ubiquitous memory introspection (preliminary manuscript)
TRANSCRIPT
Computer Science and Artificial Intelligence Laboratory
Technical Report
m a s s a c h u s e t t s i n s t i t u t e o f t e c h n o l o g y, c a m b r i d g e , m a 0 213 9 u s a — w w w. c s a i l . m i t . e d u
MIT-CSAIL-TR-2006-067 September 25, 2006
Ubiquitous Memory Introspection (Preliminary Manuscript)Qin Zhao, Rodric Rabbah, Saman Amarasinghe, Larry Rudolph, and Weng-Fai Wong
Ubiquitous Memory Introspection (Preliminary Manuscript)
Qin Zhao1,3, Rodric Rabbah2,Saman Amarasinghe1,2, Larry Rudolph1,2, Weng-Fai Wong1,3
1 Singapore-MIT Alliance2 Massachusetts Institute of Technology
3 National University of Singapore
Abstract
Modern memory systems play a critical role in the performance of applications, but a detailed un-derstanding of the application behavior in the memory system is not trivial to attain. It requires timeconsuming simulations of the memory hierarchy using long traces, and often using detailed modeling.It is increasingly possible to access hardware performance counters to measure events in the memorysystem, but the measurements remain coarse grained, better suited for performance summaries than pro-viding instruction level feedback. The availability of a low cost, online, and accurate methodology forderiving fine-grained memory behavior profiles can prove extremely useful for runtime analysis andoptimization of programs.
This paper presents a new methodology for Ubiquitous Memory Introspection (UMI). It is an onlineand lightweight mini-simulation methodology that focuses on simulating short memory access tracesrecorded from frequently executed code regions. The simulations are fast and can provide profiling re-sults at varying granularities, down to that of a single instruction or address. UMI naturally complementsruntime optimizations techniques and enables new opportunities for memory specific optimizations.
In this paper, we present a prototype implementation of a runtime system implementing UMI. Theprototype is readily deployed on commodity processors, requires no user intervention, and can operatewith stripped binaries and legacy software. The prototype operates with an average runtime overhead of20% but this slowdown is only 6% slower than a state of the art binary instrumentation tool. We used32 benchmarks, including the full suite of SPEC2000 benchmarks, for our evaluation. We show thatthe mini-simulation results accurately reflect the cache performance of two existing memory systems, anIntel Pentium 4 and an AMD Athlon MP (K7) processor. We also demonstrate that low level profilinginformation from the online simulation can serve to identify high-miss rate load instructions with a 77%rate of accuracy compared to full offline simulations that required days to complete. The online profilingresults are used at runtime to implement a simple software prefetching strategy that achieves a speedupgreater than 60% in the best case.
1 Introduction
The migration from offline to runtime optimizations provides the unique ability to perform workload-specific
optimizations that are tailored to end-user scenarios. This paper presents a practical simulation-based pro-
filing methodology for use in a pervasive online setting. The methodology calls for i) identifying frequently
executed program regions during execution, ii) selectively instrumenting some of their operations and pro-
filing their execution, and iii) periodically triggering an online fast simulator to analyze the traces and
1
record the derived performance profiles. It is not uncommon for offline simulators to use similar techniques
to reduce simulation times with sampling and functional fast forwarding [4]. A key observation inspiring
this work is that similar ideas and even simpler heuristics are possible at runtime.
The paper is focused on delivering detailed, instruction-level, profiles of the application behavior in the
memory hierarchy. Virtually all optimizations that attempt to mitigate the memory bottleneck rely on ac-
curate application-specific profiles of the memory hierarchy performance. For example, data prefetching
techniques are up to 60% more effective when they are targeted at high-miss rate memory references. Simi-
larly, locality enhancing optimizations can significantly benefit from accurate measurements of the working
sets size and characterization of their predominant reference patterns. Ubiquitous Memory Introspection
(UMI) provides online and application-specific profiling information that is necessary for runtime memory-
centric optimizations. As a result and for the first time, UMI makes it possible for traditionally offline
simulation-based optimizations to run online.
1.1 Common Practice
It is not uncommon to use simulators to model the memory system behavior of benchmarks and application
codes. Simulators are versatile and malleable, and can provide a wide range of profiling detail. They
are however invariably slow, and often prohibitively time consuming for large and realistic applications.
For example, Cachegrind [22] requires days to fully simulate the SPEC benchmark suite using the reference
input workloads. As a result, detailed simulations are used for offline performance tuning and optimizations.
They remain impractical for runtime memory optimizations whether in a virtual machine, or in a general-
purpose code manipulation environment.
1.2 A Worst Case Scenario For Hardware Counters
Increasingly, researchers have turned to hardware performance counters to quickly generate performance
profiles that identify opportunities for optimizations. The counters are extra logic added to the processor to
track events (e.g., cache misses) with little overhead. Many existing processors provide hardware counters,
and because of their low overhead, they may naturally complement online optimization systems. However
counters are designed to provide coarse-grained summaries that span thousands of instructions. They add
significant overhead to provide context-specific information, and gathering profiles at instruction granularity
2
Table 1: Running time for a range of counter sample sizes, compared to UMI.sample size 0 (native) 10 100 1K 10K 100K 1M 1 (UMI)time (s) 35.88 773.81 152.71 48.21 39.20 36.30 36.24 35.90% slowdown – 2056.66 325.61 34.36 9.25 1.17 1.00 1.18
is an order of magnitude more expensive. This is because the counters generate interrupts when they saturate
at a specified limit known as the sample size. The runtime overhead of using a counter increases dramatically
as the sample size is decreased. A case study using one of the more memory intensive applications from the
SPEC2000 benchmark suite shows a 20× slowdown compared to native execution when operating at near
instruction level granularity. Table 1 summarizes the benchmark running time for 181.mcf operating on its
training input, with a single counter for measuring the number of primary cache misses it suffers. The sample
size is varied from an allowed minimum size of 10 to an arbitrary chosen maximum of 1M. The results were
collected using PAPI [25] on a 2.2GHz Intel Xeon processor. It is readily apparent from the results that
hardware counters are not well suited for the extraction of low level details such as context information
surrounding a cache miss (e.g., an address trace leading to a cache miss for individual instructions).
1.3 A Lightweight And Practical Alternative
UMI is based on the insight that memory references traces collected at runtime reasonably approximate
the underlying memory system behavior, and that mini-simulations using these traces can be performed at
runtime to provide parameters for an online performance tuning mechanisms.
Ubiquitous memory introspection is carried out by judiciously instrumenting hot code regions to profile
the memory references that occur while the code executes. The emphasis on frequently executed code lever-
ages the same insight at the heart of existing virtual machines and binary instrumentation and optimization
systems. The instrumented code regions run periodically, and in bursts, to produce very short traces of mem-
ory references. The traces provide a brief history of the memory reference patterns. They are periodically
analyzed using simple heuristics that are effective and practical for an online setting.
The analysis can provide a great level of detail, comparable to offline simulators. For example, a fast
cache simulator can process the traces to identify load instructions that are often likely to miss in the cache.
Alternatively, a trace may record the sequence of addresses referenced by a single instruction, and this trace
is analyzed to discover patterns suitable for prefetching. UMI provides a level of profiling detail that is not
3
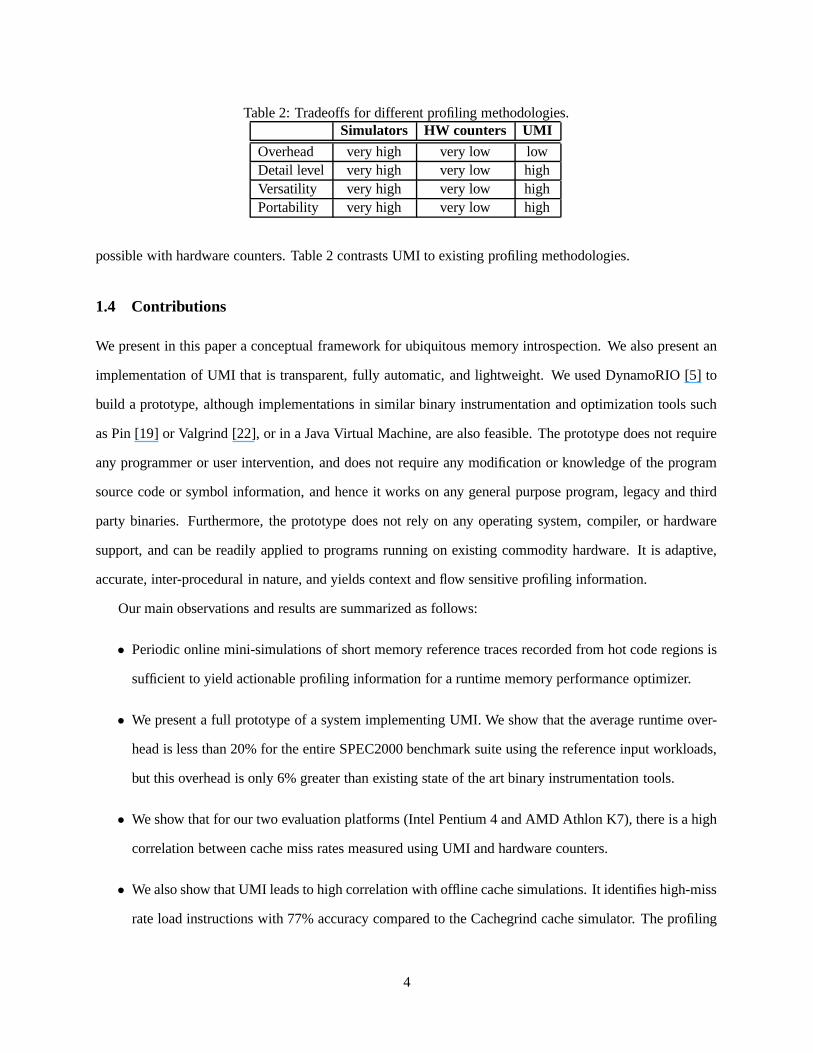
Table 2: Tradeoffs for different profiling methodologies.Simulators HW counters UMI
Overhead very high very low lowDetail level very high very low highVersatility very high very low highPortability very high very low high
possible with hardware counters. Table 2 contrasts UMI to existing profiling methodologies.
1.4 Contributions
We present in this paper a conceptual framework for ubiquitous memory introspection. We also present an
implementation of UMI that is transparent, fully automatic, and lightweight. We used DynamoRIO [5] to
build a prototype, although implementations in similar binary instrumentation and optimization tools such
as Pin [19] or Valgrind [22], or in a Java Virtual Machine, are also feasible. The prototype does not require
any programmer or user intervention, and does not require any modification or knowledge of the program
source code or symbol information, and hence it works on any general purpose program, legacy and third
party binaries. Furthermore, the prototype does not rely on any operating system, compiler, or hardware
support, and can be readily applied to programs running on existing commodity hardware. It is adaptive,
accurate, inter-procedural in nature, and yields context and flow sensitive profiling information.
Our main observations and results are summarized as follows:
• Periodic online mini-simulations of short memory reference traces recorded from hot code regions is
sufficient to yield actionable profiling information for a runtime memory performance optimizer.
• We present a full prototype of a system implementing UMI. We show that the average runtime over-
head is less than 20% for the entire SPEC2000 benchmark suite using the reference input workloads,
but this overhead is only 6% greater than existing state of the art binary instrumentation tools.
• We show that for our two evaluation platforms (Intel Pentium 4 and AMD Athlon K7), there is a high
correlation between cache miss rates measured using UMI and hardware counters.
• We also show that UMI leads to high correlation with offline cache simulations. It identifies high-miss
rate load instructions with 77% accuracy compared to the Cachegrind cache simulator. The profiling
4
results are used in an online optimization scenario to implement a simple software prefetcher that
outperforms the Pentium 4 hardware prefetcher in the best case.
UMI offers a practical and versatile alternative to existing profiling methodologies because it judiciously
records memory reference traces and can subsequently analyze them for various purposes. UMI is unique
because it naturally complements runtime optimizations, and provides opportunities for new kinds of online
optimizations that are otherwise largely infeasible. Optimizations that use UMI can replace or enhance
hardware techniques such as prefetchers and cache replacement policies. UMI also provides opportunities
to introduce novel, dynamic, and adaptive optimization techniques. As a radical example, UMI can be used
to quickly evaluate speculative optimizations that consider multiple what-if scenarios. This can complement
not only simple online compilers, but may also create opportunities for online learning-based compilation
and optimization systems.
1.5 Roadmap
We present a conceptual overview of UMI in Section 2 and describe a prototype system in Sections 3-5. In
Section 6 we present an evaluation of our prototype with respect to performance, and correlation to hardware
counters. In Section 7 we present an application of UMI for identifying high-miss rate load instructions,
and in Section 8 we demonstrate how to use the online profiling information to implement a simple software
prefetcher. Sections 9 and 10 present related work and conclude the paper with final remarks.
2 Conceptual Framework
The thesis for this work is that online mini-simulations using short memory reference traces from hot code
regions is sufficient to yield useful profiling information. The key insight enabling UMI is that numerous
virtual machines and binary instrumentation and optimization systems already exist, and they provide a
natural setting for online introspection and profile-driven optimizations.
There are three basic components to a system that implements ubiquitous memory introspection. The
first is the hot code region selector. It dynamically identifies representative code regions to instrument.
Typically such regions are frequently executed code fragments in an application. They may encompass loops
or entire methods in a Java Virtual Machine, or sequences of basic blocks promoted to an instruction trace
5
in binary code manipulation systems such as Pin or DynamoRIO. Virtually all runtime code manipulation
systems provide some form of hot code selection and optimizations. We believe they are readily amenable
for UMI, and in essence provide this first component for free.
The second component is the instrumentor. It operates on a hot region to insert new instructions that
instrument and profile the code. The application alternates between instrumented and native code regions.
When the instrumented code is run, short traces are generated to record instruction addresses as well as
the memory locations they reference. The instrumentor is commissioned with filtering the instructions in a
code region such that only informative operations are instrumented. The instrumentor also determines the
frequency with which to profile the code region, and when it is appropriate to trigger the trace analyzer.
The trace analyzer or mini-simulator is the third and final component in a system implementing UMI.
It analyzes the recorded memory reference profiles to provide various forms of information relevant to an
online optimizer. It is customizable and in this paper we present an example use of the analyzer as a fast
cache simulator. It can perform simple hit and miss accounting as a hardware counter does. It may also
simulate the hit and miss behavior for individual instructions to identity high-miss rate load instructions.
Such information is useful for optimizations that dynamically perform data prefetching.
3 Prototype System
We extended DynamoRIO to perform UMI. DynamoRIO is a dynamic binary rewriting framework for
runtime instrumentation and optimization [5]. The system performs bursty tracing on running applications
to collect memory reference traces for frequently executed code regions, and then uses a fast cache simulator
to collect cache statistics dynamically. While our prototype was implemented in DynamoRIO, UMI can be
realized in other similar systems or Java virtual machines.
DynamoRIO is a general-purpose runtime code manipulation system designed for transparency and
efficiency. It can run large real world applications on stock IA-32 hardware. DynamoRIO executes the input
application by copying the user code, one basic block at a time, into a code cache before executing the code
there. All runtime control flow is directed through the cache to provide a programmable mechanism for
instrumentation, profiling, and optimizations. DynamoRIO reduces its overhead by directly linking blocks
that are joined with direct branches, and using a fast lookup to transition between blocks that are linked
with an indirect branch. The system performs other optimizations that remove unconditional branches, and
6
Start basic block builder trace builder
dispatch
context switch
indirect branch
lookup
BASIC BLOCK
CACHE
TRACE CACHE
non-control-flow
instructionsnon-control-flow
instructions
Trace
Instrumentor
indirect branch
stays on trace?
Trace
Analyzer
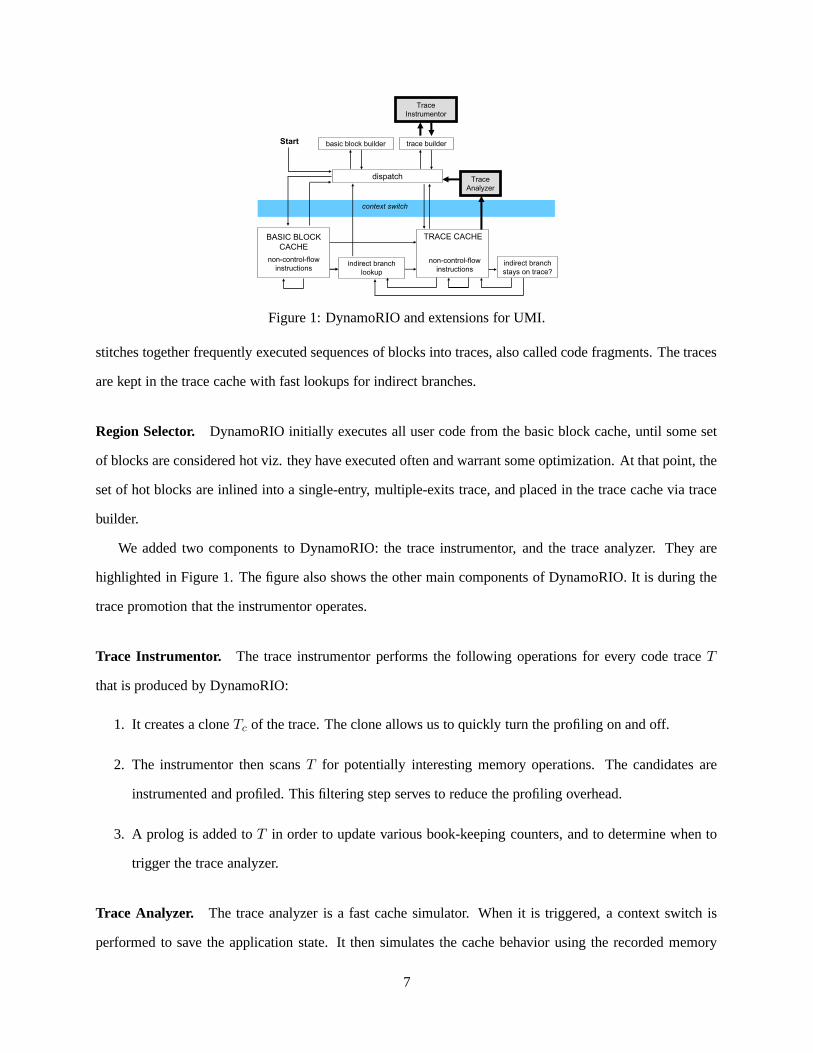
Figure 1: DynamoRIO and extensions for UMI.
stitches together frequently executed sequences of blocks into traces, also called code fragments. The traces
are kept in the trace cache with fast lookups for indirect branches.
Region Selector. DynamoRIO initially executes all user code from the basic block cache, until some set
of blocks are considered hot viz. they have executed often and warrant some optimization. At that point, the
set of hot blocks are inlined into a single-entry, multiple-exits trace, and placed in the trace cache via trace
builder.
We added two components to DynamoRIO: the trace instrumentor, and the trace analyzer. They are
highlighted in Figure 1. The figure also shows the other main components of DynamoRIO. It is during the
trace promotion that the instrumentor operates.
Trace Instrumentor. The trace instrumentor performs the following operations for every code trace T
that is produced by DynamoRIO:
1. It creates a clone Tc of the trace. The clone allows us to quickly turn the profiling on and off.
2. The instrumentor then scans T for potentially interesting memory operations. The candidates are
instrumented and profiled. This filtering step serves to reduce the profiling overhead.
3. A prolog is added to T in order to update various book-keeping counters, and to determine when to
trigger the trace analyzer.
Trace Analyzer. The trace analyzer is a fast cache simulator. When it is triggered, a context switch is
performed to save the application state. It then simulates the cache behavior using the recorded memory
7
reference profiles as input. At this stage, we can obtain detailed memory behavior information at instruction
granularity.
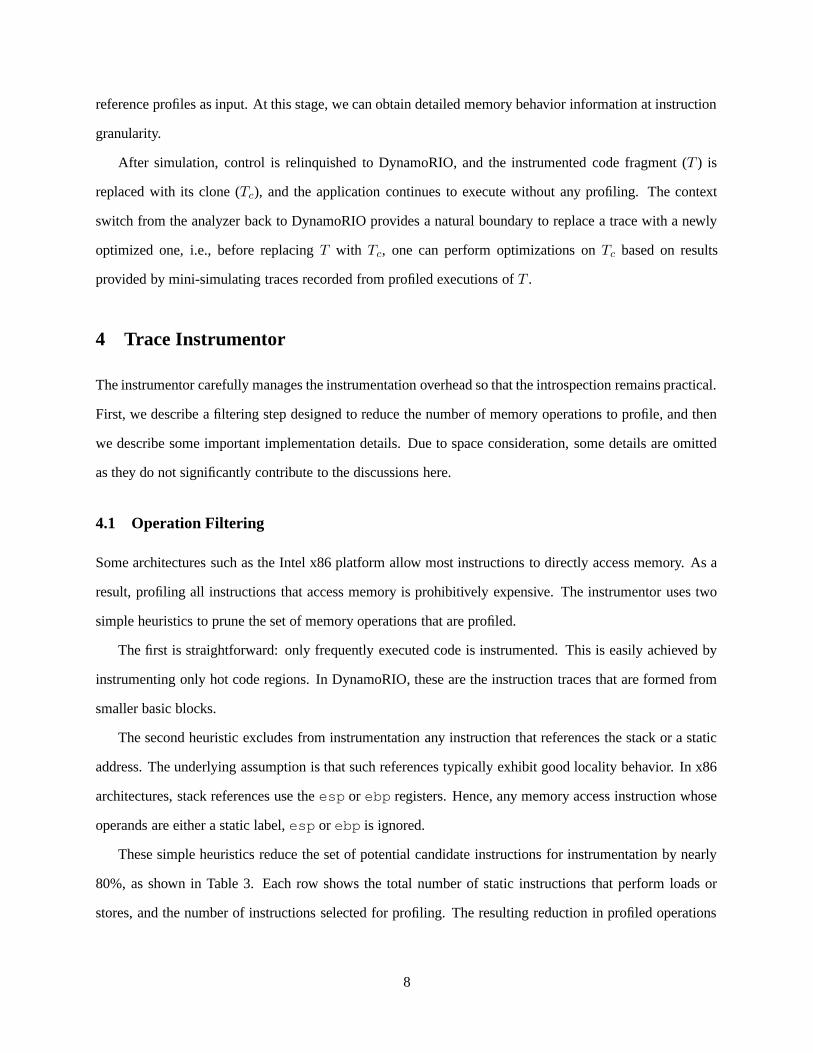
After simulation, control is relinquished to DynamoRIO, and the instrumented code fragment (T ) is
replaced with its clone (Tc), and the application continues to execute without any profiling. The context
switch from the analyzer back to DynamoRIO provides a natural boundary to replace a trace with a newly
optimized one, i.e., before replacing T with Tc, one can perform optimizations on Tc based on results
provided by mini-simulating traces recorded from profiled executions of T .
4 Trace Instrumentor
The instrumentor carefully manages the instrumentation overhead so that the introspection remains practical.
First, we describe a filtering step designed to reduce the number of memory operations to profile, and then
we describe some important implementation details. Due to space consideration, some details are omitted
as they do not significantly contribute to the discussions here.
4.1 Operation Filtering
Some architectures such as the Intel x86 platform allow most instructions to directly access memory. As a
result, profiling all instructions that access memory is prohibitively expensive. The instrumentor uses two
simple heuristics to prune the set of memory operations that are profiled.
The first is straightforward: only frequently executed code is instrumented. This is easily achieved by
instrumenting only hot code regions. In DynamoRIO, these are the instruction traces that are formed from
smaller basic blocks.
The second heuristic excludes from instrumentation any instruction that references the stack or a static
address. The underlying assumption is that such references typically exhibit good locality behavior. In x86
architectures, stack references use the esp or ebp registers. Hence, any memory access instruction whose
operands are either a static label, esp or ebp is ignored.
These simple heuristics reduce the set of potential candidate instructions for instrumentation by nearly
80%, as shown in Table 3. Each row shows the total number of static instructions that perform loads or
stores, and the number of instructions selected for profiling. The resulting reduction in profiled operations
8
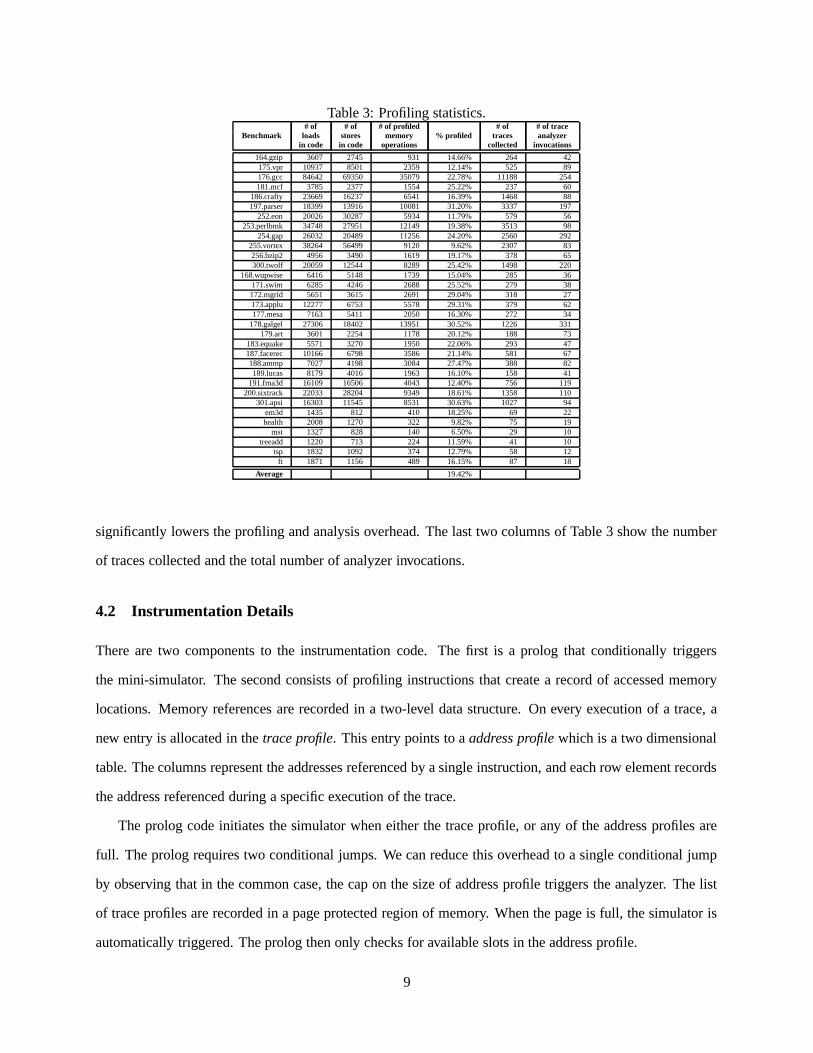
Table 3: Profiling statistics.# of # of # of profiled # of # of trace
Benchmark loads stores memory % profiled traces analyzerin code in code operations collected invocations
164.gzip 3607 2745 931 14.66% 264 42175.vpr 10937 8501 2359 12.14% 525 89176.gcc 84642 69350 35079 22.78% 11188 254181.mcf 3785 2377 1554 25.22% 237 60
186.crafty 23669 16237 6541 16.39% 1468 88197.parser 18399 13916 10081 31.20% 3337 197
252.eon 20026 30287 5934 11.79% 579 56253.perlbmk 34748 27951 12149 19.38% 3513 98
254.gap 26032 20489 11256 24.20% 2560 292255.vortex 38264 56499 9120 9.62% 2307 83256.bzip2 4956 3490 1619 19.17% 378 65300.twolf 20059 12544 8289 25.42% 1498 220
168.wupwise 6416 5148 1739 15.04% 285 36171.swim 6285 4246 2688 25.52% 279 38172.mgrid 5651 3615 2691 29.04% 318 27173.applu 12277 6753 5578 29.31% 379 62177.mesa 7163 5411 2050 16.30% 272 34
178.galgel 27306 18402 13951 30.52% 1226 331179.art 3601 2254 1178 20.12% 188 73
183.equake 5571 3270 1950 22.06% 293 47187.facerec 10166 6798 3586 21.14% 581 67188.ammp 7027 4198 3084 27.47% 388 82189.lucas 8179 4016 1963 16.10% 158 41
191.fma3d 16109 16506 4043 12.40% 756 119200.sixtrack 22033 28204 9349 18.61% 1358 110
301.apsi 16303 11545 8531 30.63% 1027 94em3d 1435 812 410 18.25% 69 22health 2008 1270 322 9.82% 75 19
mst 1327 828 140 6.50% 29 10treeadd 1220 713 224 11.59% 41 10
tsp 1832 1092 374 12.79% 58 12ft 1871 1156 489 16.15% 87 18
Average 19.42%
significantly lowers the profiling and analysis overhead. The last two columns of Table 3 show the number
of traces collected and the total number of analyzer invocations.
4.2 Instrumentation Details
There are two components to the instrumentation code. The first is a prolog that conditionally triggers
the mini-simulator. The second consists of profiling instructions that create a record of accessed memory
locations. Memory references are recorded in a two-level data structure. On every execution of a trace, a
new entry is allocated in the trace profile. This entry points to a address profile which is a two dimensional
table. The columns represent the addresses referenced by a single instruction, and each row element records
the address referenced during a specific execution of the trace.
The prolog code initiates the simulator when either the trace profile, or any of the address profiles are
full. The prolog requires two conditional jumps. We can reduce this overhead to a single conditional jump
by observing that in the common case, the cap on the size of address profile triggers the analyzer. The list
of trace profiles are recorded in a page protected region of memory. When the page is full, the simulator is
automatically triggered. The prolog then only checks for available slots in the address profile.
9
The length of the trace profile is limited to 8,192 entries. The address profile is limited to 256 operations
and 128 entries per operation (i.e., 128 iterations of the code fragment). In the worst case, the space overhead
is 32 KB of storage for the trace profile, and 128 KB for each reference profile. Another 64 KB is needed for
the simulation, leading to a total space overhead of 1 GB if all 8,192 distinct profiles are live simultaneously.
In our experiments, we found that an average of three trace profiles are used at any given time, with an
average of five instrumented instructions per code fragment. Thus, our scheme adds between 80-128 KB of
memory overhead. This includes the 64 KB required for the profile analysis.
A naive injection of instrumentation code to record the memory reference information is potentially too
expensive. A memory reference is the tuple (pc, address), and to record this information requires about
nine operations in a straight forward approach. We implemented a number of optimizations to reduce this
to between four to six operations. These details are omitted here.
5 Trace Analyzer
The analyzer is a fast cache simulator. For the evaluations in this paper, it is configured to match the number
of sets, the line size, and the associativity of the secondary cache on the host machine. The simulator
implements an LRU replacement policy, although other simpler schemes are also possible. The simulator
tracks the miss ratios for individual operations, and also maintains coarser level performance details.
During simulation, each reference is mapped to its corresponding set. The tag is compared to all tags in
the set. If there is a match, the recorded time of the matching line is updated. Otherwise, an empty line, or
the oldest line, is selected to store the current tag. We use a counter to simulate time.
Since not all memory references are profiled, the simulated results are approximations of the application
behavior. Furthermore, because only a small fraction of the memory references is simulated, the simulator
must be tuned to account for the high number of compulsory misses, and the low number of conflict and
capacity misses that would otherwise arise. Thus, in order to improve the simulated results, cache miss
accounting only starts after the first few accesses in the address trace, typically two iterations of the code
region. This has the effect of warming up the cache, and is akin to functional warming in offline cache simu-
lations that use fast forwarding. We also periodically flush the cache state to avoid long term contamination.
In our experiments, the flush occurs whenever the analyzer is triggered and more than 1M processor cycles
(obtained using rdtsc) have elapsed since it last ran.
10
0.80
1.00
1.20
1.40
1.60
1.80
2.00
168.
wup
wise
171.
swim
172.
mgr
id
173.
applu
177.
mes
a
178.
galgel
179.
art
183.
equa
ke
187.
face
rec
188.
amm
p
189.
luca
s
191.
fma3
d
200.
sixtra
ck
301.
apsi
164.
gzip
175.
vpr
176.
gcc
181.
mcf
186.
craf
ty
197.
pars
er
252.
eon
253.
perlb
mk
254.
gap
255.
vorte
x
56.b
zip2
300.
twolf
em3d
health
mst
treea
dd tsp ft
Avera
ge
DynamoRIO
UMI (no sampling)
UMI (with sampling)
run
nin
g t
ime r
ela
tive
to n
ative
exe
cu
tio
n
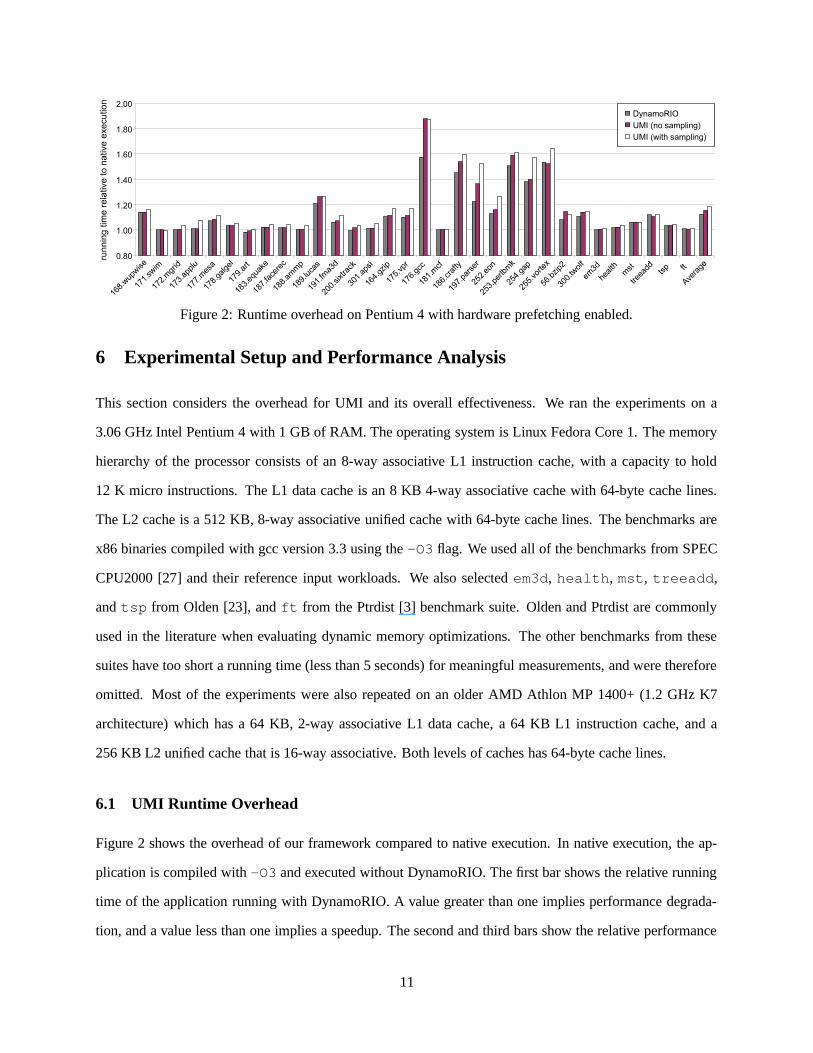
Figure 2: Runtime overhead on Pentium 4 with hardware prefetching enabled.
6 Experimental Setup and Performance Analysis
This section considers the overhead for UMI and its overall effectiveness. We ran the experiments on a
3.06 GHz Intel Pentium 4 with 1 GB of RAM. The operating system is Linux Fedora Core 1. The memory
hierarchy of the processor consists of an 8-way associative L1 instruction cache, with a capacity to hold
12 K micro instructions. The L1 data cache is an 8 KB 4-way associative cache with 64-byte cache lines.
The L2 cache is a 512 KB, 8-way associative unified cache with 64-byte cache lines. The benchmarks are
x86 binaries compiled with gcc version 3.3 using the -O3 flag. We used all of the benchmarks from SPEC
CPU2000 [27] and their reference input workloads. We also selected em3d, health, mst, treeadd,
and tsp from Olden [23], and ft from the Ptrdist [3] benchmark suite. Olden and Ptrdist are commonly
used in the literature when evaluating dynamic memory optimizations. The other benchmarks from these
suites have too short a running time (less than 5 seconds) for meaningful measurements, and were therefore
omitted. Most of the experiments were also repeated on an older AMD Athlon MP 1400+ (1.2 GHz K7
architecture) which has a 64 KB, 2-way associative L1 data cache, a 64 KB L1 instruction cache, and a
256 KB L2 unified cache that is 16-way associative. Both levels of caches has 64-byte cache lines.
6.1 UMI Runtime Overhead
Figure 2 shows the overhead of our framework compared to native execution. In native execution, the ap-
plication is compiled with -O3 and executed without DynamoRIO. The first bar shows the relative running
time of the application running with DynamoRIO. A value greater than one implies performance degrada-
tion, and a value less than one implies a speedup. The second and third bars show the relative performance
11
for UMI (i.e., application running time with DynamoRIO augmented with our profiling and analysis). These
two bars differ only in the sampling strategy used for UMI as detailed in Section 7. Note that for UMI, the
overhead is dependent of the size of the collected profile. In our experiments, we used 128 rows for each
address profile and 8,192 entries for the trace profile.
It is evident from the data that, with some exceptions, DynamoRIO has little overhead in general, with an
average overhead less than 13%. There are some benchmarks that ran faster compared to native execution
because they benefit from code placement and trace formation optimizations performed by DynamoRIO.
The overheads incurred for UMI (i.e., trace instrumentor and analyzer) are not much higher, averaging
a 15-20% slowdown overall, and merely 6% over DynamoRIO. These results suggest that online mini-
simulations and detailed introspection will become increasingly practical since the performance of binary
instrumentation tools like DynamoRIO have steadily improved over the years.
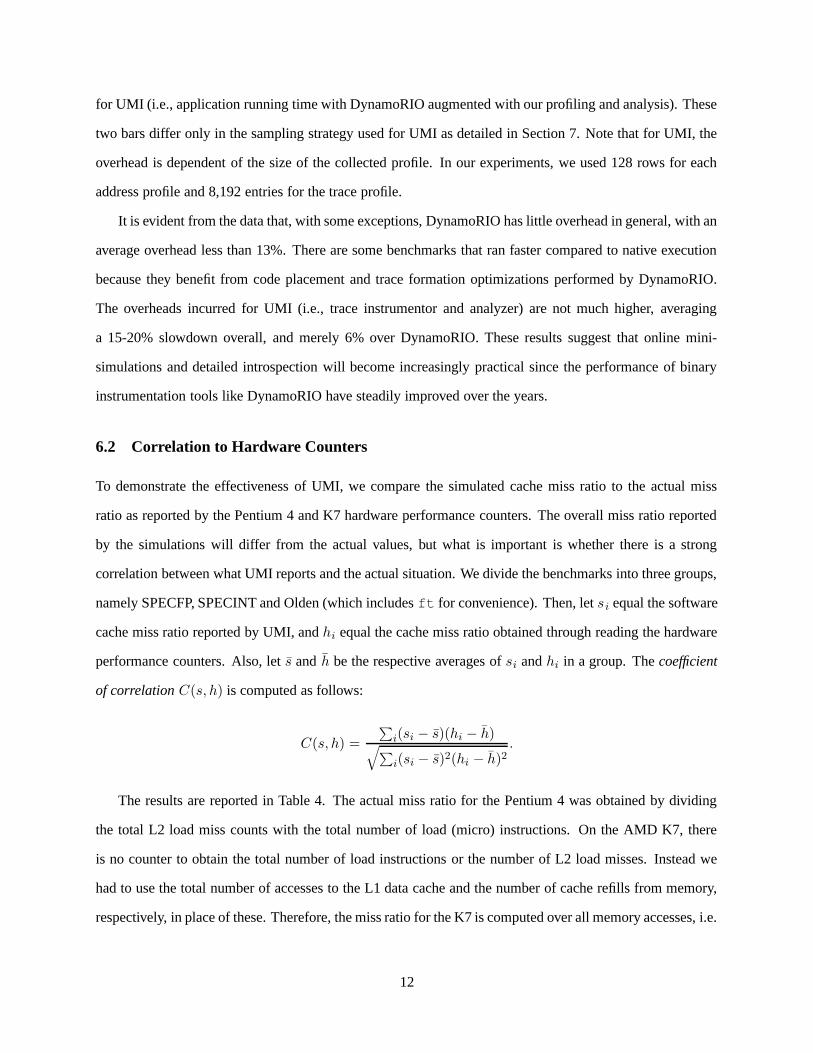
6.2 Correlation to Hardware Counters
To demonstrate the effectiveness of UMI, we compare the simulated cache miss ratio to the actual miss
ratio as reported by the Pentium 4 and K7 hardware performance counters. The overall miss ratio reported
by the simulations will differ from the actual values, but what is important is whether there is a strong
correlation between what UMI reports and the actual situation. We divide the benchmarks into three groups,
namely SPECFP, SPECINT and Olden (which includes ft for convenience). Then, let si equal the software
cache miss ratio reported by UMI, and hi equal the cache miss ratio obtained through reading the hardware
performance counters. Also, let s and h be the respective averages of si and hi in a group. The coefficient
of correlation C(s, h) is computed as follows:
C(s, h) =
∑
i(si − s)(hi − h)√
∑
i(si − s)2(hi − h)2.
The results are reported in Table 4. The actual miss ratio for the Pentium 4 was obtained by dividing
the total L2 load miss counts with the total number of load (micro) instructions. On the AMD K7, there
is no counter to obtain the total number of load instructions or the number of L2 load misses. Instead we
had to use the total number of accesses to the L1 data cache and the number of cache refills from memory,
respectively, in place of these. Therefore, the miss ratio for the K7 is computed over all memory accesses, i.e.
12
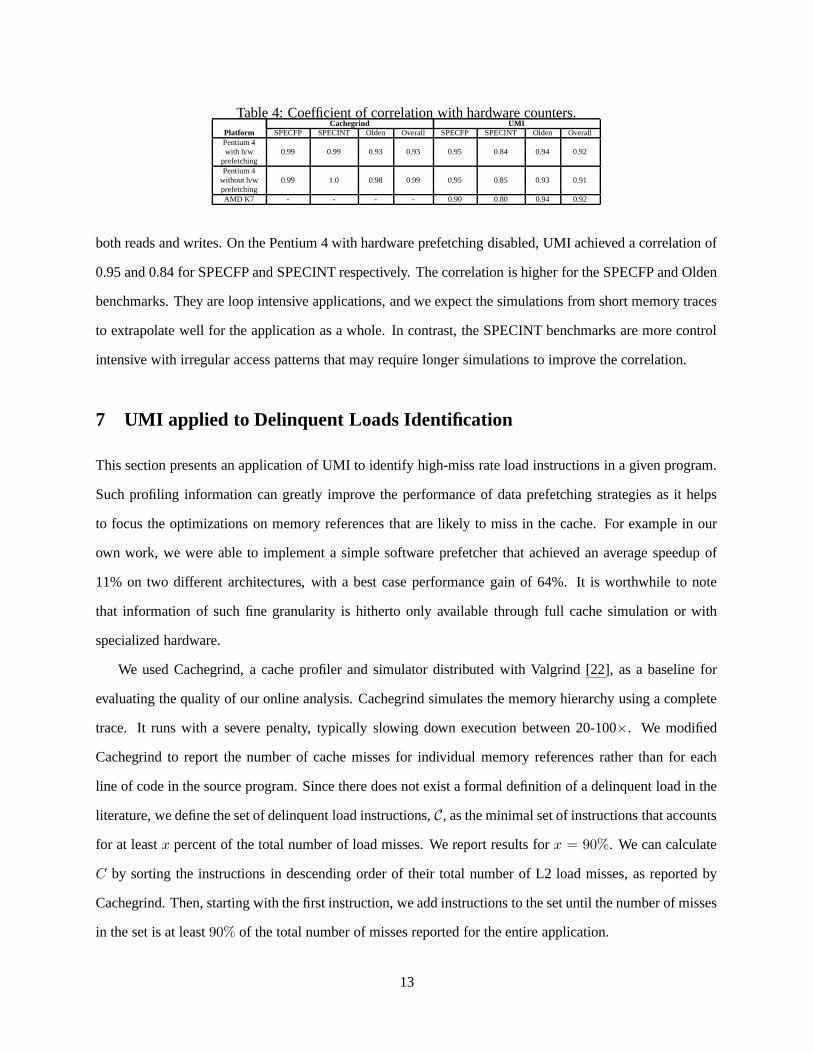
Table 4: Coefficient of correlation with hardware counters.Cachegrind UMI
Platform SPECFP SPECINT Olden Overall SPECFP SPECINT Olden OverallPentium 4with h/w 0.99 0.99 0.93 0.93 0.95 0.84 0.94 0.92
prefetchingPentium 4
without h/w 0.99 1.0 0.98 0.99 0.95 0.85 0.93 0.91prefetchingAMD K7 - - - - 0.90 0.80 0.94 0.92
both reads and writes. On the Pentium 4 with hardware prefetching disabled, UMI achieved a correlation of
0.95 and 0.84 for SPECFP and SPECINT respectively. The correlation is higher for the SPECFP and Olden
benchmarks. They are loop intensive applications, and we expect the simulations from short memory traces
to extrapolate well for the application as a whole. In contrast, the SPECINT benchmarks are more control
intensive with irregular access patterns that may require longer simulations to improve the correlation.
7 UMI applied to Delinquent Loads Identification
This section presents an application of UMI to identify high-miss rate load instructions in a given program.
Such profiling information can greatly improve the performance of data prefetching strategies as it helps
to focus the optimizations on memory references that are likely to miss in the cache. For example in our
own work, we were able to implement a simple software prefetcher that achieved an average speedup of
11% on two different architectures, with a best case performance gain of 64%. It is worthwhile to note
that information of such fine granularity is hitherto only available through full cache simulation or with
specialized hardware.
We used Cachegrind, a cache profiler and simulator distributed with Valgrind [22], as a baseline for
evaluating the quality of our online analysis. Cachegrind simulates the memory hierarchy using a complete
trace. It runs with a severe penalty, typically slowing down execution between 20-100×. We modified
Cachegrind to report the number of cache misses for individual memory references rather than for each
line of code in the source program. Since there does not exist a formal definition of a delinquent load in the
literature, we define the set of delinquent load instructions, C, as the minimal set of instructions that accounts
for at least x percent of the total number of load misses. We report results for x = 90%. We can calculate
C by sorting the instructions in descending order of their total number of L2 load misses, as reported by
Cachegrind. Then, starting with the first instruction, we add instructions to the set until the number of misses
in the set is at least 90% of the total number of misses reported for the entire application.
13
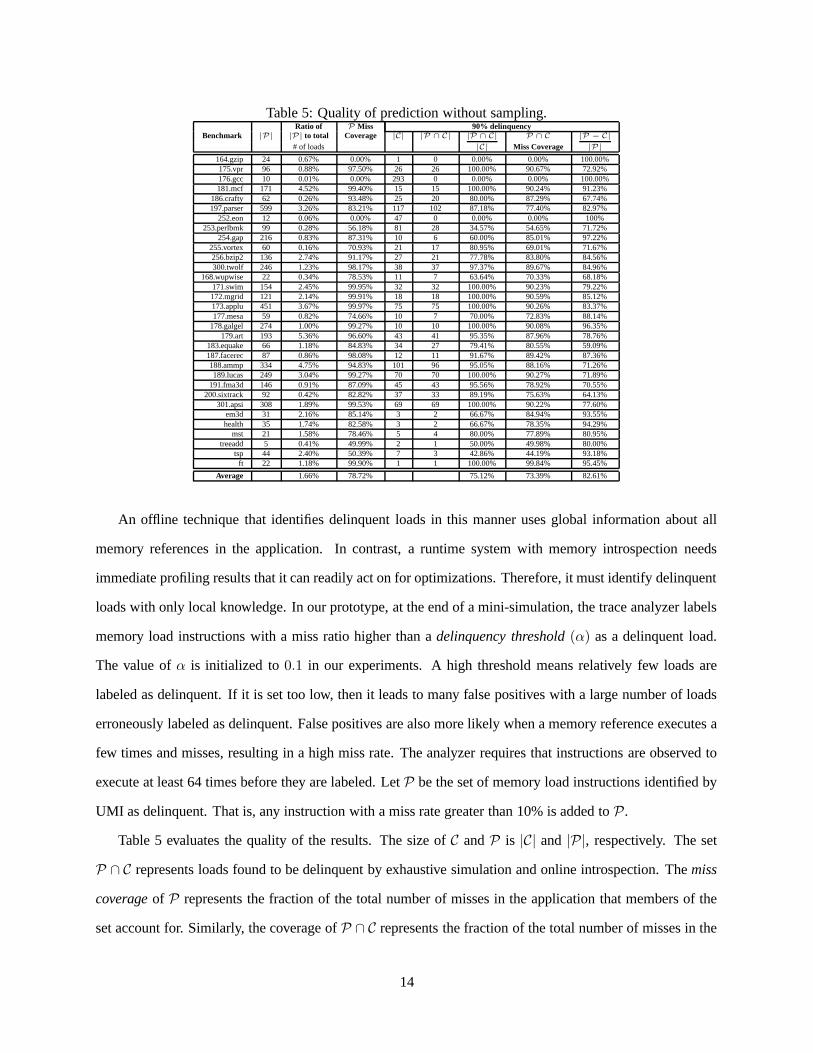
Table 5: Quality of prediction without sampling.Ratio of P Miss 90% delinquency
Benchmark |P| |P| to total Coverage |C| |P ∩ C| |P ∩ C| P ∩ C |P − C|
# of loads |C| Miss Coverage |P|
164.gzip 24 0.67% 0.00% 1 0 0.00% 0.00% 100.00%175.vpr 96 0.88% 97.50% 26 26 100.00% 90.67% 72.92%176.gcc 10 0.01% 0.00% 293 0 0.00% 0.00% 100.00%181.mcf 171 4.52% 99.40% 15 15 100.00% 90.24% 91.23%
186.crafty 62 0.26% 93.48% 25 20 80.00% 87.29% 67.74%197.parser 599 3.26% 83.21% 117 102 87.18% 77.40% 82.97%
252.eon 12 0.06% 0.00% 47 0 0.00% 0.00% 100%253.perlbmk 99 0.28% 56.18% 81 28 34.57% 54.65% 71.72%
254.gap 216 0.83% 87.31% 10 6 60.00% 85.01% 97.22%255.vortex 60 0.16% 70.93% 21 17 80.95% 69.01% 71.67%256.bzip2 136 2.74% 91.17% 27 21 77.78% 83.80% 84.56%300.twolf 246 1.23% 98.17% 38 37 97.37% 89.67% 84.96%
168.wupwise 22 0.34% 78.53% 11 7 63.64% 70.33% 68.18%171.swim 154 2.45% 99.95% 32 32 100.00% 90.23% 79.22%172.mgrid 121 2.14% 99.91% 18 18 100.00% 90.59% 85.12%173.applu 451 3.67% 99.97% 75 75 100.00% 90.26% 83.37%177.mesa 59 0.82% 74.66% 10 7 70.00% 72.83% 88.14%
178.galgel 274 1.00% 99.27% 10 10 100.00% 90.08% 96.35%179.art 193 5.36% 96.60% 43 41 95.35% 87.96% 78.76%
183.equake 66 1.18% 84.83% 34 27 79.41% 80.55% 59.09%187.facerec 87 0.86% 98.08% 12 11 91.67% 89.42% 87.36%188.ammp 334 4.75% 94.83% 101 96 95.05% 88.16% 71.26%189.lucas 249 3.04% 99.27% 70 70 100.00% 90.27% 71.89%
191.fma3d 146 0.91% 87.09% 45 43 95.56% 78.92% 70.55%200.sixtrack 92 0.42% 82.82% 37 33 89.19% 75.63% 64.13%
301.apsi 308 1.89% 99.53% 69 69 100.00% 90.22% 77.60%em3d 31 2.16% 85.14% 3 2 66.67% 84.94% 93.55%health 35 1.74% 82.58% 3 2 66.67% 78.35% 94.29%
mst 21 1.58% 78.46% 5 4 80.00% 77.89% 80.95%treeadd 5 0.41% 49.99% 2 1 50.00% 49.98% 80.00%
tsp 44 2.40% 50.39% 7 3 42.86% 44.19% 93.18%ft 22 1.18% 99.90% 1 1 100.00% 99.84% 95.45%
Average 1.66% 78.72% 75.12% 73.39% 82.61%
An offline technique that identifies delinquent loads in this manner uses global information about all
memory references in the application. In contrast, a runtime system with memory introspection needs
immediate profiling results that it can readily act on for optimizations. Therefore, it must identify delinquent
loads with only local knowledge. In our prototype, at the end of a mini-simulation, the trace analyzer labels
memory load instructions with a miss ratio higher than a delinquency threshold (α) as a delinquent load.
The value of α is initialized to 0.1 in our experiments. A high threshold means relatively few loads are
labeled as delinquent. If it is set too low, then it leads to many false positives with a large number of loads
erroneously labeled as delinquent. False positives are also more likely when a memory reference executes a
few times and misses, resulting in a high miss rate. The analyzer requires that instructions are observed to
execute at least 64 times before they are labeled. Let P be the set of memory load instructions identified by
UMI as delinquent. That is, any instruction with a miss rate greater than 10% is added to P .
Table 5 evaluates the quality of the results. The size of C and P is |C| and |P|, respectively. The set
P ∩ C represents loads found to be delinquent by exhaustive simulation and online introspection. The miss
coverage of P represents the fraction of the total number of misses in the application that members of the
set account for. Similarly, the coverage of P ∩ C represents the fraction of the total number of misses in the
14
application that the members of the sets account for. |P ∩ C|/|C| and |P − C|/|P| represent the correctness
and false positive rates respectively. Ideally, these values are 100% and 0%, respectively.
In summary, the coverage is near 70% or greater for most of the benchmarks, with a few notable ex-
ceptions which have 0% coverage: 164.gzip, 176.gcc, and 252.eon. These benchmarks have low
miss rates in general. We also found that in these benchmarks, the instructions that cause most cache misses
have a relatively low cache miss rate. For example, in 164.gzip, one instruction causes more than 90% of
the cache misses, but that instruction performs a byte-by-byte memory copy and has a mere 2% miss ratio
as reported by Cachegrind. In 176.gcc, the cache misses are distributed across 293 memory references,
each having a very low miss rate. 252.eon is computationally intensive and exhibits very good reference
locality. The other benchmarks such as 253.perlbmk, treeadd and tsp exhibit similar patterns.
We can improve the results by dynamically adjusting the delinquency threshold. One problem with the
above approach is that although the code traces are frequently executed, they may not execute for a signifi-
cant amount of time. This results in many false positives (i.e., loads are incorrectly labeled as delinquent).
To alleviate this problem, the introspection can perform periodic sampling to adjust α as the application exe-
cutes. The sampling serves to bias the profiling results toward frequently occurring instructions, and lessens
the likelihood of erroneous classification. We use the program counter (time) sampling utility provided by
DynamoRIO to implement our sampling strategy. The trace instrumentor is not only invoked when the code
fragment is first built, but also when that trace is encountered again during the sampling intervals. We trig-
ger a new sample collection every 10 milliseconds. The repeated instrumentation and profile analysis of the
code fragments accelerates the convergence of miss rates to their expected values. In addition, the sampling
methodology provides a natural mechanism to adapt to the various phases of the application lifetime. The
overhead of this time sampling approach is small, as is observed from the third bar in Figure 2.
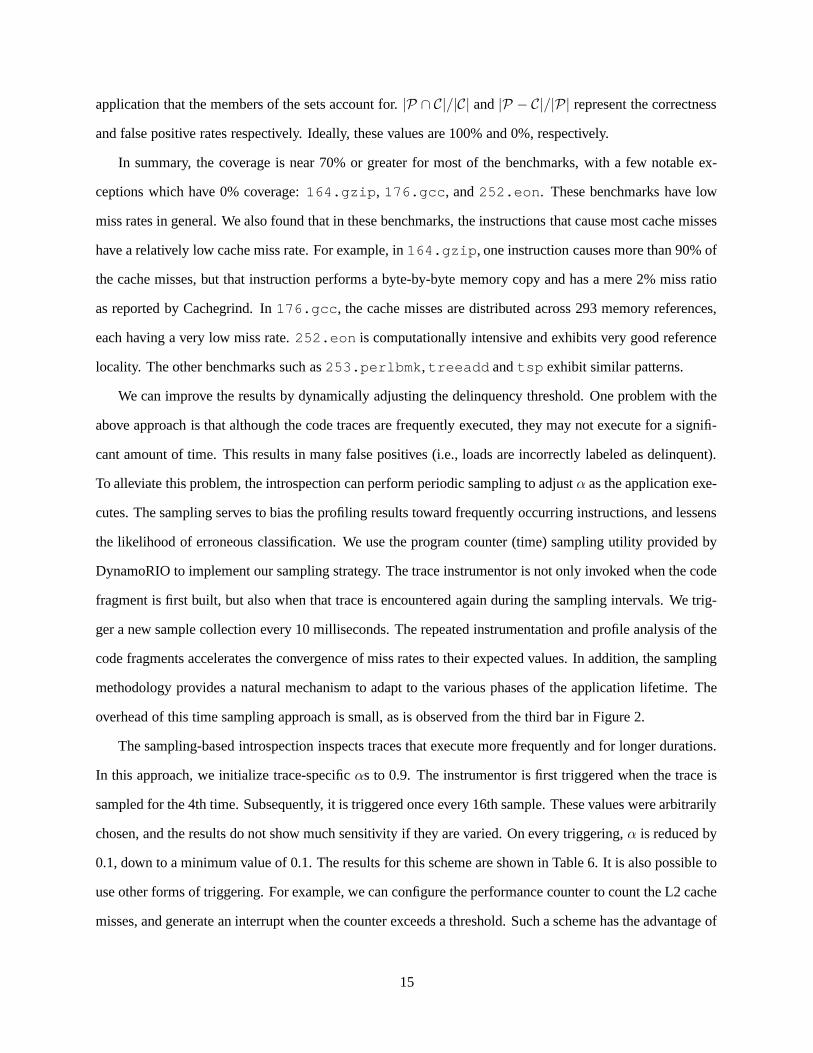
The sampling-based introspection inspects traces that execute more frequently and for longer durations.
In this approach, we initialize trace-specific αs to 0.9. The instrumentor is first triggered when the trace is
sampled for the 4th time. Subsequently, it is triggered once every 16th sample. These values were arbitrarily
chosen, and the results do not show much sensitivity if they are varied. On every triggering, α is reduced by
0.1, down to a minimum value of 0.1. The results for this scheme are shown in Table 6. It is also possible to
use other forms of triggering. For example, we can configure the performance counter to count the L2 cache
misses, and generate an interrupt when the counter exceeds a threshold. Such a scheme has the advantage of
15
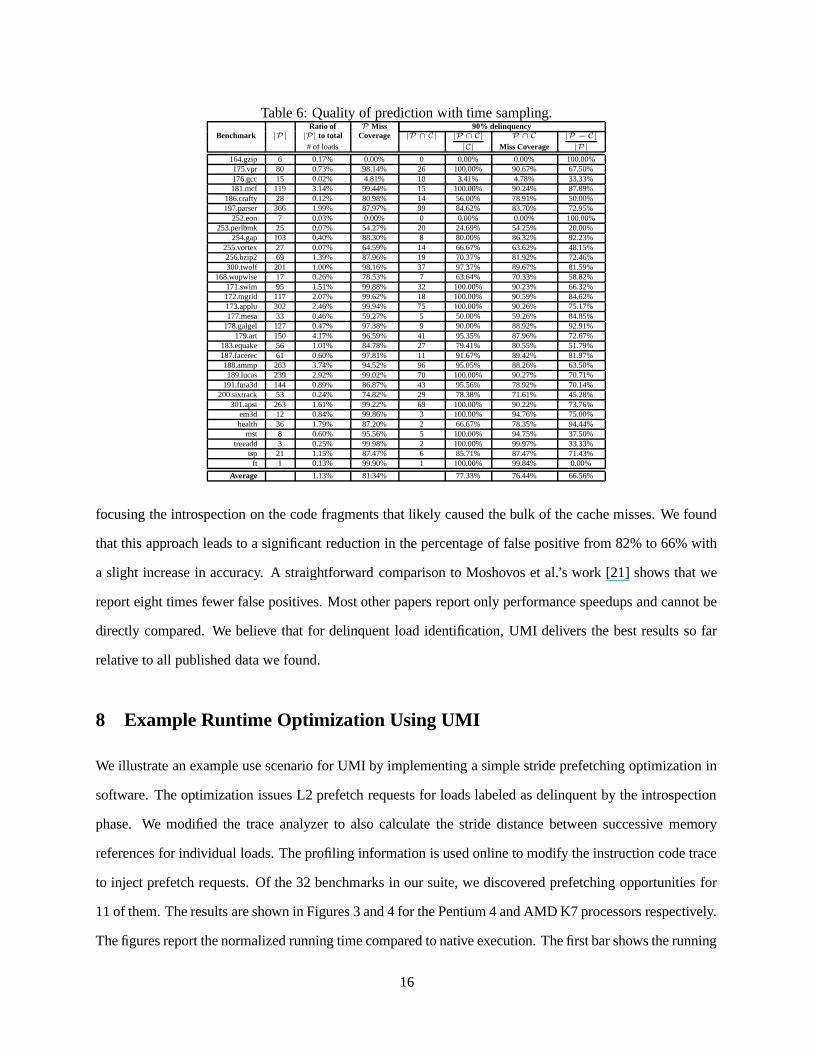
Table 6: Quality of prediction with time sampling.Ratio of P Miss 90% delinquency
Benchmark |P| |P| to total Coverage |P ∩ C| |P ∩ C| P ∩ C |P − C|
# of loads |C| Miss Coverage |P|
164.gzip 6 0.17% 0.00% 0 0.00% 0.00% 100.00%175.vpr 80 0.73% 98.14% 26 100.00% 90.67% 67.50%176.gcc 15 0.02% 4.81% 10 3.41% 4.78% 33.33%181.mcf 119 3.14% 99.44% 15 100.00% 90.24% 87.89%
186.crafty 28 0.12% 80.98% 14 56.00% 78.91% 50.00%197.parser 366 1.99% 87.97% 99 84.62% 83.70% 72.95%
252.eon 7 0.03% 0.00% 0 0.00% 0.00% 100.00%253.perlbmk 25 0.07% 54.27% 20 24.69% 54.25% 20.00%
254.gap 103 0.40% 88.30% 8 80.00% 86.32% 92.23%255.vortex 27 0.07% 64.59% 14 66.67% 63.62% 48.15%256.bzip2 69 1.39% 87.96% 19 70.37% 81.92% 72.46%300.twolf 201 1.00% 98.16% 37 97.37% 89.67% 81.59%
168.wupwise 17 0.26% 78.53% 7 63.64% 70.33% 58.82%171.swim 95 1.51% 99.88% 32 100.00% 90.23% 66.32%172.mgrid 117 2.07% 99.62% 18 100.00% 90.59% 84.62%173.applu 302 2.46% 99.94% 75 100.00% 90.26% 75.17%177.mesa 33 0.46% 59.27% 5 50.00% 59.26% 84.85%
178.galgel 127 0.47% 97.38% 9 90.00% 88.92% 92.91%179.art 150 4.17% 96.59% 41 95.35% 87.96% 72.67%
183.equake 56 1.01% 84.78% 27 79.41% 80.55% 51.79%187.facerec 61 0.60% 97.81% 11 91.67% 89.42% 81.97%188.ammp 263 3.74% 94.52% 96 95.05% 88.26% 63.50%189.lucas 239 2.92% 99.02% 70 100.00% 90.27% 70.71%
191.fma3d 144 0.89% 86.87% 43 95.56% 78.92% 70.14%200.sixtrack 53 0.24% 74.82% 29 78.38% 71.61% 45.28%
301.apsi 263 1.61% 99.22% 69 100.00% 90.22% 73.76%em3d 12 0.84% 99.86% 3 100.00% 94.76% 75.00%health 36 1.79% 87.20% 2 66.67% 78.35% 94.44%
mst 8 0.60% 95.56% 5 100.00% 94.75% 37.50%treeadd 3 0.25% 99.98% 2 100.00% 99.97% 33.33%
tsp 21 1.15% 87.47% 6 85.71% 87.47% 71.43%ft 1 0.13% 99.90% 1 100.00% 99.84% 0.00%
Average 1.13% 81.34% 77.33% 76.44% 66.56%
focusing the introspection on the code fragments that likely caused the bulk of the cache misses. We found
that this approach leads to a significant reduction in the percentage of false positive from 82% to 66% with
a slight increase in accuracy. A straightforward comparison to Moshovos et al.’s work [21] shows that we
report eight times fewer false positives. Most other papers report only performance speedups and cannot be
directly compared. We believe that for delinquent load identification, UMI delivers the best results so far
relative to all published data we found.
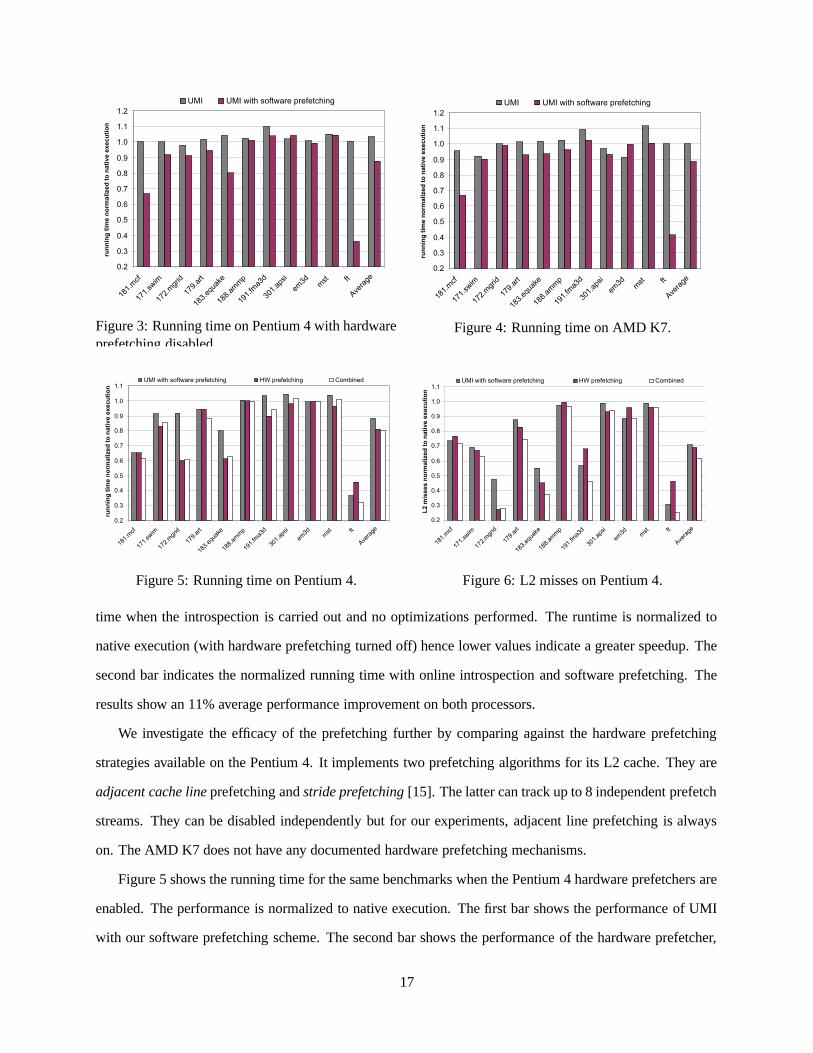
8 Example Runtime Optimization Using UMI
We illustrate an example use scenario for UMI by implementing a simple stride prefetching optimization in
software. The optimization issues L2 prefetch requests for loads labeled as delinquent by the introspection
phase. We modified the trace analyzer to also calculate the stride distance between successive memory
references for individual loads. The profiling information is used online to modify the instruction code trace
to inject prefetch requests. Of the 32 benchmarks in our suite, we discovered prefetching opportunities for
11 of them. The results are shown in Figures 3 and 4 for the Pentium 4 and AMD K7 processors respectively.
The figures report the normalized running time compared to native execution. The first bar shows the running
16
UMI UMI with software prefetching
0.2
0.3
0.4
0.5
0.6
0.7
0.8
0.9
1.0
1.1
1.2
181.
mcf
171.
swim
172.
mgr
id
179.
art
183.
equa
ke
188.
amm
p
191.
fma3
d
301.
apsi
em3d m
st ft
Ave
rage
run
nin
g t
ime n
orm
alized
to n
ati
ve e
xecu
tio
n
Figure 3: Running time on Pentium 4 with hardwareprefetching disabled.
UMI UMI with software prefetching
0.2
0.3
0.4
0.5
0.6
0.7
0.8
0.9
1.0
1.1
1.2
181.
mcf
171.
swim
172.
mgr
id
179.
art
183.
equa
ke
188.
amm
p
191.
fma3
d
301.
apsi
em3d m
st ft
Ave
rage
run
nin
g t
ime n
orm
alized
to
nati
ve e
xecu
tio
n
Figure 4: Running time on AMD K7.
0.2
0.3
0.4
0.5
0.6
0.7
0.8
0.9
1.0
1.1
181.
mcf
171.
swim
172.
mgr
id
179.
art
183.
equa
ke
188.
amm
p
191.
fma3
d
301.
apsi
em3d m
st ft
Ave
rage
run
nin
g t
ime n
orm
alized
to
nati
ve e
xecu
tio
n
UMI with software prefetching HW prefetching Combined
Figure 5: Running time on Pentium 4.
UMI with software prefetching HW prefetching Combined
0.2
0.3
0.4
0.5
0.6
0.7
0.8
0.9
1.0
1.1
181.
mcf
171.
swim
172.
mgr
id
179.
art
183.
equa
ke
188.
amm
p
191.
fma3
d
301.
apsi
em3d m
st ft
Ave
rage
L2 m
isses n
orm
alized
to
nati
ve e
xecu
tio
n
Figure 6: L2 misses on Pentium 4.
time when the introspection is carried out and no optimizations performed. The runtime is normalized to
native execution (with hardware prefetching turned off) hence lower values indicate a greater speedup. The
second bar indicates the normalized running time with online introspection and software prefetching. The
results show an 11% average performance improvement on both processors.
We investigate the efficacy of the prefetching further by comparing against the hardware prefetching
strategies available on the Pentium 4. It implements two prefetching algorithms for its L2 cache. They are
adjacent cache line prefetching and stride prefetching [15]. The latter can track up to 8 independent prefetch
streams. They can be disabled independently but for our experiments, adjacent line prefetching is always
on. The AMD K7 does not have any documented hardware prefetching mechanisms.
Figure 5 shows the running time for the same benchmarks when the Pentium 4 hardware prefetchers are
enabled. The performance is normalized to native execution. The first bar shows the performance of UMI
with our software prefetching scheme. The second bar shows the performance of the hardware prefetcher,
17
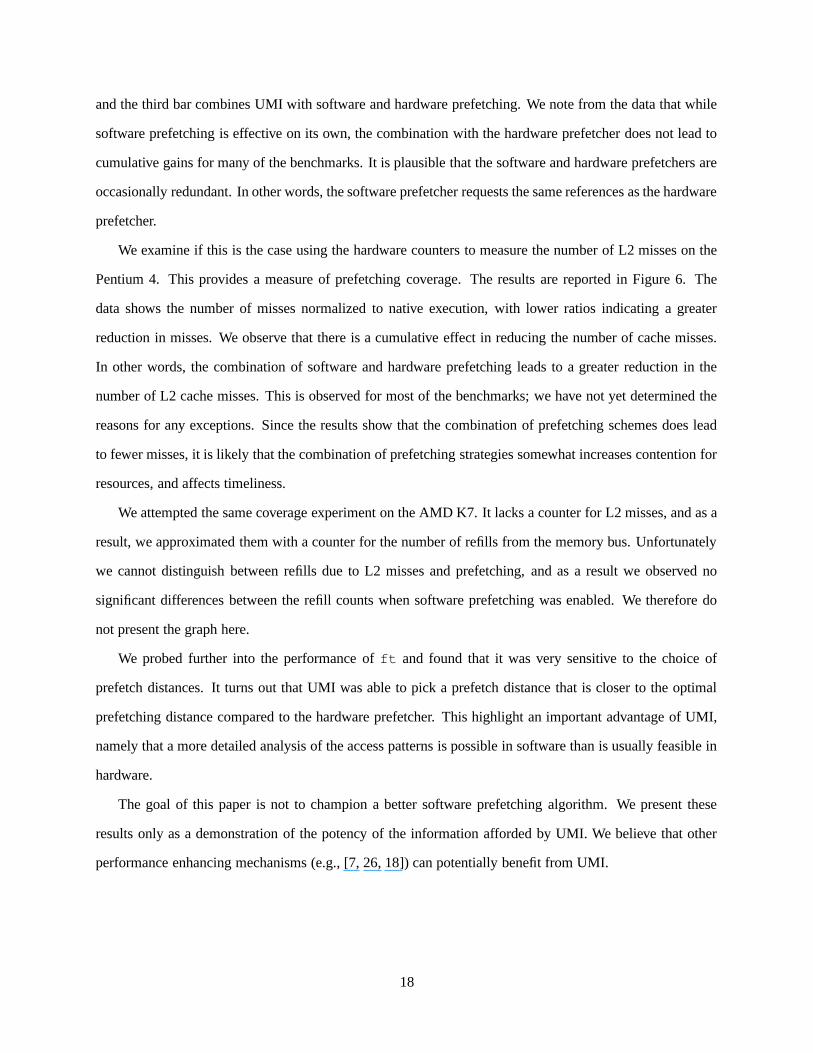
and the third bar combines UMI with software and hardware prefetching. We note from the data that while
software prefetching is effective on its own, the combination with the hardware prefetcher does not lead to
cumulative gains for many of the benchmarks. It is plausible that the software and hardware prefetchers are
occasionally redundant. In other words, the software prefetcher requests the same references as the hardware
prefetcher.
We examine if this is the case using the hardware counters to measure the number of L2 misses on the
Pentium 4. This provides a measure of prefetching coverage. The results are reported in Figure 6. The
data shows the number of misses normalized to native execution, with lower ratios indicating a greater
reduction in misses. We observe that there is a cumulative effect in reducing the number of cache misses.
In other words, the combination of software and hardware prefetching leads to a greater reduction in the
number of L2 cache misses. This is observed for most of the benchmarks; we have not yet determined the
reasons for any exceptions. Since the results show that the combination of prefetching schemes does lead
to fewer misses, it is likely that the combination of prefetching strategies somewhat increases contention for
resources, and affects timeliness.
We attempted the same coverage experiment on the AMD K7. It lacks a counter for L2 misses, and as a
result, we approximated them with a counter for the number of refills from the memory bus. Unfortunately
we cannot distinguish between refills due to L2 misses and prefetching, and as a result we observed no
significant differences between the refill counts when software prefetching was enabled. We therefore do
not present the graph here.
We probed further into the performance of ft and found that it was very sensitive to the choice of
prefetch distances. It turns out that UMI was able to pick a prefetch distance that is closer to the optimal
prefetching distance compared to the hardware prefetcher. This highlight an important advantage of UMI,
namely that a more detailed analysis of the access patterns is possible in software than is usually feasible in
hardware.
The goal of this paper is not to champion a better software prefetching algorithm. We present these
results only as a demonstration of the potency of the information afforded by UMI. We believe that other
performance enhancing mechanisms (e.g., [7, 26, 18]) can potentially benefit from UMI.
18
9 Background and Related Work
Cache Modeling and Evaluation. There are three approaches for evaluating or modeling the performance
of memory systems: hardware monitoring, software simulation, and analytical modeling. Hardware mon-
itoring has the advantages of being accurate with relatively low runtime overhead. There are a number of
proposals for architectures to monitor cache behavior [9, 30]. However, hardware-based approaches lack
generality because they require non-trivial architectural changes. Modern processors support a restricted set
of mechanisms that sample and count certain hardware events. This form of sampling lacks contextual infor-
mation, and is generally only suitable for computing statistical summaries, rather than fine-grained analysis
of individual memory access operations. Some researchers have successfully used the performance mon-
itoring units to collect performance profiles and identify delinquent loads on specific processors [17, 18].
Such schemes however are generally not portable across platforms.
Software simulators such as SimpleScalar [6], Cachegrind [22] and Dinero [13] are able to simulate
detailed cache behaviors. However, the associated overhead is often too significant to evaluate realistic
workloads. Often it takes hours to complete the entire process, even for medium-sized workloads. So it is
hard to scale this approach to large real-world applications.
There is a large body of work on analytical cache models (see [1] and [16] and for examples). Generally
these models suffer from the same set of problems—they are built on probabilistic assumptions that may not
hold in practice; they require entire traces to be stored in some cases; are only useful for general trends; and
they do not provide fine grained details.
Delinquent Load Identification. Nearly all prefetching techniques [26, 20, 7] necessitate some form of
delinquent load identification [29]. Typically this is done using profiling and complete cache simulations,
both of which are very time and resource consuming, and can only be used offline as part of a profile-guided
optimization framework.
A common strategy to reduce the overhead relies on periodic sampling of the memory references [2]. An
implementation in Jalapeno achieved an average overhead of 3%, but it did not explore the ideas of recording
traces and using online mini-simulations. Hirzel and Chilimbi [14] implemented the same scheme for x86
binaries and found the average overhead to be between 6-35%. They managed to reduce the overhead to
3-18% by coalescing dispatchers, but their scheme requires some static code analysis.
19
Others have proposed static techniques [28] to identify delinquent operations without simulation, while
some schemes use profiling to improve accuracy [24]. These strategies require suitable training data that
are representative of real workloads. To reduce the overhead, many hardware based delinquent load iden-
tification and prefetch schemes were proposed [10, 8, 11, 21, 12], but they suffer from the need of specific
hardware support.
In contrast to previous work, UMI does not rely on any operating system, compiler or specialized hard-
ware mechanism, and does not require any static analysis of the source code. Furthermore, it works on the
entire program, including dynamically loaded modules. It can be readily applied to programs running on
stock hardware, without any modifications.
10 Conclusion
This paper contributes a lightweight and practical alternative to offline profiling with simulators, and per-
formance tuning using hardware counters. We introduced Ubiquitous Memory Introspection (UMI) as a
new methodology that provides online and application-specific profiling information that is necessary for
runtime memory-centric optimizations.
UMI is based on the insight that memory references traces collected at runtime reasonably approximate
the underlying memory system behavior, and that mini-simulations using these traces can be performed at
runtime to provide parameters for an online performance tuning mechanisms. UMI permits the development
of online tools that have the new capability of inspecting memory performance at its finest granularity (in-
structions and addresses). Runtime optimizers have the unique advantage of customizing optimization plans
in a workload-specific manner, and can lessen the impact of offline performance tuning that may have used
training workloads that do not accurately reflect actual use scenarios. UMI fills a gap between time consum-
ing software simulations and hardware counters designed for medium to large granularity monitoring.
Our implementation of UMI has a low overhead and naturally complements runtime optimizations tech-
niques.We presented three applications of UMI that we can verify against actual systems. First, we showed
that UMI can accurately model the cache performance on existing memory systems for 32 benchmarks,
including the full suite of SPEC2000 benchmarks. On a Pentium 4 and an AMD K7, we observed a high
correlation between the software measured miss rates, and the actual hardware measured miss rates. Next,
we presented an application of UMI at a much finer level. Specifically, we showed that we can use UMI to
20
identify the high-miss rate (delinquent) load instructions in a program. We validated our results against full
cache simulations. We showed that we can accurately identify 77% of the delinquent loads in the program.
Although there is a 66% false positive rate, we believe future evolutions of this work will improve these
results. Last, we used the results of the introspection to implement a runtime software prefetcher. The opti-
mization was competitive with a hardware prefetcher, achieving an 11% performance gain. In the best case,
the software prefetcher discovered a prefetching opportunity that outperformed the Pentium 4 prefetcher.
We believe that UMI provides a versatile framework that naturally complements a large suite of new and
powerful online or offline memory optimizations. It is an extensible, transparent, and efficient framework
for analyzing memory performance at customizable granularity. UMI runs on existing stripped binaries and
commodity processors without any additional steps in the execution process or any user visible artifacts.
The end-users execute their programs as they normally do. UMI is also readily applicable to existing archi-
tectures and platforms, and presents new opportunities in the context of emerging multicore architectures
where the memory performance poses a serious challenge to performance scalability.
Acknowledgements
This research was sponsored in part by the Singapore-MIT Alliance, and the DARPA through the Depart-
ment of the Interior National Business Center under grant number NBCH104009.
References
[1] A. Agarwal, J. Hennessy, and M. Horowitz. An analytical cache model. ACM Trans. Comput. Syst., 7(2):184–215, 1989.
[2] M. Arnold and B. G. Ryder. A framework for reducing the cost of instrumented code. In PLDI ’01: Proceedingsof the ACM SIGPLAN 2001 conference on Programming language design and implementation, pages 168–179,New York, NY, USA, 2001. ACM Press.
[3] T. Austin. Pointer-intensive benchmark suite. http://www.cs.wisc.edu/˜austin/ptr-dist.html.
[4] K. Barr. Summarizing Multiprocessor Program Execution with Versatile, Microarchitecture-Independent Snap-shots. PhD thesis, Massachusetts Institute of Technology, September 2006.
[5] D. Bruening. Efficient, Transparent, and Comprehensive Runtime Code Manipulation. PhD thesis, MassachusettsInstitute of Technology, September 2004. http://www.cag.csail.mit.edu/rio/.
[6] D. Burger and T. Austin. The SimpleScalar Tool Set, Version 2.0. Technical report, University of Wisconsin-Madison Computer Science Department, 1997.
[7] T. M. Chilimbi and M. Hirzel. Dynamic hot data stream prefetching for general-purpose programs. In PLDI ’02:Proceedings of the ACM SIGPLAN 2002 Conference on Programming language design and implementation,pages 199–209. ACM Press, 2002.
21
[8] J. D. Collins, S. Sair, B. Calder, and D. M. Tullsen. Pointer cache assisted prefetching. In MICRO 35: Proceed-ings of the 35th annual ACM/IEEE international symposium on Microarchitecture, pages 62–73, Los Alamitos,CA, USA, 2002. IEEE Computer Society Press.
[9] J. D. Collins and D. M. Tullsen. Runtime identification of cache conflict misses: The adaptive miss buffer. ACMTrans. Comput. Syst., 19(4):413–439, 2001.
[10] J. D. Collins, D. M. Tullsen, H. Wang, and J. P. Shen. Dynamic speculative precomputation. In MICRO 34: Pro-ceedings of the 34th annual ACM/IEEE international symposium on Microarchitecture, pages 306–317, Wash-ington, DC, USA, 2001. IEEE Computer Society.
[11] J. D. Collins, H. Wang, D. M. Tullsen, C. Hughes, Y.-F. Lee, D. Lavery, and J. P. Shen. Speculative precompu-tation: long-range prefetching of delinquent loads. SIGARCH Comput. Archit. News, 29(2):14–25, 2001.
[12] R. Cooksey, S. Jourdan, and D. Grunwald. A stateless, content-directed data prefetching mechanism. In ASPLOS-X: Proceedings of the 10th international conference on Architectural support for programming languages andoperating systems, pages 279–290, New York, NY, USA, 2002. ACM Press.
[13] J. Edler and M. Hill. Dinero IV Trace-Driven Uniprocessor Cache Simulator.http://www.cs.wisc.edu/˜markhill/DineroIV.
[14] M. Hirzel and T. M. Chilimbi. Bursty tracing: A framework for low-overhead temporal profiling. In ACMWorkshop on Feedback-Directed and Dynamic Optimization, 2001.
[15] Intel Corporation. IA-32 Intel Architecture Optimization Reference Manual.
[16] S. Laha, J. H. Patel, and R. K. IYER. Accurate low-cost methods for performance evaluation of cachememorysystems. IEEE Transactions on Computers, 37(11):1325–1336, Nov 1988.
[17] J. Lu, H. Chen, R. Fu, W.-C. Hsu, B. Othmer, P.-C. Yew, and D.-Y. Chen. The performance of runtime datacache prefetching in a dynamic optimization system. In MICRO 36: Proceedings of the 36th annual IEEE/ACMInternational Symposium on Microarchitecture, page 180, Washington, DC, USA, 2003. IEEE Computer Society.
[18] J. Lu, A. Das, W.-C. Hsu, K. Nguyen, and S. G. Abraham. Dynamic helper threaded prefetching on the sunultrasparc cmp processor. In MICRO 38: Proceedings of the 38th annual IEEE/ACM International Symposiumon Microarchitecture, pages 93–104, Washington, DC, USA, 2005. IEEE Computer Society.
[19] C.-K. Luk, R. Cohn, R. Muth, H. Patil, A. Klauser, G. Lowney, S. Wallace, V. J. Reddi, and K. Hazelwood. Pin:Building customized program analysis tools with dynamic instrumentation. In Programming Language Designand Implementation, pages 190–200, Chicago, IL, June 2005.
[20] C.-K. Luk and T. C. Mowry. Compiler-based prefetching for recursive data structures. In ASPLOS-VII: Proceed-ings of the seventh international conference on Architectural support for programming languages and operatingsystems, pages 222–233, New York, NY, USA, 1996. ACM Press.
[21] A. Moshovos, D. N. Pnevmatikatos, and A. Baniasadi. Slice-processors: an implementation of operation-basedprediction. In ICS ’01: Proceedings of the 15th international conference on Supercomputing, pages 321–334,New York, NY, USA, 2001. ACM Press.
[22] N. Nethercote. Dynamic Binary Analysis and Instrumentation. PhD thesis, University of Cambridge, November2004. http://valgrind.org/.
[23] OLDEN benchmark suite. http://www.cs.princeton.edu/˜mcc/olden.html.
[24] V.-M. Panait, A. Sasturkar, and W.-F. Wong. Static identification of delinquent loads. In CGO ’04: Proceedingsof the international symposium on Code generation and optimization, page 303, Washington, DC, USA, 2004.IEEE Computer Society.
[25] PAPI: Performance application programmer interface. http://icl.cs.utk.edu/papi/.
[26] R. M. Rabbah, H. Sandanagobalane, M. Ekpanyapong, and W.-F. Wong. Compiler orchestrated prefetching viaspeculation and predication. In ASPLOS-XI: Proceedings of the 11th international conference on Architecturalsupport for programming languages and operating systems, pages 189–198, New York, NY, USA, 2004. ACMPress.
22
[27] SPEC CPU2000 Benchmark Suite, 2000. http://www.spec.org/osg/cpu2000/.
[28] Y. K. Toshihiro Ozawa and S. Nishizaki. Cache miss heuristics and preloading techniques for general-purposeprograms. In Micro28: Proceedings of the 28th International Symposium on Microarchitecture, pages 243 –248, 1995.
[29] S. P. Vanderwiel and D. J. Lilja. Data prefetch mechanisms. ACM Comput. Surv., 32(2):174–199, 2000.
[30] C. Zilles and G. Sohi. A programmable co-processor for profiling. In HPCA ’01: Proceedings of InternationalSymposium on High Performance Computer Architecture, 2001.
23