\u003ctitle\u003eautomatic lesion tracking for a pet/ct based computer aided cancer therapy...
TRANSCRIPT

Automatic lesion tracking for a PET/CT based computeraided cancer therapy monitoring system
Roland Opfer a, Winfried Brenner b, Ingwer Carlsen a, Steffen Renisch a, Jorg Sabczynski a,Rafael Wiemker a
a Philips Research Laboratories Hamburg, Germanyb Department of Nuclear Medicine, University Medical Center Hamburg, Germany
ABSTRACT
Response assessment of cancer therapy is a crucial component towards a more effective and patient individualizedcancer therapy. Integrated PET/CT systems provide the opportunity to combine morphologic with functionalinformation. However, dealing simultaneously with several PET/CT scans poses a serious workflow problem. Itcan be a difficult and tedious task to extract response criteria based upon an integrated analysis of PET and CTimages and to track these criteria over time. In order to improve the workflow for serial analysis of PET/CTscans we introduce in this paper a fast lesion tracking algorithm. We combine a global multi-resolution rigidregistration algorithm with a local block matching and a local region growing algorithm. Whenever the user clickson a lesion in the base-line PET scan the course of standardized uptake values (SUV) is automatically identifiedand shown to the user as a graph plot. We have validated our method by a data collection from 7 patients. Eachpatient underwent two or three PET/CT scans during the course of a cancer therapy. An experienced nuclearmedicine physician manually measured the courses of the maximum SUVs for altogether 18 lesions. As a resultwe obtained that the automatic detection of the corresponding lesions resulted in SUV measurements which arenearly identical to the manually measured SUVs. Between 38 measured maximum SUVs derived from manualand automatic detected lesions we observed a correlation of 0.9994 and a average error of 0.4 SUV units.
Keywords: computer aided cancer therapy, therapy monitoring, multi modality systems, registration, lesiontracking
1. INTRODUCTION
“In twenty years we are going to have what I call the three Ps medicine: predictive, personalized, and preemptive- that is my vision”. These words of Elias Zerhouni, current director of the National Institutes of Health(NIH), characterize very well the development medicine has gone through over the last decade and will be goingthrough for the foreseeable future. Computer-Aided Diagnosis (CAD) is a key technology for such 3P medicalcare. Currently, CAD systems automatically detect and characterize suspicious, i.e. potentially cancerous,lesions in medical images and indicate these lesions to the radiologist for further scrutiny.1–3 While there arenumerous publications on computer systems to support the diagnosis of cancer, relatively little has been donefor a computerized approach for personalized cancer therapy. In this paper we do some steps towards a solutionfor a computer assisted personalized cancer therapy.
Response assessment of cancer therapy is often still based on a crude morphological criteria (RECIST) mea-suring changes in the diameter of a tumor from CT images taken before and after treatment.4 The conventionalCT-based therapy assessment only allows a relatively late assessment of therapy response. FDG-PET imagingin combination with CT has a great potential to improve response assessment, especially during the early stagesof cancer therapy. The new PET-based approach allows a much earlier and more sensitive evaluation of tumorresponse. Although still being at its infancy, impressive evidence is accumulating, demonstrating the benefitof this new approach.5 The earlier positively responding tumors can be differentiated from non-responders,the better the chances of adjusting therapy for improved patient benefit and comfort. However, how to definethe best possible response criterion from PET/CT data is still under investigation.6 The most widely used
contact: [email protected]
Medical Imaging 2008: Computer-Aided Diagnosis, edited by Maryellen L. Giger, Nico KarssemeijerProc. of SPIE Vol. 6915, 691513, (2008) · 1605-7422/08/$18 · doi: 10.1117/12.770356
Proc. of SPIE Vol. 6915 691513-12008 SPIE Digital Library -- Subscriber Archive Copy

Figure 1. : Screen shot of a PET/CT follow-up study of a 31-year old male patient with high-grade Non-Hodgkinlymphoma; first follow-up with PET/CT 3 weeks after the end of first-line chemotherapy revealing a remainder tumormass in the mediastinum with FDG uptake; second follow-up 3 weeks after another 2 cycles of chemotherapy with decreasein size and SUV; third follow-up 3 months later for re-staging showing no significant changes in tumor SUV comprising3 3D PET and CT data sets. The PET data are shown as color overlays to the CT slices in the top row and in theiroriginal form in the bottom row. The red areas indicate a lesion-of-interest as segmented and tracked through the timeseries. The graph on the top right shows the SUV measures, calculated according to three different criteria. Althoughonly slice images are shown, all operations are carried out in 3D.
method is to measure the maximum standardized uptake value (SUV)7 in a suitable region of interest arounda lesion.8 However, the extraction of certain response criteria from a series of PET/CT scans is a tedious anderror prone task. In order to assess the change of SUV during the course of therapy, the physician has to identifycorresponding lesions in the PET images. Response criteria like maximum SUV have to be measured in baseline scan as well as in all consecutive follow-up PET scans.
We have developed a software system to support quantitative therapy assessment by means of tumor SUVand tumor volume on the basis of PET/CT follow-up studies providing:
• improved workflow giving the clinician unified and immediate access to all data sets,
• automatic alignment of all follow-up studies using multi-resolution rigid registration,
• methods for the semi-automatic detection and delineation of lesions,
• automatic tracking of lesions using locally rigid registration (block matching or region growing) to com-pensate for non-linear deformations,
• an expandable toolbox for the definition and systematic evaluation of response criteria.
We shall show in this paper that the combination of a global rigid registration in combination with local blockmatching and region growing can successfully be used for tracking lesions in a series of PET/CT scans. Thisalgorithm will speed up the workflow significantly and eventually may also improve the quality of treatment.
Proc. of SPIE Vol. 6915 691513-2

Global Registration_____ --a
Tr I
'di
Figure 2. Registration schema for lesion tracking: Combination of a pre-computed global rigid registration with aon-demand local block matching
2. MATERIALS
For our investigation we have used PET/CT data from 7 different patients which have been acquired with aPhilips Gemini PET/CT scanner in the department of nuclear medicine, University Medical Center Hamburg,Germany. Four patients underwent 2 PET/CT scans and three patients underwent three PET/CT scans duringthe course of a cancer therapy. The patients suffered from different cancer types. The lesions included differentmalignancies like lymphomas or solid tumors and were located at very different positions in the body. Anexperienced nuclear medicine physician has tracked altogether 18 lesions in these 7 patients over the course ofthe therapy. For each lesion the corresponding lesions in the follow-up scans were identified and the maximumand average SUV was manually measured. The average SUV was taken over a circle manually drawn aroundthe lesion in a single slice. A data set for one patient with a high-grade Non-Hodgkin lymphoma is shown inFigure 1.
3. METHODS
3.1. Lesion tracking
In order to assess the change of SUV during the course of therapy, the physician has to identify correspondinglesions in the PET images. Without software support this is a tedious and error prone task. Our system allowsthe automatic identification of corresponding lesions. The user marks a lesion in the base-line PET scan. Thealgorithm then finds the corresponding lesions in the follow-up scans automatically. Our proposed lesion trackingalgorithm consists of three basic steps. We assume that we are given a number of PET/CT scans from the samepatient.
1) Global rigid registration: We apply a fast multi-resolution rigid registration algorithm.9 We onlyallow scalings and shifts in the space of possible rigid transformations. As similarity measure we use crosscorrelation between the gray values. We compute registrations between all PET/CT pairs and between allpairs of two consecutive CT scans. Registrations between two arbitrary images from that series are definedby chaining up these global rigid registrations. This is depicted on the left image of Figure 2.
2) Block matching: Whenever the user clicks on a lesion in the base-line PET image, the correspondinglocations in the CT images are identified (based on the PET/CT registration). The initial coordinateestimate by the global registrations is refined by a block matching of a two local volume of interest (VOI)around the corresponding position in the CT images. We crop a VOI around the corresponding CT point
Proc. of SPIE Vol. 6915 691513-3
in the base-line CT image. The VOI is propagated to the follow-up CT scans according to the globalregistration. The center of the VOI is then varied in the follow-up CT scans, while optimizing the cross-correlation within the VOI. The block matching is depicted in the right image of Figure 2.
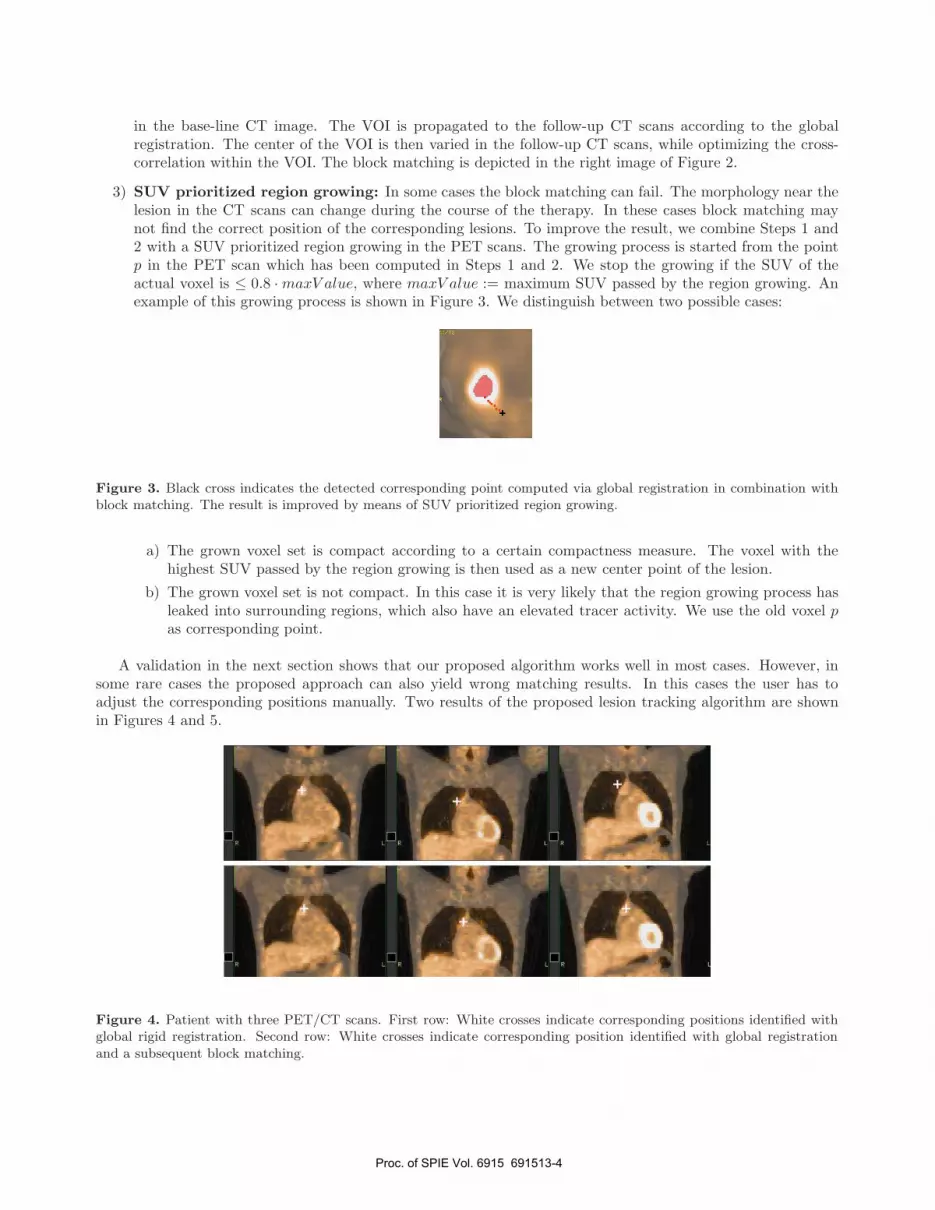
3) SUV prioritized region growing: In some cases the block matching can fail. The morphology near thelesion in the CT scans can change during the course of the therapy. In these cases block matching maynot find the correct position of the corresponding lesions. To improve the result, we combine Steps 1 and2 with a SUV prioritized region growing in the PET scans. The growing process is started from the pointp in the PET scan which has been computed in Steps 1 and 2. We stop the growing if the SUV of theactual voxel is ≤ 0.8 · maxV alue, where maxV alue := maximum SUV passed by the region growing. Anexample of this growing process is shown in Figure 3. We distinguish between two possible cases:
Figure 3. Black cross indicates the detected corresponding point computed via global registration in combination withblock matching. The result is improved by means of SUV prioritized region growing.
a) The grown voxel set is compact according to a certain compactness measure. The voxel with thehighest SUV passed by the region growing is then used as a new center point of the lesion.
b) The grown voxel set is not compact. In this case it is very likely that the region growing process hasleaked into surrounding regions, which also have an elevated tracer activity. We use the old voxel pas corresponding point.
A validation in the next section shows that our proposed algorithm works well in most cases. However, insome rare cases the proposed approach can also yield wrong matching results. In this cases the user has toadjust the corresponding positions manually. Two results of the proposed lesion tracking algorithm are shownin Figures 4 and 5.
Figure 4. Patient with three PET/CT scans. First row: White crosses indicate corresponding positions identified withglobal rigid registration. Second row: White crosses indicate corresponding position identified with global registrationand a subsequent block matching.
Proc. of SPIE Vol. 6915 691513-4
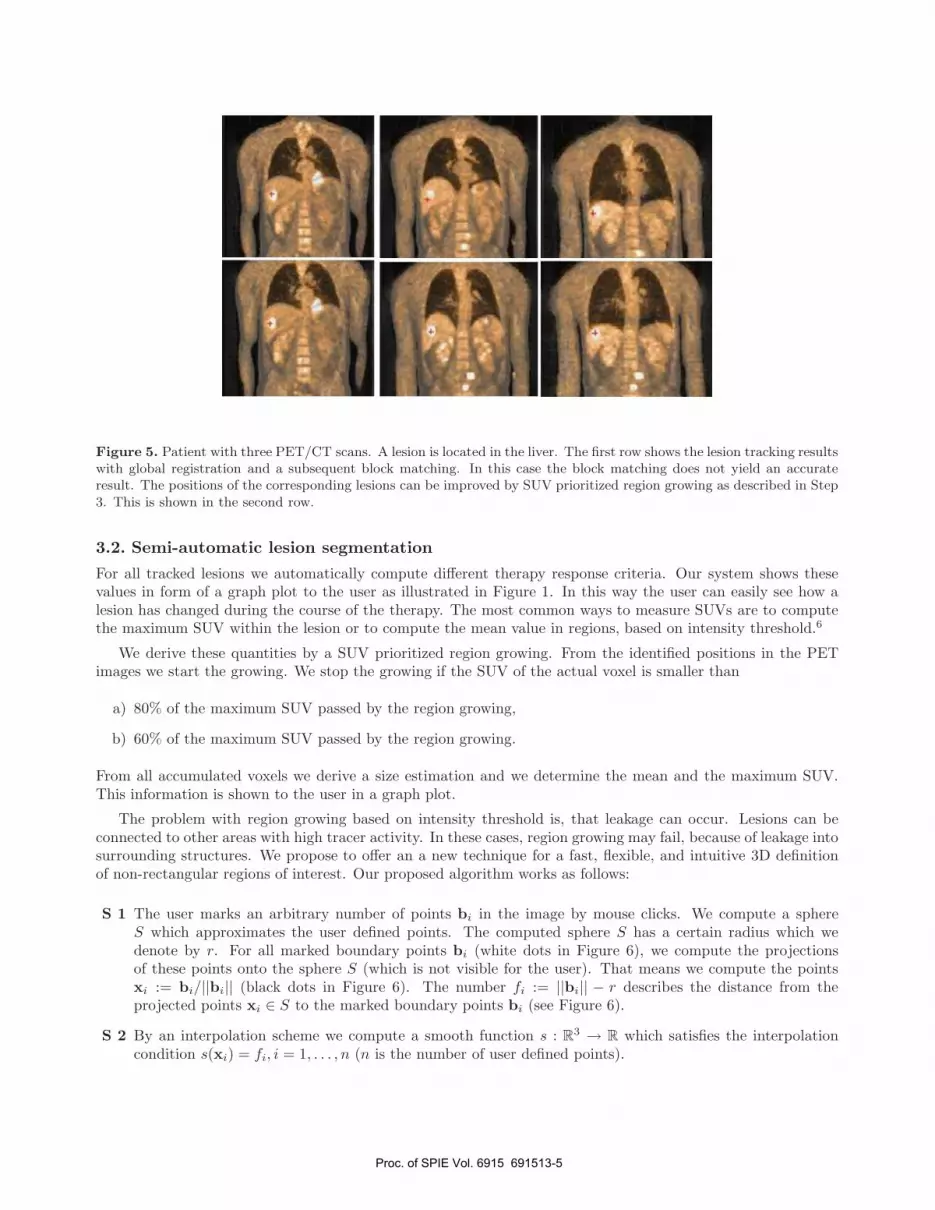
Figure 5. Patient with three PET/CT scans. A lesion is located in the liver. The first row shows the lesion tracking resultswith global registration and a subsequent block matching. In this case the block matching does not yield an accurateresult. The positions of the corresponding lesions can be improved by SUV prioritized region growing as described in Step3. This is shown in the second row.
3.2. Semi-automatic lesion segmentation
For all tracked lesions we automatically compute different therapy response criteria. Our system shows thesevalues in form of a graph plot to the user as illustrated in Figure 1. In this way the user can easily see how alesion has changed during the course of the therapy. The most common ways to measure SUVs are to computethe maximum SUV within the lesion or to compute the mean value in regions, based on intensity threshold.6
We derive these quantities by a SUV prioritized region growing. From the identified positions in the PETimages we start the growing. We stop the growing if the SUV of the actual voxel is smaller than
a) 80% of the maximum SUV passed by the region growing,
b) 60% of the maximum SUV passed by the region growing.
From all accumulated voxels we derive a size estimation and we determine the mean and the maximum SUV.This information is shown to the user in a graph plot.
The problem with region growing based on intensity threshold is, that leakage can occur. Lesions can beconnected to other areas with high tracer activity. In these cases, region growing may fail, because of leakage intosurrounding structures. We propose to offer an a new technique for a fast, flexible, and intuitive 3D definitionof non-rectangular regions of interest. Our proposed algorithm works as follows:
S 1 The user marks an arbitrary number of points bi in the image by mouse clicks. We compute a sphereS which approximates the user defined points. The computed sphere S has a certain radius which wedenote by r. For all marked boundary points bi (white dots in Figure 6), we compute the projectionsof these points onto the sphere S (which is not visible for the user). That means we compute the pointsxi := bi/||bi|| (black dots in Figure 6). The number fi := ||bi|| − r describes the distance from theprojected points xi ∈ S to the marked boundary points bi (see Figure 6).
S 2 By an interpolation scheme we compute a smooth function s : R3 → R which satisfies the interpolation
condition s(xi) = fi, i = 1, . . . , n (n is the number of user defined points).
Proc. of SPIE Vol. 6915 691513-5
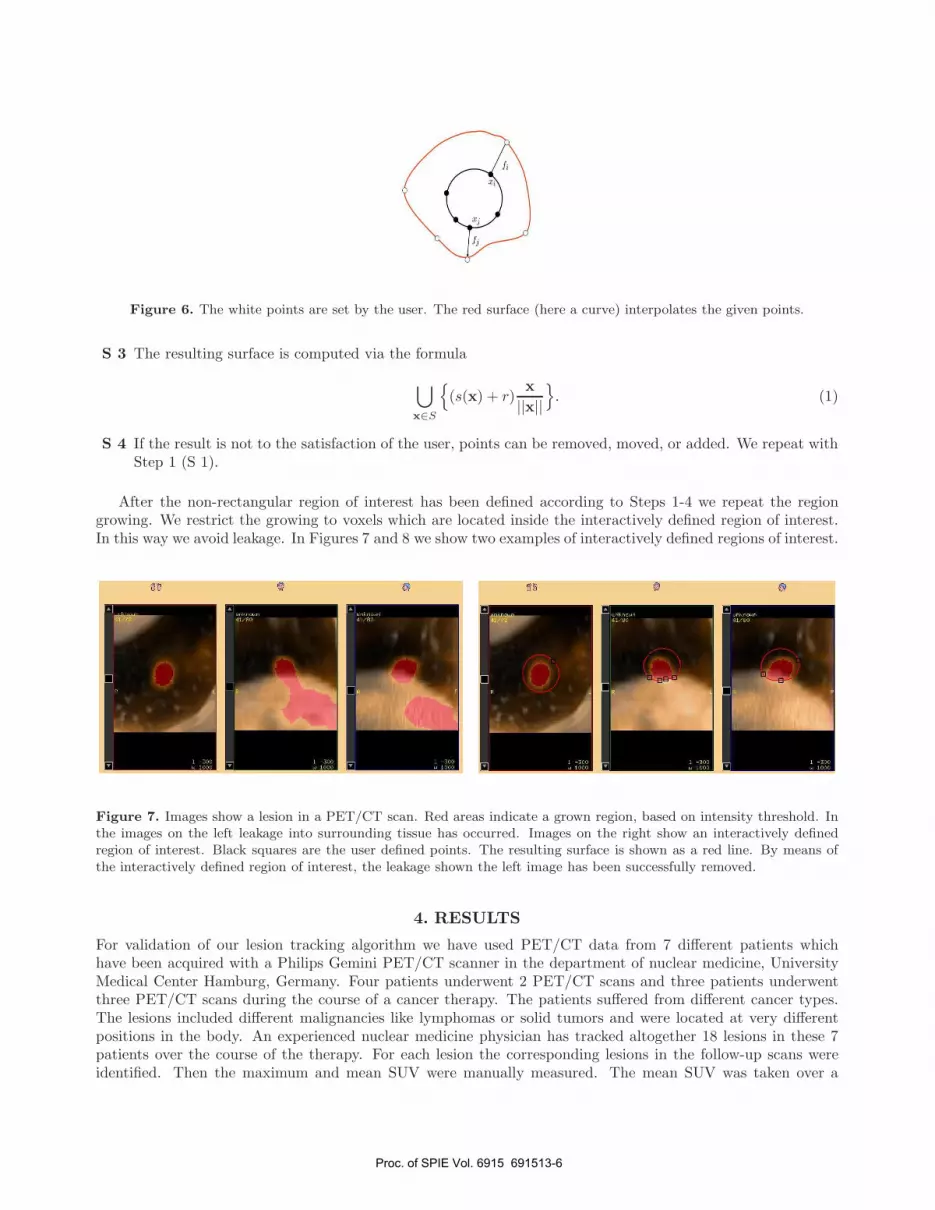
Figure 6. The white points are set by the user. The red surface (here a curve) interpolates the given points.
S 3 The resulting surface is computed via the formula
⋃
x∈S
{(s(x) + r)
x||x||
}. (1)
S 4 If the result is not to the satisfaction of the user, points can be removed, moved, or added. We repeat withStep 1 (S 1).
After the non-rectangular region of interest has been defined according to Steps 1-4 we repeat the regiongrowing. We restrict the growing to voxels which are located inside the interactively defined region of interest.In this way we avoid leakage. In Figures 7 and 8 we show two examples of interactively defined regions of interest.
Figure 7. Images show a lesion in a PET/CT scan. Red areas indicate a grown region, based on intensity threshold. Inthe images on the left leakage into surrounding tissue has occurred. Images on the right show an interactively definedregion of interest. Black squares are the user defined points. The resulting surface is shown as a red line. By means ofthe interactively defined region of interest, the leakage shown the left image has been successfully removed.
4. RESULTS
For validation of our lesion tracking algorithm we have used PET/CT data from 7 different patients whichhave been acquired with a Philips Gemini PET/CT scanner in the department of nuclear medicine, UniversityMedical Center Hamburg, Germany. Four patients underwent 2 PET/CT scans and three patients underwentthree PET/CT scans during the course of a cancer therapy. The patients suffered from different cancer types.The lesions included different malignancies like lymphomas or solid tumors and were located at very differentpositions in the body. An experienced nuclear medicine physician has tracked altogether 18 lesions in these 7patients over the course of the therapy. For each lesion the corresponding lesions in the follow-up scans wereidentified. Then the maximum and mean SUV were manually measured. The mean SUV was taken over a
Proc. of SPIE Vol. 6915 691513-6

100
10
manual max SUV
100
100
10
manual max SLA'
100
Figure 8. Image shows a lesion in a PET/CT scan. Red areas indicate a region, based on intensity threshold. As inFigure 7 an interactively defined region of interest has been defined to avoid leakage.
circle manually drawn around the lesion in a single slice (which was manually chosen). For automatic lesiontracking we interactively marked the lesion in the base-line scan with a mouse click. Lesions in the follow-upscans were then identified automatically as described in Section 3.1. From the identified lesions we started theregion growing as proposed in Section 3.2. From the grown regions we derive the maximal SUV as well as themean SUV for the intensity thresholds of 60% and 80 %. All measurement results are listed in Table 1.
From all manually annotated lesions, only in one case, the tracking failed and the lesions were missed in thefollow-up scans (see Table 1, patient 3, lesion 2). We compared courses of manually and automatically generatedSUVs measurements. The left graph in Figure 9 shows the manual maximal SUV measurements versus theautomatic maximal SUV measurements. The results are in excellent agreement. Between the 38 measuredmaximum SUVs derived from manual and automatic detected lesions we observed a correlation of 0.9994. Inaverage, the automatic SUV measurements were 0.46 SUV units higher than the manual determined values. Themean absolute error has 0.43 SUV units and the absolute error has a standard deviation of 0.6 SUV units. Itcan be observed that all but one automatic measured maximal SUVs are slightly higher (in average 0.42 SUVunits) than the manual measured SUVs. This is understandable since the manual measurement was done in asingle slice of the PET image while our automatic measurements are carried out in 3D. The right plot in Figure9 shows the manual maximal SUV measurement versus the automatically derived mean SUV for the intensitythresholds of 60%. We observe a high correlation of 0.9991 between these quantities. The plot in Figure 10compares the manual maximal and manual mean SUV measurements. Between these two measured quantitieswe observe a correlation of 0.93.
Figure 9. The plots show manual versus automatic SUV measurements.
Proc. of SPIE Vol. 6915 691513-7
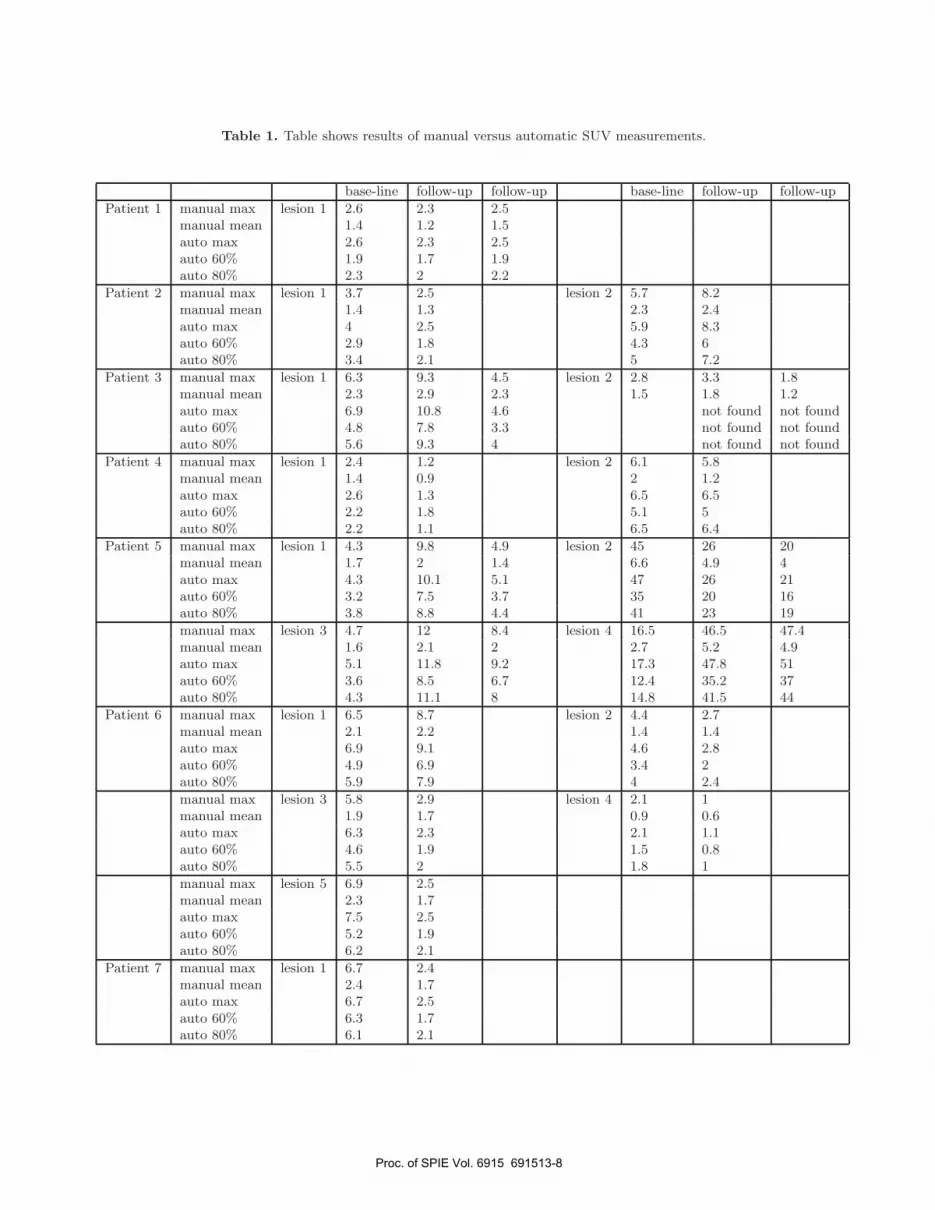
Table 1. Table shows results of manual versus automatic SUV measurements.
base-line follow-up follow-up base-line follow-up follow-up
Patient 1 manual max lesion 1 2.6 2.3 2.5manual mean 1.4 1.2 1.5auto max 2.6 2.3 2.5auto 60% 1.9 1.7 1.9auto 80% 2.3 2 2.2
Patient 2 manual max lesion 1 3.7 2.5 lesion 2 5.7 8.2manual mean 1.4 1.3 2.3 2.4auto max 4 2.5 5.9 8.3auto 60% 2.9 1.8 4.3 6auto 80% 3.4 2.1 5 7.2
Patient 3 manual max lesion 1 6.3 9.3 4.5 lesion 2 2.8 3.3 1.8manual mean 2.3 2.9 2.3 1.5 1.8 1.2auto max 6.9 10.8 4.6 not found not foundauto 60% 4.8 7.8 3.3 not found not foundauto 80% 5.6 9.3 4 not found not found
Patient 4 manual max lesion 1 2.4 1.2 lesion 2 6.1 5.8manual mean 1.4 0.9 2 1.2auto max 2.6 1.3 6.5 6.5auto 60% 2.2 1.8 5.1 5auto 80% 2.2 1.1 6.5 6.4
Patient 5 manual max lesion 1 4.3 9.8 4.9 lesion 2 45 26 20manual mean 1.7 2 1.4 6.6 4.9 4auto max 4.3 10.1 5.1 47 26 21auto 60% 3.2 7.5 3.7 35 20 16auto 80% 3.8 8.8 4.4 41 23 19
manual max lesion 3 4.7 12 8.4 lesion 4 16.5 46.5 47.4manual mean 1.6 2.1 2 2.7 5.2 4.9auto max 5.1 11.8 9.2 17.3 47.8 51auto 60% 3.6 8.5 6.7 12.4 35.2 37auto 80% 4.3 11.1 8 14.8 41.5 44
Patient 6 manual max lesion 1 6.5 8.7 lesion 2 4.4 2.7manual mean 2.1 2.2 1.4 1.4auto max 6.9 9.1 4.6 2.8auto 60% 4.9 6.9 3.4 2auto 80% 5.9 7.9 4 2.4
manual max lesion 3 5.8 2.9 lesion 4 2.1 1manual mean 1.9 1.7 0.9 0.6auto max 6.3 2.3 2.1 1.1auto 60% 4.6 1.9 1.5 0.8auto 80% 5.5 2 1.8 1
manual max lesion 5 6.9 2.5manual mean 2.3 1.7auto max 7.5 2.5auto 60% 5.2 1.9auto 80% 6.2 2.1
Patient 7 manual max lesion 1 6.7 2.4manual mean 2.4 1.7auto max 6.7 2.5auto 60% 6.3 1.7auto 80% 6.1 2.1
Proc. of SPIE Vol. 6915 691513-8

man
ual m
ean
SU
V
—
0 o
o
3 =
=
0 0
Figure 10. Plot shows the manual maximal versus the mean SUV measurements. The mean SUV was taken over a circlemanually drawn around the lesion in a single slice (which was also manually selected).
5. CONCLUSIONS
In this paper we performed the first steps towards a computer aided cancer therapy monitoring system. We haveshown that rigid registration in combination with a on demand block matching algorithm and local region growingis suitable for lesion tracking in a series of PET/CT images. The automatically measured SUV values were slightlyhigher than the manually measured values. This is due to the fact that the manual SUV measurements wereperformed in a single slice of the PET image and therefore the maximum SUV value in the lesion could be missedwhereas the automatic procedure works in all three dimensions. Our approach speeds up the workflow of serialanalysis of PET/CT images significantly, and we obtain the same results as the conventional manual approach.It will be an interesting task for future work to incorporate more sophisticated response criteria into our system.
REFERENCES1. R. Wiemker, P. Rogalla, T. Blaffert, D. Sifri, O. Hay, E. Shah, R. Truyen, and T. Fleiter, “Aspects of
computer aided detection (CAD) and volumetry of pulmonary nodules using multislice CT,” British Journalof Radiology 78, pp. 46–56, 2005.
2. R. Wiemker, P. Rogalla, D. Wormanns, T. Bulow, R. Opfer, A. Ekin, T. Blaffert, O. Hay, E. Dharaiya,R. Truyen, J. Peters, H. Hein, V. Romano, and F. Beyer, “Computer aided detection & quantification -concepts and results with respect to pulmonary nodules in high resolution CT data,” G. Spekowius, T.Wendler (Eds.), Advances in Healthcare Technology - Shaping the Future of Medical Care, Springer , pp. 385–401, 2005.
3. R. Opfer and R. Wiemker, “Performance analysis for computer aided lung nodule detection on LIDC data,”Proceedings SPIE Medical Imaging 6515, 2007.
4. J. E. Husband, L. H. Schwartz, J. Spencer, L. Ollivier, D. M. Kind, R. Johnson, and R. Reznek, “Evaluationof the response to treatment of solid tumours: a consensus statement of the international cancer imagingsociety,” British Journal of Cancer 90, pp. 2256–2260, 2004.
5. W. Weber and R. Figlin, “Monitoring cancer treatment with PET/CT: Does it make a difference?,” Journalof Nuclear Medicine 48, pp. 36S–44S, 2007.
6. M. Soret and B. I. Bacharach, S. L., “Partial-volume effect in PET tumor imaging,” Journal of NuclearMedicine 48, pp. 932–945, 2007.
7. N. MM Graham, L. Peterson, and H. R.M., “Comparison of simplified quantitative analyses of FDG uptake,”Nuclear Medicine and Biology 7, pp. 347–655, 2000.
Proc. of SPIE Vol. 6915 691513-9

8. C. Nahmias, W. T. Hanna, L. M. Wahl, M. J. Long, K. F. Hubner, and D. W. Townsend, “Time course ofearly response to chemotherapy in nonsmall cell lung cancer patients with 18F-FDG PET/CT,” Journal ofNuclear Medicine 48, pp. 744–751, 2007.
9. J. V. Hajnal, D. Hill, and D. J. Hawkes, Medical Image Registration, CRC Press LLC, Florida, 2001.
Proc. of SPIE Vol. 6915 691513-10