two distinct actin networks drive the protrusion of migrating cells
TRANSCRIPT

DOI: 10.1126/science.1100533 , 1782 (2004); 305Science
et al.A. Ponti,Migrating CellsTwo Distinct Actin Networks Drive the Protrusion of
www.sciencemag.org (this information is current as of March 1, 2007 ):The following resources related to this article are available online at
http://www.sciencemag.org/cgi/content/full/305/5691/1782version of this article at:
including high-resolution figures, can be found in the onlineUpdated information and services,
http://www.sciencemag.org/cgi/content/full/305/5691/1782/DC1 can be found at: Supporting Online Material
http://www.sciencemag.org/cgi/content/full/305/5691/1782#otherarticles, 6 of which can be accessed for free: cites 18 articlesThis article
60 article(s) on the ISI Web of Science. cited byThis article has been
http://www.sciencemag.org/cgi/content/full/305/5691/1782#otherarticles 25 articles hosted by HighWire Press; see: cited byThis article has been
http://www.sciencemag.org/cgi/collection/cell_bioCell Biology
: subject collectionsThis article appears in the following
http://www.sciencemag.org/about/permissions.dtl in whole or in part can be found at: this article
permission to reproduce of this article or about obtaining reprintsInformation about obtaining
registered trademark of AAAS. c 2004 by the American Association for the Advancement of Science; all rights reserved. The title SCIENCE is a
CopyrightAmerican Association for the Advancement of Science, 1200 New York Avenue NW, Washington, DC 20005. Science (print ISSN 0036-8075; online ISSN 1095-9203) is published weekly, except the last week in December, by the
on
Mar
ch 1
, 200
7 w
ww
.sci
ence
mag
.org
Dow
nloa
ded
from

verb expressions down into sequential mor-phemes, rather than produce multiple verbelements together in the single, simultaneousmovement found in adult models. In ASL,oversegmentation during acquisition was ob-served across a number of element types,including the agent and patient of a transitiveevent, and, as in NSL, the manner and path ofa motion event. These elements correspond tosemantic units that are relevant to lexicaliza-tion patterns in many (possibly all) languages(20). Thus, the elements chosen for segmen-tation may reveal the very primitives thatchildren are predisposed to seek out as basic,grammatical units.
Such primitives, and the processes thatisolate and recombine them, are central tochildren’s language-learning machinery to-day. Whether these drove the formation of thevery first human languages depends onwhether languages shaped learning abilities,or vice versa. We speculate that a combina-tion of the two was the case. Once languagedeveloped a discrete and hierarchical nature,children who tended toward analytical andcombinatorial learning would have an advan-tage acquiring it (3). In this way, evolutionarypressures would shape children’s language-learning (and now, language-building) mech-anisms to be analytical and combinatorial. Onthe other hand, once humans were equippedwith analytical, combinatorial learning mech-anisms, any subsequently learned languageswould be shaped into discrete and hierarchi-cally organized systems (4, 5).
Although our findings are consistent withboth directions of effect in the evolution oflearners and languages, they are at odds withaccounts in which such attributes evolvedexternally, were passed from generation togeneration solely through cultural transmis-sion, and were never reflected in the nature ofthe learning mechanism (7). In studies ofmature languages, the potential imprint of thelearning mechanism is redundant with, andhence experimentally obscured by, preexist-ing language structure. But the rapid restruc-turing of Nicaraguan Sign Language as it ispassed down through successive cohorts oflearners shows that even where discretenessand hierarchical combination are absent fromthe language environment, human learningabilities are capable of creating them anew.
References and Notes1. C. F. Hockett, Refurbishing Our Foundations: Elemen-
tary Linguistics from an Advanced Point of View (Ben-jamins, Philadelphia, 1987).
2. M. H. Christiansen, S. Kirby, Trends Cognit. Sci. 7, 300(2003).
3. R. Jackendoff, Foundations of Language: Brain, Mean-ing, Grammar, Evolution (Oxford Univ. Press, NewYork, 2002).
4. M. D. Hauser, N. Chomsky, W. T. Fitch, Science 298,1569 (2002).
5. S. Pinker, P. Bloom, Behav. Brain Sci. 13, 707 (1990).6. S. Kirby, Function, Selection, and Innateness: The
Emergence of Language Universals (Oxford Univ.Press, New York, 1999).
7. M. Tomasello, in Language Evolution, M. H. Chris-tiansen, S. Kirby, Eds. (Oxford Univ. Press, New York,2003), pp. 94–110.
8. L. Polich, But with Sign Language You Can Do So Much(Gallaudet Univ. Press, in press).
9. R. J. Senghas, thesis, University of Rochester (1997).10. S. Goldin-Meadow, in Language Acquisition: The State
of the Art, E. Wanner, L. R. Gleitman, Eds. (CambridgeUniv. Press, New York, 1982), pp. 51–77.
11. J. P. Morford, Lang. Commun. 16, 165 (1996).12. M. Coppola, thesis, University of Rochester (2002).13. J. Kegl, A. Senghas, M. Coppola, in Language Creation
and Language Change: Creolization, Diachrony, andDevelopment, M. DeGraff, Ed. (MIT Press, Cambridge,MA, 1999), pp. 179–237.
14. A. Senghas, thesis, Massachusetts Institute of Tech-nology (1995).
15. A. Senghas, M. Coppola, Psychol. Sci. 12, 323 (2001).16. A. Senghas, Cogn. Dev. 18, 511 (2003).17. See supporting data on Science Online.18. S. Kita, A. Ozyurek, J. Mem. Lang. 48, 16 (2003).19. D. McNeill, Hand and Mind: What Gestures Reveal
About Thought (Univ. of Chicago Press, Chicago,1992).
20. L. Talmy, in Grammatical Categories and the Lexicon,Vol. III, T. Shopen, Ed. (Cambridge Univ. Press, Cam-bridge, 1985), pp. 57–149.
21. E. Lenneberg, Biological Foundations of Language( Wiley, New York, 1967).
22. E. L. Newport, Cogn. Sci. 14, 11 (1990).23. E. Newport, in Aspects of the Development of Com-
petence, W. A. Collins, Ed., vol. 14 of MinnesotaSymposia on Child Psychology (Erlbaum, Hillsdale, NJ,1981), pp. 93–124.
24. J. Holm, Pidgins and Creoles, Vol. 1: Theory andStructure (Cambridge Univ. Press, Cambridge, 1988).
25. M. DeGraff, Ed., Language Creation and LanguageChange: Creolization, Diachrony, and Development(MIT Press, Cambridge, MA, 1999).
26. R. W. Anderson, in Pidginization and Creolization asLanguage Acquisition, R. Anderson, Ed. (Newbury,Rowley, MA, 1983), pp. 1–56.
27. D. Bickerton, Behav. Brain Sci. 7, 173 (1984).28. G. Sankoff, S. Laberge, Kivung 6, 32 (1973).29. Unlike NSL, creoles draw much of their vocabulary
and possibly some grammatical structure from thelanguages in contact where they arise; much debatesurrounds the question of the nature and degree ofthis influence (25).
30. R. P. Meier, J. Mem. Lang. 26, 362 (1987).31. We thank the Nicaraguan participants for their en-
thusiastic participation; the Melania Morales Schoolfor Special Education, the National Nicaraguan Asso-ciation of the Deaf (ANSNIC), and the NicaraguanMinistry of Education, Culture, and Sports (MECD) fortheir assistance and cooperation; Quaker House,Managua, for providing testing facilities; A. Engelman,M. Flaherty, E. Housman, S. Katseff, S. Littman, J.Pyers, M. Santos, and P. Shima for assistance withdata collection and analysis; and S. Bogoch, P. Ha-goort, S. Pinker, and R. Short for comments on earlierversions of the manuscript. Supported by the Lan-guage and Cognition Group at the Max Planck Insti-tute for Psycholinguistics, the Netherlands Organiza-tion for Scientific Research (NWO) project051.02.040 (A.O.), National Institute on Deafnessand Other Communication Disorders (NIDCD) grantR01 DC00491 (Susan Goldin-Meadow and A.O.),Turkish Academy of Sciences grant HAO/TUBA-GEBIP/2001-2-16 (A.O.), a visiting faculty position inpsychology at Harvard University (A.S.), and NIDCDgrant R01 DC05407 (A.S.).
Supporting Online Materialwww.sciencemag.org/cgi/content/full/305/5691/1779/DC1Materials and MethodsMovies S1 and S2
11 May 2004; accepted 15 July 2004
Two Distinct Actin NetworksDrive the Protrusion of
Migrating CellsA. Ponti, M. Machacek, S. L. Gupton, C. M. Waterman-Storer,*†
G. Danuser*†
Cell migration initiates by extension of the actin cytoskeleton at the leadingedge. Computational analysis of fluorescent speckle microscopy movies ofmigrating epithelial cells revealed this process is mediated by two spatiallycolocalized but kinematically, kinetically, molecularly, and functionally distinctactin networks. A lamellipodium network assembled at the leading edge butcompletely disassembled within 1 to 3 micrometers. It was weakly coupled tothe rest of the cytoskeleton and promoted the random protrusion and retrac-tion of the leading edge. Productive cell advance was a function of the secondcolocalized network, the lamella, where actomyosin contraction was integratedwith substrate adhesion.
Cell migration involves a coordinated cycleof plasma membrane protrusion at the lead-ing edge, adhesion site formation under theprotrusion, disruption of older adhesionsites at the cell rear, and cytoskeleton con-traction against adhesions to yield cell bodymovement (1). Protrusion is thought to re-sult from actin filament (F-actin) polymer-ization against the plasma membrane (2),with the polymerization rate regulated bythe rate of monomer addition to the fast-
growing (“barbed”) ends of filaments. Thismay depend on actin-related protein 2/3(Arp2/3) complex activation, which createsfree barbed ends by branching and de novonucleation of filaments (dendritic nucle-ation) (3), and on actin depolymerizing fac-tor (ADF) cofilin, which creates freebarbed ends by severing preexisting fila-ments and promoting depolymerization offree filament “pointed” ends (4). Filamentgrowth is limited by barbed end–capping
R E P O R T S
17 SEPTEMBER 2004 VOL 305 SCIENCE www.sciencemag.org1782
on
Mar
ch 1
, 200
7 w
ww
.sci
ence
mag
.org
Dow
nloa
ded
from
proteins and depletion of the polymeriza-tion-competent pool of actin monomers (5).
We exploited quantitative fluorescentspeckle microscopy (qFSM) (6) to studythe dynamic organization of F-actin in mi-grating cells and define its relationship tocell protrusive behavior. In FSM, a nonuni-form pattern of fluorophores forms by co-polymerization of F-actin from a pool ofactin monomers with a very low ratio be-tween fluorescently labeled and unlabeledmonomers. In high-resolution images, flu-orophore clusters are detected as local in-tensity maxima called speckles (fig. S1).We imaged speckles containing 2 to 8 flu-orescent monomers. Computational track-ing of �105 speckles per FSM movie (7)and statistical processing of their intensityfluctuations (8) allowed us to map F-actinflow (kinematics) and turnover (kinetics)with submicrometer resolution (9).
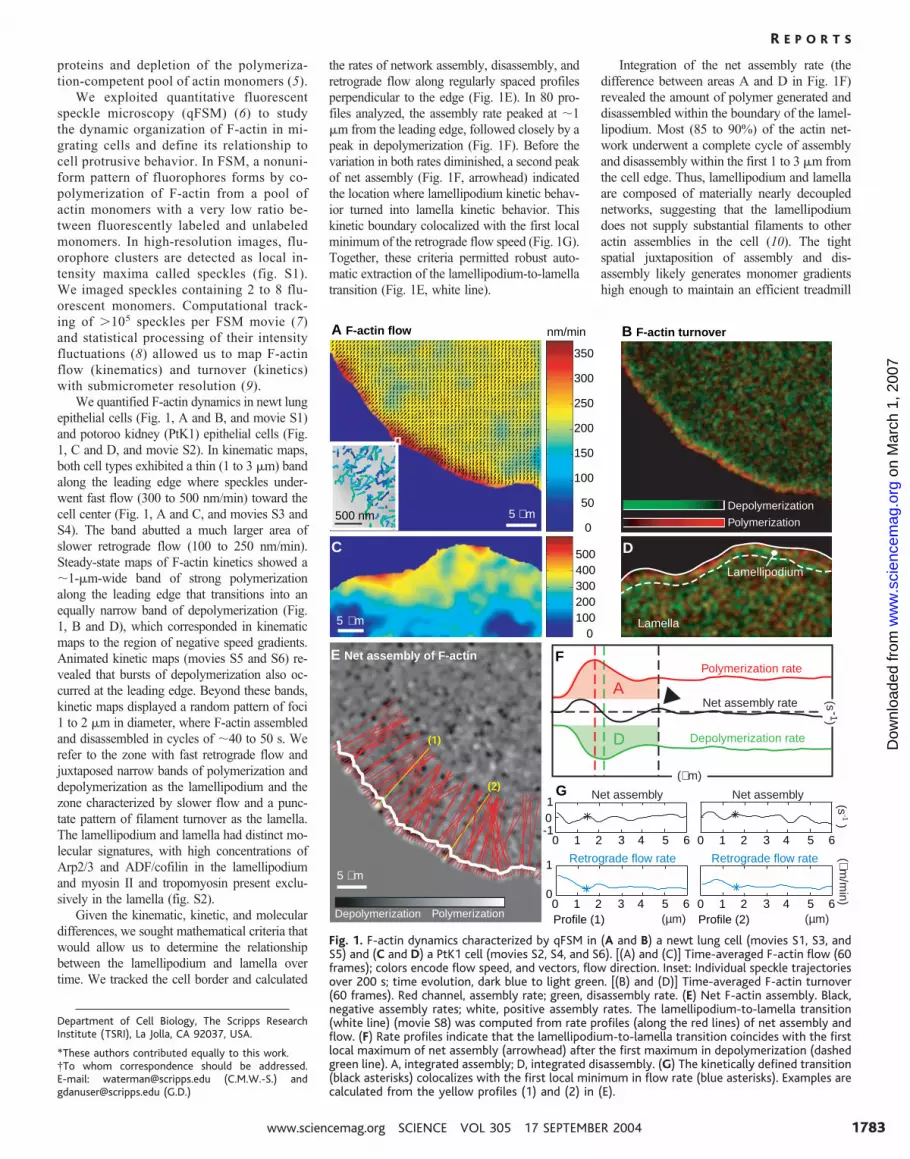
We quantified F-actin dynamics in newt lungepithelial cells (Fig. 1, A and B, and movie S1)and potoroo kidney (PtK1) epithelial cells (Fig.1, C and D, and movie S2). In kinematic maps,both cell types exhibited a thin (1 to 3 �m) bandalong the leading edge where speckles under-went fast flow (300 to 500 nm/min) toward thecell center (Fig. 1, A and C, and movies S3 andS4). The band abutted a much larger area ofslower retrograde flow (100 to 250 nm/min).Steady-state maps of F-actin kinetics showed a�1-�m-wide band of strong polymerizationalong the leading edge that transitions into anequally narrow band of depolymerization (Fig.1, B and D), which corresponded in kinematicmaps to the region of negative speed gradients.Animated kinetic maps (movies S5 and S6) re-vealed that bursts of depolymerization also oc-curred at the leading edge. Beyond these bands,kinetic maps displayed a random pattern of foci1 to 2 �m in diameter, where F-actin assembledand disassembled in cycles of �40 to 50 s. Werefer to the zone with fast retrograde flow andjuxtaposed narrow bands of polymerization anddepolymerization as the lamellipodium and thezone characterized by slower flow and a punc-tate pattern of filament turnover as the lamella.The lamellipodium and lamella had distinct mo-lecular signatures, with high concentrations ofArp2/3 and ADF/cofilin in the lamellipodiumand myosin II and tropomyosin present exclu-sively in the lamella (fig. S2).
Given the kinematic, kinetic, and moleculardifferences, we sought mathematical criteria thatwould allow us to determine the relationshipbetween the lamellipodium and lamella overtime. We tracked the cell border and calculated
the rates of network assembly, disassembly, andretrograde flow along regularly spaced profilesperpendicular to the edge (Fig. 1E). In 80 pro-files analyzed, the assembly rate peaked at �1�m from the leading edge, followed closely by apeak in depolymerization (Fig. 1F). Before thevariation in both rates diminished, a second peakof net assembly (Fig. 1F, arrowhead) indicatedthe location where lamellipodium kinetic behav-ior turned into lamella kinetic behavior. Thiskinetic boundary colocalized with the first localminimum of the retrograde flow speed (Fig. 1G).Together, these criteria permitted robust auto-matic extraction of the lamellipodium-to-lamellatransition (Fig. 1E, white line).
Integration of the net assembly rate (thedifference between areas A and D in Fig. 1F)revealed the amount of polymer generated anddisassembled within the boundary of the lamel-lipodium. Most (85 to 90%) of the actin net-work underwent a complete cycle of assemblyand disassembly within the first 1 to 3 �m fromthe cell edge. Thus, lamellipodium and lamellaare composed of materially nearly decouplednetworks, suggesting that the lamellipodiumdoes not supply substantial filaments to otheractin assemblies in the cell (10). The tightspatial juxtaposition of assembly and dis-assembly likely generates monomer gradientshigh enough to maintain an efficient treadmill
Department of Cell Biology, The Scripps ResearchInstitute (TSRI), La Jolla, CA 92037, USA.
*These authors contributed equally to this work.†To whom correspondence should be addressed.E-mail: [email protected] (C.M.W.-S.) [email protected] (G.D.)
B F-actin turnover
210 3 4 5 6
210 3 4 5 6210 3 4 5 6
2100
1
-101
3 4 5 6
A F-actin flow
C D
E Net assembly of F-actin F
G
(s )-1
Depolymerization Polymerization Profile (1) Profile (2)
(µm/m
in)(s
-1 )
5 µm
5 µm
5 µm
Polymerization
Depolymerization
Lamella
Lamellipodium
500 nm
350
300
250
200
150
100
50
nm/min
0
300200100
0
400500
(µm)(µm)
(µm)
Retrograde flow rateRetrograde flow rate
Net assembly
Net assembly rate
Net assembly
Depolymerization rate
Polymerization rate
A
D
Fig. 1. F-actin dynamics characterized by qFSM in (A and B) a newt lung cell (movies S1, S3, andS5) and (C and D) a PtK1 cell (movies S2, S4, and S6). [(A) and (C)] Time-averaged F-actin flow (60frames); colors encode flow speed, and vectors, flow direction. Inset: Individual speckle trajectoriesover 200 s; time evolution, dark blue to light green. [(B) and (D)] Time-averaged F-actin turnover(60 frames). Red channel, assembly rate; green, disassembly rate. (E) Net F-actin assembly. Black,negative assembly rates; white, positive assembly rates. The lamellipodium-to-lamella transition(white line) (movie S8) was computed from rate profiles (along the red lines) of net assembly andflow. (F) Rate profiles indicate that the lamellipodium-to-lamella transition coincides with the firstlocal maximum of net assembly (arrowhead) after the first maximum in depolymerization (dashedgreen line). A, integrated assembly; D, integrated disassembly. (G) The kinetically defined transition(black asterisks) colocalizes with the first local minimum in flow rate (blue asterisks). Examples arecalculated from the yellow profiles (1) and (2) in (E).
R E P O R T S
www.sciencemag.org SCIENCE VOL 305 17 SEPTEMBER 2004 1783
on
Mar
ch 1
, 200
7 w
ww
.sci
ence
mag
.org
Dow
nloa
ded
from

of actin turnover based on diffusive transport(11–13).
Next, we partitioned speckles into two class-es (Fig. 2A): fast-moving and short-living (class1) and slow-moving and long-living (class 2).Class 1 speckles clustered in the lamellipodium,whereas 90% of the speckles in the lamellabelonged to class 2 (Fig. 2B). However, 33% ofthe speckles falling into the area between theleading edge and the lamellipodium-lamellatransition had the characteristics of lamellaspeckles (Fig. 2B, inset). We examined the en-semble behavior of these speckle classes andfound that class 1 speckles displayed the kineticsignature of the lamellipodium (Fig. 2C), where-as class 2 speckles displayed the signature of alamella network (Fig. 2D) that extended all theway to the leading edge. This coexistence of twospatially overlapping yet kinetically and kine-matically distinct networks was masked in jointevaluation of all speckles (Fig. 1, B and D),because class 1 speckles outnumbered class 2speckles near the cell boundary.
We probed the molecular characteristicsof the two networks in a series of pharmaco-logical perturbation experiments. First, weapplied blebbistatin to inhibit nonmuscle my-
osin II adenosine triphosphatase activity (14).In agreement with myosin II localization data(fig. S2), blebbistatin reduced lamella retro-grade flow but not lamellipodium flow (Fig.3A), with little effect on the rates of filamentturnover in either network.
We next treated cells with 0.5 �M cy-tochalasin D (cytD) (Fig. 3B) to inhibit po-lymerization of free barbed ends (15). Space-time diagrams of F-actin turnover, edge dis-placement, and network flow computed alongthe leading edge (Fig. 3C) (9) revealed that,before cytD perfusion, periodic bursts of po-lymerization at the leading edge transformedin equal parts into protrusion and F-actinretrograde flow (Fig. 3C, dashed white lines).Cross-correlation analysis of the three param-eters (Fig. 3D) confirmed a positive correla-tion between edge displacement and networkturnover and negative correlations for the twoother parameter combinations. This behaviorchanged after cytD perfusion. The correlationbetween turnover and both edge displacementand network flow broke down, and the cor-relation between edge displacement and net-work flow switched from negative to positivevalues (Fig. 3D). Thus, cytD selectively re-
moved the lamellipodium network by cap-ping the free barbed ends, and the synchro-nous retraction of the leading edge and net-work (movie S7) is associated with lamellacontraction (16). Despite cytD treatment, thelamella was in a state of predominant disas-sembly for only �6 min (disassembly:assem-bly ratio of 1.8 � 0.2). Subsequently, peri-odic patterns of assembly and disassemblywere re-established (disassembly:assem-bly ratio of 1.2 � 0.1 in cytD versus 1.4 �0.1 before perfusion), indicating that much ofthe kinetic activity in the lamella network isinsensitive to cytD. However, the mainte-nance of the lamella position and its advance-ment required barbed end assembly. Washoutof cytD immediately re-established the lead-ing edge position and lamellipodial kineticand kinematic signatures.
Similarly, inhibiting depolymerization bystabilizing filaments with 1 �M jasplakinolide(11) also affected the lamellipodium selectively.Within minutes of jasplakinolide application,both filament turnover and retrograde flow werestopped in the lamellipodium, whereas the la-mella appeared unaffected (Fig. 3E). The loss ofthe lamellipodium did not alter edge position,and the same region now showed the signaturesof the lamella, providing additional evidence fortwo distinct yet spatially overlapping networks.
Which of the two networks drives cell pro-trusion? We compared leading edge displace-ment, network turnover, and retrograde flow inmovies of cells that displayed very slow netadvancement to those with persistent rapid pro-trusion. For cells with slow edge advancement,without exception, we found periodic cycles ofedge protrusion and retraction (17). They corre-lated with cycles of polymerization and depoly-merization and of faster and slower retrogradeflow. F-actin flow in the lamella (measuredproximal to the lamellipodium-lamella transi-tion) exhibited a periodicity highly correlatedwith the lamellipodium flow (Fig. 4A), but theamplitude modulation was damped by 69% (fig.S4), confirming the rather weak material cou-pling between the two networks.
Next, we examined cells with rapid, persis-tent edge protrusion (Fig. 4B and movie S2).One possibility was that the balance betweenforward edge movement and lamellipodium ret-rograde flow could be tipped toward edge move-ment. However, when polymerization increased(movie S6), it was still accompanied by acceler-ation of retrograde flow (movie S4). Alternative-ly, propulsion of the leading edge by increasedpolymerization could be accompanied by a wid-ening of the lamellipodium. Instead, we foundthat the cell boundary and lamellipodium-to-lamella transition advanced in concert (Fig. 4C),creating the impression of a lamellipodium surf-ing on a forward-growing lamella (movies S8and S9). Thus, persistent protrusion depends onthe local expansion of the lamella network. La-mellipodium polymerization is not sufficient.
Fig. 2. Distinction of spatially overlapping lamellipodium and lamella by classification of specklevelocity and lifetime. (A) Separation of fast-moving and short-living speckles (class 1, red) andslow-moving and long-living speckles (class 2, black). LTth, lifetime threshold; Vth, velocity thresh-old. (B) Thresholds are set to minimize the number of class 1 speckles in the lamella whilemaximizing the number in the lamellipodium. This multi-objective optimization has a uniquesolution, because class 1 speckles cluster in the lamellipodium with a residual occurrence of �10%in the lamella. Class 2 speckles dominate the lamella but expand all the way to the leading edge,contributing 33% to the lamellipodium region. (C) Turnover calculated from class 1 speckles showsthe spatial kinetic signature of the lamellipodium. (D) Turnover calculated from class 2 specklesshows the spatial kinetic signature of the lamella.
R E P O R T S
17 SEPTEMBER 2004 VOL 305 SCIENCE www.sciencemag.org1784
on
Mar
ch 1
, 200
7 w
ww
.sci
ence
mag
.org
Dow
nloa
ded
from

To determine if the expansion of the lamellaspatially correlated with the establishment oflinkages between the cytoskeleton and the extra-cellular matrix, we filmed actin dynamics byFSM and localized focal adhesions using greenfluorescent protein (GFP)-tagged vinculin.Protrusive edge sections (Fig. 4D, arrow-heads) were consistently positioned just be-yond the distalmost portion of focal adhesionswhere the adhesions initiated at the lamellipo-dium-to-lamella transition.
Thus, qFSM of F-actin dynamics in migrat-ing cells reveals two kinetically, kinematically,and molecularly distinct F-actin networks at theleading edge of epithelial cells, which spatiallyoverlap and yet are only weakly coupled, andwhose transition may be defined by the initiationof substrate-cytoskeleton linkages (fig. S5). Pro-ductive advancement of the leading edge re-quires expansion of the lamella, where actomy-osin contractile forces are coupled to substrateadhesion and which depends on cytD-insensi-tive filament assembly, possibly mediated byformins (18, 19). In contrast, lamellipodiumprotrusion and retraction probably serve anexploratory function or could provide rapidresponses to extracellular cues. However, per-sistent advancement of the cell relies on theunderlying lamella.
References and Notes1. D. A. Lauffenburger, A. F. Horwitz, Cell 84, 359 (1996).2. J. A. Theriot, T. J. Mitchison, Nature 352, 126 (1991).3. R. D. Mullins, J. A. Heuser, T. D. Pollard, Proc. Natl.
Acad. Sci. U.S.A. 95, 6181 (1998).4. M. Ghosh et al., Science 304, 743 (2004).5. T. D. Pollard, G. B. Borisy, Cell 112, 453 (2003).6. G. Danuser, C. M. Waterman-Storer, J. Microsc. 211,
191 (2003).7. P. Vallotton, A. Ponti, C. M. Waterman-Storer, E. D.
Salmon, G. Danuser, Biophys. J. 85, 1289 (2003).8. A. Ponti, P. Vallotton, W. C. Salmon, C. M. Waterman-
Storer, G. Danuser, Biophys. J. 84, 3336 (2003).9. Materials and methods are available as supporting
material on Science Online.10. J. V. Small, K. Rottner, I. Kaverina, Curr. Opin. Cell
Biol. 11, 54 (1999).11. L. P. Cramer, Curr. Biol. 9, 1095 (1999).12. R. S. Fischer, K. L. Fritz-Six, V. M. Fowler, J. Cell Biol.
161, 371 (2003).13. V. C. Abraham, V. Krishnamurthi, D. L. Taylor, F. Lanni,
Biophys. J. 77, 1721 (1999).14. A. F. Straight et al., Science 299, 1743 (2003).15. P. Sampath, T. D. Pollard, Biochemistry 30, 1973
(1991).16. P. Forscher, S. J. Smith, J. Cell Biol. 107, 1505 (1988).17. G. Giannone et al., Cell 116, 431 (2004).18. S. H. Zigmond et al., Curr. Biol. 13, 1820 (2003).19. C. Higashida et al., Science 303, 2007 (2004).20. Supported by research grant no. RGY5-2002 from the
Human Frontiers Science Programme and no.GM67230 from the National Institutes of Health.This is TSRI manuscript no. 16575-CB.
Supporting Online Materialwww.sciencemag.org/cgi/content/full/305/5691/1782/DC1Materials and MethodsFigs. S1 to S5Movies S1 to S9
20 May 2004; accepted 6 August 2004
Fig. 3. Probing molecular characteristics of the two networks by small molecule inhibitors. (A)Perfusion with 100 �M blebbistatin slows lamella F-actin flow exclusively (left two panels),with little effect on F-actin turnover (right two panels). P, polymerization; D, depolymerization.(B) Perfusion with 0.5 �M cytD decreases F-actin flow in the lamellipodium and inducesretraction of the leading edge (white lines) (fig. S3). Washout rescues cell edge position andlamellipodium flow rate. (C) Space-time diagrams of F-actin network turnover, edge displace-ment, and F-actin flow along the leading edge (fig. S3) (9) during perfusion and washout ofcytD. White dashed lines highlight periodicities. (D) Correlation between edge displacement (E)and F-actin flow (F); between edge displacement and F-actin turnover (T); and between flowand turnover. (E) Perfusion with 1 �M jasplakinolide selectively removes the kinetic andkinematic signature of the lamellipodium. The white line indicates the lamellipodium-to-lamella transition before drug application.
R E P O R T S
www.sciencemag.org SCIENCE VOL 305 17 SEPTEMBER 2004 1785
on
Mar
ch 1
, 200
7 w
ww
.sci
ence
mag
.org
Dow
nloa
ded
from

Zooming In on a QuantitativeTrait for Tomato Yield UsingInterspecific Introgressions
Eyal Fridman,1*† Fernando Carrari,2† Yong-Sheng Liu,1‡Alisdair R. Fernie,2 Dani Zamir1§
To explore natural biodiversity we developed and examined introgression lines (ILs)containing chromosome segments of wild species (Solanum pennellii) in the back-ground of the cultivated tomato (S. lycopersicum). We identified Brix9-2-5, whichis a S. pennellii quantitative trait locus (QTL) that increases sugar yield of tomatoesand was mapped within a flower- and fruit-specific invertase (LIN5). QTL analysisrepresenting five different tomato species delimited the functional polymorphismof Brix9-2-5 to an amino acid near the catalytic site of the invertase crystal,affecting enzyme kinetics and fruit sink strength. These results underline the powerof diverse ILs for high-resolution perspectives on complex phenotypes.
The genetic basis of many natural phenotypestakes the form of a continuous range rather thandiscrete classes. The complexity of traits show-ing continuous distribution often results fromthe segregation of numerous QTL, whose ex-pression is modified both by the environment
and by genetic background (1). Genetic resolu-tion of quantitative traits in populations thatsegregate simultaneously for different QTLscattered throughout the genome [e.g., secondfilial generation (F2), backcross, and recombi-nant inbreds] is low compared with QTL anal-
ysis in lines that segregate for a single region(i.e., ILs in plants and congenic strains in ani-mals) (2). Multiple segregating QTL at thewhole-genome level tend to mask the effects ofone another by introducing high variances instatistical analyses. In sharp contrast, ILs areidentical for the entire genome except for asingle introgressed region, and therefore allthe phenotypic variation in these lines isassociated with the introduced segment.The use of such targeted population struc-tures increased the identification power for
1The Robert H. Smith Institute of Plant Sciences andGenetics in Agriculture, Faculty of Agriculture, TheHebrew University of Jerusalem, Post Office Box 12,Rehovot 76100, Israel. 2Department Willmitzer, Max-Planck-Institut fur Molekulare Pflanzenphysiologie,Am Muhlenberg 1, 14476 Golm, Germany.
*Present address: Department of Molecular, Cellularand Developmental Biology, University of Michigan,Ann Arbor, MI 48109–1048, USA.†These authors contributed equally to this work.‡Present address: Laboratory of Plant Molecular Biol-ogy, The Rockefeller University, 1230 York Avenue,New York, NY 10021, USA.§To whom correspondence should be addressed.E-mail: [email protected]
Fig. 4. The contribution of lamellipodium and lamella to edge protrusion. (A)Space-time diagrams of F-actin turnover, edge displacement (displ.), andF-actin flow along the leading edge and lamella F-actin flow adjoining thelamellipodium-to-lamella transition (fig. S4). Cycles of assembly and disas-sembly at the leading edge (period, 0.01 Hz) are transformed in equal partsinto oscillatory edge movement and retrograde flow (white dashed lines).The same period is found in lamella flow (there is a high correlation
between flow at the leading edge and lamella flow, F versus LF), but theamplitudes are markedly decreased (cf. fig. S4). (B and C) Co-movement ofthe leading edge and the lamellipodium-to-lamella transition during persis-tent cell protrusion [the red arrow in (B) and arrows in (C)] (movie S9). (D)Overlay of GFP-vinculin (white), marking focal adhesions on the actinturnover map and showing protrusions of the leading edge (arrowheads) andthe position of the lamellipodium-lamella transition (white line).
R E P O R T S
17 SEPTEMBER 2004 VOL 305 SCIENCE www.sciencemag.org1786
on
Mar
ch 1
, 200
7 w
ww
.sci
ence
mag
.org
Dow
nloa
ded
from