two-dimensional particle-in-cell simulation of magnetic sails
TRANSCRIPT
Two-dimensional particle-in-cell simulation of the expansion of a plasma into a rarefied
medium
This article has been downloaded from IOPscience. Please scroll down to see the full text article.
2011 New J. Phys. 13 073023
(http://iopscience.iop.org/1367-2630/13/7/073023)
Download details:
IP Address: 160.6.202.47
The article was downloaded on 18/07/2011 at 09:33
Please note that terms and conditions apply.
View the table of contents for this issue, or go to the journal homepage for more
Home Search Collections Journals About Contact us My IOPscience
T h e o p e n – a c c e s s j o u r n a l f o r p h y s i c s
New Journal of Physics
Two-dimensional particle-in-cell simulation of theexpansion of a plasma into a rarefied medium
G Sarri1,5, G C Murphy2, M E Dieckmann3, A Bret4, K Quinn1,I Kourakis1, M Borghesi1, L O C Drury2 and A Ynnerman3
1 Centre for Plasma Physics, The Queens University of Belfast,Belfast BT7 1NN, UK2 Dublin Institute for Advanced Studies, 31 Fitzwilliam Place, Dublin 2, Ireland3 Department of Science and Technology (ITN), Linköping University,60174 Norrkoping, Sweden4 ETSI Industriales, Universidad de Castilla-La Mancha, 13071 Ciudad Real,SpainE-mail: [email protected]
New Journal of Physics 13 (2011) 073023 (22pp)Received 10 March 2011Published 14 July 2011Online at http://www.njp.org/doi:10.1088/1367-2630/13/7/073023
Abstract. The expansion of a dense plasma through a more rarefied ionizedmedium has been studied by means of two-dimensional particle-in-cellsimulations. The initial conditions involve a density jump by a factor of 100,located in the middle of an otherwise equally dense electron–proton plasmawith uniform proton and electron temperatures of 10 eV and 1 keV, respectively.Simulations show the creation of a purely electrostatic collisionless shocktogether with an ion-acoustic soliton tied to its downstream region. The shockfront is seen to evolve in filamentary structures consistently with the onset of theion–ion instability. Meanwhile, an un-magnetized drift instability is triggeredin the core part of the dense plasma. Such results explain recent experimentallaser–plasma experiments, carried out in similar conditions, and are of intrinsicrelevance to non-relativistic shock scenarios in the solar and astrophysicalsystems.
S Online supplementary data available from stacks.iop.org/NJP/13/073023/mmedia
5 Author to whom any correspondence should be addressed.
New Journal of Physics 13 (2011) 0730231367-2630/11/073023+22$33.00 © IOP Publishing Ltd and Deutsche Physikalische Gesellschaft
2
Contents
1. Introduction 22. The particle-in-cell (PIC) code and the initial conditions 43. Simulation results 64. Filamentation onset at the shock front 145. Discussion 176. Conclusions 21Acknowledgments 21References 21
1. Introduction
The impact of an energetic, high-intensity (1014 W cm−2 6 IL 6 1019 W cm−2) laser pulse on asolid target sets a scenario with a high degree of complexity in which the interplay of severalphysical phenomena leads to strongly nonlinear evolution of the system. In the initial stage of theinteraction, the raising edge of the laser pulse or, if present, its preceding ns-scale low-energypedestal first heats the ablated plasma via inverse bremsstrahlung thermalizing the electronsat energies of the order of keV. The high-intensity part of the laser is then forced to interactwith this plasma and the laser energy is mostly coupled with the electrons via collisionlessabsorption mechanisms such as resonance absorption [1] and vacuum heating [2]. Its ownthermal pressure forces this plasma to expand and this generally occurs within a much colder andmore rarefied plasma, which results from the photo-ionization of the low-density gas embeddingthe target. This expansion might evolve nonlinearly into shock-like structures [3], such asion-acoustic shocks, and possibly solitary waves such as ion-acoustic solitons [4] and phase-space holes of both ionic and electronic nature [5]. The recently established proton radiographytechnique [6] has made it possible to detect and characterize in detail such structures duringlaser–plasma laboratory experiments (see, e.g., [4, 7]). This new set of data is of particularimportance since it allows recreating in a laboratory experiment, and therefore in a controllableand reproducible manner, conditions of relevance to non-relativistic shock scenarios such assolar system shocks [8] and eventually even the faster supernova remnant shocks [9], just to citea few.
From the theoretical point of view, such plasma expansion was first widely explored,within fluid and kinetic frameworks, in the assumption of expansion into a vacuum [10–14].These results show that the plasma expansion will progressively erode the initially sharp iondensity gradient through the development of a rarefaction wave. The greater electron mobilityresults in a higher electron density in the interval holding the ion density gradient as well asin an electron sheath ahead of the ion front. This charge separation sets a net electrostatic fieldthat accelerates the ions. The electric field distribution, which reflects the electrons comingfrom within the expanding plasma, moves with the ion front. The electrons thus lose kineticenergy in the laboratory frame both by transferring it to the ions along the normal of the ions’front and by being reflected by the moving potential. A thermally anisotropic electron velocitydistribution develops in the absence of an ambient medium, which can give rise to the Weibelinstability [15–17] and thus to a magnetized plasma front [18]. However, recent experiments
New Journal of Physics 13 (2011) 073023 (http://www.njp.org/)

3
involving laser pulses that impact on solid targets [4] have demonstrated the rarefied plasma toplay an important role in the plasma dynamics. Electrostatic shocks [19], ion-acoustic solitonsand the development of a filamentary shock front [20] could be observed with the help of theproton radiography technique at a high spatial and temporal resolution, of the order of a fewmicrometers and a few picoseconds, respectively [6]. The shock and probably the solitons wouldnot form in the absence of an ambient medium. In principle, the filamentation of the shock frontmay be caused by the magnetic Weibel instability [18], but the filamentary structures in [4]were found to be tied to electrostatic fields. The apparent discrepancy between the experimentalfindings and the theoretical results, obtained within the approximation of expansion into avacuum, clearly demonstrates the importance of the ambient medium for the plasma dynamicsand, therefore, the necessity of its inclusion in analytical and numerical models.
The expansion of a dense into a diluted plasma has been modeled with particle-in-cell (PIC)simulations [21, 22] with the purpose of better understanding the plasma processes that developduring their mixing. Only electrons and protons, and no initial magnetic field, were introducedin the simulations. This was partially due to computational constraints and to simplify theinterpretation of the data. Generally speaking, the laser ablated plasma might in fact consist alsoof heavier ion species emerging directly from the solid foil ablation. However, such elementsare unlikely to be present at the expanding ion front since they should have an unrealisticallyhigh kinetic energy to reach the ion front during the shock formation time [4]. The expandingpositive front can then be approximated as mainly constituted by hydrogen resulting from theevaporation of impurities (e.g. water molecules) on the target surface.
A preliminary study [21] considered a one-dimensional (1D) plasma expansion that isdriven by a gradient in the plasma temperature and density. Two initially spatially separatedplasma clouds were introduced into the 1D simulation box. However, simulation results clearlyshowed that the electron temperature gradient across the cloud contact boundary is rapidlyeroded by an electrostatic double layer [23, 24], leaving the proton temperature gradient andthe plasma density gradient as the sole drivers of the ion acceleration. Moreover, a comparisonof the shock formation times in the simulation and experiment clearly demonstrated that theinitial proton temperature of 1 keV was too high to be realistic for the experiment.
The follow-up study [22] thus considered cool ions with a temperature of 10 eV andelectrons with a temperature of 1 keV, still in a 1D geometry. These temperatures were usedto initialize both clouds so that no temperature gradients were present in the initial conditionfor each species. The expansion was thus driven only by a density that varied by a factor of 100across the cloud contact boundary, which is somewhat less than the maximum density variationin the experiment [4]. Nevertheless, in this latter case the density transition will not be so sharplydefined but it will decrease smoothly at a rate that is comparable to, if not less than, the rateintroduced in the simulations. This simulation showed the rapid formation of a rarefaction waveand the acceleration of protons to about 60 times their initial thermal speed, followed by thegrowth of an electrostatic shock-like structure. This structure and the well-known collisionlesselectrostatic shocks [25] are alike in that the ambient plasma is reflected onto itself by a piston.A shock forms out of this collision. The piston is a reflecting wall in the simulation in [25] and isthe rarefaction wave in the expanding plasma. The shock and the rarefaction wave coexist in thesame spatial interval in [22]. They are separated only by a narrow velocity gap in phase space.The physics of this hybrid structure can thus be different from that of an electrostatic shock;however, due to the close phenomenological similarity of such a structure to a pure shock, wewill adopt, throughout the paper, a slight abuse of notation and refer to such a structure as
New Journal of Physics 13 (2011) 073023 (http://www.njp.org/)
4
a shock. The rapid formation time and propagation speed of such a shock in the simulationmatched that of its experimental counterpart and the electrostatic field amplitudes were also ingood agreement. The rarefaction wave was destabilized in the simulation by an electrostaticdrift instability [26, 27], which triggered the formation of plasma structures that resembled theion-acoustic waves observed in the experiment.
This good agreement between the experimental and simulation results motivated us tofurther study the thermal expansion of a plasma with the initial conditions used in [22], butwith the insertion of a transverse dimension. This is possible by the rapid formation of theshock observed in [4, 22]. Our main results are as follows. We demonstrate the creation of anion-acoustic soliton, trailing the main collisionless shock, which traps a population of protonscounter-streaming from the dilute plasma. Such a structure presents an electric field distributionthat closely resembles the one experimentally detected in [4]. Such a soliton was not triggeredin the 1D case, possibly due to a poorer plasma representation. We also show that a proton-beam-driven instability is triggered in a hot thermal electron population [28], resulting in anoblique structuring of the plasma protons on a Debye length scale just ahead of the shock. Thisinstability is fed by electric fields rather than by magnetic fields and is thus compatible with theexperimental observations in [4].
The absence of magnetic fields, which appears to be in contradiction to the results reportedin [18], can be explained by considering that the electrons of the ambient plasma, which were notconsidered in [18], are accelerated by the rarefaction wave and form a super-thermal populationbehind the expanding ion front. Super-thermal electron populations can stabilize the electrondistribution against the Weibel instability [29] and may explain why we could not observe ithere. Moreover, simulations show a very modest cooling of the electrons along the plasmapropagation direction, another factor against the onset of the Weibel instability.
It is worth mentioning here that no significant magnetic fields were detected in the 1Dcase [22] either. However, a 1D simulation allows only for a magnetic field growth perpendicularto the simulation axis. The Weibel instability requires a wavevector component orthogonal tothe expansion direction and could therefore have been artificially suppressed in a 1D geometry.A 2D setup, instead, allows for the growth of in-plane magnetic fields and more complex currentsystems that can also lead to more realistic out-of-plane magnetic fields. The lack of magneticfields in the present simulation results is therefore a more reliable indication of the suppressionof the Weibel instability in this plasma scenario.
The structure of this paper can be summarized as follows: the PIC method and the initialconditions will be discussed in section 2 and the simulation results will be presented in section 3.Section 4 will instead be entirely devoted to the filamentary structures at the shock front and adiscussion of the main reported results will be given in section 5. Finally, a conclusive summarywill be presented in section 6.
2. The particle-in-cell (PIC) code and the initial conditions
A PIC simulation code solves the Maxwell’s equations on a grid together with the relativisticLorentz force equation for an ensemble of computational particles. Each computational particle(CP) can have a charge and a mass that are different from those of a plasma particle, but theratios are the same. The ensemble properties of CPs are a good approximation to those of acollisionless plasma, provided that an adequate number of CPs are used and that the resolutionof the simulation grid is high enough. The currents and the charges of individual CPs are
New Journal of Physics 13 (2011) 073023 (http://www.njp.org/)

5
interpolated to the simulation grid, and a global current J(x) and charge ρ(x) are obtained froma summation over all CPs. These global distributions are used to update the electromagneticfields E(x) and B(x) with the help of Maxwell’s equations. The updated electromagnetic fieldsare then interpolated to the position x j of each CP with index j and its momentum p j is updatedwith the help of the relativistic Lorentz force equation. Its position is advanced with the productof the simulation time step 1t and the CP’s velocity v j . These steps are repeated n times, untilthe interval N1t of interest is covered. Maxwell’s equations and the Lorentz force equation forthe j th CP are
µ0ε0∂
∂tE = ∇ × B − µ0J, (1)
∂
∂tB = −∇ × E, (2)
∇ · E =ρ
ε0, ∇ · B = 0, (3)
d
dtp j = q j
[E(x j) + v j × B(x j)
]. (4)
The numerical scheme our code uses is described in detail in [30]. For a more general descriptionof the PIC method, see [31].
We take initial conditions for the plasma which are identical to those in [22], but shortenthe simulation box along the plasma expansion direction and introduce instead a second spatialdimension. The box length along the plasma expansion direction x is L x and the box length inthe y-direction is L y . We subdivide the box along x into two halves. The interval −L x/2 < x < 0contains the dense plasma cloud and the interval 0 < x < L x/2 the tenuous one. The electronand proton number densities of the tenuous cloud are each n0 = 1015 cm−3. The electron andproton number densities of the dense cloud are both 100n0. The electron (proton) temperatureof both clouds is 1 keV (10 eV).
The simulation domain covers the spatial interval L x × L y = 540λD × 60λD, where λD =
ve/ωpt is the Debye length of the dilute plasma. An electron thermal speed of ve ≈ 1.3 ×
107 m s−1 and the plasma frequency of the diluted plasma ωpt = (n0e2/meε0)1/2
= 1.8 × 10¹² s−1
are realistic for the ambient plasma in laser–plasma experiments. The dimension of the intervalL x/2 × L y , which is initially occupied by the dilute plasma, is then ≈ 2 mm × 0.44 mm. It iscomparable in size to that displayed in figure 1 of [4]. Our simulation time N1tωpt = 775(N = 2.9 × 10⁵) corresponds to approximately half a nanosecond, which is comparable to thetime at which the snapshot in figure 1 of [22] was taken. Our simulation should, in principle,capture the source process which is resulting in the structures visible in this picture.
The full simulation domain is resolved by a grid with 4000 × 440 cells and all boundaryconditions are periodic. The periodic boundary conditions imply that we have two rarefactionwaves: one at x ≈ 0 and a second practically identical one at the boundary between x ≈ L x/2and x ≈ −L x/2. We will focus our attention only on the central one. We use 360 CPs persimulation cell to represent the electrons of the dense cloud, and we use the same number forthe protons. The electrons and protons of the tenuous cloud are represented each by 160 particlesper cell. The CPs of the dense cloud thus have a higher numerical weight in that their chargeand mass are higher than those of the CPs of the tenuous cloud by a factor of ≈ 45.
It is worth noting here that, in the dense plasma region, the electron Debye length isresolved by 0.75 grid cell. Generally speaking, such an under-resolved electron population may
New Journal of Physics 13 (2011) 073023 (http://www.njp.org/)
6
0 200 400 600 8001
1.0001
1.0002
1.0003
1.0004
Time t
Eto
tal (
t) /
E0
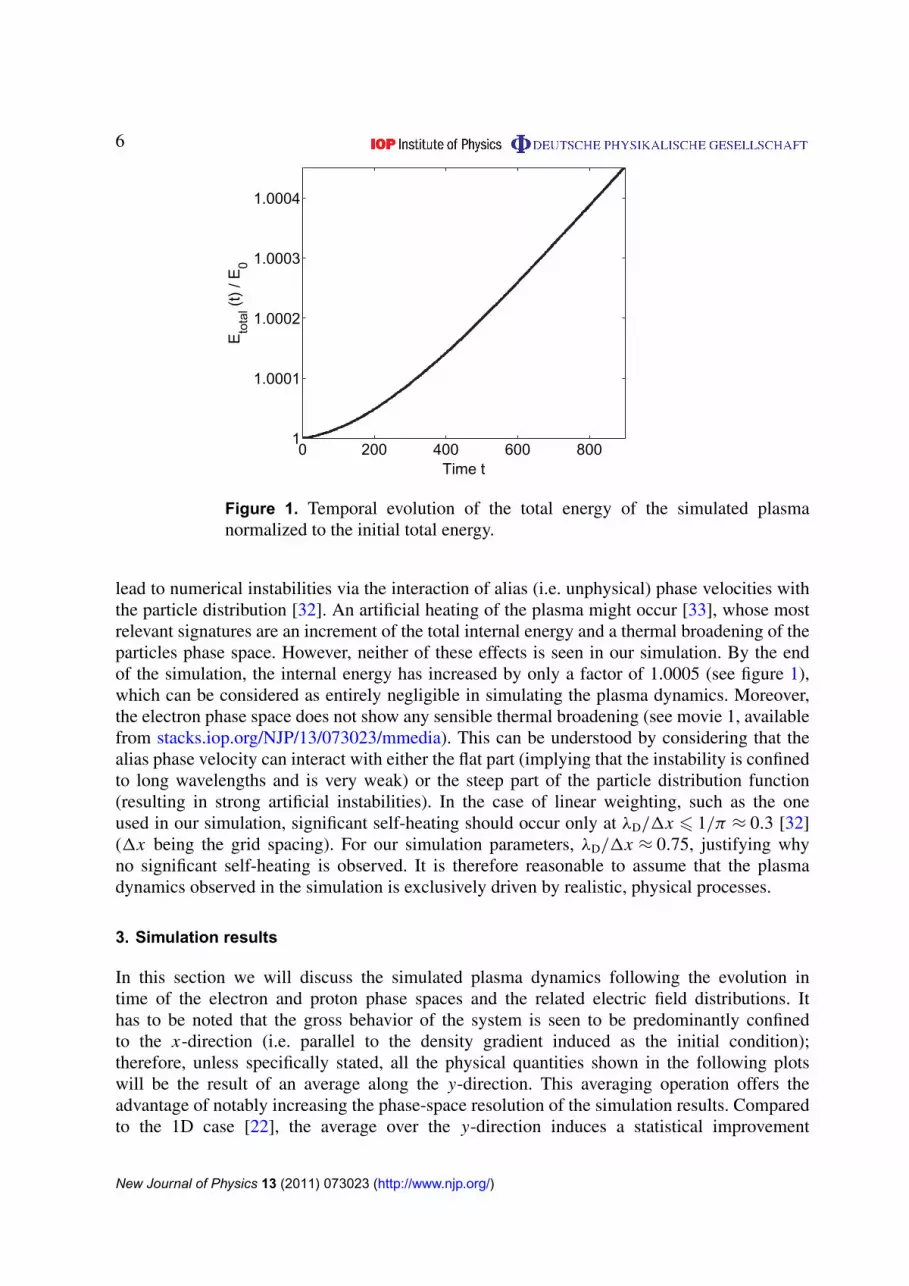
Figure 1. Temporal evolution of the total energy of the simulated plasmanormalized to the initial total energy.
lead to numerical instabilities via the interaction of alias (i.e. unphysical) phase velocities withthe particle distribution [32]. An artificial heating of the plasma might occur [33], whose mostrelevant signatures are an increment of the total internal energy and a thermal broadening of theparticles phase space. However, neither of these effects is seen in our simulation. By the endof the simulation, the internal energy has increased by only a factor of 1.0005 (see figure 1),which can be considered as entirely negligible in simulating the plasma dynamics. Moreover,the electron phase space does not show any sensible thermal broadening (see movie 1, availablefrom stacks.iop.org/NJP/13/073023/mmedia). This can be understood by considering that thealias phase velocity can interact with either the flat part (implying that the instability is confinedto long wavelengths and is very weak) or the steep part of the particle distribution function(resulting in strong artificial instabilities). In the case of linear weighting, such as the oneused in our simulation, significant self-heating should occur only at λD/1x 6 1/π ≈ 0.3 [32](1x being the grid spacing). For our simulation parameters, λD/1x ≈ 0.75, justifying whyno significant self-heating is observed. It is therefore reasonable to assume that the plasmadynamics observed in the simulation is exclusively driven by realistic, physical processes.
3. Simulation results
In this section we will discuss the simulated plasma dynamics following the evolution intime of the electron and proton phase spaces and the related electric field distributions. Ithas to be noted that the gross behavior of the system is seen to be predominantly confinedto the x-direction (i.e. parallel to the density gradient induced as the initial condition);therefore, unless specifically stated, all the physical quantities shown in the following plotswill be the result of an average along the y-direction. This averaging operation offers theadvantage of notably increasing the phase-space resolution of the simulation results. Comparedto the 1D case [22], the average over the y-direction induces a statistical improvement
New Journal of Physics 13 (2011) 073023 (http://www.njp.org/)
7
−2 −1 0 1 2 3 410
0
102
(c)
Den
sity
−2 −1 0 1 2 3 40
1
2
3x 10
8
Position
(d)
Ex
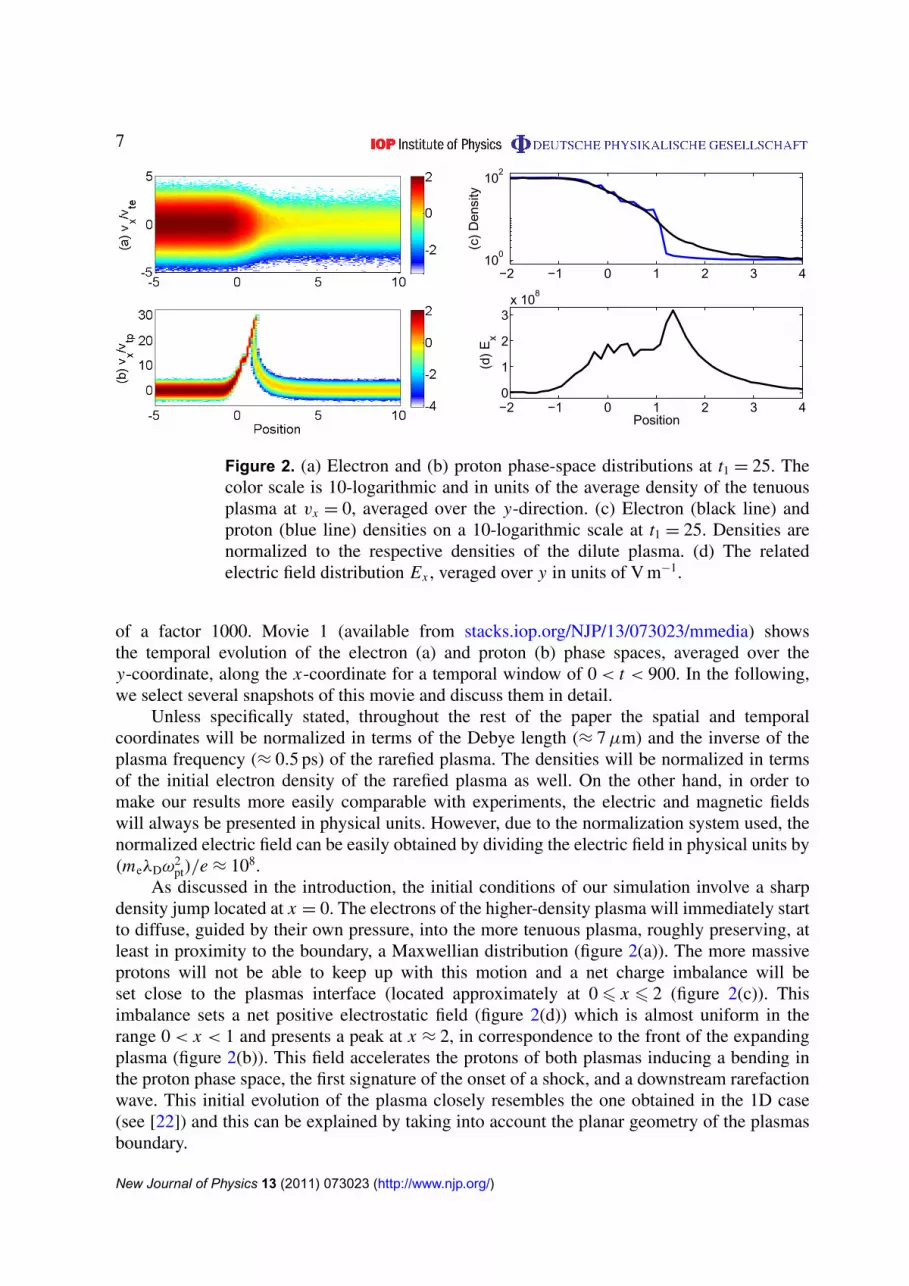
Figure 2. (a) Electron and (b) proton phase-space distributions at t1 = 25. Thecolor scale is 10-logarithmic and in units of the average density of the tenuousplasma at vx = 0, averaged over the y-direction. (c) Electron (black line) andproton (blue line) densities on a 10-logarithmic scale at t1 = 25. Densities arenormalized to the respective densities of the dilute plasma. (d) The relatedelectric field distribution Ex , veraged over y in units of V m−1.
of a factor 1000. Movie 1 (available from stacks.iop.org/NJP/13/073023/mmedia) showsthe temporal evolution of the electron (a) and proton (b) phase spaces, averaged over they-coordinate, along the x-coordinate for a temporal window of 0 < t < 900. In the following,we select several snapshots of this movie and discuss them in detail.
Unless specifically stated, throughout the rest of the paper the spatial and temporalcoordinates will be normalized in terms of the Debye length (≈ 7 µm) and the inverse of theplasma frequency (≈ 0.5 ps) of the rarefied plasma. The densities will be normalized in termsof the initial electron density of the rarefied plasma as well. On the other hand, in order tomake our results more easily comparable with experiments, the electric and magnetic fieldswill always be presented in physical units. However, due to the normalization system used, thenormalized electric field can be easily obtained by dividing the electric field in physical units by(meλDω2
pt)/e ≈ 108.As discussed in the introduction, the initial conditions of our simulation involve a sharp
density jump located at x = 0. The electrons of the higher-density plasma will immediately startto diffuse, guided by their own pressure, into the more tenuous plasma, roughly preserving, atleast in proximity to the boundary, a Maxwellian distribution (figure 2(a)). The more massiveprotons will not be able to keep up with this motion and a net charge imbalance will beset close to the plasmas interface (located approximately at 06 x 6 2 (figure 2(c)). Thisimbalance sets a net positive electrostatic field (figure 2(d)) which is almost uniform in therange 0 < x < 1 and presents a peak at x ≈ 2, in correspondence to the front of the expandingplasma (figure 2(b)). This field accelerates the protons of both plasmas inducing a bending inthe proton phase space, the first signature of the onset of a shock, and a downstream rarefactionwave. This initial evolution of the plasma closely resembles the one obtained in the 1D case(see [22]) and this can be explained by taking into account the planar geometry of the plasmasboundary.
New Journal of Physics 13 (2011) 073023 (http://www.njp.org/)
8
5 10 1510
0
101
(c)
Den
sity
−10 −5 0 5 10 15 20
0
2
4
6
8x 10
7
X−position
(d)
<E
x>y
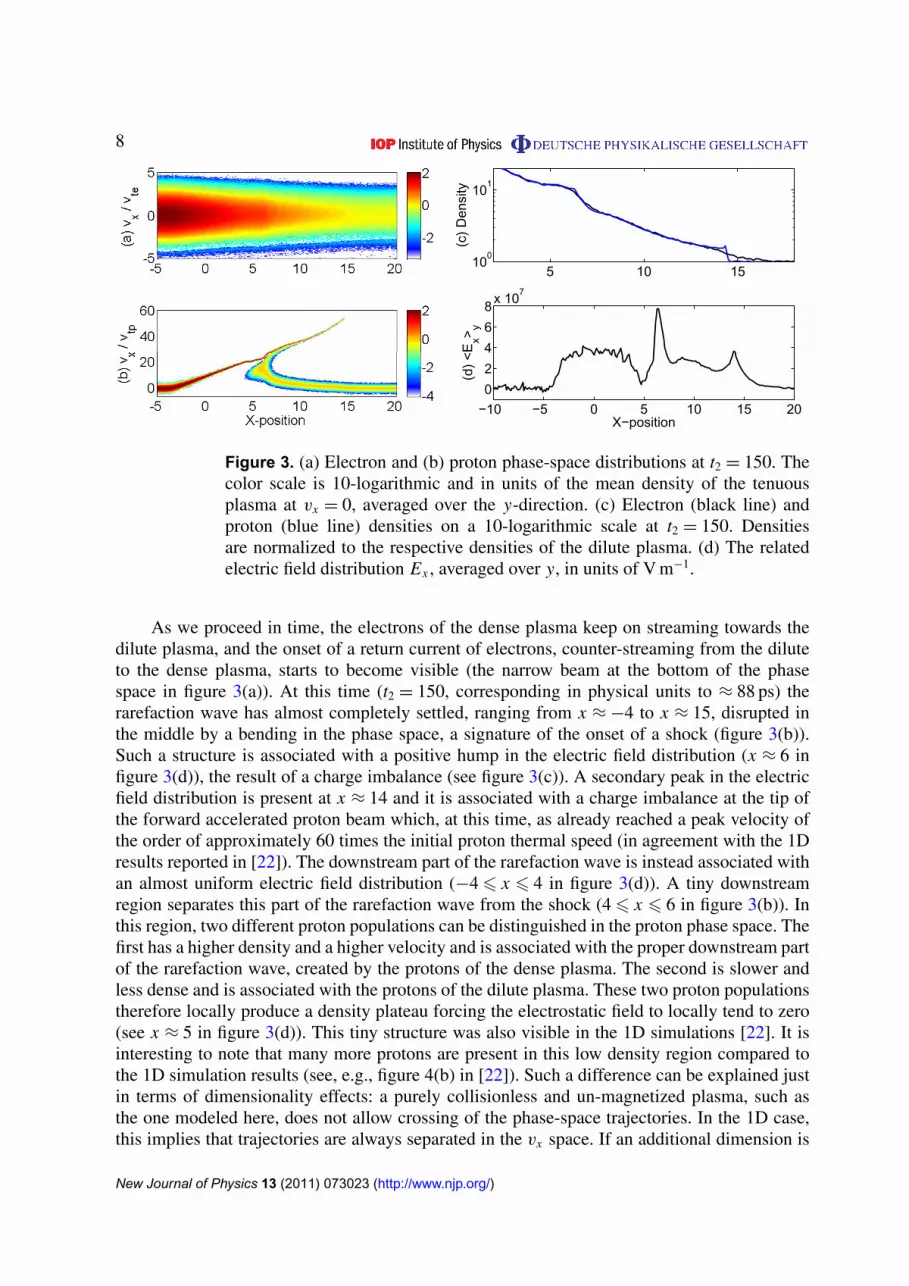
Figure 3. (a) Electron and (b) proton phase-space distributions at t2 = 150. Thecolor scale is 10-logarithmic and in units of the mean density of the tenuousplasma at vx = 0, averaged over the y-direction. (c) Electron (black line) andproton (blue line) densities on a 10-logarithmic scale at t2 = 150. Densitiesare normalized to the respective densities of the dilute plasma. (d) The relatedelectric field distribution Ex , averaged over y, in units of V m−1.
As we proceed in time, the electrons of the dense plasma keep on streaming towards thedilute plasma, and the onset of a return current of electrons, counter-streaming from the diluteto the dense plasma, starts to become visible (the narrow beam at the bottom of the phasespace in figure 3(a)). At this time (t2 = 150, corresponding in physical units to ≈ 88 ps) therarefaction wave has almost completely settled, ranging from x ≈ −4 to x ≈ 15, disrupted inthe middle by a bending in the phase space, a signature of the onset of a shock (figure 3(b)).Such a structure is associated with a positive hump in the electric field distribution (x ≈ 6 infigure 3(d)), the result of a charge imbalance (see figure 3(c)). A secondary peak in the electricfield distribution is present at x ≈ 14 and it is associated with a charge imbalance at the tip ofthe forward accelerated proton beam which, at this time, as already reached a peak velocity ofthe order of approximately 60 times the initial proton thermal speed (in agreement with the 1Dresults reported in [22]). The downstream part of the rarefaction wave is instead associated withan almost uniform electric field distribution (−46 x 6 4 in figure 3(d)). A tiny downstreamregion separates this part of the rarefaction wave from the shock (46 x 6 6 in figure 3(b)). Inthis region, two different proton populations can be distinguished in the proton phase space. Thefirst has a higher density and a higher velocity and is associated with the proper downstream partof the rarefaction wave, created by the protons of the dense plasma. The second is slower andless dense and is associated with the protons of the dilute plasma. These two proton populationstherefore locally produce a density plateau forcing the electrostatic field to locally tend to zero(see x ≈ 5 in figure 3(d)). This tiny structure was also visible in the 1D simulations [22]. It isinteresting to note that many more protons are present in this low density region compared tothe 1D simulation results (see, e.g., figure 4(b) in [22]). Such a difference can be explained justin terms of dimensionality effects: a purely collisionless and un-magnetized plasma, such asthe one modeled here, does not allow crossing of the phase-space trajectories. In the 1D case,this implies that trajectories are always separated in the vx space. If an additional dimension is
New Journal of Physics 13 (2011) 073023 (http://www.njp.org/)
9
−10 0 10 20 30 4010
0
102
(c)
Den
sity
−10 0 10 20 30 40
0
2
4
6x 10
7
X−position
(d)
<E
x> y
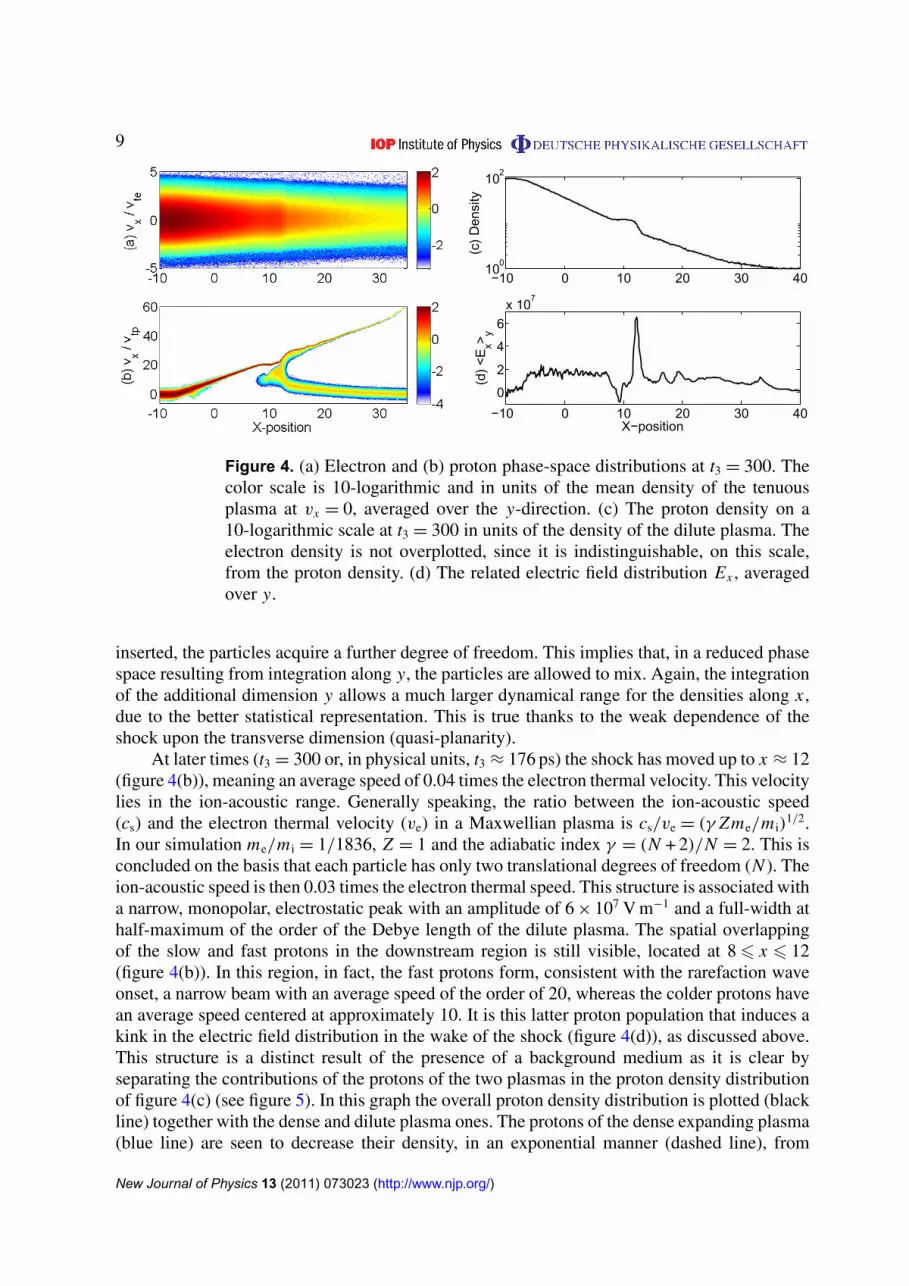
Figure 4. (a) Electron and (b) proton phase-space distributions at t3 = 300. Thecolor scale is 10-logarithmic and in units of the mean density of the tenuousplasma at vx = 0, averaged over the y-direction. (c) The proton density on a10-logarithmic scale at t3 = 300 in units of the density of the dilute plasma. Theelectron density is not overplotted, since it is indistinguishable, on this scale,from the proton density. (d) The related electric field distribution Ex , averagedover y.
inserted, the particles acquire a further degree of freedom. This implies that, in a reduced phasespace resulting from integration along y, the particles are allowed to mix. Again, the integrationof the additional dimension y allows a much larger dynamical range for the densities along x ,due to the better statistical representation. This is true thanks to the weak dependence of theshock upon the transverse dimension (quasi-planarity).
At later times (t3 = 300 or, in physical units, t3 ≈ 176 ps) the shock has moved up to x ≈ 12(figure 4(b)), meaning an average speed of 0.04 times the electron thermal velocity. This velocitylies in the ion-acoustic range. Generally speaking, the ratio between the ion-acoustic speed(cs) and the electron thermal velocity (ve) in a Maxwellian plasma is cs/ve = (γ Zme/m i)
1/2.In our simulation me/m i = 1/1836, Z = 1 and the adiabatic index γ = (N + 2)/N = 2. This isconcluded on the basis that each particle has only two translational degrees of freedom (N ). Theion-acoustic speed is then 0.03 times the electron thermal speed. This structure is associated witha narrow, monopolar, electrostatic peak with an amplitude of 6 × 10⁷ V m−1 and a full-width athalf-maximum of the order of the Debye length of the dilute plasma. The spatial overlappingof the slow and fast protons in the downstream region is still visible, located at 86 x 6 12(figure 4(b)). In this region, in fact, the fast protons form, consistent with the rarefaction waveonset, a narrow beam with an average speed of the order of 20, whereas the colder protons havean average speed centered at approximately 10. It is this latter proton population that induces akink in the electric field distribution in the wake of the shock (figure 4(d)), as discussed above.This structure is a distinct result of the presence of a background medium as it is clear byseparating the contributions of the protons of the two plasmas in the proton density distributionof figure 4(c) (see figure 5). In this graph the overall proton density distribution is plotted (blackline) together with the dense and dilute plasma ones. The protons of the dense expanding plasma(blue line) are seen to decrease their density, in an exponential manner (dashed line), from
New Journal of Physics 13 (2011) 073023 (http://www.njp.org/)
10
−10 0 10 20 30 4010
−1
100
101
102
X−position
Pro
ton
dens
ity
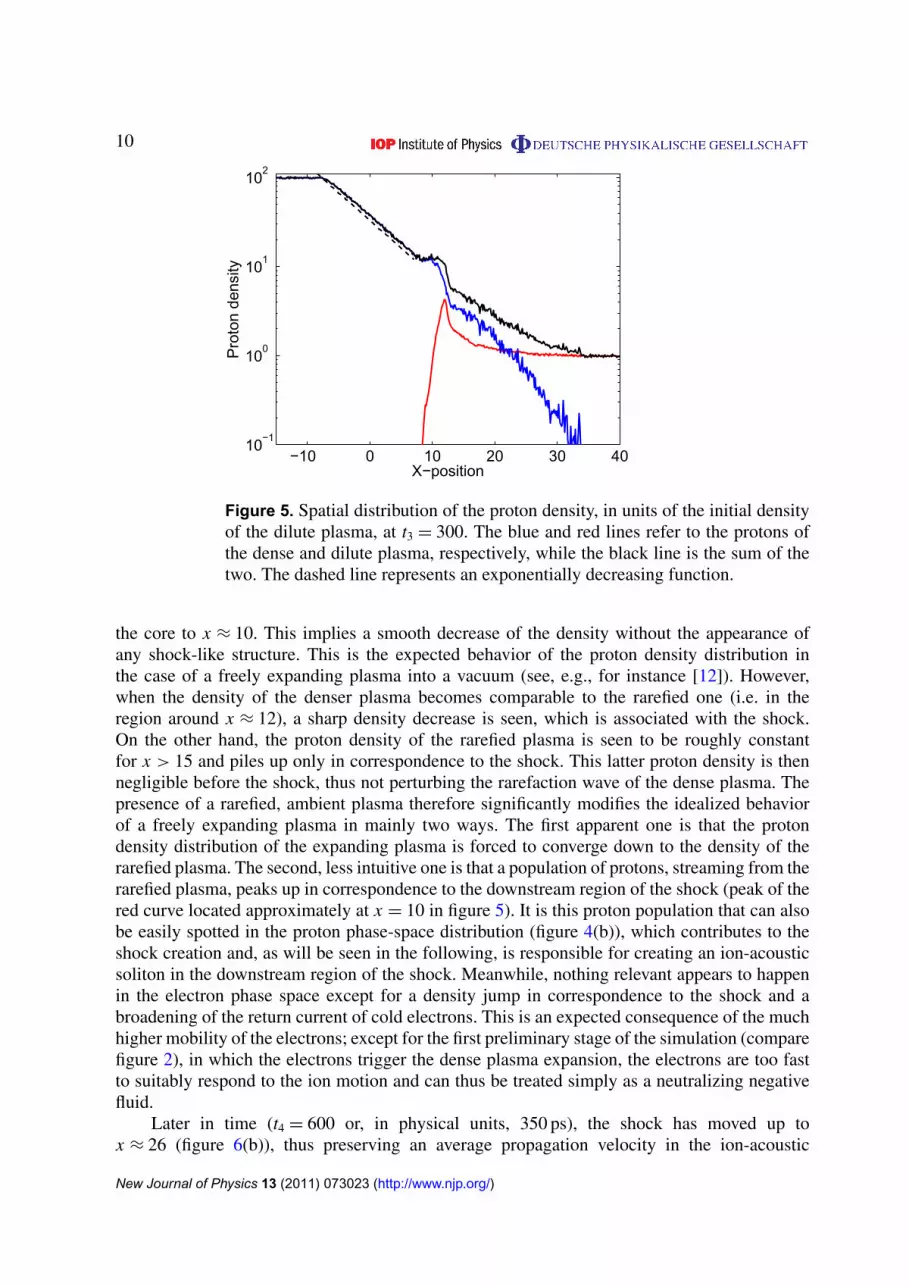
Figure 5. Spatial distribution of the proton density, in units of the initial densityof the dilute plasma, at t3 = 300. The blue and red lines refer to the protons ofthe dense and dilute plasma, respectively, while the black line is the sum of thetwo. The dashed line represents an exponentially decreasing function.
the core to x ≈ 10. This implies a smooth decrease of the density without the appearance ofany shock-like structure. This is the expected behavior of the proton density distribution inthe case of a freely expanding plasma into a vacuum (see, e.g., for instance [12]). However,when the density of the denser plasma becomes comparable to the rarefied one (i.e. in theregion around x ≈ 12), a sharp density decrease is seen, which is associated with the shock.On the other hand, the proton density of the rarefied plasma is seen to be roughly constantfor x > 15 and piles up only in correspondence to the shock. This latter proton density is thennegligible before the shock, thus not perturbing the rarefaction wave of the dense plasma. Thepresence of a rarefied, ambient plasma therefore significantly modifies the idealized behaviorof a freely expanding plasma in mainly two ways. The first apparent one is that the protondensity distribution of the expanding plasma is forced to converge down to the density of therarefied plasma. The second, less intuitive one is that a population of protons, streaming from therarefied plasma, peaks up in correspondence to the downstream region of the shock (peak of thered curve located approximately at x = 10 in figure 5). It is this proton population that can alsobe easily spotted in the proton phase-space distribution (figure 4(b)), which contributes to theshock creation and, as will be seen in the following, is responsible for creating an ion-acousticsoliton in the downstream region of the shock. Meanwhile, nothing relevant appears to happenin the electron phase space except for a density jump in correspondence to the shock and abroadening of the return current of cold electrons. This is an expected consequence of the muchhigher mobility of the electrons; except for the first preliminary stage of the simulation (comparefigure 2), in which the electrons trigger the dense plasma expansion, the electrons are too fastto suitably respond to the ion motion and can thus be treated simply as a neutralizing negativefluid.
Later in time (t4 = 600 or, in physical units, 350 ps), the shock has moved up tox ≈ 26 (figure 6(b)), thus preserving an average propagation velocity in the ion-acoustic
New Journal of Physics 13 (2011) 073023 (http://www.njp.org/)

11
−20 −10 0 10 20 30−2
0
2
4
x 107
(c)
<E
x>y
−20 −10 0 10 20 30
4
4.5
5x 10
7
X−position
(d)
sqrt
(<E
y2 >y)
Figure 6. (a) Electron and (b) proton phase-space distributions at t4 = 600. Thecolor scale is 10-logarithmic and in units of the mean density of the tenuousplasma at vx = 0, averaged over the y-direction. (c) Electric field distributionEx , averaged over y. (d) Square root of the averaged energy density of they-component of the electric field, in units of V m−1.
range. The associated electrostatic peak has decreased its amplitude down to ≈ 4 × 10⁷ V m−1
and broadened its width in order to keep approximately constant the associated potential(figure 6(c)). The low-energy proton population at the downstream part of the shock hasfurther developed into a soliton-like structure with an associated bipolar electric field (x ≈ 20in figure 6(c)). This structure, which is clearly related to the mixing in space but not in velocityof the two plasmas, could not be detected in the 1D case where only a few slow protons werepresent at the downstream part of the shock [22]. It is interesting to note that the y-component ofthe electric field distribution (figure 6(d)) does not show any significant peak in correspondenceto both the shock (x ≈ 26) and the soliton (x ≈ 20), suggesting the 1D structure of their electricfield distributions. A broad peak in the electric field is in fact present only in the ‘foreshock’region (i.e. that spatial interval, just in front of the shock, in which the ambient plasma isperturbed by the presence of the shock, approximately at x = 28); such an electric field isrelated, as will be extensively discussed in the following section, to the onset of an instability,which is transverse to the shock front, driven by the two counter-propagating proton beams. Theabsence of such Ey components, in correspondence to the shock and the soliton, is also a goodindication that the plasma flow direction (i.e. the direction along which the strongest currents areexpected to be) is mostly parallel to Ex and therefore those structures are purely electrostatic.
Moreover, in the very high density part of the rarefaction wave, an electrostatic ionicinstability is set (see the region −106 x 6−7 in figures 6(b) and (c)). Such instability inducesa strong modulation in the proton phase space associated with a bipolar electrostatic fieldwith a maximum amplitude of the order of 4 × 10⁷ V m−1. The long wavelength at whichthis instability is seen to occur is a good indication of it being related to the so-called driftinstability [26, 27]. The relatively small drift velocity (vdrift � 0.9vte) permits us in fact to ruleout the onset of the Buneman instability [34]. The drift instability occurs whenever a gradientin a particular plasma parameter (say temperature, density or magnetic fields) is set on a scale
New Journal of Physics 13 (2011) 073023 (http://www.njp.org/)
12
−20 −10 0 10 20 30 40 50 60−2
0
2
x 107
(c)
<E
x>y
−20 −10 0 10 20 30 40 50 604
4.5
5
x 107
X−position(d
) sq
rt(<
Ey2 >
y)
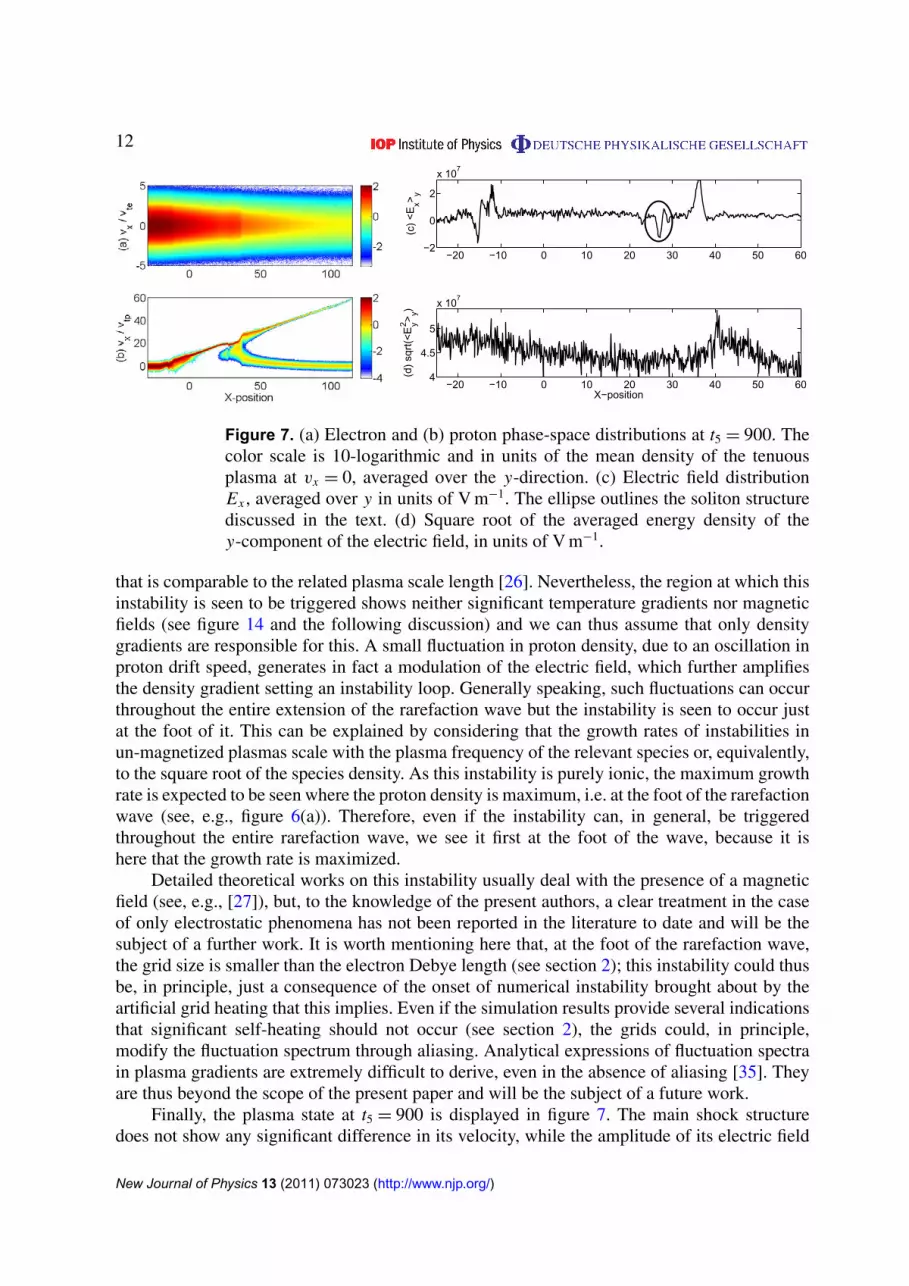
Figure 7. (a) Electron and (b) proton phase-space distributions at t5 = 900. Thecolor scale is 10-logarithmic and in units of the mean density of the tenuousplasma at vx = 0, averaged over the y-direction. (c) Electric field distributionEx , averaged over y in units of V m−1. The ellipse outlines the soliton structurediscussed in the text. (d) Square root of the averaged energy density of they-component of the electric field, in units of V m−1.
that is comparable to the related plasma scale length [26]. Nevertheless, the region at which thisinstability is seen to be triggered shows neither significant temperature gradients nor magneticfields (see figure 14 and the following discussion) and we can thus assume that only densitygradients are responsible for this. A small fluctuation in proton density, due to an oscillation inproton drift speed, generates in fact a modulation of the electric field, which further amplifiesthe density gradient setting an instability loop. Generally speaking, such fluctuations can occurthroughout the entire extension of the rarefaction wave but the instability is seen to occur justat the foot of it. This can be explained by considering that the growth rates of instabilities inun-magnetized plasmas scale with the plasma frequency of the relevant species or, equivalently,to the square root of the species density. As this instability is purely ionic, the maximum growthrate is expected to be seen where the proton density is maximum, i.e. at the foot of the rarefactionwave (see, e.g., figure 6(a)). Therefore, even if the instability can, in general, be triggeredthroughout the entire rarefaction wave, we see it first at the foot of the wave, because it ishere that the growth rate is maximized.
Detailed theoretical works on this instability usually deal with the presence of a magneticfield (see, e.g., [27]), but, to the knowledge of the present authors, a clear treatment in the caseof only electrostatic phenomena has not been reported in the literature to date and will be thesubject of a further work. It is worth mentioning here that, at the foot of the rarefaction wave,the grid size is smaller than the electron Debye length (see section 2); this instability could thusbe, in principle, just a consequence of the onset of numerical instability brought about by theartificial grid heating that this implies. Even if the simulation results provide several indicationsthat significant self-heating should not occur (see section 2), the grids could, in principle,modify the fluctuation spectrum through aliasing. Analytical expressions of fluctuation spectrain plasma gradients are extremely difficult to derive, even in the absence of aliasing [35]. Theyare thus beyond the scope of the present paper and will be the subject of a future work.
Finally, the plasma state at t5 = 900 is displayed in figure 7. The main shock structuredoes not show any significant difference in its velocity, while the amplitude of its electric field
New Journal of Physics 13 (2011) 073023 (http://www.njp.org/)
13
(a) (b)
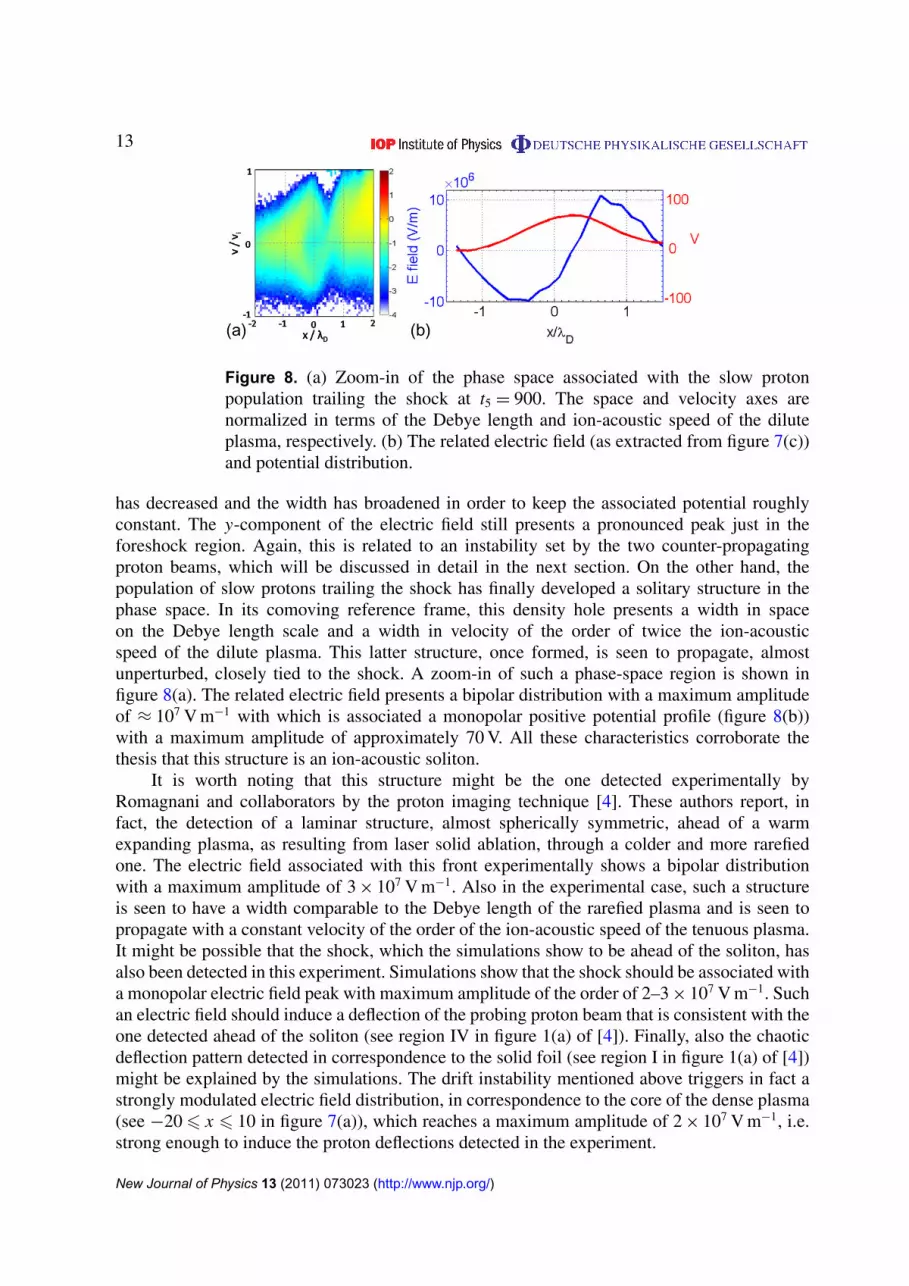
Figure 8. (a) Zoom-in of the phase space associated with the slow protonpopulation trailing the shock at t5 = 900. The space and velocity axes arenormalized in terms of the Debye length and ion-acoustic speed of the diluteplasma, respectively. (b) The related electric field (as extracted from figure 7(c))and potential distribution.
has decreased and the width has broadened in order to keep the associated potential roughlyconstant. The y-component of the electric field still presents a pronounced peak just in theforeshock region. Again, this is related to an instability set by the two counter-propagatingproton beams, which will be discussed in detail in the next section. On the other hand, thepopulation of slow protons trailing the shock has finally developed a solitary structure in thephase space. In its comoving reference frame, this density hole presents a width in spaceon the Debye length scale and a width in velocity of the order of twice the ion-acousticspeed of the dilute plasma. This latter structure, once formed, is seen to propagate, almostunperturbed, closely tied to the shock. A zoom-in of such a phase-space region is shown infigure 8(a). The related electric field presents a bipolar distribution with a maximum amplitudeof ≈ 107 V m−1 with which is associated a monopolar positive potential profile (figure 8(b))with a maximum amplitude of approximately 70 V. All these characteristics corroborate thethesis that this structure is an ion-acoustic soliton.
It is worth noting that this structure might be the one detected experimentally byRomagnani and collaborators by the proton imaging technique [4]. These authors report, infact, the detection of a laminar structure, almost spherically symmetric, ahead of a warmexpanding plasma, as resulting from laser solid ablation, through a colder and more rarefiedone. The electric field associated with this front experimentally shows a bipolar distributionwith a maximum amplitude of 3 × 10⁷ V m−1. Also in the experimental case, such a structureis seen to have a width comparable to the Debye length of the rarefied plasma and is seen topropagate with a constant velocity of the order of the ion-acoustic speed of the tenuous plasma.It might be possible that the shock, which the simulations show to be ahead of the soliton, hasalso been detected in this experiment. Simulations show that the shock should be associated witha monopolar electric field peak with maximum amplitude of the order of 2–3 × 10⁷ V m−1. Suchan electric field should induce a deflection of the probing proton beam that is consistent with theone detected ahead of the soliton (see region IV in figure 1(a) of [4]). Finally, also the chaoticdeflection pattern detected in correspondence to the solid foil (see region I in figure 1(a) of [4])might be explained by the simulations. The drift instability mentioned above triggers in fact astrongly modulated electric field distribution, in correspondence to the core of the dense plasma(see −206 x 6 10 in figure 7(a)), which reaches a maximum amplitude of 2 × 10⁷ V m−1, i.e.strong enough to induce the proton deflections detected in the experiment.
New Journal of Physics 13 (2011) 073023 (http://www.njp.org/)
14
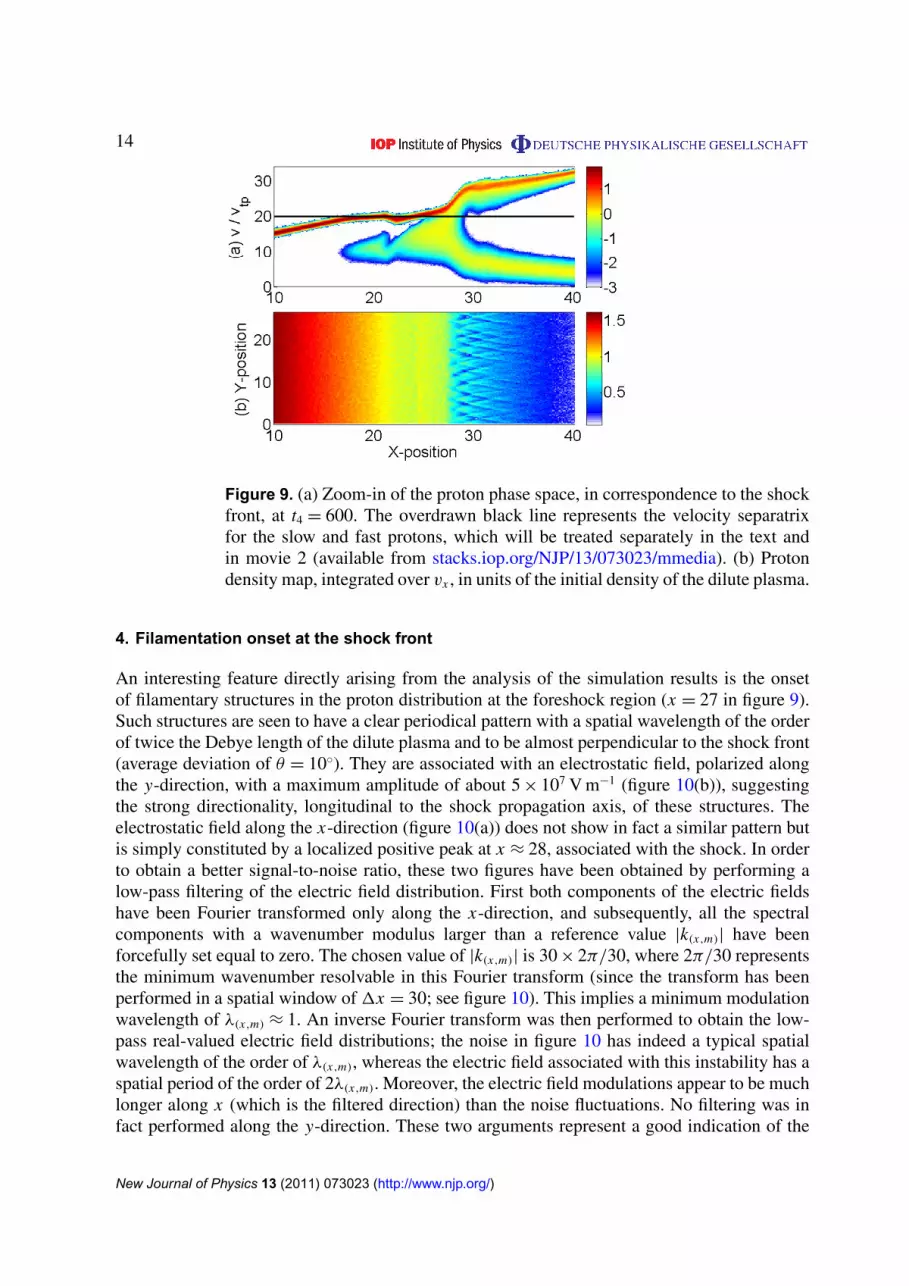
Figure 9. (a) Zoom-in of the proton phase space, in correspondence to the shockfront, at t4 = 600. The overdrawn black line represents the velocity separatrixfor the slow and fast protons, which will be treated separately in the text andin movie 2 (available from stacks.iop.org/NJP/13/073023/mmedia). (b) Protondensity map, integrated over vx , in units of the initial density of the dilute plasma.
4. Filamentation onset at the shock front
An interesting feature directly arising from the analysis of the simulation results is the onsetof filamentary structures in the proton distribution at the foreshock region (x = 27 in figure 9).Such structures are seen to have a clear periodical pattern with a spatial wavelength of the orderof twice the Debye length of the dilute plasma and to be almost perpendicular to the shock front(average deviation of θ = 10◦). They are associated with an electrostatic field, polarized alongthe y-direction, with a maximum amplitude of about 5 × 10⁷ V m−1 (figure 10(b)), suggestingthe strong directionality, longitudinal to the shock propagation axis, of these structures. Theelectrostatic field along the x-direction (figure 10(a)) does not show in fact a similar pattern butis simply constituted by a localized positive peak at x ≈ 28, associated with the shock. In orderto obtain a better signal-to-noise ratio, these two figures have been obtained by performing alow-pass filtering of the electric field distribution. First both components of the electric fieldshave been Fourier transformed only along the x-direction, and subsequently, all the spectralcomponents with a wavenumber modulus larger than a reference value |k(x,m)| have beenforcefully set equal to zero. The chosen value of |k(x,m)| is 30 × 2π/30, where 2π/30 representsthe minimum wavenumber resolvable in this Fourier transform (since the transform has beenperformed in a spatial window of 1x = 30; see figure 10). This implies a minimum modulationwavelength of λ(x,m) ≈ 1. An inverse Fourier transform was then performed to obtain the low-pass real-valued electric field distributions; the noise in figure 10 has indeed a typical spatialwavelength of the order of λ(x,m), whereas the electric field associated with this instability has aspatial period of the order of 2λ(x,m). Moreover, the electric field modulations appear to be muchlonger along x (which is the filtered direction) than the noise fluctuations. No filtering was infact performed along the y-direction. These two arguments represent a good indication of the
New Journal of Physics 13 (2011) 073023 (http://www.njp.org/)

15
10 20 30 400
10
20
(a)
Y−
posi
tion
10 20 30 400
10
20
X−position
(b)
Y−
posi
tion
−50
0
50
−50
0
50
Figure 10. The low-pass filtered electric field distributions at time t = 700around the main shock region. The Ex and Ey fields are displayed in (a) and(b), respectively. The color scale is in units of megavolts.
physical nature of the striations observed. Indeed, similar electric field structures were also seenin the unfiltered ion distribution.
An interesting feature of these striations is that slow and fast protons (i.e. protons thatare slower or faster than the reference velocity represented by the black line in figure 9(a))appear to be clearly separated spatially (see figure 11) and to propagate in time maintaining,independently, a roughly constant distribution (for the temporal evolution see movie 2, availablefrom stacks.iop.org/NJP/13/073023/mmedia).
Such a filamentation of the proton beam that, for obvious dimensionality arguments, wasnot visible in the 1D simulations [22], might have been induced by the onset of ion–ioninstability [36, 37].
Such an instability can be seen as the ionic counterpart of the well-known electron two-stream instability as first discussed by Pierce [38] and can occur when a proton beam isstreaming through an un-magnetized, collisionless plasma (refer to figure 14 and the discussionto see that no coherent magnetic fields are generated during the entire simulation time). Thecounter-streaming proton beam is provided by the existence of the shock-reflected ions. Theelectric field distribution generated is expected to be polarized in the y-direction (see figure 10),whereas the density striations are oriented along the plasma expansion axis (see figures 9and 11). The typical phase velocities of the waves generated are much smaller than those of theelectrons, which can therefore be seen simply as a neutralizing negative fluid (see figure 6(a),where no relevant modulations of the electron population can be seen in correspondence tothe filaments). The dispersion relation of such instability was first derived in [36] and can beexpressed as [39]
k2i + 2k2
D[1 + s Z(s)] = 0, (5)
s = (ωi/ki − Vi)/vthi, (6)
where ki is the instability wavevector, kD is the Debye wavevector of the ambient protons,Vi = 2cs is the drift velocity of the shock-reflected ions and vthi is the thermal speed of the
New Journal of Physics 13 (2011) 073023 (http://www.njp.org/)
16
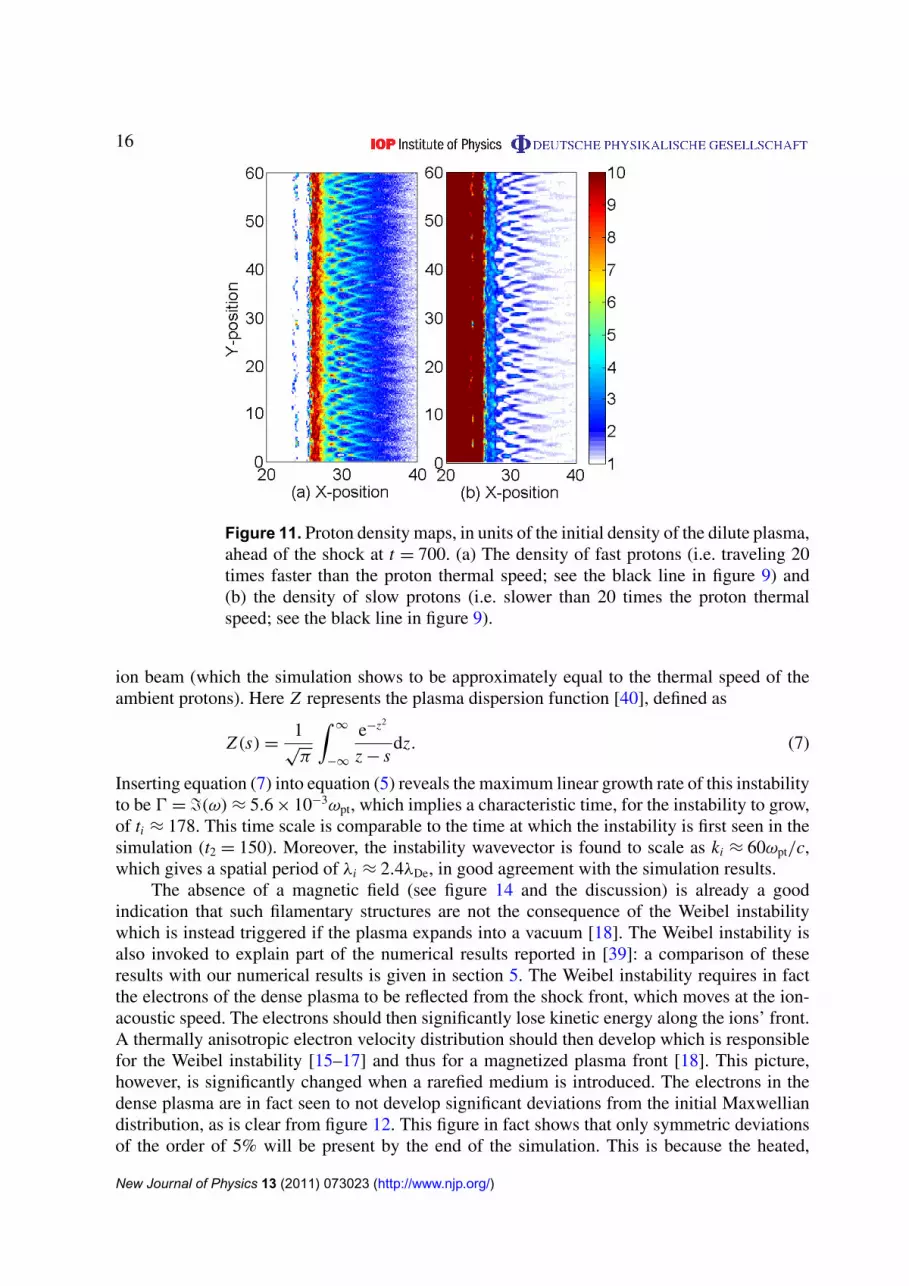
Figure 11. Proton density maps, in units of the initial density of the dilute plasma,ahead of the shock at t = 700. (a) The density of fast protons (i.e. traveling 20times faster than the proton thermal speed; see the black line in figure 9) and(b) the density of slow protons (i.e. slower than 20 times the proton thermalspeed; see the black line in figure 9).
ion beam (which the simulation shows to be approximately equal to the thermal speed of theambient protons). Here Z represents the plasma dispersion function [40], defined as
Z(s) =1
√π
∫∞
−∞
e−z2
z − sdz. (7)
Inserting equation (7) into equation (5) reveals the maximum linear growth rate of this instabilityto be 0 = =(ω) ≈ 5.6 × 10⁻³ωpt, which implies a characteristic time, for the instability to grow,of ti ≈ 178. This time scale is comparable to the time at which the instability is first seen in thesimulation (t2 = 150). Moreover, the instability wavevector is found to scale as ki ≈ 60ωpt/c,which gives a spatial period of λi ≈ 2.4λDe, in good agreement with the simulation results.
The absence of a magnetic field (see figure 14 and the discussion) is already a goodindication that such filamentary structures are not the consequence of the Weibel instabilitywhich is instead triggered if the plasma expands into a vacuum [18]. The Weibel instability isalso invoked to explain part of the numerical results reported in [39]: a comparison of theseresults with our numerical results is given in section 5. The Weibel instability requires in factthe electrons of the dense plasma to be reflected from the shock front, which moves at the ion-acoustic speed. The electrons should then significantly lose kinetic energy along the ions’ front.A thermally anisotropic electron velocity distribution should then develop which is responsiblefor the Weibel instability [15–17] and thus for a magnetized plasma front [18]. This picture,however, is significantly changed when a rarefied medium is introduced. The electrons in thedense plasma are in fact seen to not develop significant deviations from the initial Maxwelliandistribution, as is clear from figure 12. This figure in fact shows that only symmetric deviationsof the order of 5% will be present by the end of the simulation. This is because the heated,
New Journal of Physics 13 (2011) 073023 (http://www.njp.org/)
17
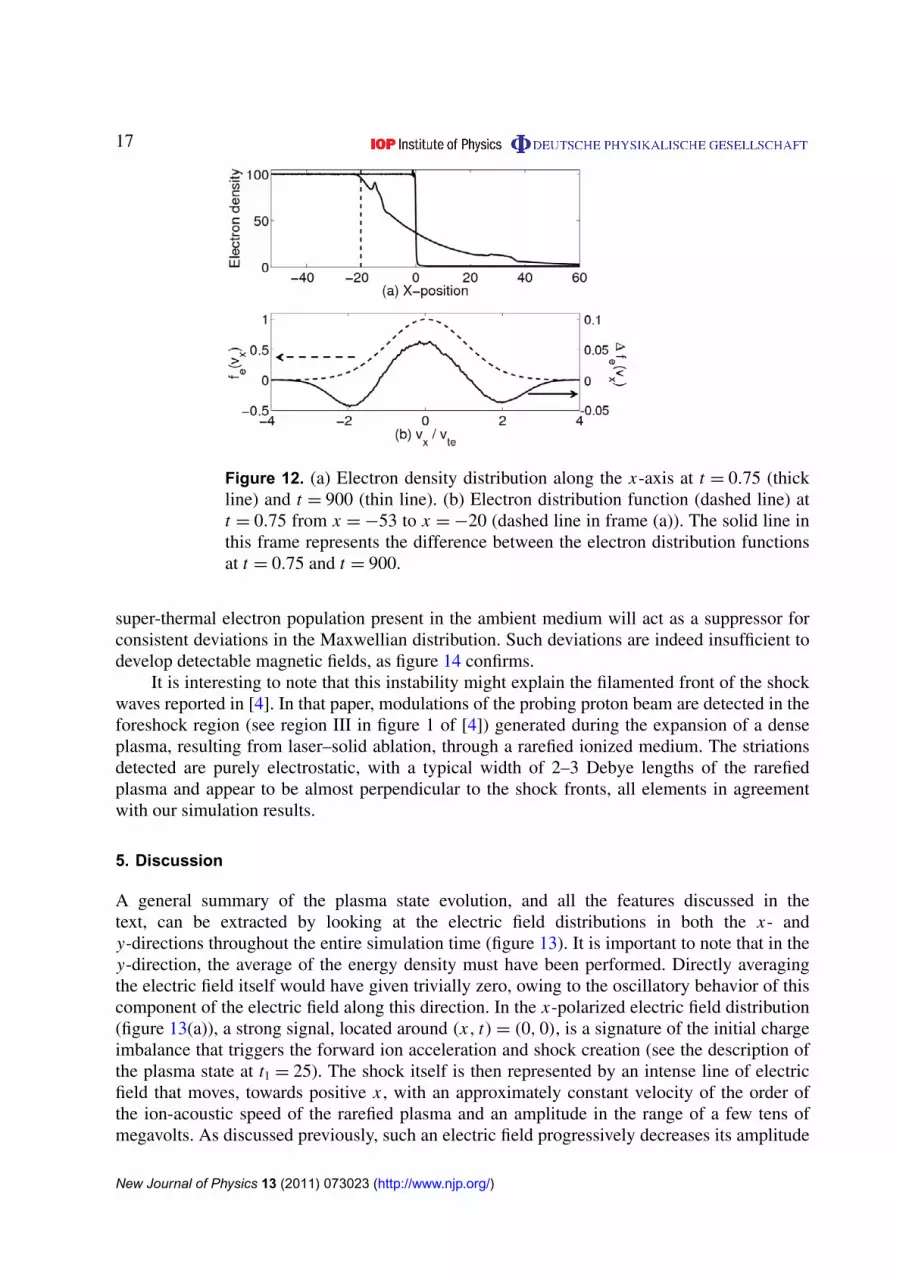
Figure 12. (a) Electron density distribution along the x-axis at t = 0.75 (thickline) and t = 900 (thin line). (b) Electron distribution function (dashed line) att = 0.75 from x = −53 to x = −20 (dashed line in frame (a)). The solid line inthis frame represents the difference between the electron distribution functionsat t = 0.75 and t = 900.
super-thermal electron population present in the ambient medium will act as a suppressor forconsistent deviations in the Maxwellian distribution. Such deviations are indeed insufficient todevelop detectable magnetic fields, as figure 14 confirms.
It is interesting to note that this instability might explain the filamented front of the shockwaves reported in [4]. In that paper, modulations of the probing proton beam are detected in theforeshock region (see region III in figure 1 of [4]) generated during the expansion of a denseplasma, resulting from laser–solid ablation, through a rarefied ionized medium. The striationsdetected are purely electrostatic, with a typical width of 2–3 Debye lengths of the rarefiedplasma and appear to be almost perpendicular to the shock fronts, all elements in agreementwith our simulation results.
5. Discussion
A general summary of the plasma state evolution, and all the features discussed in thetext, can be extracted by looking at the electric field distributions in both the x- andy-directions throughout the entire simulation time (figure 13). It is important to note that in they-direction, the average of the energy density must have been performed. Directly averagingthe electric field itself would have given trivially zero, owing to the oscillatory behavior of thiscomponent of the electric field along this direction. In the x-polarized electric field distribution(figure 13(a)), a strong signal, located around (x, t) = (0, 0), is a signature of the initial chargeimbalance that triggers the forward ion acceleration and shock creation (see the description ofthe plasma state at t1 = 25). The shock itself is then represented by an intense line of electricfield that moves, towards positive x , with an approximately constant velocity of the order ofthe ion-acoustic speed of the rarefied plasma and an amplitude in the range of a few tens ofmegavolts. As discussed previously, such an electric field progressively decreases its amplitude
New Journal of Physics 13 (2011) 073023 (http://www.njp.org/)
18
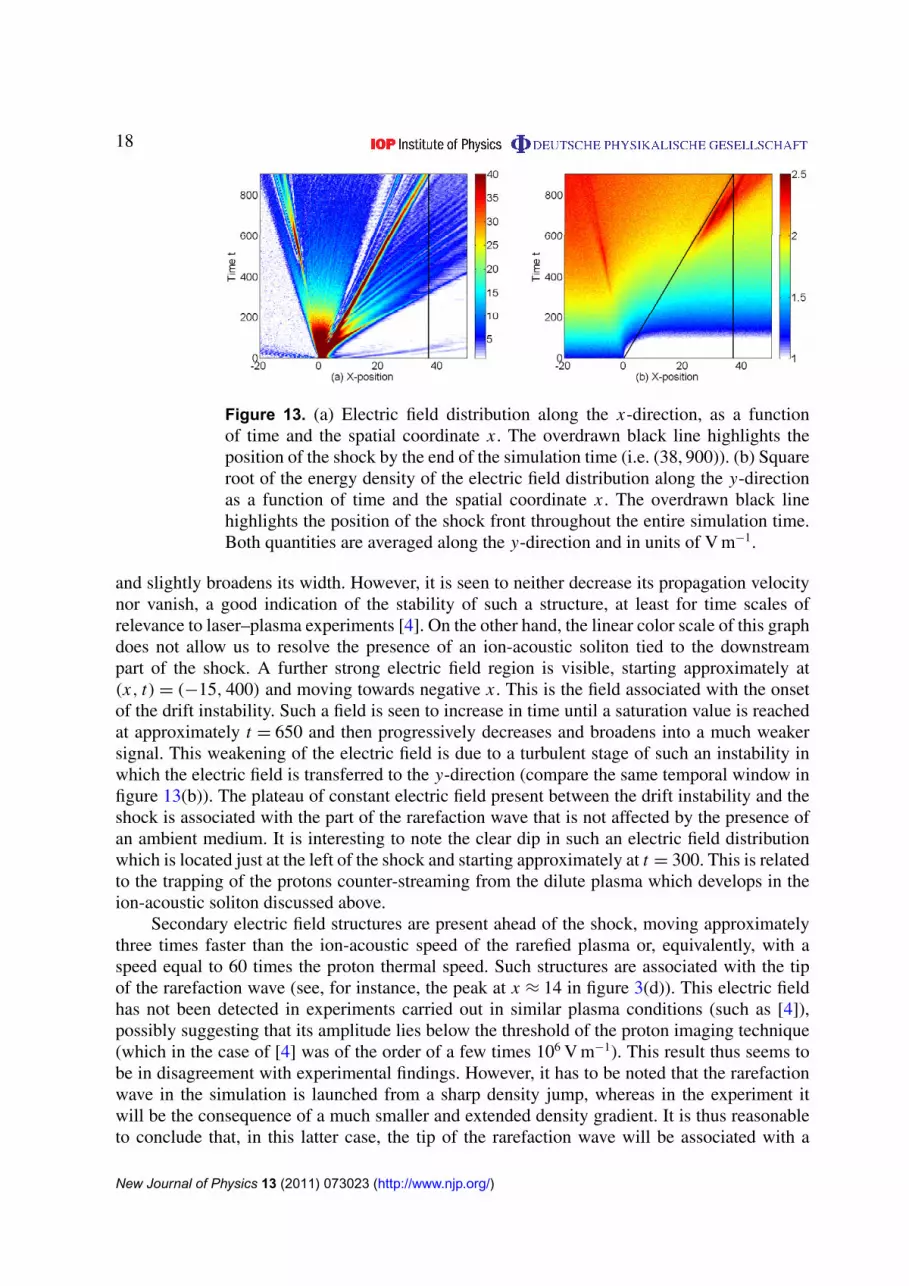
Figure 13. (a) Electric field distribution along the x-direction, as a functionof time and the spatial coordinate x . The overdrawn black line highlights theposition of the shock by the end of the simulation time (i.e. (38, 900)). (b) Squareroot of the energy density of the electric field distribution along the y-directionas a function of time and the spatial coordinate x . The overdrawn black linehighlights the position of the shock front throughout the entire simulation time.Both quantities are averaged along the y-direction and in units of V m−1.
and slightly broadens its width. However, it is seen to neither decrease its propagation velocitynor vanish, a good indication of the stability of such a structure, at least for time scales ofrelevance to laser–plasma experiments [4]. On the other hand, the linear color scale of this graphdoes not allow us to resolve the presence of an ion-acoustic soliton tied to the downstreampart of the shock. A further strong electric field region is visible, starting approximately at(x, t) = (−15, 400) and moving towards negative x . This is the field associated with the onsetof the drift instability. Such a field is seen to increase in time until a saturation value is reachedat approximately t = 650 and then progressively decreases and broadens into a much weakersignal. This weakening of the electric field is due to a turbulent stage of such an instability inwhich the electric field is transferred to the y-direction (compare the same temporal window infigure 13(b)). The plateau of constant electric field present between the drift instability and theshock is associated with the part of the rarefaction wave that is not affected by the presence ofan ambient medium. It is interesting to note the clear dip in such an electric field distributionwhich is located just at the left of the shock and starting approximately at t = 300. This is relatedto the trapping of the protons counter-streaming from the dilute plasma which develops in theion-acoustic soliton discussed above.
Secondary electric field structures are present ahead of the shock, moving approximatelythree times faster than the ion-acoustic speed of the rarefied plasma or, equivalently, with aspeed equal to 60 times the proton thermal speed. Such structures are associated with the tipof the rarefaction wave (see, for instance, the peak at x ≈ 14 in figure 3(d)). This electric fieldhas not been detected in experiments carried out in similar plasma conditions (such as [4]),possibly suggesting that its amplitude lies below the threshold of the proton imaging technique(which in the case of [4] was of the order of a few times 106 V m−1). This result thus seems tobe in disagreement with experimental findings. However, it has to be noted that the rarefactionwave in the simulation is launched from a sharp density jump, whereas in the experiment itwill be the consequence of a much smaller and extended density gradient. It is thus reasonableto conclude that, in this latter case, the tip of the rarefaction wave will be associated with a
New Journal of Physics 13 (2011) 073023 (http://www.njp.org/)
19
−20 −10 0 10 20 30 40 50
2.6
2.8
3
x 10−3
(a) X−position (t=25)
sqrt
<B
2 >y
−20 −10 0 10 20 30 40 50
2.6
2.8
3
x 10−3
(b) X−position (t=150)
sqrt
<B
2 >y
−20 −10 0 10 20 30 40 508
9
10x 10
−3
(c) X−position (t=600)
sqrt
<B
2 >y
−20 −10 0 10 20 30 40 508.5
9
9.5
10x 10
−3
(d) X−position (t=900)
sqrt
<B
2 >y
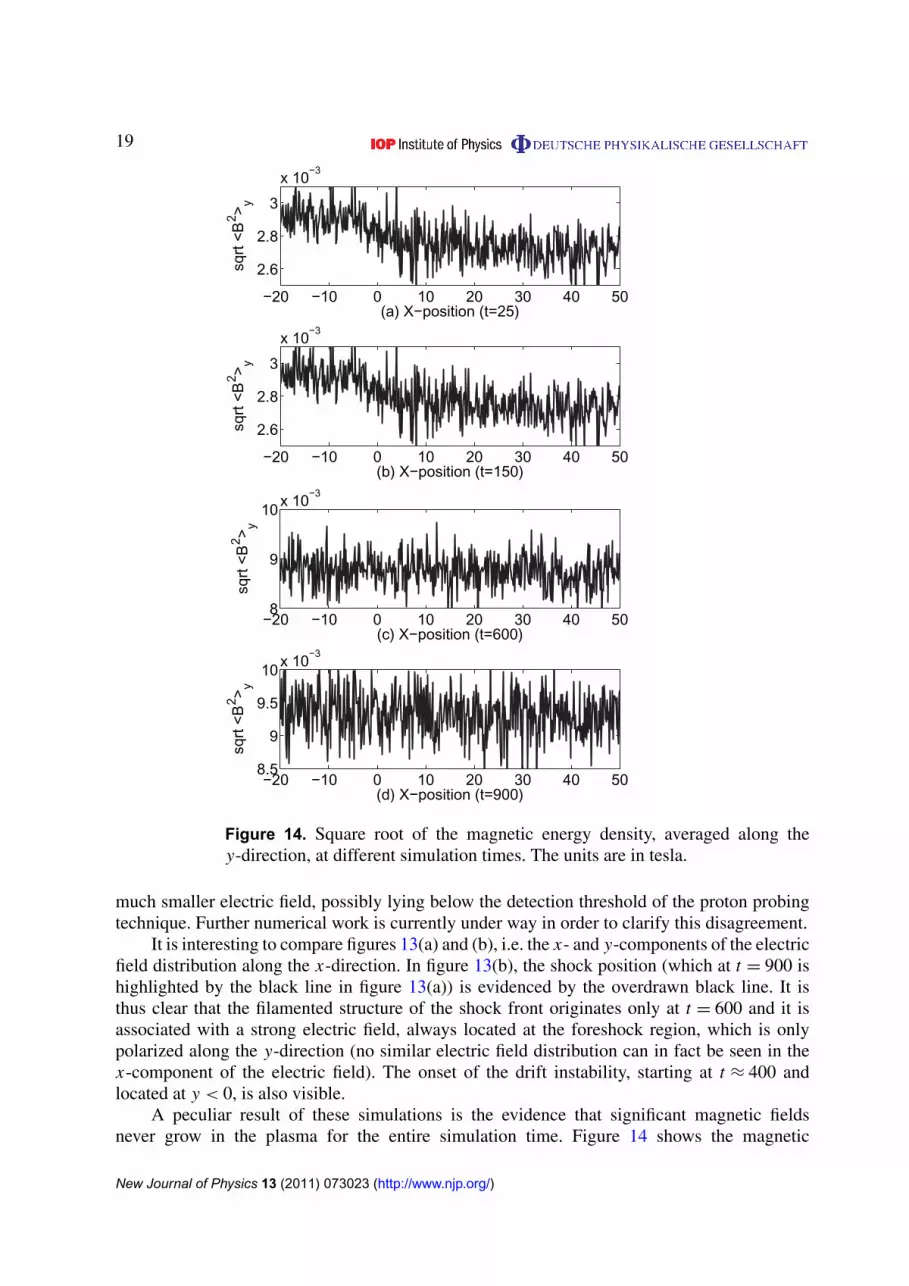
Figure 14. Square root of the magnetic energy density, averaged along they-direction, at different simulation times. The units are in tesla.
much smaller electric field, possibly lying below the detection threshold of the proton probingtechnique. Further numerical work is currently under way in order to clarify this disagreement.
It is interesting to compare figures 13(a) and (b), i.e. the x- and y-components of the electricfield distribution along the x-direction. In figure 13(b), the shock position (which at t = 900 ishighlighted by the black line in figure 13(a)) is evidenced by the overdrawn black line. It isthus clear that the filamented structure of the shock front originates only at t = 600 and it isassociated with a strong electric field, always located at the foreshock region, which is onlypolarized along the y-direction (no similar electric field distribution can in fact be seen in thex-component of the electric field). The onset of the drift instability, starting at t ≈ 400 andlocated at y < 0, is also visible.
A peculiar result of these simulations is the evidence that significant magnetic fieldsnever grow in the plasma for the entire simulation time. Figure 14 shows the magnetic
New Journal of Physics 13 (2011) 073023 (http://www.njp.org/)
20
field distributions, at the different simulation times discussed in the text, averaged over they-direction. As can be clearly seen, the amplitude of the magnetic field remains within the noiseinduced by the PIC representation of the plasma. In particular, the main consequence of sucha result is that shocks and ion-acoustic solitons generated during the expansion of a warm anddense plasma into a colder and more rarefied one are purely electrostatic modes. Also the driftinstability appears to be driven exclusively by density gradients.
The absence of a magnetized shock front appears to be in contradiction to recent theoreticalresults dealing with plasma expansion into a vacuum [18]. This work shows that, during theexpansion, the electrons will be mostly cooled down along the expansion axis, due to thetransfer of energy from the electrons to the expanding protons. This sets an anisotropy inthe electron velocity distribution that induces magnetic fields of the order of the MegaGaussthat feed the Weibel instability at the plasma front. It is shown that the cold population ofelectrons is eventually able to inhibit the instability only in a preliminary stage but does notplay any significant role in the second expansion stage [18]. Magnetic fields are thereforealways created regardless of the presence of a cold electron population in the expanding plasma.These results significantly differ from what was deduced by our simulations, where a rarefiedplasma is introduced as an ambient medium. In this case a superthermal population is created,which will drastically reduce the growth rate of the Weibel instability, possibly hampering itsonset.
Also the unstable shock front can be explained by taking into account only electrostaticphenomena. In particular, it appears to be consistent with the onset of the ion–ion instabilityas first numerically observed by Karimabadi and collaborators [41]. However, the topologicaldistribution of the filaments obtained in our simulations closely resembles that obtained byTako and Takabe [39] while simulating the creation of a collisionless shock in a neutral plasmawith an ion-to-electron temperature ratio of about 1/9. That paper indicates that collisionless,ion-acoustic shock fronts are unstable to the ion–ion instability and, at a later time, to the Weibelinstability as well. These authors claim that such an unstable front causes the vanishing of theshock at late times. However, the disruption of the shock reported in [39] might be caused bytheir different simulation setup. The ions (and electrons) are reflected at one boundary of thesimulation box in [39] by assuming boundary conditions which correspond to a reflecting wall.Two ion beams are present close to the wall. The incoming ion beam moves with the speed vb
to the wall and the reflected one moves with the speed −vb away from the wall. As long asno shock has formed, we find a spatial interval in which two counter-streaming ion beams arethus present. The ions of the reflected ion beam are increasingly modulated by their interactionthrough instabilities with the incoming electrons and ions. This modulation is strongest close tothe front of the reflected ions as PIC simulations of colliding plasma slabs in a parallel magneticfield geometry have demonstrated [42]. These modulations eventually evolve into a shock. Theshock forms far from the reflecting wall if a high ion-to-electron mass ratio is used, which isin agreement with the simulation results in [39]. Once the shock has formed, the incoming ionsare thermalized in correspondence to the shock and they can no longer reach the reflecting wallin the form of a beam. This, in turn, implies that the reflected ion beam is cut off. However, theshock has formed out of the collision between the incoming and the reflected ion beam and itmust collapse once it is no longer fed by the reflected ion beam. The shock in figure 3 of [39]forms at a time of 1000 inverse plasma frequencies and its collapse becomes apparent beforea time equal to 2000 inverse plasma frequencies. The shock forms at a distance of 12 electronskin depths away from the reflecting wall and the incoming plasma has the flow speed of 0.1c.
New Journal of Physics 13 (2011) 073023 (http://www.njp.org/)
21
Ions flowing at 0.1c cross 24 electron skin depths in 240 inverse plasma frequencies. The shockmay not collapse immediately. It is thus possible that it is the cut-off of the incoming ions bythe shock formation that lets the shock in [42] collapse, and not the ion–ion instability.
6. Conclusions
We have carried out a 2D PIC simulation aimed to study the propagation of a dense plasmainto a more rarefied medium. This study represents the extension of a preliminary 1D studywith similar initial conditions. The plasma expansion is first governed by the electrons, which,thanks to the favorable charge-to-mass ratio, start to diffuse into the rarefied plasma, leaving theprotons behind. A charge imbalance will thus be set that is responsible for the acceleration of theprotons of the tenuous plasma and the onset of a rarefaction wave. Such a wave is then disruptedby the onset of a collisionless shock structure which moves at a constant velocity of the orderof the ion-acoustic speed of the tenuous plasma. The shock front and the foreshock region areseen to be subject to electrostatic ion–ion instability, which generates longitudinal filamentarystructures in the upstream part of the shock. In the downstream part of such a shock, an ion-acoustic soliton is formed, generated by the trapped protons of the tenuous plasma. The purelyunmagnetized nature of the plasma, which is evident from the simulation results, indicates thatno Weibel instability is triggered and that these filaments might be caused by the onset of anelectrostatic ion–ion instability. The absence of any coherent magnetic field structures in theplasma is clear evidence of the purely electrostatic nature of shocks and solitons created insuch conditions. Meanwhile, in the core part of the dense, expanding plasma, the onset of anelectrostatic drift instability is observed. Such a plasma dynamics significantly differs fromanalytical and numerical treatments of plasma expansion into a vacuum. In addition to therelevance of this work for the understanding of non-relativistic shocks in solar and astrophysicalplasma scenarios, these results allow a clear interpretation of experimental data obtained insimilar conditions.
Acknowledgments
This work was supported by funding from the UK Engineering and Physical Sciences ResearchCouncil through a Science and Innovation Award to Queen’s University Belfast Centre forPlasma Physics (grant no. EP/D06337X/1), from GK 1203 and from Vetenskapsrådet (Sweden).The authors also thank the Spanish Ministerio de Educacion y Ciencia (ENE2009-09276),Consejeria de Educacion y Ciencia de la Junta de Comunidades de Castilla-La Mancha (PAI08-0182-3162) and Vetenskapsrådet (grant no. 2010-4063).
References
[1] Forslund D A et al 1975 Phys. Rev. A 11 679[2] Brunel F 1987 Phys. Rev. Lett. 59 52[3] O’Neil T M and Coroniti F V 1999 Rev. Mod. Phys. 71 S404[4] Romagnani L et al 2008 Phys. Rev. Lett. 101 025004[5] Eliasson B and Shukla P K 2006 Phys. Rep. 422 225[6] Sarri G et al 2010 New J. Phys. 12 045006[7] Sarri G et al 2010 Phys. Plasmas 17 010701
New Journal of Physics 13 (2011) 073023 (http://www.njp.org/)
22
[8] Lee E, Parks G K, Wilber M and Lin N 2009 Phys. Rev. Lett. 103 031101[9] Kulsrud R M, Ostriker J P and Gunn J E 1972 Phys. Rev. Lett. 28 636
[10] Sack C and Schamel H 1987 Phys. Rep. 156 311[11] Dorozhkina D S and Semenov V E 1998 Phys. Rev. Lett. 81 2691[12] Mora P 2005 Phys. Rev. E 72 056401[13] Mora P and Grismayer T 2009 Phys. Rev. Lett. 102 145001[14] Grismayer T, Mora P, Adam J C and Héron A 2008 Phys. Rev. E 77 066407[15] Weibel E S 1959 Phys. Rev. Lett. 2 83[16] Palodhi L, Califano F and Pegoraro F 2009 Plasma Phys. Control. Fusion 51 125006[17] Stockem A, Dieckmann M E and Schlickeiser R 2010 Plasma Phys. Control. Fusion 52 085009[18] Thaury C, Mora P, Héron A and Adam J C 2010 Phys. Rev. E 82 016408[19] Bell A R et al 1988 Phys. Rev. A 38 1363[20] Quinn K et al 2011 Phys. Rev. Lett. submitted[21] Dieckmann M E, Sarri G, Romagnani L, Kourakis I and Borghesi M 2010 Plasma Phys. Control. Fusion
52 025001[22] Sarri G, Dieckmann M E, Kourakis I and Borghesi M 2010 Phys. Plasmas 17 082305[23] Ishiguro S, Kamimura T and Sato T 1985 Phys. Fluids 28 2100[24] Fruchtman A 2006 Phys. Rev. Lett. 96 065002[25] Forslund D W and Freidberg J P 1971 Phys. Rev. Lett. 27 1189[26] Treumann R A and Baumjohann W 1997 Advanced Space Plasma Physics (London: Imperial College Press)[27] Hoh F C 1963 Phys. Fluids 6 1184[28] Yalinewich A and Gedalin M 2010 Phys. Plasmas 17 062101[29] Lazar M, Schlickeiser R and Poedts S 2010 Phys. Plasmas 17 062112[30] Eastwood J W 1991 Comput. Phys. Commun. 64 252[31] Dawson J M 1983 Rev. Mod. Phys. 55 403[32] Birdsall C K and Langdon A B 1991 Plasma Physics via Computer Simulation (Bristol: Institute of Physics
Publishing)[33] Okuda H 1972 J. Comput. Phys. 10 475[34] Buneman O 1959 Phys. Rev. 115 503[35] Belyi V V 2002 Phys. Rev. Lett. 88 255001[36] Fried B D and Wong A Y 1966 Phys. Fluids 9 1084[37] Gary S P and Omidi N 1987 J. Plasma Phys. 37 45[38] Pierce J R 1948 J. Appl. Phys. 19 231[39] Kato T N and Takabe H 2010 Phys. Plasmas 17 032114[40] Fried B D and Conte S D 1961 The Plasma Dispersion Function (New York: Academic)[41] Karimabadi H, Omidi N and Quest K B 1991 Geophys. Res. Lett. 18 1813[42] Dieckmann M E, Shukla P K and Eliasson B 2006 New J. Phys. 8 225
New Journal of Physics 13 (2011) 073023 (http://www.njp.org/)