modeling of particle size segregation: calibration using the discrete particle method
TRANSCRIPT
October 21, 2011 10:39
MODELING OF PARTICLE SIZE SEGREGATION: CALIBRATION
USING THE DISCRETE PARTICLE METHOD
ANTHONY THORNTON
Department of Mechanical Engineering : Multi-Scale Mechanics,Department of Mathematics : Numerical Analysis and Computational Mechanics
University of Twente, P.O. Box 2177500 AE Enschede, The Netherlands
e-mail: [email protected],http://www2.msm.ctw.utwente.nl/athornton/
THOMAS WEINHART
Department of Mechanical Engineering : Multi-Scale Mechanics,Department of Mathematics : Numerical Analysis and Computational Mechanics
University of Twente, P.O. Box 2177500 AE Enschede, The Netherlands
e-mail: [email protected],http://wwwhome.math.utwente.nl/˜weinhartt/
STEFAN LUDING
Department of Mechanical Engineering : Multi-Scale Mechanics,University of Twente, P.O. Box 2177500 AE Enschede, The Netherlands
e-mail: [email protected],
ONNO BOKHOVE
Department of Mathematics : Numerical Analysis and Computational MechanicsUniversity of Twente, P.O. Box 2177500 AE Enschede, The Netherlands
e-mail: [email protected],
Received Day Month YearRevised Day Month Year
Over the last 25 years a lot of work has been undertaken on constructing continuummodels for segregation of particles of different sizes. We focus on one model that isdesigned to predict segregation and remixing of two differently sized particle species. Thismodel contains two dimensionless parameters, which in general depend on both the flowand particle properties. One of the weaknesses of the model is that these dependenciesare not predicted; these have to be determined by either experiments or simulations.
We present steady-state simulations using the discrete particle method (DPM) for
bi-disperse systems with different size ratios. The aim is to determine one parameterin the continuum model, i.e., the segregation Peclet number (ratio of the segregationvelocity to diffusion) as a function of the particle size ratio.
Reasonable agreement is found; but, also measurable discrepancies are reported;
1
October 21, 2011 10:39
2 Thornton, Weinhart, Luding and Bokhove
mainly, in the simulations a thick pure phase of large particles is formed at the top ofthe flow. In the DPM contact model, tangential dissipation was required to obtain strongsegregation and steady states. Additionally, it was found that the Peclet number increaseslinearly with the size ratio for low values, but saturates to a value of approximately 7.35.
Keywords: Granular materials; DPM (DEM); Segregation; Continuum approach.
PACS Nos.: 81.05.Rm, 45.70.Mg
1. Introduction
Many industrial processes use materials in a granular form, as they are easy to
produce and store. A common industrial problem, especially in the food and phar-
maceutical industry, is generating a consistent blend thus suppressing the natural
tendency of mixed granular materials to segregate (e.g. see Refs 14, 31, 39). Gen-
erating high-quality homogeneous mixtures on an industrial scale is difficult and
this fact is illustrated by the large number of different types of mixers available e.g.
tumbling-, ribbon-blade-, rotating-, pneumatic-, air-jet-mixers; each with numerous
competing designs. Understanding segregation and mixing in these types of appara-
tus remains an active area of research in both academia and industry. Additionally,
segregation during transport and processing represents a huge problem in many
other industrial processes, but also, remains poorly understood.
There are many mechanisms for the segregation of dissimilar grains in granular
flows,4 including inter-particle percolation,6,19 convection,8,11,30 density differences,
collisional condensation,20,30 differential air drag, clustering,35 ordered settling and
temperature driven condensation;19,30 however, segregation due to size-differences is
often the most important.10 This study will focus on dense granular chute flow where
kinetic sieving32,37 is the dominant mechanism for particle-size segregation. The
basic idea is: that as grains avalanche down-slope, the local void ratio fluctuates and
small particles fall into the gaps that open up beneath them, as they are more likely
to fit into the available space than the large ones. The small particles, therefore,
migrate towards the bottom of the flow and lever the large particles upwards due
to force imbalances. This was termed squeeze expulsion by Savage and Lun.37 In
frictional flows this process is so efficient that segregated layers rapidly develop,
with a region of 100% large particles separated by a concentration jump from a
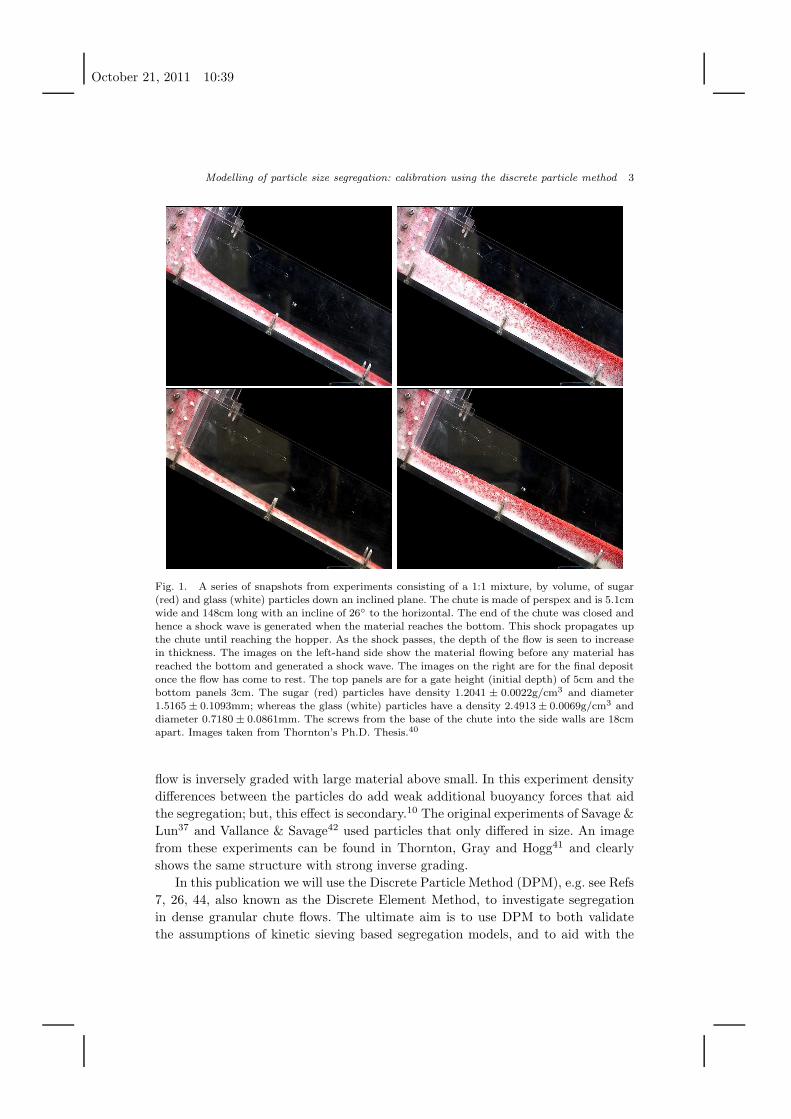
layer of 100% fine particles below.37,40,42 An experiment with two different density
and sized particle species is illustrated in Figure 1, reproduced from Thornton’s
PhD thesis.40 It shows the flow of red, large, dense, particles and white, small, less
dense, particles from a hopper containing an approximately homogeneous mixture.
A region of nearly pure, large, particles is formed near the free-surface, immediately
on exiting the gate of the hopper. This layer grows in thickness as the material
flows down the slope, due to the downward percolation of the smaller material.
As the small material percolates, squeeze expulsion forces the large particles back
upwards, forming a similar growing layer of nearly pure, small particles at the
bottom of the flow. This process continues until these pure regions meet and the
October 21, 2011 10:39
Modelling of particle size segregation: calibration using the discrete particle method 3
Fig. 1. A series of snapshots from experiments consisting of a 1:1 mixture, by volume, of sugar(red) and glass (white) particles down an inclined plane. The chute is made of perspex and is 5.1cmwide and 148cm long with an incline of 26◦ to the horizontal. The end of the chute was closed andhence a shock wave is generated when the material reaches the bottom. This shock propagates upthe chute until reaching the hopper. As the shock passes, the depth of the flow is seen to increasein thickness. The images on the left-hand side show the material flowing before any material has
reached the bottom and generated a shock wave. The images on the right are for the final depositonce the flow has come to rest. The top panels are for a gate height (initial depth) of 5cm and thebottom panels 3cm. The sugar (red) particles have density 1.2041 ± 0.0022g/cm3 and diameter1.5165± 0.1093mm; whereas the glass (white) particles have a density 2.4913± 0.0069g/cm3 anddiameter 0.7180 ± 0.0861mm. The screws from the base of the chute into the side walls are 18cmapart. Images taken from Thornton’s Ph.D. Thesis.40
flow is inversely graded with large material above small. In this experiment density
differences between the particles do add weak additional buoyancy forces that aid
the segregation; but, this effect is secondary.10 The original experiments of Savage &
Lun37 and Vallance & Savage42 used particles that only differed in size. An image
from these experiments can be found in Thornton, Gray and Hogg41 and clearly
shows the same structure with strong inverse grading.
In this publication we will use the Discrete Particle Method (DPM), e.g. see Refs
7, 26, 44, also known as the Discrete Element Method, to investigate segregation
in dense granular chute flows. The ultimate aim is to use DPM to both validate
the assumptions of kinetic sieving based segregation models, and to aid with the
October 21, 2011 10:39
4 Thornton, Weinhart, Luding and Bokhove
calibration of the free parameters that appear in these models. Despite the large
number of discrete particle simulations of segregation in industrial chutes, and other
apparatus, very few systematic studies have been performed for straightforward
chute flows. Using simple chute geometries allows the results to be more easily
compared to continuum theories enabling the determination of macro-parameters
as a function of the DPM micro-parameters. We take the first step in this direction
by investigating how the ratio of the strength of segregation to diffusion depends
on the size ratio.
In summary, we will address three questions: (i) what is the minimal DPM
contact model required to get segregation similar to that seen in experiments, (ii)
how does the ratio of segregation to diffusion depend on the size ratio and (iii) how
do our DPM results compare with a continuum theory, previously reported Monte
Carlo simulations and experimental results?
2. The Discrete Particle Method
Many researchers have used DPM simulations to investigate segregation in a variety
of situations and in this publication we give a brief overview. DPM has been used to
investigate: density segregation in rotating cylinders;23 flow of sintered ore and coke
into blast furnaces;33,34,46 size-segregation of magnetic particles in chutes;47 numer-
ous powder pharmaceutical applications including transport, blending, granulation,
milling, compression and film coating;22 and, sieving or screening.5,25 However, of
particular interest to this research, is the investigation of steady-state segregation
profiles for varying density and size differences in chute flows by Khakhar et al.24
They used DPM to investigate density effects and Monte Carlo simulations for
different sized particles.
We use a DPM to perform simulations of a collection of bi-dispersed spherical
particles of different diameters ds and dl, with the same density ρ; each particle i
has a position ri, velocity vi and angular velocity ωi. It is assumed that particles are
spherical, soft, and the contacts are treated as occurring at single points. The relative
distance between two particles i and j is rij = |ri−rj |, the branch vector (the vector
from the centre of the particle to the contact point) is bij = −(di − δnij)nij/2, the
unit normal is nij = (ri − rj)/rij , and the relative velocity is vij = vi − vj . Two
particles are in contact if their overlap,
δnij = max(0, (di + dj)/2− rij),
is positive. The normal and tangential relative velocities at the contact point are
given by
vnij = (vij · nij)nij , and vt
ij = vij − (vij · nij)nij + ωi × bij − ωj × bji.
Particles are assumed to be linearly viscoelastic; therefore, the normal and tan-
gential forces are modeled as a spring-dashpot with a linear elastic and a linear
dissipative contribution.7,26 Hence, the normal and tangential forces, acting from j
October 21, 2011 10:39
Modelling of particle size segregation: calibration using the discrete particle method 5
on i, are given by
fnij = knδnijnij − γnvn
ij , f tij = −ktδtij − γtvt
ij ,
where kn and kt are the spring constants and, γn and γt the damping constants.
The elastic tangential displacement, δtij , is defined to be zero at the initial time of
contact, and its evolution is given by
d
dtδtij = vt
ij − r−2ij (δtij · vij)rij , (1)
where the second term corrects for the rotation of the contact, so that δtij · nij = 0.
When the tangential to normal force ratio becomes larger than the microscopic fric-
tion coefficient, µp, the tangential spring yields and the particles slide, truncating
the magnitude of δtij as necessary to satisfy |f tij | < µp|fn
ij |. A more detailed descrip-
tion of the contact law used can be found in Weinhart et al.44 and for a detailed
discussion of contact laws, in general, we refer the reader to the review by Luding.26
The total force on particle i is a combination of the contact forces fnij + f t
ij
between all particle pairs i, j, currently in contact, and external forces, which for
this investigation will be limited to only gravity. We integrate the resulting force
and torque relations in time using Velocity-Verlet2 and forward Euler with a time
step ∆t = tc/50, where tc is the contact duration26 given by
tc = π/
√
kn
mij−(
γ n
2mij
)2
, (2)
with reduced mass mij = mimj/(mi+mj). The base is composed of fixed particles,
which are endowed with an infinite mass and, thus are unaffected by body and
contact forces: they do not move.
Obtaining macroscopic fields from DPM simulations is a non-trivial task, espe-
cially near a boundary. We will use an advanced and accurate spatial coarse-graining
procedure.3,12 For the present study, we only require the volume of the small par-
ticles,
V s(r, t) =π
6d3s
∑
i∈S
W (r − ri(t)) , (3)
and the total particle volume
V (r, t) =π
6
∑
i
d3iW (r − ri(t)) , (4)
where W is a coarse-graining function, and S denotes the set of small particles. In
this publication W is taken to be a Gaussian of width, or variance, ds/2, i.e.,
W(r − ri(t)) =1
(√2πds/2)3
exp
(
−|r − ri(t)|22(ds/2)2
)
. (5)
For information on how to construct other fields, we refer the reader to Goldhirsch12
and for an extension that is still valid near a boundary see Weinhart et al.45
October 21, 2011 10:39
6 Thornton, Weinhart, Luding and Bokhove
3. Continuum model of segregation
The first model of kinetic sieving was developed by Savage and Lun,37 using a sta-
tistical argument about the distribution of void spaces. This model was able to
predict steady-state size distributions for simple shear flows with bi-dispersed gran-
ular materials. Later, Gray and Thornton18,40 developed the same structure from
a mixture-theory framework. Their derivation has two key assumptions: firstly, as
the different particles percolate past each other there is a Darcy-style drag between
the different constituents (i.e., the small and large particles) and, secondly, particles
falling into void spaces do not support any of the bed weight. Since the number of
voids available for small particles to fall into is greater than for large particles, it
follows that a higher percentage of the small particles will be falling and, hence,
not supporting any of the bed load. In recent years, this segregation theory has
been developed and extended in many directions: including the addition of a pas-
sive background fluid,40,41 the effect of diffusive remixing,16 and the generalisation
to multi-component granular flows.15 We will use the two-particle size segregation-
remixing version derived by Gray and Chugunov;16 however, it should be noted that
Dolgunin and Ukolov9 were the first to suggest this form, by using phenomenological
arguments. The bi-dispersed segregation-remixing model contains two dimensionless
parameters, which in general will depend on flow and particle properties; examples
include: size-ratio, material properties, shear-rate, slope angle, particle roughness,
etc. One of the weaknesses of the model is that it is not able to predict the de-
pendence of its parameters on the particle and flow properties; these have to be
determined by either experiments or DPM simulations.
Kinetic-sieving models work best in dense, not too energetic flows, where endur-
ing contacts exist. For more energetic flows kinetic theory is more appropriate and
segregation models derived from this framework are applicable, examples include,
Jenkins;20 Jenkins and Yoon;21 and, Alam, Trujillo and Herrmann.1 Using DPM, it
is possible to systematically increase the kinetic energy of the flows and investigate
the transition between dense and kinetic regimes, but this is beyond the scope of
the current investigation, where we only consider the dense regime.
The two-particle segregation-remixing equation16 takes the form of a non-
dimensional scalar conservation law for the small particle concentration φ as a
function of the spatial coordinates x, y and z; and, time t,
∂φ
∂t+
∂
∂x(φu) +
∂
∂y(φv) +
∂
∂z(φw)− ∂
∂z(Srφ (1− φ)) =
∂
∂z
(
Dr∂φ
∂z
)
, (6)
where Sr is the dimensionless measure of the segregation-rate, whose form in the
most general case is discussed in Thornton, Gray and Hogg41 and Dr is a measure
of the diffusive remixing. In Eq. (6), ∂ is used to indicate the partial derivative, x
is the down-slope coordinate, y the cross-slope and z normal to the base coordi-
nate; furthermore u, v and w are the dimensionless bulk velocity components in the
x, y and z directions, respectively. The conservation law (6) is derived under the
assumption of uniform total granular volume fraction and is often solved subject
October 21, 2011 10:39
Modelling of particle size segregation: calibration using the discrete particle method 7
to the condition that there is no normal flux of particles through the base or free
surface of the flow.
3.1. Steady-state solution
We limit our attention to small-scale DPM simulations, periodic in the x and y-
directions, and investigate the final steady-states. Therefore, we are interested in a
steady-state solution to (6) subject to no-normal flux boundary condition, at z = 0
(the bottom) and 1 (the top), that is independent of x and y. Gray and Chugunov16
showed that such a solution takes the form,
φ =
(
1− e(−φ0Ps))
e(φ0−z)Ps
1− e(−(1−φ0)Ps) + (1− e−φ0Ps) e(φ0−z)Ps
, (7)
where Ps = Sr/Dr is the segregation Peclet number and φ0 is the mean concen-
tration of small particles. This solution represents a balance between the last two
terms of (6) and is related to the logistic equation. In general, Ps will be a function
of the particle properties, and we will use DPM to investigate the dependence of Ps
on the particle size ratio
σ = ds/dl. (8)
It should be noted that σ has been defined such that it is consistent with the original
theory of Savage and Lun;37 however, with this definition only values between 0 and
1 are possible. Therefore, we will present the results in terms of σ−1 which ranges
from 1 to infinity. The useful property of the steady-state solution (7) is that the
profile is only a function of the total small particle concentration φ0 and Ps: It
allows Ps to be determined from a simple periodic box DPM simulation.
3.2. Non-dimensionalisation of the DPM results
The DPM results presented in Section 4 will be averaged in the x- and y-directions
and hence, we will obtain local volumes of both the total granular (4) and small
particles (3) as a function of z only. For comparison with the non-dimensional
analytical solution (7) the results will be non-dimensionalised by the scaling
z = (z − b)/(s− b) , φ = V s/V, (9)
where b is the location of the base of the flow, s the location of the free surface
and V s and V are given by equations (3) and (4), respectively. Hence, the mean
concentration, φ0, of small particles is given by
φ0 =1
s− b
∫ s
b
φ(z) dz =
∫ 1
0
φ(z) dz. (10)
It is then possible to directly compare (7), obtained subject to the no-normal flux
condition at z = 0, 1, with the steady-state volume fraction profiles, φ(z), obtained
from the simulations. Then, Eq. (7) allows the determination of Ps as a function of
the parameters of the contact model.
October 21, 2011 10:39
8 Thornton, Weinhart, Luding and Bokhove
The free surface of the flow is not clearly defined in a DPM simulation and here
two different definitions will be considered. Weinhart et al.44 investigated how to
consistently define the base and free-surface locations for flows over rough bottoms.
Following their results we define both the base and free surface via the downward
normal stress, σzz . For steady uniform flows, it follows directly from the momen-
tum equations that the downward normal stress is lithostatic, i.e., it balances the
gravitational weight. Thus, σzz(z) has to decrease monotonically from a maximum
at the base to zero at the free-surface. However, in order to avoid effects of coarse
graining or single particles near the boundary, we cut off the stress σzz(z) on either
boundary by defining threshold heights
z1 = min{z : σzz < (1− κ)maxz∈R
σzz} and (11a)
z2 = max{z : σzz > κmaxz∈R
σzz} (11b)
with κ = 0.01. We subsequently linearly extrapolate the stress profile in the interval
(z1, z2) to define the base, b, and surface location, s, as the height at which the linear
extrapolation reaches the maximum and minimum values of σzz , respectively,
b = z1 −κ
1− 2κ(z2 − z1); and sf = z2 +
κ
1− 2κ(z2 − z1), (11c)
here the subscript f indicates that this is a definition of the free-surface location.
In granular chute flows there is a layer of saltating particles towards the top of
the flow, where the density decreases with height. This effect is confirmed in the
simulations presented here, see Figure 5. Gray and Chugunov16 suggested that the
theory should not be fitted over the less dense region and defined the top of the
flow as the point where the density starts to decrease. Therefore, we will also use
sd = (1− 2κ)max ρ (12)
to define the surface between the dense and less dense regions, where ρ is the density
of the flow. An illustration of the demarcation between dense and less dense flow is
shown in Figure 5. We will use the notation zf to indicate the scaling based on the
free-surface location and zd on the location of the dense basal layer.
4. Previous comparison to the theory
The original theory of Thornton and Gray18,40 has been used to investigate shear-
driven segregation in an annular Couette cell.13,28,29 In the papers cited the segrega-
tion rate is assumed to be proportional to the local shear rate and the experimentally
determined velocity profiles are used to solve the continuum model. In these experi-
ments it was not possible to monitor the local volume fraction of the small particles
directly, and it had to be inferred via the measured expansion and compaction of
the sample. They found good agreement between model and theory in the initial
phase, but at later times the segregation rate exponentially slowed down, which is
not captured by the model. Additionally, they observed an increase in the thick-
ness of the sample as the particle profile evolved (Reynolds dilatancy); this effect
October 21, 2011 10:39
Modelling of particle size segregation: calibration using the discrete particle method 9
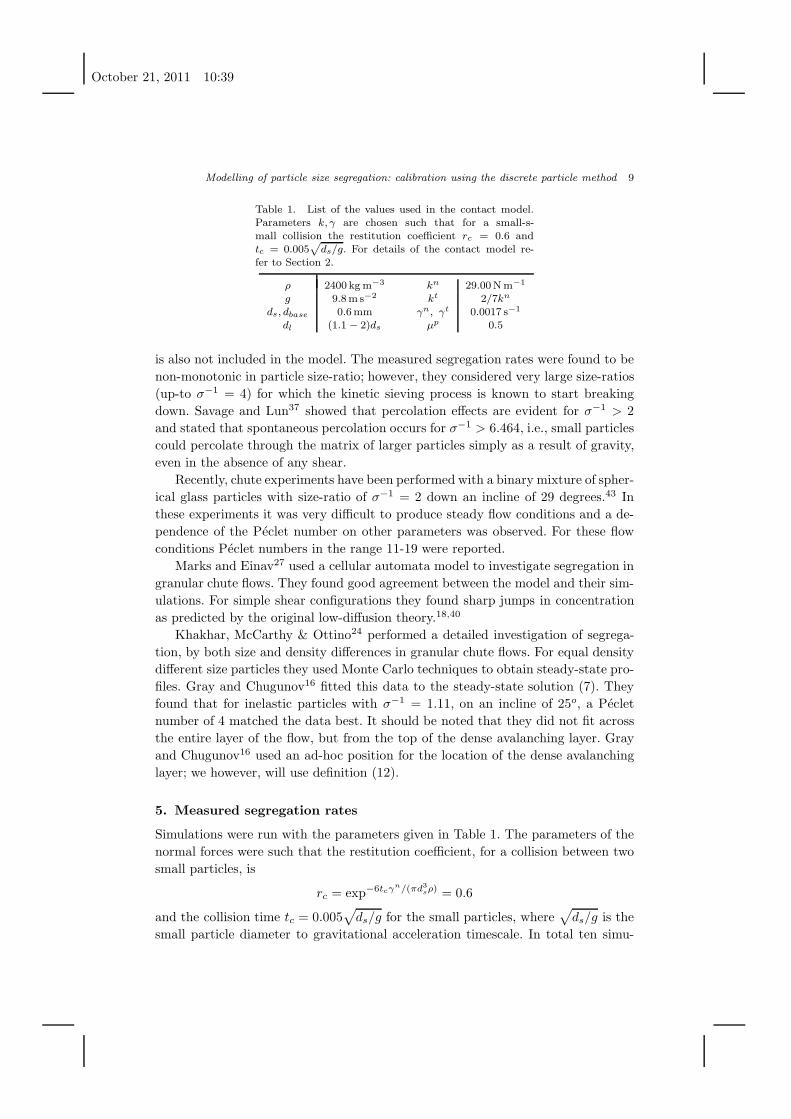
Table 1. List of the values used in the contact model.Parameters k, γ are chosen such that for a small-s-mall collision the restitution coefficient rc = 0.6 andtc = 0.005
√
ds/g. For details of the contact model re-fer to Section 2.
ρ 2400 kgm−3 kn 29.00Nm−1
g 9.8ms−2 kt 2/7kn
ds, dbase 0.6mm γn, γt 0.0017 s−1
dl (1.1 − 2)ds µp 0.5
is also not included in the model. The measured segregation rates were found to be
non-monotonic in particle size-ratio; however, they considered very large size-ratios
(up-to σ−1 = 4) for which the kinetic sieving process is known to start breaking
down. Savage and Lun37 showed that percolation effects are evident for σ−1 > 2
and stated that spontaneous percolation occurs for σ−1 > 6.464, i.e., small particles
could percolate through the matrix of larger particles simply as a result of gravity,
even in the absence of any shear.
Recently, chute experiments have been performed with a binary mixture of spher-
ical glass particles with size-ratio of σ−1 = 2 down an incline of 29 degrees.43 In
these experiments it was very difficult to produce steady flow conditions and a de-
pendence of the Peclet number on other parameters was observed. For these flow
conditions Peclet numbers in the range 11-19 were reported.
Marks and Einav27 used a cellular automata model to investigate segregation in
granular chute flows. They found good agreement between the model and their sim-
ulations. For simple shear configurations they found sharp jumps in concentration
as predicted by the original low-diffusion theory.18,40
Khakhar, McCarthy & Ottino24 performed a detailed investigation of segrega-
tion, by both size and density differences in granular chute flows. For equal density
different size particles they used Monte Carlo techniques to obtain steady-state pro-
files. Gray and Chugunov16 fitted this data to the steady-state solution (7). They
found that for inelastic particles with σ−1 = 1.11, on an incline of 25o, a Peclet
number of 4 matched the data best. It should be noted that they did not fit across
the entire layer of the flow, but from the top of the dense avalanching layer. Gray
and Chugunov16 used an ad-hoc position for the location of the dense avalanching
layer; we however, will use definition (12).
5. Measured segregation rates
Simulations were run with the parameters given in Table 1. The parameters of the
normal forces were such that the restitution coefficient, for a collision between two
small particles, is
rc = exp−6tcγn/(πd3
sρ) = 0.6
and the collision time tc = 0.005√
ds/g for the small particles, where√
ds/g is the
small particle diameter to gravitational acceleration timescale. In total ten simu-
October 21, 2011 10:39
10 Thornton, Weinhart, Luding and Bokhove
x
z
x
z
x
z
x
z
x
z
x
z
x
z
x
z
x
z
t = 5 t = 60t = 1
σ−1=
2.0
σ−1=
1.5
σ−1=
1.1
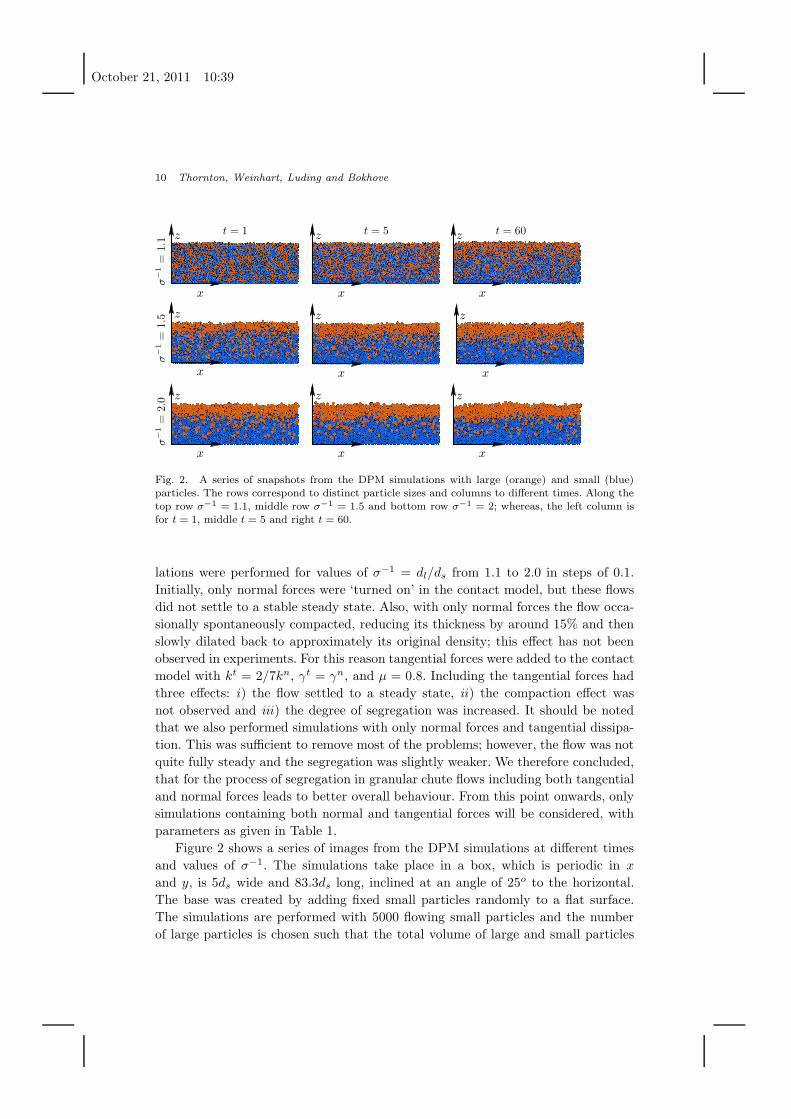
Fig. 2. A series of snapshots from the DPM simulations with large (orange) and small (blue)particles. The rows correspond to distinct particle sizes and columns to different times. Along thetop row σ−1 = 1.1, middle row σ−1 = 1.5 and bottom row σ−1 = 2; whereas, the left column isfor t = 1, middle t = 5 and right t = 60.
lations were performed for values of σ−1 = dl/ds from 1.1 to 2.0 in steps of 0.1.
Initially, only normal forces were ‘turned on’ in the contact model, but these flows
did not settle to a stable steady state. Also, with only normal forces the flow occa-
sionally spontaneously compacted, reducing its thickness by around 15% and then
slowly dilated back to approximately its original density; this effect has not been
observed in experiments. For this reason tangential forces were added to the contact
model with kt = 2/7kn, γt = γn, and µ = 0.8. Including the tangential forces had
three effects: i) the flow settled to a steady state, ii) the compaction effect was
not observed and iii) the degree of segregation was increased. It should be noted
that we also performed simulations with only normal forces and tangential dissipa-
tion. This was sufficient to remove most of the problems; however, the flow was not
quite fully steady and the segregation was slightly weaker. We therefore concluded,
that for the process of segregation in granular chute flows including both tangential
and normal forces leads to better overall behaviour. From this point onwards, only
simulations containing both normal and tangential forces will be considered, with
parameters as given in Table 1.
Figure 2 shows a series of images from the DPM simulations at different times
and values of σ−1. The simulations take place in a box, which is periodic in x
and y, is 5ds wide and 83.3ds long, inclined at an angle of 25o to the horizontal.
The base was created by adding fixed small particles randomly to a flat surface.
The simulations are performed with 5000 flowing small particles and the number
of large particles is chosen such that the total volume of large and small particles
October 21, 2011 10:39
Modelling of particle size segregation: calibration using the discrete particle method 11
t
COM
σ = 1.1
t
COM
σ = 1.3
t
COM
σ = 2
large
totalsmall
0 20 40 60 80 1000 20 40 60 80 1000 20 40 60 80 1000.25
0.3
0.35
0.4
0.45
0.5
0.55
0.6
0.65
0.7
0.75
0.25
0.3
0.35
0.4
0.45
0.5
0.55
0.6
0.65
0.7
0.75
0.25
0.3
0.35
0.4
0.45
0.5
0.55
0.6
0.65
0.7
0.75
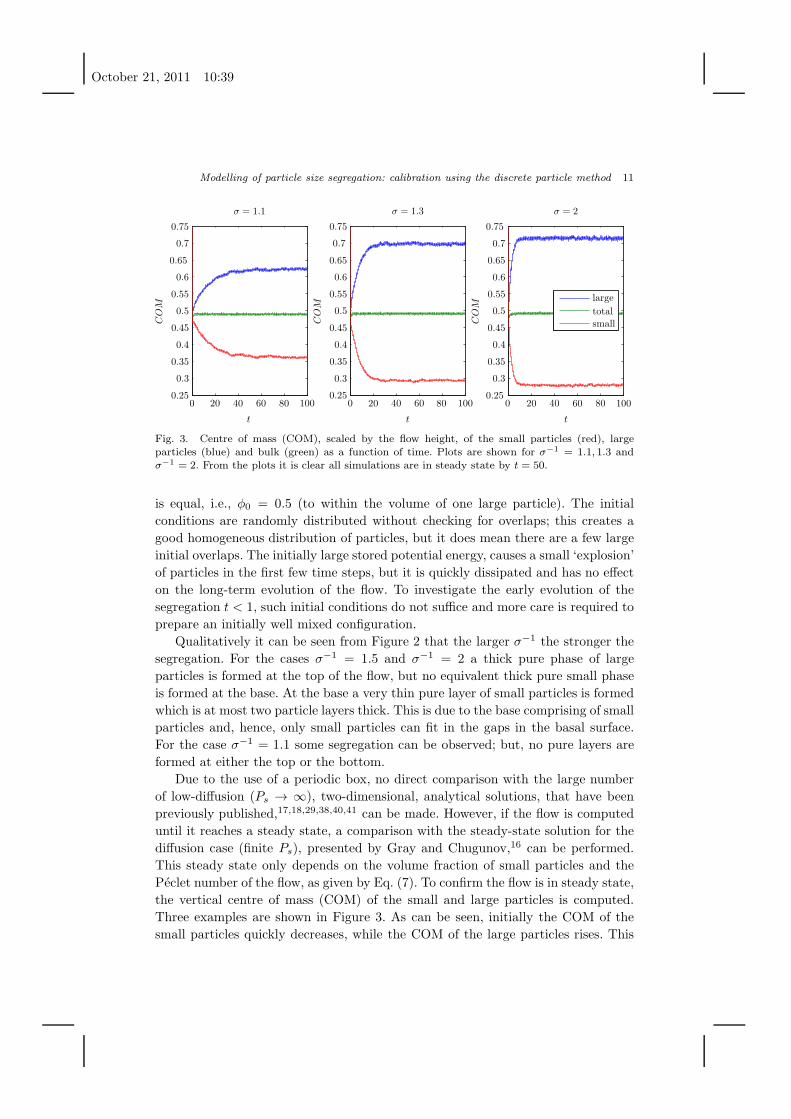
Fig. 3. Centre of mass (COM), scaled by the flow height, of the small particles (red), largeparticles (blue) and bulk (green) as a function of time. Plots are shown for σ−1 = 1.1, 1.3 andσ−1 = 2. From the plots it is clear all simulations are in steady state by t = 50.
is equal, i.e., φ0 = 0.5 (to within the volume of one large particle). The initial
conditions are randomly distributed without checking for overlaps; this creates a
good homogeneous distribution of particles, but it does mean there are a few large
initial overlaps. The initially large stored potential energy, causes a small ‘explosion’
of particles in the first few time steps, but it is quickly dissipated and has no effect
on the long-term evolution of the flow. To investigate the early evolution of the
segregation t < 1, such initial conditions do not suffice and more care is required to
prepare an initially well mixed configuration.
Qualitatively it can be seen from Figure 2 that the larger σ−1 the stronger the
segregation. For the cases σ−1 = 1.5 and σ−1 = 2 a thick pure phase of large
particles is formed at the top of the flow, but no equivalent thick pure small phase
is formed at the base. At the base a very thin pure layer of small particles is formed
which is at most two particle layers thick. This is due to the base comprising of small
particles and, hence, only small particles can fit in the gaps in the basal surface.
For the case σ−1 = 1.1 some segregation can be observed; but, no pure layers are
formed at either the top or the bottom.
Due to the use of a periodic box, no direct comparison with the large number
of low-diffusion (Ps → ∞), two-dimensional, analytical solutions, that have been
previously published,17,18,29,38,40,41 can be made. However, if the flow is computed
until it reaches a steady state, a comparison with the steady-state solution for the
diffusion case (finite Ps), presented by Gray and Chugunov,16 can be performed.
This steady state only depends on the volume fraction of small particles and the
Peclet number of the flow, as given by Eq. (7). To confirm the flow is in steady state,
the vertical centre of mass (COM) of the small and large particles is computed.
Three examples are shown in Figure 3. As can be seen, initially the COM of the
small particles quickly decreases, while the COM of the large particles rises. This
October 21, 2011 10:39
12 Thornton, Weinhart, Luding and Bokhove
σ−1 = 1.1 σ−1 = 1.3 σ−1 = 1.5
σ−1 = 1.6 σ−1 = 1.8 σ−1 = 2
z fz f
φ φ φ
0 0.25 0.5 0.75 10 0.25 0.5 0.75 10 0.25 0.5 0.75 10
0.25
0.5
0.75
1
0
0.25
0.5
0.75
1
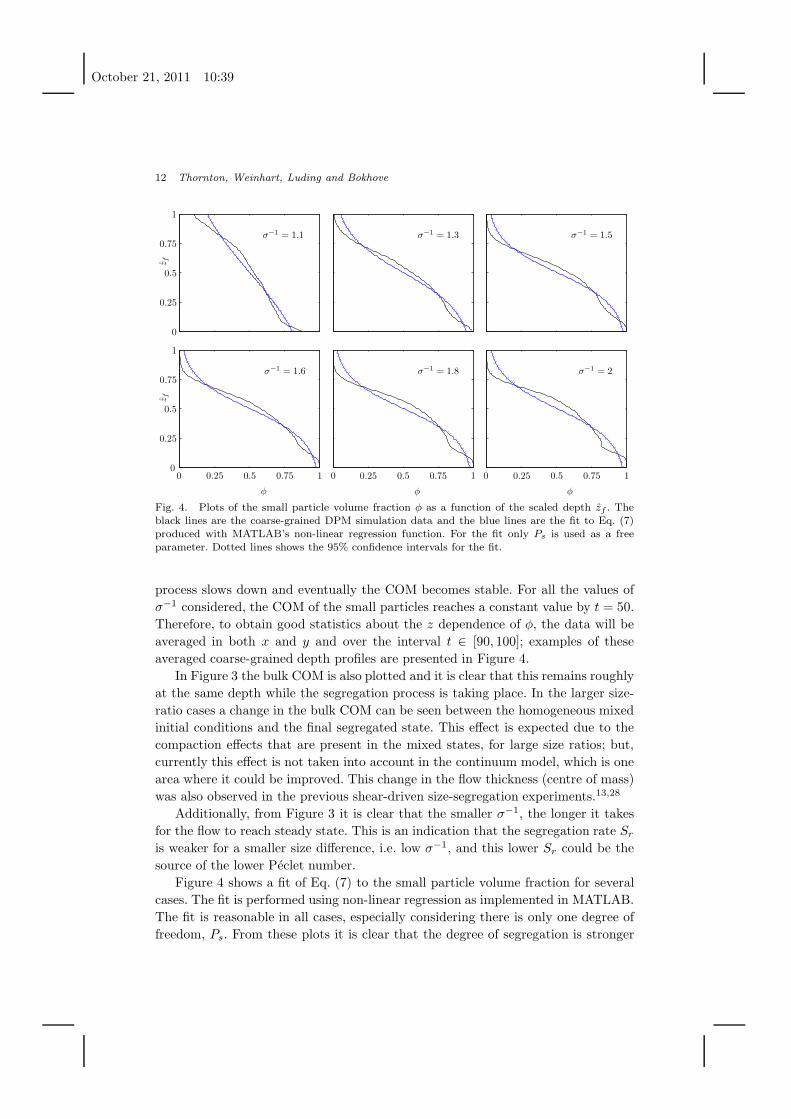
Fig. 4. Plots of the small particle volume fraction φ as a function of the scaled depth zf . Theblack lines are the coarse-grained DPM simulation data and the blue lines are the fit to Eq. (7)produced with MATLAB’s non-linear regression function. For the fit only Ps is used as a freeparameter. Dotted lines shows the 95% confidence intervals for the fit.
process slows down and eventually the COM becomes stable. For all the values of
σ−1 considered, the COM of the small particles reaches a constant value by t = 50.
Therefore, to obtain good statistics about the z dependence of φ, the data will be
averaged in both x and y and over the interval t ∈ [90, 100]; examples of these
averaged coarse-grained depth profiles are presented in Figure 4.
In Figure 3 the bulk COM is also plotted and it is clear that this remains roughly
at the same depth while the segregation process is taking place. In the larger size-
ratio cases a change in the bulk COM can be seen between the homogeneous mixed
initial conditions and the final segregated state. This effect is expected due to the
compaction effects that are present in the mixed states, for large size ratios; but,
currently this effect is not taken into account in the continuum model, which is one
area where it could be improved. This change in the flow thickness (centre of mass)
was also observed in the previous shear-driven size-segregation experiments.13,28
Additionally, from Figure 3 it is clear that the smaller σ−1, the longer it takes
for the flow to reach steady state. This is an indication that the segregation rate Sr
is weaker for a smaller size difference, i.e. low σ−1, and this lower Sr could be the
source of the lower Peclet number.
Figure 4 shows a fit of Eq. (7) to the small particle volume fraction for several
cases. The fit is performed using non-linear regression as implemented in MATLAB.
The fit is reasonable in all cases, especially considering there is only one degree of
freedom, Ps. From these plots it is clear that the degree of segregation is stronger
October 21, 2011 10:39
Modelling of particle size segregation: calibration using the discrete particle method 13
z f
Φ
Φs
Φl
0 0.1 0.2 0.3 0.4 0.5 0.6 0.70
0.1
0.2
0.3
0.4
0.5
0.6
0.7
0.8
0.9
1
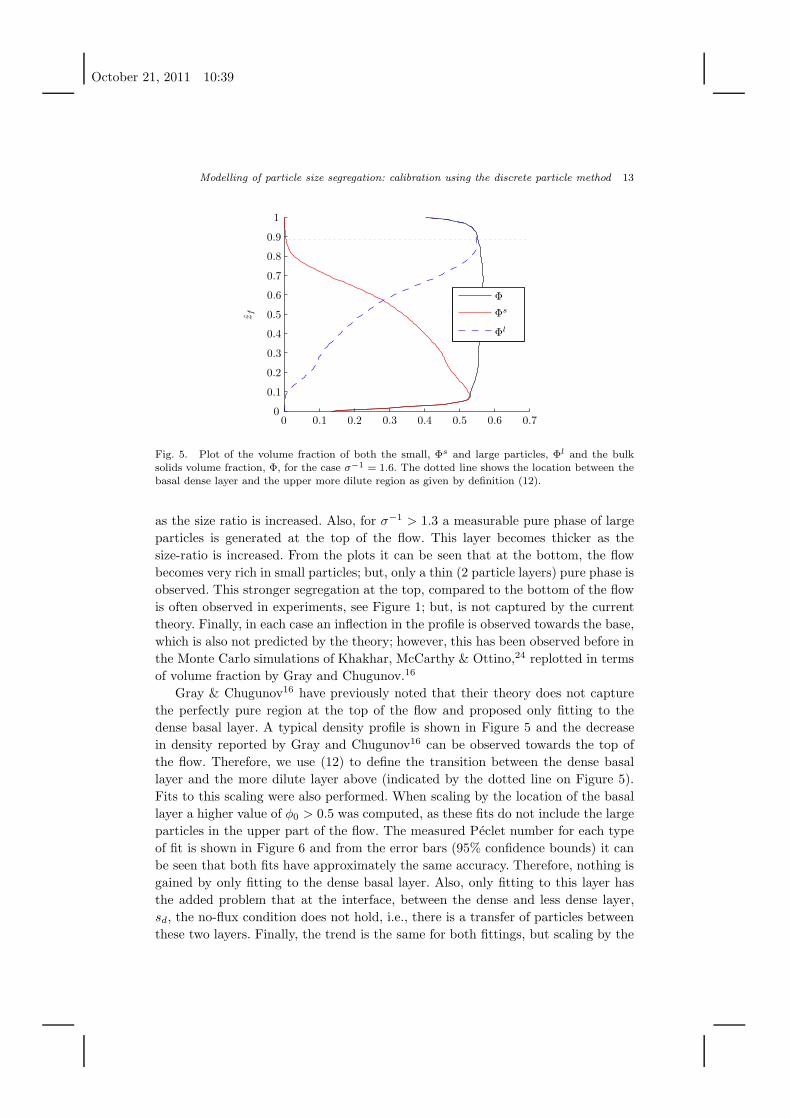
Fig. 5. Plot of the volume fraction of both the small, Φs and large particles, Φl and the bulksolids volume fraction, Φ, for the case σ−1 = 1.6. The dotted line shows the location between thebasal dense layer and the upper more dilute region as given by definition (12).
as the size ratio is increased. Also, for σ−1 > 1.3 a measurable pure phase of large
particles is generated at the top of the flow. This layer becomes thicker as the
size-ratio is increased. From the plots it can be seen that at the bottom, the flow
becomes very rich in small particles; but, only a thin (2 particle layers) pure phase is
observed. This stronger segregation at the top, compared to the bottom of the flow
is often observed in experiments, see Figure 1; but, is not captured by the current
theory. Finally, in each case an inflection in the profile is observed towards the base,
which is also not predicted by the theory; however, this has been observed before in
the Monte Carlo simulations of Khakhar, McCarthy & Ottino,24 replotted in terms
of volume fraction by Gray and Chugunov.16
Gray & Chugunov16 have previously noted that their theory does not capture
the perfectly pure region at the top of the flow and proposed only fitting to the
dense basal layer. A typical density profile is shown in Figure 5 and the decrease
in density reported by Gray and Chugunov16 can be observed towards the top of
the flow. Therefore, we use (12) to define the transition between the dense basal
layer and the more dilute layer above (indicated by the dotted line on Figure 5).
Fits to this scaling were also performed. When scaling by the location of the basal
layer a higher value of φ0 > 0.5 was computed, as these fits do not include the large
particles in the upper part of the flow. The measured Peclet number for each type
of fit is shown in Figure 6 and from the error bars (95% confidence bounds) it can
be seen that both fits have approximately the same accuracy. Therefore, nothing is
gained by only fitting to the dense basal layer. Also, only fitting to this layer has
the added problem that at the interface, between the dense and less dense layer,
sd, the no-flux condition does not hold, i.e., there is a transfer of particles between
these two layers. Finally, the trend is the same for both fittings, but scaling by the
October 21, 2011 10:39
14 Thornton, Weinhart, Luding and Bokhove
Ps
σ−1
fit to full flow height
fit to dense base layer
1 1.1 1.2 1.3 1.4 1.5 1.6 1.7 1.8 1.9 20
1
2
3
4
5
6
7
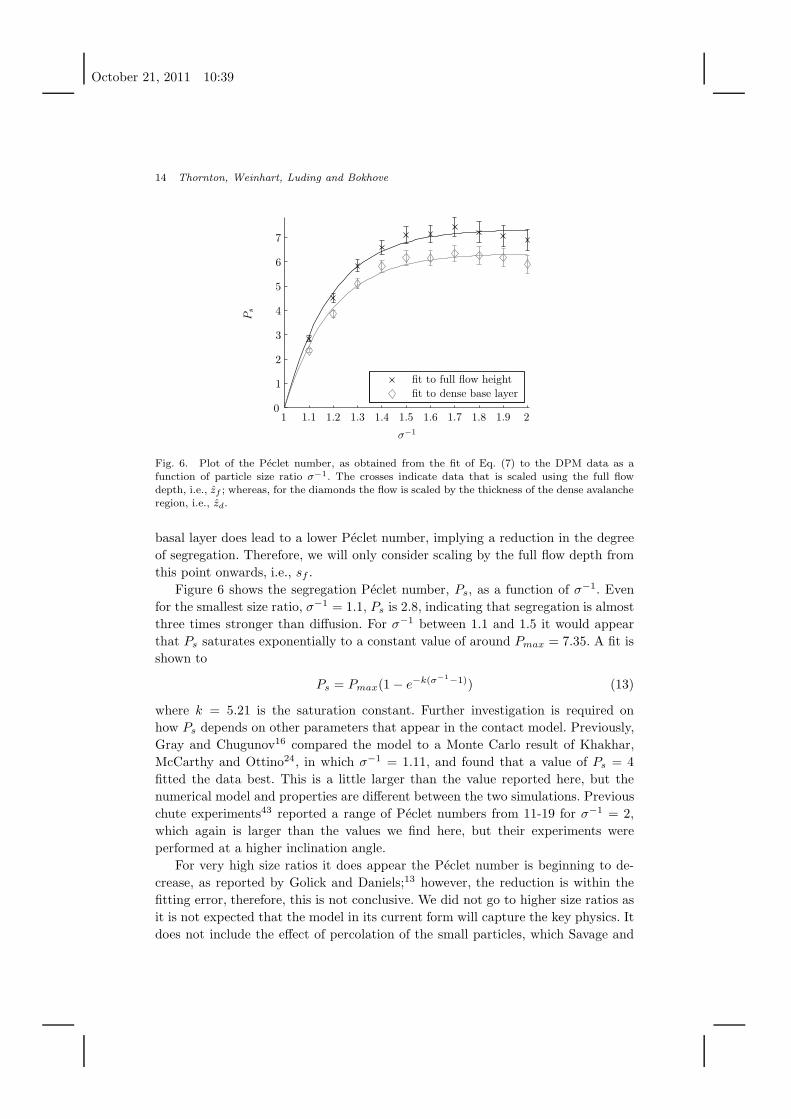
Fig. 6. Plot of the Peclet number, as obtained from the fit of Eq. (7) to the DPM data as afunction of particle size ratio σ−1. The crosses indicate data that is scaled using the full flowdepth, i.e., zf ; whereas, for the diamonds the flow is scaled by the thickness of the dense avalancheregion, i.e., zd.
basal layer does lead to a lower Peclet number, implying a reduction in the degree
of segregation. Therefore, we will only consider scaling by the full flow depth from
this point onwards, i.e., sf .
Figure 6 shows the segregation Peclet number, Ps, as a function of σ−1. Even
for the smallest size ratio, σ−1 = 1.1, Ps is 2.8, indicating that segregation is almost
three times stronger than diffusion. For σ−1 between 1.1 and 1.5 it would appear
that Ps saturates exponentially to a constant value of around Pmax = 7.35. A fit is
shown to
Ps = Pmax(1− e−k(σ−1−1)) (13)
where k = 5.21 is the saturation constant. Further investigation is required on
how Ps depends on other parameters that appear in the contact model. Previously,
Gray and Chugunov16 compared the model to a Monte Carlo result of Khakhar,
McCarthy and Ottino24, in which σ−1 = 1.11, and found that a value of Ps = 4
fitted the data best. This is a little larger than the value reported here, but the
numerical model and properties are different between the two simulations. Previous
chute experiments43 reported a range of Peclet numbers from 11-19 for σ−1 = 2,
which again is larger than the values we find here, but their experiments were
performed at a higher inclination angle.
For very high size ratios it does appear the Peclet number is beginning to de-
crease, as reported by Golick and Daniels;13 however, the reduction is within the
fitting error, therefore, this is not conclusive. We did not go to higher size ratios as
it is not expected that the model in its current form will capture the key physics. It
does not include the effect of percolation of the small particles, which Savage and
October 21, 2011 10:39
Modelling of particle size segregation: calibration using the discrete particle method 15
Lun37 reported needs to be taken into account for values of σ−1 > 2.
6. Conclusions
In summary, we have presented a DPM study of how the Peclet number, Ps, the
ratio of particle size-segregation strength to diffusion, depends on the size ratio
of the particles. Previously, only a fit to a single simulation had been reported.16
These DPM simulations were compared with theoretical predictions, but only for
steady-states; to a previous Monte-Carlo simulation; and, to experiments.
The main findings of this paper are: (i) To get strong segregation and steady
profiles it was necessary to ‘turn on’ the rotational degrees of freedom. This was done
by introducing a tangential sliding friction model; however, only adding tangential
dissipation produced very similar results. (ii) As expected, Ps does increase for
larger particle size ratio σ−1, but appears to saturate to a constant value. (iii)
The results of the DPM were compared to the binary segregation-remixing model
of Gray and Chugunov16; the agreement was good given the model only has one
free fitting parameter, Ps. The major difference between the model and DPM is
the slight asymmetry in the segregation, with a thick pure phase of large particles
forming at the top; but, only a thin perfectly pure layer of small particles appearing
at the base of the flow. The weaker segregation found at the base has previously
been observed in experiments and this effect could be captured in the model, by
introducing diffusion that is a function of the fluctuation energy of the flow. It is
known36 that the fluctuation energy is stronger towards the base and almost zero
at the free surface. Additionally, a small change in the bulk centre of mass was
observed between the homogeneous and the segregated state; again this effect is
not included in the continuum model. However, it could be incorporated in the
three-phase version of Thornton, Gray and Hogg41 as this explicitly models the air
phase and hence, can be extended to allow the bulk granular volume fraction to
vary in height and evolve with time. Hence, in the future we aim to use the results
of DPM simulations to improve the continuum model.
Further investigations are required to determine how the degree of segregation
depends on the parameters of the DPM. Since only steady-state profiles were con-
sidered, it was only possible to ascertain the ratio of the strength of the diffusion to
the strength of the segregation. To measure these two effects independently time-
evolving profiles must be considered, this requires a better procedure to produce the
initial configurations. Additionally, the DPM has highlighted two aspects that are
not captured by the continuum model: the compaction effect and the asymmetry in
the segregation depth profiles.
We have taken the contact model properties of the large and small particles
to be the same, i.e., kn, γn, kt, γt and µ; however, to gain closer agreement with
the experiments it may be better to assume the material properties are equal for
both particle types, i.e., bulk modulus, coefficient of restitution, etc. and hence the
contact properties become size dependent. Finally, this research has shown that
October 21, 2011 10:39
16 Thornton, Weinhart, Luding and Bokhove
DPM can be used to check and validate the assumptions of continuum segregation
models.
Acknowledgements
The authors would like to thank the Institute of Mechanics, Processes and Control,
Twente (IMPACT) for its financial support. The research presented is part of the
STW project ‘Polydispersed Granular Flows through Inclined Channels’.
References
1. M. Alam, L. Trujillo, and H. Herrmann. Hydrodynamic theory for reverse brazil nutsegregation and the non-monotonic ascension dynamics. Journal of Statistical Physics,124:587–623, 2006. 10.1007/s10955-006-9078-y.
2. M. P. Allen and D. J. Tildesley, editors. Computer simulation of liquids. 1993.3. M. Babic. Average balance equations for granular materials. Int. J. Eng. Science,
35(5):523–548, 1997.4. J. Bridgewater. Fundamental powder mixing mechanisms. Power Tech., 15:215–236,
1976.5. P. W. Cleary, M. D. Sinnott, and R. D. Morrison. Separation performance of double
deck banana screens – part 2: Quantitative predictions. Miner. Eng., 22(14):1230–1244, 2009.
6. M. H. Cooke and J. Bridgwater. Interparticle percolation: a statistical mechanicalinterpretation. Ind. Eng. Chem. Fundam., 18(1):25–27, 1979.
7. P. A. Cundall and O. D. L. Strack. A discrete numerical model for granular assemblies.Geotechnique, 29(47–65), 1979.
8. S. Dippel and S. Luding. Simulations on size segregation: Geometrical effects in theabsence of convection. J. Physics. I France, 5:1527–1537, 1995.
9. V. N. Dolgunin and A. A. Ukolov. Segregation modelling of particle rapid gravity flow.Powder Tech., 83(2):95–103, 1995.
10. J. A. Drahun and J. Bridgewater. The mechanisms of free surface segregation. Powd.Tech., 36:39–53, 1983.
11. E. E. Ehrichs, H. M. Jaeger, G. S. Karczmar, J. B. Knight, V. Y. Kuperman, andS. R. Nagel. Granular convection observed by magnetic-resonance-imaging. Science,267(5204):1632–1634, 1995.
12. I. Goldhirsch. Stress, stress asymmetry and couple stress: from discrete particles tocontinuous fields. Granular Matter, 12(3):239–252, 2010.
13. L. A. Golick and K. E. Daniels. Mixing and segregation rates in sheared granularmaterials. Phys. Rev. E, 80:042301, Oct 2009.
14. J. M. N. T. Gray. Granular flow in partially filled slowly rotating drums. J. Fluid.
Mech., 44:1–29, 2001.15. J. M. N. T. Gray and C. Ancey. Multi-component particle-size segregation in shallow
granular avalanches. J. Fluid Mech., 678:535–588, 2011.16. J. M. N. T. Gray and V. A. Chugunov. Particle-size segregation and diffusive remixing
in shallow granular avalanches. J. Fluid Mech., 569:365–398, 2006.17. J. M. N. T. Gray, M. Shearer, and A. R. Thornton. Time-dependent solution for
particle-size segregation in shallow granular avalanches. Proc. Royal Soc. A, 462:947–972, 2006.
18. J. M. N. T. Gray and A. R. Thornton. A theory for particle size segregation in shallowgranular free-surface flows. Proc. Royal Soc. A, 461:1447–1473, 2005.
October 21, 2011 10:39
Modelling of particle size segregation: calibration using the discrete particle method 17
19. D. C. Hong, P. V. Quinn, and Luding S. Reverse brazil nut problem: Competitionbetween percolation and condensation. Phys. Rev. Lets., 86(15):3423–3426, 2001.
20. J. T. Jenkins. Particle segregation in collisional flows of inelastic spheres. In Herrmann,Hovi, and Luding, editors, Physics of dry granular media, NATO ASI series, pages645–658. Kluwer, 1998.
21. J. T. Jenkins and D. K. Yoon. Segregation in binary mixtures under gravity. Phys.Rev. Lett., 88(19):1, May 2002.
22. W.R. Ketterhagen, T. A. Ende, and B. C. Hancock. Process modeling in the phar-maceutical industry using the discrete element method. J. Phar. Sci., 98(2):442–470,2008.
23. D. V. Khakhar, J. J. McCarthy, and J. M. Ottino. Radial segregation of granularmixtures in rotating cylinders. Phys. Fluids, 9(12):3600–3614, 1997.
24. D. V. Khakhar, J. J. McCarthy, and J. M. Ottino. Mixing and segregation of granularmaterials in chute flows. Chaos, 9:594–610, 1999.
25. J. Li, C. Webb, S. S. Pandiella, and G. M. Campbell. Discrete particle motion onsieves–a numerical study using the dem simulation. Powder Technol., 133(1-3):190–202, 2003.
26. S. Luding. Introduction to discrete element methods DEM: Basics of contact forcemodels and how to perform the micro-marco transition to continuum theory. Euro. J.of Enviro. Civ. Eng., 12(7-8):785–826, 2008.
27. B. Marks and I. Einav. A cellular automaton for segregation during granularavalanches. Granular Matter, 13:211–214, 2011.
28. L. B. H. May, L. A. Golick, K. C. Phillips, M. Shearer, and K. E. Daniels. Shear-driven size segregation of granular materials: Modeling and experiment. Phys. Rev. E,81:051301, May 2010.
29. L. B. H. May, M. Shearer, and K. E. Daniels. Scalar conservation laws with non-constant coefficients with application to particle size segregation in granular flow.Nonlinear Science, 20:689–707, 2010.
30. S. McNamara and S. Luding. A simple method to mix granular materials. In Rosato. A.D. and D. L. Blackmore, editors, Segregation in granular flows, IUTAM symposium,pages 305–310. Kluwer Academic Publishers, 2000.
31. G. Metcalfe, T. Shinbrot, J.J McCarthy, and J. M. Ottino. Avalanche mixing of gran-ular solids. Nature, 374(2):39–41, March 1995.
32. G. V. Middleton. Experimental studies related to problems of flysch sedimentation.In J. Lajoie, editor, Flysch Sedumentology in North America, pages 253–272. Toronto: Business and Economics Science Ltd, 1970.
33. H. Mio, S. Komatsuki, M. Akashi, A. Shimosaka, Y. Shirakawa, J. Hidaka, M. Kad-owaki, S. Matsuzaki, and K. Kunitomo. Validation of particle size segregation of sin-tered ore during flowing through laboratory-scale chute by discrete element method.ISIJ International, 48(12):1696–1703, 2008.
34. H. Mio, S. Komatsuki, M. Akashi, A. Shimosaka, Y. Shirakawa, J. Hidaka, M. Kad-owaki, H. Yokoyama, S. Matsuzaki, and K. Kunitomo. Analysis of traveling behaviorof nut coke particles in bell-type charging process of blast furnace by using discreteelement method. ISIJ International, 50(7):1000–1009, 2010.
35. T. Mullin. Coarsening of self-organised clusters in binary particle mixtures. Phys. Rev.Lett., 84:4741, 2000.
36. O. Pouliquen and Y. Forterre. Friction law for dense granular flows: application to themotion of a mass down a rough inlined plane. J. Fluid Mech., 453:131–151, 2002.
37. S. B. Savage and C. K. K. Lun. Particle size segregation in inclined chute flow of drycohesionless granular material. J. Fluid Mech., 189:311–335, 1988.
October 21, 2011 10:39
18 Thornton, Weinhart, Luding and Bokhove
38. M. Shearer, J. M. N. T. Gray, and A. R. Thornton. Stable solutions of a scalar conser-vation law for particle-size segregation in dense granular avalanches. Europ. J. Appl.
Math., 19:61–86, 2008.39. T. Shinbrot, A. Alexander, and F. J. Muzzio. Spontaneous chaotic granular mixing.
Nature, 397(6721):675–678, Febuary 1999.40. A. R. Thornton. A study of segregation in granular gravity driven free surface flows.
PhD thesis, University of Manchester, 2005.41. A. R. Thornton, J. M. N. T. Gray, and A. J. Hogg. A three phase model of segregation
in shallow granular free-surface flows. J. Fluid Mech., 550:1–25, 2006.42. J. W. Vallance and S. B. Savage. Particle segregation in granular flows down chutes.
In A.D. Rosato and D.L. Blackmore, editors, IUTAM Symposium on Segregation in
Granular Flows, pages 31–51. Kluwer Academic Publishers, 2000.43. S. Weiderseiner, N. Andreini, G. Epely-Chauvin, G. Moser, M. Monnereau, J .M .N .T
Gray, and C. Ancey. Experimental investigation into segregating granular flow downchutes. Phys. Fluids, 23(013301), 2011.
44. T. Weinhart, A. R. Thornton, S. Luding, and O. Bokhove. Closure relations for shallowgranular flows from particle simulations. Submitted to Granular Matter.
45. T. Weinhart, A. R. Thornton, S. Luding, and O. Bokhove. From discrete particles tocontinuum fields near a boundary. Submitted to Granular Matter.
46. Y. Yu and H. Saxen. Experimental and DEM study of segregation of ternary sizeparticles in a blast furnace top bunker model. Chem. Eng. Sci., 65(18):5237–5250,2010.
47. J. Zhang, Z. Hu, W. Ge, Y. Zhang, T. Li, and J. Li. Application of the discreteapproach to the simulation of size segregation in granular chute flow. Ind. Eng. Chem.
Res., 43(18):5521–5528, 2004.