tryptophan metabolism and oxidative stress in patients with huntington's disease
TRANSCRIPT
Tryptophan metabolism and oxidative stress in patients withHuntington’s disease
N. Stoy,* G. M. Mackay,� C. M. Forrest,� J. Christofides,� M. Egerton,� T. W. Stone�and L. G. Darlington§
*Royal Hospital for Neuro-Disability, Putney, London, UK
�Institute of Biomedical & Life Sciences, University of Glasgow, Glasgow, UK
�West Park Biochemistry Laboratories and §Department of Rheumatology, Epsom General Hospital, Epsom, Surrey, UK
Abstract
Abnormalities in the kynurenine pathway may play a role in
Huntington’s disease (HD). In this study, tryptophan depletion
and loading were used to investigate changes in blood
kynurenine pathway metabolites, as well as markers of
inflammation and oxidative stress in HD patients and healthy
controls. Results showed that the kynurenine : tryptophan
ratio was greater in HD than controls in the baseline state and
after tryptophan depletion, indicating increased indoleamine
dioxygenase activity in HD. Evidence for persistent inflam-
mation in HD was provided by elevated baseline levels of
C-reactive protein, neopterin and lipid peroxidation products
compared with controls. The kynurenate : kynurenine ratio
suggested lower kynurenine aminotransferase activity in
patients and the higher levels of kynurenine in patients at
baseline, after depletion and loading, do not result in any
differences in kynurenic acid levels, providing no supportive
evidence for a compensatory neuroprotective role for kynur-
enic acid. Quinolinic acid showed wide variations in blood
levels. The lipid peroxidation data indicate a high level of
oxidative stress in HD patients many years after disease
onset. Levels of the free radical generators 3-hydroxykynur-
enine and 3-hydroxyanthranilic acid were decreased in HD
patients, and hence did not appear to contribute to the oxi-
dative stress. It is concluded that patients with HD exhibit
abnormal handling of tryptophan metabolism and increased
oxidative stress, and that these factors could contribute to
ongoing brain dysfunction.
Keywords: Huntington’s disease, kynurenine, kynurenic
acid, oxidative stress, quinolinic acid, tryptophan.
J. Neurochem. (2005) 93, 611–623.
Huntington’s disease (HD) is an autosomal dominant disor-der characterized by neuronal loss in the striatum andneocortex. Its clinical phenotype includes motor and psychi-atric manifestations with an inexorable decline in cognitivefunction, resulting in the progressive development of choreicmovements and, in its later stages, dementia. While geneticstudies have indicated the probable involvement of a 349-kDa protein, huntingtin, bearing an abnormally expandedseries of glutamine residues close to its N-terminus, therelationship between this protein and neuronal damageremains the subject of intense investigation (Kuemmerleet al. 1999; Bates 2003).
Schwarcz and colleagues (Coyle and Schwarcz 1976;Schwarcz et al. 1984) were among the first to propose thatthe excitotoxic actions of glutamate receptor agonists couldprovide a model for neurodegenerative disorders such as HD.The discovery that quinolinic acid was an endogenousagonist at N-methyl-D-aspartate (NMDA) receptors (Stone
and Perkins 1981; Stone 2001; Stone and Darlington 2002)producing excitotoxic lesions after localized injection(Schwarcz et al. 1983) while kynurenic acid was an antag-onist (Perkins and Stone 1982) which led to hypotheses thatthese compounds, or the ratio between them, might contrib-
Received October 15, 2004; revised manuscript received December 14,2004; accepted December 14, 2004.Address correspondence and reprint requests to T. W. Stone, West
Medical Building, University of Glasgow, Glasgow G12 8QQ, UK.E-mail: [email protected] used: CRP, C-reactive protein; ELISA, enzyme-linked
immunosorbent assay; ESR, erythrocyte sedimentation rate; 3-HAO, 3-hydroxyanthranilate:oxygen 3,4-oxidoreductase; HD, Huntington’s dis-ease; HPLC, high-performance liquid chromatography; IDO, indoleam-ine-2,3-dioxygenase; indole-decyclizing, indoleamine:oxygen 2,3-dioxygenase; MTBSTFA, N-methyl-N-(tert-butyldimethylsilyl)trifluoro-acetamide; NMDA, N-methyl-D-aspartate; TBDMCS, tert-butyldimethylchlorosilane; tBDMS, t-butyldimethylsilyl; TDO, tryptophan-2,3-dioxygenase.
Journal of Neurochemistry, 2005, 93, 611–623 doi:10.1111/j.1471-4159.2005.03070.x
� 2005 International Society for Neurochemistry, J. Neurochem. (2005) 93, 611–623 611

ute to the neuronal dysfunction of HD. The administration ofquinolinic acid directly into the rodent striatum reproducesmany of the neurochemical changes which have beendescribed in the HD brain (Beal et al. 1986, 1991), leadingto the widespread use of quinolinic acid lesions as anexperimental model for the disease (Schwarz et al. 1992;Popoli et al. 1994; Hughes et al. 1999). The fidelity of thequinolinic acid model is increased by localized administra-tion into the posterior putamen of non-human primates(Burns et al. 1995).
There is now strong evidence that an overexpression of theabnormal huntingtin gene contributes to the induction of HDsymptoms in humans and to the striatal characteristics of HDin mouse models (Carter et al. 1999; Sathasivam et al. 1999;Usdin et al. 1999), so it is intriguing that administration ofquinolinic acid into the striatum can induce an increasedexpression of huntingtin (Tatter et al. 1995), raising ques-tions about which comes first. Perhaps a primary toxicitycaused by kynurenine metabolites could induce huntingtin asthe cytoprotective response postulated by some authors(Kuemmerle et al. 1999; Bates 2003).
Both quinolinic acid and kynurenic acid are part of thekynurenine pathway – a major route accounting for themetabolism of over 90% of the non-protein tryptophan in mosttissues. The quantification of various kynurenine pathwaymetabolites (Fig. 1) has revealed many other examples ofpathway alterations inHD. The levels of kynurenic acid appearto be decreased in post-mortem HD brain (Beal et al. 1992;Jauch et al. 1995), with an increased ratio of kynurenine tokynurenic acid (Beal et al. 1990). Activity of the enzyme3-hydroxyanthranilic acid oxygenase (3-HAO; 3-hydroxy-anthranilate:oxygen 3,4-oxidoreductase; EC1.13.11.6), whichconverts 3-hydroxyanthranilic acid into quinolinic acid, isincreased in HD striatum (Schwarcz et al. 1988). There is alsoan increased level of 3-hydroxykynurenine in the putamen,frontal and temporal cortex of post-mortem HD which is notfound in the brains of Alzheimer’s disease patients (Pearsonand Reynolds 1992; Guidetti et al. 2000). This compoundproduces neuronal damage, largely by generating free radicalspecies such as hydrogen peroxide which induce cell apoptosisas a result of oxidative stress (Eastman and Guilarte 1989,1990; Nakagami et al. 1996; Okuda et al. 1996, 1998).
Despite the varied evidence for an alteration of kynureninepathway intermediates in the HD brain, all previous studieshave relied on static measurements of metabolite concentra-tions, often in post-mortem tissue. In contrast, this study hasexamined the kynurenine pathway activity under thedynamic conditions of tryptophan depletion and loading ina series of patients with HD compared with normal healthycontrols. We have in addition examined the levels of theinflammatory marker neopterin, the CNS inflammationmarker S100B, which is a protein released from astroglialcells, and of the lipid peroxidation products malondialdehydeand 4-hydroxynonenal as markers of oxidative stress.
Methods
Patients
Eleven patients (three men, eight women) and 15 healthy subjects
(four men, 11 women) acting as controls were recruited from the
Royal Hospital for Neuro-Disability and completed the full
experimental protocol described below. All the patients were at a
very advanced stage of HD and in a state of severe disability
requiring their permanent hospitalization in the Royal Hospital for
Neuro-disability. The numbers of subjects exclude three patients and
three controls who consumed less than 80% of the tryptophan-
depleting or -loading mixtures, or who vomited within 2 h of their
consumption. All subjects were between 18 and 65 years of age and
any patient or control taking any drug which was known to interfere
with tryptophan metabolism was excluded. Patients were recruited
after obtaining ethical permission both from the Ethical Committee
of the Epsom and St Helier University Hospitals NHS Trust and
NH
NH2
COOH
NH
O
NH2
COOH
N COOH
OH
N COOH
OH
OH
CHO
N
COOH
COOH
NH2
O
NH2
COOH
NH2
OH
NH2
COOHO
NH2
COOH
OH
OHCHOOC
COOH
NH2N COOH
N COOH
OH
tryptophan
xanthurenic acid
formylkynurenine
kynurenic acid
tryptophan-2,3-dioxygenase(TDO)
kynurenine
kynurenine aminotransferase (KAT)
quinolinic acid
3-hydroxykynurenine
3-hydroxy-anthranilic acid
kynurenine-3-hydroxylase
3-hydroxyanthranilic acid oxygenase (3HAO)
picolinicacid
glutaryl CoA
NAD
kynureninase
quinolinic acidphosphoribosyltransferase (QPRT)
indoleamine-2,3-dioxygenase(IDO)
kynurenineformamidase
8-hydroxyquinaldic acid
Fig. 1 A summary of the kynurenine pathway. Kynurenine-3-mon-
oxygenase: EC 1.14.13.9 (kynurenine-3-hydroxylase) kynurenine
2-oxoglutarate transaminase: EC 2.6.1.7 (KAT) L-kynurenine hydrol-
ase: EC 3.7.1.3 (kynureninase) tryptophan 2,3-dioxygenase: EC
1.13.11.11 (TDO) indoleamine:oxygen 2,3-dioxygenase (indole-
decyclizing): EC 1.13.11.42 (IDO) 3-hydroxyanthranilate:oxygen 3,4-
oxidoreductase: EC 1.13.11.6 (3-HAO).
612 N. Stoy et al.
� 2005 International Society for Neurochemistry, J. Neurochem. (2005) 93, 611–623

from the Riverside Ethical Committees of the Royal Hospital for
Neuro-Disability. Informed written consent was obtained from all
subjects or their next of kin.
All subjects were fasted overnight. Baseline blood samples were
taken through a ‘Butterfly’ cannula, and then the subjects consumed
an amino acid mixture (100 g) containing all essential amino acids,
except tryptophan. This mixture is known to induce protein
synthesis (Moja et al. 1991), leading to a depletion of plasma
tryptophan levels by 80–90% (Young et al. 1988b). Further bloodsamples were taken at 5 and 7 h after ingestion of the amino acid
mixture, i.e. when the plasma tryptophan levels were expected to
reach their lowest levels. Subjects then resumed a normal tryptophan
diet. After fasting overnight, another resting blood sample was taken
24 h after the original baseline, and a tryptophan-loading dose (6 g)
was given. Both tryptophan-depleting and -loading doses were taken
orally as fruit-flavoured solutions. Blood samples were again taken 5
and 7 h after tryptophan loading (Heuther et al. 1992). Dietary
intake throughout the study remained isocaloric and both quantita-
tively and qualitatively similar to normal for each subject. All
subjects were closely monitored by a physician throughout the
study. Blood samples were protected from light, centrifuged and
plasma and serum removed and frozen within 2 h of venesection.
Samples were maintained at ) 80�C until analysis.
Analysis of tryptophan metabolites
Samples of plasma were analysed by high-performance liquid
chromatography (HPLC), to quantify the levels of six major
components of the kynurenine pathway – tryptophan, kynurenine,
kynurenic acid, 3-hydroxykynurenine, 3-hydroxyanthranilic acid
and xanthurenic acid. The methods have been based on the report by
Herve et al. (1996) with a number of modifications to improve peak
separation and sensitivity. During sample preparation, plasma
samples were kept on ice. To 480 lL plasma, 20 lL of internal
standard (1.2 mM 3-nitro-L-tyrosine) was added, followed by 50 lL4 M perchloric acid. Samples were vortexed for 30 s immediately
after acid addition, centrifuged at 5000 g for 10 min at 4�C, and the
supernatant collected. The precipitated proteins were resuspended in
150 lL water and 50 lL 4 M perchloric acid, the mixture vortexed
for 30 s and centrifuged at 5000 g for 10 min at 4�C. Again the
supernatant was collected. This washing and centrifugation step was
repeated and the supernatants combined. The combined supernatants
were split into two samples, one for analysis using UV/fluorescence
detection and the other for analysis using electrochemical detection.
Extracted samples were kept at ) 40�C prior to analysis. To
determine whether any metabolite was lost during the extraction
process, a spike of mixed standard solution was added to a plasma
sample before extraction. Three plasma samples were used, each
spiked at three different concentrations of mixed standard. Recov-
eries from a test batch of nine samples were > 90% for tryptophan,
kynurenine and kynurenic acid, 84% ± 7.0 (mean ± SD) for
3-hydroxykynurenine, 76% ± 8.8 (mean ± SD) for 3-hydroxyanth-
ranilic acid and 82% ± 6.9 (mean ± SD) for xanthurenic acid.
Mixed standard solutions, containing various amounts of each
standard, were prepared from frozen concentrated standard solutions.
Internal standard solution and 4 M perchloric acid were added to the
standard solutions, to ensure their compositions were comparable
with the sample extracts. Calibration curves were prepared from
chromatogram peak areas of these mixed standard solutions. For the
chromatograms at 250 nm and 365 nm, the internal standard was
included in the calibration curves and in quantifying the samples.
This compensates for any loss in recovery of the metabolites during
sample extraction. For fluorescence detection and electrochemical
detection, quantified results were later corrected for recovery, using a
recovery factor calculated from the results at 365 nm. Standard
solutions were also analysed after each block of 10 runs to check for
any drift in the retention times of the metabolites.
Defrosted sample supernatants and freshly diluted standards were
filtered through Whatman VectaSpin Micro Anopore tubes (What-
man International, Maidstone, Kent) using centrifugation at 3500 gfor 5 min at 4�C. Filtered samples and standards were kept at 4�C in
an autosampler. A volume of 100 lL was normally injected on to
the HPLC column.
Isocratic reversed-phase HPLC was performed at 37�C, using a
Waters HPLC system (Waters, Milford, MA, USA). For tryptophan,
kynurenine and kynurenic acid determination, separation was
achieved using a Kingsorb C18 column (250 · 4.6 mm ID, particle
size 5 lm, Phenomenex, Macclesfield, UK) and the detection system
included both a Waters 2487 dual wavelength UV detector (250 nm
and 365 nm) and a Waters 474 fluorescence detector, connected in
series. The mobile phase, pumped at a flow rate of 1 mL/min, was
50 mM acetic acid, 100 mM zinc acetate containing 3% acetonitrile,
based on the composition described by Herve et al. (1996). Zincacetate was included in the mobile phase as it significantly enhances
the fluorescence of kynurenic acid (Shibata 1988). Tryptophan was
determined by UV detection at a wavelength of 250 nm and
kynurenine was detected at 365 nm. Kynurenic acid was determined
by fluorescence detection (excitation 344 nm, emission 390 nm).
For 3-hydroxykynurenine, 3-hydroxyanthranilic acid and xan-
thurenic acid, separation was with a Synergi Hydro-RP 80 A column
(250 · 4.6 mm ID, particle size 4 lm; Phenomenex, Macclesfield,
UK) and detection with a Waters Concorde electrochemical detector
at an oxidation voltage of 0.65 V. The mobile phase, at a flow rate of
1 mL/min, was 50 mM phosphoric acid, 50 mM citric acid, 60 lMEDTA, 8 mM heptane sulfonic acid, 2 mM sodium chloride, with the
pH adjusted to 3.1 with potassium hydroxide, and completed by the
addition of 5% methanol.
The limits of detection using an injection volume of 100 lL and a
signal-to-noise threshold of 3, were tryptophan 20 pmol, kynurenine
5 pmol, kynurenic acid 0.2 pmol, 3-hydroxykynurenine 3 pmol,
3-hydroxyanthranilic acid 3 pmol and xanthurenic acid 2 pmol.
Levels of quinolinic acid were measured by GC/MS of the
t-butyldimethylsilyl (tBDMS) derivative, after sample cleanup using
solid phase extraction. To 1 mL plasma, 100 lL of the internal
standard (10 lM dipicolinic acid) and 2 mL 0.02 M acetate buffer
pH 2.0–2.2 was added. A Waters SepPak Vac C18 (500 mg, 3 mL)
cartridge was conditioned with 1 mL 0.5 M HC1 and successively
washed with 5 mL methanol, 2 mL water and 2 mL 0.02 M acetate
buffer pH 2.0–2.2. The sample was applied to the pre-treated
cartridge. The cartridge was then washed with 2 mL water, followed
by 2 mL hexane and dried before eluting quinolinic acid with
3 · 2 mL 2% ammonia in methanol. Then, 50 lL of 2 lg/mL
prazepam in ethanol was added to the quinolinic acid extract as an
extra recovery standard and the mixture dried. The dried extract was
mixed with 0.5 mL methanol and again dried. 20 lL of deriva-
tizing agent, N-methyl-N-(tert-butyldimethylsilyl)trifluoroacetamide
(MTBSTFA) + 1% tert-butyldimethylchlorosilane (TBDMCS) was
Kynurenines and Huntington’s disease 613
� 2005 International Society for Neurochemistry, J. Neurochem. (2005) 93, 611–623
added and the sample incubated for 2 h at 90�C, as described in the
method by Dobbie and Surtees (1997). The derivatized extract was
analysed by GC/MS using a Thermo GC8000 and MD800
quadrupole mass detector. A 1 lL sample was injected using
splitless injection at 190�C on to a 30-m · 0.2 mm RTX5 GC
column. The GC oven temperature was increased from 120�C to
230�C over 5 min followed by a rise to 260�C over 16 min. The
detector, using electron impact at 70 eV, was set to maximum voltage
monitoring ions at m/z of 338.1 and 380.1 with a dwell time of 0.3 s.
The limit of sensitivity was 10 nmol/L, with between-batch
reproducibility (based on repeat assays of spiked samples of human
serum) of < 15% at 250 nmol/L and < 10% at 800 nmol/L. The
standard curve was linear over the range 12–2500 nmol/L (r2 ¼0.999), but a quadratic curve fit was used to all batches to compensate
for any loss of linearity with GC column ageing.
Standard clinical assays
Erythrocyte sedimentation rate (ESR) was measured by a Starrsed
Automated ESR machine (Vitech Scientific, Partridge Green, UK)
which utilizes the method recommended by the International Council
for Standardization in International Council for Standardization in
Haematology 1933), based on the method of Westergren (1921).
C-reactive protein (CRP) was measured using a Behring Turbitimer.
Neopterin assay
Neopterin levels were measured in 10 lL aliquots of serum using an
immunoassay kit (Immunobiological Laboratories, Hamburg, Ger-
many). All samples were analysed in duplicate. The assay was a
competitive enzyme-linked immunosorbent assay (ELISA) where a
peroxidase-conjugated and a non-conjugated antigen competed for a
fixed number of antibody binding sites. Following incubation with
substrate solution, colour developed and the optical density was read
at 450 nm in an automated plate-reader, unknowns being quantified
by reference to known standards.
Lipid peroxidation products
An aliquot of 100 lL of serum was used for quantifying the
concentrations of the lipid peroxidation products malondialdehyde
and 4-hydroxynonenal measured using a Bioxytech LPO-586 colori-
metric assay (Biostat, Stockport, UK). The analysis involved the
reaction of N-methyl-2-phenylindole with these peroxidation productsto form a stable chromogenic indolic dimer which was estimated
spectrophotometrically at 586 nm.All sampleswere tested in duplicate.
S100B assay
S100B was measured in 50-lL aliquots of serum using a commercial
ELISA (Sangtec 100 ELISA, DiaSoria, Stillwater, MN, USA).
Standards, controls and unknown samples were incubated with a
detection antibody conjugated with horseradish peroxidase. Follow-
ing incubation in microtitre plates, the wells were washed and
incubated with a tetramethylbenzidine substrate for a further 15 min.
The enzyme reaction was stopped by the addition of tetram-
ethylbenzidine stop solution and absorbance measured at 450 nm.
Statistical analyses
A repeated measures ANOVA, followed by a Student–Newman–Keuls
multiple comparison post-test, was used when comparing
measurements from the same patients or control subjects at different
time points during the depletion or loading protocols. Comparison of
original baseline andbaseline 24 h after depletion for the samepatients
or control subjects was determined using a paired two-tailed t-test.Comparisons between patients and controls were made using an
unpaired two-tailed t-test. To overcome any masking of significant
differences due to the natural variability between human subjects,
we have also calculated the percentage changes in tryptophan
metabolites from baseline levels for individual subjects. The mean
percentage changes for control subjects and patients with HD have
then been compared at each time point using a two-tailed t-test.Results are only included in the text when they provide additional
information to that obtained from the raw data. In all cases a
significance threshold of 5% (p < 0.05) was employed.
Cross-correlations were assessed by using a correlation matrix of
all combinations of parameters, which yielded the Pearson correla-
tion coefficient and its probability level. Many of the positive
significant correlations observed were those expected on simple
biochemical grounds, such as between the levels of all the tryptophan
metabolites across the various time points of the tryptophan depletion
and loading protocols. Results are quoted only for correlations which
could not be easily predicted and which may have implications for
understanding the biology of the kynurenines.
Results
ESR and CRP
The baseline CRP level in patients with HD was5.24 ± 0.87 mg/dL (n ¼ 11), significantly higher than incontrol subjects (2.00 ± 0.73 mg/dL; n ¼ 15; p < 0.01). Thebaseline ESR level in patients was 19.7 ± 5.1 mm/h (n ¼ 11)which was not significantly different from controls(11.7 ± 2.6 mm/h, n ¼ 15). In patients with HD there wasa significant correlation between ESR and age (p < 0.001)and between ESR and CRP (p < 0.05).
Neopterin
Baseline levels of neopterin in patients with HD were4.70 ± 0.45 ng/mL (n ¼ 11), significantly higher than incontrol subjects (3.22 ± 0.21 ng/mL, n ¼ 15; p < 0.01).There was a significant correlation between age and baselineneopterin levels (p < 0.01) in HD patients and betweenneopterin and CRP (p < 0.05).
Oxidative stress
Baseline levels of the lipid peroxidation products malondial-dehyde and 4-hydroxynonenal were almost eightfold higher inpatientswithHD (6.98 ± 1.16 ng/mL,n ¼ 11) comparedwithcontrol subjects (0.88 ± 0.09 lM, n ¼ 15; p < 0.001).
S100B
There was no significant difference in baseline levels of thebrain injury marker S100B between control subjects(0.09 ± 0.01 lg/l; n ¼ 15) and patients with HD(0.13 ± 0.02 lg/l; n ¼ 11).
614 N. Stoy et al.
� 2005 International Society for Neurochemistry, J. Neurochem. (2005) 93, 611–623
Tryptophan metabolites
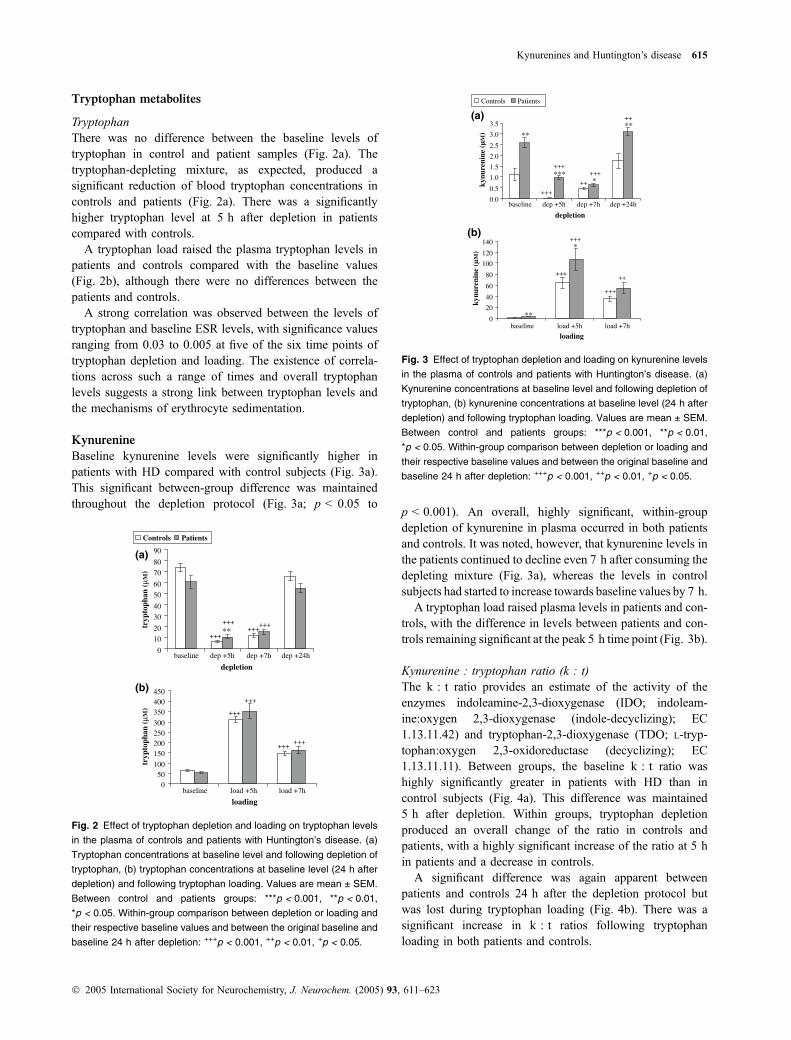
TryptophanThere was no difference between the baseline levels oftryptophan in control and patient samples (Fig. 2a). Thetryptophan-depleting mixture, as expected, produced asignificant reduction of blood tryptophan concentrations incontrols and patients (Fig. 2a). There was a significantlyhigher tryptophan level at 5 h after depletion in patientscompared with controls.
A tryptophan load raised the plasma tryptophan levels inpatients and controls compared with the baseline values(Fig. 2b), although there were no differences between thepatients and controls.
A strong correlation was observed between the levels oftryptophan and baseline ESR levels, with significance valuesranging from 0.03 to 0.005 at five of the six time points oftryptophan depletion and loading. The existence of correla-tions across such a range of times and overall tryptophanlevels suggests a strong link between tryptophan levels andthe mechanisms of erythrocyte sedimentation.
Kynurenine
Baseline kynurenine levels were significantly higher inpatients with HD compared with control subjects (Fig. 3a).This significant between-group difference was maintainedthroughout the depletion protocol (Fig. 3a; p < 0.05 to
p < 0.001). An overall, highly significant, within-groupdepletion of kynurenine in plasma occurred in both patientsand controls. It was noted, however, that kynurenine levels inthe patients continued to decline even 7 h after consuming thedepleting mixture (Fig. 3a), whereas the levels in controlsubjects had started to increase towards baseline values by 7 h.
A tryptophan load raised plasma levels in patients and con-trols, with the difference in levels between patients and con-trols remaining significant at the peak 5 h time point (Fig. 3b).
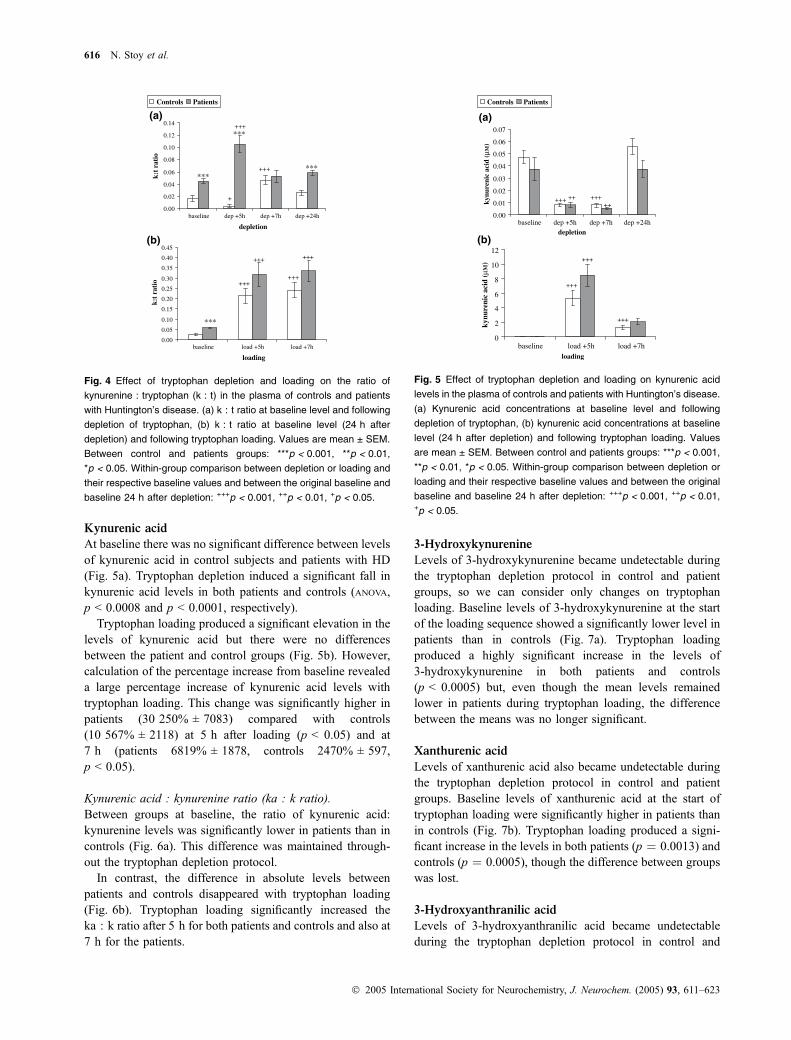
Kynurenine : tryptophan ratio (k : t)The k : t ratio provides an estimate of the activity of theenzymes indoleamine-2,3-dioxygenase (IDO; indoleam-ine:oxygen 2,3-dioxygenase (indole-decyclizing); EC1.13.11.42) and tryptophan-2,3-dioxygenase (TDO; L-tryp-tophan:oxygen 2,3-oxidoreductase (decyclizing); EC1.13.11.11). Between groups, the baseline k : t ratio washighly significantly greater in patients with HD than incontrol subjects (Fig. 4a). This difference was maintained5 h after depletion. Within groups, tryptophan depletionproduced an overall change of the ratio in controls andpatients, with a highly significant increase of the ratio at 5 hin patients and a decrease in controls.
A significant difference was again apparent betweenpatients and controls 24 h after the depletion protocol butwas lost during tryptophan loading (Fig. 4b). There was asignificant increase in k : t ratios following tryptophanloading in both patients and controls.
depletion
0
10
20
30
40
50
60
70
80
90
baseline dep +5h dep +7h dep +24h
tryp
toph
an (
µM)
Controls Patients
(a)
**+++
++++++
+++
loading
050
100
150200250300
350400450
baseline load +5h load +7h
tryp
toph
an (
µM)
(b)
+++
+++
++++++
Fig. 2 Effect of tryptophan depletion and loading on tryptophan levels
in the plasma of controls and patients with Huntington’s disease. (a)
Tryptophan concentrations at baseline level and following depletion of
tryptophan, (b) tryptophan concentrations at baseline level (24 h after
depletion) and following tryptophan loading. Values are mean ± SEM.
Between control and patients groups: ***p < 0.001, **p < 0.01,
*p < 0.05. Within-group comparison between depletion or loading and
their respective baseline values and between the original baseline and
baseline 24 h after depletion: +++p < 0.001, ++p < 0.01, +p < 0.05.
depletion
0.0
0.5
1.0
1.5
2.0
2.5
3.0
3.5
baseline dep +5h dep +7h dep +24h
kynu
reni
ne (
µM
)
Controls Patients
(a)
**
***
**
*+++
++
++++++
++
loading
0
20
40
60
80
100
120
140
baseline load +5h load +7h
kynu
reni
ne (
µM
)
(b)*
**
+++
+++++
+++
Fig. 3 Effect of tryptophan depletion and loading on kynurenine levels
in the plasma of controls and patients with Huntington’s disease. (a)
Kynurenine concentrations at baseline level and following depletion of
tryptophan, (b) kynurenine concentrations at baseline level (24 h after
depletion) and following tryptophan loading. Values are mean ± SEM.
Between control and patients groups: ***p < 0.001, **p < 0.01,
*p < 0.05. Within-group comparison between depletion or loading and
their respective baseline values and between the original baseline and
baseline 24 h after depletion: +++p < 0.001, ++p < 0.01, +p < 0.05.
Kynurenines and Huntington’s disease 615
� 2005 International Society for Neurochemistry, J. Neurochem. (2005) 93, 611–623
Kynurenic acid
At baseline there was no significant difference between levelsof kynurenic acid in control subjects and patients with HD(Fig. 5a). Tryptophan depletion induced a significant fall inkynurenic acid levels in both patients and controls (ANOVA,p < 0.0008 and p < 0.0001, respectively).
Tryptophan loading produced a significant elevation in thelevels of kynurenic acid but there were no differencesbetween the patient and control groups (Fig. 5b). However,calculation of the percentage increase from baseline revealeda large percentage increase of kynurenic acid levels withtryptophan loading. This change was significantly higher inpatients (30 250% ± 7083) compared with controls(10 567% ± 2118) at 5 h after loading (p < 0.05) and at7 h (patients 6819% ± 1878, controls 2470% ± 597,p < 0.05).
Kynurenic acid : kynurenine ratio (ka : k ratio).Between groups at baseline, the ratio of kynurenic acid:kynurenine levels was significantly lower in patients than incontrols (Fig. 6a). This difference was maintained through-out the tryptophan depletion protocol.
In contrast, the difference in absolute levels betweenpatients and controls disappeared with tryptophan loading(Fig. 6b). Tryptophan loading significantly increased theka : k ratio after 5 h for both patients and controls and also at7 h for the patients.
3-Hydroxykynurenine
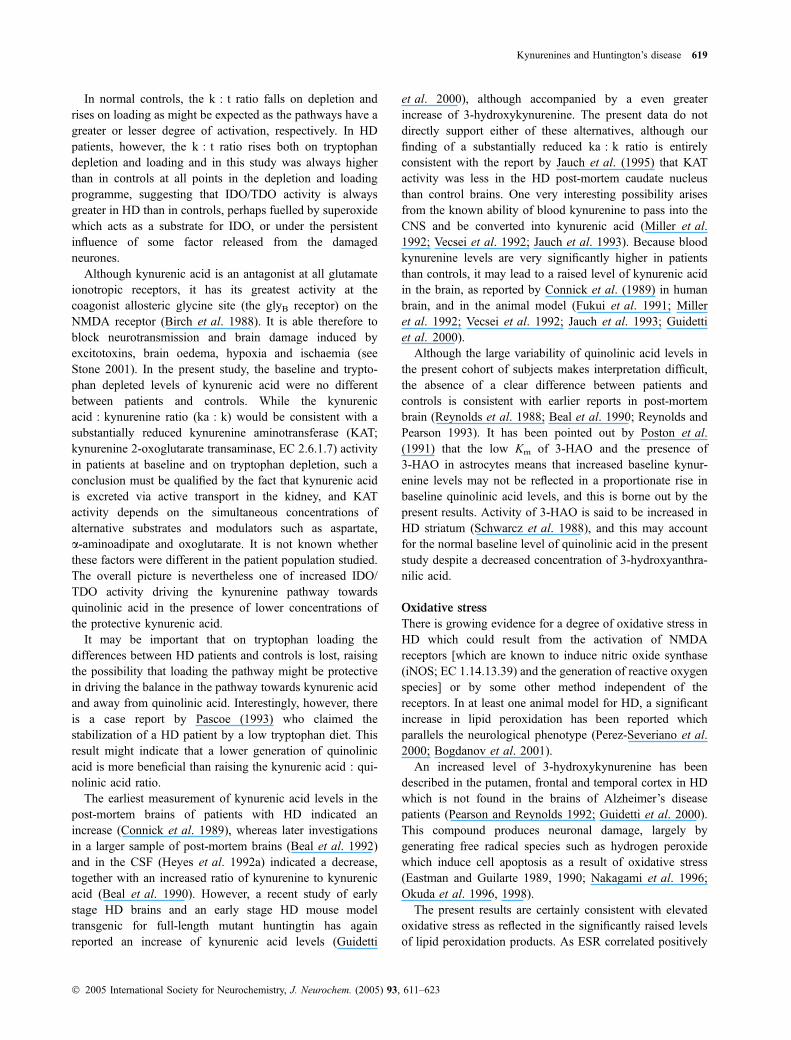
Levels of 3-hydroxykynurenine became undetectable duringthe tryptophan depletion protocol in control and patientgroups, so we can consider only changes on tryptophanloading. Baseline levels of 3-hydroxykynurenine at the startof the loading sequence showed a significantly lower level inpatients than in controls (Fig. 7a). Tryptophan loadingproduced a highly significant increase in the levels of3-hydroxykynurenine in both patients and controls(p < 0.0005) but, even though the mean levels remainedlower in patients during tryptophan loading, the differencebetween the means was no longer significant.
Xanthurenic acid
Levels of xanthurenic acid also became undetectable duringthe tryptophan depletion protocol in control and patientgroups. Baseline levels of xanthurenic acid at the start oftryptophan loading were significantly higher in patients thanin controls (Fig. 7b). Tryptophan loading produced a signi-ficant increase in the levels in both patients (p ¼ 0.0013) andcontrols (p ¼ 0.0005), though the difference between groupswas lost.
3-Hydroxyanthranilic acid
Levels of 3-hydroxyanthranilic acid became undetectableduring the tryptophan depletion protocol in control and
depletion
0.00
0.02
0.04
0.06
0.08
0.10
0.12
0.14
baseline dep +5h dep +7h dep +24h
k:t
rati
o
Controls Patients
(a)
***
***
***+++
+
+++
loading
0.00
0.05
0.10
0.15
0.20
0.25
0.30
0.35
0.40
0.45
baseline load +5h load +7h
k:t
rati
o
(b)
***
++++++
+++ +++
Fig. 4 Effect of tryptophan depletion and loading on the ratio of
kynurenine : tryptophan (k : t) in the plasma of controls and patients
with Huntington’s disease. (a) k : t ratio at baseline level and following
depletion of tryptophan, (b) k : t ratio at baseline level (24 h after
depletion) and following tryptophan loading. Values are mean ± SEM.
Between control and patients groups: ***p < 0.001, **p < 0.01,
*p < 0.05. Within-group comparison between depletion or loading and
their respective baseline values and between the original baseline and
baseline 24 h after depletion: +++p < 0.001, ++p < 0.01, +p < 0.05.
depletion
0.00
0.01
0.02
0.03
0.04
0.05
0.06
0.07
baseline dep +5h dep +7h dep +24h
kynu
reni
c ac
id (
µM)
Controls Patients
(a)
+++ +++++++
loading
0
2
4
6
8
10
12
baseline load +5h load +7h
kynu
reni
c ac
id (
µM)
(b)
+++
+++
+++
Fig. 5 Effect of tryptophan depletion and loading on kynurenic acid
levels in the plasma of controls and patients with Huntington’s disease.
(a) Kynurenic acid concentrations at baseline level and following
depletion of tryptophan, (b) kynurenic acid concentrations at baseline
level (24 h after depletion) and following tryptophan loading. Values
are mean ± SEM. Between control and patients groups: ***p < 0.001,
**p < 0.01, *p < 0.05. Within-group comparison between depletion or
loading and their respective baseline values and between the original
baseline and baseline 24 h after depletion: +++p < 0.001, ++p < 0.01,+p < 0.05.
616 N. Stoy et al.
� 2005 International Society for Neurochemistry, J. Neurochem. (2005) 93, 611–623
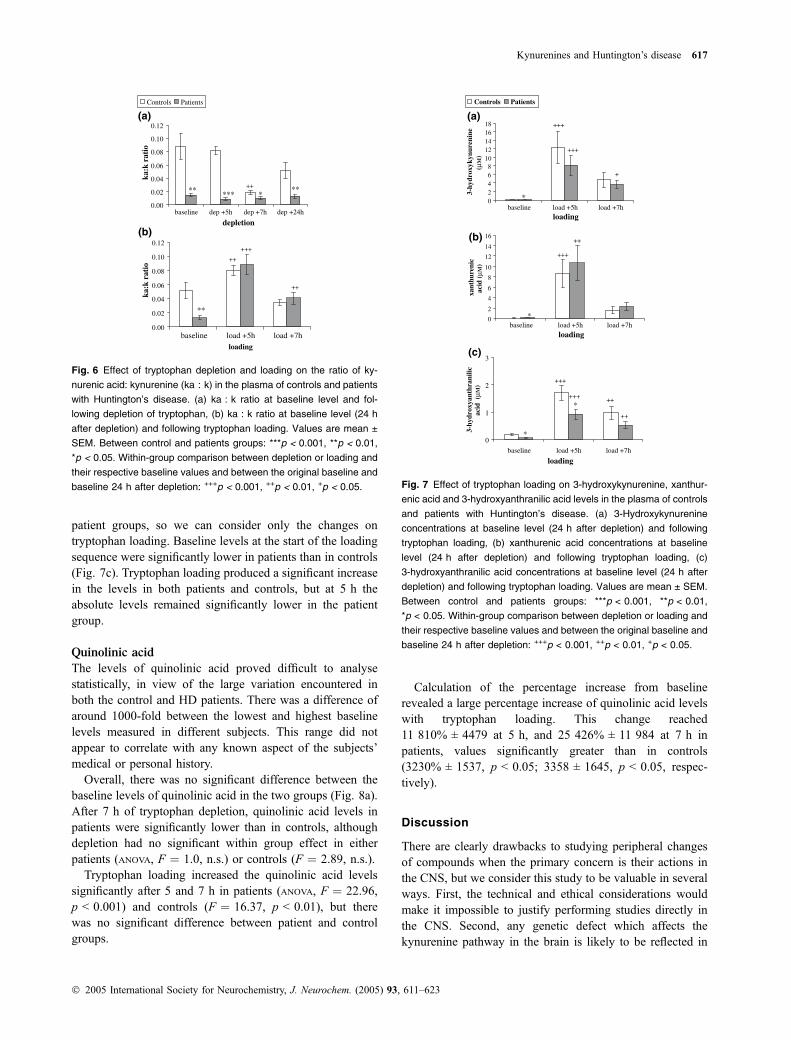
patient groups, so we can consider only the changes ontryptophan loading. Baseline levels at the start of the loadingsequence were significantly lower in patients than in controls(Fig. 7c). Tryptophan loading produced a significant increasein the levels in both patients and controls, but at 5 h theabsolute levels remained significantly lower in the patientgroup.
Quinolinic acid
The levels of quinolinic acid proved difficult to analysestatistically, in view of the large variation encountered inboth the control and HD patients. There was a difference ofaround 1000-fold between the lowest and highest baselinelevels measured in different subjects. This range did notappear to correlate with any known aspect of the subjects’medical or personal history.
Overall, there was no significant difference between thebaseline levels of quinolinic acid in the two groups (Fig. 8a).After 7 h of tryptophan depletion, quinolinic acid levels inpatients were significantly lower than in controls, althoughdepletion had no significant within group effect in eitherpatients (ANOVA, F ¼ 1.0, n.s.) or controls (F ¼ 2.89, n.s.).
Tryptophan loading increased the quinolinic acid levelssignificantly after 5 and 7 h in patients (ANOVA, F ¼ 22.96,p < 0.001) and controls (F ¼ 16.37, p < 0.01), but therewas no significant difference between patient and controlgroups.
Calculation of the percentage increase from baselinerevealed a large percentage increase of quinolinic acid levelswith tryptophan loading. This change reached11 810% ± 4479 at 5 h, and 25 426% ± 11 984 at 7 h inpatients, values significantly greater than in controls(3230% ± 1537, p < 0.05; 3358 ± 1645, p < 0.05, respec-tively).
Discussion
There are clearly drawbacks to studying peripheral changesof compounds when the primary concern is their actions inthe CNS, but we consider this study to be valuable in severalways. First, the technical and ethical considerations wouldmake it impossible to justify performing studies directly inthe CNS. Second, any genetic defect which affects thekynurenine pathway in the brain is likely to be reflected in
depletion
0.00
0.02
0.04
0.06
0.08
0.10
0.12
baseline dep +5h dep +7h dep +24h
ka:k
rat
io
Controls Patients
***** *
**++
(a)
loading
0.00
0.02
0.04
0.06
0.08
0.10
0.12
baseline load +5h load +7h
ka:k
rat
io
**
++
++
+++
(b)
Fig. 6 Effect of tryptophan depletion and loading on the ratio of ky-
nurenic acid: kynurenine (ka : k) in the plasma of controls and patients
with Huntington’s disease. (a) ka : k ratio at baseline level and fol-
lowing depletion of tryptophan, (b) ka : k ratio at baseline level (24 h
after depletion) and following tryptophan loading. Values are mean ±
SEM. Between control and patients groups: ***p < 0.001, **p < 0.01,
*p < 0.05. Within-group comparison between depletion or loading and
their respective baseline values and between the original baseline and
baseline 24 h after depletion: +++p < 0.001, ++p < 0.01, +p < 0.05.
loading
02468
1012141618
baseline load +5h load +7h
3-hy
drox
ykyn
uren
ine
(µM
)
Controls Patients
*
(a)
+++
+
+++
loading
0
2
4
6
8
10
12
14
16
baseline load +5h load +7h
xant
hure
nic
acid
(µM
)
(b)
*
+++
++
loading
0
1
2
3
baseline load +5h load +7h
3-hy
drox
yant
hran
ilic
acid
(µ M
)
(c)
*
*
+++
+++++
++
Fig. 7 Effect of tryptophan loading on 3-hydroxykynurenine, xanthur-
enic acid and 3-hydroxyanthranilic acid levels in the plasma of controls
and patients with Huntington’s disease. (a) 3-Hydroxykynurenine
concentrations at baseline level (24 h after depletion) and following
tryptophan loading, (b) xanthurenic acid concentrations at baseline
level (24 h after depletion) and following tryptophan loading, (c)
3-hydroxyanthranilic acid concentrations at baseline level (24 h after
depletion) and following tryptophan loading. Values are mean ± SEM.
Between control and patients groups: ***p < 0.001, **p < 0.01,
*p < 0.05. Within-group comparison between depletion or loading and
their respective baseline values and between the original baseline and
baseline 24 h after depletion: +++p < 0.001, ++p < 0.01, +p < 0.05.
Kynurenines and Huntington’s disease 617
� 2005 International Society for Neurochemistry, J. Neurochem. (2005) 93, 611–623

changed metabolism throughout the body, both because thesame enzymes outside the brain may be affected and becauseof the passage of metabolites from CNS to the blood and viceversa. In fact the levels of kynurenine metabolites in the CNSare substantially influenced by peripheral levels, especially astryptophan and kynurenine penetrate readily across theblood–brain barrier using the large neutral amino acidtransporter (Fukui et al. 1991; Miller et al. 1992; Vecseiet al. 1992; Jauch et al. 1993) and induce increased produc-tion of downstream metabolites (Jauch et al. 1993). This isparticularly likely to be a significant factor in neurodegen-erative disorders such as HD as any accompanying inflam-matory activity will result in the infiltration into the CNS ofactivated macrophages with enhanced kynurenine pathwaymetabolism promoted by the activation of IDO activity(Heyes et al. 1992b; Espey et al. 1997).
Kynurenines
There are two primary hypotheses for a role of tryptophanmetabolites in HD. One is based on the ability of kynureninesto modulate activity of the NMDA-sensitive glutamatereceptors, while the other is based on the ability of3-hydroxykynurenine and 3-hydroxyanthranilic acid tomodulate the generation of reactive oxygen species and,thus, the production of oxidative stress.
A crucial role for NMDA receptors in the neuronaldysfunction and loss which occurs in HD has been postulatedsince the concept of a relationship between excitotoxicity andneurodegenerative disease was proposed by Coyle andSchwarcz (1976) and the excitatory and neurotoxic actionsof quinolinic acid as an endogenous agonist at NMDAreceptors was described (Stone and Perkins 1981; Schwarczet al. 1983). In post-mortem HD brain, Young et al. (1988a)detected a loss of NMDA receptors, consistent with anincreased loss of cells bearing these receptors in response toan excitotoxic process mediated by glutamate or quinolinicacid. The huntingtin protein increases expression of the NR1/NR2B subunit combinations in the NMDA receptors foundon the medium spiny neostriatal neurons which are mostvulnerable to loss in HD. This effect could account for theincreased neuronal sensitivity to NMDA reported in a mousemodel (Cepeda et al. 2001), and the increased sensitivity toNMDA or quinolinic acid excitation and toxicity (Chen et al.1999; Zeron et al. 2002).
While there is no apparent difference between the restinglevels of tryptophan in patients with HD and controls in thisstudy it is clear that there is a far greater conversion oftryptophan to kynurenine in patients because the absolutebaseline levels of kynurenine are more than double those incontrols, i.e. the kynurenine pathway appears to be in a stateof enhanced activation in HD. It is of interest, however, thatkynurenine levels fall to a much greater extent at 5 h oftryptophan depletion in controls than in patients. Thissuggests that the relatively greater activity of TDO/IDO inpatients is increased even further in this situation. The raisedlevels of kynurenine in HD are believed to demonstrate a realeffect as they are observed at five of the six time pointsthroughout the depletion and loading protocols. Indeed,calculation of the kynurenine : tryptophan (k : t) ratiosreveals that at the time of maximum tryptophan depletionthe ratio falls in controls but is increased in patients.Together, these results suggest that the activity of TDO and/or IDO is greater in patients than controls, and that activity isnot depressed as much by lowered tryptophan availability asit is in controls.
This difference may be due more to the availability ofcofactors or competing substrates than to a difference in theenzymes themselves, as the difference in activity is lostfollowing a tryptophan load, when the enzymes should bemaximally active and competition for alternative substrateswill be heavily in favour of tryptophan. This in turn maysuggest that IDO contributes relatively more to the metabo-lism of tryptophan in patients, as this enzyme acts on a widerrange of substrates than does the more selective TDO. Agreater contribution by IDO would also be entirely consistentwith the greater neopterin levels and oxidative stressproducts in patients, as IDO is present in microglia andmacrophages and other immune competent cells.
depletion
0
1
2
3
4
5
baseline dep +5h dep +7h dep +24h
quin
olin
ic a
cid
(µM
)
Controls Patients
***
(a)
loading
0
2
4
6
8
10
12
14
baseline load +5h load +7h
quin
olin
ic a
cid
(µM
)
(b)
++++
++
+
Fig. 8 Effect of tryptophan depletion and loading on quinolinic acid
levels in the plasma of controls and patients with Huntington’s disease.
(a) Quinolinic acid concentrations at baseline level and following
depletion of tryptophan, (b) quinolinic acid concentrations at baseline
level (24 h after depletion) and following tryptophan loading. Values
are mean ± SEM. Between control and patients groups: ***p < 0.001,
**p < 0.01, *p < 0.05. Within-group comparison between depletion or
loading and their respective baseline values and between the original
baseline and baseline 24 h after depletion: +++p < 0.001, ++p < 0.01,+p < 0.05.
618 N. Stoy et al.
� 2005 International Society for Neurochemistry, J. Neurochem. (2005) 93, 611–623
In normal controls, the k : t ratio falls on depletion andrises on loading as might be expected as the pathways have agreater or lesser degree of activation, respectively. In HDpatients, however, the k : t ratio rises both on tryptophandepletion and loading and in this study was always higherthan in controls at all points in the depletion and loadingprogramme, suggesting that IDO/TDO activity is alwaysgreater in HD than in controls, perhaps fuelled by superoxidewhich acts as a substrate for IDO, or under the persistentinfluence of some factor released from the damagedneurones.
Although kynurenic acid is an antagonist at all glutamateionotropic receptors, it has its greatest activity at thecoagonist allosteric glycine site (the glyB receptor) on theNMDA receptor (Birch et al. 1988). It is able therefore toblock neurotransmission and brain damage induced byexcitotoxins, brain oedema, hypoxia and ischaemia (seeStone 2001). In the present study, the baseline and trypto-phan depleted levels of kynurenic acid were no differentbetween patients and controls. While the kynurenicacid : kynurenine ratio (ka : k) would be consistent with asubstantially reduced kynurenine aminotransferase (KAT;kynurenine 2-oxoglutarate transaminase, EC 2.6.1.7) activityin patients at baseline and on tryptophan depletion, such aconclusion must be qualified by the fact that kynurenic acidis excreted via active transport in the kidney, and KATactivity depends on the simultaneous concentrations ofalternative substrates and modulators such as aspartate,a-aminoadipate and oxoglutarate. It is not known whetherthese factors were different in the patient population studied.The overall picture is nevertheless one of increased IDO/TDO activity driving the kynurenine pathway towardsquinolinic acid in the presence of lower concentrations ofthe protective kynurenic acid.
It may be important that on tryptophan loading thedifferences between HD patients and controls is lost, raisingthe possibility that loading the pathway might be protectivein driving the balance in the pathway towards kynurenic acidand away from quinolinic acid. Interestingly, however, thereis a case report by Pascoe (1993) who claimed thestabilization of a HD patient by a low tryptophan diet. Thisresult might indicate that a lower generation of quinolinicacid is more beneficial than raising the kynurenic acid : qui-nolinic acid ratio.
The earliest measurement of kynurenic acid levels in thepost-mortem brains of patients with HD indicated anincrease (Connick et al. 1989), whereas later investigationsin a larger sample of post-mortem brains (Beal et al. 1992)and in the CSF (Heyes et al. 1992a) indicated a decrease,together with an increased ratio of kynurenine to kynurenicacid (Beal et al. 1990). However, a recent study of earlystage HD brains and an early stage HD mouse modeltransgenic for full-length mutant huntingtin has againreported an increase of kynurenic acid levels (Guidetti
et al. 2000), although accompanied by a even greaterincrease of 3-hydroxykynurenine. The present data do notdirectly support either of these alternatives, although ourfinding of a substantially reduced ka : k ratio is entirelyconsistent with the report by Jauch et al. (1995) that KATactivity was less in the HD post-mortem caudate nucleusthan control brains. One very interesting possibility arisesfrom the known ability of blood kynurenine to pass into theCNS and be converted into kynurenic acid (Miller et al.1992; Vecsei et al. 1992; Jauch et al. 1993). Because bloodkynurenine levels are very significantly higher in patientsthan controls, it may lead to a raised level of kynurenic acidin the brain, as reported by Connick et al. (1989) in humanbrain, and in the animal model (Fukui et al. 1991; Milleret al. 1992; Vecsei et al. 1992; Jauch et al. 1993; Guidettiet al. 2000).
Although the large variability of quinolinic acid levels inthe present cohort of subjects makes interpretation difficult,the absence of a clear difference between patients andcontrols is consistent with earlier reports in post-mortembrain (Reynolds et al. 1988; Beal et al. 1990; Reynolds andPearson 1993). It has been pointed out by Poston et al.(1991) that the low Km of 3-HAO and the presence of3-HAO in astrocytes means that increased baseline kynur-enine levels may not be reflected in a proportionate rise inbaseline quinolinic acid levels, and this is borne out by thepresent results. Activity of 3-HAO is said to be increased inHD striatum (Schwarcz et al. 1988), and this may accountfor the normal baseline level of quinolinic acid in the presentstudy despite a decreased concentration of 3-hydroxyanthra-nilic acid.
Oxidative stress
There is growing evidence for a degree of oxidative stress inHD which could result from the activation of NMDAreceptors [which are known to induce nitric oxide synthase(iNOS; EC 1.14.13.39) and the generation of reactive oxygenspecies] or by some other method independent of thereceptors. In at least one animal model for HD, a significantincrease in lipid peroxidation has been reported whichparallels the neurological phenotype (Perez-Severiano et al.2000; Bogdanov et al. 2001).
An increased level of 3-hydroxykynurenine has beendescribed in the putamen, frontal and temporal cortex in HDwhich is not found in the brains of Alzheimer’s diseasepatients (Pearson and Reynolds 1992; Guidetti et al. 2000).This compound produces neuronal damage, largely bygenerating free radical species such as hydrogen peroxidewhich induce cell apoptosis as a result of oxidative stress(Eastman and Guilarte 1989, 1990; Nakagami et al. 1996;Okuda et al. 1996, 1998).
The present results are certainly consistent with elevatedoxidative stress as reflected in the significantly raised levelsof lipid peroxidation products. As ESR correlated positively
Kynurenines and Huntington’s disease 619
� 2005 International Society for Neurochemistry, J. Neurochem. (2005) 93, 611–623
with age only in the HD patients and not in controls it may bethat the inflammation shown in these patients, i.e. increasedneopterin and lipid peroxidation products are not solely theeffects of ageing but reflect an inflammatory process in thebrains of these patients resulting from the disease process andpossibly a response to proteins or other substances releasedfrom the damaged brain as the disease progresses with time.ESR correlated positively with CRP (p < 0.05) which isgenerally accepted to be the more reliable measurement ofdisease activity.
IDO activity is known to be stimulated by superoxide,which acts as a co-substrate for the enzyme. It is possiblethat oxidative stress leading to superoxide production couldresult in a secondary activation of the kynurenine pathway,generating the raised kynurenine level and k : t ratio.Alternatively, a primary increase of kynurenine pathwayactivity could increase oxidative stress as a result of raisedlevels of metabolites such as 3-hydroxykynurenine and3-hydroxyanthranilic acid which can generate reactiveoxygen species. Because resting levels of these lattermetabolites are shown here to be lower in patients than incontrols, the former explanation is more likely to becorrect, although it should be emphasized that, as a resultof the peripheral generation and metabolism of thesecompounds, our measurements of these compounds inblood may reflect the central situation to only a limitedextend, with the possibility that their levels could be raisedwithin the CNS.
There are related observations to suggest an impairment ofcellular energy metabolism in animal models and HDpatients (Beal 1992; Browne et al. 1999) which could resultfrom the binding of huntingtin to key enzymes such asglyceraldehyde-3-phosphate dehydrogenase (D-glyceralde-hyde-3-phosphate:NADP+ oxidoreductase, EC 1.2.1.9;Burke et al. 1996). These changes include defects inmitochondrial function (Tabrizi et al. 2000) with increasedNOS activity, and could contribute to the increased sensitiv-ity of NMDA receptors in HD (Beal 1992) as well as thegeneration of free radical species both directly and as a resultof NMDA receptor activation.
Neopterin
The increased level of neopterin in our HD patients whencompared with controls is consistent with evidence for aninflammatory process in neurodegenerative disorders suchas Parkinson’s disease (Widner et al. 2002) and Alzheimer’sdisease, and may reflect an inflammatory reaction to cellulardamage and removal occurring within the CNS. It is stillnot clear whether the peripheral immune activation is aprimary response, and the activated peripheral macrophageswhich are known to penetrate into the CNS are thenrecruited to the sites of cell damage, or whether the primaryresponse is activation of microglia by cellular damagewithin the CNS. Activated microglia are present in HD
brain from an early stage in proximity to the most affectedareas (Sapp 2001) and iNOS has been found in (activated)microglia adjacent to degenerating neurones (Tabrizi et al.2000). Macrophages derived from peripheral blood mono-cytes are well known to be recruited into regions of CNSinflammation and necrosis but their contribution to HDpathogenesis is unknown.
Raised levels of neopterin are often associated withincreased activity of reactive oxygen species and low levelsof antioxidants (Murr et al. 2002), an observation which issupported by our present finding of similarly elevated levelsof neopterin and lipid peroxidation products in HD patients.Activated microglia are present in HD brain from an earlystage in proximity to the most affected areas (Sapp 2001) andiNOS has been found in (activated) microglia adjacent todegenerating neurones (Tabrizi et al. 2000). Macrophagesderived from peripheral monocytes are well known to berecruited into regions of CNS but their contribution to HDpathogenesis is unknown.
The raised level of neopterin in patients with HD isconsistent with the similar finding from Leblhuber et al.(1998) who also noted a correlation with lower tryptophanlevels and with poor survival of patients with HD.
CRP
Elevated levels of CRP are associated with the immuneresponse and disease activity (Gershov et al. 2000). Raisedlevels have been correlated with the inflammatory eventsaccompanying heart disease and atherosclerosis, with nocorrelation with antibodies to infectious agents (De Backeret al. 2002; Heilbronn and Clifton 2002). The raised levels ofCRP found here therefore in the absence of changes of ESRand haemoglobin, could be an indicator of generalizedinflammatory response to the destruction of brain cells andhuntingtin-related damage elsewhere, as for example instriated muscle, though the specific contribution of CRP tothe inflammatory response remains uncertain. This inflam-matory response could result in the activation of thekynurenine pathway with potentially yet more inflammation,i.e. a self-perpetuating cycle.
S100
This is one of the first reports of the measurement of S100Bin patients with HD. The protein S100B is released fromastroglial cells and is a biochemical marker for diagnosis andmonitoring of brain damage. S100B is elevated in patientswith Alzheimer’s disease and Down’s syndrome (Griffinet al. 1989), and is increased following ischaemic stroke(Buttner et al. 1997; Wunderlich et al. 1999). The normallevels in blood found here are consistent with evidence thatS100B is associated with the earliest stages of neuronaldamage, and that levels decline within a few days of an acuteinsult. The absence of a difference from controls thereforehelps to rule out the existence of acute cerebral damage
620 N. Stoy et al.
� 2005 International Society for Neurochemistry, J. Neurochem. (2005) 93, 611–623
superimposed upon the chronic neurodegeneration. Theresults also suggest that S100B has no value as a markerof neurodegeneration in later stages of HD.
In summary, this study has demonstrated clear differences inthe levels of oxidative stress and the kinetics of the kynureninepathway in patients with HD compared with controls.Tryptophan depletion or loading gives rise to differentialeffects in patients and controls both in terms of the absoluteamounts of metabolites produced, and in terms of the timecourse of those changes. These differences could reflectgenetic differences in the various enzymes of the pathway,differences in the concentrations or availability of cofactors orcompeting substrates for the enzymes, or differences in theinteractions between the kynurenine pathway and metabolicpathways which compete with key metabolites (Fig. 1). Theseperipheral results may not accurately reflect concentrations inthe CNS, but they are consistent with the general concept thatabnormalities of tryptophan metabolism along the kynureninepathway could contribute to neuronal dysfunction and damagein HD. The data also strongly reinforce the view that a highlevel of oxidative stress is present in HD patients many yearsafter the onset of the disease.
Acknowledgements
The authors wish to acknowledge Ms Rosalind B. McMillan for
technical assistance in Glasgow, and the invaluable help of
Mrs Helen Finch, MSc SRD (Dietician) and of Dr M. Khanderia
(Chief Pharmacist) at The Royal Hospital for Neuro-Disability,
London. They also wish to thank The Peacock Trust and the Royal
Hospital for Neuro-Disability for their support.
References
Bates G. (2003) Huntingtin aggregation and toxicity in Huntington’sdisease. Lancet 361, 1642–1644.
Beal M. F. (1992) Does impairment of energy metabolism result inexcitotoxic neuronal death in neurodegeneration illnesses? Ann.Neurol. 31, 119–130.
Beal M. F., Kowall N. W., Ellison D. W., Mazurek M. F., Swartz K. J.and Martin J. B. (1986) Replication of the neurochemical charac-teristics of Huntington’s disease by quinolinic acid. Nature 321,168–171.
Beal M. F., Matson W. R., Swartz K. J., Gamache P. H. and Bird E. D.(1990) Kynurenine pathway measurements in Huntington’s diseasestriatum: evidence for reduced for kynurenic acid. J. Neurochem.55, 1327–1339.
Beal M. F., Kowall N. W., Ferrante R. J. and Cippolloni P. B. (1991)Chronic quinolinic acid lesions in rats closely resemble Hunting-ton’s disease. J. Neurosci. 11, 1649–1659.
Beal M. F., Matson W. R., Storey E., Milbury P., Ryan E. A., Ogawa T.and Bird E. D. (1992) Kynurenic acid concentrations are reducedin Huntington’s disease cerebral cortex. J. Neurol. Sci. 108, 80–87.
Birch P. J., Grossman C. J. and Hayes A. G. (1988) Kynurenic acidantagonises responses to NMDA via an action at the strychnine-insensitive glycine receptor. Eur. J. Pharmacol. 154, 85–87.
Bogdanov M. B., Andreassen O. A., Dedeoglu A., Ferrante R. J. andBeal M. F. (2001) Increased oxidative damage to DNA in a
transgenic mouse model of Huntington’s disease. J. Neurochem.79, 1246–1249.
Browne S. E., Ferrante R. J. and Beal M. F. (1999) Oxidative stress inHuntington’s disease. Brain Pathol. 9, 147–163.
Burke J. R., Enghild J. J., Martin M. E., Jou Y. S., Myers R. M., RosesA. D., Vance J. M. and Strittmatter W. J. (1996) Huntington andDRPLA proteins selectively interact with the enzyme GAPDH.Nat. Med. 2, 347–350.
Burns L. H., Pakzaban P., Deacon T. W., Brownell A. L., Tatter S. B.,Jenkins B. G. and Isacson O. (1995) Selective putaminal excito-toxic lesions in non-human primates model the movement disorderof Huntington’s disease. Neuroscience 64, 1007–1017.
Buttner T., Weyers S., Postert T., Sprengelmeyer R. and Kuhn W. (1997)S-100 protein: serum marker of focal brain damage after ischemicterritorial MCA infarction. Stroke 28, 1961–1965.
Carter R. J., Lione L. A., Humby T., Mangiarini L., Mahal A., Bates G.P., Dunnett S. B. and Morton A. J. (1999) Characterisation ofprogressive motor deficits in mice transgenic for the humanHuntington’s disease mutation. J. Neurosci. 19, 3248–3257.
Cepeda C., Ariano M. A., Calvert C. R., Flores-Hernandez J. andChandler S. H. (2001) NMDA receptor function in mouse modelsof Huntington’s disease. J. Neurosci. Res. 66, 525–539.
Chen N., Luo T., Wellington C., Metzler M., McCutcheon K., HaydenM. R. and Raymond L. A. (1999) Subtype-specific enhancement ofNMDA receptor currents by mutant huntington. J. Neurochem. 72,1890–1898.
Connick J. H., Carla V., Moroni F. and Stone T. W. (1989) Increase inkynurenic acid in Huntington’s disease motor cortex. J. Neuro-chem. 52, 985–987.
Coyle J. T. and Schwarcz R. (1976) Lesion of striatal neurons with kainicacid provides a model for Huntington’s chorea. Nature 263, 244–246.
De Backer J., Mak R., De Bacquer D., Van Renterghem L., VerbraekelE., Kornitzer M. and De Backer G. (2002) Parameters of inflam-mation and infection in a community based cas–control study ofcoronary heart disease. Atherosclerosis 160, 457–463.
Dobbie M. S. and Surtees R. A. H. (1997) Concentrations of quinolinicacid in cerebrospinal fluid measured by gas chromatography andelectron-impact ionisation mass spectrometry - Age-related chan-ges in a paediatric reference population. J. Chromatogr. B 696,53–58.
Eastman C. L. and Guilarte T. R. (1989) Cytotoxicity of 3-hydroxyky-nurenine in a neuronal hybrid cell line. Brain Res. 495, 225–231.
Eastman C. L. and Guilarte T. R. (1990) The role of hydrogen peroxidein the in vitro cytotoxicity of 3-hydroxykynurenine. Neurochem.Res. 15, 1101–1107.
Espey M. G., Chernyshev O. N., Reinhard J. F., Namboodiri M. A. A.and Colton C. A. (1997) Activated human microglia produce theexcitotoxin quinolinic acid. Neuroreport 8, 431–434.
Fukui S., Schwarcz R., Rapoport S. I., Takada Y. and Smith Q. R. (1991)Blood–brain barrier transport of kynurenines: implications forbrain synthesis and metabolism. J. Neurochem. 56, 2007–2017.
Gershov D., Kim S., Brot N. and Elkon K. B. (2000) C-reactive proteinbinds to apoptotic cells, protects the cells from assembly of theterminal complement components, and sustains an antiinflamma-tory innate immune response: Implications for systemic autoim-munity. J. Exp. Med. 193, 1953–1963.
Griffin W. S. T., Stanley L. C., Ling C., White L., Macleod V., Perrot L.J., White C. L. and Araoz C. (1989) Brain interleukin-1 and S-100immunoreactivity are elevated in Down’s syndrome and Alzhei-mer’s disease. Proc. Natl Acad. Sci. USA 86, 7611–7615.
Guidetti P., Reddy P. H., Tagle D. A. and Schwarcz R. (2000) Earlykynurenergic impairment in Huntington’s disease and in a trans-genic animal model. Neurosci. Lett. 283, 233–235.
Kynurenines and Huntington’s disease 621
� 2005 International Society for Neurochemistry, J. Neurochem. (2005) 93, 611–623
Heilbronn L. K. and Clifton P. M. (2002) C-reactive protein and cor-onary artery disease: influence of obesity, caloric restriction andweight loss. J. Nutr. Biochem. 13, 316–321.
Herve C., Beyne P., Jamault H. and Delacoux E. (1996) Determinationof tryptophan and its kynurenine pathway metabolites in humanserum by high-performance liquid chromatography with simulta-neous ultraviolet and fluorimetric detection. J. Chromatogr. B 675,157–161.
Heuther G., Hajak G., Reimer A., Poeggeler B., Blomer M., RodenbeckA. and Ruther E. (1992) The metabolic fate of infused L-tryptophanin men: possible clinical implications of the accumulation of cir-culating tryptophan and tryptophan metabolites. Psychopharma-cology 109, 422–432.
Heyes M. P., Saito K., Crowley J. S. et al. (1992a) Quinolinic acid andkynurenine pathway metabolism in inflammatory and non-inflam-matory neurologic disease. Brain 115, 1249–1273.
Heyes M. P., Saito K. and Markey S. P. (1992b) Human macrophagesconvert 1-tryptophan into the neurotoxin quinolinic acid. Biochem.J. 283, 633–635.
Hughes P. E., Alexi T., Williams C. E., Clark R. G. and Gluckman P. D.(1999) Administration of recombinant activin-A has powerful neu-rotrophic effects on select striatal phenotypes in the quinolinic acidlesion model of Huntington’s disease. Neuroscience 92, 197–209.
International Council for Standardization in Haematology. (1933) ICSHrecommendations for measurement of erythrocyte sedimentationrate. Clin. Pathol. 46, 198–200.
Jauch D. A., Sethy V. H., Weick B. G., Chase T. N. and Schwarcz R.(1993) Intravenous administration of L-kynurenine to rhesusmonkeys: effect on quinolinate and kynurenate levels in serum andcerebrospinal fluid. Neuropharmacology 32, 467–472.
Jauch D., Urbanska E. M., Guidetti P., Bird E. D., Vonsattel J. P.,Whetsell W. O. and Schwarcz R. (1995) Dysfunction of brainkynurenic acid metabolism in Huntington’s disease: focus onkynurenine aminotransferase. J. Neurol. Sci. 130, 39–47.
Kuemmerle S., Gutekunst C. A., Klein A. M., Li X. J., Li S. H., Beal M.F., Hersch S. M. and Ferrante R. J. (1999) Huntingtin aggregatesmay not predict neuronal death in Huntington’s disease. Ann.Neurol. 46, 842–849.
Leblhuber F., Walli J., Jellinger K., Tilz G. P., Widner B., Laccone F. andFuchs D. (1998) Activated immune system in patients withHuntington’s disease. Clin. Chem. Lab. Med. 36, 747–750.
Miller J. M., MacGarvey U. and Beal M. F. (1992) The effect of per-ipheral loading with kynurenine and probenecid on extracellularstriatal kynurenic acid concentrations. Neurosci. Lett. 146, 115–118.
Moja E. A., Restani P., Corsini E., Stacchezzini M. C., Assereto R. andGalli C. L. (1991) Cycloheximide blocks the fall of plasma andtissue tryptophan levels after tryptophan-free amino acid mixtures.Life Sci. 49, 1121–1128.
Murr C., Widner B., Wirleitner B. and Fuchs D. (2002) Neopterin as amarker for immune system activation. Curr. Drug Metab. 3, 175–187.
Nakagami Y., Saito H. and Katsuki H. (1996) 3-Hydroxykynureninetoxicity on the rat striatum in vivo. Jpn J. Pharmacol. 71, 183–186.
Okuda S., Nishiyama N., Saito H. and Katsuki H. (1996) Hydrogenperoxide-mediated neuronal cell death induced by an endogenousneurotoxin, 3-hydroxykynurenine. Proc. Natl Acad. Sci. USA 93,12 553–12 558.
Okuda S., Nishiyama N., Saito H. and Katsuki H. (1998) 3-hydrox-ykynurenine, an endogenous stress generator, causes neuronal celldeath with apoptotic features and region selectivity. J. Neurochem.70, 299–307.
Pascoe M. (1993) Huntington’s disease and low tryptophan diet. Med.Hypotheses 41, 325–326.
Pearson S. J. and Reynolds G. P. (1992) Increased brain concentration ofa neurotoxin, 3-hydroxykynurenine, in Huntington’s disease.Neurosci. Lett. 144, 199–201.
Perez-Severiano F., Rios C. and Segovia J. (2000) Striatal oxidativedamage parallels the expression of a neurological phenotype inmice transgenic for the mutation of Huntington’s disease. BrainRes. 862, 234–237.
Perkins M. N. and Stone T. W. (1982) An iontophoretic investigationof the action of convulsant kynurenines and their interaction withthe endogenous excitant quinolinic acid. Brain Res. 247, 184–187.
Popoli P., Pezzola A., Domenici M. E., Sagratella S., Diana G., CaporaliM. G., Bronzetti E., Vega J. and Scotti de Carolis A. (1994)Behavioural and electrophysiological correlates of the quinolinicacid rat model of Huntington’s disease in rats. Brain Res. Bull. 35,329–335.
Poston M. R., Bailey M. S., Schwarcz R. and Shipley M. T. (1991)Differential complementary localization of metabolic enzymes forquinolinic acid in olfactory-bulb astrocytes. J. Comp. Neurol. 311,367–374.
Reynolds G. P. and Pearson S. J. (1993) Neurochemical-clinical corre-lates of Huntington’s disease: applications of brain-banking tech-niques. J. Neural Transm. Supplement 39, 207–214.
Reynolds G. P., Pearson S. J. and Halket J. (1988) Brain quinolinic acidin Huntington’s disease. J. Neurochem. 50, 1959–1960.
Sapp E., Kegel K. B., Aronin N., Hashikawa T., Uchiyama Y., TohyamaK., Bhide P. G., Vonsattel J. P. and DiFiglia M. (2001) Early andprogressive accumulation of reactive microglia in the Huntingtondisease brain. J. Neuropath. Exp. Neurol. 60, 161–172.
Sathasivam K., Hobbs C., Mangiarini L., Mahal A., Turmaine M.,Doherty P., Davies S. W. and Bates G. P. (1999) Transgenic modelsof Huntington’s disease. Phil. Trans. Roy. Soc. 354, 963–969.
Schwarcz R., Whetsell W. O. and Mangano R. M. (1983) Quinolinicacid: an endogenous metabolite that causes axon-sparing lesions inrat brain. Science 219, 316–318.
Schwarcz R., Foster A. C., French E. D., Whetsell W. O. and Kohler C.(1984) Excitotoxic models for neurodegenerative disorders. LifeSci. 35, 19–32.
Schwarcz R., Okuno E., White R. J., Bird E. D. and Whetsell W. O.(1988) 3-Hydroxyanthranilate oxygenase activity is increased inthe brains of Huntington’s disease victims. Proc. Natl Acad. Sci.USA 85, 4079–4081.
Schwarz M., Block F., Topper R., Sontag K. H. and Noth J. (1992)Abnormalities of somatosenory evoked potentials in the quinolinicacid model of Huntington’s disease: evidence that basal gangliamodulate sensory cortical input. Ann. Neurol. 32, 358–364.
Shibata K. (1988) Fluorimetric micro-determination of kynurenic acid,an endogenous blocker of neurotoxicity, by HPLC. J. Chromatogr.Biomed 430, 376–380.
Stone T. W. (2001) Kynurenines in the CNS: from endogenous obscurityto therapeutic importance. Progr. Neurobiol. 64, 185–218.
Stone T. W. and Darlington L. G. (2002) Endogenous kynurenines astargets for drug discovery and development. Nat. Revs. DrugDiscovery 1, 609–620.
Stone T. W. and Perkins M. N. (1981) Quinolinic acid: a potentendogenous excitant at amino acid receptors in the CNS. Eur. J.Pharmacol. 72, 411–412.
Tabrizi S. J., Workman J., Hart P. E., Mangiarini L., Mahal A., Bates G.,Cooper J. M. and Schapira A. H. V. (2000) Mitochondrial dys-function and free radical damage in the Huntington R6/2 transgenicmouse. Ann. Neurol. 47, 80–86.
Tatter S. B., Galpern W. R., Hoogeveen A. T. and Isacson O. (1995)Effects of striatal excitotoxicity on huntingtin-like immunoreac-tivity. Neuroreport 6, 1125–1129.
622 N. Stoy et al.
� 2005 International Society for Neurochemistry, J. Neurochem. (2005) 93, 611–623
Usdin M. T., Shelbourne P. F., Myers R. M. and Madison D. V. (1999)Impaired synaptic plasticity in mice carrying the Huntington’sdisease mutation. Human Mol. Genet. 8, 839–848.
Vecsei L., Miller J., MacGarvey U. and Beal M. F. (1992) Effects ofKynurenine and probenecid on plasma and brain tissue concen-trations of kynurenic acid. Neurodegeneration 1, 17–26.
Westergren A. (1921) Studies of the suspension stability of the blood inpulmonary tuberculosis. Med. Scand. 54, 247–250.
Widner B., Leblhuber F. and Fuchs D. (2002) Increase neopterin pro-duction and tryptophan degradation in advanced Parkinson’s dis-ease. J. Neural Transm. 109, 181–189.
Wunderlich M. T., Ebert A. D., Kratz T., Goertler M., Jost S. andHerrmann M. (1999) Early neurobehavioral outcome after stroke is
related to release of neurobiochemical markers of brain damage.Stroke 30, 1190–1195.
Young A. B., Greenamyre J. T., Hollingsworth Z., Albin R., D’AmatoC., Shoulson I. and Penney J. B. (1988a) NMDA receptor losses inputamen in patients with Huntington’s disease. Science 241, 981–983.
Young S. N., Tourjman S. V., Teff K. L., Pihl R. O. and Anderson G. H.(1988b) The effect of lowering plasma tryptophan on food selec-tion in normal males. Pharmacol. Biochem. Behav. 31, 149–152.
Zeron M. M., Hansson O., Chen N., Wellington C. L., Leavitt B. E.,Brundin P., Hayden M. R. and Raymond L. A. (2002) Increasedsensitivity to NMDA receptor-mediated excitotoxicity in a mousemodel of Huntington’s disease. Neuron 33, 849–860.
Kynurenines and Huntington’s disease 623
� 2005 International Society for Neurochemistry, J. Neurochem. (2005) 93, 611–623