trust during the early stages of the 2009 h1n1 pandemic
TRANSCRIPT

This article was downloaded by: [University of Georgia]On: 14 October 2013, At: 11:05Publisher: Taylor & FrancisInforma Ltd Registered in England and Wales Registered Number: 1072954 Registeredoffice: Mortimer House, 37-41 Mortimer Street, London W1T 3JH, UK
Journal of Health Communication:International PerspectivesPublication details, including instructions for authors andsubscription information:http://www.tandfonline.com/loi/uhcm20
Trust During the Early Stages of the 2009H1N1 PandemicVicki S. Freimuth a , Don Musa b , Karen Hilyard c , Sandra CrouseQuinn d & Kevin Kim ea Center for Health and Risk Communication , University of Georgia ,Athens , Georgia , USAb School of Public Health , University of Pittsburgh , Pittsburgh ,Pennsylvania , USAc College of Public Health , University of Georgia , Athens ,Georgia , USAd School of Public Health , University of Maryland , College Park ,Maryland , USAe School of Education , University of Pittsburgh , Pittsburgh ,Pennsylvania , USAPublished online: 11 Oct 2013.
To cite this article: Vicki S. Freimuth , Don Musa , Karen Hilyard , Sandra Crouse Quinn & Kevin Kim ,Journal of Health Communication (2013): Trust During the Early Stages of the 2009 H1N1 Pandemic,Journal of Health Communication: International Perspectives
To link to this article: http://dx.doi.org/10.1080/10810730.2013.811323
PLEASE SCROLL DOWN FOR ARTICLE
Taylor & Francis makes every effort to ensure the accuracy of all the information (the“Content”) contained in the publications on our platform. However, Taylor & Francis,our agents, and our licensors make no representations or warranties whatsoever as tothe accuracy, completeness, or suitability for any purpose of the Content. Any opinionsand views expressed in this publication are the opinions and views of the authors,and are not the views of or endorsed by Taylor & Francis. The accuracy of the Contentshould not be relied upon and should be independently verified with primary sourcesof information. Taylor and Francis shall not be liable for any losses, actions, claims,proceedings, demands, costs, expenses, damages, and other liabilities whatsoever orhowsoever caused arising directly or indirectly in connection with, in relation to or arisingout of the use of the Content.
This article may be used for research, teaching, and private study purposes. Anysubstantial or systematic reproduction, redistribution, reselling, loan, sub-licensing,systematic supply, or distribution in any form to anyone is expressly forbidden. Terms &Conditions of access and use can be found at http://www.tandfonline.com/page/terms-and-conditions
Dow
nloa
ded
by [
Uni
vers
ity o
f G
eorg
ia]
at 1
1:05
14
Oct
ober
201
3
1
Journal of Health Communication, 0:1–19, 2013Copyright © Taylor & Francis Group, LLCISSN: 1081-0730 print/1087-0415 onlineDOI: 10.1080/10810730.2013.811323
Trust During the Early Stages of the 2009 H1N1 Pandemic
VICKI S. FREIMUTH
Center for Health and Risk Communication, University of Georgia, Athens, Georgia, USA
DON MUSA
School of Public Health, University of Pittsburgh, Pittsburgh, Pennsylvania, USA
KAREN HILYARD
College of Public Health, University of Georgia, Athens, Georgia, USA
SANDRA CROUSE QUINN
School of Public Health, University of Maryland, College Park, Maryland, USA
KEVIN KIM
School of Education, University of Pittsburgh, Pittsburgh, Pennsylvania, USA
Distrust of the government often stands in the way of cooperation with public health recommendations in a crisis. The purpose of this article is to describe the public’s trust in government recommendations during the early stages of the H1N1 pandemic and to identify factors that might account for these trust levels. The authors surveyed 1,543 respondents about their experiences and attitudes related to H1N1 influenza between June 3, 2009, and July 6, 2009, during the first wave of the pandemic using the Knowledge Networks online panel. This panel is representative of the U.S. population and uses a combination of random digit dialing and address-based probability sampling frames covering 99% of the U.S. household population to recruit participants. To ensure participation of low-income individuals and those without Internet access, Knowledge Networks provides hardware and access to the Internet if needed. Measures included standard demographics, a trust scale, trust ratings for individual spokespersons, involvement with H1N1, experience with H1N1, and past discrimination in health care. The authors found that trust of government was low (2.3 out of 4) and varied across demographic groups. Blacks and Hispanics reported higher trust in government than did Whites. Of the spokespersons included, personal health professionals received the highest trust ratings and religious leaders the lowest. Attitudinal and experience variables predicted trust better than demographic
Address correspondence to Vicki S. Freimuth, 2015 Jacobs Run Road, New Richmond, OH 45157, USA. E-mail: [email protected]
Dow
nloa
ded
by [
Uni
vers
ity o
f G
eorg
ia]
at 1
1:05
14
Oct
ober
201
3
2 V. S. Freimuth et al.
characteristics. Closely following the news about the flu virus, having some self-reported knowledge about H1N1, self-reporting of local cases, and previously experiencing discrimination were the significant attitudinal and experience predictors of trust. Using a second longitudinal survey, trust in the early stages of the pandemic predicted vaccine acceptance later but only for White, non-Hispanic individuals.
During a public health emergency, it is critical that risk communication messages con-vince the public to cooperate quickly with governmental directives such as to boil water, shelter-in-place, dispose of tainted food products and take necessary vaccinations or medications. Distrust of the government and its directives often stands in the way of this cooperation. The Pew Research Center for the People and the Press (2010) recently reported that Americans’ level of trust in government in general is at an all-time low. Just 22% say they can trust the government in Washington almost always or most of the time, among the lowest measures in half a century. About the same percentage (19%) says they are “basically content” with the federal government, which is largely unchanged from 2006 and 2007, but lower than a decade ago. Trust in the govern-ment is usually assumed to be even lower in minority communities, attributed to past discrimination, neglect and such previous events as the Tuskegee syphilis study in the Black community and the perception of poor performance by the government follow-ing Hurricane Katrina. The Pew Study (2010), however, found the opposite trend—that Blacks and Hispanics reported higher levels of trust in government than did Whites.
It is common to measure the public’s level of trust in government policy and in key spokespersons but few studies have tried to explain why the public is so distrustful or what can be done to try to improve the level of trust. Most of these studies have used hypothetical scenarios rather than real crises (e.g., Seigrist, Earle, & Gutscher, 2003). The purpose of this article is to describe the public’s trust in government recommen-dations and key spokespersons in the early stages of the H1N1 pandemic, identify factors that might account for these trust levels, and explore whether trust is related to later vaccine acceptance.
We focused on the early stages of the pandemic because uncertainty is particularly high during this period and the consequences of compliance are critical. An infectious disease, in particular, can be controlled more successfully if individuals immediately begin following public health recommendations such as hand washing, social distancing, or vaccination. The H1N1 pandemic, declared by the World Health Organization in June 2009, provided an opportunity to examine the public’s trust in the government recommendations and its spokespersons during the early stages of a real emerging health crisis. At that time, there was no vaccine available and uncertainty about whether one would be developed. Public health recommendations included washing hands frequently, avoiding people who were sick, staying away from crowds, and practicing proper hygiene behavior. However, some policies changed or were abandoned as officials learned more about the pandemic’s transmission patterns and virulence. At first, some public health agencies overseas cancelled public events (Stern & Markel, 2009), quarantined people on the basis of nationality or proximity to known cases (Ong et al., 2009), issued travel warnings (Associated Press, 2009), and ordered the slaughter of pigs (Ballantyne, 2009). In the United States, some schools with one or more cases of H1N1 were closed, but school closures were quickly deemed ineffective in stopping transmission. Later, instead of keeping both sick and well people at home, only those individuals with the virus were asked to stay isolated until 24 hours after symptoms subsided (Neil, 2009). Flu patients were also told to avoid
Dow
nloa
ded
by [
Uni
vers
ity o
f G
eorg
ia]
at 1
1:05
14
Oct
ober
201
3
Trust During Early Stages of 2009 H1N1 Pandemic 3
visiting doctors or hospitals unless symptoms became severe (Centers for Disease Control and Prevention, 2009). The initial severity of the virus in Mexico created high public demand for a vaccine, leading the U.S. Food and Drug Administration to accelerate its approval process for producing and distributing vaccines and to limit the first available vaccines to health care workers and patients at higher risk, such as children and pregnant women (Masterson, 2009). As the pandemic progressed and was perceived as less severe, demand fell and vaccine became available, often for free, to anyone interested (Ruiz, 2009). Although now, more extreme policies, and later shifts in policies may be perceived in retrospect by some as overreaction, they indicate the high degree of uncertainty in the first months of the pandemic.
Trust has been an important construct in communication research at both the interpersonal and public policy levels for decades, yet there is still considerable con-troversy about what it is and how it should be measured. Early researchers looking at communication and persuasion such as Hovland and colleagues (1953) identified two dimensions of trust—expertness and trustworthiness—and referred to these concepts collectively as credibility. In general, risk researchers measure trust by asking about each of its core components. Peters and colleagues (1997) found empirical support for four components of trust from those identified in earlier research (Kasperson et al., 1992; Renn & Levine, 1991): commitment, knowledge and expertise, concern and care. We included these four dimensions in the measure of trust in this study.
A frequent criticism of this research is that respondents are usually asked to use dimensions of trust predetermined by the researcher, rather than dimensions selected by the respondents themselves. Meredith and colleagues (2007) took a different approach to identifying the components of trust, conducting qualitative research with a sample of Blacks. In a series of focus groups, they asked respondents to react to escalating stages of a bioterrorism scenario. They investigated participants’ responses to new information presented in each stage and whether they trusted the information and its source. Using an inductive analysis strategy to assess the role that trust played, their analysis revealed five components of trust: fiduciary responsibility, defined as a relationship in which someone acts in the capacity of another’s rights, assets, or well-being; honesty, defined as perceived truthfulness and sincerity; competency, defined as being perceived as well-qualified to perform an act; consistency, defined as uniformity and agreement among messages; and faith, defined as any mention of faith or similar words. Meredith’s qualitative research (2007) reinforced the four dimensions found by Peters and colleagues’ (1997) quantitative work and prompted us to add a dimension similar to Meredith’s fiduciary responsibility, which is defined as the extent to which they believed the government’s actions in response to swine flu were in their personal best interest and how much they believed the government would protect them from swine flu. The only dimension identified by Meredith that we did not address was faith.
In addition to assessing trust in the government’s recommendations, we examined trust in individual spokespersons that were active in the early stages of the pandemic. Reactions to individual spokesperson often interact with the public’s trust in the overall government recommendations.
Another goal of this study was to identify factors that predict trust in government that might lead to communication strategies to improve trust, and ultimately coopera-tion, with government recommendations. Although we examined demographic char-acteristics including gender, age, income, education, and race/ethnicity, we agreed with Poortinga and Pidgeon (2003) that affect plays an increasingly important role in lay per-ceptions of trust and, unlike demographic characteristics, may provide opportunities
Dow
nloa
ded
by [
Uni
vers
ity o
f G
eorg
ia]
at 1
1:05
14
Oct
ober
201
3

4 V. S. Freimuth et al.
to intervene to improve trust. Given that these affective judgments about institutions vary considerably on the basis of level of involvement and experience with the crisis and the government’s reaction to it (Earle & Siegrist, 2003), we added the following factors as potential predictors of trust: involvement with the pandemic measured by self-reported knowledge about it and how closely an individual was following the news about it; and experience with the flu virus measured by whether cases were occur-ring locally and whether an individual or anyone they knew had experienced flu-like symptoms in the previous 2 months. Because racial differences have consistently been identified in previous research as related to trust, we also included previous experience with discrimination in health care as a predictor of trust.
Using vaccination data from a second survey with a significant subset of our national sample, we examined the relation of trust with H1N1 vaccination. Because the focus of this article is primarily trust and its correlates, we limited our analysis of the second survey data to an examination of vaccination acceptance. In addition, given that racial differences in vaccination have been found, we investigated the relation between trust and H1N1 vaccination by race/ethnicity group.
Research Questions
We investigated these research questions:
1. Did the public trust government recommendations in the early stages of the H1N1 outbreak?
2. To what degree did the public trust individual spokespersons that were active in the early stages of the pandemic?
3. Did trust in government recommendations or spokespersons vary across demo-graphic groups?
4. Did demographic characteristics, level of involvement, experience with H1N1, or past discrimination in health care predict trust?
5. Was trust related to later H1N1 vaccine acceptance and did this relationship differ by race?
Method
Sample
Participants were a randomly drawn sample of adults from the Knowledge Networks (KN) online research panel who were surveyed about their experiences and attitudes related to H1N1 between June 3, 2009, and July 6, 2009, during the first wave of the pandemic. The KN panel is representative of the U.S. population, and uses a combi-nation of random-digit dial and address-based probability sampling frames covering 99% of the U.S. household population to recruit participants. To ensure participation of low-income individuals and those without Internet access, KN provides hardware and access to the Internet if needed. While the overall KN panel recruitment response rate is low (7.33%), they use panel and survey poststratification weighting to ensure that the panel as a whole and random samples drawn from it are demographically rep-resentative of the U.S. population in order to minimize nonresponse bias. A random sample of 2,498 adults, 18 years of age or older, including oversamples of Blacks and Hispanics, was invited to participate. A total of 1,543 people completed the survey for a completion rate of 62%. The survey was administered in English and Spanish.
Dow
nloa
ded
by [
Uni
vers
ity o
f G
eorg
ia]
at 1
1:05
14
Oct
ober
201
3
Trust During Early Stages of 2009 H1N1 Pandemic 5
In a second national survey of the U.S. population using the KN panel, which was conducted in late January 2010, we attempted to include all original respondents to our first survey. Among the 1543 respondents to the first survey, we were able to re-survey 929 (60.2% of the original sample) who provided information about vaccine acceptance. In this article, we first analyze trust and its correlates among all original 1543 respondents, and then examine vaccine acceptance for those 929 respondents who participated in the second wave of data collection. A comparison of the demographic characteristics of the 929 repeat respondents with the 604 who did not participate in the second survey indicates that the two groups were similar but not identical. The respondents who participated at Wave 2 were older (M = 51 years vs. 46 years; p < .001) and had slightly more income (53% with income $50,000 and more vs. 45%; p = .003) and education (32% bachelor’s degree or higher vs. 25%; p = .027) than those who did not participate a second time. They were also less likely to be black or Hispanic (12% Black vs. 14%; 15% Hispanic vs. 26%; p < .001) and to have experienced discrimination in health care (17.9% ever experienced discrimination vs. 11.1%; p < .001). However, there were no significant differences in how knowledgeable they were about H1N1, how closely they were following news coverage about the disease, whether they reported local cases of the disease or whether they knew anyone who had experienced flu-like symptoms. In addition, there were no differences in their level of trust in the government to handle H1N1. The demographic differences are a limitation in our examination of the relationship of trust to vaccine acceptance to the extent that these variables are related to vaccination. We discuss this further in the discussion section. KN provides weighting and stratification variables for analysis, incorporating design-based weights to account for the recruitment of the panelists and both panel-based and study-specific poststratification weights to account for nonresponse, benchmarked against the Current Population Survey. Weighting variables include gender, age, race/ethnicity, education, U.S. census region, metropolitan area, Internet access, and language spoken at home—English or Spanish. All analyses reported here are weighted to make them demographically representative of the U.S. population, using weights provided by KN for the first survey or additional weights provided for the 929 reinterviewed respondents in the second survey. More information on the KN research panel is available from its website (http://www.knowledgenetworks.com).
Measures
Trust in the government’s handling of H1N1 was measured by a scale with seven questions measuring key components of the inductive model of trust proposed by Meredith and colleagues (2007) and the quantitative dimensions from Peters and col-leagues’ Trust Determination Model. We applied these dimensions in the context of the swine flu outbreak and developed questions addressing each dimension (Quinn, Kumar, Freimuth, Kidwell, & Musa, 2009). The questions asked for the level of trust the respondents felt regarding the government’s openness, honesty, commitment, caring and concern, and competence in addressing H1N1; the extent to which they believed the government’s actions in response to swine flu are in their personal best interest; and how much they believed the government would protect them from swine flu. The questions were answered on 4-point scales (varying by question) that ranged from not at all trusting to very trusting. The wording of the questions is shown in Table 2, in which we categorize the responses into low trust and high trust. Low trust includes the lowest two (least trusting) categories that differed by question (e.g., “not
Dow
nloa
ded
by [
Uni
vers
ity o
f G
eorg
ia]
at 1
1:05
14
Oct
ober
201
3
6 V. S. Freimuth et al.
at all open” or “somewhat open” for the first question) and high trust included the highest two (most trusting) categories (e.g., “open” or “very open” for the first ques-tion). These seven items were highly correlated using the original 4-point scale and a factor analysis (principal components extraction with varimax rotation) indicated that all the items loaded on one factor (Cronbach’s alpha = 0.91). For questions with missing data, we imputed the mean of the remaining items as the response (1.6% or less missing on all items) (Quinn et al., 2009). This was only done for respondents with two or fewer missing answers. The trust scale score was calculated as the mean of the responses to the seven items. It has a theoretical range of 1 to 4 with higher values indi-cating greater trust. The trust scale is fairly normal in distribution with a mean of 2.29 and a median of 2.14, enabling the use of multiple regression in our modeling of trust.
Trust in information sources (spokespersons) regarding swine flu was measured by a series of questions asking respondents to indicate their level of trust in each of a “list of people who have been giving us information about swine flu.” Answers were provided on a 4-point scale that ranged from 1 (do not trust at all) to 4 (trust totally). Again, for ease of presentation, we categorized the responses into low trust (“do not trust at all” and “trust a little”) and high trust (“trust somewhat” and “trust totally”), and the percentage with high trust is shown in the table.
The primary independent variables were standard demographic characteristics and the self-reported experience and attitudinal characteristics of the respondents regarding H1N1. Demographic variables included gender, age, race/ethnicity, income, and education. The level of involvement of the respondent with H1N1 was measured by self-reported knowledge (“How knowledgeable are you about the swine flu?” with answers ranging from “very knowledgeable” to “not knowledgeable at all”), and how closely the respondent was following the pandemic. This variable was recoded into three categories: very closely/closely, somewhat closely, and not too closely/not at all. To measure the respondents’ experience with H1N1, they were asked “Has there been a case of swine flu in your city or county?” (yes/no), and “Have you or anyone you know experienced flu-like symptoms since April?” (yes/no). Respondents were asked whether they “personally had ever experienced discrimination or been hassled when seeking health care because of [their] race, ethnicity or color” (yes/no). We measured H1N1 vaccination in the second survey by a question that asked whether respondents had “done any of the following in response to the swine flu pandemic.” The list of behaviors included “gotten the 2009 swine flu vaccine” (yes/no).
Data Analysis
Data were analyzed with STATA 11 using complex survey analysis procedures to account for the sample design and weights. All analyses except factor analysis and scale reliability used the survey weights. Bivariate analyses report adjusted Pearson’s chi-square tests for categorical measures and adjusted Wald F statistics for continu-ous measures. The relationship between trust and the demographic and attitudinal measures was examined using multiple linear regression models. In all analyses, p < .05 indicated a significant finding.
Results
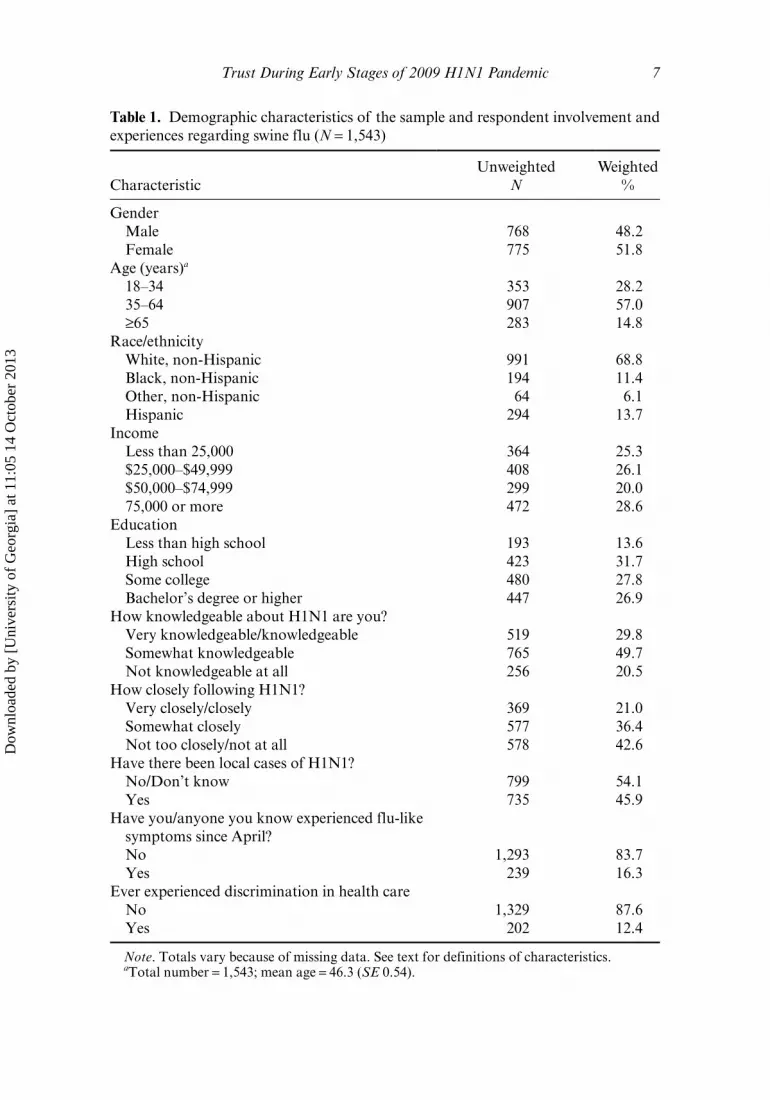
Table 1 presents the demographic characteristics and level of experience and involve-ment of the respondents with the H1N1 pandemic. The first research question asked
Dow
nloa
ded
by [
Uni
vers
ity o
f G
eorg
ia]
at 1
1:05
14
Oct
ober
201
3
Trust During Early Stages of 2009 H1N1 Pandemic 7
Table 1. Demographic characteristics of the sample and respondent involvement and experiences regarding swine flu (N = 1,543)
CharacteristicUnweighted
NWeighted
%
Gender Male 768 48.2 Female 775 51.8Age (years)a
18–34 353 28.2 35–64 907 57.0 ≥65 283 14.8Race/ethnicity White, non-Hispanic 991 68.8 Black, non-Hispanic 194 11.4 Other, non-Hispanic 64 6.1 Hispanic 294 13.7Income Less than 25,000 364 25.3 $25,000–$49,999 408 26.1 $50,000–$74,999 299 20.0 75,000 or more 472 28.6Education Less than high school 193 13.6 High school 423 31.7 Some college 480 27.8 Bachelor’s degree or higher 447 26.9How knowledgeable about H1N1 are you? Very knowledgeable/knowledgeable 519 29.8 Somewhat knowledgeable 765 49.7 Not knowledgeable at all 256 20.5How closely following H1N1? Very closely/closely 369 21.0 Somewhat closely 577 36.4 Not too closely/not at all 578 42.6Have there been local cases of H1N1? No/Don’t know 799 54.1 Yes 735 45.9Have you/anyone you know experienced flu-like
symptoms since April? No 1,293 83.7 Yes 239 16.3Ever experienced discrimination in health care No 1,329 87.6 Yes 202 12.4
Note. Totals vary because of missing data. See text for definitions of characteristics. aTotal number = 1,543; mean age = 46.3 (SE 0.54).
Dow
nloa
ded
by [
Uni
vers
ity o
f G
eorg
ia]
at 1
1:05
14
Oct
ober
201
3
8 V. S. Freimuth et al.
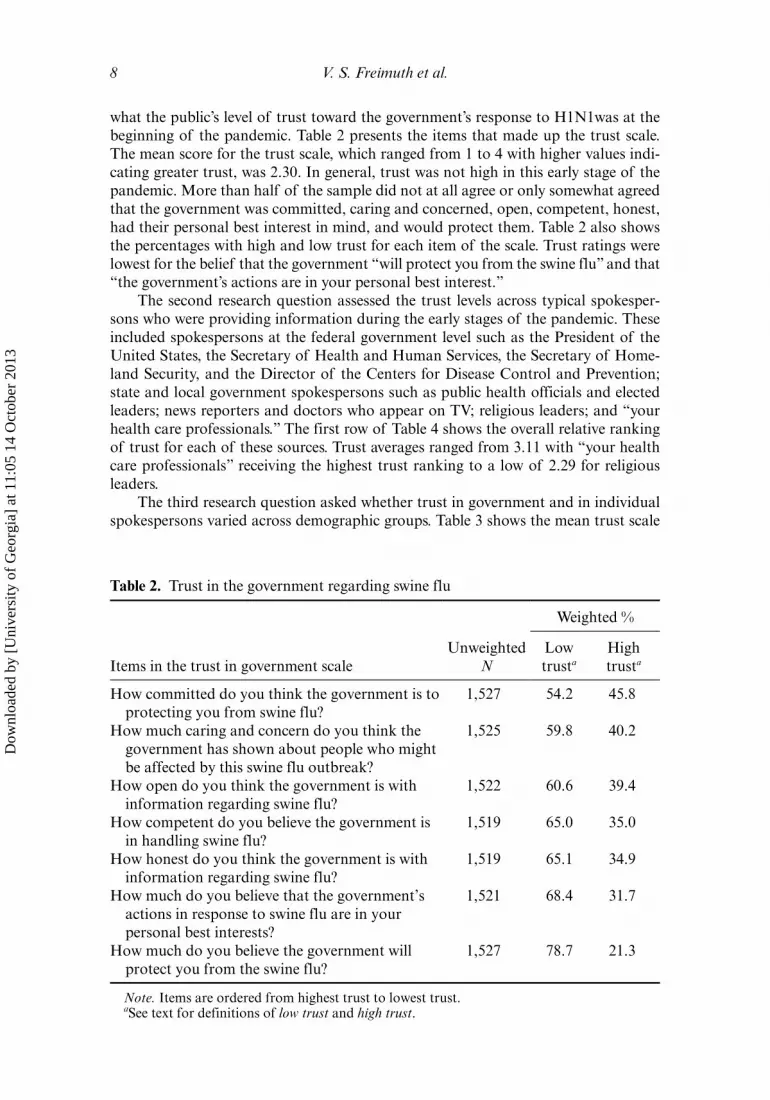
what the public’s level of trust toward the government’s response to H1N1was at the beginning of the pandemic. Table 2 presents the items that made up the trust scale. The mean score for the trust scale, which ranged from 1 to 4 with higher values indi-cating greater trust, was 2.30. In general, trust was not high in this early stage of the pandemic. More than half of the sample did not at all agree or only somewhat agreed that the government was committed, caring and concerned, open, competent, honest, had their personal best interest in mind, and would protect them. Table 2 also shows the percentages with high and low trust for each item of the scale. Trust ratings were lowest for the belief that the government “will protect you from the swine flu” and that “the government’s actions are in your personal best interest.”
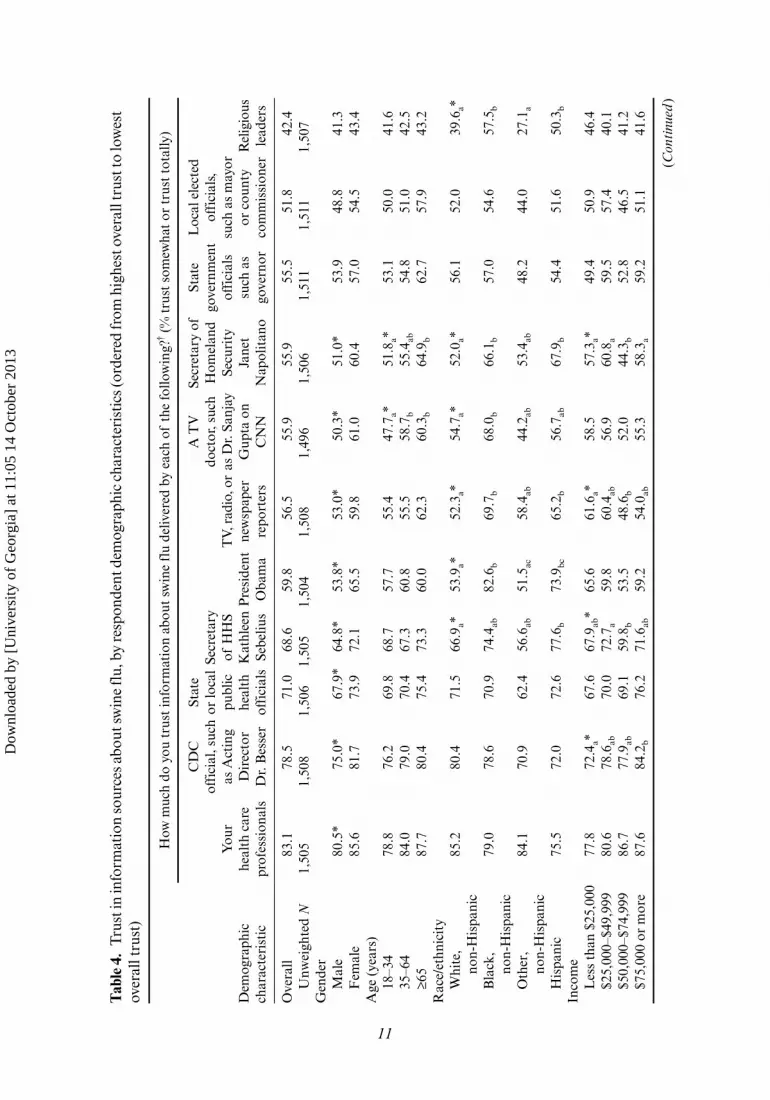
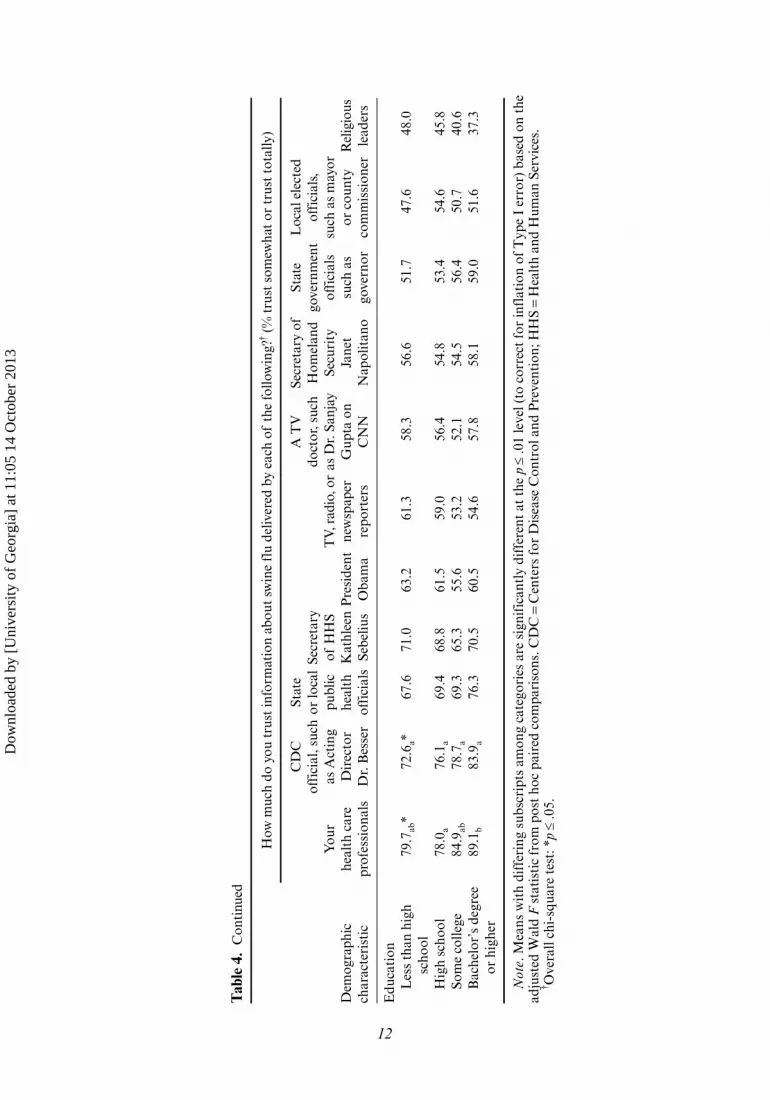
The second research question assessed the trust levels across typical spokesper-sons who were providing information during the early stages of the pandemic. These included spokespersons at the federal government level such as the President of the United States, the Secretary of Health and Human Services, the Secretary of Home-land Security, and the Director of the Centers for Disease Control and Prevention; state and local government spokespersons such as public health officials and elected leaders; news reporters and doctors who appear on TV; religious leaders; and “your health care professionals.” The first row of Table 4 shows the overall relative ranking of trust for each of these sources. Trust averages ranged from 3.11 with “your health care professionals” receiving the highest trust ranking to a low of 2.29 for religious leaders.
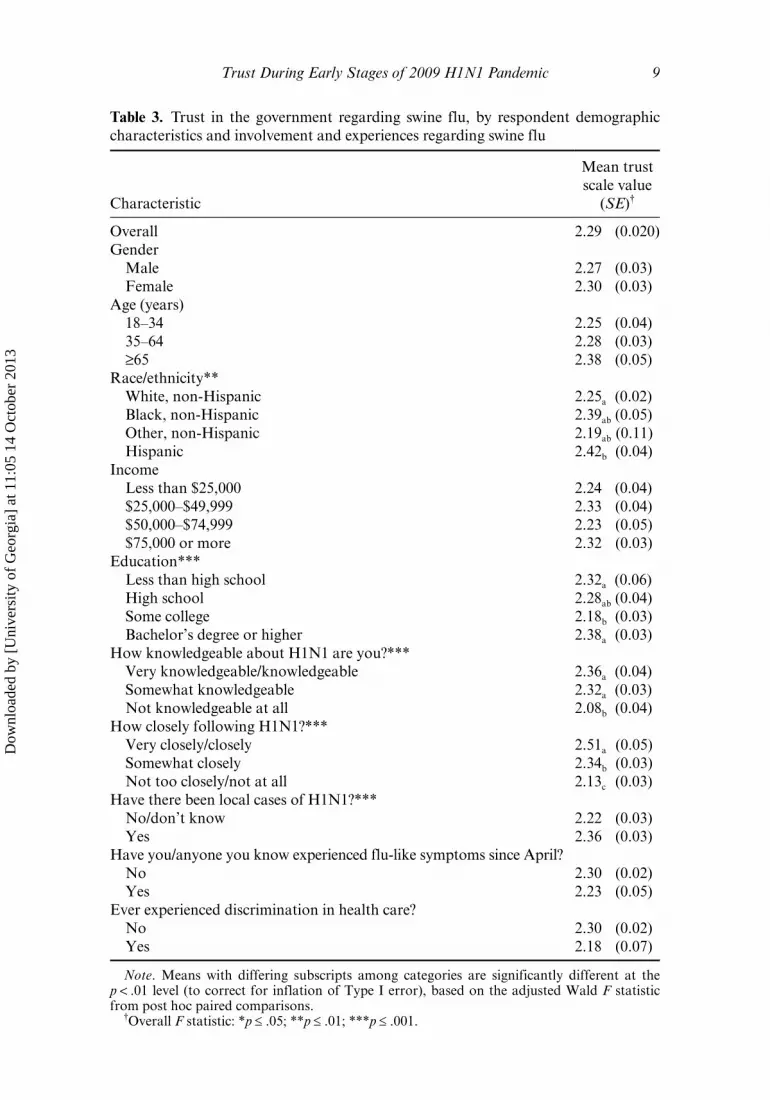
The third research question asked whether trust in government and in individual spokespersons varied across demographic groups. Table 3 shows the mean trust scale
Table 2. Trust in the government regarding swine flu
Unweighted N
Weighted %
Items in the trust in government scaleLow trusta
High trusta
How committed do you think the government is to protecting you from swine flu?
1,527 54.2 45.8
How much caring and concern do you think the government has shown about people who might be affected by this swine flu outbreak?
1,525 59.8 40.2
How open do you think the government is with information regarding swine flu?
1,522 60.6 39.4
How competent do you believe the government is in handling swine flu?
1,519 65.0 35.0
How honest do you think the government is with information regarding swine flu?
1,519 65.1 34.9
How much do you believe that the government’s actions in response to swine flu are in your personal best interests?
1,521 68.4 31.7
How much do you believe the government will protect you from the swine flu?
1,527 78.7 21.3
Note. Items are ordered from highest trust to lowest trust. aSee text for definitions of low trust and high trust.
Dow
nloa
ded
by [
Uni
vers
ity o
f G
eorg
ia]
at 1
1:05
14
Oct
ober
201
3
Trust During Early Stages of 2009 H1N1 Pandemic 9
Table 3 . Trust in the government regarding swine flu, by respondent demographic characteristics and involvement and experiences regarding swine flu
Characteristic
Mean trust scale value
(SE)†
Overall 2.29 (0.020)Gender Male 2.27 (0.03) Female 2.30 (0.03)Age (years) 18–34 2.25 (0.04) 35–64 2.28 (0.03) ≥65 2.38 (0.05)Race/ethnicity** White, non-Hispanic 2.25a (0.02) Black, non-Hispanic 2.39ab (0.05) Other, non-Hispanic 2.19ab (0.11) Hispanic 2.42b (0.04)Income Less than $25,000 2.24 (0.04) $25,000–$49,999 2.33 (0.04) $50,000–$74,999 2.23 (0.05) $75,000 or more 2.32 (0.03)Education*** Less than high school 2.32a (0.06) High school 2.28ab (0.04) Some college 2.18b (0.03) Bachelor’s degree or higher 2.38a (0.03)How knowledgeable about H1N1 are you?*** Very knowledgeable/knowledgeable 2.36a (0.04) Somewhat knowledgeable 2.32a (0.03) Not knowledgeable at all 2.08b (0.04)How closely following H1N1?*** Very closely/closely 2.51a (0.05) Somewhat closely 2.34b (0.03) Not too closely/not at all 2.13c (0.03)Have there been local cases of H1N1?*** No/don’t know 2.22 (0.03) Yes 2.36 (0.03)Have you/anyone you know experienced flu-like symptoms since April? No 2.30 (0.02) Yes 2.23 (0.05)Ever experienced discrimination in health care? No 2.30 (0.02) Yes 2.18 (0.07)
Note. Means with differing subscripts among categories are significantly different at the p < .01 level (to correct for inflation of Type I error), based on the adjusted Wald F statistic from post hoc paired comparisons.
†Overall F statistic: *p ≤ .05; **p ≤ .01; ***p ≤ .001.
Dow
nloa
ded
by [
Uni
vers
ity o
f G
eorg
ia]
at 1
1:05
14
Oct
ober
201
3

10 V. S. Freimuth et al.
scores across gender, age, race/ethnicity, income levels, and education. There were no statistically significant differences across gender, age, and income (although older respondents showed a nonsignificant tendency to be more trusting) but significant differences were present for race/ethnicity and education. Whites (2.25) and the het-erogeneous group of other race (2.19) reported the lowest trust averages, followed by Blacks (2.39) and Hispanics (2.42). Trust scores also varied significantly across education levels. The lowest trust was reported by those with some college (2.18), fol-lowed by those who had graduated from high school (2.28), those with less than a high school education (2.32), and those with a college degree (2.38). We also examined trust in individual spokespersons across demographic groups. Table 4 shows these results. In general, women were more trusting across sources than men. Age presented the same consistent pattern across all sources. When there were statistically significant differences across age, younger people trusted less than older ones. There were statisti-cally significant differences for different racial/ethnic groups in trust across seven of the 11 sources.1 The pattern was consistent with the overall trust levels in that Whites usually trusted less, followed by Blacks and then Hispanics for all of these seven except for two interesting exceptions. Whites had higher trust ratings of personal health care professionals (3.15) than did Blacks or Hispanics (both 2.97). The other exception was trust of religious leaders. Blacks reported higher trust (2.55) compared with Whites (2.25) and Hispanics (2.38). However, even among Blacks, health care professionals were the most trusted and religious leaders were the least trusted sources. Although there were no statistically significant differences in overall trust across income levels, there were differences in trust in individual spokespersons by income level for per-sonal health care professionals, Centers for Disease Control and Prevention, President Obama, the media, the Secretary of Homeland Security, and state officials. The pat-tern of these differences was consistent for personal health care professionals and the Centers for Disease Control and Prevention in that the higher the income, the higher the trust, but that pattern was reversed for President Obama and the media (TV, radio, or newspaper reporters) in that the lowest income groups trusted the most. Last, statis-tically significant educational differences followed a similar pattern: trust was higher for personal health care professionals and Centers for Disease Control and Preven-tion the greater the education but lower for President Obama and news reporters. In addition, we found that the lower the education level, the greater the trust of religious leaders.
The fourth research question asked what potential factors would predict trust in government. We found that involvement (greater self-reported knowledge about swine flu and following the news about the disease more closely) were both significantly related to greater levels of trust. Reporting local cases of swine flu was associated with higher levels of trust, while having flu-like symptoms either yourself or someone you knew was not significantly associated with trust. Previously experiencing discrimina-tion in health care was not significantly associated with lower levels of trust in govern-ment although there was a strong tendency in this direction (Table 3).
We used regression analysis to examine the independent effects of each predictor while controlling on all other predictors (Table 5). A goal was to determine the degree to which demographic variables alone account for varying levels of trust and then to evaluate the degree to which attitudinal and experience variables improve the
1 Because of the heterogeneity of “other race” and the difficulty in interpreting the results for this category, this group is not discussed here.
Dow
nloa
ded
by [
Uni
vers
ity o
f G
eorg
ia]
at 1
1:05
14
Oct
ober
201
3
11
Tab
le 4
. Tr
ust i
n in
form
atio
n so
urce
s abo
ut sw
ine
flu,
by
resp
onde
nt d
emog
raph
ic c
hara
cter
isti
cs (o
rder
ed fr
om h
ighe
st o
vera
ll tr
ust t
o lo
wes
t ov
eral
l tru
st)
Dem
ogra
phic
ch
arac
teri
stic
How
muc
h do
you
tru
st in
form
atio
n ab
out
swin
e fl
u de
liver
ed b
y ea
ch o
f th
e fo
llow
ing?
† (%
tru
st s
omew
hat
or t
rust
tot
ally
)
You
r he
alth
car
e pr
ofes
sion
als
CD
C
offi
cial
, suc
h as
Act
ing
Dir
ecto
r D
r. B
esse
r
Stat
e or
loca
l pu
blic
he
alth
of
fici
als
Secr
etar
y of
HH
S K
athl
een
Sebe
lius
Pre
side
nt
Oba
ma
TV,
rad
io, o
r ne
wsp
aper
re
port
ers
A T
V
doct
or, s
uch
as D
r. S
anja
y G
upta
on
CN
N
Secr
etar
y of
H
omel
and
Secu
rity
Ja
net
Nap
olit
ano
Stat
e go
vern
men
t of
fici
als
such
as
gove
rnor
Loc
al e
lect
ed
offi
cial
s,
such
as
may
or
or c
ount
y co
mm
issi
oner
Rel
igio
us
lead
ers
Ove
rall
83.1
78.5
71.0
68.6
59.8
56.5
55.9
55.9
55.5
51.8
42.4
U
nwei
ghte
d N
1,50
51,
508
1,50
61,
505
1,50
41,
508
1,49
61,
506
1,51
11,
511
1,50
7G
ende
r
Mal
e80
.5*
75.0
*67
.9*
64.8
*53
.8*
53.0
*50
.3*
51.0
*53
.948
.841
.3
Fem
ale
85.6
81.7
73.9
72.1
65.5
59.8
61.0
60.4
57.0
54.5
43.4
Age
(ye
ars)
18
–34
78.8
76.2
69.8
68.7
57.7
55.4
47.7
a*51
.8a*
53.1
50.0
41.6
35
–64
84.0
79.0
70.4
67.3
60.8
55.5
58.7
b55
.4ab
54.8
51.0
42.5
≥6
587
.780
.475
.473
.360
.062
.360
.3b
64.9
b62
.757
.943
.2R
ace/
ethn
icit
y
Whi
te,
no
n-H
ispa
nic
85.2
80.4
71.5
66.9
a*53
.9a*
52.3
a*54
.7a*
52.0
a*56
.152
.039
.6a*
B
lack
,
non-
His
pani
c79
.078
.670
.974
.4ab
82.6
b69
.7b
68.0
b66
.1b
57.0
54.6
57.5
b
O
ther
,
non-
His
pani
c84
.170
.962
.456
.6ab
51.5
ac58
.4ab
44.2
ab53
.4ab
48.2
44.0
27.1
a
H
ispa
nic
75.5
72.0
72.6
77.6
b73
.9bc
65.2
b56
.7ab
67.9
b54
.451
.650
.3b
Inco
me
L
ess
than
$25
,000
77.8
72.4
a*67
.667
.9ab
*65
.661
.6a*
58.5
57.3
a*49
.450
.946
.4
$25,
000–
$49,
999
80.6
78.6
ab70
.072
.7a
59.8
60.4
ab56
.960
.8a
59.5
57.4
40.1
$5
0,00
0–$7
4,99
986
.777
.9ab
69.1
59.8
b53
.548
.6b
52.0
44.3
b52
.846
.541
.2
$75,
000
or m
ore
87.6
84.2
b76
.271
.6ab
59.2
54.0
ab55
.358
.3a
59.2
51.1
41.6
(Con
tinu
ed)
Dow
nloa
ded
by [
Uni
vers
ity o
f G
eorg
ia]
at 1
1:05
14
Oct
ober
201
3
12
Dem
ogra
phic
ch
arac
teri
stic
How
muc
h do
you
tru
st in
form
atio
n ab
out
swin
e fl
u de
liver
ed b
y ea
ch o
f th
e fo
llow
ing?
† (%
tru
st s
omew
hat
or t
rust
tot
ally
)
You
r he
alth
car
e pr
ofes
sion
als
CD
C
offi
cial
, suc
h as
Act
ing
Dir
ecto
r D
r. B
esse
r
Stat
e or
loca
l pu
blic
he
alth
of
fici
als
Secr
etar
y of
HH
S K
athl
een
Sebe
lius
Pre
side
nt
Oba
ma
TV,
rad
io, o
r ne
wsp
aper
re
port
ers
A T
V
doct
or, s
uch
as D
r. S
anja
y G
upta
on
CN
N
Secr
etar
y of
H
omel
and
Secu
rity
Ja
net
Nap
olit
ano
Stat
e go
vern
men
t of
fici
als
such
as
gove
rnor
Loc
al e
lect
ed
offi
cial
s,
such
as
may
or
or c
ount
y co
mm
issi
oner
Rel
igio
us
lead
ers
Edu
cati
on
Les
s th
an h
igh
sc
hool
79.7
ab*
72.6
a*67
.671
.063
.261
.358
.356
.651
.747
.648
.0
H
igh
scho
ol78
.0a
76.1
a69
.468
.861
.559
.056
.454
.853
.454
.645
.8
Som
e co
llege
84.9
ab78
.7a
69.3
65.3
55.6
53.2
52.1
54.5
56.4
50.7
40.6
B
ache
lor’
s de
gree
or h
ighe
r89
.1b
83.9
a76
.370
.560
.554
.657
.858
.159
.051
.637
.3
Not
e. M
eans
wit
h di
ffer
ing
subs
crip
ts a
mon
g ca
tego
ries
are
sig
nifi
cant
ly d
iffe
rent
at
the
p ≤
.01
leve
l (to
cor
rect
for
infl
atio
n of
Typ
e I
erro
r) b
ased
on
the
adju
sted
Wal
d F
sta
tist
ic f
rom
pos
t ho
c pa
ired
com
pari
sons
. CD
C =
Cen
ters
for
Dis
ease
Con
trol
and
Pre
vent
ion;
HH
S =
Hea
lth
and
Hum
an S
ervi
ces.
† O
vera
ll ch
i-sq
uare
tes
t: *
p ≤
.05.
Tab
le 4
. C
onti
nued
Dow
nloa
ded
by [
Uni
vers
ity o
f G
eorg
ia]
at 1
1:05
14
Oct
ober
201
3
Trust During Early Stages of 2009 H1N1 Pandemic 13
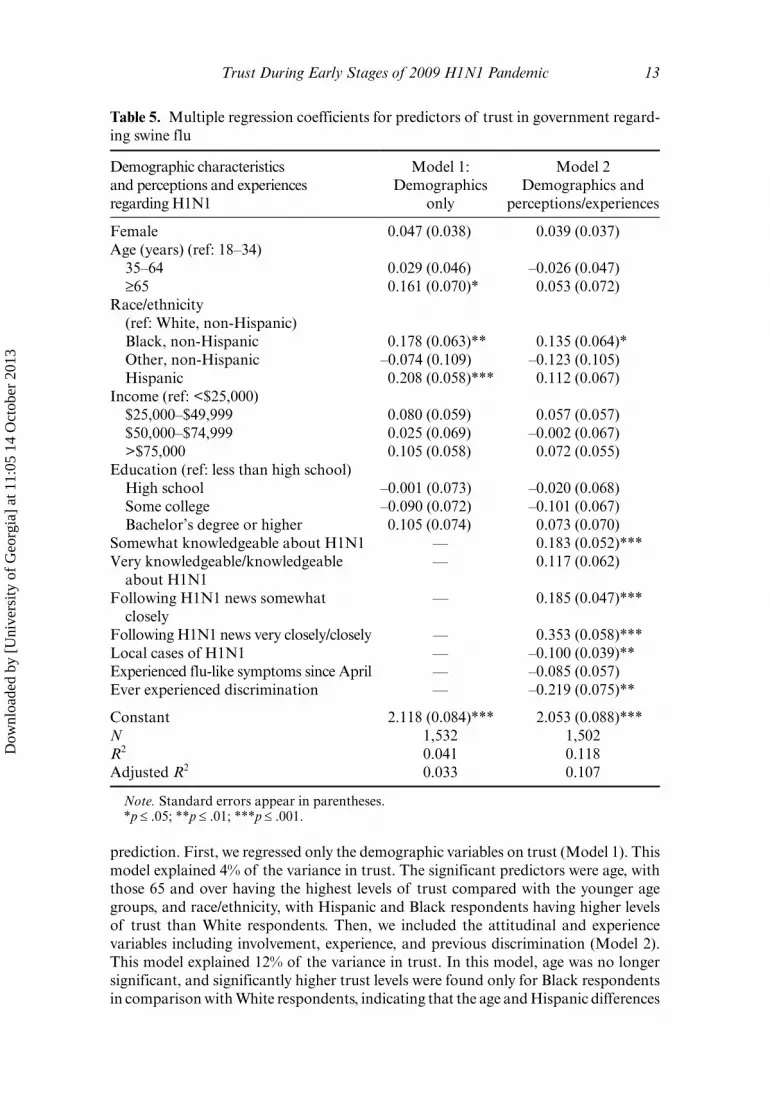
prediction. First, we regressed only the demographic variables on trust (Model 1). This model explained 4% of the variance in trust. The significant predictors were age, with those 65 and over having the highest levels of trust compared with the younger age groups, and race/ethnicity, with Hispanic and Black respondents having higher levels of trust than White respondents. Then, we included the attitudinal and experience variables including involvement, experience, and previous discrimination (Model 2). This model explained 12% of the variance in trust. In this model, age was no longer significant, and significantly higher trust levels were found only for Black respondents in comparison with White respondents, indicating that the age and Hispanic differences
Table 5 . Multiple regression coefficients for predictors of trust in government regard-ing swine flu
Demographic characteristics and perceptions and experiences regarding H1N1
Model 1: Demographics
only
Model 2 Demographics and
perceptions/experiences
Female 0.047 (0.038) 0.039 (0.037)Age (years) (ref: 18–34) 35–64 0.029 (0.046) –0.026 (0.047) ≥65 0.161 (0.070)* 0.053 (0.072)Race/ethnicity
(ref: White, non-Hispanic) Black, non-Hispanic 0.178 (0.063)** 0.135 (0.064)* Other, non-Hispanic –0.074 (0.109) –0.123 (0.105) Hispanic 0.208 (0.058)*** 0.112 (0.067)Income (ref: <$25,000) $25,000–$49,999 0.080 (0.059) 0.057 (0.057) $50,000–$74,999 0.025 (0.069) –0.002 (0.067) >$75,000 0.105 (0.058) 0.072 (0.055)Education (ref: less than high school) High school –0.001 (0.073) –0.020 (0.068) Some college –0.090 (0.072) –0.101 (0.067) Bachelor’s degree or higher 0.105 (0.074) 0.073 (0.070)Somewhat knowledgeable about H1N1 — 0.183 (0.052)***Very knowledgeable/knowledgeable
about H1N1— 0.117 (0.062)
Following H1N1 news somewhat closely
— 0.185 (0.047)***
Following H1N1 news very closely/closely — 0.353 (0.058)***Local cases of H1N1 — –0.100 (0.039)**Experienced flu-like symptoms since April — –0.085 (0.057)Ever experienced discrimination — –0.219 (0.075)**
Constant 2.118 (0.084)*** 2.053 (0.088)***N 1,532 1,502R2 0.041 0.118Adjusted R2 0.033 0.107
Note. Standard errors appear in parentheses. *p ≤ .05; **p ≤ .01; ***p ≤ .001.
Dow
nloa
ded
by [
Uni
vers
ity o
f G
eorg
ia]
at 1
1:05
14
Oct
ober
201
3

14 V. S. Freimuth et al.
found in Model 1 were accounted for by the attitudinal and experience variables. Closely following the news about the flu virus, having some self-reported knowledge about H1N1, reporting local cases and previously experiencing discrimination were the significant attitudinal and experience predictors of trust.
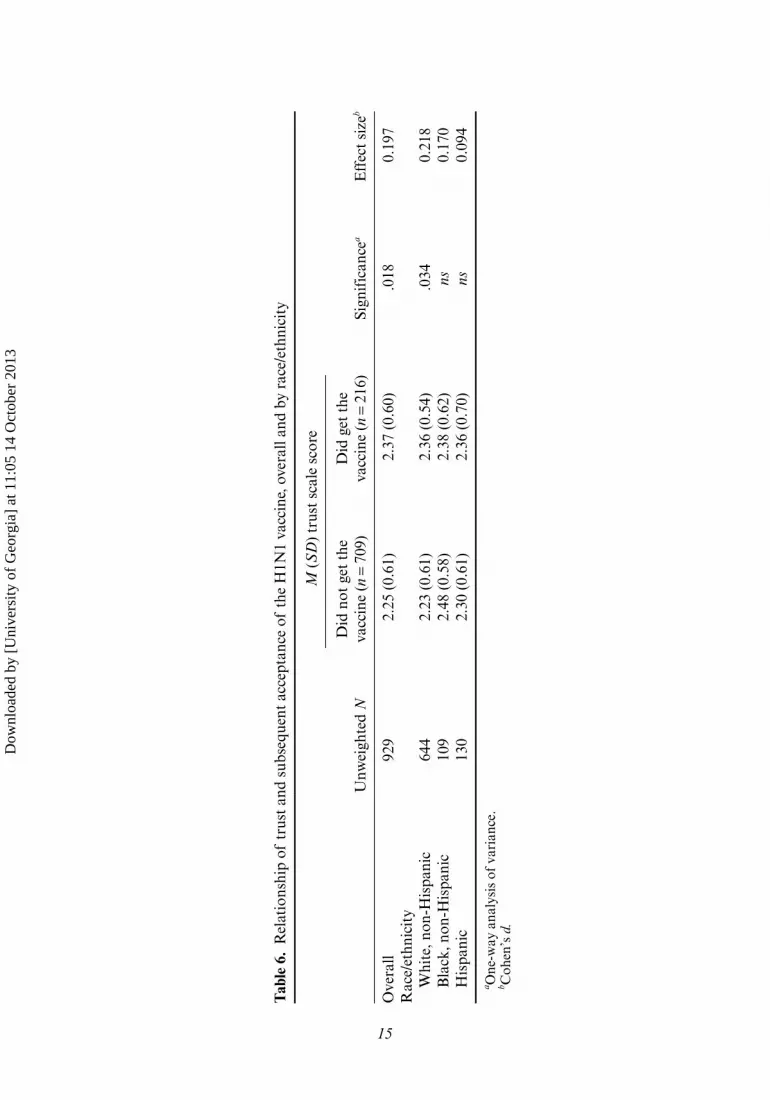
Finally, the last research question asked whether trust in government was related to subsequent vaccination behavior. To address this, we examined the mean levels on the trust in government scale of those who reported having gotten or not gotten the swine flu vaccine in the second survey, overall and by race/ethnicity. Because of the small number of “other” race individuals, we excluded this group from the race com-parison. Table 6 shows that there was a significant difference in trust between those who did not report getting the vaccine (mean 2.25) and those who reported getting it (mean 2.37). There were also significant race/ethnicity differences in these findings with the only significant relation between trust and vaccine acceptance found among the white respondents and, surprisingly, no significant relationship among Black and Hispanic respondents. Table 6 also shows the effect size for these relationships. A value of 0.2 for Cohen’s d (the effect size measure used) is considered small. Thus, it is evi-dent that the effect sizes of the relationship between trust and subsequent vaccine acceptance is small overall and for White non-Hispanic respondents.
Discussion
If there is any hope of controlling the spread of a highly infectious disease, it is critical that risk communications convince the public to follow government recommendations in the early stages of a crisis. Yet, it is during this period that uncertainty will be the greatest. How widespread is the threat? How severe will the disease be? What contain-ment measures will be most effective? The public will have to trust experts and officials before it cooperates with their recommendations. Previous research (Peters, Covello, & McCallum, 1997) has discovered that individuals and institutions are trusted when the public perceives that they are knowledgeable and expert, they are open and honest, and concerned and caring. The Pew trust in government surveys show us the chal-lenge involved in achieving these perceptions. Trust for government in general is at an all-time low (only 22% say they can trust the government in Washington, DC, almost always or most of the time) so it is unlikely that the public will automatically trust specific government recommendations during a crisis. Larson and colleagues (2011) outlined three reasons why trust in government recommendations may have eroded in recent years. First, trust is affected when public officials disagree over a policy recom-mendation. Second, communication has changed from top-down expert to consumer systems to non-hierarchical dialogue based systems. With these changes has come public questioning and emergence of dissent groups. Also, the media’s attempts to balance coverage by providing equal opportunity to all viewpoints has given outlier views equal attention.
Unlike most trust studies which use hypothetical scenarios, we surveyed a rep-resentative group of the public as it experienced the beginning of a real pandemic. Although this pandemic turned out to have much less severe disease than expected, in June 2009 when the survey was conducted there was considerable uncertainty about the path the pandemic would take and what government actions would be recom-mended. We found that trust in the government’s response was low among the public in general. Perhaps this low initial trust played a role in the subsequent low rate of vaccination and the concerns over the safety of a new vaccine. Trust varied among
Dow
nloa
ded
by [
Uni
vers
ity o
f G
eorg
ia]
at 1
1:05
14
Oct
ober
201
3
15
Tab
le 6
. R
elat
ions
hip
of t
rust
and
sub
sequ
ent
acce
ptan
ce o
f th
e H
1N1
vacc
ine,
ove
rall
and
by r
ace/
ethn
icit
y
Unw
eigh
ted
N
M (
SD
) tr
ust
scal
e sc
ore
Did
not
get
the
va
ccin
e (n
= 7
09)
Did
get
the
va
ccin
e (n
= 2
16)
Sign
ific
ance
aE
ffec
t si
zeb
Ove
rall
929
2.25
(0.
61)
2.37
(0.
60)
.018
0.19
7R
ace/
ethn
icit
y
Whi
te, n
on-H
ispa
nic
644
2.23
(0.
61)
2.36
(0.
54)
.034
0.21
8
Bla
ck, n
on-H
ispa
nic
109
2.48
(0.
58)
2.38
(0.
62)
ns0.
170
H
ispa
nic
130
2.30
(0.
61)
2.36
(0.
70)
ns0.
094
a One
-way
ana
lysi
s of
var
ianc
e.
b Coh
en’s
d.
Dow
nloa
ded
by [
Uni
vers
ity o
f G
eorg
ia]
at 1
1:05
14
Oct
ober
201
3

16 V. S. Freimuth et al.
different demographic groups. It is unfortunate that some of the groups with lower trust were those who would later be identified as priority groups for vaccinations (e.g., the younger adults). Similar to recent Pew data (The Pew Study, 2010) we found that both Blacks and Hispanics reported higher trust levels than did Whites. These results might reflect general levels of trust in the government, particularly early in the admin-istration of President Obama, or it may be that these groups felt particularly vulner-able to this illness because they had less ability to practice self-protective behaviors as they tended to live in more crowded conditions, use more public transportation, and have less ability to socially isolate themselves and their families (Quinn et al., 2011). Without the ability to protect themselves, they may have felt the need to place their trust in the government to protect them. Hispanics reported the highest amount of trust. Since this pandemic was first reported in Mexico, they may have had increased awareness of the threat and felt particularly susceptible to the illness.
Trust in individual spokespersons varied considerably (3.11 to 2.29 on a 4-point scale). The most trusted source was one’s own physician but, even in this case, there were demographic differences. Blacks and Hispanics trusted their own physicians less than did Whites. The same pattern emerged for the Centers for Disease Control and Prevention, which is the organization most likely to lead a public health response to an infectious disease crisis. Perhaps some historic precedents such as the Tuskegee Study and the anthrax crisis have eroded trust from minority groups for this organiza-tion that has enjoyed a higher level of trust from the public than most agencies of the federal government. One particularly disturbing finding was the low level of trust for local elected officials such as mayors and county commissioners. These individuals almost always emerge as local spokespersons in any kind of crisis, yet these results suggest they may not be very effective in establishing trust and cooperation. Given that local public health officials were near the top of the trust rankings, it would be sensible to use them as local spokespersons, or, at the very least, have them appearing with local elected officials. Although religious leaders are trusted little in this kind of crisis in general, they are much more trusted by Blacks.
The measure of trust we used, which was based on qualitative research with Blacks and quantitative research with general audiences, worked well. Commitment was the dimension of trust rated the highest, which is consistent with the earlier work of Peters and colleagues (1997) on dimensions of trust surrounding an environmental issue. Even though we did include an item that addressed competence, this item was highly correlated with the other trust questions and thus the results did not support two independent dimensions of trust suggested by many researchers such as Seigrist and colleagues (2003). Since the competence factor is based on past performance, it is possible that the pandemic was so novel and at such an early stage, the public had little feel for the government’s ability to perform well in managing it. Moreover, at this point in the pandemic, the government had taken little action. It was still unclear whether a vaccine would be produced and who would be recommended to take it. School clo-sures were occurring and were controversial but based on local decisions so may not have influenced the competence item very significantly. Future research should look at these issues longitudinally as an independent competence factor could emerge as the public has more opportunities to judge the government’s ability to manage the crisis.
Our results suggest that communication may play an important role in develop-ing a theoretical understanding of how trust develops. Involvement with the issue was positively related to trust. Those who reported higher levels of knowledge and were following the news more closely also reported higher trust. These findings suggest that
Dow
nloa
ded
by [
Uni
vers
ity o
f G
eorg
ia]
at 1
1:05
14
Oct
ober
201
3

Trust During Early Stages of 2009 H1N1 Pandemic 17
increased communication about a crisis should have a positive effect on trust. The key in this communication is getting the attention of those who are not interested or who are avoiding the topic. Direct experience with the pandemic, as indicated by reported cases in the community, was related to higher levels of trust. Perhaps those with more direct experience were satisfied with the government’s performance. It was so early in the pandemic when the survey occurred and so few had had this kind of experience that it is difficult to interpret this finding. It is not surprising that those who reported that they had experienced discrimination in health care in the past had lower levels of trust in the government, reinforcing the notion that trust is slow to earn but quickly lost. Only 12% of the sample reported this discrimination, but this group needs careful attention in the future to regain their trust.
There were statistically significant higher trust levels for white, non-Hispanic respondents who chose to get vaccinated than those who did not, but the differences were small and only explained small proportions of the variance in vaccine acceptance. For Blacks and Hispanics, trust in the government’s handling of H1N1 did not predict vaccine acceptance, results that certainly contradict conventional wisdom about the role of trust and health behaviors. Perhaps trust in government is less important in vaccine acceptance compared to its role in other health behaviors. In a recent Swiss study, trust in medical organizations, and not trust in government, was found to be predictive of actual vaccination status during the H1N1 pandemic (Gilles et al., 2011). One should also keep in mind that trust was measured in terms of the government’s handling of the pandemic, not specifically trust in vaccines. It is likely that measures of trust in the vaccine itself would be much stronger predictors of vaccine acceptance. Further study is needed to explore the relative importance of who and what is the object of the public’s trust in explaining vaccine acceptance. These results certainly suggest that a number of other factors were involved in explaining vaccine acceptance and future research should continue to try to identify what those factors are. This is particularly crucial given the significant attention given to vaccine critics in the media.
What are the practical implications of this research? First, there is a consistent pattern of results across this pandemic and other public health crises that the public does not necessarily trust the government’s recommendations and that lack of trust will affect the extent of its cooperation. There are some suggestions in these results on ways to enhance trust. The choice of spokespersons is critical. Although many have argued for a single spokesperson, this may be a naïve recommendation in a true national emer-gency. Given the pervasiveness of the mass media, there is a need for multiple spokes-persons, but there can be efforts to produce consistent messages and for official sources to be forthcoming about giving timely and complete information to the public, even if that information is not reassuring. These results clearly argue for the expert source rather than the political leader. They also argue for targeting of spokespersons to audi-ences when it is possible. For example, although religious leaders may not be effective for most audiences, they might enhance trust when used with Black audiences. Like-wise, a physician or public health official might be less trusted by Blacks than by other groups. Young adults represent a real challenge for public health officials. They trust spokespersons less in general and are accustomed to different kinds of relationships with their sources than are older audiences. Social media users, who tend to be younger, expect opportunities to dialogue with their spokespersons and do not react well to the role of passive audience member. Government agencies have begun to be active users of social media. The challenge will be to adapt the emergency messages to these new forms of media when time pressures are so intense and the information so critical.
Dow
nloa
ded
by [
Uni
vers
ity o
f G
eorg
ia]
at 1
1:05
14
Oct
ober
201
3
18 V. S. Freimuth et al.
The regression results demonstrate that much more work needs to be done to understand what contributes to trust in government during a public health emergency. Previous efforts to establish trust in a crisis have tended to focus on demographic groups often based on the assumption that trust was lower in minority groups. Results from this study corroborate other national polls such as Pew’s that measured gen-eral trust in government and challenge this assumption. Minority groups may trust government more than Whites do; however, that could be a temporal phenomenon related to the current Obama administration. Including all the standard demographic characteristics, we were able to explain only 4% of the variance in trust. It is clear that researchers need to look beyond demographics to understand trust differences. Even when we included the most obvious predictors of trust such as involvement, and rel-evant past experience including discrimination, we explained only 12% of the variance in trust, three times as what demographics alone could do. One direction this research should take in the future is to include political ideology in these analyses. Underly-ing values about the role of government may influence trust in government recom-mendations during a crisis. We also need more longitudinal research to see how trust fluctuates during an on-going crisis. At the time of this study, government action was minimal. It was not yet clear whether a vaccine would be developed or who would be recommended to take it. As the pandemic unfolded, many more issues arose that could affect trust such as perceived success or failure of the government’s early mitigation efforts such as school closures, safety of the vaccine, fairness of the priority groups and distribution systems. Researchers and practitioners need to understand trust bet-ter so they can work to strengthen it between crises to ensure it is in place when it could be a matter of life and death.
References
Associated Press. (2009, April 27). Swine flu prompts EU warning on travel to U.S. Ballantyne, C. (2009, May 1). Will Egypt’s plans to kill pigs protect it from swine—Sorry, H1N1
flu? Scientific American. Retrieved from http://www.scientificamerican.com/blog/post.cfm?id=will-egypts-plans-to-kill-pigs-prot-2009-05-01
Centers for Disease Control and Prevention. (2009). CDC guidance for responses to influenza for institutions of higher education during the 2009–2010 academic year. Atlanta, GA: Author.
Earle, T. C., & Siegrist, M. (2006). Morality information, performance information and the confidence. Journal of Applied Social Psychology, 36, 383–416.
Gilles, I., Bangerter, A., Clemence, A., Green, E. G. T., Krings, F., Staerkle, C., & Wagner-Egger, P. (2011). Trust in medical organizations predicts pandemic (H1N1) 2009 vaccina-tion behavior and perceived efficacy of protection measures in the Swiss public. European Journal of Epidemiology, 26, 203–210.
Hovland, C. I., Janis, I. L., & Kelley, H. H. (1953). Psychological studies of opinion change. New Haven, CT: Yale University Press.
Kasperson, R. E., & Tuler, S. (1992). Siting hazardous facilities and communicating risks under conditions of high social distrust. Journal of Social Issues, 48, 161–187.
Larson, H. J., Cooper, L. Z., Eskola, J., Katz, S. L., & Ratzan, S. (2011). Addressing the vaccine confidence gap. Lancet, 378, 526–535.
Masterson, K. (2009, September 10). Swine flu vaccine trials begin testing volunteers. National Public Radio.
Meredith, L. S., Eisenman, D. P., Rhodes, H., Ryan, G., & Long, A. (2007). Trust influences response to public health messages during a bioterrorist event. Journal of Health Com-munication, 12, 217–232.
Neil, T. (2009, August 7). CDC eases swine flu school closure guidance. MedPage Today.
Dow
nloa
ded
by [
Uni
vers
ity o
f G
eorg
ia]
at 1
1:05
14
Oct
ober
201
3
Trust During Early Stages of 2009 H1N1 Pandemic 19
Ong, C. M., Ho, K. Y., Hsu, L. Y., Lim, A. Y. T., Fisher, D. A., & Tambyah, P. A. (2009). React-ing to the emergence of swine-origin influenza A H1N1. The Lancet Infectious Diseases, 9, 397–398.
Peters, R. G., Covello, V. T., & McCallum, D. B. (1997). The determinants of trust and credibility in environmental risk communication: An empirical study. Risk Analysis, 17, 43–54.
Poortinga, W., & Pidgeon, N. F. (2003). Exploring the dimensionality of trust in risk regulation. Risk Analysis, 23, 961–972.
Quinn, S. C., Kumar, S., Freimuth, V. S., Kidwell, K., & Musa, D. (2009). Public willingness to take a vaccine or drug under Emergency Use Authorization during the 2009 H1N1 pan-demic. Biosecurity Bioterrorism, 7, 275–290.
Quinn, S. C., Kumar, S., Freimuth, V. S., Musa, D., Casteneda-Angarita, N., & Kidwell, K. (2011). Racial and ethnic disparities in exposure, susceptibility and access to health care for H1N1 influenza: Results of a national survey. American Journal of Public Health, 101, 285–293.
Renn, O., & Levine, D. (1991). Credibility and trust in risk communication. In R. E. Kasperson & P. J. M. Stallen (Eds.), Communicating risks to the public (pp. 175–218). Dordrecht, The Netherlands: Kluwer Academic.
Ruiz, R. (2009, October 30). Behind the H1N1 vaccine shortage. Forbes. Siegrist, M., Earle, T. C., & Gutscher, H. (2003). Test of a trust and confidence model in the
applied context of electromagnetic field (EMF) risks. Risk Analysis, 23, 705–716.Stern, A. M., & Markel, H. (2009). What Mexico taught the world About pandemic influenza
preparedness and community mitigation strategies. JAMA, 302, 1221–1222.The Pew Research Center for The People and the Press. (2010, April 18). The people and their
government: Distrust discontent, anger and partisan rancor. Washington, DC: Author.
Dow
nloa
ded
by [
Uni
vers
ity o
f G
eorg
ia]
at 1
1:05
14
Oct
ober
201
3