transport mechanism in ion-exchange pervaporation membranes: dehydration of water-ethanol mixture by...
TRANSCRIPT
journal of MEMBRANE
SCIENCE
E L S E V I E R Journal of Membrane Science 133 (1997) 255-267
Transport mechanism in ion-exchange pervaporation membranes: Dehydration of water-ethanol mixture by sodium polyethylene
sulphonate membranes
V. F r e g e r a, E . K o r l n ' , J. W i s n i a k a, E . K o r n g o l d b
a Department of Chemical Engineering, Ben-Gurion University of the Negev, Beer-Sheva, Israel b The Institutes for Applied Research, Ben-Gurion University of the Negev, Beer-Sheva, Israel
Received 17 February 1997; received in revised form 2 April 1997; accepted 2 April 1997
Abstract
Pervaporation of a water-ethanol mixture with sulphonated polyethylene membranes of various capacities at various temperatures and for various feed compositions was studied both theoretically and experimentally. A model is proposed that accounts both for the effects of partial immobilization of water in the membrane due to adsorption by the groups and for the obstruction effect of the polymer matrix on the basis of percolation arguments. Analysis of the pervaporation data against the results of previous sorption experiments showed that the model is in fair agreement with the experiment. A number of peculiarities not predicted by the model and not observed for ethanol transport, such as enhanced diffusivity and selectivity and reduced apparent activation energy, were observed concerning the transport of water. These deviations are explained by assuming the existence of a selective facilitated mechanism of water transport. Other possible mechanisms are also discussed.
Keywords: Pervaporation; Ion-exchange membranes; Percolation; Sulphonated polyethylene; Water--ethanol mixture
1. Introduction
Pervaporation has proved to be an effective solution for the dehydration of organic liquids, and a number of high-performance membranes has been developed for this purpose. These membranes typically comprise highly hydrophilic groups fixed on a polymer matrix. The aim of the present study is to elucidate the mechanism that governs pervaporation transport and selectivity in membranes possessing ion-exchange groups. Since any proper study of the pervaporation
*Corresponding author. Fax: 972 7 64 72 916.
0376-7388/97/$17.00 O 1997 Elsevier Science B.V. All rights reserved. PI I S 0 3 7 6 - 7 3 8 8 ( 9 7 ) 0 0 0 8 0 - X
transport mechanism implies separate analysis of sorption and diffusion, the first part of our study [1] was devoted exclusively to the problem of preferential sorption (membrane-solution equilibrium). The pro- blem was approached from a particular point of view, that is, total sorption and sorption selectivity were analyzed with reference to capacity (ionogenic group content). Correspondingly, the experimental method used was based on a series of membranes of different capacities. It was shown that the experimental results may be described analytically by a model combining a per-group water sorption isotherm equation and a modified Setschenow equation. The former expresses the amount of water uptaken by a membrane and has
256 V. Freger et al./Journal o f Membrane Science 133 (1997) 255-267
been found to be capacity-independent, while the latter expresses the sorption selectivity as the solubi- lity of the organic component in the water uptaken by the polymer.
In the work reported below we pursue our study of the pervaporation properties of ion-exchange mem- branes described in Ref. [1] and focus on the permea- tion (diffusion) aspects of the phenomena. The permeability and pervaporation selectivity of the ion-exchange membranes are analyzed using the same experimental system as previously, that is, sulpho- nated polyethylene (SPE) membranes of various capa- cities and water-ethanol solutions. Again, especial emphasis is given to the effect of the capacity.
In contrast to pervaporation studies of non-polar systems (organics removal and separation), where the practice is to separate sorption and diffusion, most studies of water-selective pervaporation membranes tend to adopt an oversimplified approach whereby the sorption effects are not distinguished from the overall pervaporation effects and are erroneously (or perhaps deliberately) introduced into diffusivity-concentra- tion correlations.
This situation can probably be explained by the inapplicability of the conventional approaches to highly hydrophilic systems. An ion-exchange mem- brane swollen with an aqueous organic solution is fundamentally different from a hydrophobic mem- brane swollen with a non-polar organic solvent. The latter has a practically homogeneous structure in which the polymer is merely one of the components of a polymer solution, and it is amenable to Flory- Huggins' thermodynamic analysis [2,3]. Any ion- exchange membrane, on the other hand, is character- ized by strong clustering of solvent, and it is essen- tially a microscopic dispersion of an aqueous phase in a hydrophobic matrix, with a rather sharp boundary between the two phases. The existence of such hetero- geneous structures was first demonstrated by Gierke et al. [4] for Nation and was successfully exploited by Cabasso et al. [5,6] to explain the pervaporation properties of Nation and SPE membranes. The phe- nomenon seems to be common to both hydrophobic and hydrophilic polymeric membranes whenever aqueous organic solutions are involved, as has been demonstrated recently by Nguyen et al. [7]. The relevant properties of the phases (diffusivities and solubilities of the components of the liquid mixture)
are substantially different. Systems of this type, called 'disordered media,' occur in many fields of physics and chemistry and have been extensively studied during the last three decades [8]. In the study described below, we attempt to exploit some of the results obtained in this field, especially those relating to percolation theory [9] and to the problem of micro- scopic conduction of composite materials [10] (see also [11] for applications in chemical engineering). It should be noted that some results relating to transport in dense polymers using this approach have already been reported [12].
The variable we are interested in is the macroscopic diffusivity of the components of the solution in the membrane. From a number of studies on the macro- scopic properties of disordered media [8-11], it would appear that the most important parameter governing the macroscopic transport properties of a composite material (permeability, diffusivity, etc.) is the volume fraction of the dispersed phase (degree of swelling in our case). This conclusion is in very good agreement with the results of Blum et al. [13], who studied self- diffusivity of solvents in polymer solutions by NMR using the pulsed gradient spin-echo (PGSE) techni- que. Their experimental data for several polymer- solvent systems were fairly well described by a single curve expressing the ratio between diffusivity in solu- tion and bulk diffusivity at the same temperature as a function of the solvent volume fraction. However, the polymers involved in the study of Blum et al. did not contain ionic groups, and thus they can differ signifi- cantly from our system. As we will see, this difference can be absolutely crucial for the transport of water.
Concerning the problem of selectivity, our aim was to obtain a model relating sorption and pervaporation selectivities similar to the model relating flux and degree of swelling. As will be shown, this problem may also have its solution within the above transport model and the model of sorption selectivity proposed in our previous work.
Two important points should be mentioned regard- ing the applicability of the percolation model to our system. First, in the classical two-phase composite each phase is assumed to be uniform and characterized by the unique value of any transport property at any point occupied by the phase. In our case this assump- t ion- although realistic for the hydrophobic phase (the matrix) - is not entirely correct for the aqueous phase.
V Freger et al./Journal of Membrane Science 133 (1997) 255-267 257
Roughly speaking, the aqueous phase consists of the first solvation shells, where the molecules are largely immobilized, and 'free' solvent (higher solvation shells), whose transport characteristics are expected to be comparable with those of bulk water. Moreover, non-uniform distribution of the organic component in the aqueous phase may also cause substantial devia- tions from the pure two-phase model. Second, the volume fraction of the dispersed phase is not the only parameter determining the transport properties of the system, and the morphology and microstructure of the dispersed phase may also be very important [8,10]. Nevertheless, in view of the absence of specific pecu- liarities in the microstructure of the swollen mem- brane, this last factor may apparently be ignored. In the next section these problems will be addressed in greater detail.
The main purpose of the present work is, then, to analyse the mechanism of pervaporation transport in ion-exchange membranes using two concepts: immo- bilization of the solvent due to adsorption by ionic groups, and the obstruction effect resulting from the heterogeneity of the swollen ion-exchange membrane. In its main features our picture is similar to that proposed by Cabasso et al. [5], but we lay stress on the quantitative aspects of the problem. The swelling data obtained in our previous study become a crucial part of this analysis. By taking membranes of different capacities, we can distinguish between the effects of swelling and those of membrane selectivity (the pre- sence of an organic component inside the membrane) on the mechanism of water permeation. This is per- haps one of the most important advantages of our experimental method.
2. Transport model
2.1. Transport o f water
The present study is based on the standard solution- diffusion model in which the components of the mixture are assumed to cross the membrane by means of diffusion. We will consider two diffusion equations, the simple Fick equation
Ji : -DimdCi /dz (1)
and the more rigorous and general equation of Darken,
Prager and Crank [14]
Ji = -DimCidlnai / dz (2)
where Ji, Dim, Ci, and ai are the flux, the diffusivity in the membrane, and the concentration and activity of component i, respectively, and z is the coordinate normal to the membrane surface.
It should be noted that Eqs. (1) and (2) are valid only in the absence of convective motion in the liquid; otherwise, a convective term should be added to the right part. To solve Eqs. (1) and (2), two kinds of functions have to be provided explicitly for each component: Ci as a function of ai (generally, of the activities of all liquid components), and Dim as a function of Cis or ais. The first problem has already been examined [1], and the second - the diffusivity- concentration dependence - will be considered below.
Consider once again a water-ethanol mixture. Even for the least selective (lowest capacity) membrane used here, the water flux was much greater than the ethanol flux. For this reason, and recalling that ethanol has only a minor effect on sorption of water [1], the presence of ethanol may be neglected in the analysis of water permeation. As shown previously [1], uptake of water by Na-SPE membranes may be described by the following equation:
Cw = Qpnw (aw) (3)
where Q is the capacity of the membrane (in eq/kg of PE), p the density of PE, and nw is the sorption of water per ionogenic group, which depends on water activity and is practically independent of capacity in the region of capacities involved. The subscript 'w ' stands for water. Eq. (2) now reads
Jw = - Dwm Cwdlnaw / dz (4)
where Cw is given by Eq. (3). Note that, since the flux is related to the dry membrane, the concentrations are also related to the volume of the PE matrix, which is practically equal to the volume of the dry membrane.
As already mentioned, the solvent uptaken by the membrane comprises at least two 'phases' character- ized by different mobilities of water molecules. In general, one should consider the distribution of dif- ferent states of water to be characterized by some thermodynamic coordinate and introduce diffusivity as a function of this coordinate. The diffusion coeffi- cient Dwm in Eq. (4) is, therefore, an apparent para-
258 V Freger et al./Journal of Membrane Science 133 (1997) 255-267
meter obtained by averaging the diffusivities over all possible states. In order to simplify the situation, we will consider only two states: water in the first solva- tion shells (bound water), and the rest of the water uptaken by the membrane (free water). The apparent diffusivity is thus given by
DwmCw b b f f : + DwmC w (5) D wm Cw
where the superscripts 'b ' and ' f ' denote bound and free water, respectively. Assume next that the diffu- sivity of the bound water is negligible compared to that of free water. This assumption (arbitrary to some extent) is supported by the fact that water molecules in primary hydration shells of ions in solution are largely immobilized as has been demonstrated in many stu- dies; for example, those on the mobility of ions in solution [15]. The apparent diffusivity reduces to
DwmCw f f = DwmC w (6)
Comparing Eqs. (4) and (6), we obtain
Jw = D f m C f dlnaw/dz (7)
The concentration of free water Cfw may be esti- mated as follows. We have shown previously [1] that the function nw(aw) may be expressed through the modified BET equation:
noKkaw nw(aw) : (1 - kaw + Kkaw)(1 - kaw) (8)
where no, K, and k are fitting parameters. The physical meaning of the parameters suggests that Eq. (8) may be split into a Langmuir isotherm giving the amount of bound water per group, and the difference n f between total sorption and bound water, which gives the amount of free water per group:
b _ noKkaw (9a) nw 1 + Kkaw
f b n w = nw - n w (9b)
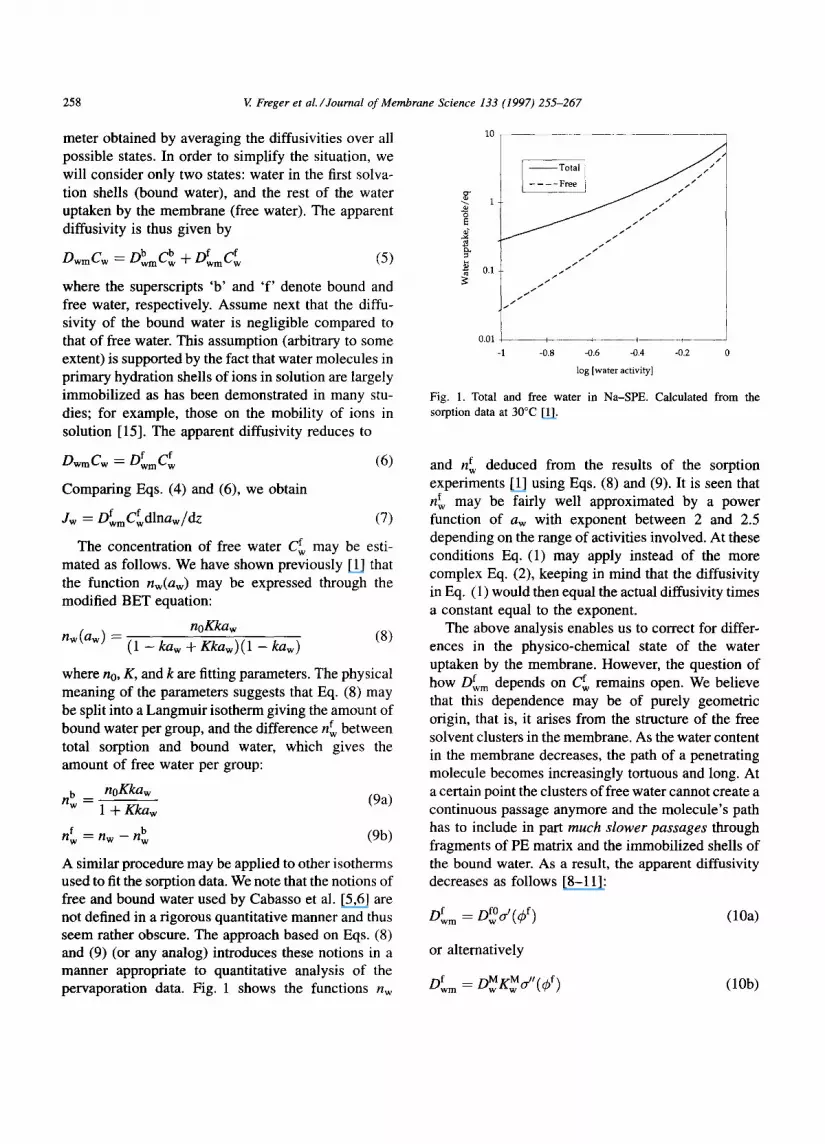
A similar procedure may be applied to other isotherms used to fit the sorption data. We note that the notions of free and bound water used by Cabasso et al. [5,6] are not defined in a rigorous quantitative manner and thus seem rather obscure. The approach based on Eqs. (8) and (9) (or any analog) introduces these notions in a manner appropriate to quantitative analysis of the pervaporation data. Fig. 1 shows the functions nw
10
"-. 1
0.1
i Total i L . . . . F~e j J /
~ / / j l / / / J 1/
/ t / / /
/ / 1/ /
f / .s / / / / /
0.01 i -
-1 -0.8 -0.6 -0.4 -0.2
log [water activity]
F ig . 1. Total and f ree w a t e r in N a - S P E . Ca l c u l a t e d f r o m the
so rp t ion da ta at 3 0 ° C [1].
f deduced from the results of the sorption and n w experiments [1] using Eqs. (8) and (9). It is seen that
f may be fairly well approximated by a power rt w
function of aw with exponent between 2 and 2.5 depending on the range of activities involved. At these conditions Eq. (1) may apply instead of the more complex Eq. (2), keeping in mind that the diffusivity in Eq. (1) would then equal the actual diffusivity times a constant equal to the exponent.
The above analysis enables us to correct for differ- ences in the physico-chemical state of the water uptaken by the membrane. However, the question of
f how Dwm depends on Cfw remains open. We believe that this dependence may be of purely geometric origin, that is, it arises from the structure of the free solvent clusters in the membrane. As the water content in the membrane decreases, the path of a penetrating molecule becomes increasingly tortuous and long. At a certain point the clusters of free water cannot create a continuous passage anymore and the molecule's path has to include in part much slower passages through fragments of PE matrix and the immobilized shells of the bound water. As a result, the apparent diffusivity decreases as follows [8-11]:
f fO f Dwm = Dwc/(~b ) (10a)
or alternatively
f = DMwwKMO~'(J) (lOb) Owm

V Freger et al./Journal of Membrane Science 133 (1997) 255-267 259
where D~ is the diffusivity corresponding to 0 f ---- 1, that is, the bulk diffusivity, D~w is the diffusivity of water in the matrix, Kw M is the solubility of water in the matrix, and O f is the volume fraction of free solvent in the membrane. Functions a ' and d t, which differ only
0 M M by a factor Dfw~/(DwK~ ), are called conductivity factors and express the obstruction effect of the geo- metry of the conducting phase. In general, for a given system microgeometry, functions d or d ~ will depend on the ratio of the conductivities of the phases and the volume fraction of the conductive phase. A number of general explicit formulae have been worked out for estimating the conductivity factor of two-phase com- posites for various microstructures [10]. Unfortu- nately, most give the solution in the form of exact upper and lower bounds. These bounds become exceedingly distant from each other when the con- ductivities of the different phases differ very substan- tially, as in our case. Accordingly, here we will use an analysis based on percolation theory arguments, that is, on general considerations relating to phase con- nectivity and continuity.
For many ideal regular two-phase arrangements (networks), the conductivity factor ~r is characterized by the occurrence of a limiting value of the volume fraction called a percolation threshold below which the apparent conductivity (diffusivity) falls to zero (assuming the matrix to be absolutely non-conduct- ing). Above and not too far from the percolation threshold, the conductivity of regular networks has been proven to obey a power law the exponent of which is a universal constant. Though real continuum composite media generally exhibit similar behavior, many deviations occur. Thus, some systems show no percolation threshold or one very close to zero (the so- called Archie's law [16]). It has also been shown that in certain cases the exponent may be strongly depen- dent on the geometry of the phases' interception [ 17]. Peculiarities of microstructure or a finite conductivity of the matrix may additionally complicate the picture [101.
We expect the geometry of the phase interface to be similar for membranes of different capacities but comprising the same ionogenic groups and matrix. Hence the variation of the conductivity factor cr with O f is expected to be the same for all the membranes. Therefore, the model equation for pervaporative transport of water may be written
as follows:
Jw f0 # f f = - D w ~ (0)Cwdlnaw/dz (11)
where 0 f and C f (in m 3 of water per m 3 of PE in our case) are related to each other by
O f ~--- c f / ( 1 + C f ) ~ Cfw (12)
Beating in mind the considerations presented after Eq. (9) and assuming zero permeate pressure, we obtain the solution of Eq. (11) as follows:
Lao C~o D f dC f Jw 6 -1 f f 6-1 f = DwmCwdlnaw ~ Jo --wm--w
fo f * ~ ~,~ (O w/6) ot(Of)dO f dO
and finally
Jw fO t f = (Ow/6)~ (00) (13)
where 6 is the membrane thickness, 0 f is the equili- brium water content at the feed side of the membrane, and (t is some function which should be invariant for various capacities. Under these assumptions Eq. (13) is valid for all the membranes considered in the present study. Of course, a similar equation could be obtained by using Eq. (10b) as starting point. Another function ~" would then be obtained which would differ from ( ' only by the constant factor mentioned above. It is also seen from Eq. (13) that if d is a power function of O f, then ( ' has to be a power function of O f with exponent greater by 1 than that of o s.
It would be very useful to be able to develop functions q and ( in explicit form. Unfortunately, in the present state of percolation theory and of other approaches dealing with the conductivity of composite media, an explicit derivation of these functions is not possible, and therefore approximate qualitative and semiqualitative methods seem appropriate. The kind of arguments we will apply were first proposed by Ambegaokar et al. [ 18] and are known as critical path analysis. Ambegaokar et al. assumed that the resis- tivity of a network with a wide distribution of bond resistivities is determined primarily by the resistivity of the bonds of least possible resistivity (the 'critical' bonds), which together with the bonds of lower resis- tivity just form an infinite cluster. In our system, the critical bonds are the critical channels or 'necks'
260 V. Freger et aL /Journal o f Membrane Science 133 (1997) 255-267
connecting the clusters of free solvent if the system lies above the percolation threshold, that is, if the free solvent phase is infinitely connected, or the critical matrix fragments separating the clusters if the system lies below the percolation threshold. By critical matrix fragments in the latter case is meant the fragments of least possible resistivity, which if replaced together with the matrix fragments of lower resistivity with solvent would lead to infinite connectedness of the free solvent phase. For many cases this idea would provide an excellent way of estimating the system conductivity. Unfortunately, even for the simplest case of an absolutely non-conducting matrix - let alone in our case - correct application of this idea would be a non-trivial task (see [17,18]). This is why explicit derivation of the functions (r and ( was not attempted. Nevertheless, the notion of 'critical bond' seems to be very useful for the analysis of two other important aspects of pervaporation - temperature dependence and selectivity.
As was first pointed out by Pike et al. [19], the temperature dependence of the diffusivity (in terms of apparent activation energy) of a composite material depends on which percolation regime is actually operative, that is, on whether the system lies above or below the percolation threshold. In the idealized picture the activation energy is determined by that of macroscopic diffusivity of the material which consti- tutes the critical bond, that is, free solvent or matrix. The activation energy of diffusivity in these two phases corresponds to the activation energy of bulk diffusivity D~ or matrix permeability D~Kw M, respec- tively, which are assumed to be independent of mem- brane capacity and water content. In principle, the former should be close to the coefficient of self- diffusion of water and the latter to the permeability of PE. However, due to the finite ratio of the diffusiv- ities in the two phases the real picture is not ideal, and there has to be a transition region in which the critical path may include both very narrow solvent channels and very thin matrix fragments. In this region the apparent activation energy should gradually change as the free solvent content changes.
In the case of the flux the situation is complicated by two factors - the temperature dependence of water uptake, and non-uniform conditions in the membrane as a result of the concentration gradient. Since water uptake by ion-exchange materials is known to be
rather insensitive to temperature [20], the first factor may apparently be ignored. Concerning the latter, it should be noted that the flux is proportional to fDidCi. Since, as we shall see, diffusivity rises very rapidly with concentration, the contribution of the dry downstream side of the membrane to the integral is practically negligible and may be ignored. The appar- ent activation energy of the flux should thus be very close to that of the diffusivity at the feed side of the membrane.
Thus, an investigation of the temperature depen- dence of the pervaporative flux or diffusivity could provide valuable information about the structure of the working membrane and the mechanism of pervapora- tive transport and selectivity (see next section).
2.2. Transport of ethanol
We will now attempt to estimate the selectivity or, more specifically, the concentration of ethanol in the permeate using the same approach. For the transport of ethanol we assume that it is described by a relation equivalent to Eq. (2):
Je = - D em Ced lnae / d z (14)
where the index 'e ' denotes ethanol. As the ethanol inside the membrane is for the most part dissolved in a very large amount of water and is presumably dragged by the moving water, Eq. (14) should in general contain a convection term. For simplicity we assume (reasonably, as will be shown later) that the rate of mass transfer in most of the concentration range is determined by diffusion through the fragments of the matrix. The concentration of both water and ethanol in the matrix always remains very low and the dragging effect is not expected to occur, hence no convective term is required.
Since the solubilities of water and ethanol in PE are very low and thus inconvenient to use, it is accepted practice to express the permeability of PE to a liquid component in terms of a transmission number Q, defined as the flux of a neat solvent through a film multiplied by the film thickness. This parameter is easy to measure experimentally. It is seen from the definition of Q and Eq. (2) or (14) that Q may be expressed as the product of D and "7 -- C/a, where the latter is the activity coefficient of the solvent in the matrix. D, "7 and therefore Q are practically constant at

E Freger et al./Journal of Membrane Science 133 (1997) 255-267 2 6 1
a given temperature due to the very low concentration of the solvent. Eqs. (2) and (14) may be transformed, therefore, into:
Ji z Qimdai /dz (15)
where the index ' i ' is either 'w ' or 'e ' . As ethanol is primarily found inside the membrane
in the same phase as water, transport of the mixed solvent may be analyzed using the same type of arguments as for water, that is, critical path analysis. As discussed in the previous section, the microscopic values of Qm for ethanol and water are determined by the resistance of the critical matrix fragments. It is important to emphasize that the fragments are the same for both components. At this point our picture is different from that of Cabasso et al. [5], who assume that the transport of an organic component occurs as diffusion within the entire matrix. Taking Eq. (15) for ethanol and water and dividing them by each other, we see that the ratio of the apparent transmission numbers at each point should simply be equal to the ratio of those of the matrix material. Assuming zero activities at the permeate side and integrating, we obtain for the composition of the permeate
Xp = Je/Jw = (aem/awm)(ae/aw)z=O
= (Q~/Qw)M(a~/aw)z=O (16)
Next, we have to consider that the electrostatic field of the ionic groups, which is responsible for the salt- ing-out effect and hence the sorption selectivity as has been shown previously [1], extends throughout the ion-exchange membrane, including the matrix. The solubilities (activity coefficients) of water and ethanol in the matrix change accordingly. This fact may be allowed by replacing the ratio of activities in Eq. (16) by a different, 'effective' ratio. We will take this effective ratio to be the ratio of the 'free' activities of the components of the solvent phase inside the membrane; that is, the activities calculated as if the solvent confined in the membrane were free. (The validity of this assumption has yet to be proven; however, it is based on our intuitive expectation that the electrostatic contribution 'shifts' the ratio of activ- ity coefficients to the same degree in the matrix and in the solvent phase.) Since the ethanol content in the membrane is relatively low, the water 'free' activity is close to 1. The ethanol 'free' activity may be calcu-
lated as
a e = Xe~Ye (17)
where ",/~ is the 'free' activity coefficient of ethanol and x e is the 'free' ethanol content in the membrane. Since the ethanol concentration is low, the activity coefficient should be close to the activity coefficient of ethanol in water at infinite dilution, 7~- Thus, we arrive at the following equation for the ethanol content in the permeate:
M * , , Xp = (Oe/aw) 'Te(Xe)z=0 = A(Xe)z=O
P E oc~ * ( a e / a w ) ~/~ (Xe)z=0 (18)
In the last approximate equality we implicitly assume that the permeability (transmission numbers) of the matrix is similar to that of PE. The significance of Eq. (18) is that it connects the pervaporation and the sorption selectivity (the latter is the last quantity in the equations) and, in addition, predicts that they should be proportional to each other. Note that all the quan- tifies in Eq. (18) are, in principle, available or easily measured.
Concerning the temperature dependence, all our remarks in the previous section regarding the tem- perature dependence of the water flux are also valid for the ethanol flux. We may therefore expect the apparent activation energy of the ethanol flux to be close to that characterizing the permeability of PE to ethanol, which is, of course, different from that characterizing the permeability to water. Of course, this statement is true when the critical path includes fragments of matrix. Otherwise, the activation energies of water and of the ethanol fluxes should be almost identical, as is typical for the diffusion coefficients of components in the same solution.
3. Experimental
To ensure that the results obtained for the sorption tests [1] might be applicable to the analysis of the pervaporation experiments reported here, we used the same membranes and solutions, that is, sodium poly- ethylene sulphonate (Na-SPE) membranes with capa- cities similar to those used in the sorption tests and water-ethanol mixtures. The methods of preparation and characterization of the membranes have been
262 V. Freger et al./Journal of Membrane Science 133 (1997) 255-267
described elsewhere [1,21,22]. The membranes were hollow fibers of 200~tm thickness, 2.0 mm outer diameter and 0.3 to 0.5 m length, prepared from PE fibers of the same dimensions. The capacities of the membranes were in the range of 0.85 to 4.80 meq/g on a PE basis. The fiber used for the PE permeability measurements was of 1.25 m length.
We believe that these comparatively thick hollow- fiber membranes offer some clear advantages for pervaporation studies. Due to the relatively high flux and sufficiently large surface area, pervaporation experiments may be performed using a single fiber. This feature helps avoid the flow maldistribution typical for fibers in a bundle, and it also keeps the circulation rate at the desired level. In addition, hol- low-fiber membranes need no porous support, so that flux measurements are not influenced by the support resistance.
The experimental setup is shown in Fig. 2. A feed solution (water-ethanol mixture) was thermostatted in a large flask and circulated through a hollow-fiber membrane by means of a pump. The hollow fiber was located inside a round-bottom flask connected to a vacuum system, the permeate vapor was permanently removed from the flask and the permeate was collected in a cold trap cooled by liquid nitrogen. The amount of solution (100 to 500 ml) was large enough to ensure that variations in solution composition during a test will be minor. The circulation rate in all tests was 100 ml/min - high enough to prevent concentration polarization and a temperature drop along the fiber. The measured temperature drop did not exceed 0.5 K and was considered negligible; the inlet temperature was taken as the working temperature. Depending on the flux, the residual pressure in the evacuated flask measured with a mercury manometer varied in the
Vacuum
Dow~ flask wilh Iq d t g
Fig. 2. Scheme of pervaporation tests.
range 0 to 1 kPa, but in each test it was at least an order of magnitude lower than the partial pressure of water over the solution and thus was taken as zero. In each test a starting period of 0.5 to 2 h (the higher the flux, the shorter the period) was allowed for the system to attain dynamic equilibrium before beginning perme- ate collection. For this purpose two cold traps were used, one for the starting period and the other for the measurements. Test duration (time of permeate col- lection) was from 1 to 9 h depending on the flux. At the end of the test the total amount of permeate was determined by weighing the trap, and the composi- tions of the permeate and the retentate were deter- mined by GC as described elsewhere [1]. From these measurements the total and component fluxes and selectivity were calculated. In flux calculations the mass of permeate was related to the surface area of dry membrane.
4. Results and discussion
4.1. Transport of water
In order to examine the validity of Eq. (13), all the permeation data, including different capacities and feed compositions, were plotted as water flux versus equilibrium water content at the feed side. The pertinent results are shown in Fig. 3 in two ways: (a) versus total water content and (b) versus free water content. The latter were calculated using the results of earlier sorption experiments [1] and Eq. (9) for free water. Since it is known [20] that the influence of temperature on membrane-water equilibrium is relatively weak, the difference between the tem- peratures of the pervaporation tests (313.15 K) and the sorption experiments (303.15 K) was considered insignificant. It is seen that, in contrast to Fig. 3(a), the experimental points in Fig. 3(b) fit fairly well on a common curve in agreement with Eq. (13). In the concentration range considered (about 0.03 to 0.3 volume fraction) the curve is fairly well approximated by the power function ~',-~ ((~f)n, where n ~3.66. The permeability of PE placed at zero concentration is also shown for comparison. The apparent diffusiv- ities were estimated from the permeation data using the following relationships (assuming zero concentra- tion at the permeate side and the Fick equation for

V. Freger et al./Journal of Membrane Science 133 (1997) 255-267 263
lO000 (a)
d
(b)
1000
100
10 ~ ~ ' 1 ~ ~ 4.46 meq/g
--x-- 4.65 meq/g
---x-- 4.80 meq/g ! I
0.1 0.2 0.3
Volume fraction of total water in the membrane
I0000 ...........................................................................................................................................................
lO00
"E I00 ~z
I0
0.4
I
O.l
i x * m & o
mK
PE permeability
. . . ~ I~tm x ~ x ' ~
. ~,,t *~ Axj O 0.85 meq/g
• 2.65 meq/g
• 3.78 meq/g
A4.46 meq/g
× 4.65 meq/g
X4 ,80 meq/g
0 0.05 0.1 0.15 0.2 0.25
Equil ibr ium free water volume fraction
Fig. 3. Water flux through a Na-SPE membrane at 313.15 K vs. (a) equilibrium total water content; (b) equilibrium free water content.
simplicity):
Dwm(J) = tSdJw/d~bfo ~ n6Jw/~ fo ~ (~bf) 266 (19)
The diffusivity plotted vs. free water content is shown in Fig. 4. The results of Blum et al. [13] are also shown for purposes of comparison. The latter data have been replotted from the graph presented in the original paper so as to give the self-diffusivity of water for ~b f = 1 at 313.15 K (3.2×10 -9 m E / s [23]). It is seen that the exponent corresponding to these data (2.57) is fairly close to the value found in the present work. Admittedly, Blum's data were obtained for a different
0.1
d
0.01
0.001 0.01
10 Neat water self-diffusivity
× Blum et aL
X0.85 meq/g
• 2.65 meq/g
• 3.78 meq/g
• 4.46 meq/g
• 4.80 meq/g
0.1
Volume fraction of free water in the membrane
Fig. 4. Apparent water diffusivity in Na-SPE at 40°C vs. free water content and extrapolation to the bulk water. The data of Blum et al. [13] are also shown.
concentration range (0.2 to 1 volume fraction), and thus the comparison is not strictly valid. Moreover, our data seem to lie near the transition area between two percolation regimes, while Blum's data relate primar- ily to a range well above the percolation threshold where the volume occupied by the solvent is con- nected. Nevertheless, from the graph it seems evident that the two series of experiments cannot join to form a single curve. Extrapolation of our data to neat water (O f :- 1) gives a value which is about 15 times higher than the self-diffusivity of water (Fig. 4).
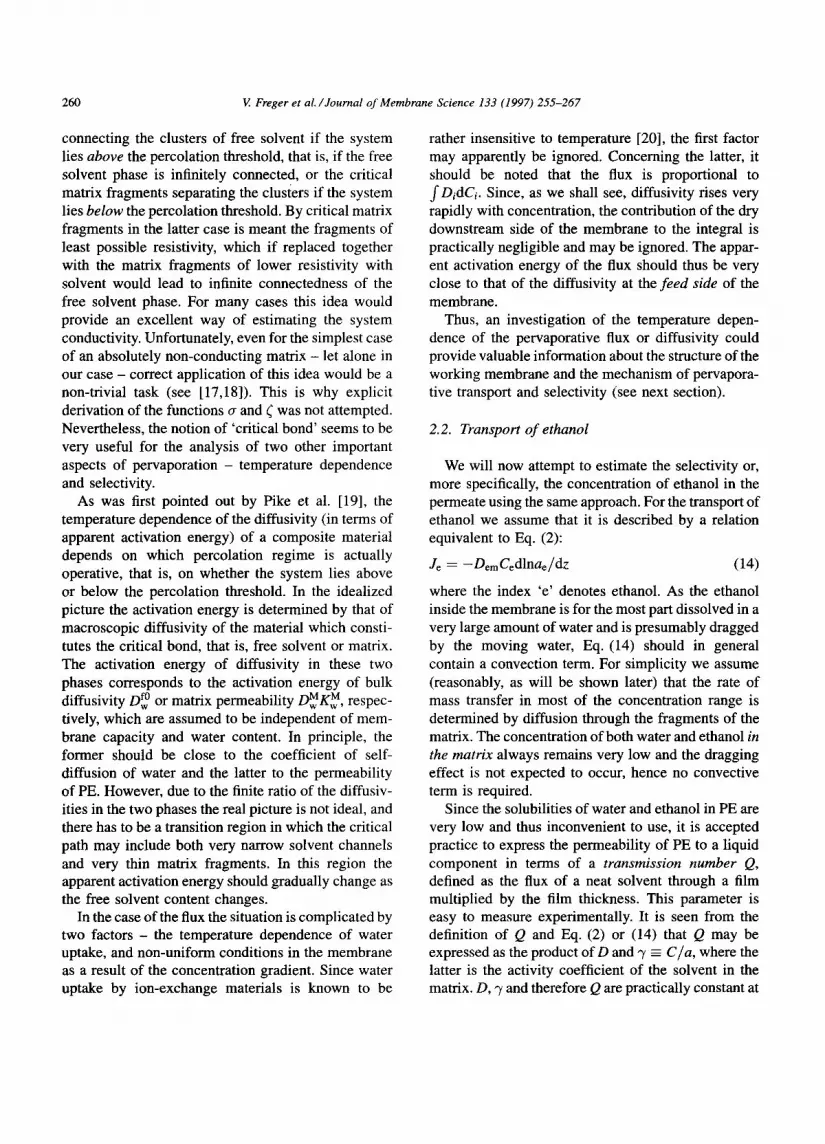
The temperature dependence of the water flux for two compositions of the feed solution was expressed in the form of an Arrhenius plot, as shown in Fig. 5. It is seen that similar apparent activation energies were obtained for samples of different capacity for a given feed solution, only small differences being observed for different feed compositions. Thus for water as feed solution (free solvent volume fraction in the mem- brane between 0.18 and 0.26 depending on capacity) the activation energy is estimated to be 25 kJ/mole, not very far from 31 kJ/mole for 80% ethanol solution (free solvent volume fraction about half as large, namely, 0.10 to 0.12). Similar values have been reported by Cabasso et al. [5,6] for the transport of water in Na-forms of Nation and SPE membranes. Our results lie well within the interval between values reported for water self-diffusion (17.8 kJ/mole, esti- mated from water self-diffusivity data [23]) and the experimentally determined permeability of PE film to water (47 kJ/mole; also shown in Fig. 5). One possi-
264 V Freger et al./Journal of Membrane Science 133 (1997) 255-267
10000
+ 265 meq/g ( I ) |00 • --t~--- 3.78 meq/g (I)
"--i~ 4 46 meq/g (I) + 4 . 6 5 meq/g (I) + 4 . 8 0 meq/g (I)
10 --{3-- 2.65 mcq/g (2) + 3.78 meq/g (2) + 480 meq/g (2) ---o-- PE (I)
0.1 2.9 3 3.1 3.2 3.3
10*/T, K '
Fig. 5. Arrhenius plot of water flux for membranes of different capacities and neat water (1) or 80% ethanol (2) as feed solution. The lowest line corresponds to PE permeability to water.
ble explanation is that we are dealing with the transi- tion area where the contributions of both matrix and solvent are still comparable, recalling the behavior described by Pike et al. [19] for binary alloys.
4.2. Transport o f ethanol and water
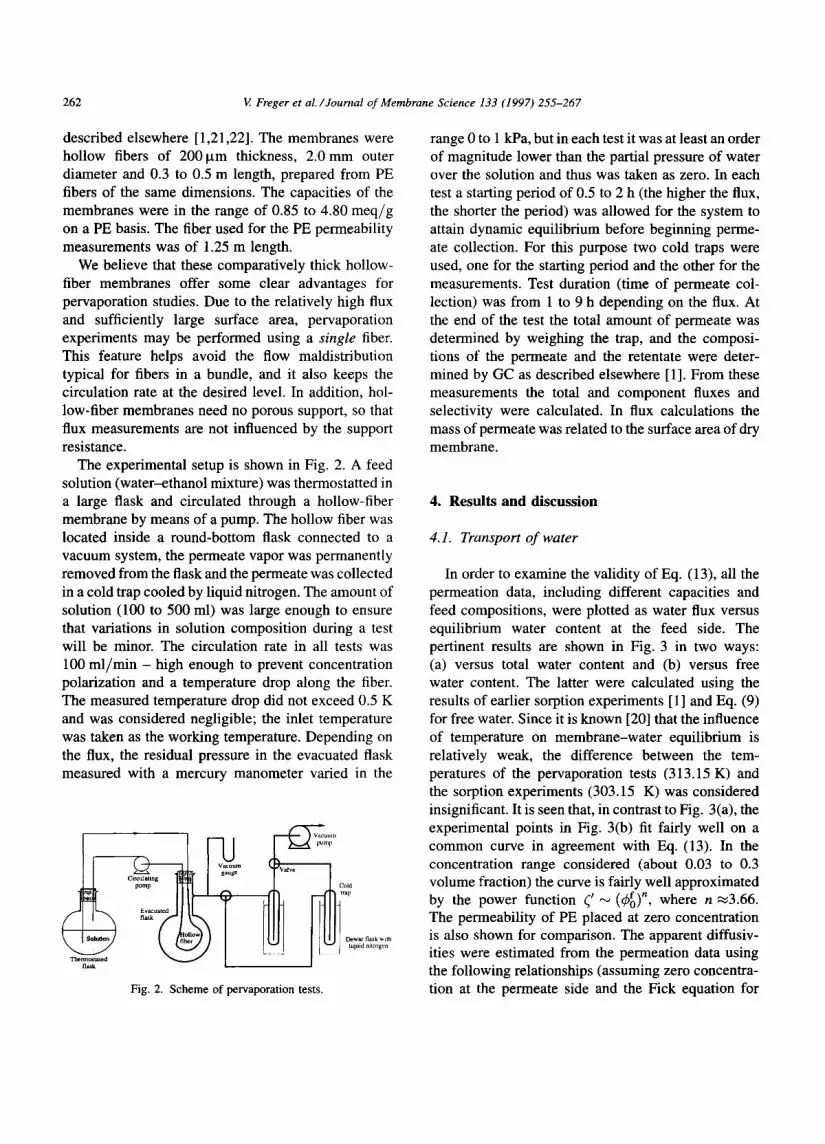
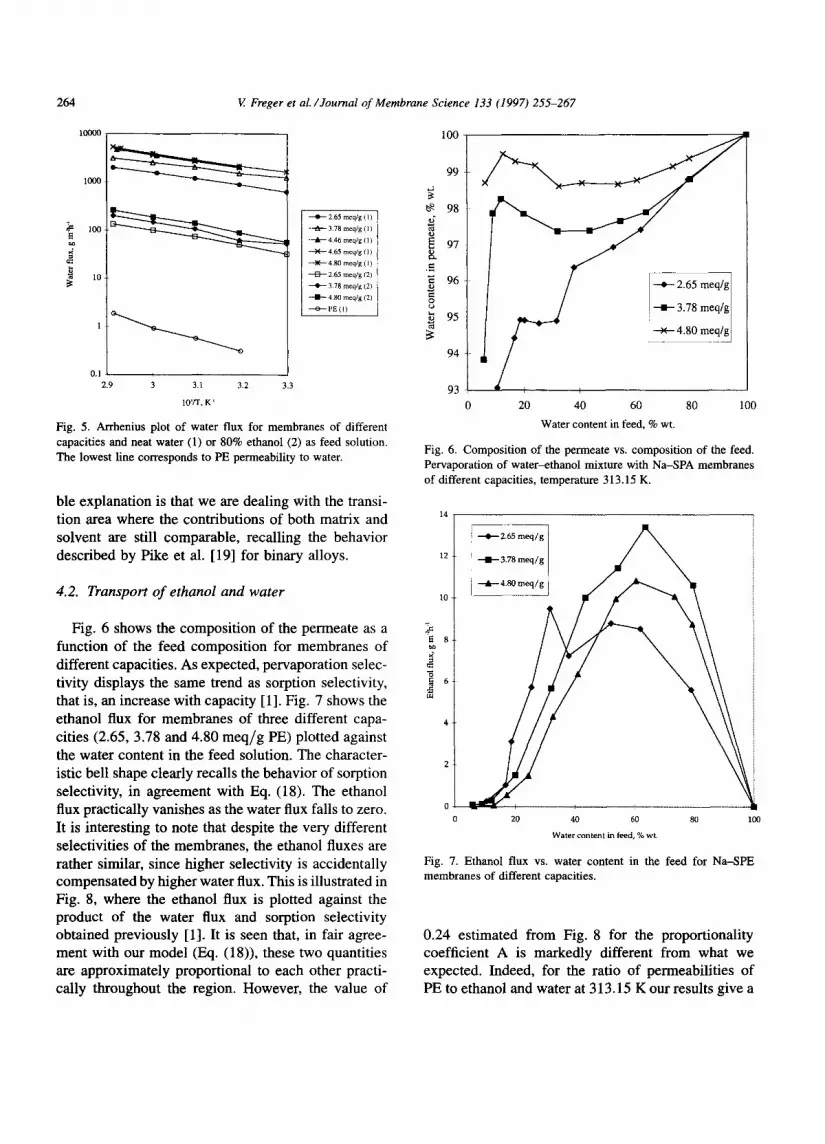
Fig. 6 shows the composit ion of the permeate as a function of the feed composit ion for membranes of different capacities. As expected, pervaporation selec- tivity displays the same trend as sorption selectivity, that is, an increase with capacity [1]. Fig. 7 shows the ethanol flux for membranes of three different capa- cities (2.65, 3.78 and 4.80 m e q / g PE) plotted against the water content in the feed solution. The character- istic bell shape clearly recalls the behavior of sorption selectivity, in agreement with Eq. (18). The ethanol flux practical ly vanishes as the water flux falls to zero. It is interesting to note that despite the very different selectivities of the membranes, the ethanol fluxes are rather similar, since higher selectivity is accidentally compensated by higher water flux. This is illustrated in Fig. 8, where the ethanol flux is plotted against the product of the water flux and sorption selectivity obtained previously [1]. It is seen that, in fair agree- ment with our model (Eq. (18)), these two quantities are approximately proportional to each other practi- cal ly throughout the region. However, the value of
100 -
99
98 i
! 9 7
"~ 96
~ 95 ' --x-- 4.80 meq/g
94
93 0 20 40 60 80 100
Water content in feed, % wt.
Fig. 6. Composition of the permeate vs. composition of the feed. Pervaporation of water-ethanol mixture with Na-SPA membranes of different capacities, temperature 313.15 K.
14
• 2.65 m e q / g / / ~
12 -'--II-- 3.78 m e q / g / .
• / g ]
10
4
2
0
80 100
Water content in feed, % wt.
Fig. 7. Ethanol flux vs. water content in the feed for Na-SPE membranes of different capacities.
0.24 est imated from Fig. 8 for the proportionali ty coefficient A is markedly different from what we expected. Indeed, for the ratio of permeabil i t ies of PE to ethanol and water at 313.15 K our results give a
V. Freger et al./Journal of Membrane Science 133 (1997) 255-267 265
100
e~
10
0.1
0.01
* 2.65 meq/g
• 3.78 meq/g
• 4.46 meq/g
x 4.65 meq/g
x 4.80 meq/g
x
• • 4*
xm
)K **A
0.01 0.1 1 10 100
Jwxe*, g m-2h ~
Fig. 8. Ethanol flux vs. water flux t imes sorption selectivity.
100
q/g (80% EtOH) i 1113.78 meq/g (80% EtOH) I [A C~0 mefi/g (80% EtOH) [ , × PE (neat EtOH) i
1
0.1 , ~ 2.9 3 3.1 3.2 3.3
10VT, K '
Fig. 9. Arrhenius plot of ethanol flux for membranes of different capacities and 80% ethanol feed solution and for PE film of the same thickness and with neat ethanol as feed solution.
value of about 3 (see Figs. 5 and 9), while ,,/~ may be estimated approximately as 5 [24]; thus A should equal about 15.
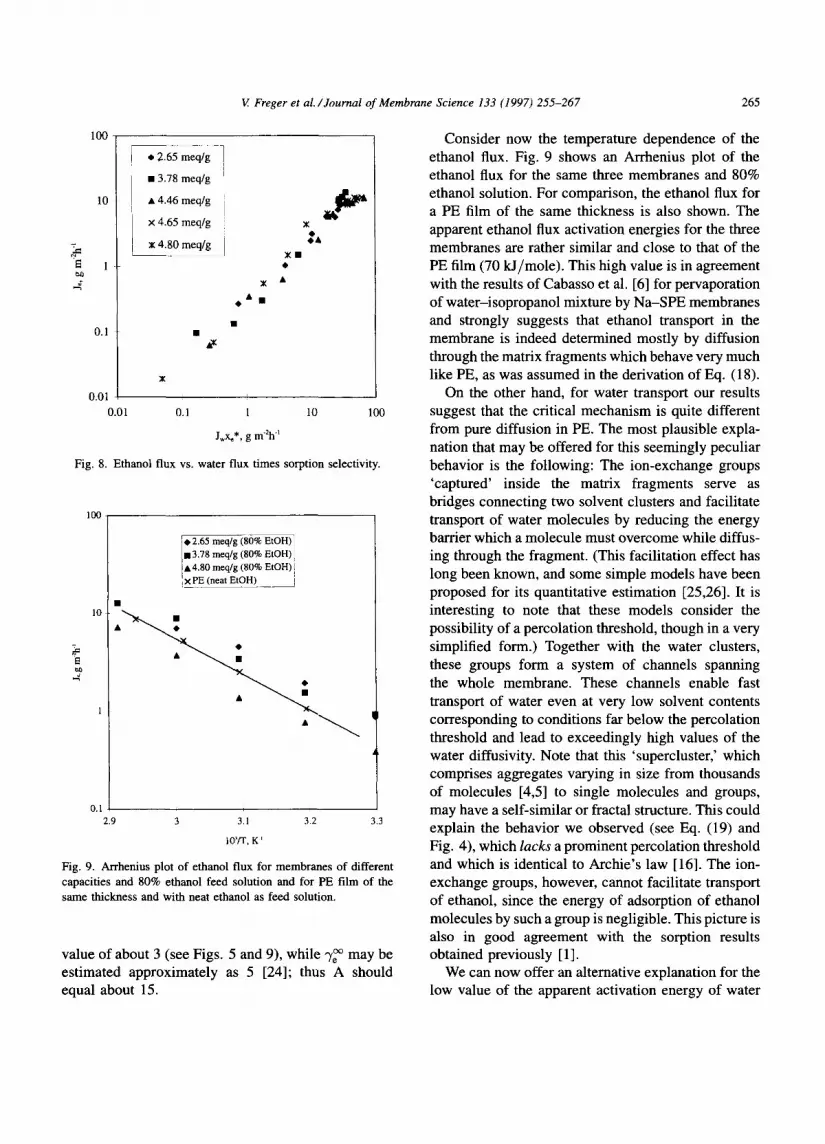
Consider now the temperature dependence of the ethanol flux. Fig. 9 shows an Arrhenius plot of the ethanol flux for the same three membranes and 80% ethanol solution. For comparison, the ethanol flux for a PE film of the same thickness is also shown. The apparent ethanol flux activation energies for the three membranes are rather similar and close to that of the PE film (70 kJ/mole). This high value is in agreement with the results of Cabasso et al. [6] for pervaporation of water-isopropanol mixture by Na-SPE membranes and strongly suggests that ethanol transport in the membrane is indeed determined mostly by diffusion through the matrix fragments which behave very much like PE, as was assumed in the derivation of Eq. (18).
On the other hand, for water transport our results suggest that the critical mechanism is quite different from pure diffusion in PE. The most plausible expla- nation that may be offered for this seemingly peculiar behavior is the following: The ion-exchange groups 'captured' inside the matrix fragments serve as bridges connecting two solvent clusters and facilitate transport of water molecules by reducing the energy barrier which a molecule must overcome while diffus- ing through the fragment. (This facilitation effect has long been known, and some simple models have been proposed for its quantitative estimation [25,26]. It is interesting to note that these models consider the possibility of a percolation threshold, though in a very simplified form.) Together with the water clusters, these groups form a system of channels spanning the whole membrane. These channels enable fast transport of water even at very low solvent contents corresponding to conditions far below the percolation threshold and lead to exceedingly high values of the water diffusivity. Note that this 'supercluster,' which comprises aggregates varying in size from thousands of molecules [4,5] to single molecules and groups, may have a self-similar or fractal structure. This could explain the behavior we observed (see Eq. (19) and Fig. 4), which lacks a prominent percolation threshold and which is identical to Archie's law [16]. The ion- exchange groups, however, cannot facilitate transport of ethanol, since the energy of adsorption of ethanol molecules by such a group is negligible. This picture is also in good agreement with the sorption results obtained previously [1].
We can now offer an alternative explanation for the low value of the apparent activation energy of water
266 V Freger et al./Journal of Membrane Science 133 (1997) 255-267
flux: the facilitated mechanism reduces it. It is also possible to explain the very low values of the para- meter A in Eq. (18). Indeed, in this situation the ratio of the permeabilities to ethanol and to water of the matrix is no longer equal to the ratio obtained with a PE film, and the increase in the apparent permeability of the PE matrix to water results in a decrease in the value of A. Taking into account the factor of about 15 derived from Fig. 4, we obtain a value close to 1 for coefficient A. This is much closer to the experimental result, though still higher. There are probably addi- tional effects that contribute to reducing the value ofA. Among them are:
(a) electrostatic effects (resulting from differences in the dielectric constants of the matrix and solvent or from other phenomena) that alter the salting-out effect and hence the effective ratio of activities in Eq. (17);
(b) immobilization of ethanol as a result of adsorp- tion on the solvent-matrix interface inside the mem- brane;
(c) the small size of the water molecule compared with ethanol. This could produce a sieving effect, because of the greater probability that the 'holes' (fluctuations of free volume) in thin matrix fragments will allow passage of water.
Another effect deserves special consideration. Since water molecules have a strong tendency to aggregate, they begin to move together as clusters when a driving force is applied. In this situation the environment of a molecule no longer behaves like a medium at rest, as in pure diffusion; instead, on the average, the environment moves in the same direction as the molecule. The collective character of this motion greatly resembles viscous flow in a system of capillary channels in a porous medium. Of course, because the force per molecule opposing the motion is smaller, it is more rapid than pure diffusion. Note that the method used by Blum et al. [13] (NMR-PGSE) deals with pure diffusion, where the medium is at rest. This is probably another reason why our curve and that of Blum (Fig. 4) do not join up. It is interesting that, as follows from the Stokes-Einstein formula, from the temperature dependence of the water flux it is practi- cally impossible to tell between viscous flow and diffusion, because the two have to have very similar apparent activation energies (15.1 M/mole - as esti- mated from water viscosity data [27] - and 17.8 kJ/mole, respectively). Some of the questions
raised here may hopefully be answered by NMR- PGSE measurement of water and ethanol diffusivities in a swollen SPE membrane. As noted earlier, this method makes it possible to obtain the diffusivities of the components directly and to totally eliminate the effect of collective motion, and thus to distinguish between the latter and the other effects considered above.
5. Conclusions
The pervaporation of water-ethanol mixtures was investigated using hollow-fiber SPE membrane of various capacities, the fluxes and selectivity of the water and ethanol being measured as a function of the composition and temperature of the feed solution. We propose a semiquantitative model based on a percola- tion concept to describe the transport of a mixed aqueous-organic solvent in an ion-exchange mem- brane. This model takes into account two facts: (a) the existence of different states of water adsorbed by the membrane, and (b) obstruction of diffusion of the liquid components in the membrane by the matrix. We show that the experimental data, presented as water flux vs. the equilibrium free solvent content in the membrane, are described in fair agreement with the model by a single curve from which the conductivity factor expressing the obstruction effect can be read off. The curve of diffusivity derived from these data turns out to be a power function with exponent 2.66 and lacking a prominent percolation threshold.
The experimental diffusivity of water was much higher than expected from the model based on the bulk self-diffusivity. In addition, the experimentally deter- mined temperature-dependence of the water flux and the pervaporation selectivity appear to be different from those predicted by the model for a matrix with properties identical to PE, although the latter is shown to be approximately proportional to the sorption selec- tivity in the whole range of concentrations in agree- ment with the model. For ethanol such effects were not detected. We attribute these results to facilitation of water transport due to the ionogenic groups present in SPE, which would explain both the enormously high diffusivity of water and the enhanced selectivity. Nevertheless, as this explanation does not seem enough, additional effects that might be responsible
v. Freger et al./Journal of Membrane Science 133 (1997) 255-267 267
for the p e c u l i a r b e h a v i o r o f the m e m b r a n e h a v e b e e n
br ie f ly d i scussed .
In conc lus ion , a l t h o u g h our m o d e l is in s e m i q u a n -
t i ta t ive a g r e e m e n t w i th the resu l t s o f the p e r v a p o r a t i o n
and so rp t ion e x p e r i m e n t s , a n u m b e r o f po in t s r e l a t i ng
to the p e r m e a t i o n and sepa ra t ion m e c h a n i s m r e m a i n to
b e c lar i f ied u s i n g m o r e soph i s t i ca t ed e x p e r i m e n t a l
m e t h o d s .
Acknowledgements
T h e au thors w o u l d l ike to t h a n k Mr. J. F r e i m a n and
Dr. Y. L a d y z h e n s k i i for k ind ly h e l p i n g in so lv ing the
t e chn i ca l p r o b l e m s an d to Mrs . A l i z a Sen for s ty l ing
the manusc r ip t .
References
[1] V. Freger, E. Korin, J. Wisniak and E. Komgold, Preferential sorption in ion-exchange pervaporation membranes: Sorption of water-ethanol mixture by sodium polyethylene sulphonate, J. Membrane Sci., 128 (1997) 151.
[2] M.H.V. Mulder, Thermodynamic principles of pervaporation, in R.Y.M. Huang (Ed.), Pervaporation Membrane Separation Processes, Elsevier, 1991.
[3] J.G.A. Bitter, Transport Mechanism in Membrane Separation Processes, Plenum Press, New York, 1991.
[4] T.D. Gierke, G.E. Munn and F.C. Wilson, The morphology in Nation perfluorinated membrane product, as determined by wide- and small-angle X-ray studies, J. Polym. Sci., Phys. Edn., 19 (1981) 1687.
[5] I. Cabasso and Z.Z. Liu, The permselectivity of ion-exchange membranes for non-electrolyte liquid mixture. I. Separation of alcohol-water mixtures with Nation hollow fibers, J. Membrane Sci., 24 (1985) 101.
[6] I. Cabasso, E. Korngold and Z.Z. Liu, On the separation of alcohol/water mixtures by polyethylene ion exchange membrane, J. Polym. Sci., Polym. Lett. Edn., 23 (1985) 577.
[7] Q.T. Nguyen, E. Favre, Z.H. Ping and J. N6el, Clustering of solvents in membranes and its influence on membrane transport properties, J. Membrane Sci., 113 (1996) 137.
[8] J.M. Ziman, Models of Disorder, Cambridge University Press, Cambridge, 1979.
[9] D. Staufer and A. Aharony, Introduction to Percolation Theory, Taylor and Francis, London, 1992.
[10] S. Torquato, Thermal conductivity of disordered heteroge- neous media from microstructure, Rev. Chem. Eng., 4 (1987) 151.
[11] K.K. Mohanty, J.M. Ottino and H.T. Davis, Reaction and transport in disordered media: Introduction of percolation concept, Chem. Eng. Sci, 37 (1982) 905.
[12] A. Adrover, M. Giona and M. Gassi, Analysis of controlled release in disordered structures: A percolation model, J. Membrane Sci., 113 (1996) 21.
[13] ED. Blum, S. Pickup and K.R. Foster, Solvent self-diffusion in polymer solutions, J. Colloid Interface Sci., 113 (1986) 336.
[14] J. Crank, Mathematics of Diffusion, 2nd edn., Clarendon Press, Oxford, 1975.
[15] B.E. Conway, Ion Hydration in Chemistry and Biophysics, Elsevier, 1981.
[16] P.N. Sen, Dielectric and acoustic response of rocks, in R. Burring, S. Childress and G. Papanicolaou (Eds.), Macro- scopic Properties of Disordered Media, Springer-Verlag, 1982.
[17] S. Feng, B.I. Halperin and P.N. Sen, Transport properties of continuum system near the percolation threshold, Phys. Rev. B, 35 (1987) 197.
[18] V. Ambegaokar, B.I. Halperin and J.S. Langer, Hopping conductivity in disordered systems, Phys. Rev. B, 4 (1971) 2612.
[19] G.E. Pike, W.J. Camp, C.H. Seager and G.L. McVay, Percolative aspects of diffusion in binary alloys, Phys. Rev. B, 10 (1974) 4909.
[20] E Helfferich, Ion Exchange, McGraw-Hill, New York, 1962. [21] E de Korosy and Y. Shorr, Polyethylene sulphochloride based
permselective membrane, U.S.A. Patent 3388080, 1963. [22] I. Cabasso and E. Komgold, Membrane permeation process
for dehydration of organic liquids mixtures using sulphonated ion-exchange polyalkene membranes, U.S.A. Patent 4728429, 1988.
[23] R. Mills and V.M.M. Lobo, Self-diffusivity in Electrolite Solution, Elsevier, 1989.
[24] R.C. Reid, J.M. Prausnitz and B.E. Poling, The Properties of Gases and Liquids, 3d edn., McGraw-Hill, 1987.
[25] R.D. Noble, Generalized microscopic mechanism of facili- tated transport in fixed site carrier membranes, J. Membrane Sci., 75 (1992) 121.
[26] E.L. Cussler, R. Aris and A. Bhown, On the limits of facilitated transport, J. Membrane Sci., 43 (1989) 149.
[27] CRC Handbook of Chemistry and Physics, R.C. Weast (Ed.), 56th edn., CRC Press, 1975, p. F-49.