transcriptome profiling of the small intestinal epithelium in germfree versus conventional piglets
TRANSCRIPT
BioMed CentralBMC Genomics
ss
Open AcceResearch articleTranscriptome profiling of the small intestinal epithelium in germfree versus conventional pigletsShankar R Chowdhury†1, Dale E King†1, Benjamin P Willing2, Mark R Band3, Jonathan E Beever1, Adrienne B Lane1, Juan J Loor1,4, Juan C Marini5, Laurie A Rund1, Lawrence B Schook1,4,6,7, Andrew G Van Kessel2 and H Rex Gaskins*1,4,6,7Address: 1Department of Animal Sciences, University of Illinois, Urbana, Illinois, 61801, USA, 2Department of Animal and Poultry Science, University of Saskatchewan, Saskatoon, S7N 5A8, Canada, 3W. M. Keck Center for Comparative and Functional Genomics, University of Illinois, Urbana, Illinois, 61801, USA, 4Division of Nutritional Sciences, University of Illinois, Urbana, Illinois, 61801, USA, 5U.S. Department of Agriculture/ARS Children's Nutrition Research Center, Department of Pediatrics, Baylor College of Medicine, Houston, Texas, 77030, USA, 6Department of Pathobiology, University of Illinois, Urbana, Illinois, 61801, USA and 7Institute for Genomic Biology, University of Illinois, Urbana, Illinois, 61801, USA
Email: Shankar R Chowdhury - [email protected]; Dale E King - [email protected]; Benjamin P Willing - [email protected]; Mark R Band - [email protected]; Jonathan E Beever - [email protected]; Adrienne B Lane - [email protected]; Juan J Loor - [email protected]; Juan C Marini - [email protected]; Laurie A Rund - [email protected]; Lawrence B Schook - [email protected]; Andrew G Van Kessel - [email protected]; H Rex Gaskins* - [email protected]
* Corresponding author †Equal contributors
AbstractBackground: To gain insight into host-microbe interactions in a piglet model, a functional genomics approach was usedto address the working hypothesis that transcriptionally regulated genes associated with promoting epithelial barrierfunction are activated as a defensive response to the intestinal microbiota. Cesarean-derived germfree (GF) newbornpiglets were colonized with adult swine feces, and villus and crypt epithelial cell transcriptomes from colonized and GFneonatal piglets were compared using laser-capture microdissection and high-density porcine oligonucleotide microarraytechnology.
Results: Consistent with our hypothesis, resident microbiota induced the expression of genes contributing to intestinalepithelial cell turnover, mucus biosynthesis, and priming of the immune system. Furthermore, differential expression ofgenes associated with antigen presentation (pan SLA class I, B2M, TAP1 and TAPBP) demonstrated that microbiota inducedimmune responses using a distinct regulatory mechanism common for these genes. Specifically, gene network analysisrevealed that microbial colonization activated both type I (IFNAR) and type II (IFNGR) interferon receptor mediatedsignaling cascades leading to enhanced expression of signal transducer and activator of transcription 1 (STAT1), STAT2and IFN regulatory factor 7 (IRF7) transcription factors and the induction of IFN-inducible genes as a reflection of intestinalepithelial inflammation. In addition, activated RNA expression of NF-kappa-B inhibitor alpha (NFκBIA; a.k.a I-kappa-B-alpha,IKBα) and toll interacting protein (TOLLIP), both inhibitors of inflammation, along with downregulated expression of theimmunoregulatory transcription factor GATA binding protein-1 (GATA1) is consistent with the maintenance of intestinalhomeostasis.
Conclusion: This study supports the concept that the intestinal epithelium has evolved to maintain a physiological stateof inflammation with respect to continuous microbial exposure, which serves to sustain a tight intestinal barrier whilepreventing overt inflammatory responses that would compromise barrier function.
Published: 5 July 2007
BMC Genomics 2007, 8:215 doi:10.1186/1471-2164-8-215
Received: 13 March 2007Accepted: 5 July 2007
This article is available from: http://www.biomedcentral.com/1471-2164/8/215
© 2007 Chowdhury et al; licensee BioMed Central Ltd. This is an Open Access article distributed under the terms of the Creative Commons Attribution License (http://creativecommons.org/licenses/by/2.0), which permits unrestricted use, distribution, and reproduction in any medium, provided the original work is properly cited.
Page 1 of 16(page number not for citation purposes)
BMC Genomics 2007, 8:215 http://www.biomedcentral.com/1471-2164/8/215
BackgroundThe gastrointestinal (GI) tract of the pig harbors a numer-ically dense and metabolically active microbiota com-prised mainly of bacteria [1]. Indeed, all animals have,and seemingly require, long-term cooperative associa-tions with indigenous bacteria in the GI tract. Studies withgnotobiotic animal models demonstrate most conclu-sively that indigenous bacteria stimulate the normal mat-uration of host tissues and provide key defense andnutritional functions [2]. This mutualistic relationshiphas been selected over evolutionary time resulting in a sta-ble microbiota in mature animals that is generally similarin composition and function in a diverse range of animalspecies [3].
Despite evolutionary stability, the intestinal microbiotadevelops in individual animals in a characteristic succes-sional pattern that requires substantial adaptation by thehost during early life. The impact of the developing micro-biota as well as the metabolic activities of climax commu-nities require special consideration when viewed in thecontext of pig production in which efficiency of animalgrowth is a primary objective [4].
The epithelial lining of the GI tract is characterized by ahigh cell turnover rate and the constant production of aprotective mucus coat. Together these two physiologicalprocesses provide effective innate defense against luminalthreats including those emanating from normal gut bacte-ria. In fact, epithelial cell turnover and secretory activityare both profoundly affected by the numbers, types, andspatial distribution of GI bacteria, with the latter micro-bial features being influenced by both exogenous andendogenous (host-derived) nutrients. Innate defensefunctions afforded by the epithelium are provided at theexpense of animal growth efficiency. Specifically, GI tis-sues represent only 5% of body weight (approximate) butthey receive a disproportionate fraction of cardiac outputand contribute 15–35% of whole body oxygen consump-tion and protein turnover [5-7]. Only 10% of the totalprotein synthesized by the GI tract is accumulated as newmass [8]; most proteins are lost in sloughed epithelialcells or as secreted products such as mucus.
Carriage of microbial populations capable of utilizingrefractory plant components enabled feral pigs to exploitdistinct habitats thereby enhancing survival and repro-ductive success. Animal growth efficiency is, however, aconcept introduced only upon domestication of the pig asa food animal. These issues provoke consideration of anoptimal gut microbiota for intestinal health versus itseffects on the efficiency of gastrointestinal and wholebody growth throughout the productive life cycle of a pig.However, the normal microbiota of the pig intestine hasreceived surprisingly little attention from an animal
growth perspective. In the present study, laser capturemicrodissection (LCM) and microarray analysis were usedto distinguish gene expression profiles in the small intes-tinal epithelium of GF versus conventional (CONV) neo-natal piglets. The genetic pathways induced are consistentwith the concept that the host responds to normal gut bac-teria by mounting epithelial defenses that presumablyimpact the efficiency of whole animal growth.
ResultsMicrobial status and animal performanceBacterial colony growth was not observed on cultures offecal swabs and cecal digesta of GF pigs indicating GF sta-tus was maintained. Cecal colonization (log CFU/g con-tents) in CONV pigs ranged from 8.1 to 9.5 and 8.5 to 9.7for total aerobes and anaerobes, respectively. All pigsappeared healthy with body weight gain (kg ± SE) over the14 day period of 1.26 ± 0.23 and 1.36 ± 0.17 for GF andCONV pigs, respectively.
Principal component analysisPCA analysis demonstrated that 60% of the variation ingene expression [component 1 (32%) and component 2(28%); see Additional file 1] was due to the state of micro-bial colonization (CONV versus GF). In contrast, 25% ofthe variation in gene expression (component 3) was dueto an epithelial compartment effect (crypt versus villi). Fif-teen percent of the variation (component 4) did not fol-low a distinct pattern of treatment or compartment effect,perhaps indicating a treatment-compartment interaction,variation due to the technical procedures involved in sam-ple preparation, sample variation (among piglets) or acombination of these factors [see Additional file 1]. Thus,most of the variation in gene expression was due to thetreatment effect with minor effects contributed by the epi-thelial-compartment and treatment-compartment inter-actions.
Gene expression in crypt versus villiSeventy genes, involved in transcription, cell proliferationand differentiation, nutrient transport and metabolism,and immune responses were differentially expressed (P <0.05) in CONV crypts compared with GF crypts [see Addi-tional file 2]. Twelve genes, mainly involved in immuneresponsiveness, were significantly upregulated in CONVversus GF villi [see Additional file 3]. These results indi-cate that, relative to proliferative crypt epithelial cells, dif-ferentiated and short-lived villus epithelial cells are lessresponsive to microbial colonization-induced geneexpression. Because the state of microbial colonizationelicited the greatest responses from the intestinal epithe-lium, subsequent analyses focused on the effects of intes-tinal microbiota irrespective of crypt versus villuscompartment effects.
Page 2 of 16(page number not for citation purposes)
BMC Genomics 2007, 8:215 http://www.biomedcentral.com/1471-2164/8/215
Microbiota effects on intestinal epithelial gene expressionA total of 223 genes were differentially expressed (P <0.05) in the intestinal epithelium (crypt plus villi) ofCONV relative to GF animals. Among them, 170 geneswere upregulated, and 53 genes were downregulated inCONV compared to GF epithelia. Differentially expressedgenes were categorized according to gene ontology (GO)biological processes: 10% in transcription, 9% in signaltransduction, 6% in cell proliferation, differentiation andregulation of cell growth, 5% in transport, 10% in metab-olism, 4% in electron transport mechanisms, 5% inimmune responsiveness, 23% were involved in 'other'processes and 28% encode genes of unknown function[see Additional file 4], which is consistent with knownlimitations in gene annotation in the current GO databaseof porcine genes [9].
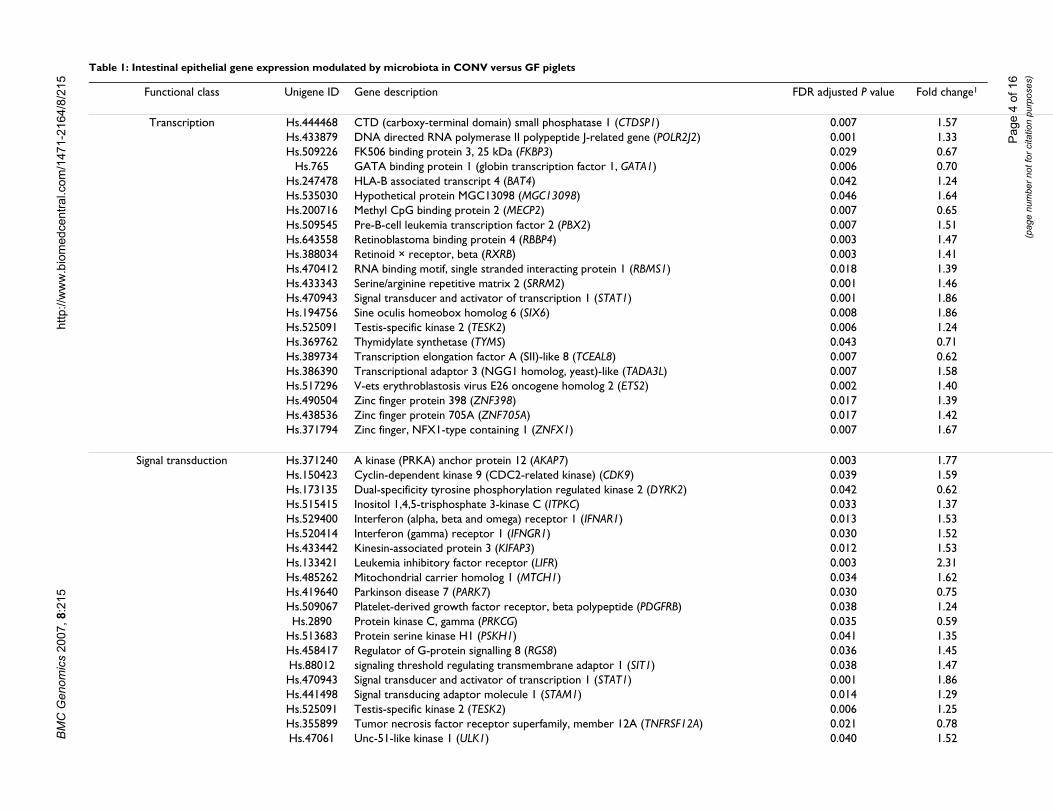
Gene transcriptionCONV animals exhibited increased expression of severalgenes encoding proteins involved in transcriptional proc-esses such as DNA directed RNA polymerase-II(POLR2J2), Drosophila sine oculis homeobox homolog 6(SIX6), signal transducer and activator of transcription-1(STAT1), transcriptional adaptor 3-like (TADA3L), andzinc finger protein-398 (ZNF398) (Table 1). Furthermore,microbial colonization induced mRNA expression ofretinoid × receptor beta (RXRB), HLA-B associated tran-script-4 (BAT4), and pre-B-cell leukemia transcription fac-tor-2 (PBX2), which are each encoded within the majorhistocompatibility complex (MHC) and may therefore beinvolved in some aspect of immunity [10]. On the otherhand, CONV animals exhibited lower expression of genesencoding GATA binding protein-1 (GATA1), transcriptionelongation factor A (SII)-like-8 (TCEAL8) and methyl-CpG-binding protein-2 (MECP2, a negative regulator oftranscription) (Table 1).
Signal transductionMost of the differentially expressed genes involved in sig-nal transduction processes were upregulated in CONVanimals [e.g., STAT1, leukemia inhibitory factor receptoralpha (LIFR), signaling threshold regulating transmem-brane adaptor 1 (SIT1), interferon (IFN) αβ receptor-1(IFNAR1), IFNγ receptor-1 (IFNGR1), platelet-derivedgrowth factor receptor B(PDGFRB), kinesin-associatedprotein-3 (KIFAP3), and regulator of G-protein signaling-8 (RGS8)] (Table 1), indicating that receptor-mediatedsignaling cascades were activated by mutualistic microbes.The gene encoding protein kinase C gamma (PKC-γ) wasdownregulated (P < 0.05) in CONV versus GF epithelia.Intestinal epithelial cells express twelve known isoformsof PKC that play critical roles in intracellular signalingincluding cell proliferation, differentiation, apoptosis,adhesion, membrane remodeling, migration, ion secre-tion, and barrier function [11]. However, PKC-γ is one of
the least explored isoforms of the PKC family and furtherstudies are necessary to determine its involvement in thetransduction of signals activated by intestinal microbes inileal epithelial cells.
Cell proliferation and differentiationBacterial colonization downregulated the expression ofvarious genes encoding proteins involved in cell apoptosis[NCK-associated protein-1 (NCKAP1), TNF receptorsuperfamily, member 12A (TNFRSF12A)], downregula-tion of cell proliferation (fatty acid bind protein-7;FABP7) and cytokinesis (septin 7; SEPT7) (Table 1). Inaddition, genes involved in cell proliferation [cyclin-dependent kinase-9 (CDK9), signal-induced proliferationassociated gene-1 (SIPA1), PDGFRB [12], suppressor ofcytokine signaling-3 (SOCS3)], differentiation (drebrin1;DBN1) and regulation of cell growth (development anddifferentiation enhancing factor-like-1; DDEFL1) andstructural integrity (moesin; MSN) were upregulated inCONV compared with GF piglets (P < 0.05) indicating theinvolvement of a biotic stimulus that induces genes asso-ciated with epithelial cell turnover to protect the hostfrom microbial colonization.
Transport and metabolismGenes encoding ATPase and solute carrier family-7 pro-teins, which are associated with cationic amino acid andmonocarboxylic acid transport, were upregulated by intes-tinal microbiota (Table 1). Expression of genes encodingKelch-like-2 protein (intracellular protein transporter)and fatty acid binding protein (transport of long chainfatty acids), was significantly downregulated in CONVpiglets indicating differential expression of transport sys-tems in CONV versus GF pigs. Intestinal microbiotadownregulated glycerol-3-phosphate dehydrogenase 1(GPD1) expression whose product is involved in fructosemetabolism. Genes encoding glycogen phosphorylaseand glyceraldehyde-3-phosphate dehydrogenase associ-ated with glycogenolysis, gluconeogenesis, and glycolysiswere significantly upregulated in CONV compared to GFanimals, perhaps demonstrating a higher energy require-ment of CONV epithelial cells. With respect to lipidmetabolism, expression of genes encoding acyl-coen-zyme-A-synthetase and acyl-coenzyme-A-dehydrogenaserelated to fatty acid metabolism was significantly upregu-lated by the microbiota presumably to increase cellularenergy supply. Nutrient requirements of GF rodents arelow compared to those colonized with a normal microbi-ota [13].
Resident microbiota inhibited expression of serine pro-tease-35 (PRSS35) (P < 0.05). The RNA expression of thegene encoding the lysosomal protease cathepsin D(CTSD) was significantly upregulated in CONV piglets.Furthermore, two genes encoding phosphatidylserine
Page 3 of 16(page number not for citation purposes)
Page
4 o
f 16
(pag
e nu
mbe
r not
for c
itatio
n pu
rpos
es)
FDR adjusted P value Fold change1
0.007 1.570.001 1.330.029 0.670.006 0.700.042 1.240.046 1.640.007 0.650.007 1.510.003 1.470.003 1.410.018 1.390.001 1.460.001 1.860.008 1.860.006 1.240.043 0.710.007 0.620.007 1.580.002 1.400.017 1.390.017 1.420.007 1.67
0.003 1.770.039 1.590.042 0.620.033 1.370.013 1.530.030 1.520.012 1.530.003 2.310.034 1.620.030 0.750.038 1.240.035 0.590.041 1.350.036 1.450.038 1.470.001 1.860.014 1.290.006 1.250.021 0.780.040 1.52
BMC G
enom
ics
2007
, 8:2
15ht
tp://
ww
w.b
iom
edce
ntra
l.com
/147
1-21
64/8
/215
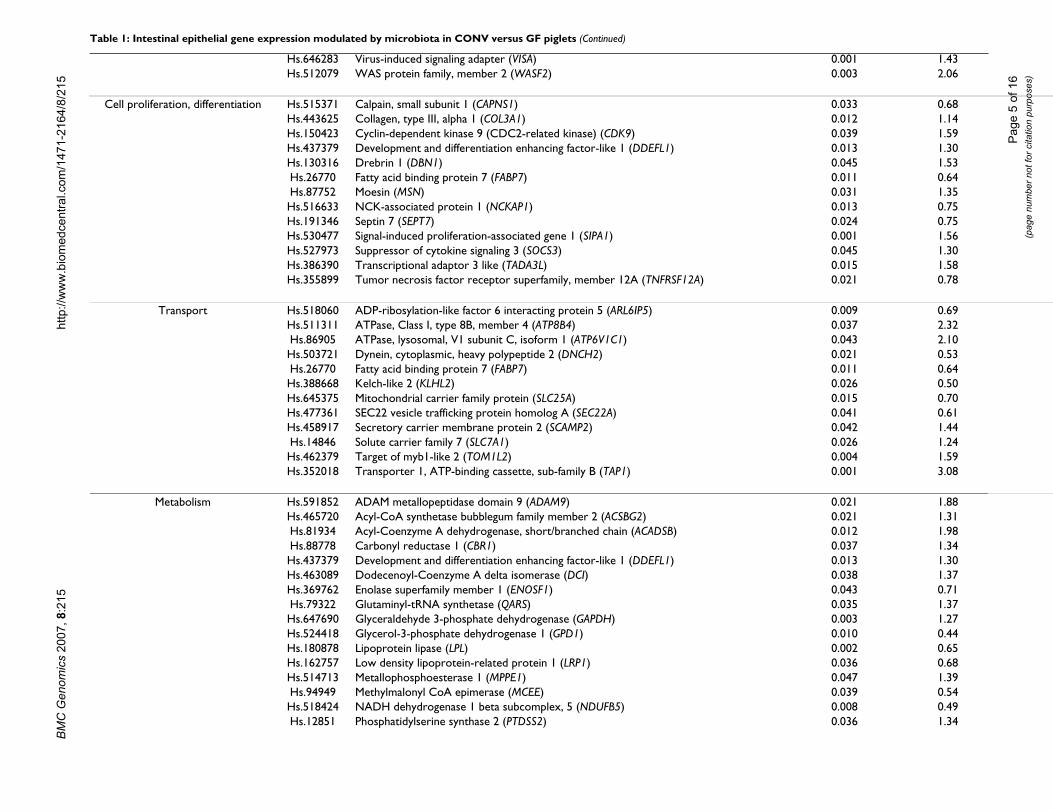
Table 1: Intestinal epithelial gene expression modulated by microbiota in CONV versus GF piglets
Functional class Unigene ID Gene description
Transcription Hs.444468 CTD (carboxy-terminal domain) small phosphatase 1 (CTDSP1)Hs.433879 DNA directed RNA polymerase II polypeptide J-related gene (POLR2J2)Hs.509226 FK506 binding protein 3, 25 kDa (FKBP3)
Hs.765 GATA binding protein 1 (globin transcription factor 1, GATA1)Hs.247478 HLA-B associated transcript 4 (BAT4)Hs.535030 Hypothetical protein MGC13098 (MGC13098)Hs.200716 Methyl CpG binding protein 2 (MECP2)Hs.509545 Pre-B-cell leukemia transcription factor 2 (PBX2)Hs.643558 Retinoblastoma binding protein 4 (RBBP4)Hs.388034 Retinoid × receptor, beta (RXRB)Hs.470412 RNA binding motif, single stranded interacting protein 1 (RBMS1)Hs.433343 Serine/arginine repetitive matrix 2 (SRRM2)Hs.470943 Signal transducer and activator of transcription 1 (STAT1)Hs.194756 Sine oculis homeobox homolog 6 (SIX6)Hs.525091 Testis-specific kinase 2 (TESK2)Hs.369762 Thymidylate synthetase (TYMS)Hs.389734 Transcription elongation factor A (SII)-like 8 (TCEAL8)Hs.386390 Transcriptional adaptor 3 (NGG1 homolog, yeast)-like (TADA3L)Hs.517296 V-ets erythroblastosis virus E26 oncogene homolog 2 (ETS2)Hs.490504 Zinc finger protein 398 (ZNF398)Hs.438536 Zinc finger protein 705A (ZNF705A)Hs.371794 Zinc finger, NFX1-type containing 1 (ZNFX1)
Signal transduction Hs.371240 A kinase (PRKA) anchor protein 12 (AKAP7)Hs.150423 Cyclin-dependent kinase 9 (CDC2-related kinase) (CDK9)Hs.173135 Dual-specificity tyrosine phosphorylation regulated kinase 2 (DYRK2)Hs.515415 Inositol 1,4,5-trisphosphate 3-kinase C (ITPKC)Hs.529400 Interferon (alpha, beta and omega) receptor 1 (IFNAR1)Hs.520414 Interferon (gamma) receptor 1 (IFNGR1)Hs.433442 Kinesin-associated protein 3 (KIFAP3)Hs.133421 Leukemia inhibitory factor receptor (LIFR)Hs.485262 Mitochondrial carrier homolog 1 (MTCH1)Hs.419640 Parkinson disease 7 (PARK7)Hs.509067 Platelet-derived growth factor receptor, beta polypeptide (PDGFRB)Hs.2890 Protein kinase C, gamma (PRKCG)
Hs.513683 Protein serine kinase H1 (PSKH1)Hs.458417 Regulator of G-protein signalling 8 (RGS8)Hs.88012 signaling threshold regulating transmembrane adaptor 1 (SIT1)Hs.470943 Signal transducer and activator of transcription 1 (STAT1)Hs.441498 Signal transducing adaptor molecule 1 (STAM1)Hs.525091 Testis-specific kinase 2 (TESK2)Hs.355899 Tumor necrosis factor receptor superfamily, member 12A (TNFRSF12A)Hs.47061 Unc-51-like kinase 1 (ULK1)
Page
5 o
f 16
(pag
e nu
mbe
r not
for c
itatio
n pu
rpos
es)
0.001 1.430.003 2.06
0.033 0.680.012 1.140.039 1.590.013 1.300.045 1.530.011 0.640.031 1.350.013 0.750.024 0.750.001 1.560.045 1.300.015 1.580.021 0.78
0.009 0.690.037 2.320.043 2.100.021 0.530.011 0.640.026 0.500.015 0.700.041 0.610.042 1.440.026 1.240.004 1.590.001 3.08
0.021 1.880.021 1.310.012 1.980.037 1.340.013 1.300.038 1.370.043 0.710.035 1.370.003 1.270.010 0.440.002 0.650.036 0.680.047 1.390.039 0.540.008 0.490.036 1.34
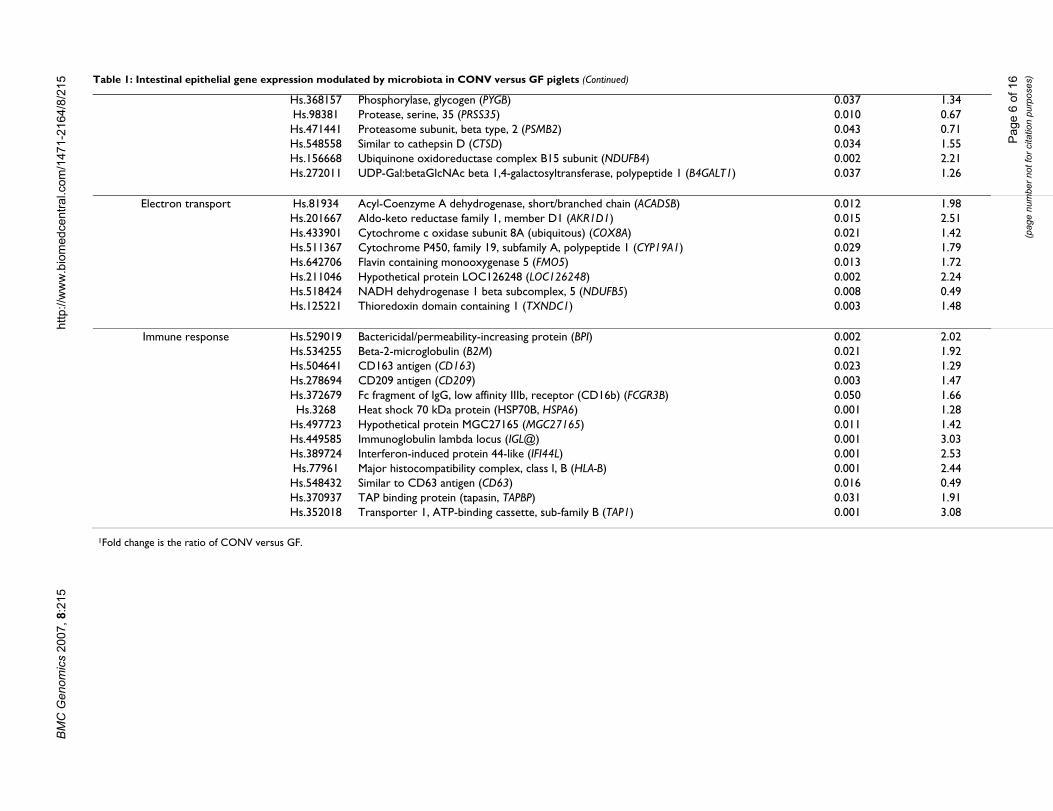
Table 1: Intestinal epithelial gene expression modulated by microbiota in CONV versus GF piglets (Continued)
BMC
Gen
omic
s 20
07, 8
:215
http
://w
ww
.bio
med
cent
ral.c
om/1
471-
2164
/8/2
15Hs.646283 Virus-induced signaling adapter (VISA)Hs.512079 WAS protein family, member 2 (WASF2)
Cell proliferation, differentiation Hs.515371 Calpain, small subunit 1 (CAPNS1)Hs.443625 Collagen, type III, alpha 1 (COL3A1)Hs.150423 Cyclin-dependent kinase 9 (CDC2-related kinase) (CDK9)Hs.437379 Development and differentiation enhancing factor-like 1 (DDEFL1)Hs.130316 Drebrin 1 (DBN1)Hs.26770 Fatty acid binding protein 7 (FABP7)Hs.87752 Moesin (MSN)Hs.516633 NCK-associated protein 1 (NCKAP1)Hs.191346 Septin 7 (SEPT7)Hs.530477 Signal-induced proliferation-associated gene 1 (SIPA1)Hs.527973 Suppressor of cytokine signaling 3 (SOCS3)Hs.386390 Transcriptional adaptor 3 like (TADA3L)Hs.355899 Tumor necrosis factor receptor superfamily, member 12A (TNFRSF12A)
Transport Hs.518060 ADP-ribosylation-like factor 6 interacting protein 5 (ARL6IP5)Hs.511311 ATPase, Class I, type 8B, member 4 (ATP8B4)Hs.86905 ATPase, lysosomal, V1 subunit C, isoform 1 (ATP6V1C1)Hs.503721 Dynein, cytoplasmic, heavy polypeptide 2 (DNCH2)Hs.26770 Fatty acid binding protein 7 (FABP7)Hs.388668 Kelch-like 2 (KLHL2)Hs.645375 Mitochondrial carrier family protein (SLC25A)Hs.477361 SEC22 vesicle trafficking protein homolog A (SEC22A)Hs.458917 Secretory carrier membrane protein 2 (SCAMP2)Hs.14846 Solute carrier family 7 (SLC7A1)Hs.462379 Target of myb1-like 2 (TOM1L2)Hs.352018 Transporter 1, ATP-binding cassette, sub-family B (TAP1)
Metabolism Hs.591852 ADAM metallopeptidase domain 9 (ADAM9)Hs.465720 Acyl-CoA synthetase bubblegum family member 2 (ACSBG2)Hs.81934 Acyl-Coenzyme A dehydrogenase, short/branched chain (ACADSB)Hs.88778 Carbonyl reductase 1 (CBR1)Hs.437379 Development and differentiation enhancing factor-like 1 (DDEFL1)Hs.463089 Dodecenoyl-Coenzyme A delta isomerase (DCI)Hs.369762 Enolase superfamily member 1 (ENOSF1)Hs.79322 Glutaminyl-tRNA synthetase (QARS)Hs.647690 Glyceraldehyde 3-phosphate dehydrogenase (GAPDH)Hs.524418 Glycerol-3-phosphate dehydrogenase 1 (GPD1)Hs.180878 Lipoprotein lipase (LPL)Hs.162757 Low density lipoprotein-related protein 1 (LRP1)Hs.514713 Metallophosphoesterase 1 (MPPE1)Hs.94949 Methylmalonyl CoA epimerase (MCEE)Hs.518424 NADH dehydrogenase 1 beta subcomplex, 5 (NDUFB5)Hs.12851 Phosphatidylserine synthase 2 (PTDSS2)
Page
6 o
f 16
(pag
e nu
mbe
r not
for c
itatio
n pu
rpos
es)
0.037 1.340.010 0.670.043 0.710.034 1.550.002 2.210.037 1.26
0.012 1.980.015 2.510.021 1.420.029 1.790.013 1.720.002 2.240.008 0.490.003 1.48
0.002 2.020.021 1.920.023 1.290.003 1.470.050 1.660.001 1.280.011 1.420.001 3.030.001 2.530.001 2.440.016 0.490.031 1.910.001 3.08
BMC
Gen
omic
s 20
07, 8
:215
http
://w
ww
.bio
med
cent
ral.c
om/1
471-
2164
/8/2
15
Hs.368157 Phosphorylase, glycogen (PYGB)Hs.98381 Protease, serine, 35 (PRSS35)Hs.471441 Proteasome subunit, beta type, 2 (PSMB2)Hs.548558 Similar to cathepsin D (CTSD)Hs.156668 Ubiquinone oxidoreductase complex B15 subunit (NDUFB4)Hs.272011 UDP-Gal:betaGlcNAc beta 1,4-galactosyltransferase, polypeptide 1 (B4GALT1)
Electron transport Hs.81934 Acyl-Coenzyme A dehydrogenase, short/branched chain (ACADSB)Hs.201667 Aldo-keto reductase family 1, member D1 (AKR1D1)Hs.433901 Cytochrome c oxidase subunit 8A (ubiquitous) (COX8A)Hs.511367 Cytochrome P450, family 19, subfamily A, polypeptide 1 (CYP19A1)Hs.642706 Flavin containing monooxygenase 5 (FMO5)Hs.211046 Hypothetical protein LOC126248 (LOC126248)Hs.518424 NADH dehydrogenase 1 beta subcomplex, 5 (NDUFB5)Hs.125221 Thioredoxin domain containing 1 (TXNDC1)
Immune response Hs.529019 Bactericidal/permeability-increasing protein (BPI)Hs.534255 Beta-2-microglobulin (B2M)Hs.504641 CD163 antigen (CD163)Hs.278694 CD209 antigen (CD209)Hs.372679 Fc fragment of IgG, low affinity IIIb, receptor (CD16b) (FCGR3B)Hs.3268 Heat shock 70 kDa protein (HSP70B, HSPA6)
Hs.497723 Hypothetical protein MGC27165 (MGC27165)Hs.449585 Immunoglobulin lambda locus (IGL@)Hs.389724 Interferon-induced protein 44-like (IFI44L)Hs.77961 Major histocompatibility complex, class I, B (HLA-B)Hs.548432 Similar to CD63 antigen (CD63)Hs.370937 TAP binding protein (tapasin, TAPBP)Hs.352018 Transporter 1, ATP-binding cassette, sub-family B (TAP1)
1Fold change is the ratio of CONV versus GF.
Table 1: Intestinal epithelial gene expression modulated by microbiota in CONV versus GF piglets (Continued)
BMC Genomics 2007, 8:215 http://www.biomedcentral.com/1471-2164/8/215
synthase-2 and glutamyl-tRNA synthetase, associated withamino acid metabolism and peptide biosynthesis respec-tively, were induced by microbial colonization (P < 0.05).Expression of the metallophosphoesterase-1 gene, whoseproduct is involved in purine metabolism, was signifi-cantly upregulated, whereas expression of the thymidylatesynthetase gene was downregulated (P < 0.05) in CONVversus GF animals. Overall, microbial colonizationinduced the expression of genes involved in nutrienttransport and carbohydrate, protein, lipid and nucleotidemetabolism.
Electron transportThe expression of several genes involved in electron trans-port such as flavin containing monooxygenase-5 (FMO5),cytochrome P450, family 19, subfamily A, polypeptide 1(CYP19A1), acyl-coenzyme A dehydrogenase (ACADSB),aldo-keto reductase family 1, member D1 (AKR1D1),thioredoxin domain containing I (TXNDC1) and cyto-chrome c oxidase (COX8A) was significantly upregulatedin CONV versus GF animals (P < 0.05; Table 1). Microbialcolonization downregulated expression of NADH dehy-drogenase (ubiquinone) 1 beta subcomplex, 5(NDUFB5), the product of which is associated with oxida-tive phosphorylation (P < 0.05; Table 1). These resultsdemonstrate that microbiota induced genes involved incatalysis of various oxidative reactions.
Immune responsivenessConsistent with the previous observations [14,15], micro-biota induced expression of the gene encoding bacteri-cidal permeability-increasing protein (BPI), whichdamages bacterial inner/outer membranes and contrib-utes to neutralization of bacterial lipopolysaccharide(LPS, Table 1). The complex of MHC class I α-chain, beta2 microglobulin (B2M), transporter-1 ATP-binding cas-sette sub-family B (TAP1), tapasin (TAPBP), calreticulin,and Erp57 comprises the peptide-loading complex forMHC class I antigen processing [16]. These genes are char-acteristically induced in response to inflammatory cuesand increased expression of swine leukocyte antigen clas-sical class I (SLA class I), B2M, TAP1 and TAPBP, in thecurrent study, likely reflects microbiota induced epithelialinflammation. Enhanced expression of HSPA6 (heatshock protein 70) in CONV animals further confirms thisoutcome as this gene is also induced by IFNβ [17].
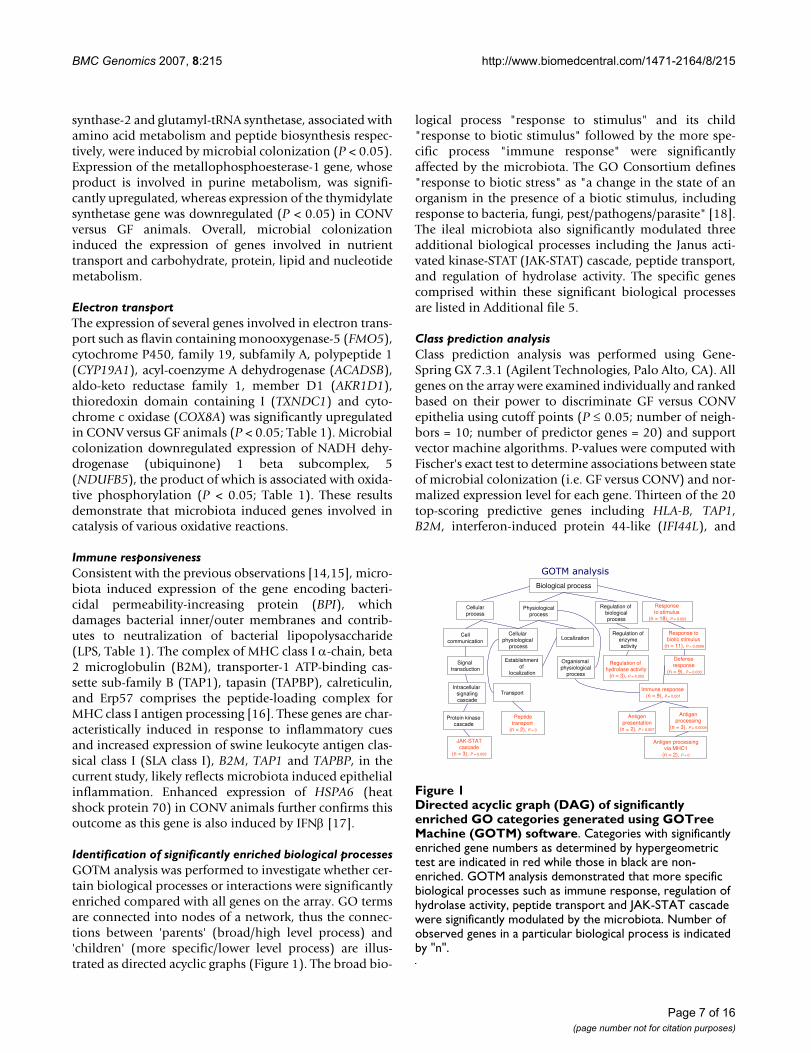
Identification of significantly enriched biological processesGOTM analysis was performed to investigate whether cer-tain biological processes or interactions were significantlyenriched compared with all genes on the array. GO termsare connected into nodes of a network, thus the connec-tions between 'parents' (broad/high level process) and'children' (more specific/lower level process) are illus-trated as directed acyclic graphs (Figure 1). The broad bio-
logical process "response to stimulus" and its child"response to biotic stimulus" followed by the more spe-cific process "immune response" were significantlyaffected by the microbiota. The GO Consortium defines"response to biotic stress" as "a change in the state of anorganism in the presence of a biotic stimulus, includingresponse to bacteria, fungi, pest/pathogens/parasite" [18].The ileal microbiota also significantly modulated threeadditional biological processes including the Janus acti-vated kinase-STAT (JAK-STAT) cascade, peptide transport,and regulation of hydrolase activity. The specific genescomprised within these significant biological processesare listed in Additional file 5.
Class prediction analysisClass prediction analysis was performed using Gene-Spring GX 7.3.1 (Agilent Technologies, Palo Alto, CA). Allgenes on the array were examined individually and rankedbased on their power to discriminate GF versus CONVepithelia using cutoff points (P ≤ 0.05; number of neigh-bors = 10; number of predictor genes = 20) and supportvector machine algorithms. P-values were computed withFischer's exact test to determine associations between stateof microbial colonization (i.e. GF versus CONV) and nor-malized expression level for each gene. Thirteen of the 20top-scoring predictive genes including HLA-B, TAP1,B2M, interferon-induced protein 44-like (IFI44L), and
Directed acyclic graph (DAG) of significantly enriched GO categories generated using GOTree Machine (GOTM) soft-wareFigure 1Directed acyclic graph (DAG) of significantly enriched GO categories generated using GOTree Machine (GOTM) software. Categories with significantly enriched gene numbers as determined by hypergeometric test are indicated in red while those in black are non-enriched. GOTM analysis demonstrated that more specific biological processes such as immune response, regulation of hydrolase activity, peptide transport and JAK-STAT cascade were significantly modulated by the microbiota. Number of observed genes in a particular biological process is indicated by "n".
GOTM analysis
Biological process
Response to stimulus
(n = 18), P = 0.003
Regulation of biologicalprocess
Physiologicalprocess
Response to biotic stimulus
(n = 11), P = 0.0006
Regulation of enzyme activity
LocalizationCellular
physiological process
Cellcommunication
Defense response
(n = 9), P = 0.003
Regulation of hydrolase activity
(n = 3), P = 0.002
Organismal physiological
process
Establishment of
localization
Signal transduction
Intracellular signalingcascade
Transport
Antigen processingvia MHC1
(n = 2), P = 0
Immune response (n = 9), P = 0.001
JAK-STATcascade
(n = 3), P = 0.003
Antigenpresentation
(n = 2), P = 0.007
Protein kinasecascade
Peptidetransport
(n = 2), P = 0
Antigenprocessing
(n = 3), P = 0.0004
Cellularprocess
Page 7 of 16(page number not for citation purposes)
BMC Genomics 2007, 8:215 http://www.biomedcentral.com/1471-2164/8/215
STAT1 were differentially expressed in CONV versus GFepithelia [see Additional file 6]. This outcome further sup-ports the conclusion that microbial colonization activatedthe expression of STAT1 and the induction of interferon-inducible genes.
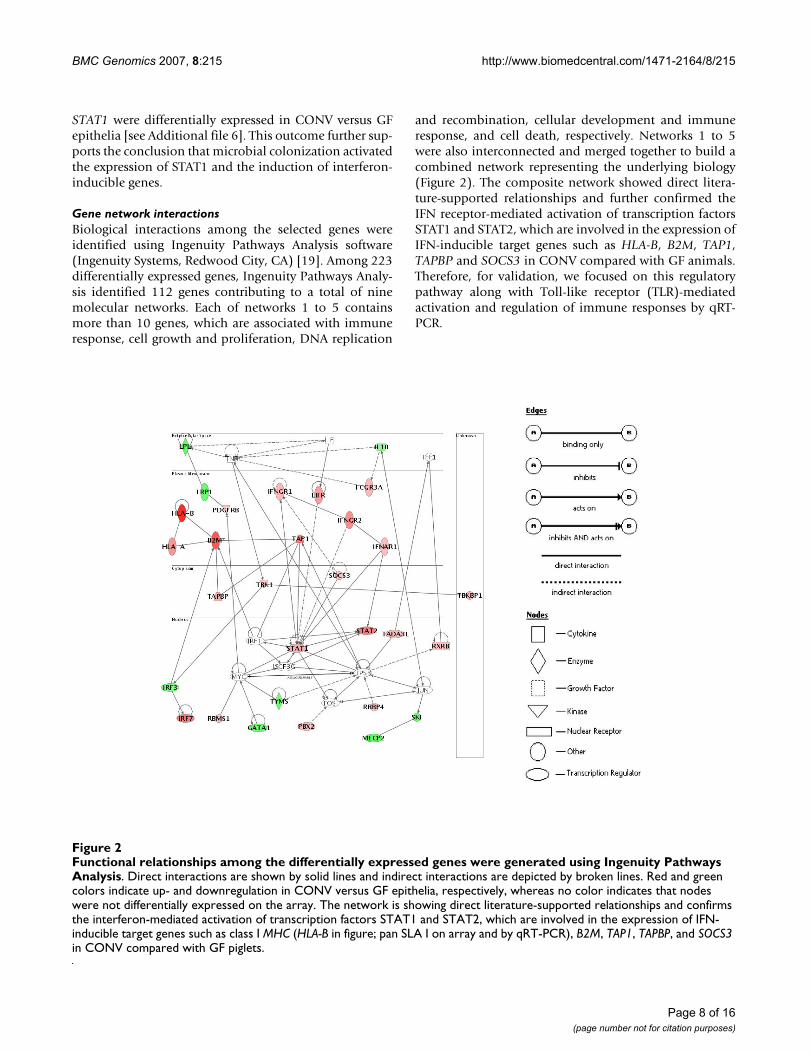
Gene network interactionsBiological interactions among the selected genes wereidentified using Ingenuity Pathways Analysis software(Ingenuity Systems, Redwood City, CA) [19]. Among 223differentially expressed genes, Ingenuity Pathways Analy-sis identified 112 genes contributing to a total of ninemolecular networks. Each of networks 1 to 5 containsmore than 10 genes, which are associated with immuneresponse, cell growth and proliferation, DNA replication
and recombination, cellular development and immuneresponse, and cell death, respectively. Networks 1 to 5were also interconnected and merged together to build acombined network representing the underlying biology(Figure 2). The composite network showed direct litera-ture-supported relationships and further confirmed theIFN receptor-mediated activation of transcription factorsSTAT1 and STAT2, which are involved in the expression ofIFN-inducible target genes such as HLA-B, B2M, TAP1,TAPBP and SOCS3 in CONV compared with GF animals.Therefore, for validation, we focused on this regulatorypathway along with Toll-like receptor (TLR)-mediatedactivation and regulation of immune responses by qRT-PCR.
Functional relationships among the differentially expressed genes were generated using Ingenuity Pathways AnalysisFigure 2Functional relationships among the differentially expressed genes were generated using Ingenuity Pathways Analysis. Direct interactions are shown by solid lines and indirect interactions are depicted by broken lines. Red and green colors indicate up- and downregulation in CONV versus GF epithelia, respectively, whereas no color indicates that nodes were not differentially expressed on the array. The network is showing direct literature-supported relationships and confirms the interferon-mediated activation of transcription factors STAT1 and STAT2, which are involved in the expression of IFN-inducible target genes such as class I MHC (HLA-B in figure; pan SLA I on array and by qRT-PCR), B2M, TAP1, TAPBP, and SOCS3 in CONV compared with GF piglets.
Page 8 of 16(page number not for citation purposes)
BMC Genomics 2007, 8:215 http://www.biomedcentral.com/1471-2164/8/215
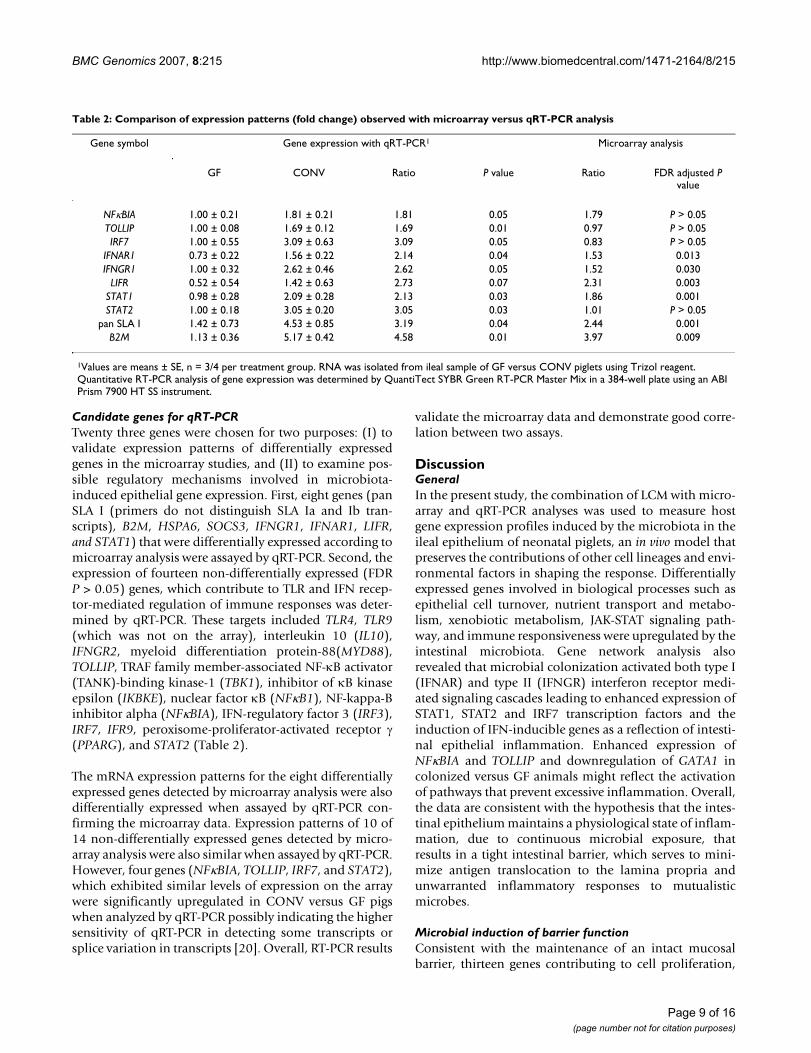
Candidate genes for qRT-PCRTwenty three genes were chosen for two purposes: (I) tovalidate expression patterns of differentially expressedgenes in the microarray studies, and (II) to examine pos-sible regulatory mechanisms involved in microbiota-induced epithelial gene expression. First, eight genes (panSLA I (primers do not distinguish SLA Ia and Ib tran-scripts), B2M, HSPA6, SOCS3, IFNGR1, IFNAR1, LIFR,and STAT1) that were differentially expressed according tomicroarray analysis were assayed by qRT-PCR. Second, theexpression of fourteen non-differentially expressed (FDRP > 0.05) genes, which contribute to TLR and IFN recep-tor-mediated regulation of immune responses was deter-mined by qRT-PCR. These targets included TLR4, TLR9(which was not on the array), interleukin 10 (IL10),IFNGR2, myeloid differentiation protein-88(MYD88),TOLLIP, TRAF family member-associated NF-κB activator(TANK)-binding kinase-1 (TBK1), inhibitor of κB kinaseepsilon (IKBKE), nuclear factor κB (NFκB1), NF-kappa-Binhibitor alpha (NFκBIA), IFN-regulatory factor 3 (IRF3),IRF7, IFR9, peroxisome-proliferator-activated receptor γ(PPARG), and STAT2 (Table 2).
The mRNA expression patterns for the eight differentiallyexpressed genes detected by microarray analysis were alsodifferentially expressed when assayed by qRT-PCR con-firming the microarray data. Expression patterns of 10 of14 non-differentially expressed genes detected by micro-array analysis were also similar when assayed by qRT-PCR.However, four genes (NFκBIA, TOLLIP, IRF7, and STAT2),which exhibited similar levels of expression on the arraywere significantly upregulated in CONV versus GF pigswhen analyzed by qRT-PCR possibly indicating the highersensitivity of qRT-PCR in detecting some transcripts orsplice variation in transcripts [20]. Overall, RT-PCR results
validate the microarray data and demonstrate good corre-lation between two assays.
DiscussionGeneralIn the present study, the combination of LCM with micro-array and qRT-PCR analyses was used to measure hostgene expression profiles induced by the microbiota in theileal epithelium of neonatal piglets, an in vivo model thatpreserves the contributions of other cell lineages and envi-ronmental factors in shaping the response. Differentiallyexpressed genes involved in biological processes such asepithelial cell turnover, nutrient transport and metabo-lism, xenobiotic metabolism, JAK-STAT signaling path-way, and immune responsiveness were upregulated by theintestinal microbiota. Gene network analysis alsorevealed that microbial colonization activated both type I(IFNAR) and type II (IFNGR) interferon receptor medi-ated signaling cascades leading to enhanced expression ofSTAT1, STAT2 and IRF7 transcription factors and theinduction of IFN-inducible genes as a reflection of intesti-nal epithelial inflammation. Enhanced expression ofNFκBIA and TOLLIP and downregulation of GATA1 incolonized versus GF animals might reflect the activationof pathways that prevent excessive inflammation. Overall,the data are consistent with the hypothesis that the intes-tinal epithelium maintains a physiological state of inflam-mation, due to continuous microbial exposure, thatresults in a tight intestinal barrier, which serves to mini-mize antigen translocation to the lamina propria andunwarranted inflammatory responses to mutualisticmicrobes.
Microbial induction of barrier functionConsistent with the maintenance of an intact mucosalbarrier, thirteen genes contributing to cell proliferation,
Table 2: Comparison of expression patterns (fold change) observed with microarray versus qRT-PCR analysis
Gene symbol Gene expression with qRT-PCR1 Microarray analysis
GF CONV Ratio P value Ratio FDR adjusted P value
NFκBIA 1.00 ± 0.21 1.81 ± 0.21 1.81 0.05 1.79 P > 0.05TOLLIP 1.00 ± 0.08 1.69 ± 0.12 1.69 0.01 0.97 P > 0.05IRF7 1.00 ± 0.55 3.09 ± 0.63 3.09 0.05 0.83 P > 0.05
IFNAR1 0.73 ± 0.22 1.56 ± 0.22 2.14 0.04 1.53 0.013IFNGR1 1.00 ± 0.32 2.62 ± 0.46 2.62 0.05 1.52 0.030
LIFR 0.52 ± 0.54 1.42 ± 0.63 2.73 0.07 2.31 0.003STAT1 0.98 ± 0.28 2.09 ± 0.28 2.13 0.03 1.86 0.001STAT2 1.00 ± 0.18 3.05 ± 0.20 3.05 0.03 1.01 P > 0.05
pan SLA I 1.42 ± 0.73 4.53 ± 0.85 3.19 0.04 2.44 0.001B2M 1.13 ± 0.36 5.17 ± 0.42 4.58 0.01 3.97 0.009
1Values are means ± SE, n = 3/4 per treatment group. RNA was isolated from ileal sample of GF versus CONV piglets using Trizol reagent. Quantitative RT-PCR analysis of gene expression was determined by QuantiTect SYBR Green RT-PCR Master Mix in a 384-well plate using an ABI Prism 7900 HT SS instrument.
Page 9 of 16(page number not for citation purposes)
BMC Genomics 2007, 8:215 http://www.biomedcentral.com/1471-2164/8/215
differentiation and regulation of cell growth were upregu-lated by bacterial colonization. In addition, expression ofa gene involved in TNF receptor-mediated cell apoptosiswas downregulated by resident microbiota [21]. Consist-ent with observations that goblet cell products provideinnate protection that influences bacterial colonization[22,23], upregulation of beta 1,4-galactosyltransferase(B4GALT1) mRNA expression for mucin biosynthesis [24]in CONV piglets may reflect a general mucogenicresponse in conventionalized animals to maintain barrierfunction [22,25-27].
Toll-like receptor-mediated signalingThe promotion of barrier function might be an inherentfeature of mutualistic microbiota-induced TLR-mediatedsignaling [28,29]. In addition to the MyD88-dependentpathway that promotes rapid NFκB activation, TLRs alsotrigger MyD88-independent, IFN receptor-mediated sig-nal transduction cascades upon the recognition of a vari-ety of microbe-associated molecular patterns. Thesecascades activate members of the IRF family along withslow activation of NFκB [30]. The expression of TLR4,TLR9, MYD88, TBK1, IKBKE, IRF3, and IRF9 was unaf-fected but IFNAR1, IFNGR1, and IRF7 were induced bymicrobial colonization as determined by qRT-PCR analy-sis. A MyD88-independent pathway has been shown toactivate IRFs and subsequently IFN-inducible genes inhuman embryonic kidney 293 cells [31], and mouse mac-rophages [32]. Similarly, mouse embryonic fibroblastslacking MyD88 retained the ability to induce IFNα/βmRNA expression in response to viruses [33]. MyD88 isnot required for the regulation of the majority of genesresponsive to LPS and several MyD88-independentmouse genes contain NFκB and IFN-stimulated responseelement (ISRE; IFNα/β) binding sites [34]. MyD88-defi-cient mice also mount a normal host defense response toStaphylococcus aureus infection [35]. However, inflamma-tory responses during polymicrobial sepsis in mice defi-cient for MyD88 were markedly reduced implicating theimportance of this signal transduction molecule in certaininflammatory scenarios [36]. The present study demon-strates that a MyD88-independent, IFN receptor-mediatedpathway was activated by the intestinal microbiota in ilealepithelial cells of neonatal piglets, possibly reflecting astate of controlled inflammation. A potential limitation ofthe current study was the measurement of epithelialresponses at a single time point 14 days after colonization.An early induction of TLR-mediated inflammation mighthave gradually become adapted to the continuous micro-bial exposure enabling a state of cellular homeostasis.
IFN-mediated signalingThe data indicate that IFN receptor-mediated signalingcascades stimulated the expression of IFN-inducible genesin the ileal epithelium of CONV piglets. Interferon recep-
tor complex IFNAR consists of two subunits IFNAR1 andIFNAR2, and IFNGR is comprised of IFNGR1 and IFNGR2subunits [37]. Stimulation of IFNAR or IFNGR via theinflammatory cytokines IFNα/β and IFNγ activates recep-tor-associated Janus protein tyrosine kinases (Jak1 andTyk2 for IFNAR and Jak1 and Jak2 for IFNGR) and thetranscription factors STAT1 and STAT2 [38-40]. The phos-phorylated STAT1/STAT2 heterodimers associate withIFR9 and bind to upstream regulatory consensussequences of IFNα/β inducible genes (ISRE) [40]. In addi-tion, formation of STAT1 homodimers stimulates tran-scription of genes containing IFNγ-activated sequence(GAS, cis-regulatory element) [40,41]. In the presentstudy, microbiota activated IFN receptor-mediated signal-ing cascades possibly through STAT1, STAT2 and IRF7transcription factors to induce IFN-inducible target genessuch as pan SLA I, B2M, HSPA6, TAP1, TAPBP, IFI44L andSOCS3 in CONV compared with GF epithelia. Kawai et al.[42] demonstrated that the induction of IFNα/β mRNAwas markedly inhibited in IRF7-/- mouse embryonicfibroblasts and IRF7 activation was TBK1- and IKKε-inde-pendent in mouse plasmacytoid dendritic cells. Further-more, Rhee et al. [43] reported that enteric Salmonellainfection induced the expression of IFNγ regulated genesinvolved in antimicrobial defense in mice. IFNα/β signal-ing upregulates IFNγ production in T cells and dendriticcells [39,44]. Upregulation of IFNAR1 and IFNGR1expression by the intestinal microbiota in the currentstudy indicates that IFNα/β as well as IFNγ signaling path-ways were activated in epithelial cells. The transcriptionfactor STAT1 is common for both and crosstalk betweenthese signaling pathways was reported by Takaoka et al.[39]. Therefore, STAT1 contributes to regulation of genescontaining ISRE as well as GAS elements [45] and recipro-cally affect each other's production and signaling [39].Furthermore, SOCS3 is known to regulate the IFN signal-ing pathway by controlling STAT1 induction [46]. Over-all, these results indicate that mutualistic microbes mayactivate IFN receptor-mediated signaling cascades in intes-tinal epithelial cells leading to activation of the transcrip-tion factors STAT1 and STAT2 and IFN-inducible genesharboring the cis-regulatory elements ISRE and GAS.
Regulation of inflammatory processesResident microbiota can inhibit NFκB nuclear localiza-tion [47] and TLR4 induction [48] and thereby possiblyprevent overt inflammatory responses. In the presentstudy, microbial colonization induced NFκBIA expres-sion, which encodes I-kappa-B-alpha, (IKBα), a proteinassociated with the inactivation of NFκB by sequesteringit in the cytoplasm, consistent with inhibition of NFκBmediated inflammatory responses [47]. This outcometogether with the induction of TOLLIP expression inCONV piglets possibly contributed to the suppression ofan excessive inflammatory response to maintain intestinal
Page 10 of 16(page number not for citation purposes)
BMC Genomics 2007, 8:215 http://www.biomedcentral.com/1471-2164/8/215
homeostasis. TOLLIP inhibits TLR signaling by interferingwith IL-1 receptor-associated kinase (IRAK) [49]. Indeed,intestinal epithelial cells express low levels of TLR4 andhigh levels of TOLLIP to prevent excessive inflammation[50].
The transcription factor GATA-1 upregulates TNFα-induced mRNA expression of chemokines eotaxin,RANTES and monocyte chemotactic protein-1 (MCP1) inairway epithelial cells [51]. Downregulation of GATA1might have also contributed to intestinal homeostasis byinhibiting the expression of inflammatory chemokines.However, a comparatively low activation of NFκB alongwith steady-state activation of IFN receptor-mediated geneinduction was maintained in the intestinal epithelium ofanimals harboring microbiota. This finding is consistentwith an earlier report on the same model of an increasednumber of intraepithelial lymphocytes in the small intes-tine of CONV versus GF piglets [52].
This physiological state of inflammation was also associ-ated with enhanced expression of genes associated withcell proliferation. NFκB is constitutively active in tumorcell lines derived from hematopoietic and solid tumors[53] and epithelial malignancies including colorectal,breast, lung, pancreas, and prostate cancers [54]. Suppres-sion of NFκB in tumor samples inhibits proliferation,causes cell cycle arrest, and leads to apoptosis [55]. Inaddition to carcinoma cells, NFκB is also active in prolif-erating T cells, B cells, thymocytes, monocytes and astro-cytes [53] indicating a crucial role of NFκB in cellproliferation. Furthermore, enhanced expression of LIFRin CONV piglets is consistent with involvement of itsproduct in epithelial cell proliferation. LIF, a member ofthe inflammatory IL-6 cytokine family [56], induced pro-liferation of premalignant epithelial cells [57] and stimu-lates self-proliferation of embryonic stem cells [58].
ConclusionThe present study indicates that microbial colonizationtranscriptionally induces the expression of cell membranereceptors and transcription factors, which are involved inthe induction of IFN-inducible genes. Furthermore, overtinflammatory responses were possibly controlled throughthe induction of NFκBIA and TOLLIP and down-regula-tion of GATA1 expression, consistent with the mainte-nance of intestinal homeostasis. Collectively, the studysupports the concept that the intestinal epithelium main-tains a physiological state of inflammation with respect tocontinuous microbial exposure, which serves to maintaina tight intestinal barrier, without engendering overtinflammatory responses that would compromise barrierfunction.
MethodsAnimals and experimental designTwo crossbred sows were purchased from Prairie SwineCenter (Saskatoon, Canada) and housed in animal facili-ties until 113 d gestation. Eight cesarean-derived pigletsfrom two litters were randomly assigned to two GF isola-tors (4 piglets per isolator) located at the University of Sas-katchewan gnotobiotic animal facility. Using bottles fittedwith nipples, all piglets were fed at 3 hr intervals to satietya sterile porcine serum (Gibco, Burlington, Canada) andinfant milk formula (Similac®, Abbott Laboratories,Abbott Park, IL) in 1:1 ratio. After 24 hrs, piglets were fedsterile infant formula (2:1 mixture of Similac and water)ad libitum from individual troughs replenished every 8 hrsfor 14 d. Experimental protocol was reviewed andapproved by the University of Illinois and the Universityof Saskatchewan, Institutional Animal Care and Use Com-mittees, and was performed in accordance with recom-mendations of the Canadian Council on Animal Care.
Microbial colonization and confirmation of GF statusFour piglets from one isolator were orally inoculated byadding 2 ml of the fecal slurry to the milk after 24 and 30hrs postpartum. Four piglets in another isolator were keptGF throughout the study. Sterile swabs were wiped peri-anally daily during the experiment. The swabs were sub-merged in tubes of brain-heart infusion broth (DifcoLaboratories, Sparks, MD) with 0.5% cysteine hydrochlo-ride and were monitored for the development of turbid-ity. GF status of the piglets was confirmed by observinglack of microbial growth in the medium. An opaque colorwith obvious precipitate was observed in all tubes withswabs taken from CONV piglets indicating microbial col-onization. Anaerobic and aerobic culture of fecal swabscollected throughout the experiment, together with theculture in blood agar base (BBL, Sparks, MD) with 5%defibrinated sheep blood for 48 hrs at 37°C of cecaldigesta collected at the end of the experiment, further con-firmed GF and CONV status. These procedures weredescribed in detail by Shirkey et al. [52].
Tissue collection and cryopreservationAnimals were euthanized by CO2 asphyxiation and exsan-guination on d 14 and the small intestine was rapidly dis-sected and the length was measured. Two cm longsegments starting at the 85% of SI length measured dis-tally of the pyloric sphincter were identified, embedded inShandon Cryomatrix™ (Thermo Electron Corporation,Pittsburgh, PA) and immediately frozen in liquid nitro-gen. The samples were transported to the laboratory ondry ice and stored at -80°C until further analysis.
Page 11 of 16(page number not for citation purposes)
BMC Genomics 2007, 8:215 http://www.biomedcentral.com/1471-2164/8/215
Villus and crypt cell isolation by laser capture microdissection (LCM)Laser capture microdissection was used to recover epithe-lial villus and crypt cells from frozen ileal sections. Thecryostat (Leica CM 3050, Leica Microsystems, Deerfield,IL) was cleaned with 100% ethanol to avoid cross contam-ination, and a fresh disposable blade was used to cut eachtissue. Frozen ileal tissue sections were placed in the cryo-stat for about 10 min to allow adjustment to the cuttingtemperature (-15 to -20°C). Tissue sections (8 μm thick)were cut and placed on Silane Prep slides (Sigma, St.Louis, MO) and stored at -80°C. A HistoGene™ stainingkit (Arcturus, Mountain View, CA) was used to prepare thetissue for LCM. Briefly, the slides were thawed for 30 s,fixed in nuclease-free 75% ethanol, rehydrated in nucle-ase-free distilled water for 30 s, stained with HistoGenestain for 20 s, and rinsed in nuclease-free water for 30 s.Slides were then dehydrated by sequential immersion in agraded ethanol series (75%, 95% and 100% ethanol for30 s each), followed by 5 min in xylene. Tissue sectionswere then dried in a slide box with desiccant for 5 min atroom temperature before cell capture with LCM. Micro-dissection and capture of villus and crypt cell populationswere performed immediately on a Pixcell II ® LCM System(Arcturus) according to manufacturer instructions. A glassslide was mounted on the stage of the microscope and aCapSureTM LCM cap (Arcturus) was placed over the tissueand a low power infrared laser was pulsed to activate thetransfer film and captured villus and crypt cells. Two hun-dred to five hundred cells were collected onto each capusing the following parameters: spot size, 7.5 μm; power,50 mW; pulse duration 2.00 s.
RNA isolation and amplificationTotal RNA was isolated from laser captured villus andcrypt cells using the PicoPure™ RNA isolation Kit (Arctu-rus) according to manufacturer recommendations.Briefly, 20 μl of extraction buffer was placed into the LCMassembly microcentrifuge tube and incubated for 30 minat 42°C. After incubation, the assembly was briefly centri-fuged to collect the extraction fluid into the microcentri-fuge tube. The fluid was then loaded onto a spin column,washed several times, and the total cellular RNA waseluted as 10 μl volume. RNA from each sample was sub-jected to 2 rounds of amplification using the RiboAmp™RNA linear amplification kit (Arcturus). Subsequently,RNA was reverse-transcribed into cDNA incorporating aT7 promoter. The cDNA was eluted with 16 μl of elutionbuffer and in vitro transcribed into amplified anti-senseRNA with a T7 RNA polymerase incorporating amino-allyl-UTP (Ambion, Austin, TX).
Probe labeling for microarray analysisThe amplified anti-sense (aRNA) was labeled with Cy3 orCy5 dyes. Each of the 16 cell populations was reversed
labeled with Cy3 and Cy5 to account for dye labeling bias,resulting in 32 target samples for microarray hybridiza-tion. Cy3 and Cy5 dyes were resuspended in 45 μl dime-thyl sulfoxide (DMSO, Sigma) and stored at -80°C in alight protected area. For the labeling reaction, 5–7 μg ofamino-allyl tagged aRNA was dried in a SpeedVac and 5 μlof 0.1 M Na2CO3 (pH, 9.0) and 5 μl of dye (Cy3 or Cy5)dissolved in DMSO were added to the dried sample. Themixture was then incubated in the dark for 75 min andunincorporated dye was removed with a modified proto-col based on the Qiagen Mini Elute Kit (Qiagen, Valencia,CA) with a total elution volume of 50 μl for each sample.The sample was then dried in a SpeedVac for 50 min todryness and resuspended in 10 μl of RNase free water. Todecrease the fragment size to 60–200 bases, 1 μL of frag-mentation buffer (Ambion) was added to the sample andheated to 70°C for 15 min. Stop solution (1 μl) wasadded to terminate the reaction. A blocking mixture con-taining 2 μl of poly d(A) and 20 μl of Porcine Hybloc™(Applied Genetics Laboratories, Melbourne, FL) wereadded to 12 μl probe and incubated at 100°C for 1 minthen snap-cooled on ice for 2 min. Subsequently, the mix-ture was centrifuged to dryness in a SpeedVac and 80 μl ofthe hybridization buffer (20% formamide, 5× Denhardts,6× SSC, 0.1% SDS, 25 μg/ml tRNA, and RNase free water)was added to each dried sample. The probe was warmedto 42°C for 5 min and maintained at this temperatureuntil hybridization.
Microarray development and hybridizationDetails on the design and validation of the porcine oligo-nucleotide set have been reported [9]. This set represents13,297 porcine cDNAs and ESTs. A reference design wasused in which each of the experimental samples was cohy-bridized with the reference sample that contained equalamounts of all the RNA samples used in the experiment,which allowed the treatment of fluorescence ratios asmeasurements of relative expression. Single-spotted oli-gos were printed on GAPS II slides (Corning, Corning,NY) at the W. M. Keck Center for Comparative and Func-tional Genomics, University of Illinois. Before hybridiza-tion, the arrays were plunged in 0.2% SDS water andimmediately agitated vigorously for 2 min, washed threetimes in successive jars of distilled water and rinsed in100% ethanol. The arrays were then incubated in 5× SSC,0.1% SDS, 1% BSA in a Coplin jar for 45 to 60 min at42°C, washed by immersing in 5 successive Coplin jars ofdeionized distilled water (RICCA Chemical Company,Arlington, TX), rinsed in 100% isopropanol, to ensurethat the SDS was completely removed from the arrays andsubsequently dried by centrifugation. An array was placedinto a Corning Hybridization Chamber (Sigma) and 80 μlof the labeled solution was applied to a slide and coveredwith a LifterSlip™ (Erie Scientific, Portsmouth, NH). The
Page 12 of 16(page number not for citation purposes)
BMC Genomics 2007, 8:215 http://www.biomedcentral.com/1471-2164/8/215
chamber was then assembled and submerged in a 42°Cwater bath for 48 hrs.
Post-hybridization wash and array scanningThe hybridization chamber was disassembled and theLifterSlip™ was removed by immersing the array in 2×SSC, 0.1% SDS (at 42°C) until the LifterSlip™ movedfreely away from the slide. The arrays were placed in 2×SSC, 0.1% SDS for 5 min at 42°C. Subsequently the arrayswere placed in 0.1× SSC, 0.1% SDS for 10 min at roomtemperature followed by 0.1× SSC for 1 min at room tem-perature. The arrays were then rinsed in 0.01× SSC for 10sec or less and dried by centrifugation. Following hybrid-ization and washing, slides were scanned immediately forboth dye channels with an Axon 4000B (MolecularDevices, Union City, CA) dual-laser confocal scanner andimages were processed using GenePix v6.0 software(Molecular Devices). Microarray data from this study areavailable at The National Center for Biotechnology Infor-mation (NCBI) Gene Expression Omnibus (GEO) data-base (GSE7232) [59].
Microarray performance and data analysisDuring an initial screening, microarrays that did not con-tain at least 50% of the total number of spots with medianbackground-subtracted signal intensities >3 SD abovebackground in both Cy3 and Cy5 channels were repeated.Data from a total of 32 microarrays were normalized andused for statistical analysis. Median foreground intensities(F) and median background intensities (B) were gener-ated to construct the data matrix. Data were filtered outwhen the following criteria were satisfied: (I) removal oflow intensity spots when F-B < M + 2 MAD, where M is themedian of the negative control spots (blank or bufferspots); MAD is the median absolute deviation, (II)removal of saturated spots with very high intensity, and(III) removal of spots flagged by GenePix. Data were nor-malized using the regional lowess normalization (rlow-ess) method from the MAANOVA package [60] andanalyzed by Proc GLM in SAS (version 8.2). The data wasfitted to the model: yijklm = μ + Ai + Dj + Tk + Cl + TCkl + Sm +eijklm where yijklm is the logarithm of signal intensity, μ is theoverall mean expression level, Ai is the effect of the i tharray, Dj is the effect of the j th dye, Tk is the effect of the kth treatment, Cl is the effect of the l th tissue, TCkl is theinteraction effect of the k th treatment and the l th tissue,Sm is the m th sample effect, and eijklm is random effect andis assumed to follow normal distribution with 0 meanand constant variance. To avoid type I error of least squaremeans, Proc multtest was conducted to generate a falsediscovery rate (FDR) value [61]. FDR adjustments balancetype I and type II error rates. Genes were considered to bedifferentially expressed when FDR adjusted P = 0.05.
Microarray annotationBasic Local Alignment Search Tool (BLASTN) analysisagainst 13,297 spotted oligonucleotides was performedagainst tentative consensus (TC) sequences from TheInstitute for Genomic Research (TIGR) database [63](build 12; 42 sequences) and porcine UniGene databasefrom the NCBI database [64] (build 27; 544 sequences) toidentify swine-specific genes, EST clusters, and annota-tions. In addition, BLASTN for all sequences was per-formed against human UniGene (build 199; 727sequences), mouse UniGene (build 161; 13 sequences),mouse mRNA (236 sequences), and human mRNAsequences (11,717 sequences) using an E-value cut-off ofE ≤ e-5 and an extension threshold of 40 (NCBI February28, 2007) [64]. For all searches, best hits were used toannotate the swine sequences. A total of 10,560 oligoshad GO annotation, and they resulted in 6,344 differentNCBI gene IDs. GO terms were obtained (February 28,2007) from the GO database [65]. Perl scripts were usedto annotate the porcine sequences with relevant informa-tion parsed from human UniGene and LocusLink (e.g.,gene symbol, gene name, function, OMIM number,PubMed identification numbers) to obtain GO annota-tions associated with human and mouse UniGene num-bers.
Approach for data miningFirst, principal component analysis (PCA) was used toidentify components having the greatest effect on variancein gene expression. Second, genes that were differentiallyexpressed were categorized by their involvement in GObiological processes. Third, GOTree Machine (GOTM)analysis was used to identify GO categories with relativelyenriched gene numbers that were significantly impactedby microbial state (GF versus CONV). Fourth, class pre-diction analysis was performed to predict marker genes inCONV versus GF epithelia. Fifth, biological interactionsamong differentially expressed genes were identifiedusing Ingenuity Pathways Analysis 3.1 software [19].Finally, quantitative RT-PCR was used to validate themicroarray results for pathways selected by GOTM andIngenuity Pathways Analysis.
Principal component analysis (PCA)Differentially expressed genes were subjected to PCAusing GeneSpring GX 7.3.1 (Agilent Technologies) todetermine patterns in the variability of expression pro-files. PCA is a mathematical method that reduces thenumber of dimensions in a large dataset to a few dimen-sions that explain the majority of the variation betweensamples [62].
Page 13 of 16(page number not for citation purposes)
BMC Genomics 2007, 8:215 http://www.biomedcentral.com/1471-2164/8/215
Gene ontology, class prediction and biological pathways analysesDifferentially expressed genes were categorized accordingto their involvement in GO biological processes. Further-more, GOTM analysis was performed to identify specificbiological processes (i.e., number of genes operative inthe process) that were significantly enriched among thedifferentially expressed genes relative to their abundanceon the microarray [66]. Class prediction analysis was con-ducted via GeneSpring GX 7.3.1 (Agilent) to predictmarker genes for microbe-activated intestinal epithelialcells. Finally, functional relationships among the differen-tially expressed genes were generated using IngenuityPathways Analysis software.
Quantitative real-time RT-PCR (qRT-PCR)Total RNA was isolated from ileal samples using TRIZOLreagent (Invitrogen, Carlsbad, CA) for qRT-PCR to vali-date microbial colonization-induced changes in theexpression of genes involved in selected pathways. RNAwas purified with the RNeasy Mini kit and residual DNAremoved using the RNase-Free DNase set (Qiagen). RNAquality was determined to check the integrity of 28S and18S rRNA using Agilent 2100 Bioanalyzer (Agilent) andtotal RNA yield was quantified by spectrophotometry.Porcine-gene-specific primers were designed by PrimerExpress Software v2.0 (Applied Biosystems, Foster City,CA) and PRIMER3 algorithm in Biology WorkBench [67][see Additional file 7]. One step RT-PCR was performedusing Qiagen reagent (Qiagen) according to the manufac-turer's instructions and a GeneAmp PCR System 2700thermocycler (Applied Biosystems) to confirm singleproduct amplification. Quantitative RT-PCR reactionswere performed using SYBRGreen Master Mix accordingto the manufacturer's instructions (Qiagen). The relativeexpression of mRNA transcripts was measured in triplicatein a 384-well plate using an ABI Prism 7900 HT SS instru-ment (Applied Biosystems) after normalization to 18SrRNA. Data were analyzed by SAS and P < 0.05 was con-sidered significant.
Authors' contributionsSRC carried out the qRT-PCR analysis, coordinated thebioinformatic analysis of the microarray and qRT-PCRdata, and drafted the manuscript along with HRG. DEKparticipated in epithelial sample collection, RNA isola-tion, microarray hybridization and drafted an earlier ver-sion of the manuscript. BPW conducted the animal trial.MRB, ABL, LAR, and JEB assisted with either the laser cap-ture microdissection or microarray hybridization andinterpretation of data. JCM designed the statistical modelsused for data analysis. JJL contributed to the bioinfor-matic analysis of the microarray and qRT-PCR data andinterpretation of the results. LBS, AGVK and HRG con-
ceived and coordinated the study. All authors read andapproved the final manuscript.
Additional material
Additional file 1Principal component analysis. Principal component analysis (PCA) was performed using GeneSpring software (Agilent) to reduce the number of variables in the multivariate data.Click here for file[http://www.biomedcentral.com/content/supplementary/1471-2164-8-215-S1.ppt]
Additional file 2Expression profiles of genes associated with various biological processes in CONV compared with GF crypts. Table lists the differentially expressed genes involved in transcription, signal transduction, cell proliferation and differentiation, metabolism, electron transport, immune response and other biological processes in ileal epithelia from crypts of conventional ver-sus germfree animals.Click here for file[http://www.biomedcentral.com/content/supplementary/1471-2164-8-215-S2.doc]
Additional file 3Expression profiles of genes associated with various biological processes in CONV compared with GF villi. Table lists the differentially expressed genes involved in immune response and other biological processes in ileal epithelia from villi of conventional versus germfree animals.Click here for file[http://www.biomedcentral.com/content/supplementary/1471-2164-8-215-S3.doc]
Additional file 4The differentially expressed genes were categorized according to GO bio-logical processes. A pie chart depicts the percentage of differentially expressed genes in the GO biological processes of transcription, signal transduction, cell cycle, transport, metabolism, immune response, electron transport, others, and unknown.Click here for file[http://www.biomedcentral.com/content/supplementary/1471-2164-8-215-S4.ppt]
Additional file 5Genes comprising the enriched biological processes identified by GOTM analysis. Table lists the differentially expressed genes associated with sig-nificantly enriched biological processes as determined by GOTM analysis.Click here for file[http://www.biomedcentral.com/content/supplementary/1471-2164-8-215-S5.doc]
Additional file 6Marker genes identified by class prediction analysis. Table lists marker genes that distinguish germfree versus conventional ileal epithelia identi-fied by class prediction analysis with GeneSpring software (Agilent).Click here for file[http://www.biomedcentral.com/content/supplementary/1471-2164-8-215-S6.doc]
Page 14 of 16(page number not for citation purposes)
BMC Genomics 2007, 8:215 http://www.biomedcentral.com/1471-2164/8/215
AcknowledgementsWe thank Dr. Lei Liu at the W. M. Keck Center for Comparative and Func-tional Genomics and Dr. Massimo Bionaz (Department of Animal Sciences) for microarray data analysis and Ingenuity Pathway Analysis consultation, respectively. We also thank Carole Wilson at the W. M. Keck Center for Comparative and Functional Genomics and Daniel Graugnard (Department of Animal Sciences) for technical assistance with RNA isolation and quality analysis. We thank Dr. James F. Zachary for his expert assistance with laser capture microdissection. This project was supported by National Research Initiative Competitive Grant no. 2003-35206-12824 from the USDA Coop-erative State Research, Education, and Extension Service to HRG and Hatch grants from the Illinois Agricultural Experiment Station (ILLU-538-387, HRG; ILLU 538-314, LBS) and by the Saskatchewan Agriculture Devel-opment Fund to AGVK.
References1. Leser TD, Amenuvor JZ, Jensen TK, Lindecrona RH, Boye M, Moller
K: Culture-independent analysis of gut bacteria: the pig gas-trointestinal tract microbiota revisited. Appl Environ Microbiol2002, 68:673-690.
2. Gaskins HR: Immunological aspects of host/microbiota inter-actions at the intestinal epithelium. In Gastrointestinal Microbiol-ogy and Host Interactions Volume 2. Edited by: Mackie RIIREWBA. NewYork, Chapman and Hall; 1997:537-587.
3. Savage DC: Microbial ecology of the gastrointestinal tract.Annu Rev Microbiol 1977, 31:107-133.
4. Gaskins HR: Intestinal bacteria and their influence on swinegrowth. In Swine Nutrition Edited by: Lewis AJSLL. Boca Raton, CRCPress; 2000:585-608.
5. Ebner S, Schoknecht P, Reeds P, Burrin D: Growth and metabo-lism of gastrointestinal and skeletal muscle tissues in pro-tein-malnourished neonatal pigs. Am J Physiol 1994,266:R1736-43.
6. Edelstone DI, Holzman IR: Oxygen consumption by the gas-trointestinal tract and liver in conscious newborn lambs. AmJ Physiol 1981, 240:G297-304.
7. McNurlan MA, Garlick PJ: Contribution of rat liver and gastroin-testinal tract to whole-body protein synthesis in the rat. Bio-chem J 1980, 186:381-383.
8. Reeds PJ, Burrin DG, Davis TA, Fiorotto ML: Postnatal growth ofgut and muscle: competitors or collaborators. Proc Nutr Soc1993, 52:57-67.
9. Zhao SH, Recknor J, Lunney JK, Nettleton D, Kuhar D, Orley S, Tug-gle CK: Validation of a first-generation long-oligonucleotidemicroarray for transcriptional profiling in the pig. Genomics2005, 86:618-625.
10. Spies T, Blanck G, Bresnahan M, Sands J, Strominger JL: A new clus-ter of genes within the human major histocompatibilitycomplex. Science 1989, 243:214-217.
11. Farhadi A, Keshavarzian A, Ranjbaran Z, Fields JZ, Banan A: The roleof protein kinase C isoforms in modulating injury and repairof the intestinal barrier. J Pharmacol Exp Ther 2006, 316:1-7.
12. Alvarez RH, Kantarjian HM, Cortes JE: Biology of platelet-derivedgrowth factor and its involvement in disease. Mayo Clin Proc2006, 81:1241-1257.
13. Khoury KA, Floch MH, Hersh T: Small intestinal mucosal cellproliferation and bacterial flora in the conventionalization ofthe germfree mouse. J Exp Med 1969, 130:659-670.
14. Elsbach P, Weiss J: Role of the bactericidal/permeability-increasing protein in host defence. Curr Opin Immunol 1998,10:45-49.
15. Levy O: A neutrophil-derived anti-infective molecule: bacte-ricidal/permeability-increasing protein. Antimicrob Agents Chem-other 2000, 44:2925-2931.
16. Cresswell P: Antigen processing and presentation. Immunol Rev2005, 207:5-7.
17. Satoh J NY Tabunoki H, Yamamura T: Microarray analysis identi-fies a set of CXCR3 and CCR2 ligand chemokines as earlyIFNbeta-responsive genes in peripheral blood lymphocytesin vitro: an implication for IFNbeta-related adverse effects inmultiple sclerosis. BMC Neurol 2006, 19:6-18.
18. Mutch DM, Simmering R, Donnicola D, Fotopoulos G, Holzwarth JA,Williamson G, Corthesy-Theulaz I: Impact of commensal micro-biota on murine gastrointestinal tract gene ontologies. Phys-iol Genomics 2004, 19:22-31.
19. Ingenuity [http://www.ingenuity.com]20. Kahn AB, Ryan MC, Liu H, Zeeberg BR, Jamison DC, Weinstein JN:
SpliceMiner: a high-throughput database implementation ofthe NCBI Evidence Viewer for microarray splice variantanalysis. BMC Bioinformatics 2007, 8:75.
21. Esfandiari F, Villanueva JA, Wong DH, French SW, Halsted CH:Chronic ethanol feeding and folate deficiency activatehepatic endoplasmic reticulum stress pathway in micropigs.Am J Physiol Gastrointest Liver Physiol 2005, 289:G54-63.
22. Deplancke B, Gaskins HR: Microbial modulation of innatedefense: goblet cells and the intestinal mucus layer. Am J ClinNutr 2001, 73:1131S-1141S.
23. He W, Wang ML, Jiang HQ, Steppan CM, Shin ME, Thurnheer MC,Cebra JJ, Lazar MA, Wu GD: Bacterial colonization leads to thecolonic secretion of RELMbeta/FIZZ2, a novel goblet cell-specific protein. Gastroenterology 2003, 125:1388-1397.
24. Misra AK, Ujita M, Fukuda M, Hindsgaul O: Synthesis and enzy-matic evaluation of mucin type core 4 O-glycan. Carbohydr Lett2001, 4:71-76.
25. Conour JE, Ganessunker D, Tappenden KA, Donovan SM, GaskinsHR: Acidomucin goblet cell expansion induced by parenteralnutrition in the small intestine of piglets. Am J Physiol Gastroin-test Liver Physiol 2002, 283:G1185-96.
26. Kang W, Rathinavelu S, Samuelson LC, Merchant JL: Interferongamma induction of gastric mucous neck cell hypertrophy.Lab Invest 2005, 85:702-715.
27. Kandori H, Hirayama K, Takeda M, Doi K: Histochemical, lectin-histochemical and morphometrical characteristics of intesti-nal goblet cells of germfree and conventional mice. Exp Anim1996, 45:155-160.
28. Rakoff-Nahoum S, Paglino J, Eslami-Varzaneh F, Edberg S, MedzhitovR: Recognition of commensal microflora by toll-like recep-tors is required for intestinal homeostasis. Cell 2004,118:229-241.
29. Cario E, Gerken G, Podolsky DK: Toll-like receptor 2 enhancesZO-1-associated intestinal epithelial barrier integrity viaprotein kinase C. Gastroenterology 2004, 127:224-238.
30. Moynagh PN: TLR signalling and activation of IRFs: revisitingold friends from the NF-kappaB pathway. Trends Immunol 2005,26:469-476.
31. Fitzgerald KA, Rowe DC, Barnes BJ, Caffrey DR, Visintin A, Latz E,Monks B, Pitha PM, Golenbock DT: LPS-TLR4 signaling to IRF-3/7 and NF-kappaB involves the toll adapters TRAM and TRIF.J Exp Med 2003, 198:1043-1055.
32. Kawai T, Takeuchi O, Fujita T, Inoue J, Muhlradt PF, Sato S, HoshinoK, Akira S: Lipopolysaccharide stimulates the MyD88-inde-pendent pathway and results in activation of IFN-regulatoryfactor 3 and the expression of a subset of lipopolysaccharide-inducible genes. J Immunol 2001, 167:5887-5894.
33. Honda K, Yanai H, Negishi H, Asagiri M, Sato M, Mizutani T, ShimadaN, Ohba Y, Takaoka A, Yoshida N, Taniguchi T: IRF-7 is the masterregulator of type-I interferon-dependent immune responses.Nature 2005, 434:772-777.
34. Bjorkbacka H, Fitzgerald KA, Huet F, Li X, Gregory JA, Lee MA, Ord-ija CM, Dowley NE, Golenbock DT, Freeman MW: The inductionof macrophage gene expression by LPS predominantly uti-lizes Myd88-independent signaling cascades. Physiol Genomics2004, 19:319-330.
Additional file 7Sequences for qRT-PCR primers. Table lists the porcine-gene-specific primers used for qRT-PCR analysis.Click here for file[http://www.biomedcentral.com/content/supplementary/1471-2164-8-215-S7.doc]
Page 15 of 16(page number not for citation purposes)
BMC Genomics 2007, 8:215 http://www.biomedcentral.com/1471-2164/8/215
Publish with BioMed Central and every scientist can read your work free of charge
"BioMed Central will be the most significant development for disseminating the results of biomedical research in our lifetime."
Sir Paul Nurse, Cancer Research UK
Your research papers will be:
available free of charge to the entire biomedical community
peer reviewed and published immediately upon acceptance
cited in PubMed and archived on PubMed Central
yours — you keep the copyright
Submit your manuscript here:http://www.biomedcentral.com/info/publishing_adv.asp
BioMedcentral
35. Skerrett SJ, Liggitt HD, Hajjar AM, Wilson CB: Cutting edge: mye-loid differentiation factor 88 is essential for pulmonary hostdefense against Pseudomonas aeruginosa but not Staphylo-coccus aureus. J Immunol 2004, 172:3377-3381.
36. Weighardt H, Mages J, Jusek G, Kaiser-Moore S, Lang R, Holzmann B:Organ-specific role of MyD88 for gene regulation during pol-ymicrobial peritonitis. Infect Immun 2006, 74:3618-3632.
37. Stark GR, Kerr IM, Williams BR, Silverman RH, Schreiber RD: Howcells respond to interferons. Annu Rev Biochem 1998, 67:227-264.
38. Darnell JE Jr., Kerr IM, Stark GR: Jak-STAT pathways and tran-scriptional activation in response to IFNs and other extracel-lular signaling proteins. Science 1994, 264:1415-1421.
39. Takaoka A, Mitani Y, Suemori H, Sato M, Yokochi T, Noguchi S, Tan-aka N, Taniguchi T: Cross talk between interferon-gamma and-alpha/beta signaling components in caveolar membranedomains. Science 2000, 288:2357-2360.
40. Theofilopoulos AN, Baccala R, Beutler B, Kono DH: Type I inter-ferons (alpha/beta) in immunity and autoimmunity. Annu RevImmunol 2005, 23:307-336.
41. Pawliczak R, Logun C, Madara P, Barb J, Suffredini AF, Munson PJ,Danner RL, Shelhamer JH: Influence of IFN-gamma on geneexpression in normal human bronchial epithelial cells: mod-ulation of IFN-gamma effects by dexamethasone. PhysiolGenomics 2005, 23:28-45.
42. Kawai T, Sato S, Ishii KJ, Coban C, Hemmi H, Yamamoto M, Terai K,Matsuda M, Inoue J, Uematsu S, Takeuchi O, Akira S: Interferon-alpha induction through Toll-like receptors involves a directinteraction of IRF7 with MyD88 and TRAF6. Nat Immunol2004, 5:1061-1068.
43. Rhee SJ, Walker WA, Cherayil BJ: Developmentally regulatedintestinal expression of IFN-gamma and its target genes andthe age-specific response to enteric Salmonella infection. JImmunol 2005, 175:1127-1136.
44. Brinkmann V, Geiger T, Alkan S, Heusser CH: Interferon alphaincreases the frequency of interferon gamma-producinghuman CD4+ T cells. J Exp Med 1993, 178:1655-1663.
45. Holko M, Williams BR: Functional annotation of IFN-alpha-stimulated gene expression profiles from sensitive andresistant renal cell carcinoma cell lines. J Interferon Cytokine Res2006, 26:534-547.
46. Hong F, Jaruga B, Kim WH, Radaeva S, El-Assal ON, Tian Z, NguyenVA, Gao B: Opposing roles of STAT1 and STAT3 in T cell-mediated hepatitis: regulation by SOCS. J Clin Invest 2002,110:1503-1513.
47. Kelly D, Campbell JI, King TP, Grant G, Jansson EA, Coutts AG, Pet-tersson S, Conway S: Commensal anaerobic gut bacteria atten-uate inflammation by regulating nuclear-cytoplasmicshuttling of PPAR-gamma and RelA. Nat Immunol 2004,5:104-112.
48. Backhed F, Normark S, Schweda EK, Oscarson S, Richter-Dahlfors A:Structural requirements for TLR4-mediated LPS signalling:a biological role for LPS modifications. Microbes Infect 2003,5:1057-1063.
49. Zhang G, Ghosh S: Negative regulation of toll-like receptor-mediated signaling by Tollip. J Biol Chem 2002, 277:7059-7065.
50. Abreu MT, Thomas LS, Arnold ET, Lukasek K, Michelsen KS, ArditiM: TLR signaling at the intestinal epithelial interface. J Endo-toxin Res 2003, 9:322-330.
51. Richter M, Cantin AM, Beaulieu C, Cloutier A, Larivee P: Zinc che-lators inhibit eotaxin, RANTES, and MCP-1 production instimulated human airway epithelium and fibroblasts. Am JPhysiol Lung Cell Mol Physiol 2003, 285:L719-29.
52. Shirkey TW, Siggers RH, Goldade BG, Marshall JK, Drew MD,Laarveld B, Van Kessel AG: Effects of commensal bacteria onintestinal morphology and expression of proinflammatorycytokines in the gnotobiotic pig. Exp Biol Med (Maywood) 2006,231:1333-1345.
53. Aggarwal BB: Nuclear factor-kappaB: the enemy within. CancerCell 2004, 6:203-208.
54. Rayet B, Gelinas C: Aberrant rel/nfkb genes and activity inhuman cancer. Oncogene 1999, 18:6938-6947.
55. Bharti AC, Aggarwal BB: Nuclear factor-kappa B and cancer: itsrole in prevention and therapy. Biochem Pharmacol 2002,64:883-888.
56. Smith AG, Heath JK, Donaldson DD, Wong GG, Moreau J, Stahl M,Rogers D: Inhibition of pluripotential embryonic stem cell dif-
ferentiation by purified polypeptides. Nature 1988,336:688-690.
57. Loewen GM, Tracy E, Blanchard F, Tan D, Yu J, Raza S, Matsui S, Bau-mann H: Transformation of human bronchial epithelial cellsalters responsiveness to inflammatory cytokines. BMC Cancer2005, 5:145.
58. Friel R, van der Sar S, Mee PJ: Embryonic stem cells: understand-ing their history, cell biology and signalling. Adv Drug Deliv Rev2005, 57:1894-1903.
59. GEO [http://www.ncbi.nlm.nih.gov/geo/]60. Wu H, Kerr MK, Cui XQ, Churchill GA: MAANOVA: A software
Package for the Analysis of Spotted cDNA MicroarrayExperiments in he Analysis of Gene Expression Data: Anoverview of Methods and Software. 2003.
61. Reiner A, Yekutieli D, Benjamini Y: Identifying differentiallyexpressed genes using false discovery rate controlling proce-dures. Bioinformatics 2003, 19:368-375.
62. Tigr [http://www.tigr.org/]63. NCBI [http://www.ncbi.nlm.nih.gov/BLAST/]64. Geneontology [http://www.geneontology.org]65. Fannin RD, Auman JT, Bruno ME, Sieber SO, Ward SM, Tucker CJ,
Merrick BA, Paules RS: Differential gene expression profiling inwhole blood during acute systemic inflammation in lipopoly-saccharide-treated rats. Physiol Genomics 2005, 21:92-104.
66. Zhang B, Schmoyer D, Kirov S, Snoddy J: GOTree Machine(GOTM): a web-based platform for interpreting sets of inter-esting genes using Gene Ontology hierarchies. BMC Bioinfor-matics 2004, 5:16.
67. PRIMER3 [http://workbench.sdsc.edu]
Page 16 of 16(page number not for citation purposes)