transcontinental gas pipe line company, llc regional
TRANSCRIPT
Transcontinental Gas Pipe Line Company, LLC
Section 3-3 PCSM Plan for Compressor Station 200
Regional Energy Access Expansion Project – Compressor Station 200
April 2021
Regional Energy Access Expansion Project ESCGP-3 Permit Application Transcontinental Gas Pipe Line Company, LLC Section 3-3 PCSM Plan for Compressor Station 200
i
TABLE OF CONTENTS
Sections 1. Project Description
2. Topographic Features of the Area (NOI Checklist Item 7.a)
3. Receiving Surface Waters (NOI Checklist Item 7.e)
4. Types, Depth, Slope, Locations & Limitation of the Soils and Geologic Formations (NOI Checklist Item 7.b, 7.l, 8.a, 8.e)
4.1 Resolutions to Soil Limitations
4.2 Geologic Formations
5. Characterizations of Earth Disturbance Activities, Including Past, Present, and Proposed Land Uses (NOI Checklist Item 7.c)
6. Post Construction Stormwater Management Best Management Practices, Installation Sequence and PCSM Critical Stages (NOI Checklist Item 7.f, 7.g)
7. Net Change in Volume and Rate of Runoff (NOI Checklist Item 7.d, 8.b, 8.c, 8.d)
8. Temporary and Permanent Stabilization
8.1 Permanent Stabilization
8.2 Temporary Stabilization
8.3 Stabilization During Non-Growing Season
8.4 Riparian Buffer Stabilization
9. Long Term Operation and Maintenance Schedule (NOI Checklist Item 7.j)
10. Recycling and Disposal of Materials (NOI Checklist Item 7.k)
11. Thermal Impacts (NOI Checklist Item 7.m)
12. Antidegradation Requirements (NOI Checklist Item 7.o, 8.f)
13. Riparian Buffers (NOI Checklist Item 7.n)
14. Offsite Discharge Analysis
15. Non-Structural and Structural Water Quality BMP Description
16. The PCSM Plan Shall be Prepared by a Person Trained and Experienced in PCSM Methods and Techniques
Regional Energy Access Expansion Project ESCGP-3 Permit Application Transcontinental Gas Pipe Line Company, LLC Section 3-3 PCSM Plan for Compressor Station 200
ii
Attachments 1 Project Location Map
2 Soils Map and Report
3 Site Evaluation and Soil Infiltration Test Report
4 PCSM Plan BMP Design Worksheets and Calculations 4.1 CN Table 4.2 Stormwater BMP Manual Appedix D Worksheet 4.3 BMP HydroCad Report
5 Non-Structural and Structural Water Quality BMPs Map
6 Offsite Discharge Report
Drawings 1 of 6 Post Construction Stormwater Management Plan - Cover
2 of 6 Post Construction Stormwater Management Plan - Existing Site Conditions
3 of 6 Post Construction Stormwater Management Plan - Proposed Site Plan
4 of 6 Post Construction Stormwater Management Plan - Notes
5-6 of 6 Post Construction Stormwater Management Plan - Details

SECTION 3.3.1 NARRATIVE
Regional Energy Access Expansion Project ESCGP-3 Permit Application Transcontinental Gas Pipe Line Company, LLC Section 3-3 PCSM Plan Narrative for Compressor Station 200
1
1. Project Description
Transcontinental Gas Pipe Line Company, LLC (Transco), indirectly owned by the
Williams Companies, Inc. (Williams) is seeking authorization from the Federal Energy Regulatory
Commission (FERC) under Section 7(c) of the Natural Gas Act and Part 157 of the Commissions
regulations, to construct, own, operate, and maintain the proposed Project facilities associated
with the Regional Energy Access Expansion Project (Project). The Project is an expansion of
Transco’s existing natural gas transmission system that will enable Transco to provide an
incremental 829,400 dekatherms per day (Dth/d) of year-round firm transportation capacity from
the Marcellus Shale production area in northeastern Pennsylvania (PA) to multiple delivery points
along Transco’s Leidy Line in PA, Transco’s mainline at the Station 210 Zone 6 Pooling Point1 in
Mercer County, New Jersey (NJ) and multiple delivery points in Transco’s Zone 6 in NJ, PA, and
Maryland (MD).
The existing Compressor Station 200 component of the Project is located in East
Whiteland Township, Chester County. Proposed are compressor station modifications to connect
the existing Transco Mainline A into suction to support south flow.
This Post Construction Stormwater Management (PCSM) Plan has been developed for
the Compressor Station 200 site. The PCSM Plan shall be designed and implemented to be
consistent with the PCSM Plan under 25 Pa. Code § 102.8 (relating to PCSM requirements). The
work and disturbed areas are located within Transco property, existing easements or legally
obtained workspace. The limit of disturbance (LOD) for the Compressor Station 200 site will be
approximately 3.16 acres. Subject to FERC’s certification of the Project and receipt of the
necessary permits and authorizations, Transco anticipates construction of the Project to start in
third quarter 2022 to meet a proposed in-service date of December 1, 2023.
2. Topographic Features of the Area (NOI Checklist Item 7.a)
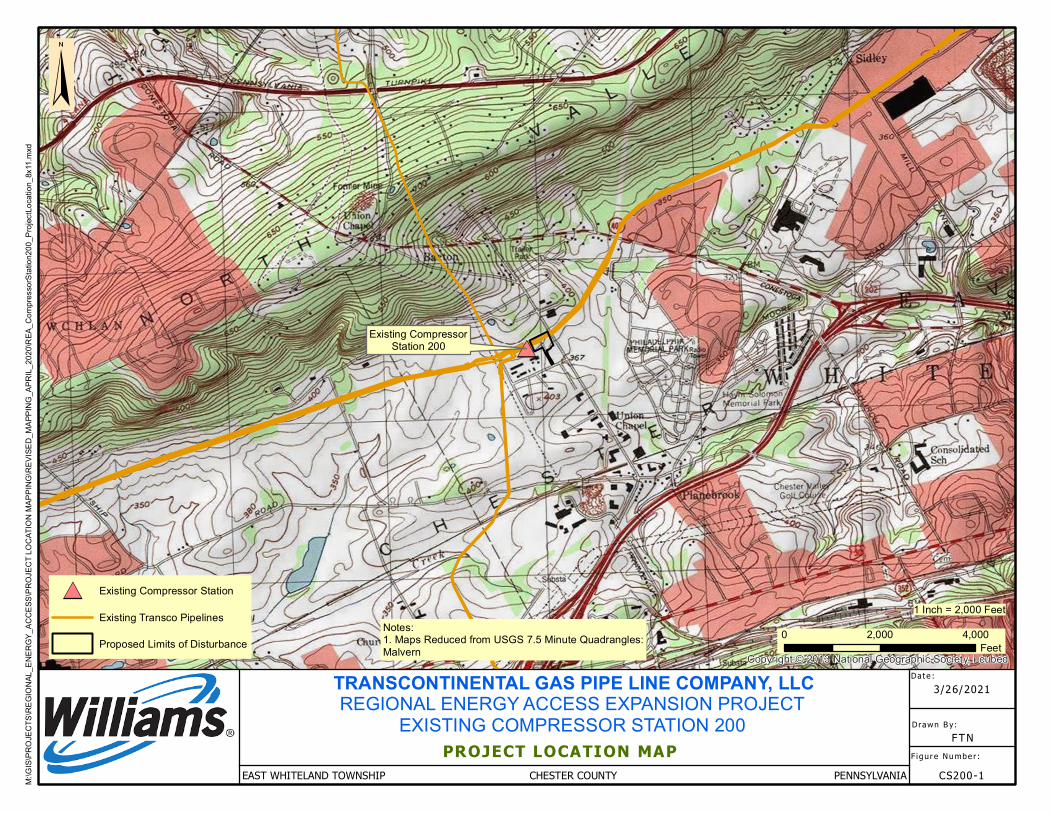
A Project Location Map for Compressor Station 200 is included in Attachment 1. This map
shows the topographical features of the general site vicinity and is based on the USGS 7.5 Minute
topographical mapping of the Malvern, Pennsylvania quadrangles.
Regional Energy Access Expansion Project ESCGP-3 Permit Application Transcontinental Gas Pipe Line Company, LLC Section 3-3 PCSM Plan Narrative for Compressor Station 200
2
3. Receiving Surface Waters (NOI Checklist Item 7.e)
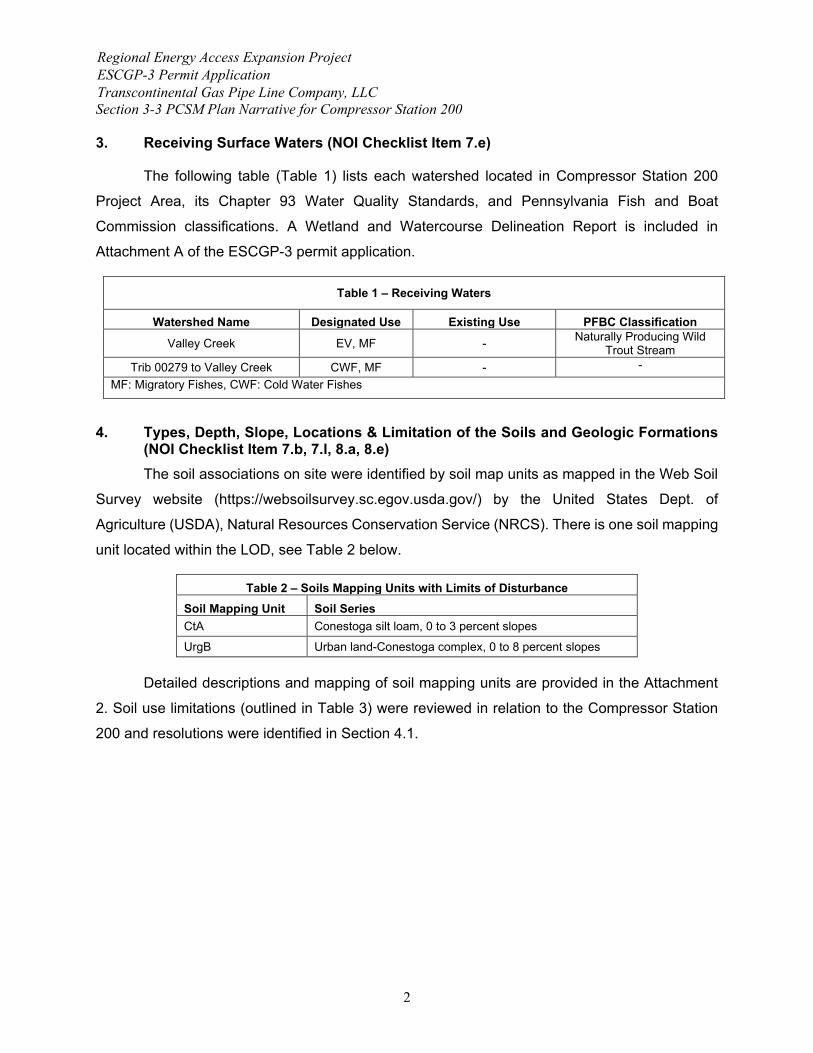
The following table (Table 1) lists each watershed located in Compressor Station 200
Project Area, its Chapter 93 Water Quality Standards, and Pennsylvania Fish and Boat
Commission classifications. A Wetland and Watercourse Delineation Report is included in
Attachment A of the ESCGP-3 permit application.
Table 1 – Receiving Waters
Watershed Name Designated Use Existing Use PFBC Classification Valley Creek EV, MF - Naturally Producing Wild
Trout Stream Trib 00279 to Valley Creek CWF, MF - -
MF: Migratory Fishes, CWF: Cold Water Fishes
4. Types, Depth, Slope, Locations & Limitation of the Soils and Geologic Formations
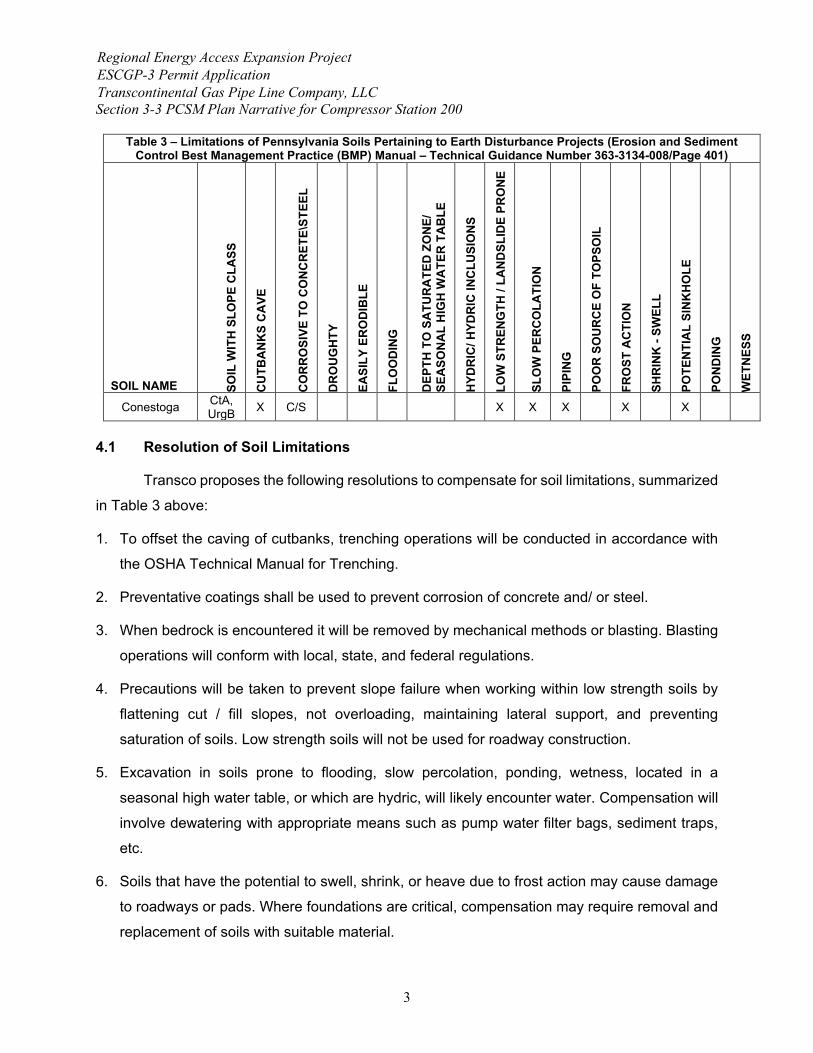
(NOI Checklist Item 7.b, 7.l, 8.a, 8.e) The soil associations on site were identified by soil map units as mapped in the Web Soil
Survey website (https://websoilsurvey.sc.egov.usda.gov/) by the United States Dept. of
Agriculture (USDA), Natural Resources Conservation Service (NRCS). There is one soil mapping
unit located within the LOD, see Table 2 below.
Table 2 – Soils Mapping Units with Limits of Disturbance Soil Mapping Unit Soil Series CtA Conestoga silt loam, 0 to 3 percent slopes
UrgB Urban land-Conestoga complex, 0 to 8 percent slopes Detailed descriptions and mapping of soil mapping units are provided in the Attachment
2. Soil use limitations (outlined in Table 3) were reviewed in relation to the Compressor Station
200 and resolutions were identified in Section 4.1.
Regional Energy Access Expansion Project ESCGP-3 Permit Application Transcontinental Gas Pipe Line Company, LLC Section 3-3 PCSM Plan Narrative for Compressor Station 200
3
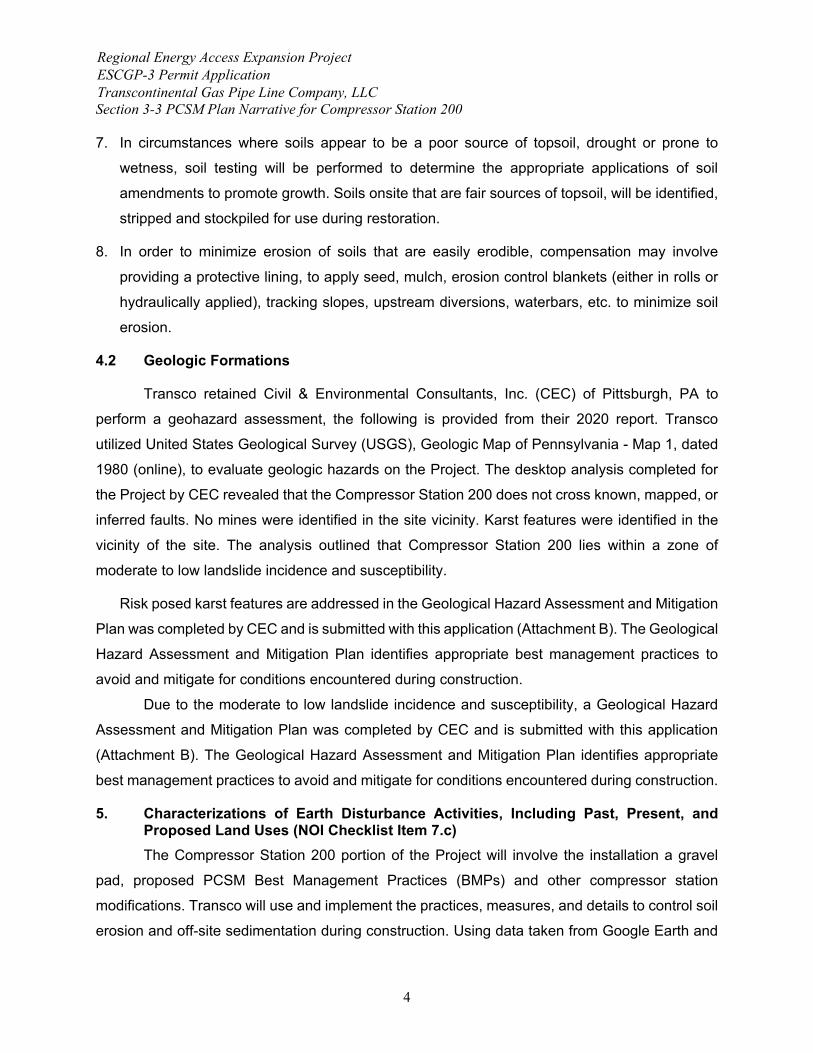
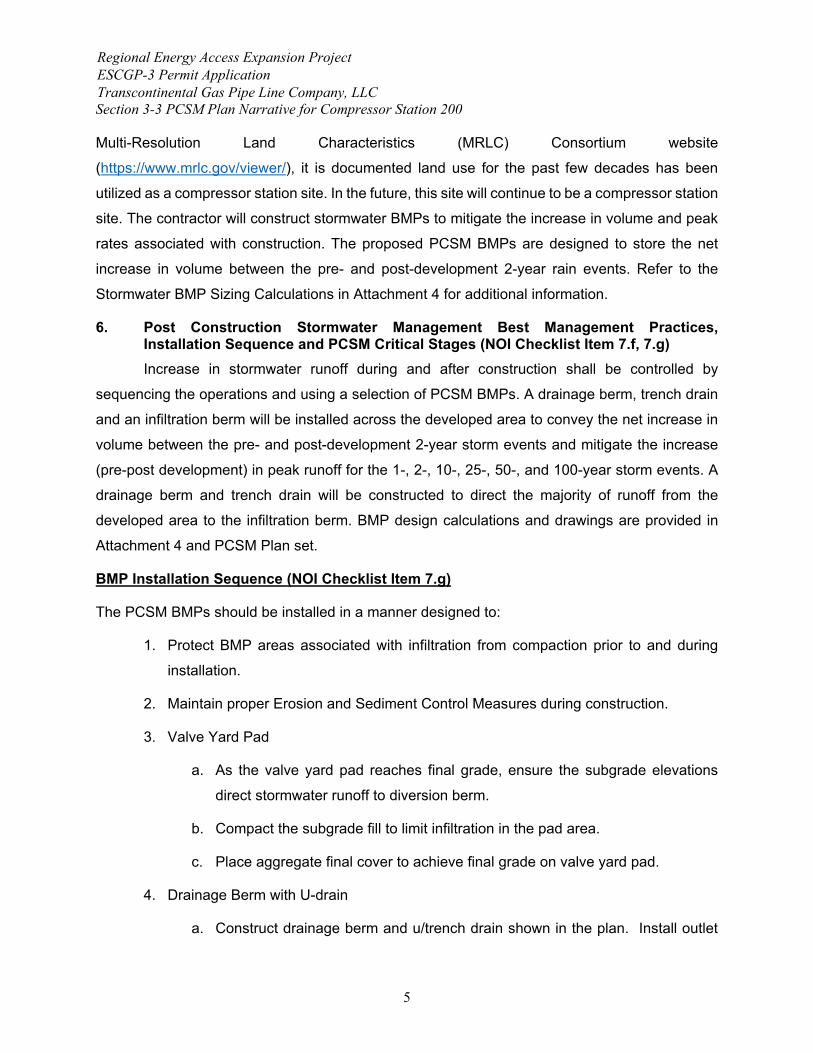
Table 3 – Limitations of Pennsylvania Soils Pertaining to Earth Disturbance Projects (Erosion and Sediment Control Best Management Practice (BMP) Manual – Technical Guidance Number 363-3134-008/Page 401)
SOIL NAME SOIL
WIT
H S
LOPE
CLA
SS
CU
TBA
NK
S C
AVE
CO
RR
OSI
VE T
O C
ON
CR
ETE\
STEE
L
DR
OU
GH
TY
EASI
LY E
RO
DIB
LE
FLO
OD
ING
DEP
TH T
O S
ATU
RA
TED
ZO
NE/
SE
ASO
NA
L H
IGH
WA
TER
TA
BLE
HYD
RIC
/ HYD
RIC
INC
LUSI
ON
S
LOW
STR
ENG
TH /
LAN
DSL
IDE
PRO
NE
SLO
W P
ERCO
LATI
ON
PIPI
NG
POO
R S
OU
RC
E O
F TO
PSO
IL
FRO
ST A
CTI
ON
SHR
INK
- SW
ELL
POTE
NTI
AL
SIN
KH
OLE
PON
DIN
G
WET
NES
S
Conestoga CtA, UrgB X C/S X X X X X
4.1 Resolution of Soil Limitations
Transco proposes the following resolutions to compensate for soil limitations, summarized
in Table 3 above:
1. To offset the caving of cutbanks, trenching operations will be conducted in accordance with
the OSHA Technical Manual for Trenching.
2. Preventative coatings shall be used to prevent corrosion of concrete and/ or steel.
3. When bedrock is encountered it will be removed by mechanical methods or blasting. Blasting
operations will conform with local, state, and federal regulations.
4. Precautions will be taken to prevent slope failure when working within low strength soils by
flattening cut / fill slopes, not overloading, maintaining lateral support, and preventing
saturation of soils. Low strength soils will not be used for roadway construction.
5. Excavation in soils prone to flooding, slow percolation, ponding, wetness, located in a
seasonal high water table, or which are hydric, will likely encounter water. Compensation will
involve dewatering with appropriate means such as pump water filter bags, sediment traps,
etc.
6. Soils that have the potential to swell, shrink, or heave due to frost action may cause damage
to roadways or pads. Where foundations are critical, compensation may require removal and
replacement of soils with suitable material.
Regional Energy Access Expansion Project ESCGP-3 Permit Application Transcontinental Gas Pipe Line Company, LLC Section 3-3 PCSM Plan Narrative for Compressor Station 200
4
7. In circumstances where soils appear to be a poor source of topsoil, drought or prone to
wetness, soil testing will be performed to determine the appropriate applications of soil
amendments to promote growth. Soils onsite that are fair sources of topsoil, will be identified,
stripped and stockpiled for use during restoration.
8. In order to minimize erosion of soils that are easily erodible, compensation may involve
providing a protective lining, to apply seed, mulch, erosion control blankets (either in rolls or
hydraulically applied), tracking slopes, upstream diversions, waterbars, etc. to minimize soil
erosion.
4.2 Geologic Formations
Transco retained Civil & Environmental Consultants, Inc. (CEC) of Pittsburgh, PA to
perform a geohazard assessment, the following is provided from their 2020 report. Transco
utilized United States Geological Survey (USGS), Geologic Map of Pennsylvania - Map 1, dated
1980 (online), to evaluate geologic hazards on the Project. The desktop analysis completed for
the Project by CEC revealed that the Compressor Station 200 does not cross known, mapped, or
inferred faults. No mines were identified in the site vicinity. Karst features were identified in the
vicinity of the site. The analysis outlined that Compressor Station 200 lies within a zone of
moderate to low landslide incidence and susceptibility.
Risk posed karst features are addressed in the Geological Hazard Assessment and Mitigation
Plan was completed by CEC and is submitted with this application (Attachment B). The Geological
Hazard Assessment and Mitigation Plan identifies appropriate best management practices to
avoid and mitigate for conditions encountered during construction.
Due to the moderate to low landslide incidence and susceptibility, a Geological Hazard
Assessment and Mitigation Plan was completed by CEC and is submitted with this application
(Attachment B). The Geological Hazard Assessment and Mitigation Plan identifies appropriate
best management practices to avoid and mitigate for conditions encountered during construction.
5. Characterizations of Earth Disturbance Activities, Including Past, Present, and Proposed Land Uses (NOI Checklist Item 7.c) The Compressor Station 200 portion of the Project will involve the installation a gravel
pad, proposed PCSM Best Management Practices (BMPs) and other compressor station
modifications. Transco will use and implement the practices, measures, and details to control soil
erosion and off-site sedimentation during construction. Using data taken from Google Earth and
Regional Energy Access Expansion Project ESCGP-3 Permit Application Transcontinental Gas Pipe Line Company, LLC Section 3-3 PCSM Plan Narrative for Compressor Station 200
5
Multi-Resolution Land Characteristics (MRLC) Consortium website
(https://www.mrlc.gov/viewer/), it is documented land use for the past few decades has been
utilized as a compressor station site. In the future, this site will continue to be a compressor station
site. The contractor will construct stormwater BMPs to mitigate the increase in volume and peak
rates associated with construction. The proposed PCSM BMPs are designed to store the net
increase in volume between the pre- and post-development 2-year rain events. Refer to the
Stormwater BMP Sizing Calculations in Attachment 4 for additional information.
6. Post Construction Stormwater Management Best Management Practices, Installation Sequence and PCSM Critical Stages (NOI Checklist Item 7.f, 7.g)
Increase in stormwater runoff during and after construction shall be controlled by
sequencing the operations and using a selection of PCSM BMPs. A drainage berm, trench drain
and an infiltration berm will be installed across the developed area to convey the net increase in
volume between the pre- and post-development 2-year storm events and mitigate the increase
(pre-post development) in peak runoff for the 1-, 2-, 10-, 25-, 50-, and 100-year storm events. A
drainage berm and trench drain will be constructed to direct the majority of runoff from the
developed area to the infiltration berm. BMP design calculations and drawings are provided in
Attachment 4 and PCSM Plan set.
BMP Installation Sequence (NOI Checklist Item 7.g)
The PCSM BMPs should be installed in a manner designed to:
1. Protect BMP areas associated with infiltration from compaction prior to and during
installation.
2. Maintain proper Erosion and Sediment Control Measures during construction.
3. Valve Yard Pad
a. As the valve yard pad reaches final grade, ensure the subgrade elevations
direct stormwater runoff to diversion berm.
b. Compact the subgrade fill to limit infiltration in the pad area.
c. Place aggregate final cover to achieve final grade on valve yard pad.
4. Drainage Berm with U-drain
a. Construct drainage berm and u/trench drain shown in the plan. Install outlet
Regional Energy Access Expansion Project ESCGP-3 Permit Application Transcontinental Gas Pipe Line Company, LLC Section 3-3 PCSM Plan Narrative for Compressor Station 200
6
protection as required.
5. Install Infiltration Berm
a. Complete site grading and stabilize within the limit of disturbance except where
the Infiltration Berms will be constructed. Make every effort to minimize berm
footprint and necessary zone of disturbance (including both removal of existing
vegetation and disturbance of empty soil) in order to maximize infiltration.
b. Lightly scarify the soil in the area of the proposed berm before delivering soil
to site.
c. Bring in fill material to make up the major portion of the berm. Soil should be
added in 8-inch lifts and compacted after each addition according to design
specifications. The slope and shape of the berm should be graded out as soil
is added.
d. Protect the surface ponding area at the base of the berm from compaction. If
compaction of this area does occur, scarify the soil to a depth of at least 8
inches.
e. Complete final grading of the berm after the top layer of soil is added. Tamp
soil down lightly and smooth sides of the berm. The crest and base of the berm
should be at level grade.
f. Plant berm with turf, meadow plants, shrubs or trees, as desired.
g. Mulch planted and disturbed areas with compost mulch to prevent erosion
while plants become established.
6. All temporary E&S BMPs will be removed following site stabilization. Do not remove
other Erosion and Sediment Control measures until site is fully stabilized.
7. All installed BMPs will be monitored until final site stabilization is achieved.
8. Long term operation and maintenance guidelines discussed below shall be followed.
PCSM Critical Stages
Critical points requiring visits by the licensed professional or delegate are as follows:
1. Upon commencement of construction activities to ascertain the Infiltration Berm area has
been flagged and fence erected to prevent access to the area.
2. At completion of the Drainage Berm to ensure it has been constructed to the proposed
Regional Energy Access Expansion Project ESCGP-3 Permit Application Transcontinental Gas Pipe Line Company, LLC Section 3-3 PCSM Plan Narrative for Compressor Station 200
7
lines and grades, the specified lining materials have been installed in accordance with the
requirements of the plans and specifications, and if applicable, vegetation has been
established.
3. At the beginning of construction of the Infiltration Berm to ensure the infiltration area has
not been compacted by construction activities.
4. During construction of the Infiltration Berm the licensed professional will observe that the
BMP is constructed in accordance with the plans and specifications.
5. Following installation of the Valve Yard Pad subgrade to ensure stormwater flow is
directed to the Diversion Berm.
6. For final inspection of constructed BMPs.
7. At the establishment of hard surface stabilization or 70% vegetation covers to allow
removal of E&S controls.
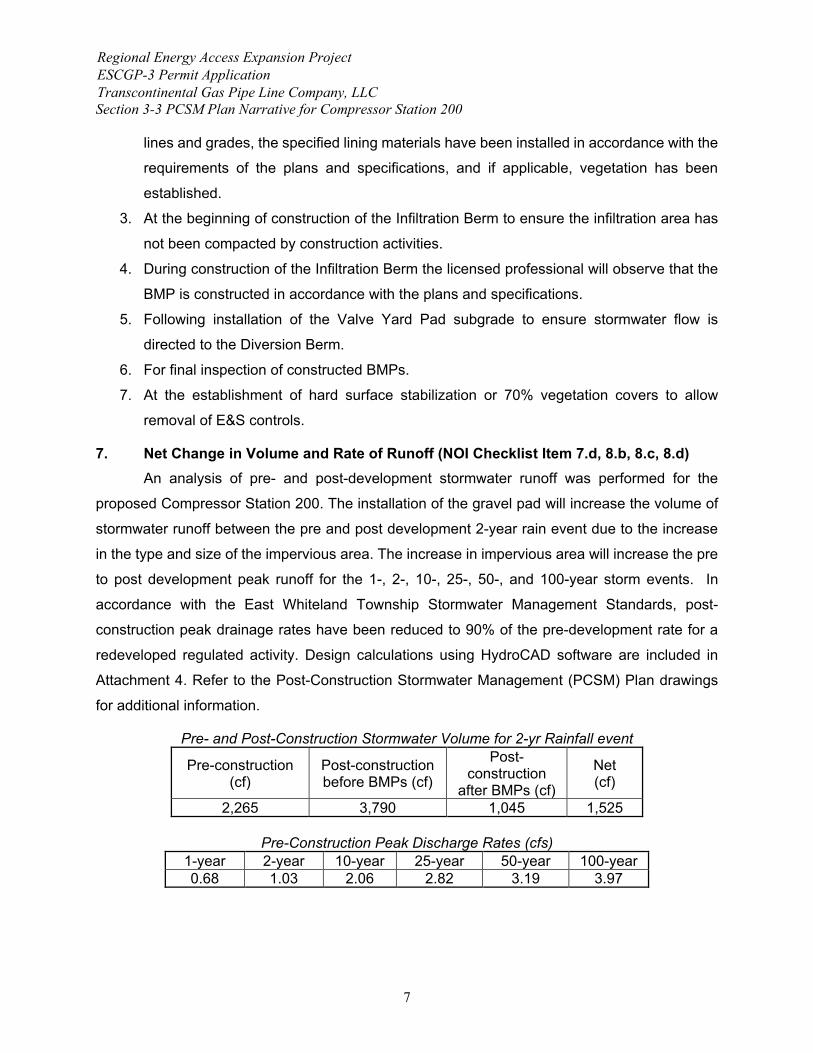
7. Net Change in Volume and Rate of Runoff (NOI Checklist Item 7.d, 8.b, 8.c, 8.d) An analysis of pre- and post-development stormwater runoff was performed for the
proposed Compressor Station 200. The installation of the gravel pad will increase the volume of
stormwater runoff between the pre and post development 2-year rain event due to the increase
in the type and size of the impervious area. The increase in impervious area will increase the pre
to post development peak runoff for the 1-, 2-, 10-, 25-, 50-, and 100-year storm events. In
accordance with the East Whiteland Township Stormwater Management Standards, post-
construction peak drainage rates have been reduced to 90% of the pre-development rate for a
redeveloped regulated activity. Design calculations using HydroCAD software are included in
Attachment 4. Refer to the Post-Construction Stormwater Management (PCSM) Plan drawings
for additional information.
Pre- and Post-Construction Stormwater Volume for 2-yr Rainfall event
Pre-construction (cf)
Post-construction before BMPs (cf)
Post-construction
after BMPs (cf)
Net (cf)
2,265 3,790 1,045 1,525
Pre-Construction Peak Discharge Rates (cfs) 1-year 2-year 10-year 25-year 50-year 100-year 0.68 1.03 2.06 2.82 3.19 3.97
Regional Energy Access Expansion Project ESCGP-3 Permit Application Transcontinental Gas Pipe Line Company, LLC Section 3-3 PCSM Plan Narrative for Compressor Station 200
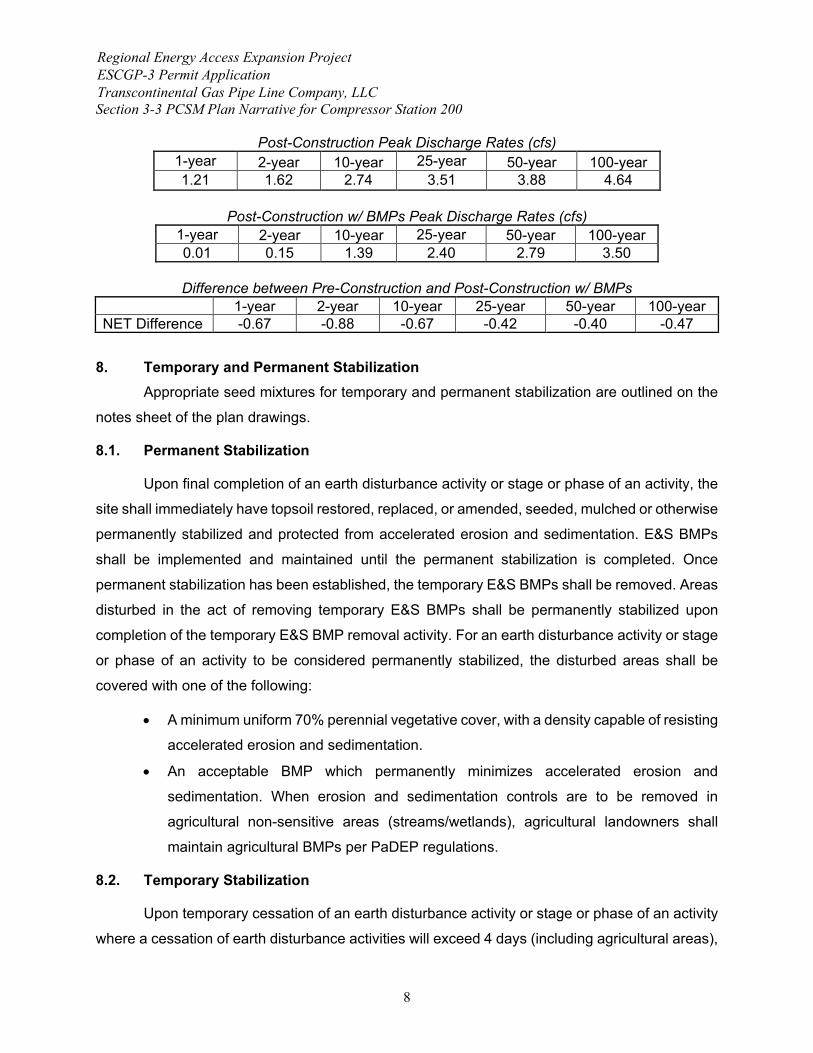
8
Post-Construction Peak Discharge Rates (cfs) 1-year 2-year 10-year 25-year 50-year 100-year 1.21 1.62 2.74 3.51 3.88 4.64
Post-Construction w/ BMPs Peak Discharge Rates (cfs)
1-year 2-year 10-year 25-year 50-year 100-year 0.01 0.15 1.39 2.40 2.79 3.50
Difference between Pre-Construction and Post-Construction w/ BMPs
1-year 2-year 10-year 25-year 50-year 100-year NET Difference -0.67 -0.88 -0.67 -0.42 -0.40 -0.47
8. Temporary and Permanent Stabilization
Appropriate seed mixtures for temporary and permanent stabilization are outlined on the
notes sheet of the plan drawings.
8.1. Permanent Stabilization
Upon final completion of an earth disturbance activity or stage or phase of an activity, the
site shall immediately have topsoil restored, replaced, or amended, seeded, mulched or otherwise
permanently stabilized and protected from accelerated erosion and sedimentation. E&S BMPs
shall be implemented and maintained until the permanent stabilization is completed. Once
permanent stabilization has been established, the temporary E&S BMPs shall be removed. Areas
disturbed in the act of removing temporary E&S BMPs shall be permanently stabilized upon
completion of the temporary E&S BMP removal activity. For an earth disturbance activity or stage
or phase of an activity to be considered permanently stabilized, the disturbed areas shall be
covered with one of the following:
• A minimum uniform 70% perennial vegetative cover, with a density capable of resisting
accelerated erosion and sedimentation.
• An acceptable BMP which permanently minimizes accelerated erosion and
sedimentation. When erosion and sedimentation controls are to be removed in
agricultural non-sensitive areas (streams/wetlands), agricultural landowners shall
maintain agricultural BMPs per PaDEP regulations.
8.2. Temporary Stabilization
Upon temporary cessation of an earth disturbance activity or stage or phase of an activity
where a cessation of earth disturbance activities will exceed 4 days (including agricultural areas),
Regional Energy Access Expansion Project ESCGP-3 Permit Application Transcontinental Gas Pipe Line Company, LLC Section 3-3 PCSM Plan Narrative for Compressor Station 200
9
the site shall be immediately seeded, mulched, or otherwise protected from accelerated erosion
and sedimentation pending future earth disturbance activities. For an earth disturbance activity or
stage or phase of an activity to be considered temporarily stabilized, the disturbed areas shall be
covered with one of the following:
• A minimum uniform coverage of mulch and seed, with a density capable of
resisting accelerated erosion and sedimentation.
• An acceptable BMP which temporarily minimizes accelerated erosion and
sedimentation.
8.3. Stabilization During Non-Growing Season
When utility construction must be done and is completed during a non-growing season,
interim stabilization BMPs must be implemented and adequately maintained. The application of
straw mulch at the rate of 3.0 tons per acre is required. The BMPs should be inspected weekly
(unless snow covered) and after each runoff event to identify areas that become bare. Temporary
erosion and sediment pollution controls must be maintained.
8.4. Riparian Buffer Stabilization
No riparian buffer stabilization is necessary for the Compressor Station 200 site.
9. Long Term Operation and Maintenance Schedule (NOI Checklist Item 7.j) PCSM BMPs should be properly maintained to ensure their effectiveness. Sheet flow
conditions and infiltration must be sustained throughout the life of the BMP. BMPs should be
inspected for clogging from sediment of debris, damage by foot or vehicular traffic, and flow
channelization. Inspections should be made on a quarterly basis for the first two years following
installation, and then twice per year thereafter. Inspections should also be made after every storm
event greater than 1 inch during the establishment period.
Channel linings should be inspected for signs of erosion or dislodging, as applicable.
Channels should be inspected for debris, overgrown vegetation, and other blockages. Catch
basins and inlets should be inspected at least two times per year and after runoff events and
cleaned as needed. Vegetation along the surface of the infiltration basin should be maintained in
good conditions. Vehicles should not be parked or driven on an infiltration berm and care should
be taken to avoid excessive compaction by mowers.
Regional Energy Access Expansion Project ESCGP-3 Permit Application Transcontinental Gas Pipe Line Company, LLC Section 3-3 PCSM Plan Narrative for Compressor Station 200
10
Operation and maintenance guidelines should be provided to facility owners and tenants.
Sediment and debris should be routinely removed upon observation. If erosion is observed,
measures should be taken to improve the dispersion method to address the source of erosion.
Sediment should be removed when the BMP is thoroughly dry. Trash and debris removed from
the site should be deposited only at suitable disposal/recycling sites and must comply with
applicable local, state, and federal waste regulations. Grass cover should be mowed with low
ground pressure equipment as needed to control noxious weeds. Mowing should be done only
when the soil is dry in order to prevent tracking damage to vegetation, soil compaction, and flow
concentrations. If vegetative cover is not fully established within the designated time, it should be
replaced with an alternative species. Unwanted or invasive growth should be removed on an
annual basis.
Vegetated areas will be inspected weekly and after runoff events until permanent
vegetation is achieved. Once the vegetation is established, inspections of health, diversity, and
density should be performed at least twice per year, during both the growing and non-growing
season. Vegetative cover should be sustained at 85% and reestablished if damage greater than
50% is observed. Damaged BMPs will be repaired as soon as possible upon discovery. Repairs
will be made to restore damaged BMPs to the original design condition.
10. Recycling and Disposal of Materials (NOI Checklist Item 7.k) The restoration will require the removal of the temporary materials. The temporary
materials include, but may not be limited to, stone surfaces and associated geotextiles. The
contractors are required to dispose of the materials at suitable disposal or recycling sites and in
compliance with local, state and federal regulations.
Contractors are required to inventory and manage their construction site materials. The
goal is to be aware of the materials on-site, ensure they are properly maintained, used, and
disposed of, and to make sure the materials are not exposed to stormwater. The following
materials or substances are expected to be present on-site during construction (Note: this list is
not an all-inclusive list and the materials management plan can be modified to address additional
materials used on-site):
• Acids • Detergents • Fertilizers (nitrogen/phosphorus) • Hydroseeding mixtures

Regional Energy Access Expansion Project ESCGP-3 Permit Application Transcontinental Gas Pipe Line Company, LLC Section 3-3 PCSM Plan Narrative for Compressor Station 200
11
• Petroleum based products • Sanitary wastes • Soil stabilization additives • Solder • Solvents
These materials must be stored as appropriate and shall not contact storm or non-
stormwater discharges. Contractor shall provide a weatherproof container to store chemicals or
erodible substances that must be kept on the site. Contractor is responsible for reading,
maintaining, and making employees and subcontractors aware of Safety Data Sheets (SDSs).
11. Thermal Impacts (NOI Checklist Item 7.m) Thermal impacts to surface waters are not anticipated. Most of the stormwater will be
routed through the stormwater BMP designed to retain and infiltrate the first surge of water from
the site. The first surge of water will be the warmest water for the duration of the storm event and
will quickly cool as the storm event progresses. The BMPs are designed to capture and infiltrate
this warmest surge of stormwater. Based on routing calculations, stormwater is retained in the
BMPs for a period of 11.50 hours before being discharged during a 100-year/24-hour storm event.
This retention period is longer for less intense storms. Therefore, as a result of these measures,
no significant thermal impact to the receiving waters is anticipated.
12. Antidegradation Requirements (NOI Checklist Item 7.o, 8.f) Compressor Station 200 is located within an EV watershed; therefore, an evaluation for
antidegradation requirements was performed. Transco used various criteria to evaluate parcels
suitable for a compressor station within the hydraulic range required to meet the purpose and
need of the project. The criteria for parcel evaluation included but was not limited to existing
conditions, resource impacts, workspace, and reasonable availability. Based on the location
selected for Compressor Station 200, impacts to EV watersheds are unavoidable. Transco
determined that there are no cost-effective and environmental sound viable non-discharge
alternatives for the project.
Construction activities within the EV watershed will result in increased discharge of
stormwater to surface waters which will be mitigated by the implementation of post construction
stormwater management (PCSM) BMPs. Proposed PCSM BMPs are designed with stormwater
volume reduction and water quality treatment maximized to the extent practicable within the site
constraints to maintain and protect existing water quality and existing and designated uses.
Regional Energy Access Expansion Project ESCGP-3 Permit Application Transcontinental Gas Pipe Line Company, LLC Section 3-3 PCSM Plan Narrative for Compressor Station 200
12
13. Riparian Buffers (NOI Checklist Item 7.n) Compressor Station 200 is not located within a riparian buffer.
14. Offsite Discharge Analysis The stormwater BMP’s being constructed at Compressor Station 200 are in areas that will
discharge stormwater to offsite non-surface water. These areas have been analyzed to reduce
the likelihood that these discharges will be erosive to adjacent property owners. The analysis has
been performed in accordance with PADEP Document 3150-FS-DEP4124, “Off-Site Discharges
of Stormwaters to Areas That Are Not Surface Waters”. The full analysis is presented in
Attachment 6 – Offsite Discharge Report. A summary of the findings for Compressor Station 200
is presented below.
Compressor Station 200 utilizes an infiltration berm to release water through a spillway. It
flows directly into a level spreader where it then discharges towards the vegetated area located
southeast of the Limits of Disturbance. The stormwater is discharged as sheet flow and travels
along a vegetative flow path until it reaches an onsite drainage swale, which then discharges to
an existing culvert along N. Bacton Hill Road. The area downgradient of the proposed infiltration
berm is over 90% vegetated. Additionally, velocity coming out of the outfall protection for the 25-
yr 24-hr storm was calculated and found to be 1.53 fps. Since the outlet velocity is below 2.5 fps
downstream erosion will be minimal if not negligible.
15. Non-Structural and Structural Water Quality BMP Description The limit of disturbance will be reduced to the maximum extent possible by disturbing only
those areas necessary to complete the proposed earthwork and BMP installations. Sensitive
features such as wetlands and riparian buffers will be protected to the maximum extent possible.
These areas will be clearly delineated in the field and protected prior to construction activities
taking place. Existing vegetation is not to be removed from the protected area and the areas shall
not be subject to grading or movement of existing soils. Protected areas that have been
disturbed/compacted during construction will be restored using soil amendment and restoration.
16. The PCSM Plan Shall be Prepared by a Person Trained and Experienced in PCSM Methods and Techniques These plans and narrative were prepared by Kevin C. Clark, PE (BAI Group, LLC) of State
College, PA in accordance with the Pennsylvania Department of Environmental Protection
Stormwater BMP Manual, December 2006. Plan preparer’s resume is provided in Attachment C
of the ESCGP-3 permit package).
ATTACHMENT 1 PROJECT LOCATION MAP
##Existing Compressor
Station 200
Copyright:© 2013 National Geographic Society, i-cubed
CS200-1
3/26/2021
Drawn B y:FTN
Date :
F igur e Nu mbe r:
§
## Existing Compressor Station
Existing Transco Pipelines
Proposed Limits of Disturbance0 2,000 4,000
Feet
1 Inch = 2,000 FeetNotes:1. Maps Reduced from USGS 7.5 Minute Quadrangles:Malvern
CHESTER COUNTY PENNSYLVANIA
M:\G
IS\P
RO
JEC
TS\R
EGIO
NAL
_EN
ERG
Y_AC
CES
S\PR
OJE
CT
LOC
ATIO
N M
APPI
NG
\REV
ISED
_MAP
PIN
G_A
PRIL
_202
0\R
EA_C
ompr
esso
rSta
tion2
00_P
roje
ctLo
catio
n_8x
11.m
xd
PROJECT LOCATION MAP
TRANSCONTINENTAL GAS PIPE LINE COMPANY, LLCREGIONAL ENERGY ACCESS EXPANSION PROJECT
EXISTING COMPRESSOR STATION 200
EAST WHITELAND TOWNSHIP
ATTACHMENT 2 SOILS MAP AND REPORT
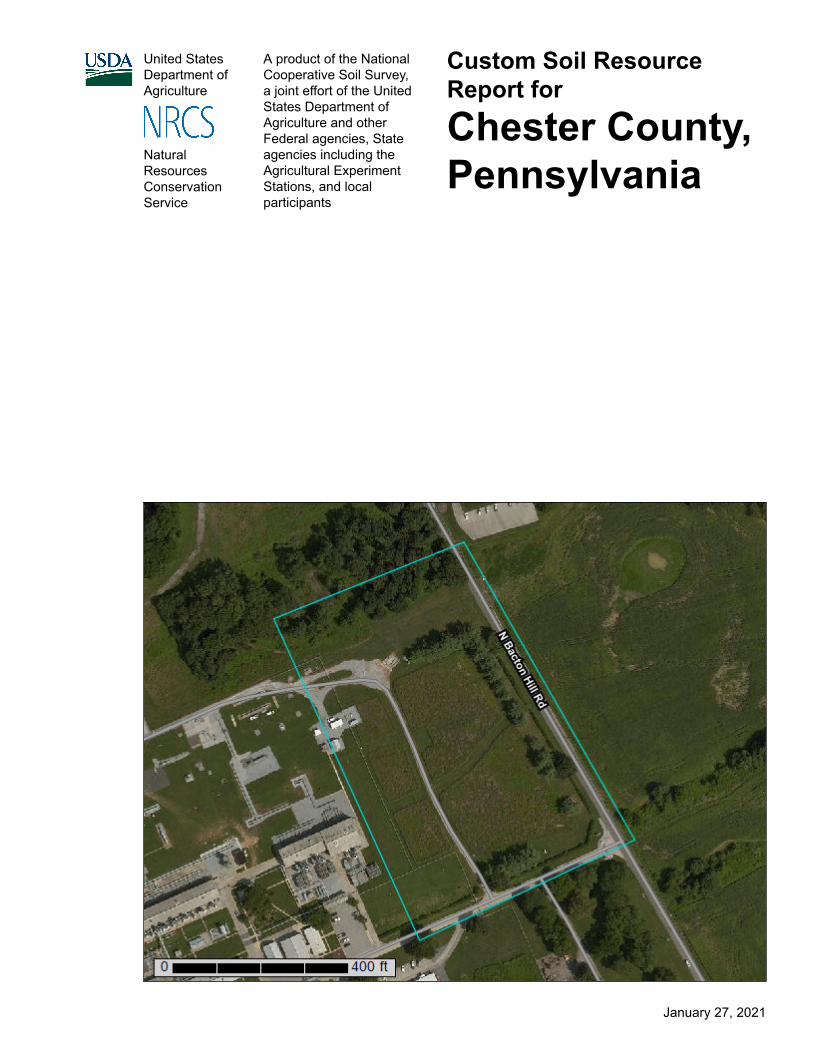
United StatesDepartment ofAgriculture
A product of the NationalCooperative Soil Survey,a joint effort of the UnitedStates Department ofAgriculture and otherFederal agencies, Stateagencies including theAgricultural ExperimentStations, and localparticipants
Custom Soil Resource Report for
Chester County, Pennsylvania
NaturalResourcesConservationService
January 27, 2021

PrefaceSoil surveys contain information that affects land use planning in survey areas. They highlight soil limitations that affect various land uses and provide information about the properties of the soils in the survey areas. Soil surveys are designed for many different users, including farmers, ranchers, foresters, agronomists, urban planners, community officials, engineers, developers, builders, and home buyers. Also, conservationists, teachers, students, and specialists in recreation, waste disposal, and pollution control can use the surveys to help them understand, protect, or enhance the environment.
Various land use regulations of Federal, State, and local governments may impose special restrictions on land use or land treatment. Soil surveys identify soil properties that are used in making various land use or land treatment decisions. The information is intended to help the land users identify and reduce the effects of soil limitations on various land uses. The landowner or user is responsible for identifying and complying with existing laws and regulations.
Although soil survey information can be used for general farm, local, and wider area planning, onsite investigation is needed to supplement this information in some cases. Examples include soil quality assessments (http://www.nrcs.usda.gov/wps/portal/nrcs/main/soils/health/) and certain conservation and engineering applications. For more detailed information, contact your local USDA Service Center (https://offices.sc.egov.usda.gov/locator/app?agency=nrcs) or your NRCS State Soil Scientist (http://www.nrcs.usda.gov/wps/portal/nrcs/detail/soils/contactus/?cid=nrcs142p2_053951).
Great differences in soil properties can occur within short distances. Some soils are seasonally wet or subject to flooding. Some are too unstable to be used as a foundation for buildings or roads. Clayey or wet soils are poorly suited to use as septic tank absorption fields. A high water table makes a soil poorly suited to basements or underground installations.
The National Cooperative Soil Survey is a joint effort of the United States Department of Agriculture and other Federal agencies, State agencies including the Agricultural Experiment Stations, and local agencies. The Natural Resources Conservation Service (NRCS) has leadership for the Federal part of the National Cooperative Soil Survey.
Information about soils is updated periodically. Updated information is available through the NRCS Web Soil Survey, the site for official soil survey information.
The U.S. Department of Agriculture (USDA) prohibits discrimination in all its programs and activities on the basis of race, color, national origin, age, disability, and where applicable, sex, marital status, familial status, parental status, religion, sexual orientation, genetic information, political beliefs, reprisal, or because all or a part of an individual's income is derived from any public assistance program. (Not all prohibited bases apply to all programs.) Persons with disabilities who require
2

alternative means for communication of program information (Braille, large print, audiotape, etc.) should contact USDA's TARGET Center at (202) 720-2600 (voice and TDD). To file a complaint of discrimination, write to USDA, Director, Office of Civil Rights, 1400 Independence Avenue, S.W., Washington, D.C. 20250-9410 or call (800) 795-3272 (voice) or (202) 720-6382 (TDD). USDA is an equal opportunity provider and employer.
3
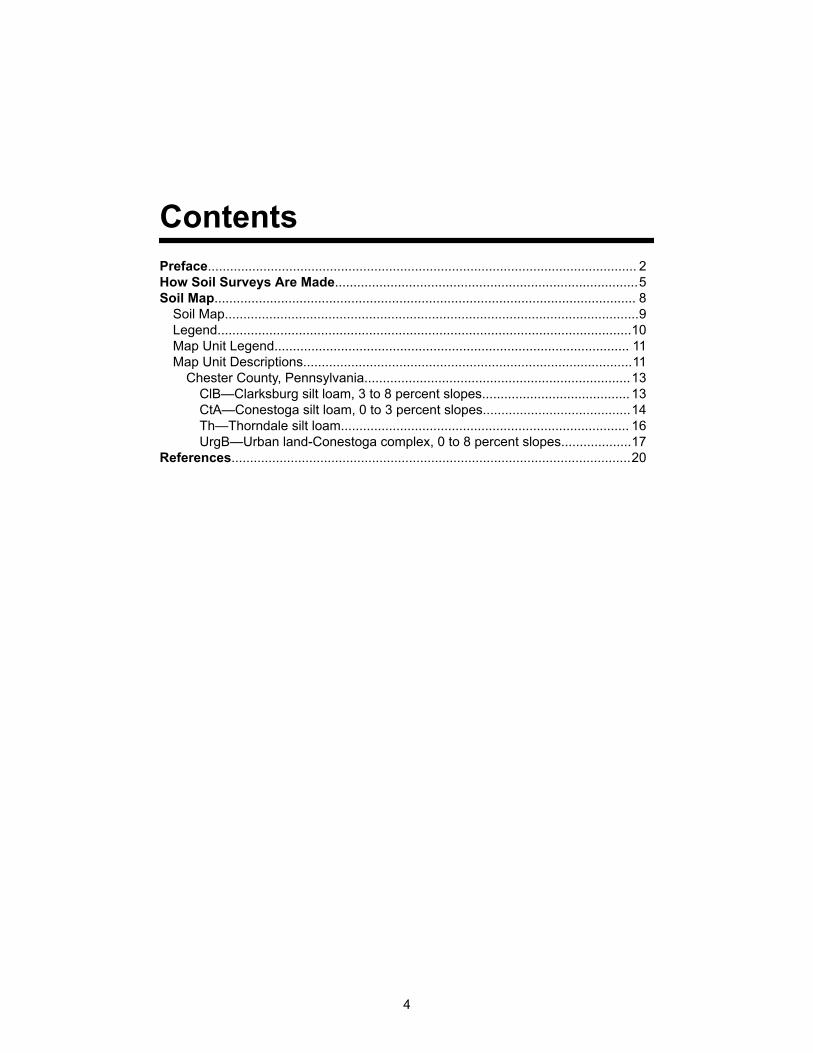
ContentsPreface.................................................................................................................... 2How Soil Surveys Are Made..................................................................................5Soil Map.................................................................................................................. 8
Soil Map................................................................................................................9Legend................................................................................................................10Map Unit Legend................................................................................................ 11Map Unit Descriptions.........................................................................................11
Chester County, Pennsylvania........................................................................13ClB—Clarksburg silt loam, 3 to 8 percent slopes........................................ 13CtA—Conestoga silt loam, 0 to 3 percent slopes........................................14Th—Thorndale silt loam.............................................................................. 16UrgB—Urban land-Conestoga complex, 0 to 8 percent slopes...................17
References............................................................................................................20
4

How Soil Surveys Are MadeSoil surveys are made to provide information about the soils and miscellaneous areas in a specific area. They include a description of the soils and miscellaneous areas and their location on the landscape and tables that show soil properties and limitations affecting various uses. Soil scientists observed the steepness, length, and shape of the slopes; the general pattern of drainage; the kinds of crops and native plants; and the kinds of bedrock. They observed and described many soil profiles. A soil profile is the sequence of natural layers, or horizons, in a soil. The profile extends from the surface down into the unconsolidated material in which the soil formed or from the surface down to bedrock. The unconsolidated material is devoid of roots and other living organisms and has not been changed by other biological activity.
Currently, soils are mapped according to the boundaries of major land resource areas (MLRAs). MLRAs are geographically associated land resource units that share common characteristics related to physiography, geology, climate, water resources, soils, biological resources, and land uses (USDA, 2006). Soil survey areas typically consist of parts of one or more MLRA.
The soils and miscellaneous areas in a survey area occur in an orderly pattern that is related to the geology, landforms, relief, climate, and natural vegetation of the area. Each kind of soil and miscellaneous area is associated with a particular kind of landform or with a segment of the landform. By observing the soils and miscellaneous areas in the survey area and relating their position to specific segments of the landform, a soil scientist develops a concept, or model, of how they were formed. Thus, during mapping, this model enables the soil scientist to predict with a considerable degree of accuracy the kind of soil or miscellaneous area at a specific location on the landscape.
Commonly, individual soils on the landscape merge into one another as their characteristics gradually change. To construct an accurate soil map, however, soil scientists must determine the boundaries between the soils. They can observe only a limited number of soil profiles. Nevertheless, these observations, supplemented by an understanding of the soil-vegetation-landscape relationship, are sufficient to verify predictions of the kinds of soil in an area and to determine the boundaries.
Soil scientists recorded the characteristics of the soil profiles that they studied. They noted soil color, texture, size and shape of soil aggregates, kind and amount of rock fragments, distribution of plant roots, reaction, and other features that enable them to identify soils. After describing the soils in the survey area and determining their properties, the soil scientists assigned the soils to taxonomic classes (units). Taxonomic classes are concepts. Each taxonomic class has a set of soil characteristics with precisely defined limits. The classes are used as a basis for comparison to classify soils systematically. Soil taxonomy, the system of taxonomic classification used in the United States, is based mainly on the kind and character of soil properties and the arrangement of horizons within the profile. After the soil
5

scientists classified and named the soils in the survey area, they compared the individual soils with similar soils in the same taxonomic class in other areas so that they could confirm data and assemble additional data based on experience and research.
The objective of soil mapping is not to delineate pure map unit components; the objective is to separate the landscape into landforms or landform segments that have similar use and management requirements. Each map unit is defined by a unique combination of soil components and/or miscellaneous areas in predictable proportions. Some components may be highly contrasting to the other components of the map unit. The presence of minor components in a map unit in no way diminishes the usefulness or accuracy of the data. The delineation of such landforms and landform segments on the map provides sufficient information for the development of resource plans. If intensive use of small areas is planned, onsite investigation is needed to define and locate the soils and miscellaneous areas.
Soil scientists make many field observations in the process of producing a soil map. The frequency of observation is dependent upon several factors, including scale of mapping, intensity of mapping, design of map units, complexity of the landscape, and experience of the soil scientist. Observations are made to test and refine the soil-landscape model and predictions and to verify the classification of the soils at specific locations. Once the soil-landscape model is refined, a significantly smaller number of measurements of individual soil properties are made and recorded. These measurements may include field measurements, such as those for color, depth to bedrock, and texture, and laboratory measurements, such as those for content of sand, silt, clay, salt, and other components. Properties of each soil typically vary from one point to another across the landscape.
Observations for map unit components are aggregated to develop ranges of characteristics for the components. The aggregated values are presented. Direct measurements do not exist for every property presented for every map unit component. Values for some properties are estimated from combinations of other properties.
While a soil survey is in progress, samples of some of the soils in the area generally are collected for laboratory analyses and for engineering tests. Soil scientists interpret the data from these analyses and tests as well as the field-observed characteristics and the soil properties to determine the expected behavior of the soils under different uses. Interpretations for all of the soils are field tested through observation of the soils in different uses and under different levels of management. Some interpretations are modified to fit local conditions, and some new interpretations are developed to meet local needs. Data are assembled from other sources, such as research information, production records, and field experience of specialists. For example, data on crop yields under defined levels of management are assembled from farm records and from field or plot experiments on the same kinds of soil.
Predictions about soil behavior are based not only on soil properties but also on such variables as climate and biological activity. Soil conditions are predictable over long periods of time, but they are not predictable from year to year. For example, soil scientists can predict with a fairly high degree of accuracy that a given soil will have a high water table within certain depths in most years, but they cannot predict that a high water table will always be at a specific level in the soil on a specific date.
After soil scientists located and identified the significant natural bodies of soil in the survey area, they drew the boundaries of these bodies on aerial photographs and
Custom Soil Resource Report
6

identified each as a specific map unit. Aerial photographs show trees, buildings, fields, roads, and rivers, all of which help in locating boundaries accurately.
Custom Soil Resource Report
7

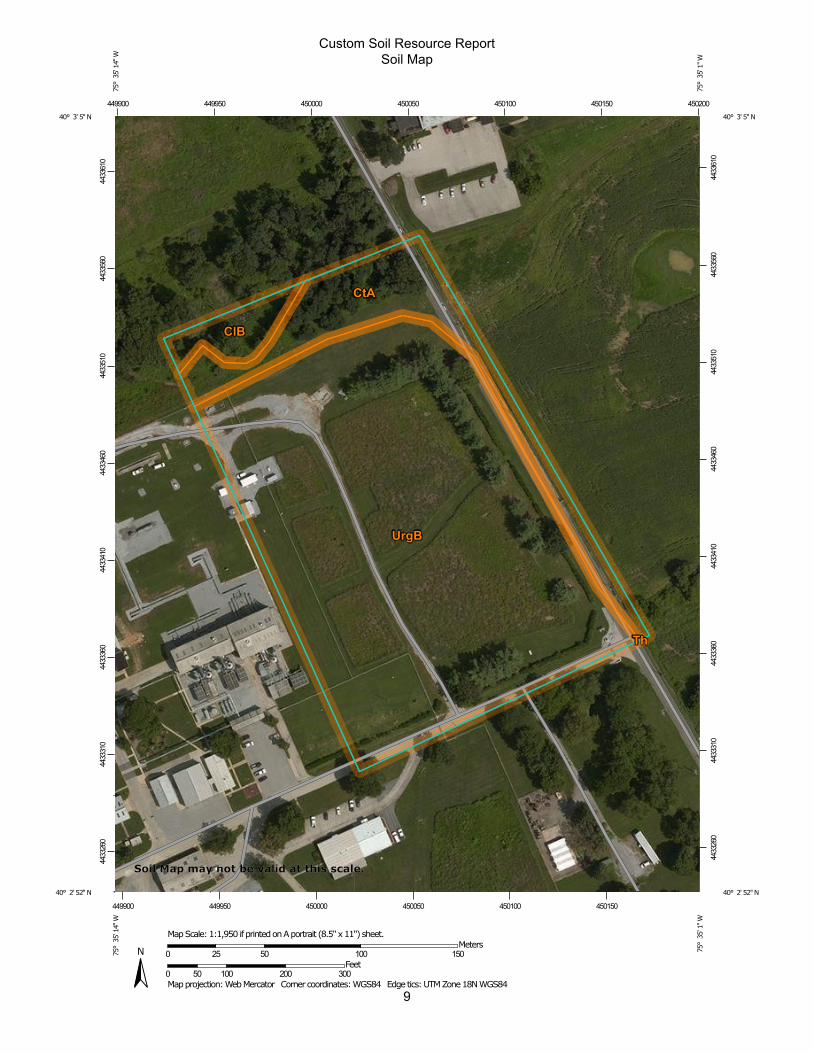
Soil MapThe soil map section includes the soil map for the defined area of interest, a list of soil map units on the map and extent of each map unit, and cartographic symbols displayed on the map. Also presented are various metadata about data used to produce the map, and a description of each soil map unit.
8
9
Custom Soil Resource ReportSoil Map
4433
260
4433
310
4433
360
4433
410
4433
460
4433
510
4433
560
4433
610
4433
260
4433
310
4433
360
4433
410
4433
460
4433
510
4433
560
4433
610
449900 449950 450000 450050 450100 450150 450200
449900 449950 450000 450050 450100 450150
40° 3' 5'' N75
° 3
5' 1
4'' W
40° 3' 5'' N
75° 3
5' 1
'' W
40° 2' 52'' N
75° 3
5' 1
4'' W
40° 2' 52'' N
75° 3
5' 1
'' W
N
Map projection: Web Mercator Corner coordinates: WGS84 Edge tics: UTM Zone 18N WGS840 50 100 200 300
Feet0 25 50 100 150
MetersMap Scale: 1:1,950 if printed on A portrait (8.5" x 11") sheet.
Soil Map may not be valid at this scale.
MAP LEGEND MAP INFORMATION
Area of Interest (AOI)Area of Interest (AOI)
SoilsSoil Map Unit Polygons
Soil Map Unit Lines
Soil Map Unit Points
Special Point FeaturesBlowout
Borrow Pit
Clay Spot
Closed Depression
Gravel Pit
Gravelly Spot
Landfill
Lava Flow
Marsh or swamp
Mine or Quarry
Miscellaneous Water
Perennial Water
Rock Outcrop
Saline Spot
Sandy Spot
Severely Eroded Spot
Sinkhole
Slide or Slip
Sodic Spot
Spoil Area
Stony Spot
Very Stony Spot
Wet Spot
Other
Special Line Features
Water FeaturesStreams and Canals
TransportationRails
Interstate Highways
US Routes
Major Roads
Local Roads
BackgroundAerial Photography
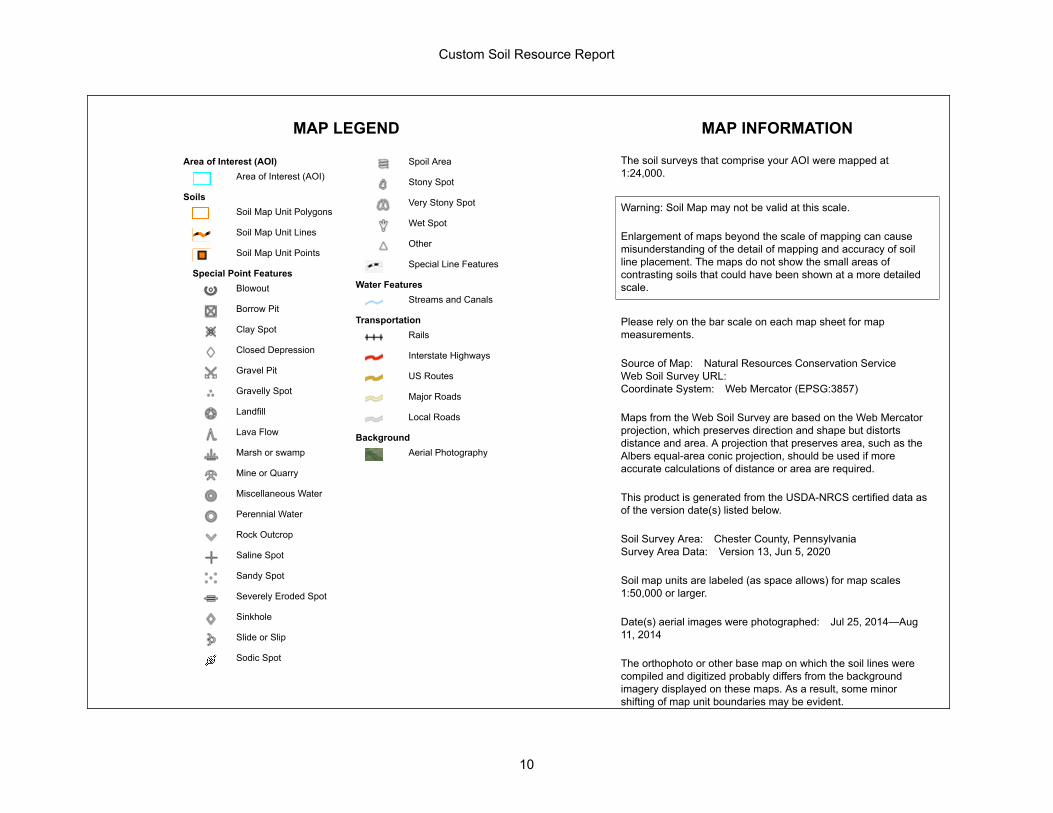
The soil surveys that comprise your AOI were mapped at 1:24,000.
Warning: Soil Map may not be valid at this scale.
Enlargement of maps beyond the scale of mapping can cause misunderstanding of the detail of mapping and accuracy of soil line placement. The maps do not show the small areas of contrasting soils that could have been shown at a more detailed scale.
Please rely on the bar scale on each map sheet for map measurements.
Source of Map: Natural Resources Conservation ServiceWeb Soil Survey URL: Coordinate System: Web Mercator (EPSG:3857)
Maps from the Web Soil Survey are based on the Web Mercator projection, which preserves direction and shape but distorts distance and area. A projection that preserves area, such as the Albers equal-area conic projection, should be used if more accurate calculations of distance or area are required.
This product is generated from the USDA-NRCS certified data as of the version date(s) listed below.
Soil Survey Area: Chester County, PennsylvaniaSurvey Area Data: Version 13, Jun 5, 2020
Soil map units are labeled (as space allows) for map scales 1:50,000 or larger.
Date(s) aerial images were photographed: Jul 25, 2014—Aug 11, 2014
The orthophoto or other base map on which the soil lines were compiled and digitized probably differs from the background imagery displayed on these maps. As a result, some minor shifting of map unit boundaries may be evident.
Custom Soil Resource Report
10
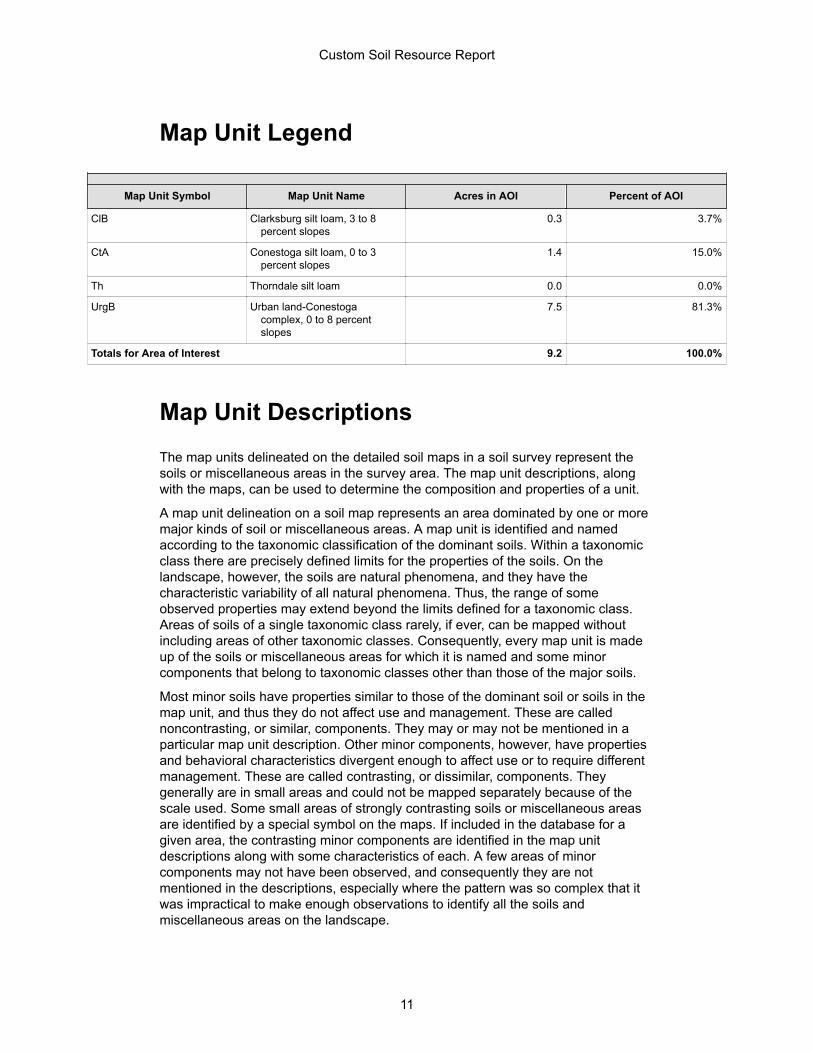
Map Unit Legend
Map Unit Symbol Map Unit Name Acres in AOI Percent of AOI
ClB Clarksburg silt loam, 3 to 8 percent slopes
0.3 3.7%
CtA Conestoga silt loam, 0 to 3 percent slopes
1.4 15.0%
Th Thorndale silt loam 0.0 0.0%
UrgB Urban land-Conestoga complex, 0 to 8 percent slopes
7.5 81.3%
Totals for Area of Interest 9.2 100.0%
Map Unit DescriptionsThe map units delineated on the detailed soil maps in a soil survey represent the soils or miscellaneous areas in the survey area. The map unit descriptions, along with the maps, can be used to determine the composition and properties of a unit.
A map unit delineation on a soil map represents an area dominated by one or more major kinds of soil or miscellaneous areas. A map unit is identified and named according to the taxonomic classification of the dominant soils. Within a taxonomic class there are precisely defined limits for the properties of the soils. On the landscape, however, the soils are natural phenomena, and they have the characteristic variability of all natural phenomena. Thus, the range of some observed properties may extend beyond the limits defined for a taxonomic class. Areas of soils of a single taxonomic class rarely, if ever, can be mapped without including areas of other taxonomic classes. Consequently, every map unit is made up of the soils or miscellaneous areas for which it is named and some minor components that belong to taxonomic classes other than those of the major soils.
Most minor soils have properties similar to those of the dominant soil or soils in the map unit, and thus they do not affect use and management. These are called noncontrasting, or similar, components. They may or may not be mentioned in a particular map unit description. Other minor components, however, have properties and behavioral characteristics divergent enough to affect use or to require different management. These are called contrasting, or dissimilar, components. They generally are in small areas and could not be mapped separately because of the scale used. Some small areas of strongly contrasting soils or miscellaneous areas are identified by a special symbol on the maps. If included in the database for a given area, the contrasting minor components are identified in the map unit descriptions along with some characteristics of each. A few areas of minor components may not have been observed, and consequently they are not mentioned in the descriptions, especially where the pattern was so complex that it was impractical to make enough observations to identify all the soils and miscellaneous areas on the landscape.
Custom Soil Resource Report
11

The presence of minor components in a map unit in no way diminishes the usefulness or accuracy of the data. The objective of mapping is not to delineate pure taxonomic classes but rather to separate the landscape into landforms or landform segments that have similar use and management requirements. The delineation of such segments on the map provides sufficient information for the development of resource plans. If intensive use of small areas is planned, however, onsite investigation is needed to define and locate the soils and miscellaneous areas.
An identifying symbol precedes the map unit name in the map unit descriptions. Each description includes general facts about the unit and gives important soil properties and qualities.
Soils that have profiles that are almost alike make up a soil series. Except for differences in texture of the surface layer, all the soils of a series have major horizons that are similar in composition, thickness, and arrangement.
Soils of one series can differ in texture of the surface layer, slope, stoniness, salinity, degree of erosion, and other characteristics that affect their use. On the basis of such differences, a soil series is divided into soil phases. Most of the areas shown on the detailed soil maps are phases of soil series. The name of a soil phase commonly indicates a feature that affects use or management. For example, Alpha silt loam, 0 to 2 percent slopes, is a phase of the Alpha series.
Some map units are made up of two or more major soils or miscellaneous areas. These map units are complexes, associations, or undifferentiated groups.
A complex consists of two or more soils or miscellaneous areas in such an intricate pattern or in such small areas that they cannot be shown separately on the maps. The pattern and proportion of the soils or miscellaneous areas are somewhat similar in all areas. Alpha-Beta complex, 0 to 6 percent slopes, is an example.
An association is made up of two or more geographically associated soils or miscellaneous areas that are shown as one unit on the maps. Because of present or anticipated uses of the map units in the survey area, it was not considered practical or necessary to map the soils or miscellaneous areas separately. The pattern and relative proportion of the soils or miscellaneous areas are somewhat similar. Alpha-Beta association, 0 to 2 percent slopes, is an example.
An undifferentiated group is made up of two or more soils or miscellaneous areas that could be mapped individually but are mapped as one unit because similar interpretations can be made for use and management. The pattern and proportion of the soils or miscellaneous areas in a mapped area are not uniform. An area can be made up of only one of the major soils or miscellaneous areas, or it can be made up of all of them. Alpha and Beta soils, 0 to 2 percent slopes, is an example.
Some surveys include miscellaneous areas. Such areas have little or no soil material and support little or no vegetation. Rock outcrop is an example.
Custom Soil Resource Report
12
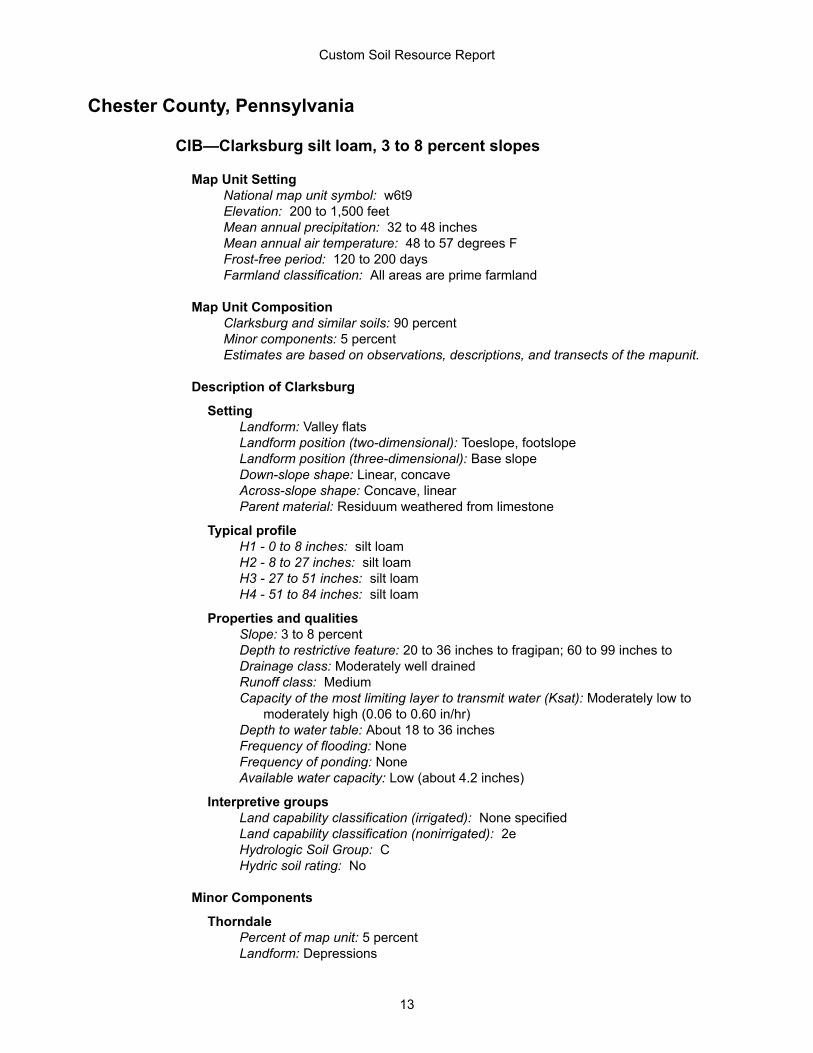
Chester County, Pennsylvania
ClB—Clarksburg silt loam, 3 to 8 percent slopes
Map Unit SettingNational map unit symbol: w6t9Elevation: 200 to 1,500 feetMean annual precipitation: 32 to 48 inchesMean annual air temperature: 48 to 57 degrees FFrost-free period: 120 to 200 daysFarmland classification: All areas are prime farmland
Map Unit CompositionClarksburg and similar soils: 90 percentMinor components: 5 percentEstimates are based on observations, descriptions, and transects of the mapunit.
Description of Clarksburg
SettingLandform: Valley flatsLandform position (two-dimensional): Toeslope, footslopeLandform position (three-dimensional): Base slopeDown-slope shape: Linear, concaveAcross-slope shape: Concave, linearParent material: Residuum weathered from limestone
Typical profileH1 - 0 to 8 inches: silt loamH2 - 8 to 27 inches: silt loamH3 - 27 to 51 inches: silt loamH4 - 51 to 84 inches: silt loam
Properties and qualitiesSlope: 3 to 8 percentDepth to restrictive feature: 20 to 36 inches to fragipan; 60 to 99 inches to Drainage class: Moderately well drainedRunoff class: MediumCapacity of the most limiting layer to transmit water (Ksat): Moderately low to
moderately high (0.06 to 0.60 in/hr)Depth to water table: About 18 to 36 inchesFrequency of flooding: NoneFrequency of ponding: NoneAvailable water capacity: Low (about 4.2 inches)
Interpretive groupsLand capability classification (irrigated): None specifiedLand capability classification (nonirrigated): 2eHydrologic Soil Group: CHydric soil rating: No
Minor Components
ThorndalePercent of map unit: 5 percentLandform: Depressions
Custom Soil Resource Report
13
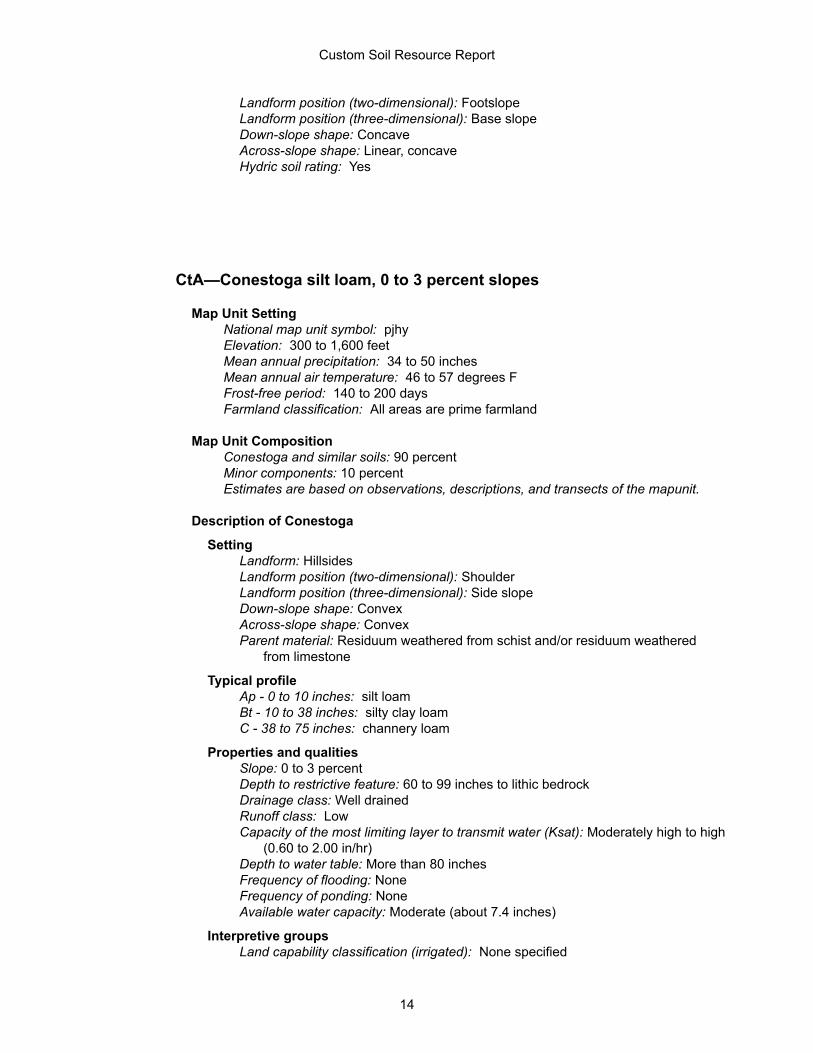
Landform position (two-dimensional): FootslopeLandform position (three-dimensional): Base slopeDown-slope shape: ConcaveAcross-slope shape: Linear, concaveHydric soil rating: Yes
CtA—Conestoga silt loam, 0 to 3 percent slopes
Map Unit SettingNational map unit symbol: pjhyElevation: 300 to 1,600 feetMean annual precipitation: 34 to 50 inchesMean annual air temperature: 46 to 57 degrees FFrost-free period: 140 to 200 daysFarmland classification: All areas are prime farmland
Map Unit CompositionConestoga and similar soils: 90 percentMinor components: 10 percentEstimates are based on observations, descriptions, and transects of the mapunit.
Description of Conestoga
SettingLandform: HillsidesLandform position (two-dimensional): ShoulderLandform position (three-dimensional): Side slopeDown-slope shape: ConvexAcross-slope shape: ConvexParent material: Residuum weathered from schist and/or residuum weathered
from limestone
Typical profileAp - 0 to 10 inches: silt loamBt - 10 to 38 inches: silty clay loamC - 38 to 75 inches: channery loam
Properties and qualitiesSlope: 0 to 3 percentDepth to restrictive feature: 60 to 99 inches to lithic bedrockDrainage class: Well drainedRunoff class: LowCapacity of the most limiting layer to transmit water (Ksat): Moderately high to high
(0.60 to 2.00 in/hr)Depth to water table: More than 80 inchesFrequency of flooding: NoneFrequency of ponding: NoneAvailable water capacity: Moderate (about 7.4 inches)
Interpretive groupsLand capability classification (irrigated): None specified
Custom Soil Resource Report
14
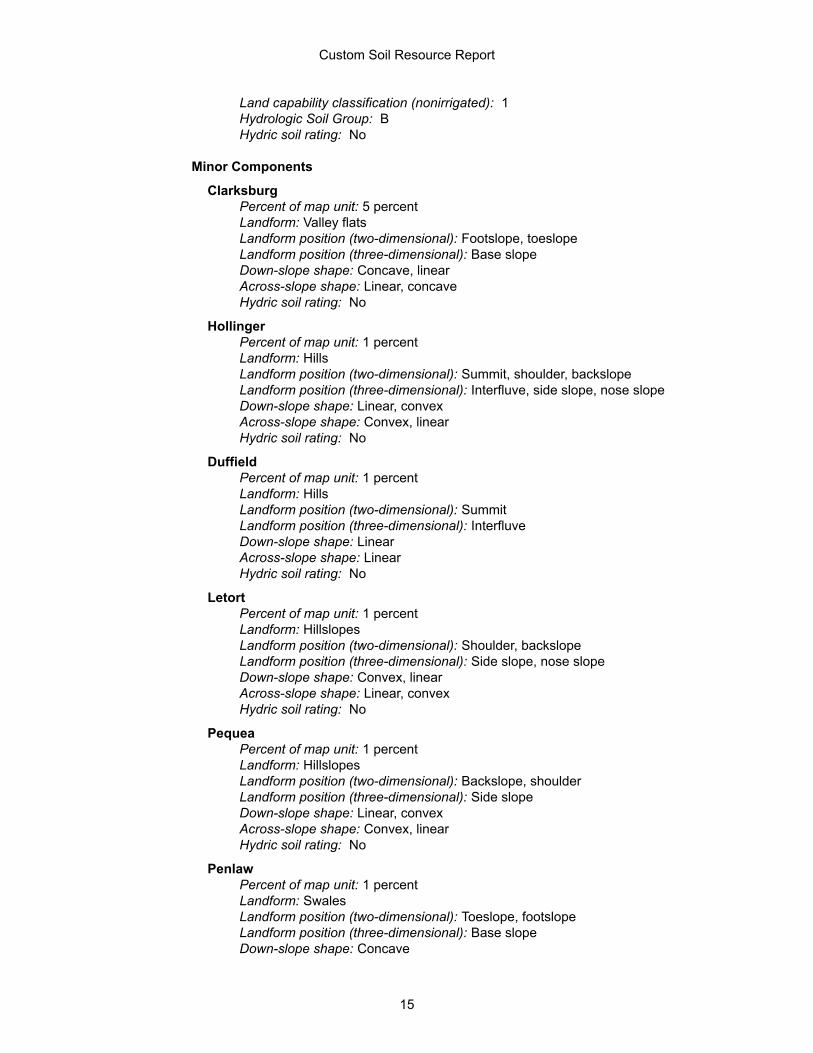
Land capability classification (nonirrigated): 1Hydrologic Soil Group: BHydric soil rating: No
Minor Components
ClarksburgPercent of map unit: 5 percentLandform: Valley flatsLandform position (two-dimensional): Footslope, toeslopeLandform position (three-dimensional): Base slopeDown-slope shape: Concave, linearAcross-slope shape: Linear, concaveHydric soil rating: No
HollingerPercent of map unit: 1 percentLandform: HillsLandform position (two-dimensional): Summit, shoulder, backslopeLandform position (three-dimensional): Interfluve, side slope, nose slopeDown-slope shape: Linear, convexAcross-slope shape: Convex, linearHydric soil rating: No
DuffieldPercent of map unit: 1 percentLandform: HillsLandform position (two-dimensional): SummitLandform position (three-dimensional): InterfluveDown-slope shape: LinearAcross-slope shape: LinearHydric soil rating: No
LetortPercent of map unit: 1 percentLandform: HillslopesLandform position (two-dimensional): Shoulder, backslopeLandform position (three-dimensional): Side slope, nose slopeDown-slope shape: Convex, linearAcross-slope shape: Linear, convexHydric soil rating: No
PequeaPercent of map unit: 1 percentLandform: HillslopesLandform position (two-dimensional): Backslope, shoulderLandform position (three-dimensional): Side slopeDown-slope shape: Linear, convexAcross-slope shape: Convex, linearHydric soil rating: No
PenlawPercent of map unit: 1 percentLandform: SwalesLandform position (two-dimensional): Toeslope, footslopeLandform position (three-dimensional): Base slopeDown-slope shape: Concave
Custom Soil Resource Report
15
Across-slope shape: ConcaveHydric soil rating: No
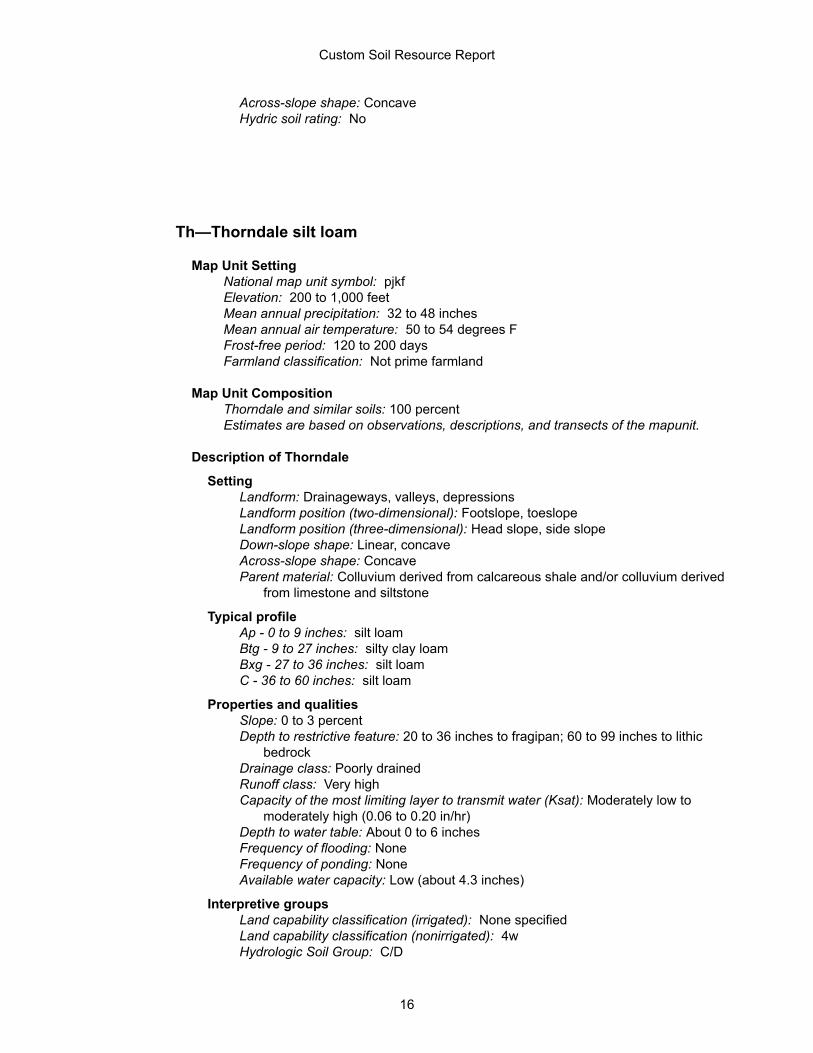
Th—Thorndale silt loam
Map Unit SettingNational map unit symbol: pjkfElevation: 200 to 1,000 feetMean annual precipitation: 32 to 48 inchesMean annual air temperature: 50 to 54 degrees FFrost-free period: 120 to 200 daysFarmland classification: Not prime farmland
Map Unit CompositionThorndale and similar soils: 100 percentEstimates are based on observations, descriptions, and transects of the mapunit.
Description of Thorndale
SettingLandform: Drainageways, valleys, depressionsLandform position (two-dimensional): Footslope, toeslopeLandform position (three-dimensional): Head slope, side slopeDown-slope shape: Linear, concaveAcross-slope shape: ConcaveParent material: Colluvium derived from calcareous shale and/or colluvium derived
from limestone and siltstone
Typical profileAp - 0 to 9 inches: silt loamBtg - 9 to 27 inches: silty clay loamBxg - 27 to 36 inches: silt loamC - 36 to 60 inches: silt loam
Properties and qualitiesSlope: 0 to 3 percentDepth to restrictive feature: 20 to 36 inches to fragipan; 60 to 99 inches to lithic
bedrockDrainage class: Poorly drainedRunoff class: Very highCapacity of the most limiting layer to transmit water (Ksat): Moderately low to
moderately high (0.06 to 0.20 in/hr)Depth to water table: About 0 to 6 inchesFrequency of flooding: NoneFrequency of ponding: NoneAvailable water capacity: Low (about 4.3 inches)
Interpretive groupsLand capability classification (irrigated): None specifiedLand capability classification (nonirrigated): 4wHydrologic Soil Group: C/D
Custom Soil Resource Report
16
Hydric soil rating: Yes
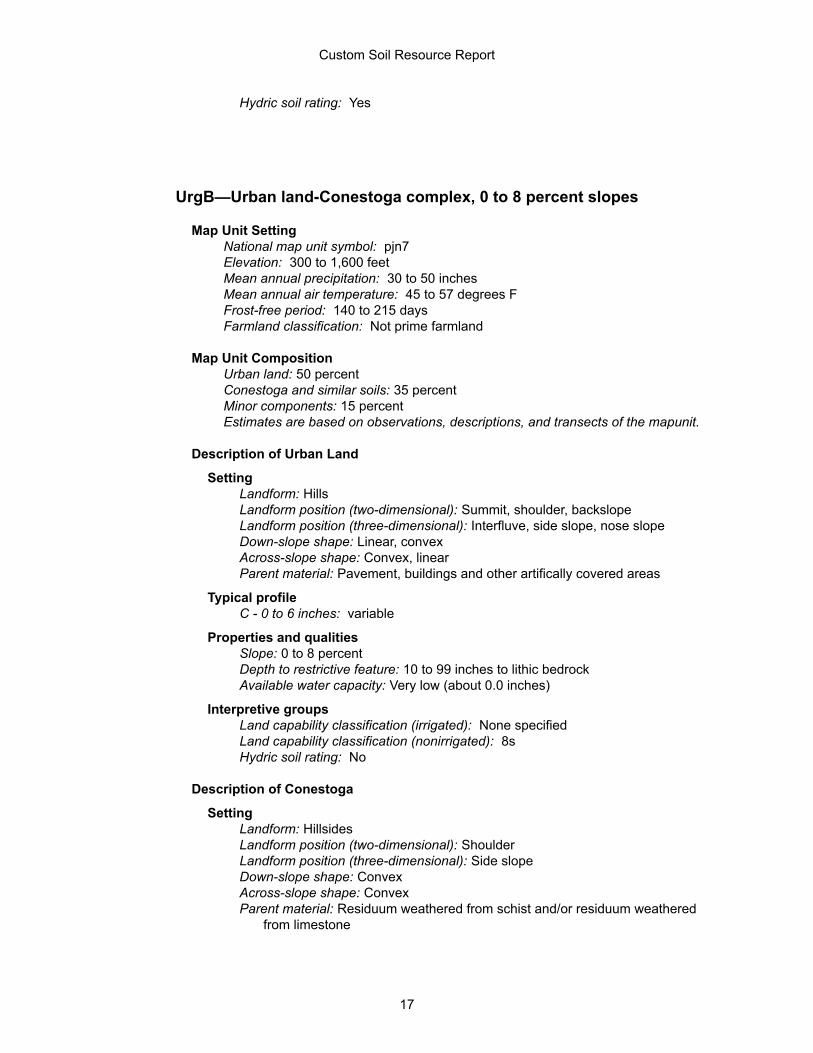
UrgB—Urban land-Conestoga complex, 0 to 8 percent slopes
Map Unit SettingNational map unit symbol: pjn7Elevation: 300 to 1,600 feetMean annual precipitation: 30 to 50 inchesMean annual air temperature: 45 to 57 degrees FFrost-free period: 140 to 215 daysFarmland classification: Not prime farmland
Map Unit CompositionUrban land: 50 percentConestoga and similar soils: 35 percentMinor components: 15 percentEstimates are based on observations, descriptions, and transects of the mapunit.
Description of Urban Land
SettingLandform: HillsLandform position (two-dimensional): Summit, shoulder, backslopeLandform position (three-dimensional): Interfluve, side slope, nose slopeDown-slope shape: Linear, convexAcross-slope shape: Convex, linearParent material: Pavement, buildings and other artifically covered areas
Typical profileC - 0 to 6 inches: variable
Properties and qualitiesSlope: 0 to 8 percentDepth to restrictive feature: 10 to 99 inches to lithic bedrockAvailable water capacity: Very low (about 0.0 inches)
Interpretive groupsLand capability classification (irrigated): None specifiedLand capability classification (nonirrigated): 8sHydric soil rating: No
Description of Conestoga
SettingLandform: HillsidesLandform position (two-dimensional): ShoulderLandform position (three-dimensional): Side slopeDown-slope shape: ConvexAcross-slope shape: ConvexParent material: Residuum weathered from schist and/or residuum weathered
from limestone
Custom Soil Resource Report
17
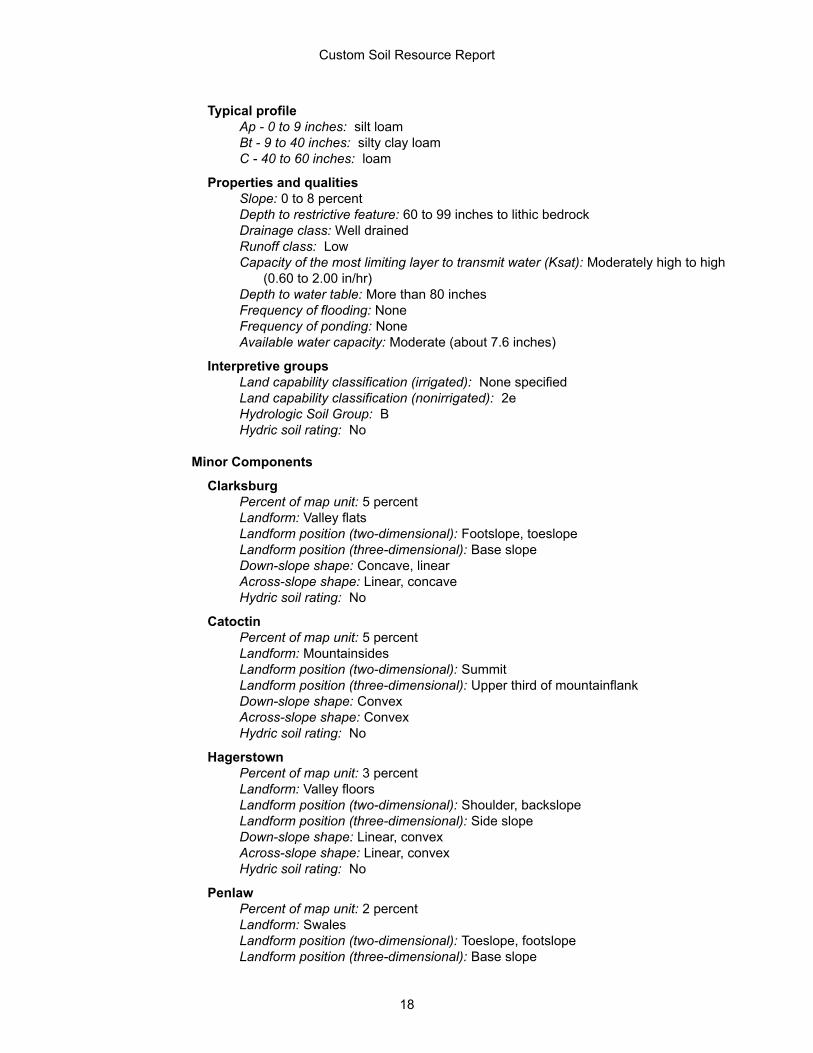
Typical profileAp - 0 to 9 inches: silt loamBt - 9 to 40 inches: silty clay loamC - 40 to 60 inches: loam
Properties and qualitiesSlope: 0 to 8 percentDepth to restrictive feature: 60 to 99 inches to lithic bedrockDrainage class: Well drainedRunoff class: LowCapacity of the most limiting layer to transmit water (Ksat): Moderately high to high
(0.60 to 2.00 in/hr)Depth to water table: More than 80 inchesFrequency of flooding: NoneFrequency of ponding: NoneAvailable water capacity: Moderate (about 7.6 inches)
Interpretive groupsLand capability classification (irrigated): None specifiedLand capability classification (nonirrigated): 2eHydrologic Soil Group: BHydric soil rating: No
Minor Components
ClarksburgPercent of map unit: 5 percentLandform: Valley flatsLandform position (two-dimensional): Footslope, toeslopeLandform position (three-dimensional): Base slopeDown-slope shape: Concave, linearAcross-slope shape: Linear, concaveHydric soil rating: No
CatoctinPercent of map unit: 5 percentLandform: MountainsidesLandform position (two-dimensional): SummitLandform position (three-dimensional): Upper third of mountainflankDown-slope shape: ConvexAcross-slope shape: ConvexHydric soil rating: No
HagerstownPercent of map unit: 3 percentLandform: Valley floorsLandform position (two-dimensional): Shoulder, backslopeLandform position (three-dimensional): Side slopeDown-slope shape: Linear, convexAcross-slope shape: Linear, convexHydric soil rating: No
PenlawPercent of map unit: 2 percentLandform: SwalesLandform position (two-dimensional): Toeslope, footslopeLandform position (three-dimensional): Base slope
Custom Soil Resource Report
18

Down-slope shape: ConcaveAcross-slope shape: ConcaveHydric soil rating: No
Custom Soil Resource Report
19
ReferencesAmerican Association of State Highway and Transportation Officials (AASHTO). 2004. Standard specifications for transportation materials and methods of sampling and testing. 24th edition.
American Society for Testing and Materials (ASTM). 2005. Standard classification of soils for engineering purposes. ASTM Standard D2487-00.
Cowardin, L.M., V. Carter, F.C. Golet, and E.T. LaRoe. 1979. Classification of wetlands and deep-water habitats of the United States. U.S. Fish and Wildlife Service FWS/OBS-79/31.
Federal Register. July 13, 1994. Changes in hydric soils of the United States.
Federal Register. September 18, 2002. Hydric soils of the United States.
Hurt, G.W., and L.M. Vasilas, editors. Version 6.0, 2006. Field indicators of hydric soils in the United States.
National Research Council. 1995. Wetlands: Characteristics and boundaries.
Soil Survey Division Staff. 1993. Soil survey manual. Soil Conservation Service. U.S. Department of Agriculture Handbook 18. http://www.nrcs.usda.gov/wps/portal/nrcs/detail/national/soils/?cid=nrcs142p2_054262
Soil Survey Staff. 1999. Soil taxonomy: A basic system of soil classification for making and interpreting soil surveys. 2nd edition. Natural Resources Conservation Service, U.S. Department of Agriculture Handbook 436. http://www.nrcs.usda.gov/wps/portal/nrcs/detail/national/soils/?cid=nrcs142p2_053577
Soil Survey Staff. 2010. Keys to soil taxonomy. 11th edition. U.S. Department of Agriculture, Natural Resources Conservation Service. http://www.nrcs.usda.gov/wps/portal/nrcs/detail/national/soils/?cid=nrcs142p2_053580
Tiner, R.W., Jr. 1985. Wetlands of Delaware. U.S. Fish and Wildlife Service and Delaware Department of Natural Resources and Environmental Control, Wetlands Section.
United States Army Corps of Engineers, Environmental Laboratory. 1987. Corps of Engineers wetlands delineation manual. Waterways Experiment Station Technical Report Y-87-1.
United States Department of Agriculture, Natural Resources Conservation Service. National forestry manual. http://www.nrcs.usda.gov/wps/portal/nrcs/detail/soils/home/?cid=nrcs142p2_053374
United States Department of Agriculture, Natural Resources Conservation Service. National range and pasture handbook. http://www.nrcs.usda.gov/wps/portal/nrcs/detail/national/landuse/rangepasture/?cid=stelprdb1043084
20

United States Department of Agriculture, Natural Resources Conservation Service. National soil survey handbook, title 430-VI. http://www.nrcs.usda.gov/wps/portal/nrcs/detail/soils/scientists/?cid=nrcs142p2_054242
United States Department of Agriculture, Natural Resources Conservation Service. 2006. Land resource regions and major land resource areas of the United States, the Caribbean, and the Pacific Basin. U.S. Department of Agriculture Handbook 296. http://www.nrcs.usda.gov/wps/portal/nrcs/detail/national/soils/?cid=nrcs142p2_053624
United States Department of Agriculture, Soil Conservation Service. 1961. Land capability classification. U.S. Department of Agriculture Handbook 210. http://www.nrcs.usda.gov/Internet/FSE_DOCUMENTS/nrcs142p2_052290.pdf
Custom Soil Resource Report
21
ATTACHMENT 3 SITE EVALUATION AND SOIL INFILTRATION TEST REPORT
State College • Tunkhannock www.baigroupllc.com
341 10th Avenue Suite 103, Royersford PA 19468 • 610.495.5585 Civil, Environmental, & Geological Consultants
April 1, 2021
TRANSCONTINENTAL GAS PIPE LINE COMPANY, LLC. A SUBSIDIARY OF THE WILLIAMS COMPANIES, INC. REGIONAL ENERGY ACCESS EXPANSION PROJECT
COMPRESSOR STATION 200 PROJECT
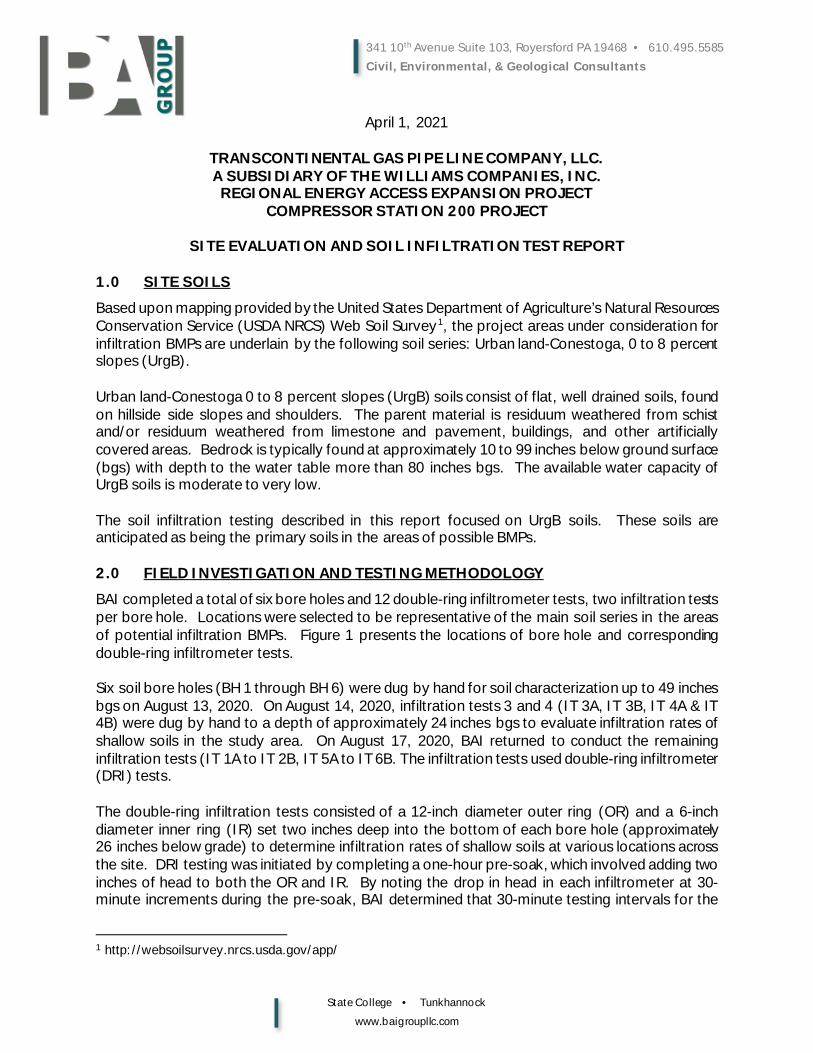
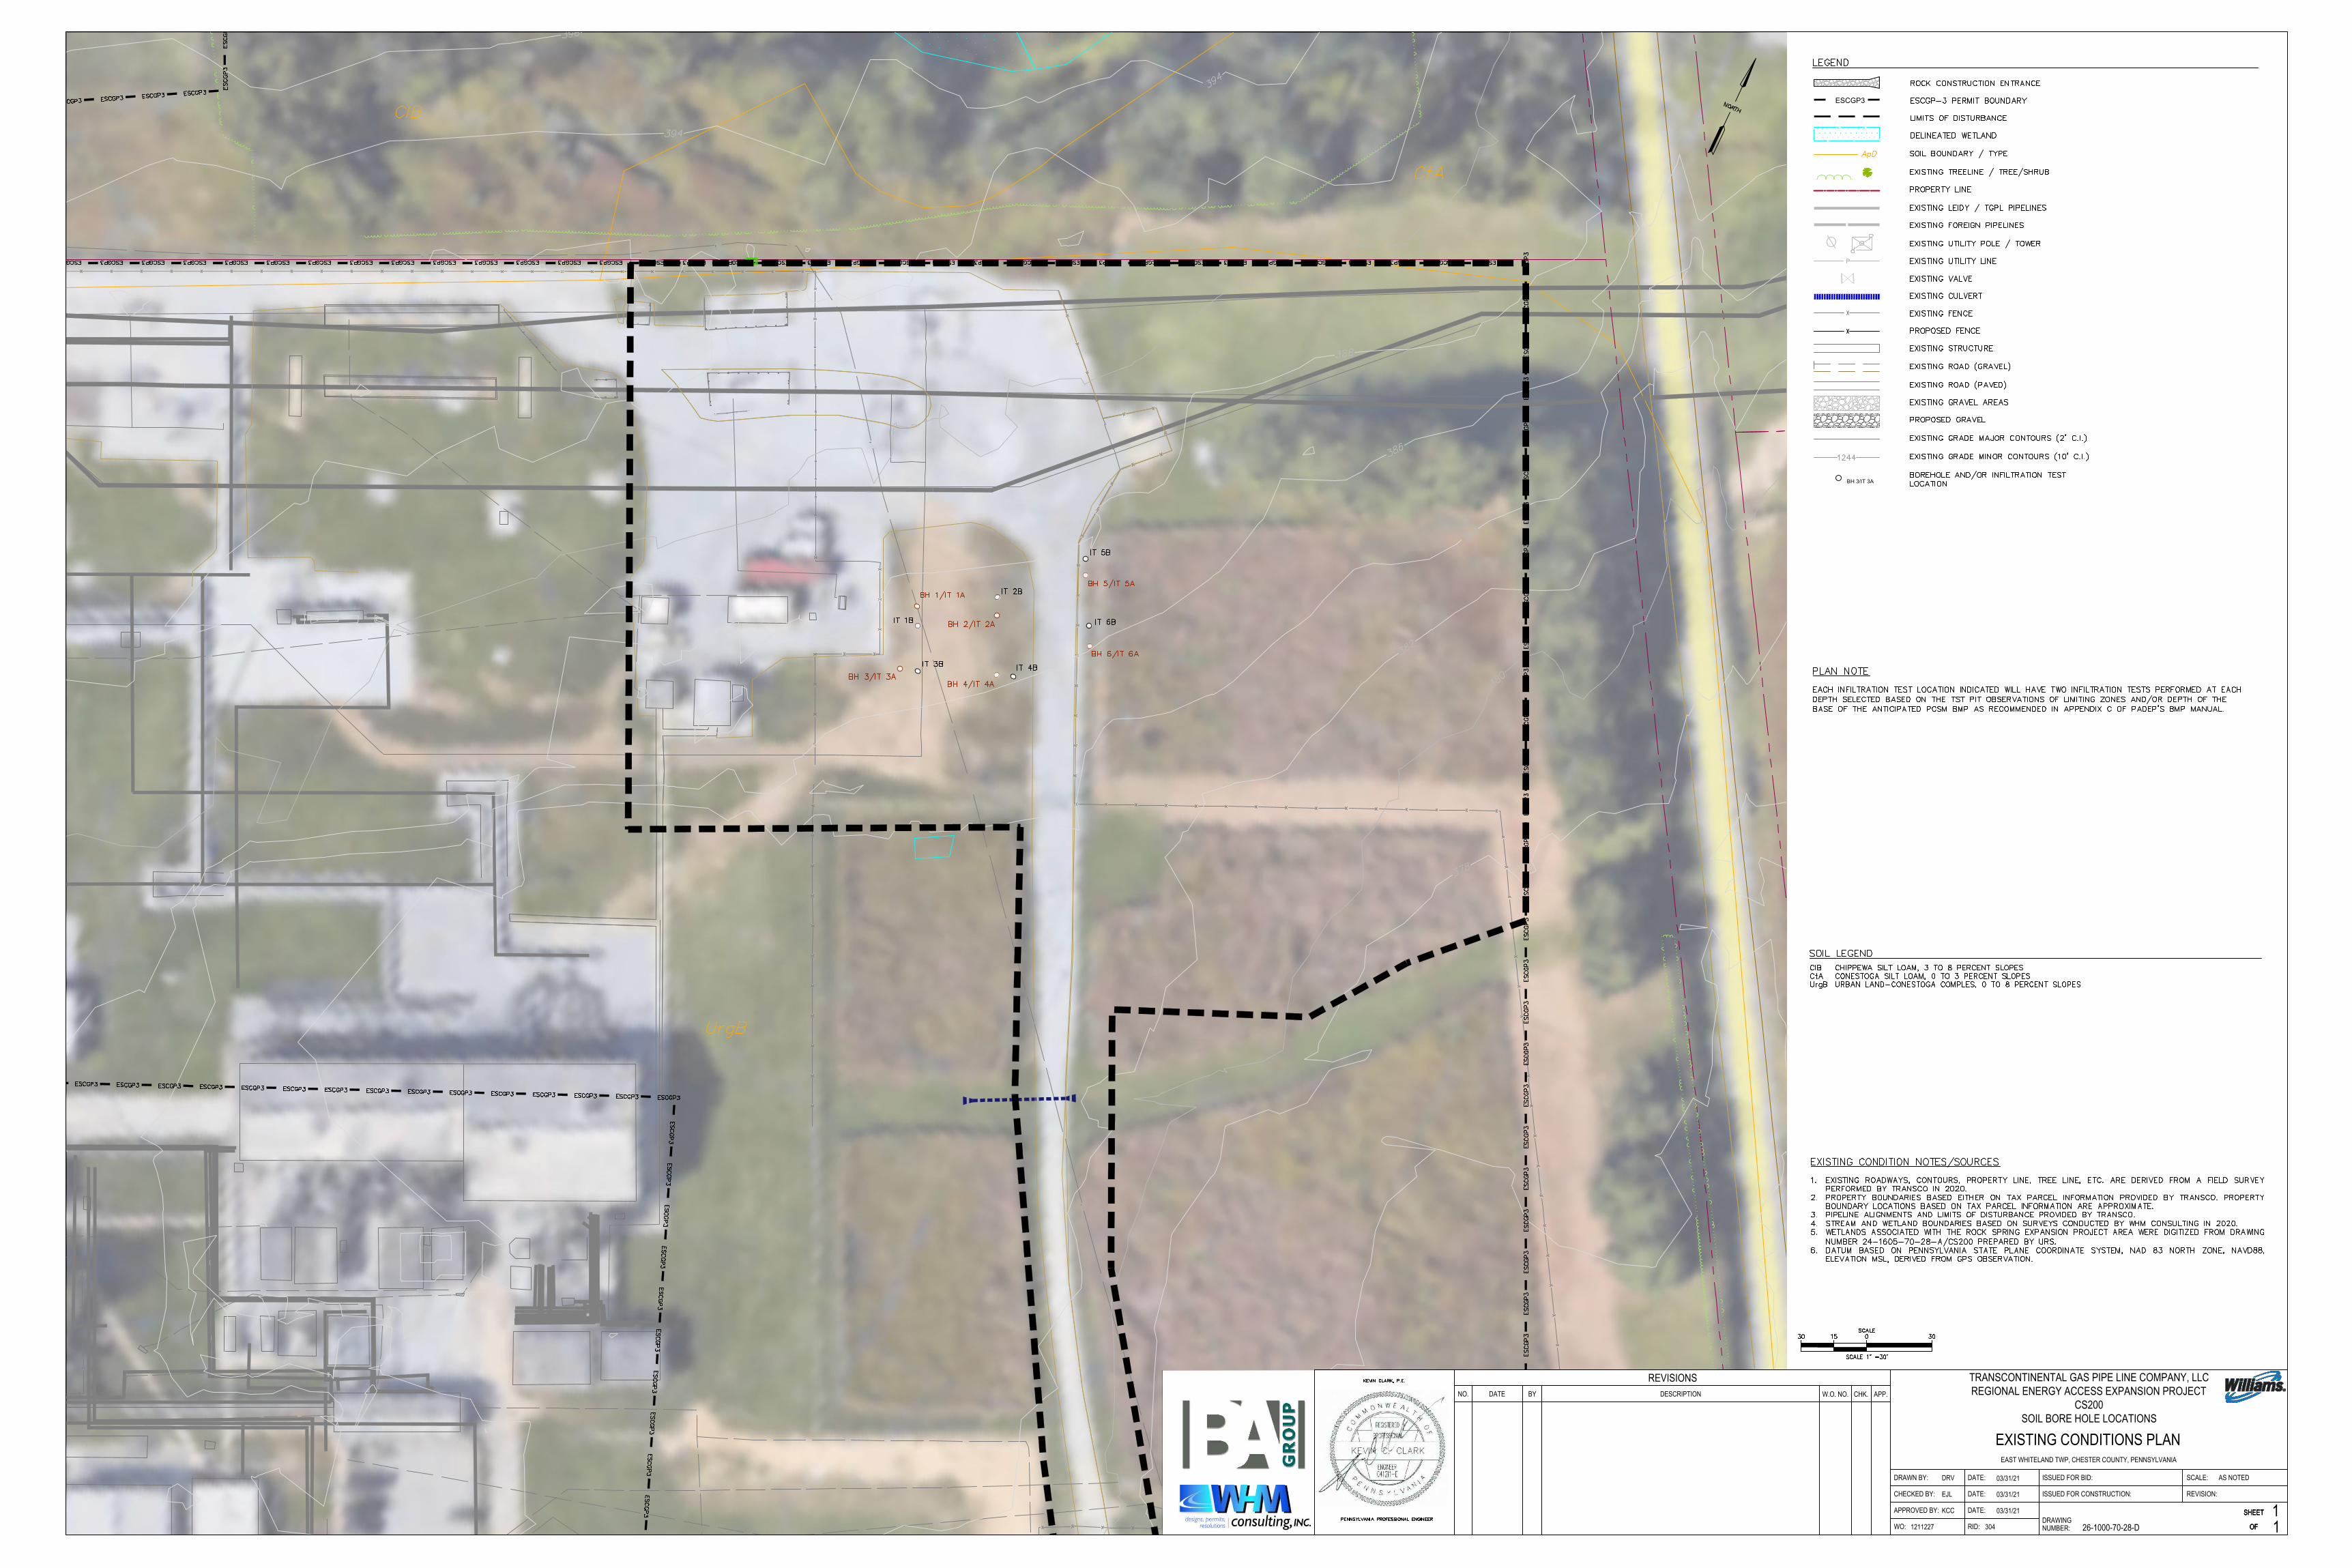
SITE EVALUATION AND SOIL INFILTRATION TEST REPORT 1.0 SITE SOILS Based upon mapping provided by the United States Department of Agriculture’s Natural Resources Conservation Service (USDA NRCS) Web Soil Survey1, the project areas under consideration for infiltration BMPs are underlain by the following soil series: Urban land-Conestoga, 0 to 8 percent slopes (UrgB). Urban land-Conestoga 0 to 8 percent slopes (UrgB) soils consist of flat, well drained soils, found on hillside side slopes and shoulders. The parent material is residuum weathered from schist and/or residuum weathered from limestone and pavement, buildings, and other artificially covered areas. Bedrock is typically found at approximately 10 to 99 inches below ground surface (bgs) with depth to the water table more than 80 inches bgs. The available water capacity of UrgB soils is moderate to very low. The soil infiltration testing described in this report focused on UrgB soils. These soils are anticipated as being the primary soils in the areas of possible BMPs. 2.0 FIELD INVESTIGATION AND TESTING METHODOLOGY BAI completed a total of six bore holes and 12 double-ring infiltrometer tests, two infiltration tests per bore hole. Locations were selected to be representative of the main soil series in the areas of potential infiltration BMPs. Figure 1 presents the locations of bore hole and corresponding double-ring infiltrometer tests. Six soil bore holes (BH 1 through BH 6) were dug by hand for soil characterization up to 49 inches bgs on August 13, 2020. On August 14, 2020, infiltration tests 3 and 4 (IT 3A, IT 3B, IT 4A & IT 4B) were dug by hand to a depth of approximately 24 inches bgs to evaluate infiltration rates of shallow soils in the study area. On August 17, 2020, BAI returned to conduct the remaining infiltration tests (IT 1A to IT 2B, IT 5A to IT 6B. The infiltration tests used double-ring infiltrometer (DRI) tests. The double-ring infiltration tests consisted of a 12-inch diameter outer ring (OR) and a 6-inch diameter inner ring (IR) set two inches deep into the bottom of each bore hole (approximately 26 inches below grade) to determine infiltration rates of shallow soils at various locations across the site. DRI testing was initiated by completing a one-hour pre-soak, which involved adding two inches of head to both the OR and IR. By noting the drop in head in each infiltrometer at 30-minute increments during the pre-soak, BAI determined that 30-minute testing intervals for the
1 http://websoilsurvey.nrcs.usda.gov/app/
Site Evaluation and Soil Infiltration Test Report Compressor Station 200 Project April 1, 2021 Page 2 of 4
www.baigroupllc.com
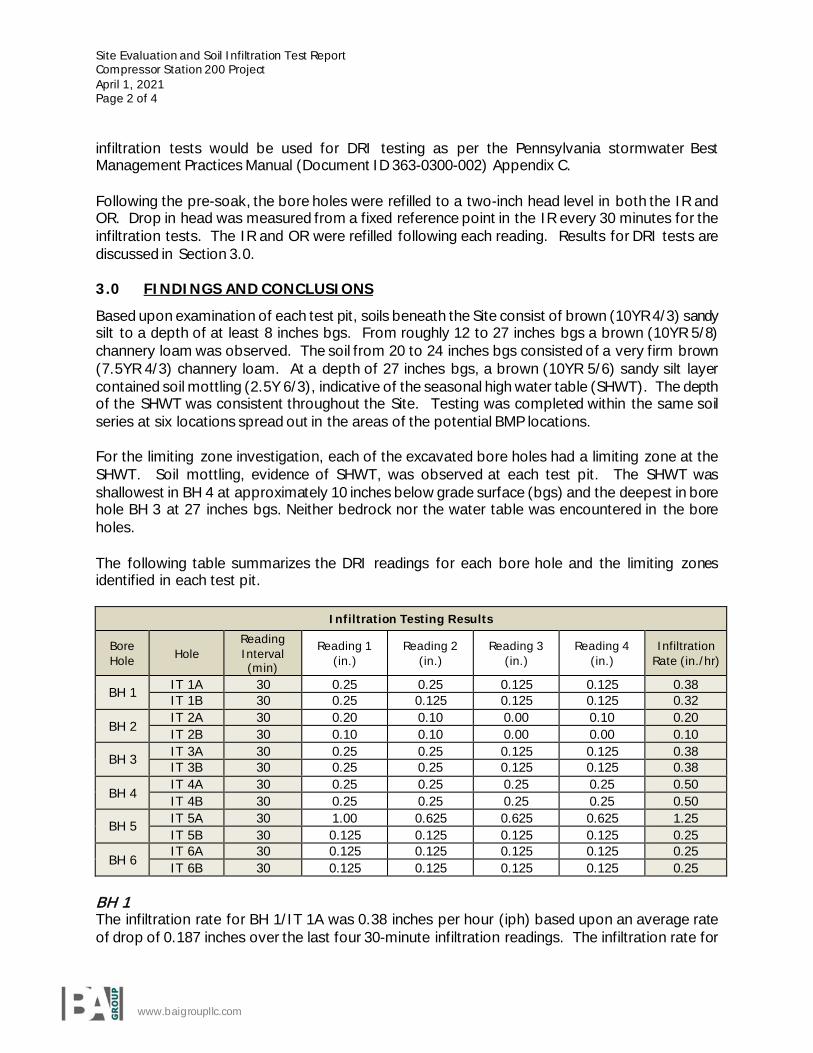
infiltration tests would be used for DRI testing as per the Pennsylvania stormwater Best Management Practices Manual (Document ID 363-0300-002) Appendix C. Following the pre-soak, the bore holes were refilled to a two-inch head level in both the IR and OR. Drop in head was measured from a fixed reference point in the IR every 30 minutes for the infiltration tests. The IR and OR were refilled following each reading. Results for DRI tests are discussed in Section 3.0. 3.0 FINDINGS AND CONCLUSIONS Based upon examination of each test pit, soils beneath the Site consist of brown (10YR 4/3) sandy silt to a depth of at least 8 inches bgs. From roughly 12 to 27 inches bgs a brown (10YR 5/8) channery loam was observed. The soil from 20 to 24 inches bgs consisted of a very firm brown (7.5YR 4/3) channery loam. At a depth of 27 inches bgs, a brown (10YR 5/6) sandy silt layer contained soil mottling (2.5Y 6/3), indicative of the seasonal high water table (SHWT). The depth of the SHWT was consistent throughout the Site. Testing was completed within the same soil series at six locations spread out in the areas of the potential BMP locations. For the limiting zone investigation, each of the excavated bore holes had a limiting zone at the SHWT. Soil mottling, evidence of SHWT, was observed at each test pit. The SHWT was shallowest in BH 4 at approximately 10 inches below grade surface (bgs) and the deepest in bore hole BH 3 at 27 inches bgs. Neither bedrock nor the water table was encountered in the bore holes. The following table summarizes the DRI readings for each bore hole and the limiting zones identified in each test pit.
Infiltration Testing Results
Bore Hole Hole
Reading Interval (min)
Reading 1 (in.)
Reading 2 (in.)
Reading 3 (in.)
Reading 4 (in.)
Infiltration Rate (in./hr)
BH 1 IT 1A 30 0.25 0.25 0.125 0.125 0.38 IT 1B 30 0.25 0.125 0.125 0.125 0.32
BH 2 IT 2A 30 0.20 0.10 0.00 0.10 0.20 IT 2B 30 0.10 0.10 0.00 0.00 0.10
BH 3 IT 3A 30 0.25 0.25 0.125 0.125 0.38 IT 3B 30 0.25 0.25 0.125 0.125 0.38
BH 4 IT 4A 30 0.25 0.25 0.25 0.25 0.50 IT 4B 30 0.25 0.25 0.25 0.25 0.50
BH 5 IT 5A 30 1.00 0.625 0.625 0.625 1.25 IT 5B 30 0.125 0.125 0.125 0.125 0.25
BH 6 IT 6A 30 0.125 0.125 0.125 0.125 0.25 IT 6B 30 0.125 0.125 0.125 0.125 0.25
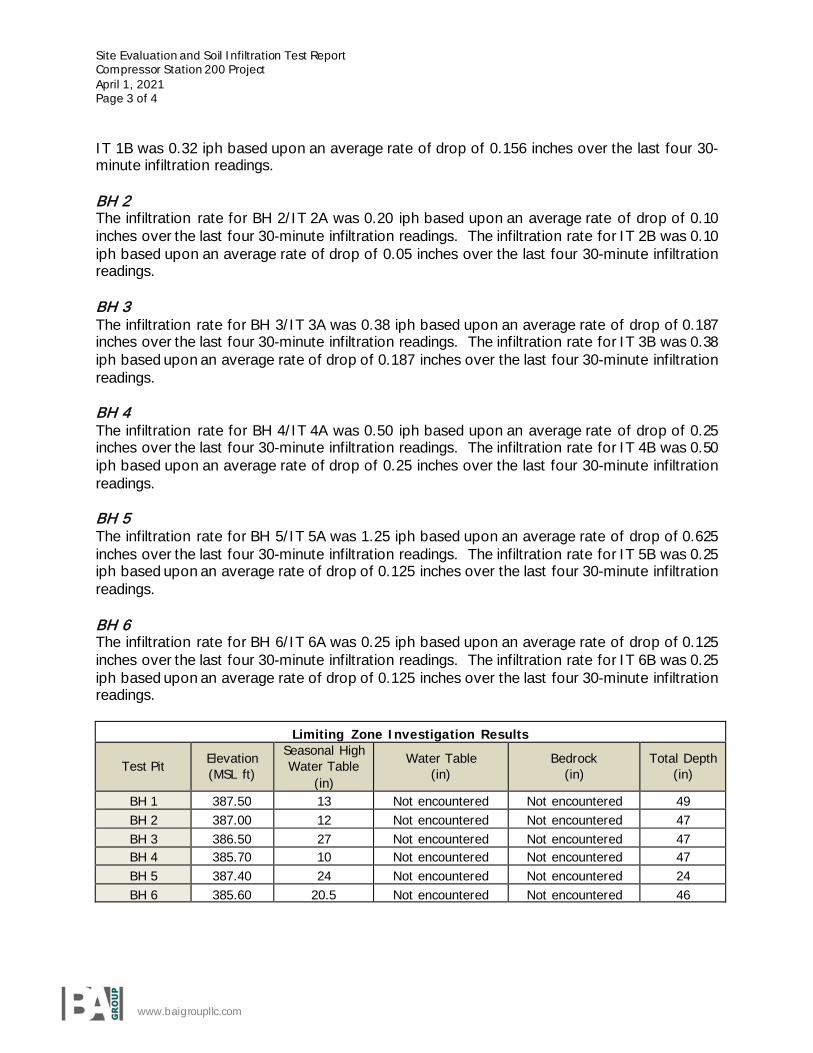
BH 1 The infiltration rate for BH 1/IT 1A was 0.38 inches per hour (iph) based upon an average rate of drop of 0.187 inches over the last four 30-minute infiltration readings. The infiltration rate for
Site Evaluation and Soil Infiltration Test Report Compressor Station 200 Project April 1, 2021 Page 3 of 4
www.baigroupllc.com
IT 1B was 0.32 iph based upon an average rate of drop of 0.156 inches over the last four 30-minute infiltration readings. BH 2 The infiltration rate for BH 2/IT 2A was 0.20 iph based upon an average rate of drop of 0.10 inches over the last four 30-minute infiltration readings. The infiltration rate for IT 2B was 0.10 iph based upon an average rate of drop of 0.05 inches over the last four 30-minute infiltration readings. BH 3 The infiltration rate for BH 3/IT 3A was 0.38 iph based upon an average rate of drop of 0.187 inches over the last four 30-minute infiltration readings. The infiltration rate for IT 3B was 0.38 iph based upon an average rate of drop of 0.187 inches over the last four 30-minute infiltration readings.
BH 4 The infiltration rate for BH 4/IT 4A was 0.50 iph based upon an average rate of drop of 0.25 inches over the last four 30-minute infiltration readings. The infiltration rate for IT 4B was 0.50 iph based upon an average rate of drop of 0.25 inches over the last four 30-minute infiltration readings. BH 5 The infiltration rate for BH 5/IT 5A was 1.25 iph based upon an average rate of drop of 0.625 inches over the last four 30-minute infiltration readings. The infiltration rate for IT 5B was 0.25 iph based upon an average rate of drop of 0.125 inches over the last four 30-minute infiltration readings.
BH 6 The infiltration rate for BH 6/IT 6A was 0.25 iph based upon an average rate of drop of 0.125 inches over the last four 30-minute infiltration readings. The infiltration rate for IT 6B was 0.25 iph based upon an average rate of drop of 0.125 inches over the last four 30-minute infiltration readings.
Limiting Zone Investigation Results
Test Pit Elevation (MSL ft)
Seasonal High Water Table
(in)
Water Table (in)
Bedrock (in)
Total Depth (in)
BH 1 387.50 13 Not encountered Not encountered 49 BH 2 387.00 12 Not encountered Not encountered 47 BH 3 386.50 27 Not encountered Not encountered 47 BH 4 385.70 10 Not encountered Not encountered 47 BH 5 387.40 24 Not encountered Not encountered 24 BH 6 385.60 20.5 Not encountered Not encountered 46

Site Evaluation and Soil Infiltration Test Report Compressor Station 200 Project April 1, 2021 Page 4 of 4
www.baigroupllc.com
4.0 REFERENCES Pennsylvania Department of Environmental Protection. “Pennsylvania Stormwater Best
Management Practices Manual” Document No. 363-0300-02, December 2006. "Web Soil Survey - Home." Web Soil Survey - Home. United States Department of Agriculture, 6
Dec. 2013. Web. 18 December 2020. <http://websoilsurvey.nrcs.usda.gov/app/>.
FO
FO
FO
FO
FO FO FO
FO
FO
FO
F
O
FO
F
O
FO
FO
FO
FO
FO
F
O
F
O
F
O
FO
FO
FO
FO
FO
F
O
UE
UE UE
UE
UE
UE
UE
UE
UE
UE
UE
U
E
U
E
UE
UE
UE
UE UE
UE
UE
UE
UE
UE
UE
UE
UE
UE
UE
UE
U
E
UE
UE
UE
UE
UE UE
UE
UE
UE
UE
U
E
UE
U
E
UE
UE
UE
UE
UE
UE
U
E
U
E
U
E
UE
UE
UE
UE
UE
U
E
OHE
OHE
OHE
OHE
OHE
OHE
O
H
E
OHE
OHE
OHE
OHE
O
H
E
W
W
W
W
W
W
W
W
W
W
W
W
W
G
G
G
G
G
G
G
G
G
G
G
G
G
G
G
S
A
N
SAN
SAN
SAN
SAN
SAN
SAN
SAN
SAN
SAN
SAN
SAN
SAN
S
T
S
T
ST
ST
ST
ST
ST
ST
ST
ST
ST
ST
ST
ST
ST
ST
S
T
1
EXISTING CONDITIONS PLAN
1SHEET
OF
03/31/21
1211227 26-1000-70-28-D
KCC
EJL
DRV 03/31/21
03/31/21 SHEET
OFDRAWINGNUMBER:
ISSUED FOR CONSTRUCTION:
ISSUED FOR BID:
SHEET
OF
SCALE:DRAWN BY:
CHECKED BY:
APPROVED BY:
DATE:
DATE:
DATE:
NO. DATE BY W.O. NO. CHK. APP.DESCRIPTION
REVISIONS
WO:
REVISION:
RID:
TRANSCONTINENTAL GAS PIPE LINE COMPANY, LLCREGIONAL ENERGY ACCESS EXPANSION PROJECT
CS200SOIL BORE HOLE LOCATIONS
EAST WHITELAND TWP, CHESTER COUNTY, PENNSYLVANIA
AS NOTED
BH 3/IT 3A
ESCGP3
304

ATTACHMENT 4 PCSM PLAN BMP DESIGN WORKSHEETS
AND CALCULATIONS

Regional Energy Access Expansion Project ESCGP-3 Permit Application Transcontinental Gas Pipe Line Company, LLC Section 3-3 PCSM Plan Narrative Attachments for Compressor Station 200
i
TABLE OF CONTENTS
Attachment 4 4.1 CN Table
4.2 Stormwater BMP Manual Appendix D Worksheet
4.3 BMP HydroCAD Report
ATTACHMENT 4.1 CN TABLE
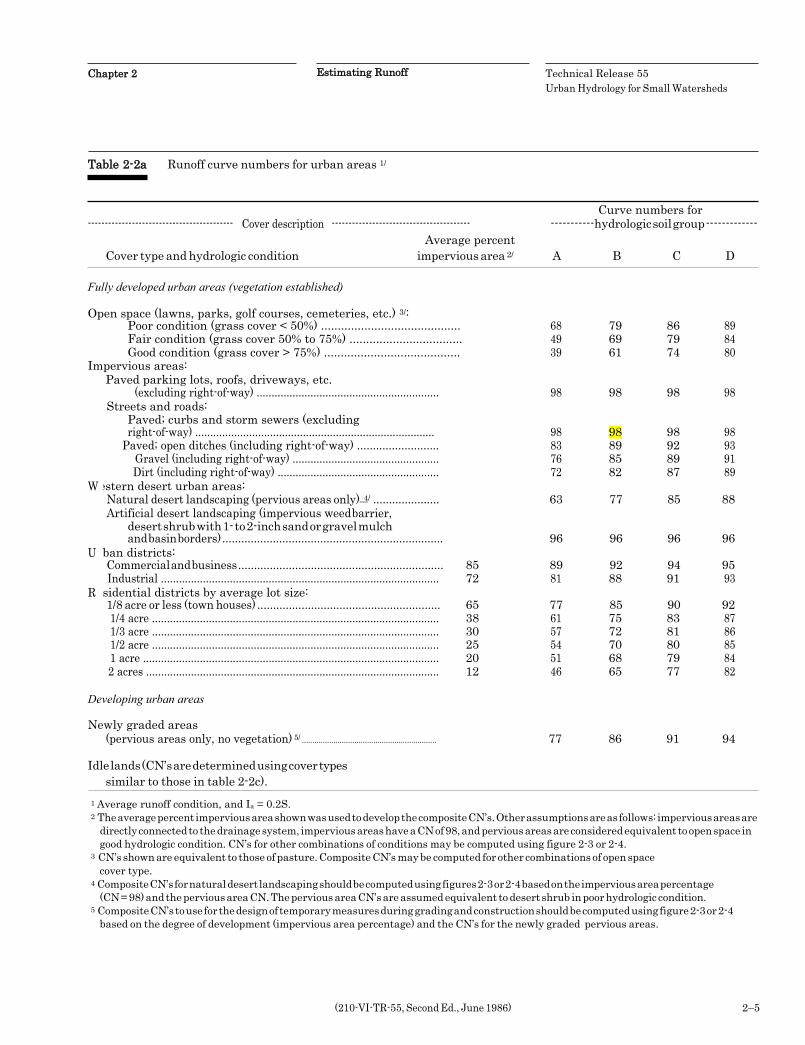
Estimating Runoff Chapter 2 Technical Release 55 Urban Hydrology for Small Watersheds
(210-VI-TR-55, Second Ed., June 1986) 2–5
Table 2-2a Runoff curve numbers for urban areas 1/
Curve numbers for
------------------------------------------- Cover description ----------------------------------------- -----------hydrologic soil group ------------- Average percent
Cover type and hydrologic condition impervious area 2/ A B C D
Fully developed urban areas (vegetation established)
Open space (lawns, parks, golf courses, cemeteries, etc.) 3/:
Impervious areas: Paved parking lots, roofs, driveways, etc.
W
U
R
Developing urban areas
Newly graded areas (pervious areas only, no vegetation) 5/ ................................................................ 77 86 91 94
Idle lands (CN’s are determined using cover types
similar to those in table 2-2c).
1 Average runoff condition, and Ia = 0.2S. 2 The average percent impervious area shown was used to develop the composite CN’s. Other assumptions are as follows: impervious areas are
directly connected to the drainage system, impervious areas have a CN of 98, and pervious areas are considered equivalent to open space in good hydrologic condition. CN’s for other combinations of conditions may be computed using figure 2-3 or 2-4.
3 CN’s shown are equivalent to those of pasture. Composite CN’s may be computed for other combinations of open space cover type.
4 Composite CN’s for natural desert landscaping should be computed using figures 2-3 or 2-4 based on the impervious area percentage (CN = 98) and the pervious area CN. The pervious area CN’s are assumed equivalent to desert shrub in poor hydrologic condition.
5 Composite CN’s to use for the design of temporary measures during grading and construction should be computed using figure 2-3 or 2-4 based on the degree of development (impervious area percentage) and the CN’s for the newly graded pervious areas.
Poor condition (grass cover < 50%) .......................................... 68 79 86 89 Fair condition (grass cover 50% to 75%) .................................. 49 69 79 84 Good condition (grass cover > 75%) ......................................... 39 61 74 80
(excluding right-of-way) ............................................................. 98 98 98 98 Streets and roads:
Paved; curbs and storm sewers (excluding right-of-way) ................................................................................
98
98
98
98
Paved; open ditches (including right-of-way) .......................... 83 89 92 93 Gravel (including right-of-way) ................................................. 76 85 89 91 Dirt (including right-of-way) ...................................................... 72 82 87 89
estern desert urban areas: Natural desert landscaping (pervious areas only) 4/ ..................... 63 77 85 88 Artificial desert landscaping (impervious weed barrier,
desert shrub with 1- to 2-inch sand or gravel mulch and basin borders) ...................................................................... 96 96 96 96
ban districts: Commercial and business ................................................................. 85 89 92 94 95 Industrial ............................................................................................. 72 81 88 91 93
sidential districts by average lot size: 1/8 acre or less (town houses) .......................................................... 65 77 85 90 92 1/4 acre ................................................................................................ 38 61 75 83 87 1/3 acre ................................................................................................ 30 57 72 81 86 1/2 acre ................................................................................................ 25 54 70 80 85 1 acre ................................................................................................... 20 51 68 79 84 2 acres .................................................................................................. 12 46 65 77 82
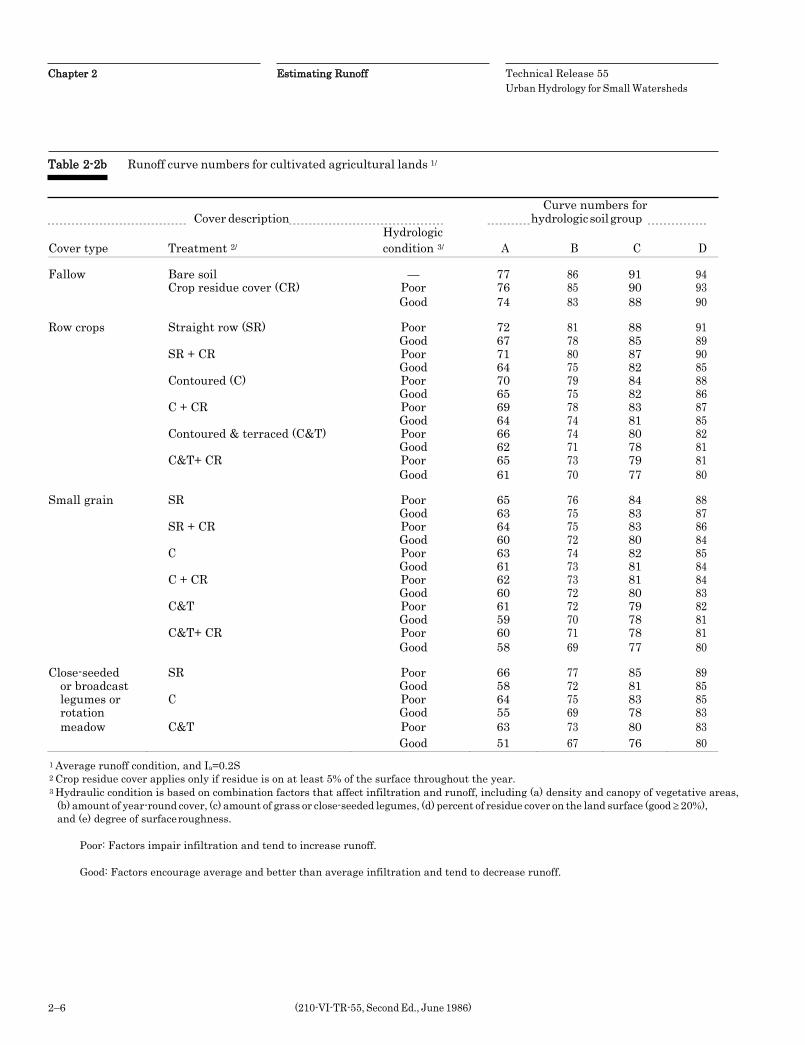
Chapter 2 Estimating Runoff Technical Release 55 Urban Hydrology for Small Watersheds
2–6 (210-VI-TR-55, Second Ed., June 1986)
Table 2-2b Runoff curve numbers for cultivated agricultural lands 1/
Curve numbers for Cover description hydrologic soil group
Hydrologic Cover type Treatment 2/ condition 3/ A B C D
Fallow Bare soil — 77 86 91 94 Crop residue cover (CR) Poor 76 85 90 93 Good 74 83 88 90
Row crops Straight row (SR) Poor 72 81 88 91 Good 67 78 85 89 SR + CR Poor 71 80 87 90 Good 64 75 82 85 Contoured (C) Poor 70 79 84 88 Good 65 75 82 86 C + CR Poor 69 78 83 87 Good 64 74 81 85 Contoured & terraced (C&T) Poor 66 74 80 82 Good 62 71 78 81 C&T+ CR Poor 65 73 79 81 Good 61 70 77 80
Small grain SR Poor 65 76 84 88 Good 63 75 83 87 SR + CR Poor 64 75 83 86 Good 60 72 80 84 C Poor 63 74 82 85 Good 61 73 81 84 C + CR Poor 62 73 81 84 Good 60 72 80 83 C&T Poor 61 72 79 82 Good 59 70 78 81 C&T+ CR Poor 60 71 78 81 Good 58 69 77 80
Close-seeded SR Poor 66 77 85 89 or broadcast Good 58 72 81 85 legumes or C Poor 64 75 83 85 rotation Good 55 69 78 83 meadow C&T Poor 63 73 80 83
Good 51 67 76 80 1 Average runoff condition, and Ia=0.2S 2 Crop residue cover applies only if residue is on at least 5% of the surface throughout the year. 3 Hydraulic condition is based on combination factors that affect infiltration and runoff, including (a) density and canopy of vegetative areas,
(b) amount of year-round cover, (c) amount of grass or close-seeded legumes, (d) percent of residue cover on the land surface (good ≥ 20%), and (e) degree of surface roughness.
Poor: Factors impair infiltration and tend to increase runoff.
Good: Factors encourage average and better than average infiltration and tend to decrease runoff.
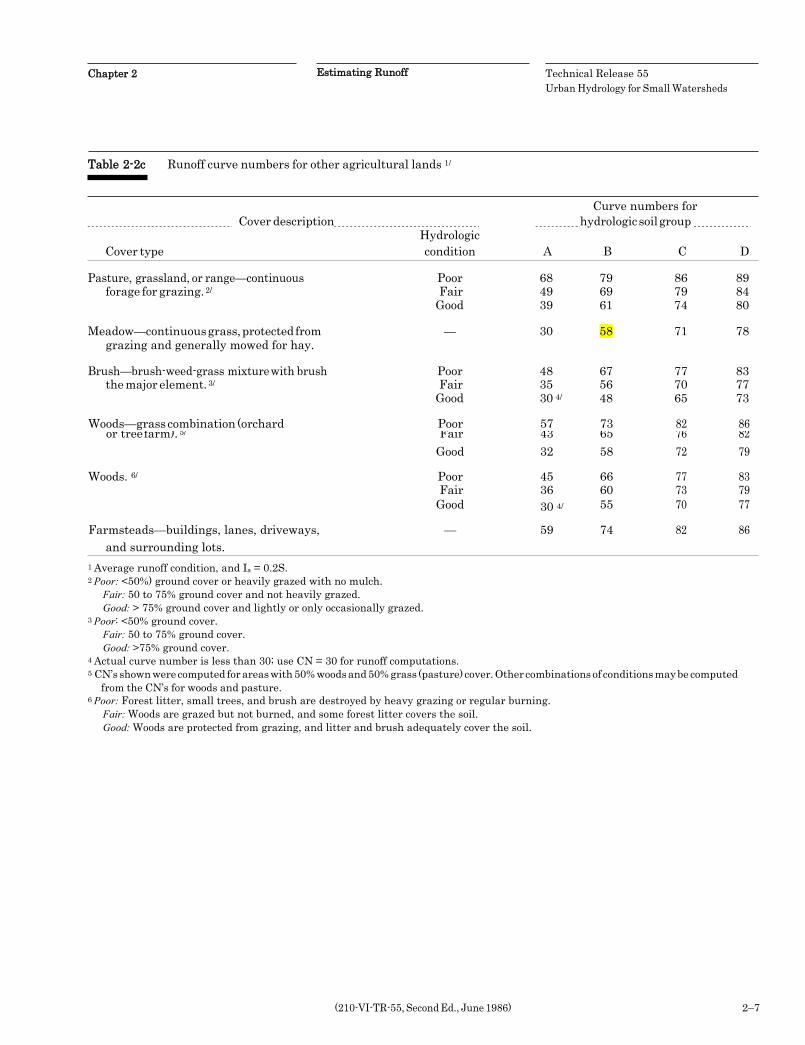
Estimating Runoff Chapter 2 Technical Release 55 Urban Hydrology for Small Watersheds
(210-VI-TR-55, Second Ed., June 1986) 2–7
Table 2-2c Runoff curve numbers for other agricultural lands 1/
Curve numbers for Cover description hydrologic soil group
Hydrologic Cover type condition A B C D
Pasture, grassland, or range—continuous Poor 68 79 86 89 forage for grazing. 2/ Fair 49 69 79 84
Good 39 61 74 80
Meadow—continuous grass, protected from — 30 58 71 78 grazing and generally mowed for hay.
Brush—brush-weed-grass mixture with brush Poor 48 67 77 83 the major element. 3/ Fair 35 56 70 77
Good 30 4/ 48 65 73
Woods—grass combination (orchard Poor 57 73 82 86 or tree farm). 5/ Fair 43 65 76 82
Good 32 58 72 79
Woods. 6/ Poor 45 66 77 83 Fair 36 60 73 79 Good 30 4/ 55 70 77
Farmsteads—buildings, lanes, driveways, — 59 74 82 86 and surrounding lots.
1 Average runoff condition, and Ia = 0.2S. 2 Poor: <50%) ground cover or heavily grazed with no mulch.
Fair: 50 to 75% ground cover and not heavily grazed. Good: > 75% ground cover and lightly or only occasionally grazed.
3 Poor: <50% ground cover. Fair: 50 to 75% ground cover. Good: >75% ground cover.
4 Actual curve number is less than 30; use CN = 30 for runoff computations. 5 CN’s shown were computed for areas with 50% woods and 50% grass (pasture) cover. Other combinations of conditions may be computed
from the CN’s for woods and pasture. 6 Poor: Forest litter, small trees, and brush are destroyed by heavy grazing or regular burning.
Fair: Woods are grazed but not burned, and some forest litter covers the soil. Good: Woods are protected from grazing, and litter and brush adequately cover the soil.
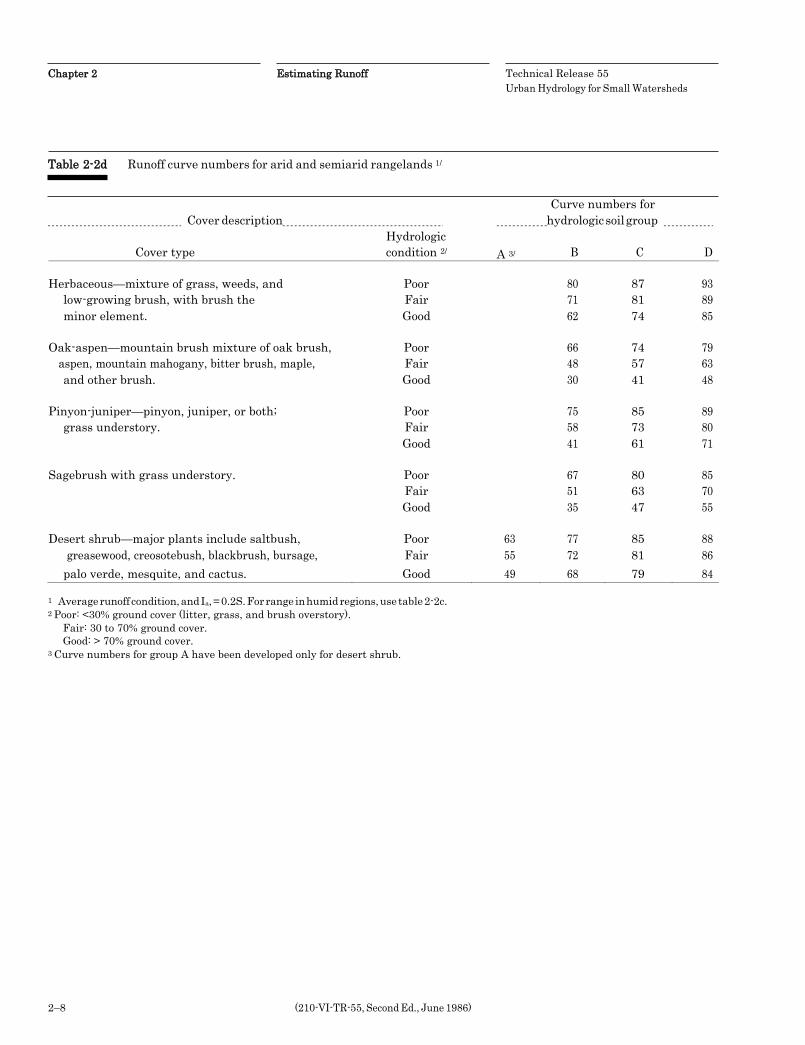
Chapter 2 Estimating Runoff Technical Release 55 Urban Hydrology for Small Watersheds
2–8 (210-VI-TR-55, Second Ed., June 1986)
Table 2-2d Runoff curve numbers for arid and semiarid rangelands 1/
Curve numbers for Cover description hydrologic soil group
Hydrologic Cover type condition 2/ A 3/ B C D
Herbaceous—mixture of grass, weeds, and
Poor
80
87
93
low-growing brush, with brush the Fair 71 81 89 minor element. Good 62 74 85
Oak-aspen—mountain brush mixture of oak brush, Poor
66 74 79 aspen, mountain mahogany, bitter brush, maple, Fair 48 57 63 and other brush. Good 30 41 48
Pinyon-juniper—pinyon, juniper, or both; Poor
75 85 89 grass understory. Fair 58 73 80
Good 41 61 71
Sagebrush with grass understory. Poor
67 80 85 Fair 51 63 70 Good 35 47 55
Desert shrub—major plants include saltbush, Poor 63 77 85 88 greasewood, creosotebush, blackbrush, bursage, Fair 55 72 81 86
palo verde, mesquite, and cactus. Good 49 68 79 84
1 Average runoff condition, and Ia, = 0.2S. For range in humid regions, use table 2-2c. 2 Poor: <30% ground cover (litter, grass, and brush overstory).
Fair: 30 to 70% ground cover. Good: > 70% ground cover.
3 Curve numbers for group A have been developed only for desert shrub.
ATTACHMENT 4.2 STORMWATER BMP MANUAL
APPENDIX D WORKSHEET
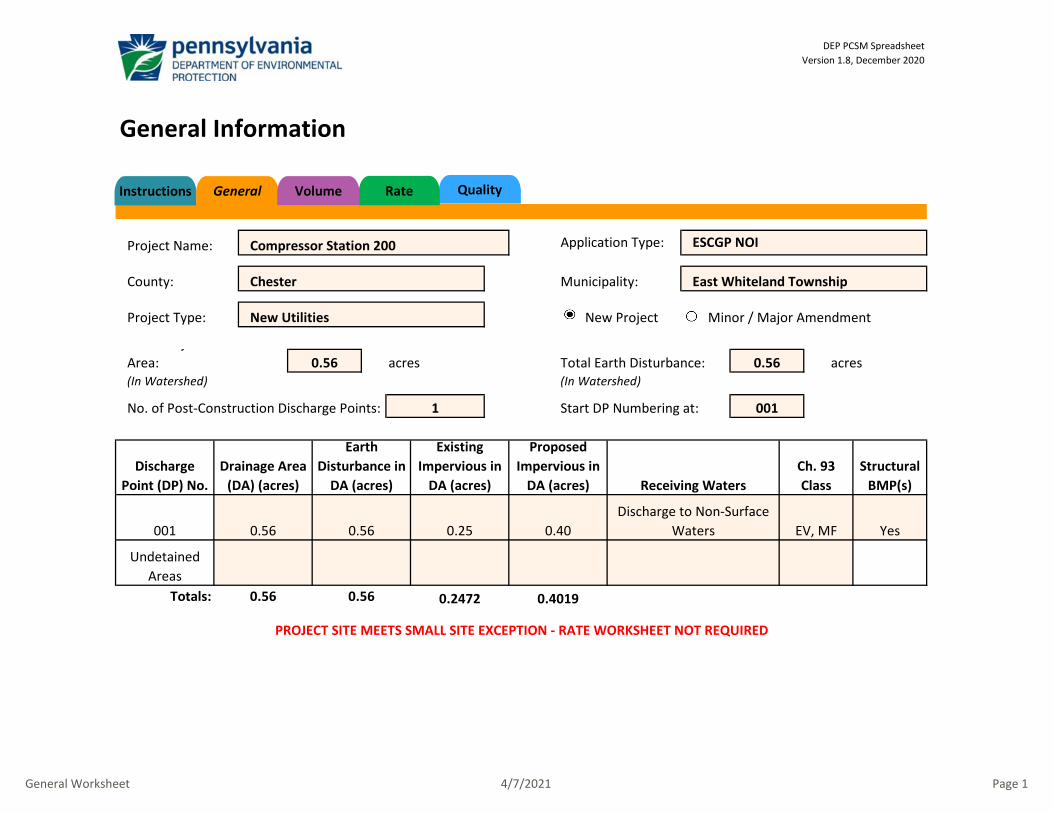
O
Totals: 0.2472 0.4019
Undetained Areas
0.56 0.56
PROJECT SITE MEETS SMALL SITE EXCEPTION - RATE WORKSHEET NOT REQUIRED
DEP PCSM SpreadsheetVersion 1.8, December 2020
General Information
County: Chester
Project Name:
0.56 acres
Project Type: New Utilities
j Area: 0.56 acres
Discharge Point (DP) No.
Earth Disturbance in
DA (acres)
No. of Post-Construction Discharge Points:
Existing Impervious in
DA (acres)
Proposed Impervious in
DA (acres)
001 0.56
ESCGP NOIApplication Type:
Municipality: East Whiteland Township
Compressor Station 200
New Project
Structural BMP(s)
Yes
Ch. 93 Class
1
Discharge to Non-Surface Waters EV, MF
(In Watershed)
Start DP Numbering at: 001
Receiving WatersDrainage Area
(DA) (acres)
Total Earth Disturbance:
Minor / Major Amendment
0.56 0.25 0.40
(In Watershed)
QualityRateInstructions General Volume
General Worksheet 4/7/2021 Page 1
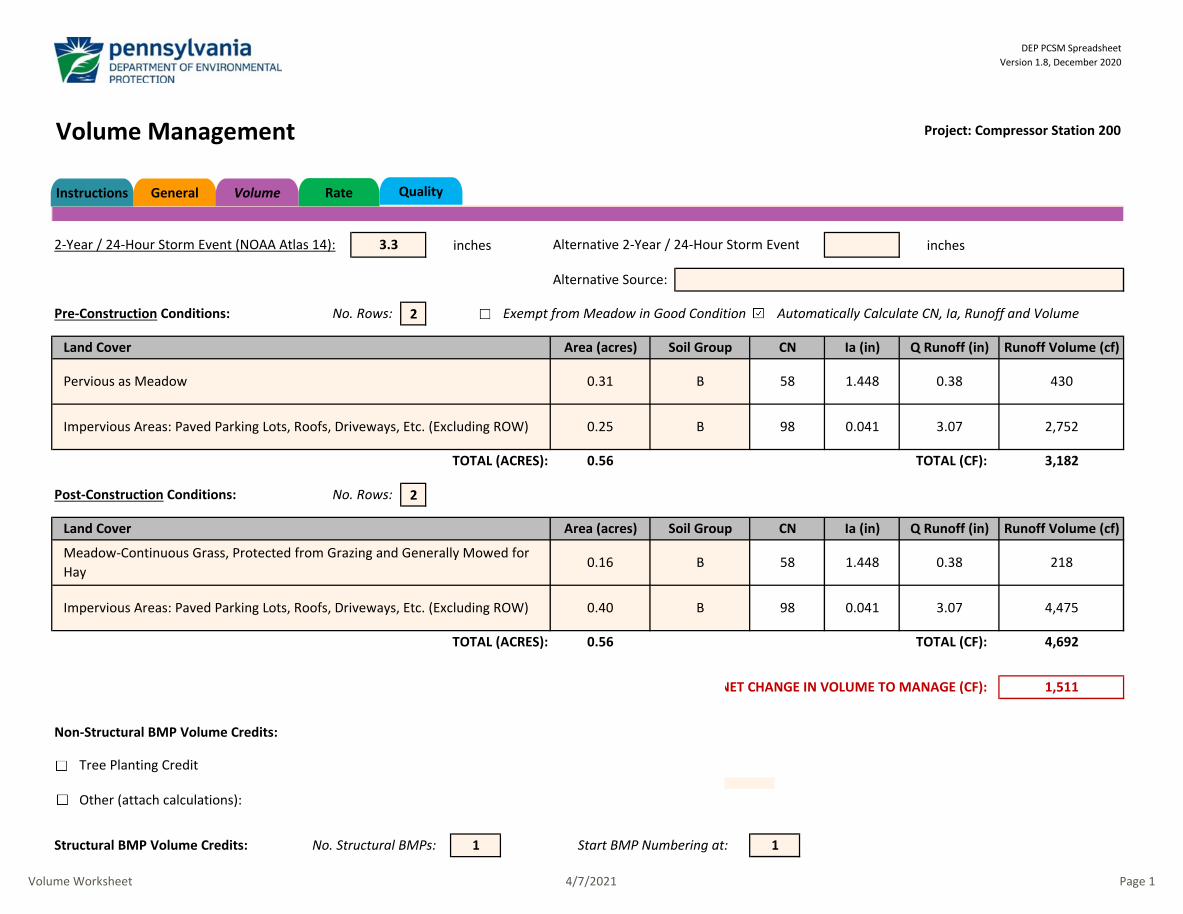
Volume Management
inches inches
2
2
2,752B 98 0.041
1
Other (attach calculations):
FALSEStart BMP Numbering at: 1
Tree Planting Credit
1,511
4,692
Ia (in)
B
3.07 4,475B
58
3.07
0.31
Area (acres)Land Cover
Impervious Areas: Paved Parking Lots, Roofs, Driveways, Etc. (Excluding ROW) 0.25
Q Runoff (in)
0.38
Soil Group
B
DEP PCSM SpreadsheetVersion 1.8, December 2020
2-Year / 24-Hour Storm Event (NOAA Atlas 14): 3.3 Alternative 2-Year / 24-Hour Storm Event
Alternative Source:
No. Rows:Pre-Construction Conditions: Automatically Calculate CN, Ia, Runoff and VolumeExempt from Meadow in Good Condition
Project: Compressor Station 200
Ia (in)
1.448 430
Runoff Volume (cf)CN
Pervious as Meadow
TOTAL (ACRES): 0.56
NET CHANGE IN VOLUME TO MANAGE (CF):
TOTAL (CF):
Non-Structural BMP Volume Credits:
Impervious Areas: Paved Parking Lots, Roofs, Driveways, Etc. (Excluding ROW) 0.40
58 1.448 0.38
0.56
Post-Construction Conditions:
CN Q Runoff (in)
TOTAL (CF):
Land Cover Soil Group
98 0.041
Runoff Volume (cf)
3,182
218
No. Structural BMPs:
TOTAL (ACRES):
Area (acres)
Meadow-Continuous Grass, Protected from Grazing and Generally Mowed for Hay
0.16
No. Rows:
Structural BMP Volume Credits:
QualityRateInstructions General Volume
Volume Worksheet 4/7/2021 Page 1
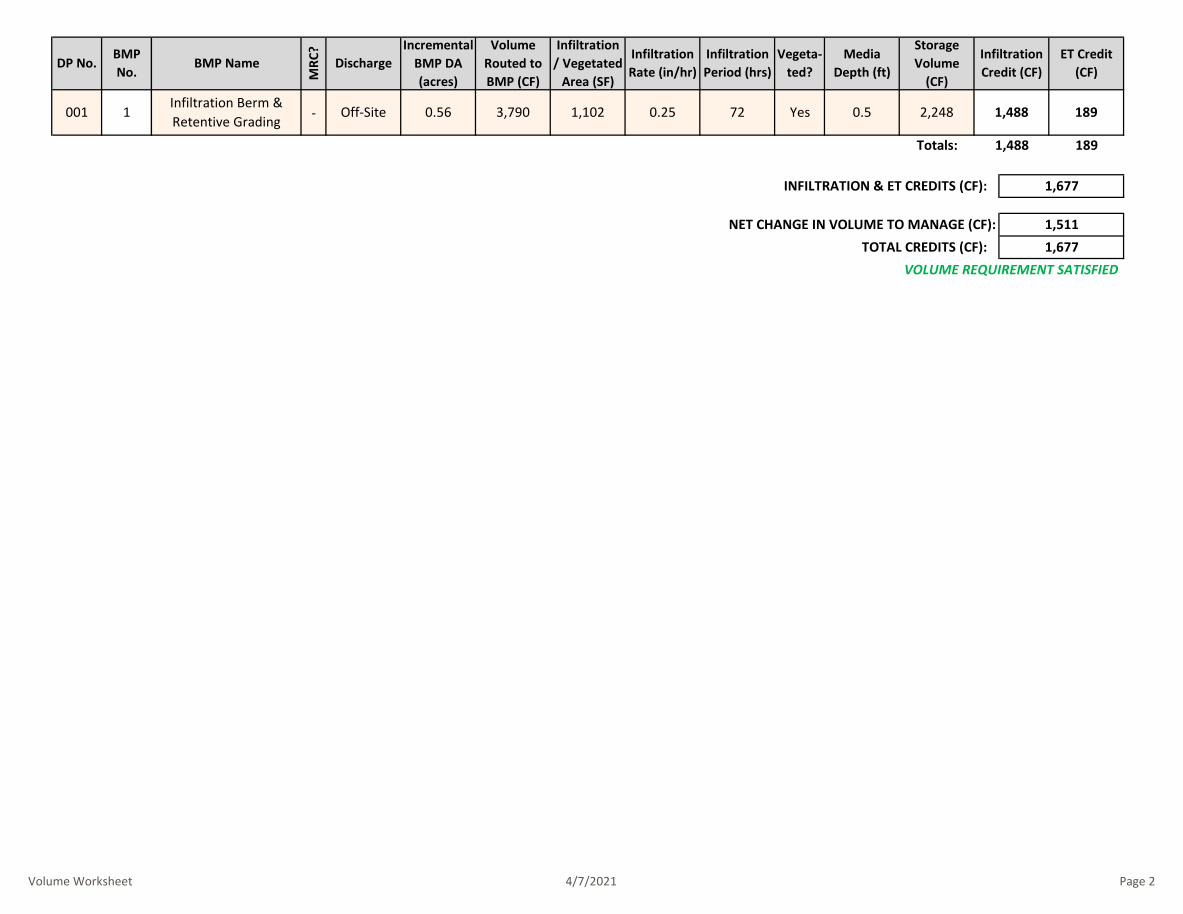
0 - 0
0 0189Totals:
1,677
Infiltration Credit (CF)
1,488
INFILTRATION & ET CREDITS (CF):
1,488
Cumulati
Storage Volume
(CF)
VOLUME REQUIREMENT SATISFIEDTOTAL CREDITS (CF): 1,677
NET CHANGE IN VOLUME TO MANAGE (CF): 1,511
001
ET Credit (CF)
DP No.
189
Incremental BMP DA (acres)
0.56
BMP Name
Infiltration Berm & Retentive Grading
3,790
Media Depth (ft)
2,2480.5
Vegeta-ted?
Yes
Infiltration Period (hrs)
72
Infiltration Rate (in/hr)
0.25
Infiltration / Vegetated
Area (SF)
1,102
Volume Routed to BMP (CF)
BMP No.
1
Discharge
Off-Site
MRC
?
Volume Worksheet 4/7/2021 Page 2
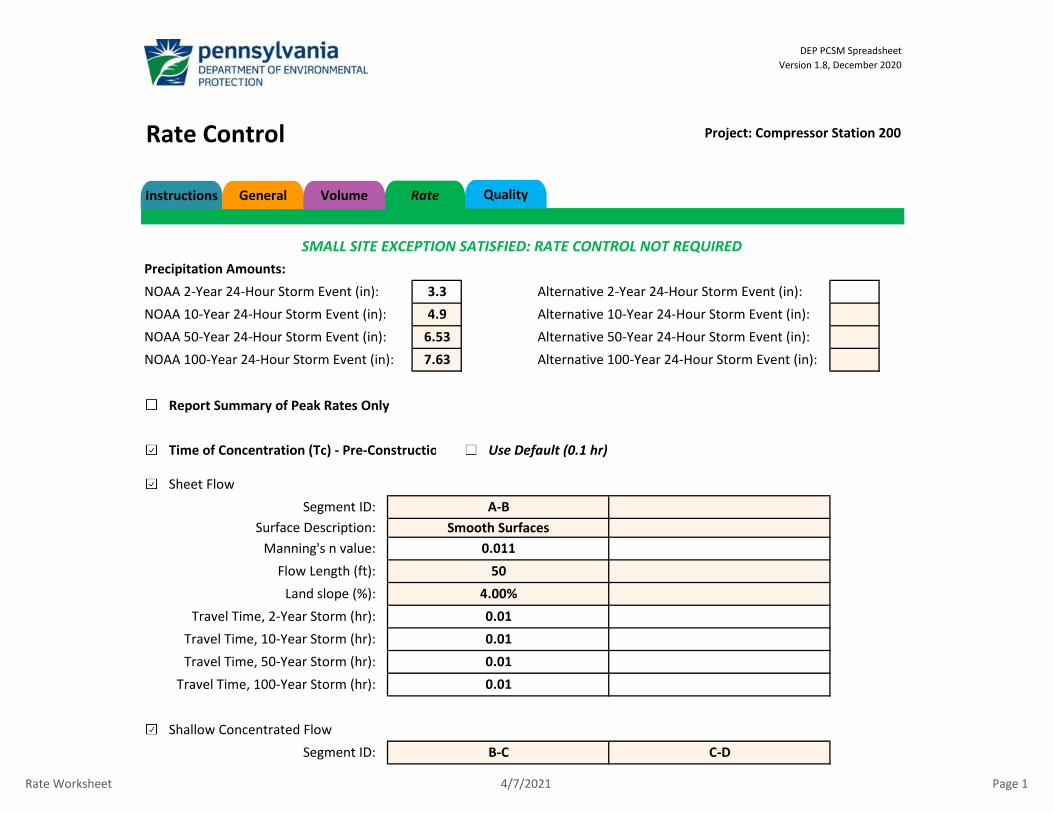
Rate Control
Report Summary of Peak Rates Only
Time of Concentration (Tc) - Pre-Constructio Use Default (0.1 hr)
Segment ID: B-C C-D
SMALL SITE EXCEPTION SATISFIED: RATE CONTROL NOT REQUIRED
Shallow Concentrated Flow
Smooth Surfaces0.011
504.00%0.010.010.010.01
A-B
Travel Time, 100-Year Storm (hr):
Travel Time, 2-Year Storm (hr):
DEP PCSM SpreadsheetVersion 1.8, December 2020
Travel Time, 10-Year Storm (hr):Travel Time, 50-Year Storm (hr):
Segment ID:Surface Description:
Manning's n value:Flow Length (ft):
Land slope (%):
Sheet Flow
NOAA 100-Year 24-Hour Storm Event (in):
Alternative 10-Year 24-Hour Storm Event (in):Alternative 50-Year 24-Hour Storm Event (in):Alternative 100-Year 24-Hour Storm Event (in):
4.96.537.63
NOAA 10-Year 24-Hour Storm Event (in):NOAA 50-Year 24-Hour Storm Event (in):
Alternative 2-Year 24-Hour Storm Event (in):3.3NOAA 2-Year 24-Hour Storm Event (in):Precipitation Amounts:
Project: Compressor Station 200
QualityRateInstructions General Volume
Rate Worksheet 4/7/2021 Page 1
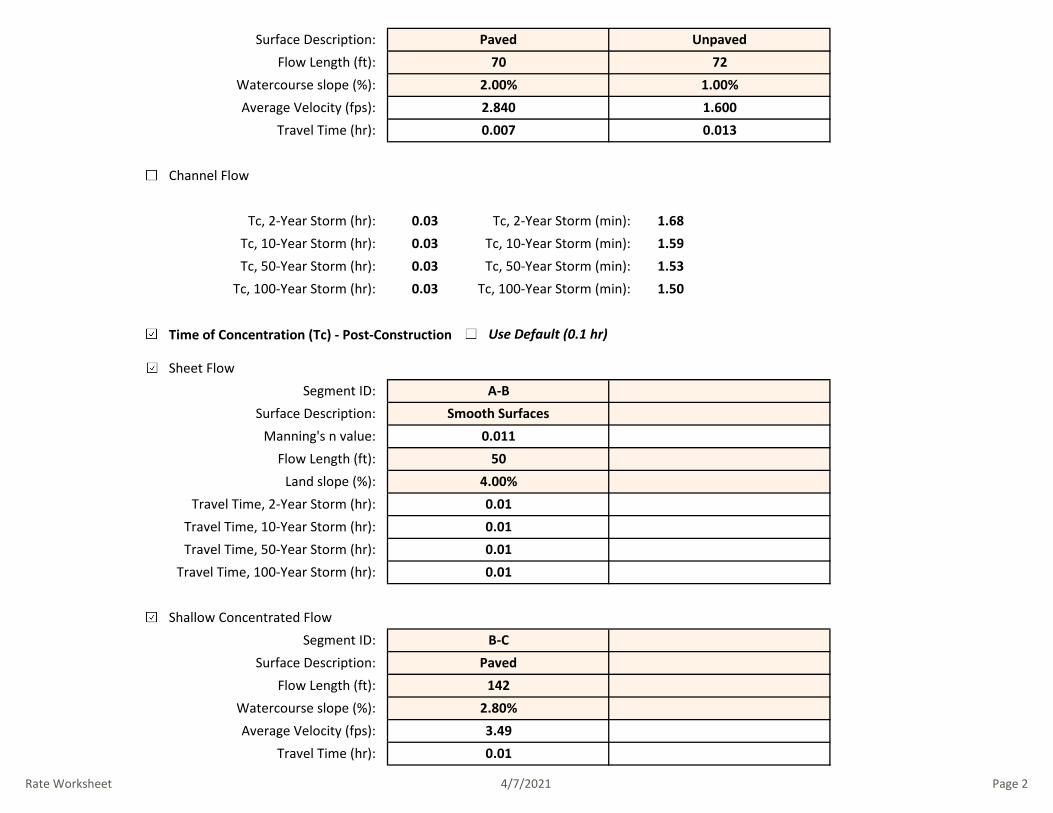
Time of Concentration (Tc) - Post-Construction
0.01
0.030.030.030.03
Tc, 2-Year Storm (min):Tc, 10-Year Storm (min):Tc, 50-Year Storm (min):
Tc, 100-Year Storm (min):
1.681.591.531.50
3.49
Use Default (0.1 hr)
Average Velocity (fps):
Shallow Concentrated Flow
Travel Time, 10-Year Storm (hr): 0.01Travel Time, 50-Year Storm (hr):
Travel Time (hr): 0.01
Segment ID: B-CSurface Description: Paved
Flow Length (ft): 142
Sheet FlowSegment ID: A-B
Surface Description: Smooth SurfacesManning's n value: 0.011
Flow Length (ft): 50
Travel Time, 100-Year Storm (hr): 0.01
0.01
Watercourse slope (%):
Average Velocity (fps): 2.840 1.600
Channel Flow
Travel Time (hr): 0.007 0.013
Surface Description: Paved Unpaved72Flow Length (ft): 70
Watercourse slope (%): 2.00% 1.00%
Tc, 2-Year Storm (hr):Tc, 10-Year Storm (hr):Tc, 50-Year Storm (hr):
Tc, 100-Year Storm (hr):
Land slope (%): 4.00%Travel Time, 2-Year Storm (hr):
2.80%
Rate Worksheet 4/7/2021 Page 2
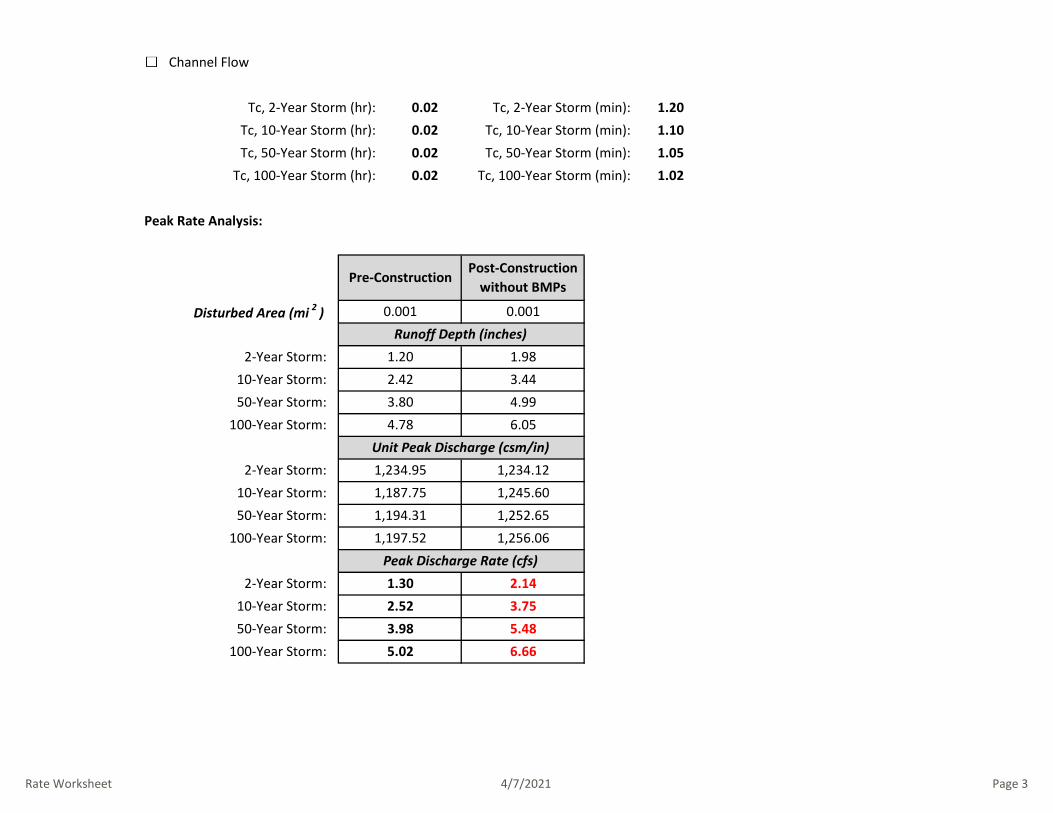
1.101.051.02
0.020.020.020.02
Tc, 2-Year Storm (min):Tc, 10-Year Storm (min):Tc, 50-Year Storm (min):
Tc, 100-Year Storm (min):
Channel Flow
2-Year Storm:10-Year Storm:50-Year Storm:
100-Year Storm:
1.302.523.985.02
2.143.755.486.66
Disturbed Area (mi 2 ) 0.001
1.20
Peak Rate Analysis:
100-Year Storm:
Tc, 2-Year Storm (hr):Tc, 10-Year Storm (hr):
Runoff Depth (inches)
Unit Peak Discharge (csm/in)
Peak Discharge Rate (cfs)
2-Year Storm:10-Year Storm:50-Year Storm:
100-Year Storm:
Tc, 50-Year Storm (hr):Tc, 100-Year Storm (hr):
Pre-ConstructionPost-Construction
without BMPs
0.001
1.983.444.996.05
1,234.121,245.601,252.651,256.06
2-Year Storm:10-Year Storm:50-Year Storm:
1.202.423.804.78
1,234.951,187.751,194.311,197.52
Rate Worksheet 4/7/2021 Page 3
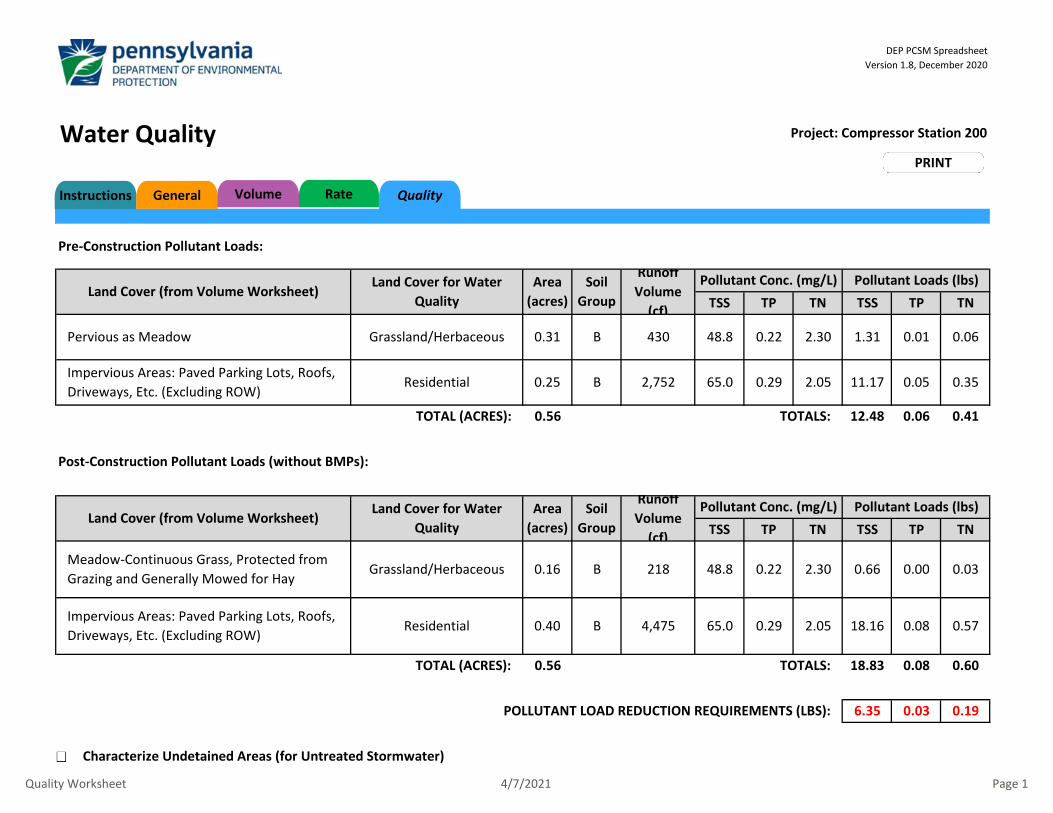
Water Quality
Impervious Areas: Paved Parking Lots, Roofs, Driveways, Etc. (Excluding ROW)
Residential 0.40
B 48.8 0.22 2.30 0.66 0.00 0.03218Meadow-Continuous Grass, Protected from Grazing and Generally Mowed for Hay
Grassland/Herbaceous
Land Cover (from Volume Worksheet)Land Cover for Water
QualityArea
(acres)
0.16
B 65.0 0.29 2.05 18.16 0.08 0.574,475
Post-Construction Pollutant Loads (without BMPs):
Soil Group
Runoff Volume
(cf)
Pollutant Conc. (mg/L) Pollutant Loads (lbs)TSS TP TN TSS TP TN
12.48 0.06 0.41
B 48.8 0.22 2.30 1.31 0.01
B 65.0 0.29 2.05 11.17
DEP PCSM SpreadsheetVersion 1.8, December 2020
2,752
430 0.06
Pre-Construction Pollutant Loads:
Soil Group
Runoff Volume
(cf)
Pollutant Conc. (mg/L) Pollutant Loads (lbs)TSS TP TN TSS TP TN
0.05 0.35
Land Cover (from Volume Worksheet)Land Cover for Water
Quality
Pervious as Meadow Grassland/Herbaceous
Area (acres)
0.31
Impervious Areas: Paved Parking Lots, Roofs, Driveways, Etc. (Excluding ROW)
Residential 0.25
Project: Compressor Station 200
TOTALS:TOTAL (ACRES): 0.56
Characterize Undetained Areas (for Untreated Stormwater) No. Rows:
TOTAL (ACRES): 0.56 0.08 0.604,692
POLLUTANT LOAD REDUCTION REQUIREMENTS (LBS): 6.35 0.03 0.19
TOTALS: 18.83
QualityRateInstructions General Volume
Quality Worksheet 4/7/2021 Page 1
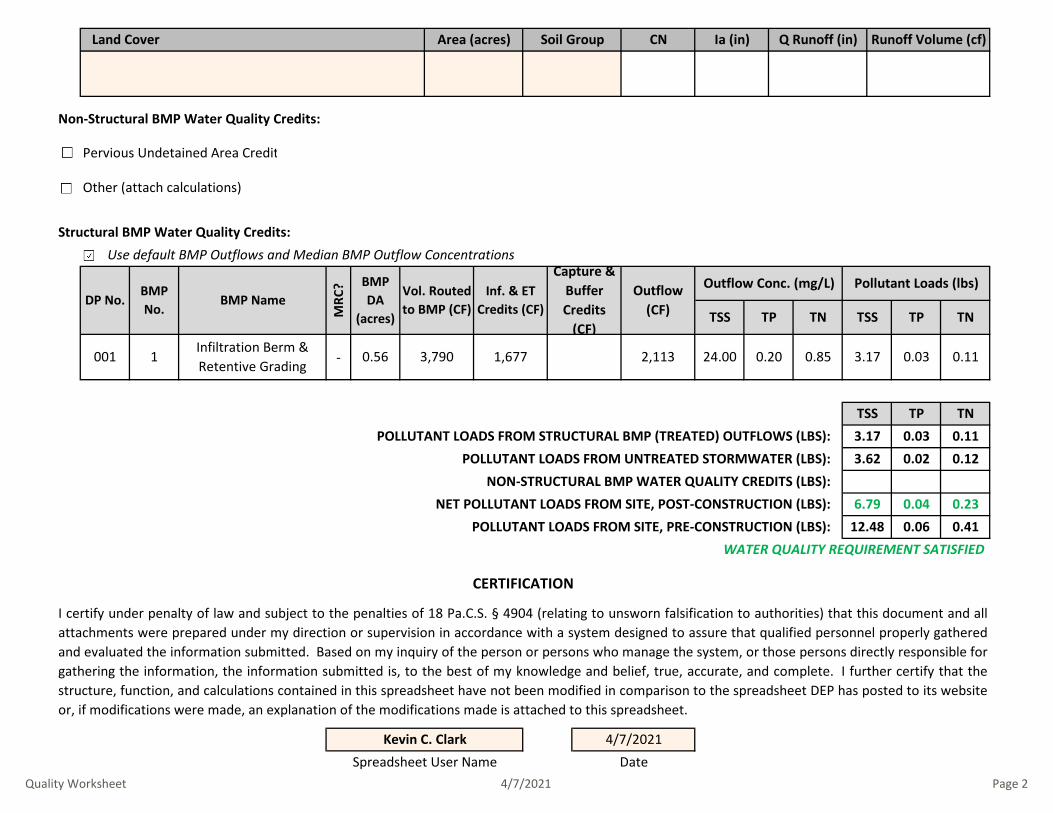
Other (attach calculations)
-
CERTIFICATION
I certify under penalty of law and subject to the penalties of 18 Pa.C.S. § 4904 (relating to unsworn falsification to authorities) that this document and allattachments were prepared under my direction or supervision in accordance with a system designed to assure that qualified personnel properly gatheredand evaluated the information submitted. Based on my inquiry of the person or persons who manage the system, or those persons directly responsible forgathering the information, the information submitted is, to the best of my knowledge and belief, true, accurate, and complete. I further certify that thestructure, function, and calculations contained in this spreadsheet have not been modified in comparison to the spreadsheet DEP has posted to its websiteor, if modifications were made, an explanation of the modifications made is attached to this spreadsheet.
Kevin C. ClarkSpreadsheet User Name
4/7/2021Date
POLLUTANT LOADS FROM STRUCTURAL BMP (TREATED) OUTFLOWS (LBS):POLLUTANT LOADS FROM UNTREATED STORMWATER (LBS):
NON-STRUCTURAL BMP WATER QUALITY CREDITS (LBS):NET POLLUTANT LOADS FROM SITE, POST-CONSTRUCTION (LBS):
POLLUTANT LOADS FROM SITE, PRE-CONSTRUCTION (LBS):WATER QUALITY REQUIREMENT SATISFIED
3.17 0.03 0.113.62 0.02 0.12
6.79 0.04 0.2312.48 0.06 0.41
TSS TP TN
0.85 3.17 0.03 0.110.2024.00
Use default BMP Outflows and Median BMP Outflow Concentrations
DP No.BMP No.
BMP Name
MRC
? BMP DA
(acres)
Vol. Routed to BMP (CF)
Inf. & ET Credits (CF)
Capture & Buffer Credits
(CF)
Outflow (CF)
Outflow Conc. (mg/L) Pollutant Loads (lbs)
TSS TP TN TSS TP TN
Non-Structural BMP Water Quality Credits:
1Infiltration Berm & Retentive Grading
0.56
Pervious Undetained Area Credit
Structural BMP Water Quality Credits:
3,790 1,677001 2,113
Runoff Volume (cf)Q Runoff (in)Ia (in)CNSoil GroupArea (acres)Land Cover
TSS TP TN
Quality Worksheet 4/7/2021 Page 2
ATTACHMENT 4.3 BMP HYDROCAD REPORT
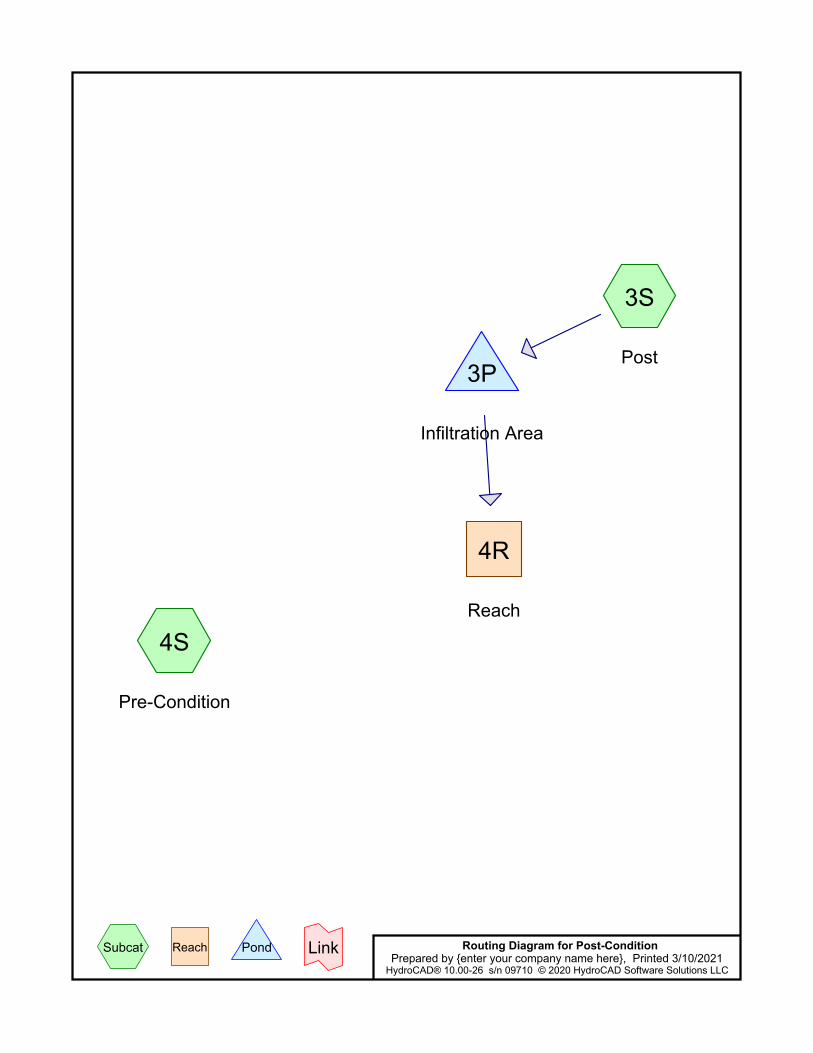
3S
Post
4S
Pre-Condition
4R
Reach
3P
Infiltration Area
Routing Diagram for Post-ConditionPrepared by {enter your company name here}, Printed 3/10/2021
HydroCAD® 10.00-26 s/n 09710 © 2020 HydroCAD Software Solutions LLC
Subcat Reach Pond Link

Post-Condition Printed 3/10/2021Prepared by {enter your company name here}
Page 2HydroCAD® 10.00-26 s/n 09710 © 2020 HydroCAD Software Solutions LLC
Project Notes
Rainfall events imported from "NRCS-Rain.txt" for 7614 PA Chester-C
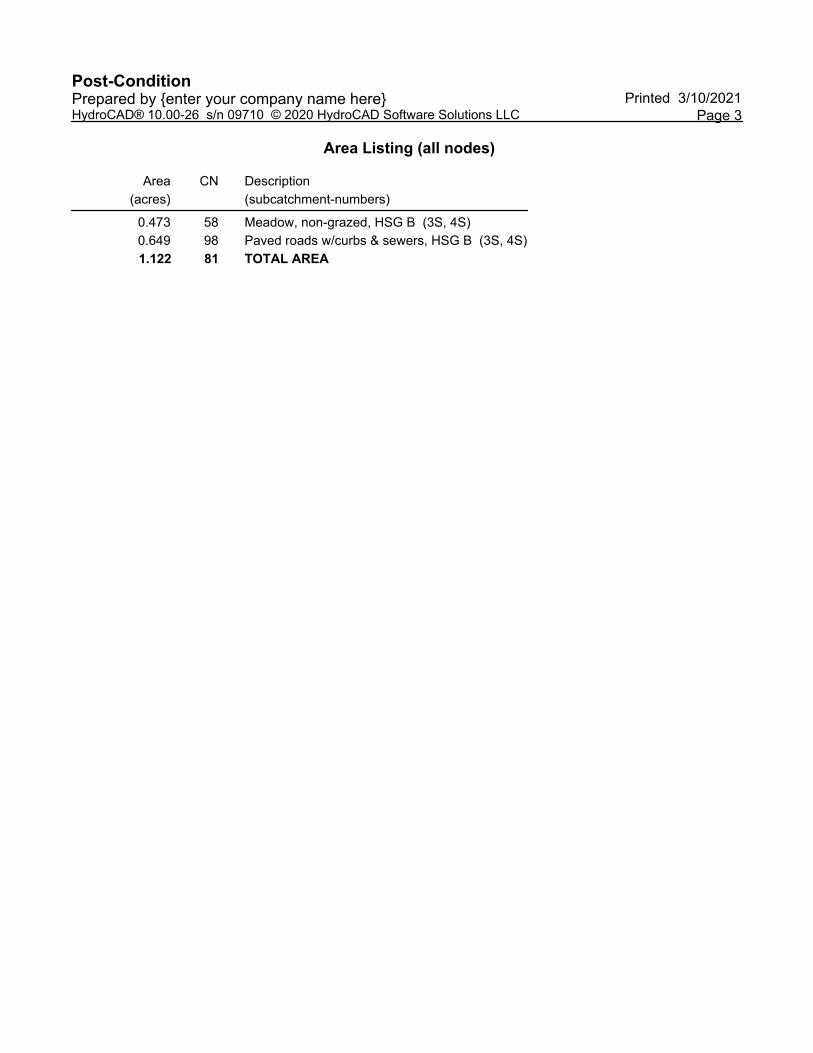
Post-Condition Printed 3/10/2021Prepared by {enter your company name here}
Page 3HydroCAD® 10.00-26 s/n 09710 © 2020 HydroCAD Software Solutions LLC
Area Listing (all nodes)
Area(acres)
CN Description(subcatchment-numbers)
0.473 58 Meadow, non-grazed, HSG B (3S, 4S)0.649 98 Paved roads w/curbs & sewers, HSG B (3S, 4S)
1.122 81 TOTAL AREA

Post-Condition Printed 3/10/2021Prepared by {enter your company name here}
Page 4HydroCAD® 10.00-26 s/n 09710 © 2020 HydroCAD Software Solutions LLC
Soil Listing (all nodes)
Area(acres)
SoilGroup
SubcatchmentNumbers
0.000 HSG A1.122 HSG B 3S, 4S0.000 HSG C0.000 HSG D0.000 Other
1.122 TOTAL AREA
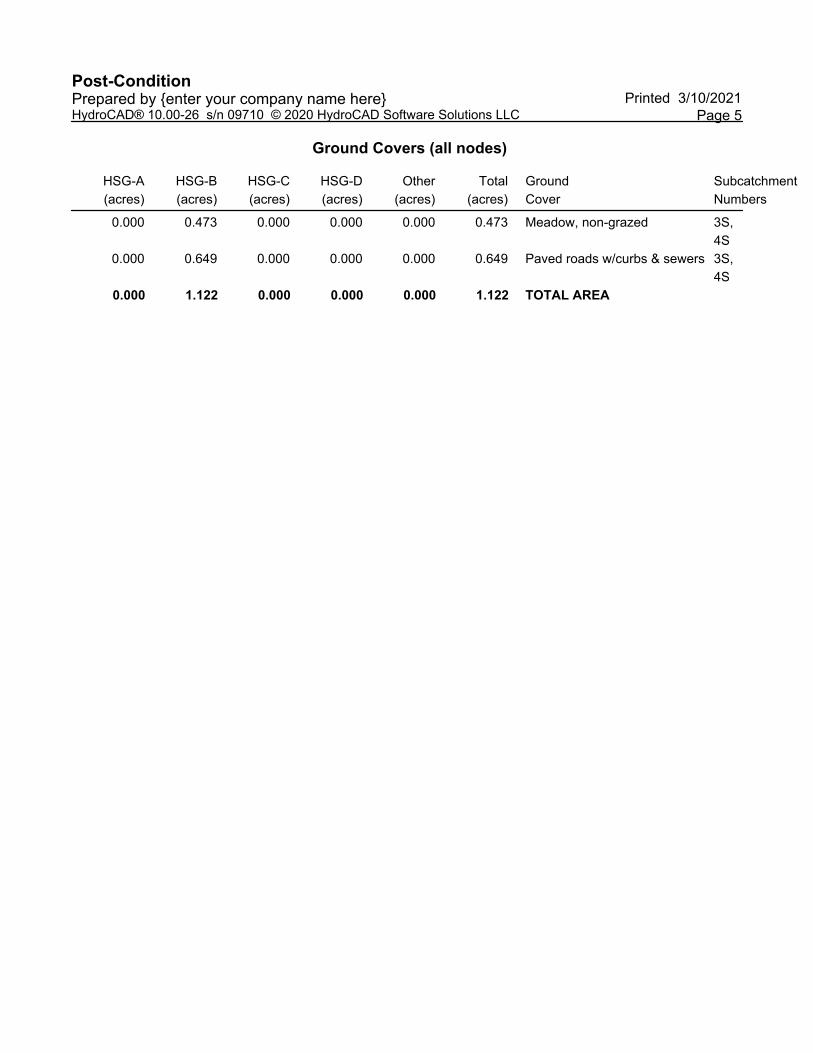
Post-Condition Printed 3/10/2021Prepared by {enter your company name here}
Page 5HydroCAD® 10.00-26 s/n 09710 © 2020 HydroCAD Software Solutions LLC
Ground Covers (all nodes)
HSG-A(acres)
HSG-B(acres)
HSG-C(acres)
HSG-D(acres)
Other(acres)
Total(acres)
GroundCover
SubcatchmentNumbers
0.000 0.473 0.000 0.000 0.000 0.473 Meadow, non-grazed 3S, 4S
0.000 0.649 0.000 0.000 0.000 0.649 Paved roads w/curbs & sewers 3S, 4S
0.000 1.122 0.000 0.000 0.000 1.122 TOTAL AREA
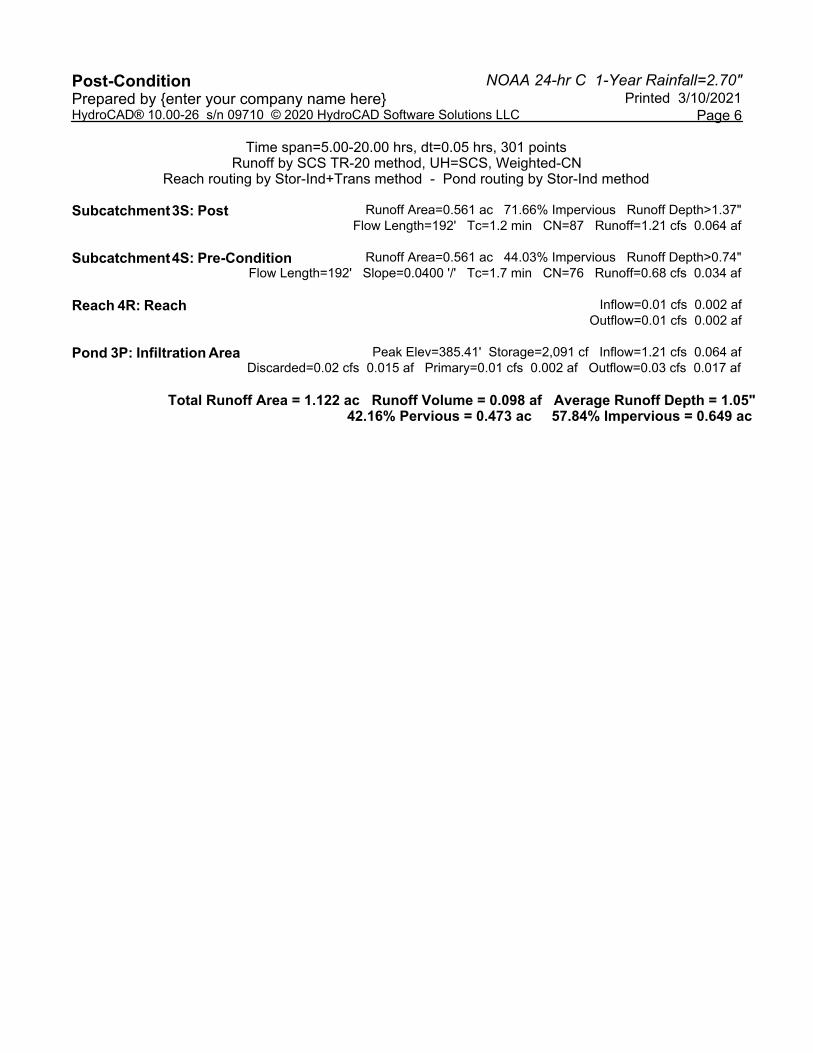
NOAA 24-hr C 1-Year Rainfall=2.70"Post-Condition Printed 3/10/2021Prepared by {enter your company name here}
Page 6HydroCAD® 10.00-26 s/n 09710 © 2020 HydroCAD Software Solutions LLC
Time span=5.00-20.00 hrs, dt=0.05 hrs, 301 pointsRunoff by SCS TR-20 method, UH=SCS, Weighted-CN
Reach routing by Stor-Ind+Trans method - Pond routing by Stor-Ind method
Runoff Area=0.561 ac 71.66% Impervious Runoff Depth>1.37"Subcatchment 3S: Post Flow Length=192' Tc=1.2 min CN=87 Runoff=1.21 cfs 0.064 af
Runoff Area=0.561 ac 44.03% Impervious Runoff Depth>0.74"Subcatchment 4S: Pre-Condition Flow Length=192' Slope=0.0400 '/' Tc=1.7 min CN=76 Runoff=0.68 cfs 0.034 af
Inflow=0.01 cfs 0.002 afReach 4R: Reach Outflow=0.01 cfs 0.002 af
Peak Elev=385.41' Storage=2,091 cf Inflow=1.21 cfs 0.064 afPond 3P: Infiltration Area Discarded=0.02 cfs 0.015 af Primary=0.01 cfs 0.002 af Outflow=0.03 cfs 0.017 af
Total Runoff Area = 1.122 ac Runoff Volume = 0.098 af Average Runoff Depth = 1.05"42.16% Pervious = 0.473 ac 57.84% Impervious = 0.649 ac

NOAA 24-hr C 1-Year Rainfall=2.70"Post-Condition Printed 3/10/2021Prepared by {enter your company name here}
Page 7HydroCAD® 10.00-26 s/n 09710 © 2020 HydroCAD Software Solutions LLC
Summary for Subcatchment 3S: Post
[49] Hint: Tc<2dt may require smaller dt
Runoff = 1.21 cfs @ 12.07 hrs, Volume= 0.064 af, Depth> 1.37"
Runoff by SCS TR-20 method, UH=SCS, Weighted-CN, Time Span= 5.00-20.00 hrs, dt= 0.05 hrsNOAA 24-hr C 1-Year Rainfall=2.70"
Area (ac) CN Description0.159 58 Meadow, non-grazed, HSG B0.402 98 Paved roads w/curbs & sewers, HSG B0.561 87 Weighted Average0.159 28.34% Pervious Area0.402 71.66% Impervious Area
Tc Length Slope Velocity Capacity Description(min) (feet) (ft/ft) (ft/sec) (cfs)
0.5 50 0.0400 1.60 Sheet Flow, Sheet FlowSmooth surfaces n= 0.011 P2= 3.30"
0.7 142 0.0280 3.40 Shallow Concentrated Flow, SCFPaved Kv= 20.3 fps
1.2 192 Total
Subcatchment 3S: Post
Runoff
Hydrograph
Time (hours)201918171615141312111098765
Flo
w (
cfs)
1
0
NOAA 24-hr C1-Year Rainfall=2.70"
Runoff Area=0.561 acRunoff Volume=0.064 af
Runoff Depth>1.37"Flow Length=192'
Tc=1.2 minCN=87
1.21 cfs
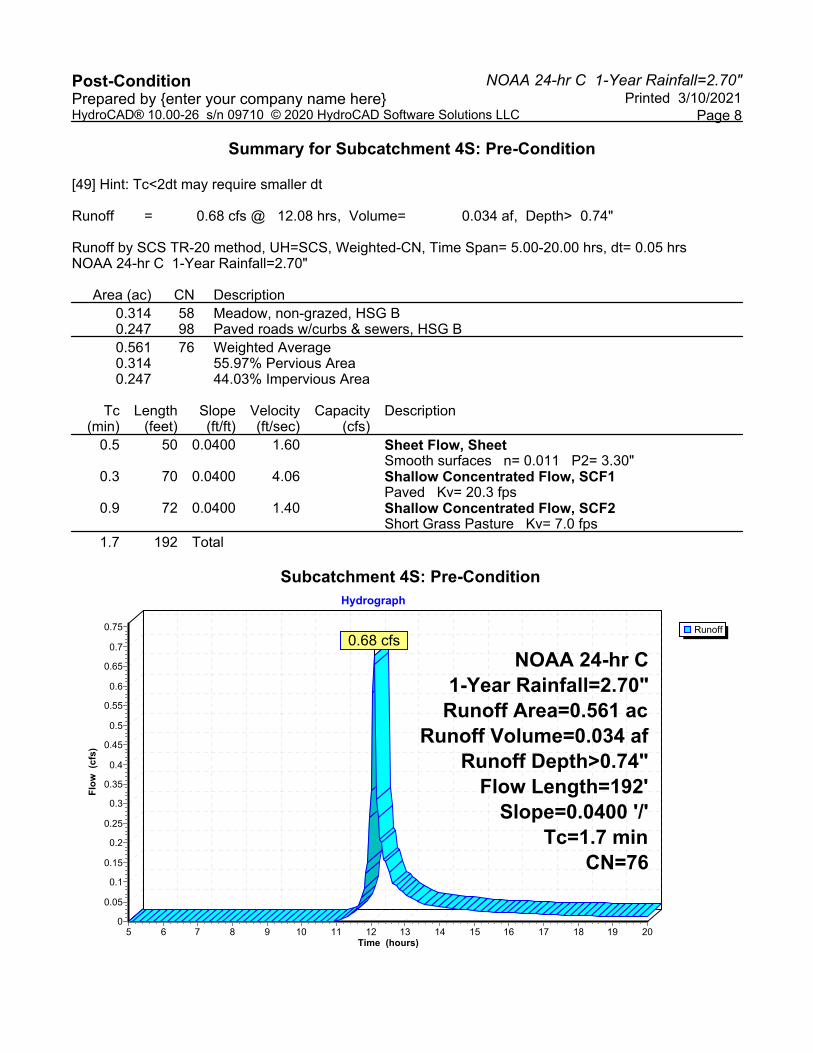
NOAA 24-hr C 1-Year Rainfall=2.70"Post-Condition Printed 3/10/2021Prepared by {enter your company name here}
Page 8HydroCAD® 10.00-26 s/n 09710 © 2020 HydroCAD Software Solutions LLC
Summary for Subcatchment 4S: Pre-Condition
[49] Hint: Tc<2dt may require smaller dt
Runoff = 0.68 cfs @ 12.08 hrs, Volume= 0.034 af, Depth> 0.74"
Runoff by SCS TR-20 method, UH=SCS, Weighted-CN, Time Span= 5.00-20.00 hrs, dt= 0.05 hrsNOAA 24-hr C 1-Year Rainfall=2.70"
Area (ac) CN Description0.314 58 Meadow, non-grazed, HSG B0.247 98 Paved roads w/curbs & sewers, HSG B0.561 76 Weighted Average0.314 55.97% Pervious Area0.247 44.03% Impervious Area
Tc Length Slope Velocity Capacity Description(min) (feet) (ft/ft) (ft/sec) (cfs)
0.5 50 0.0400 1.60 Sheet Flow, SheetSmooth surfaces n= 0.011 P2= 3.30"
0.3 70 0.0400 4.06 Shallow Concentrated Flow, SCF1Paved Kv= 20.3 fps
0.9 72 0.0400 1.40 Shallow Concentrated Flow, SCF2Short Grass Pasture Kv= 7.0 fps
1.7 192 Total
Subcatchment 4S: Pre-Condition
Runoff
Hydrograph
Time (hours)201918171615141312111098765
Flo
w (
cfs)
0.75
0.7
0.65
0.6
0.55
0.5
0.45
0.4
0.35
0.3
0.25
0.2
0.15
0.1
0.05
0
NOAA 24-hr C1-Year Rainfall=2.70"
Runoff Area=0.561 acRunoff Volume=0.034 af
Runoff Depth>0.74"Flow Length=192'
Slope=0.0400 '/'Tc=1.7 min
CN=76
0.68 cfs
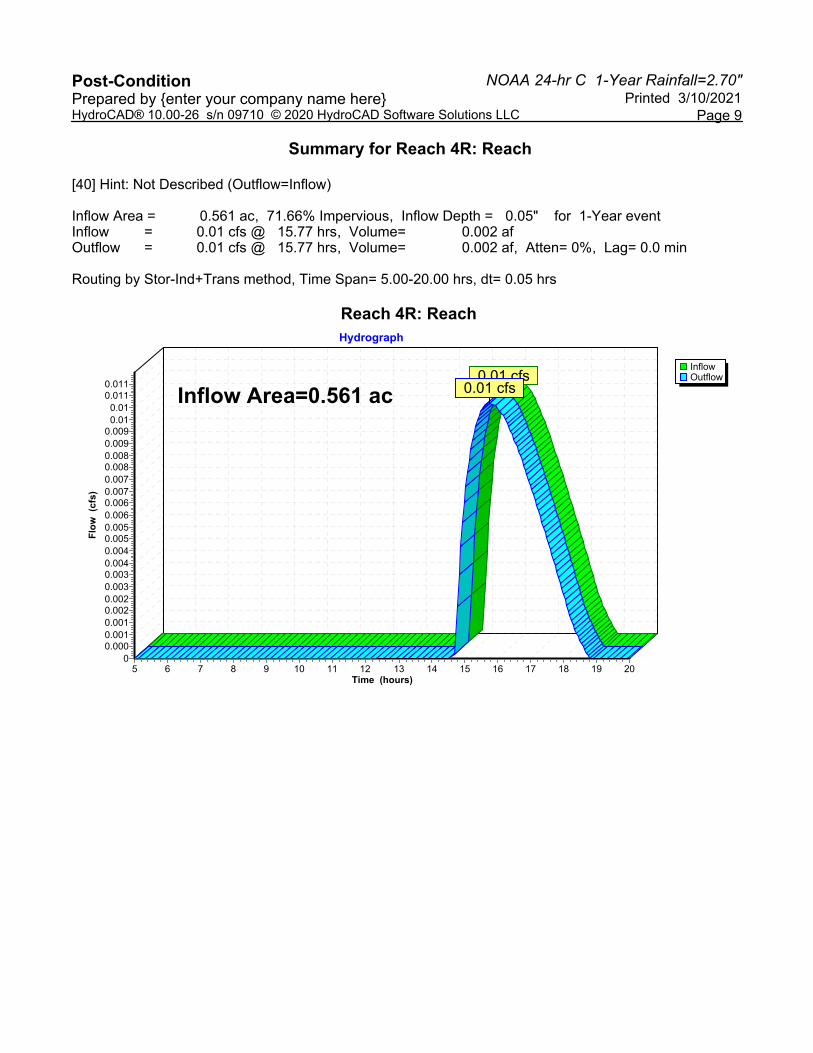
NOAA 24-hr C 1-Year Rainfall=2.70"Post-Condition Printed 3/10/2021Prepared by {enter your company name here}
Page 9HydroCAD® 10.00-26 s/n 09710 © 2020 HydroCAD Software Solutions LLC
Summary for Reach 4R: Reach
[40] Hint: Not Described (Outflow=Inflow)
Inflow Area = 0.561 ac, 71.66% Impervious, Inflow Depth = 0.05" for 1-Year eventInflow = 0.01 cfs @ 15.77 hrs, Volume= 0.002 afOutflow = 0.01 cfs @ 15.77 hrs, Volume= 0.002 af, Atten= 0%, Lag= 0.0 min
Routing by Stor-Ind+Trans method, Time Span= 5.00-20.00 hrs, dt= 0.05 hrs
Reach 4R: Reach
InflowOutflow
Hydrograph
Time (hours)201918171615141312111098765
Flo
w (
cfs)
0.0110.011
0.010.01
0.0090.0090.0080.0080.0070.0070.0060.0060.0050.0050.0040.0040.0030.0030.0020.0020.0010.0010.000
0
Inflow Area=0.561 ac0.01 cfs
0.01 cfs

NOAA 24-hr C 1-Year Rainfall=2.70"Post-Condition Printed 3/10/2021Prepared by {enter your company name here}
Page 10HydroCAD® 10.00-26 s/n 09710 © 2020 HydroCAD Software Solutions LLC
Summary for Pond 3P: Infiltration Area
Inflow Area = 0.561 ac, 71.66% Impervious, Inflow Depth > 1.37" for 1-Year eventInflow = 1.21 cfs @ 12.07 hrs, Volume= 0.064 afOutflow = 0.03 cfs @ 15.77 hrs, Volume= 0.017 af, Atten= 97%, Lag= 221.8 minDiscarded = 0.02 cfs @ 15.77 hrs, Volume= 0.015 afPrimary = 0.01 cfs @ 15.77 hrs, Volume= 0.002 af
Routing by Stor-Ind method, Time Span= 5.00-20.00 hrs, dt= 0.05 hrsPeak Elev= 385.41' @ 15.77 hrs Surf.Area= 2,770 sf Storage= 2,091 cf
Plug-Flow detention time= 262.5 min calculated for 0.017 af (26% of inflow)Center-of-Mass det. time= 163.5 min ( 948.4 - 785.0 )
Volume Invert Avail.Storage Storage Description#1 384.00' 4,007 cf Custom Stage Data (Prismatic) Listed below (Recalc)
Elevation Surf.Area Inc.Store Cum.Store(feet) (sq-ft) (cubic-feet) (cubic-feet)
384.00 127 0 0384.50 1,102 307 307385.00 2,077 795 1,102385.40 2,757 967 2,069386.00 3,703 1,938 4,007
Device Routing Invert Outlet Devices#1 Primary 385.40' 4.0' long x 6.0' breadth Broad-Crested Rectangular Weir
Head (feet) 0.20 0.40 0.60 0.80 1.00 1.20 1.40 1.60 1.80 2.00 2.50 3.00 3.50 4.00 4.50 5.00 5.50 Coef. (English) 2.37 2.51 2.70 2.68 2.68 2.67 2.65 2.65 2.65 2.65 2.66 2.66 2.67 2.69 2.72 2.76 2.83
#2 Discarded 384.00' 0.250 in/hr Exfiltration over Surface area Conductivity to Groundwater Elevation = 382.00'
Discarded OutFlow Max=0.02 cfs @ 15.77 hrs HW=385.41' (Free Discharge)2=Exfiltration ( Controls 0.02 cfs)
Primary OutFlow Max=0.01 cfs @ 15.77 hrs HW=385.41' (Free Discharge)1=Broad-Crested Rectangular Weir (Weir Controls 0.01 cfs @ 0.21 fps)
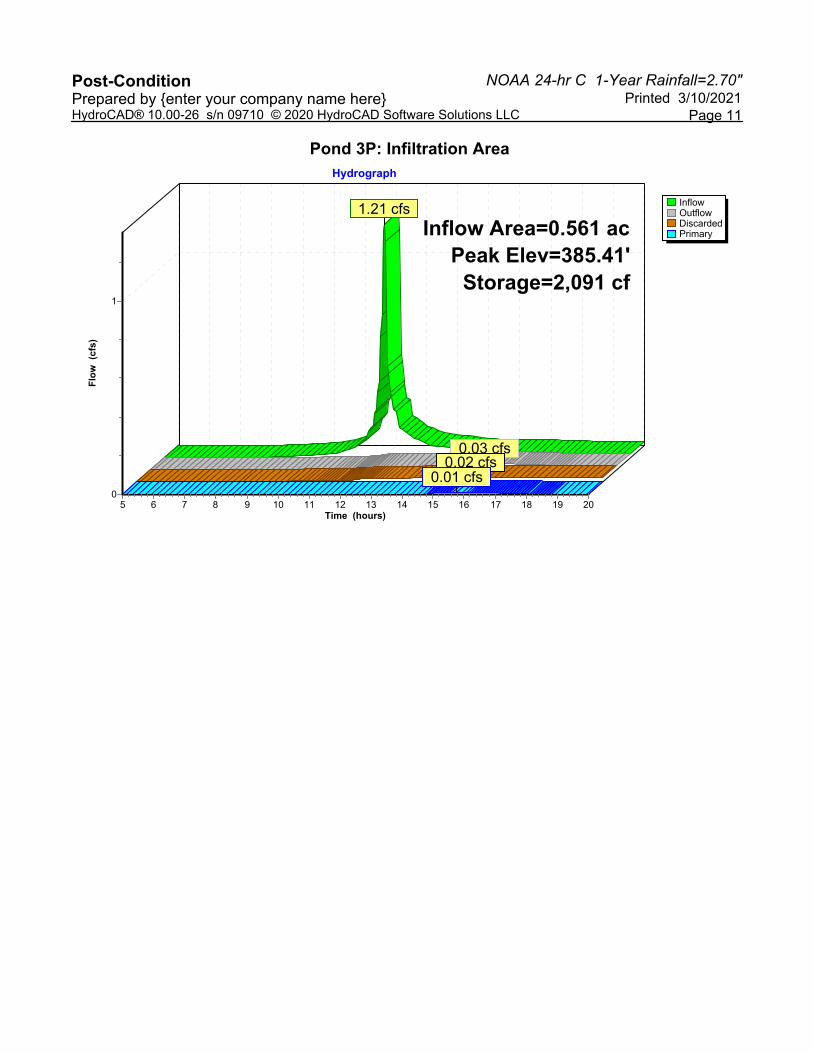
NOAA 24-hr C 1-Year Rainfall=2.70"Post-Condition Printed 3/10/2021Prepared by {enter your company name here}
Page 11HydroCAD® 10.00-26 s/n 09710 © 2020 HydroCAD Software Solutions LLC
Pond 3P: Infiltration Area
InflowOutflowDiscardedPrimary
Hydrograph
Time (hours)201918171615141312111098765
Flo
w (
cfs)
1
0
Inflow Area=0.561 acPeak Elev=385.41'
Storage=2,091 cf
1.21 cfs
0.03 cfs0.02 cfs
0.01 cfs

NOAA 24-hr C 2-Year Rainfall=3.30"Post-Condition Printed 3/10/2021Prepared by {enter your company name here}
Page 12HydroCAD® 10.00-26 s/n 09710 © 2020 HydroCAD Software Solutions LLC
Time span=5.00-20.00 hrs, dt=0.05 hrs, 301 pointsRunoff by SCS TR-20 method, UH=SCS, Weighted-CN
Reach routing by Stor-Ind+Trans method - Pond routing by Stor-Ind method
Runoff Area=0.561 ac 71.66% Impervious Runoff Depth>1.86"Subcatchment 3S: Post Flow Length=192' Tc=1.2 min CN=87 Runoff=1.62 cfs 0.087 af
Runoff Area=0.561 ac 44.03% Impervious Runoff Depth>1.11"Subcatchment 4S: Pre-Condition Flow Length=192' Slope=0.0400 '/' Tc=1.7 min CN=76 Runoff=1.03 cfs 0.052 af
Inflow=0.15 cfs 0.024 afReach 4R: Reach Outflow=0.15 cfs 0.024 af
Peak Elev=385.46' Storage=2,248 cf Inflow=1.62 cfs 0.087 afPond 3P: Infiltration Area Discarded=0.02 cfs 0.016 af Primary=0.15 cfs 0.024 af Outflow=0.18 cfs 0.039 af
Total Runoff Area = 1.122 ac Runoff Volume = 0.139 af Average Runoff Depth = 1.49"42.16% Pervious = 0.473 ac 57.84% Impervious = 0.649 ac
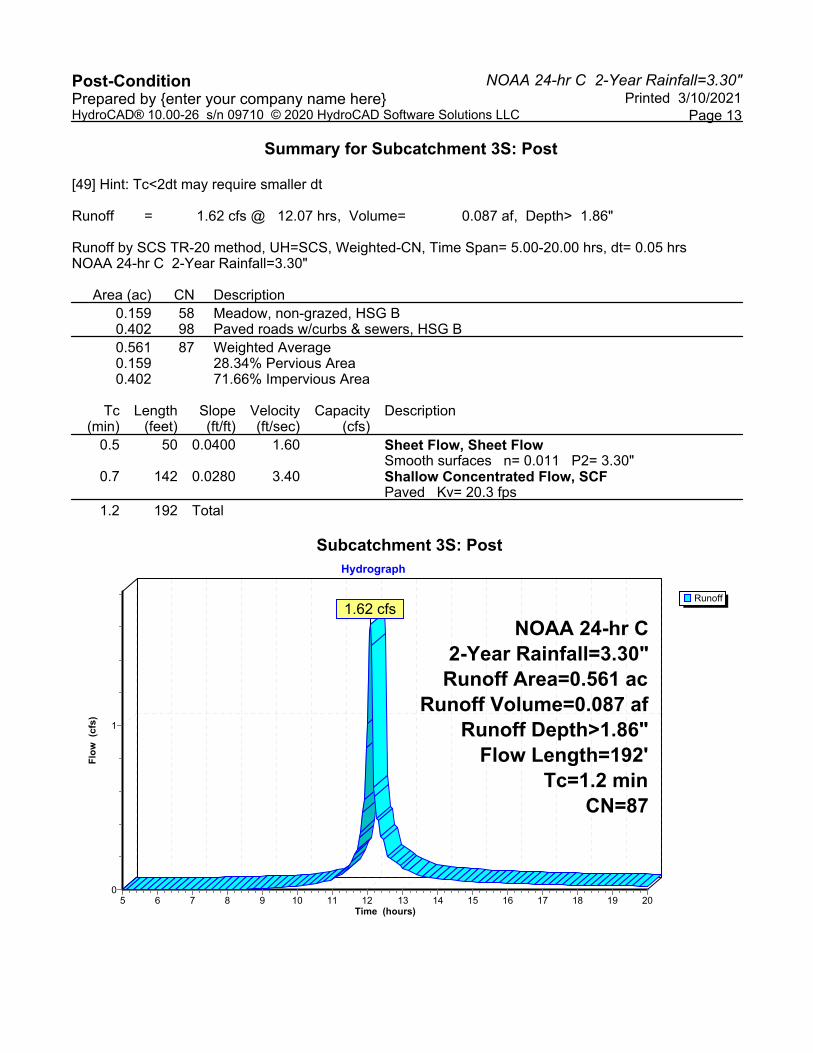
NOAA 24-hr C 2-Year Rainfall=3.30"Post-Condition Printed 3/10/2021Prepared by {enter your company name here}
Page 13HydroCAD® 10.00-26 s/n 09710 © 2020 HydroCAD Software Solutions LLC
Summary for Subcatchment 3S: Post
[49] Hint: Tc<2dt may require smaller dt
Runoff = 1.62 cfs @ 12.07 hrs, Volume= 0.087 af, Depth> 1.86"
Runoff by SCS TR-20 method, UH=SCS, Weighted-CN, Time Span= 5.00-20.00 hrs, dt= 0.05 hrsNOAA 24-hr C 2-Year Rainfall=3.30"
Area (ac) CN Description0.159 58 Meadow, non-grazed, HSG B0.402 98 Paved roads w/curbs & sewers, HSG B0.561 87 Weighted Average0.159 28.34% Pervious Area0.402 71.66% Impervious Area
Tc Length Slope Velocity Capacity Description(min) (feet) (ft/ft) (ft/sec) (cfs)
0.5 50 0.0400 1.60 Sheet Flow, Sheet FlowSmooth surfaces n= 0.011 P2= 3.30"
0.7 142 0.0280 3.40 Shallow Concentrated Flow, SCFPaved Kv= 20.3 fps
1.2 192 Total
Subcatchment 3S: Post
Runoff
Hydrograph
Time (hours)201918171615141312111098765
Flo
w (
cfs) 1
0
NOAA 24-hr C2-Year Rainfall=3.30"
Runoff Area=0.561 acRunoff Volume=0.087 af
Runoff Depth>1.86"Flow Length=192'
Tc=1.2 minCN=87
1.62 cfs
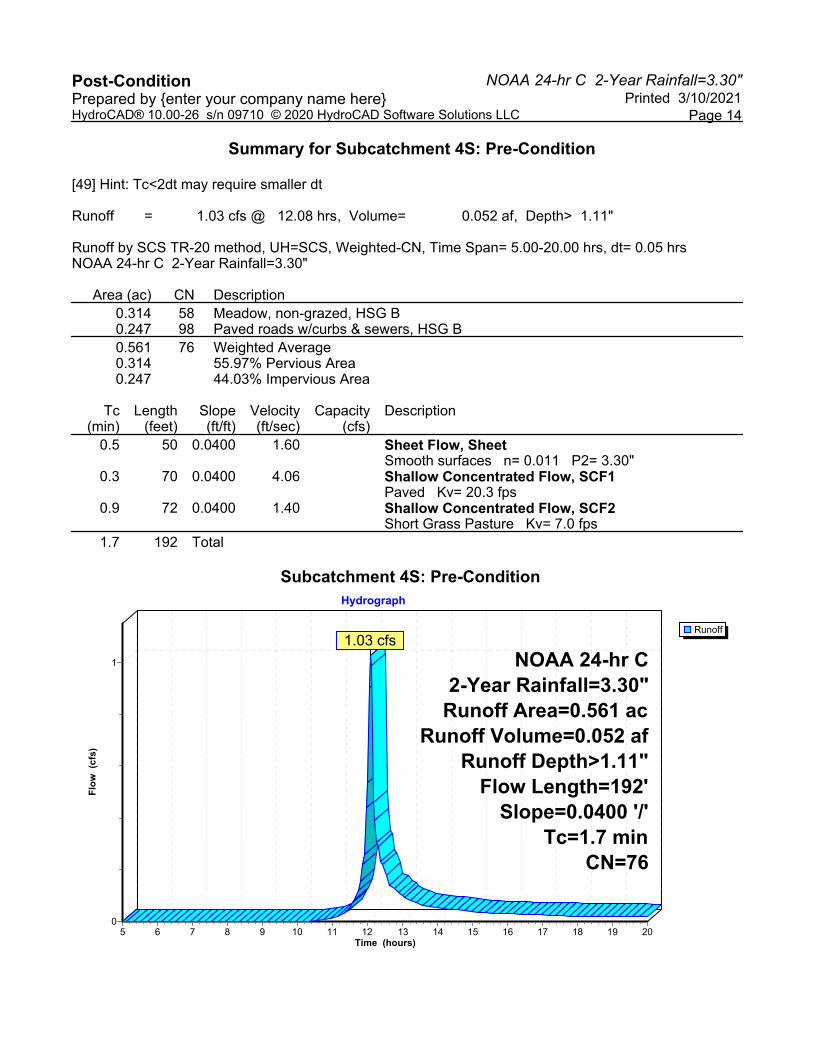
NOAA 24-hr C 2-Year Rainfall=3.30"Post-Condition Printed 3/10/2021Prepared by {enter your company name here}
Page 14HydroCAD® 10.00-26 s/n 09710 © 2020 HydroCAD Software Solutions LLC
Summary for Subcatchment 4S: Pre-Condition
[49] Hint: Tc<2dt may require smaller dt
Runoff = 1.03 cfs @ 12.08 hrs, Volume= 0.052 af, Depth> 1.11"
Runoff by SCS TR-20 method, UH=SCS, Weighted-CN, Time Span= 5.00-20.00 hrs, dt= 0.05 hrsNOAA 24-hr C 2-Year Rainfall=3.30"
Area (ac) CN Description0.314 58 Meadow, non-grazed, HSG B0.247 98 Paved roads w/curbs & sewers, HSG B0.561 76 Weighted Average0.314 55.97% Pervious Area0.247 44.03% Impervious Area
Tc Length Slope Velocity Capacity Description(min) (feet) (ft/ft) (ft/sec) (cfs)
0.5 50 0.0400 1.60 Sheet Flow, SheetSmooth surfaces n= 0.011 P2= 3.30"
0.3 70 0.0400 4.06 Shallow Concentrated Flow, SCF1Paved Kv= 20.3 fps
0.9 72 0.0400 1.40 Shallow Concentrated Flow, SCF2Short Grass Pasture Kv= 7.0 fps
1.7 192 Total
Subcatchment 4S: Pre-Condition
Runoff
Hydrograph
Time (hours)201918171615141312111098765
Flo
w (
cfs)
1
0
NOAA 24-hr C2-Year Rainfall=3.30"
Runoff Area=0.561 acRunoff Volume=0.052 af
Runoff Depth>1.11"Flow Length=192'
Slope=0.0400 '/'Tc=1.7 min
CN=76
1.03 cfs
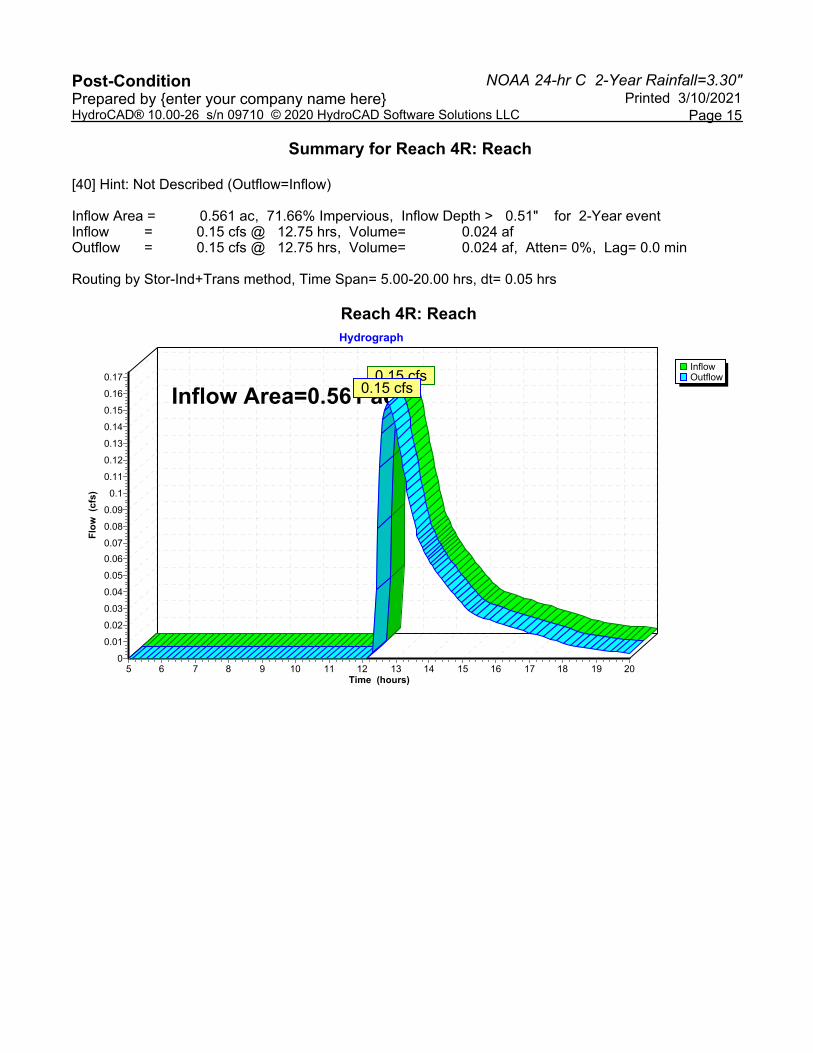
NOAA 24-hr C 2-Year Rainfall=3.30"Post-Condition Printed 3/10/2021Prepared by {enter your company name here}
Page 15HydroCAD® 10.00-26 s/n 09710 © 2020 HydroCAD Software Solutions LLC
Summary for Reach 4R: Reach
[40] Hint: Not Described (Outflow=Inflow)
Inflow Area = 0.561 ac, 71.66% Impervious, Inflow Depth > 0.51" for 2-Year eventInflow = 0.15 cfs @ 12.75 hrs, Volume= 0.024 afOutflow = 0.15 cfs @ 12.75 hrs, Volume= 0.024 af, Atten= 0%, Lag= 0.0 min
Routing by Stor-Ind+Trans method, Time Span= 5.00-20.00 hrs, dt= 0.05 hrs
Reach 4R: Reach
InflowOutflow
Hydrograph
Time (hours)201918171615141312111098765
Flo
w (
cfs)
0.17
0.16
0.15
0.14
0.13
0.12
0.11
0.1
0.09
0.08
0.07
0.06
0.05
0.04
0.03
0.02
0.01
0
Inflow Area=0.561 ac0.15 cfs
0.15 cfs
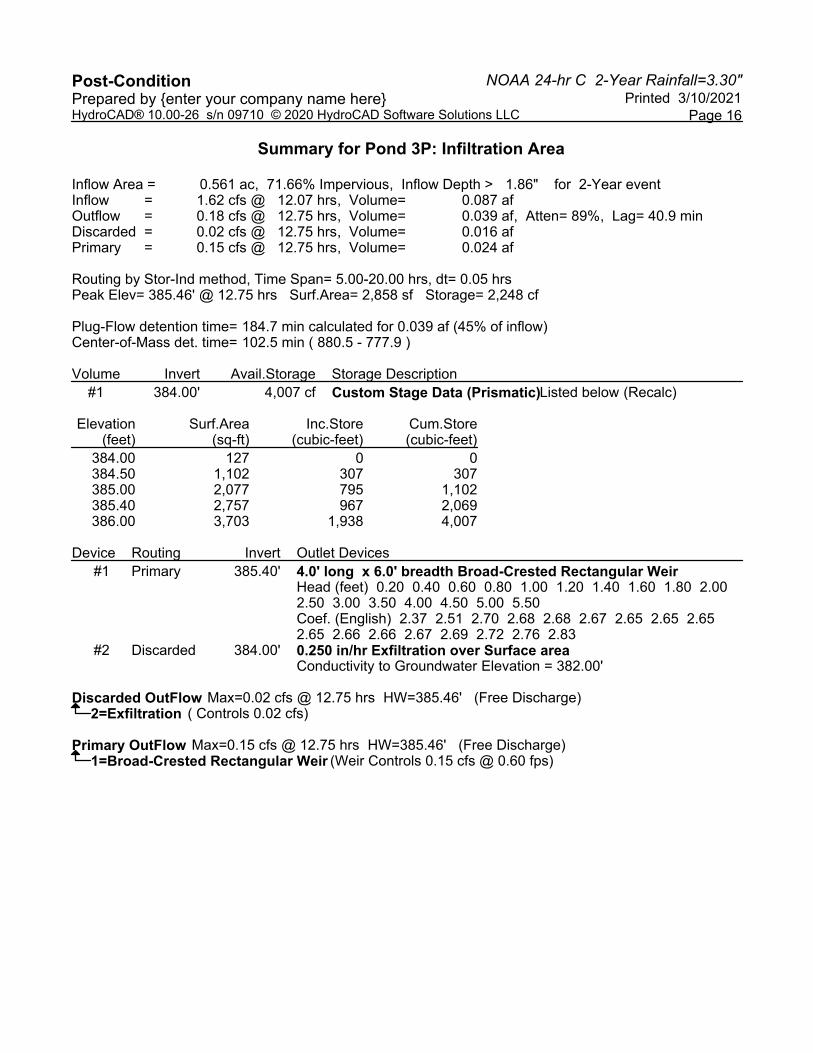
NOAA 24-hr C 2-Year Rainfall=3.30"Post-Condition Printed 3/10/2021Prepared by {enter your company name here}
Page 16HydroCAD® 10.00-26 s/n 09710 © 2020 HydroCAD Software Solutions LLC
Summary for Pond 3P: Infiltration Area
Inflow Area = 0.561 ac, 71.66% Impervious, Inflow Depth > 1.86" for 2-Year eventInflow = 1.62 cfs @ 12.07 hrs, Volume= 0.087 afOutflow = 0.18 cfs @ 12.75 hrs, Volume= 0.039 af, Atten= 89%, Lag= 40.9 minDiscarded = 0.02 cfs @ 12.75 hrs, Volume= 0.016 afPrimary = 0.15 cfs @ 12.75 hrs, Volume= 0.024 af
Routing by Stor-Ind method, Time Span= 5.00-20.00 hrs, dt= 0.05 hrsPeak Elev= 385.46' @ 12.75 hrs Surf.Area= 2,858 sf Storage= 2,248 cf
Plug-Flow detention time= 184.7 min calculated for 0.039 af (45% of inflow)Center-of-Mass det. time= 102.5 min ( 880.5 - 777.9 )
Volume Invert Avail.Storage Storage Description#1 384.00' 4,007 cf Custom Stage Data (Prismatic) Listed below (Recalc)
Elevation Surf.Area Inc.Store Cum.Store(feet) (sq-ft) (cubic-feet) (cubic-feet)
384.00 127 0 0384.50 1,102 307 307385.00 2,077 795 1,102385.40 2,757 967 2,069386.00 3,703 1,938 4,007
Device Routing Invert Outlet Devices#1 Primary 385.40' 4.0' long x 6.0' breadth Broad-Crested Rectangular Weir
Head (feet) 0.20 0.40 0.60 0.80 1.00 1.20 1.40 1.60 1.80 2.00 2.50 3.00 3.50 4.00 4.50 5.00 5.50 Coef. (English) 2.37 2.51 2.70 2.68 2.68 2.67 2.65 2.65 2.65 2.65 2.66 2.66 2.67 2.69 2.72 2.76 2.83
#2 Discarded 384.00' 0.250 in/hr Exfiltration over Surface area Conductivity to Groundwater Elevation = 382.00'
Discarded OutFlow Max=0.02 cfs @ 12.75 hrs HW=385.46' (Free Discharge)2=Exfiltration ( Controls 0.02 cfs)
Primary OutFlow Max=0.15 cfs @ 12.75 hrs HW=385.46' (Free Discharge)1=Broad-Crested Rectangular Weir (Weir Controls 0.15 cfs @ 0.60 fps)
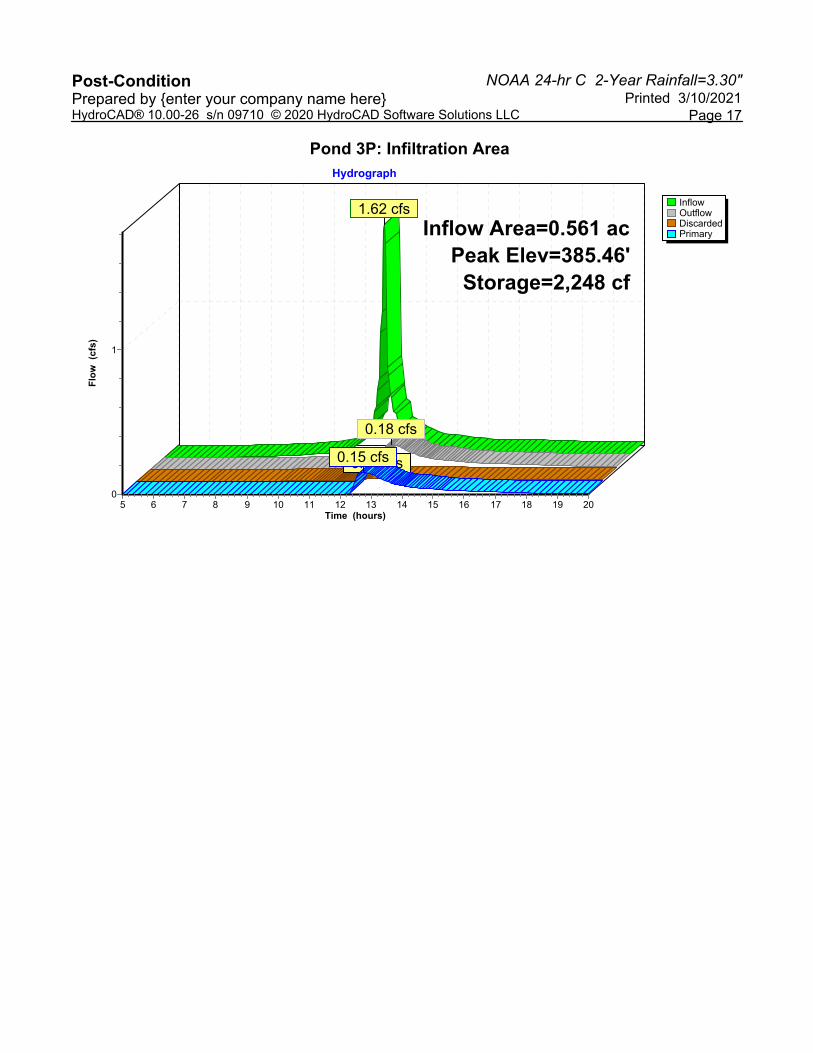
NOAA 24-hr C 2-Year Rainfall=3.30"Post-Condition Printed 3/10/2021Prepared by {enter your company name here}
Page 17HydroCAD® 10.00-26 s/n 09710 © 2020 HydroCAD Software Solutions LLC
Pond 3P: Infiltration Area
InflowOutflowDiscardedPrimary
Hydrograph
Time (hours)201918171615141312111098765
Flo
w (
cfs) 1
0
Inflow Area=0.561 acPeak Elev=385.46'
Storage=2,248 cf
1.62 cfs
0.18 cfs
0.02 cfs0.15 cfs

NOAA 24-hr C 10-Year Rainfall=4.90"Post-Condition Printed 3/10/2021Prepared by {enter your company name here}
Page 18HydroCAD® 10.00-26 s/n 09710 © 2020 HydroCAD Software Solutions LLC
Time span=5.00-20.00 hrs, dt=0.05 hrs, 301 pointsRunoff by SCS TR-20 method, UH=SCS, Weighted-CN
Reach routing by Stor-Ind+Trans method - Pond routing by Stor-Ind method
Runoff Area=0.561 ac 71.66% Impervious Runoff Depth>3.25"Subcatchment 3S: Post Flow Length=192' Tc=1.2 min CN=87 Runoff=2.74 cfs 0.152 af
Runoff Area=0.561 ac 44.03% Impervious Runoff Depth>2.26"Subcatchment 4S: Pre-Condition Flow Length=192' Slope=0.0400 '/' Tc=1.7 min CN=76 Runoff=2.06 cfs 0.106 af
Inflow=1.39 cfs 0.086 afReach 4R: Reach Outflow=1.39 cfs 0.086 af
Peak Elev=385.67' Storage=2,884 cf Inflow=2.74 cfs 0.152 afPond 3P: Infiltration Area Discarded=0.03 cfs 0.017 af Primary=1.39 cfs 0.086 af Outflow=1.42 cfs 0.104 af
Total Runoff Area = 1.122 ac Runoff Volume = 0.257 af Average Runoff Depth = 2.75"42.16% Pervious = 0.473 ac 57.84% Impervious = 0.649 ac

NOAA 24-hr C 10-Year Rainfall=4.90"Post-Condition Printed 3/10/2021Prepared by {enter your company name here}
Page 19HydroCAD® 10.00-26 s/n 09710 © 2020 HydroCAD Software Solutions LLC
Summary for Subcatchment 3S: Post
[49] Hint: Tc<2dt may require smaller dt
Runoff = 2.74 cfs @ 12.07 hrs, Volume= 0.152 af, Depth> 3.25"
Runoff by SCS TR-20 method, UH=SCS, Weighted-CN, Time Span= 5.00-20.00 hrs, dt= 0.05 hrsNOAA 24-hr C 10-Year Rainfall=4.90"
Area (ac) CN Description0.159 58 Meadow, non-grazed, HSG B0.402 98 Paved roads w/curbs & sewers, HSG B0.561 87 Weighted Average0.159 28.34% Pervious Area0.402 71.66% Impervious Area
Tc Length Slope Velocity Capacity Description(min) (feet) (ft/ft) (ft/sec) (cfs)
0.5 50 0.0400 1.60 Sheet Flow, Sheet FlowSmooth surfaces n= 0.011 P2= 3.30"
0.7 142 0.0280 3.40 Shallow Concentrated Flow, SCFPaved Kv= 20.3 fps
1.2 192 Total
Subcatchment 3S: Post
Runoff
Hydrograph
Time (hours)201918171615141312111098765
Flo
w (
cfs)
3
2
1
0
NOAA 24-hr C10-Year Rainfall=4.90"Runoff Area=0.561 ac
Runoff Volume=0.152 afRunoff Depth>3.25"
Flow Length=192'Tc=1.2 min
CN=87
2.74 cfs
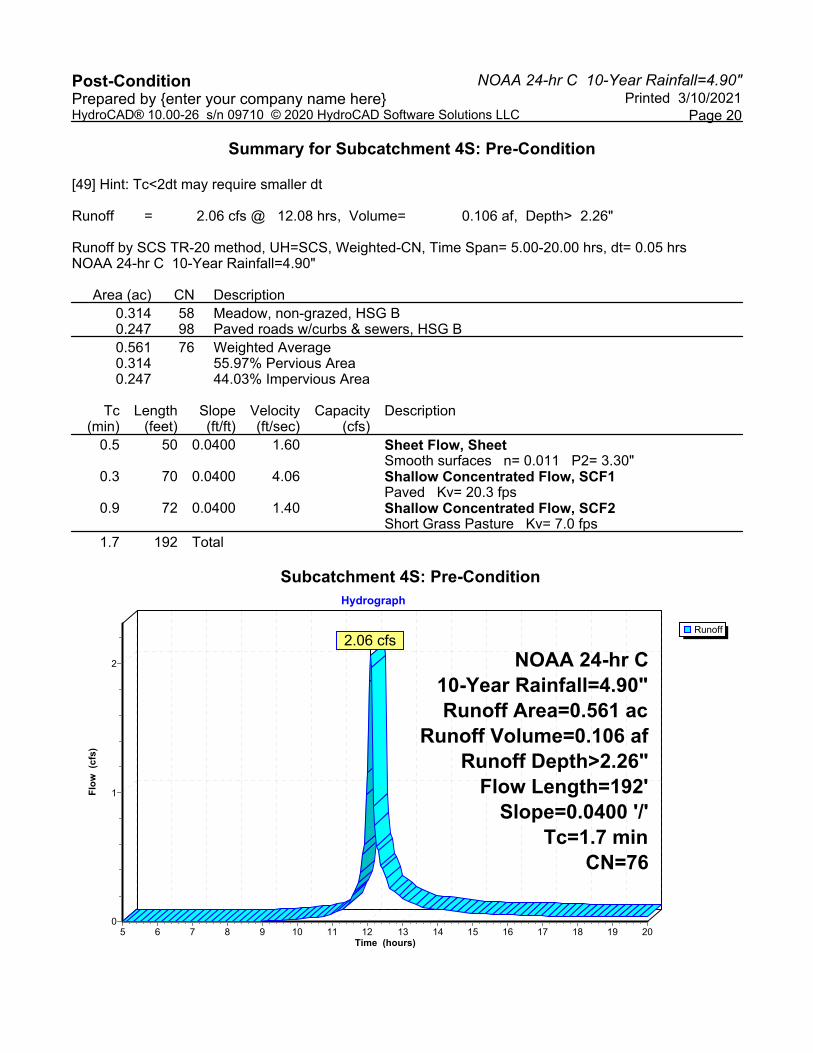
NOAA 24-hr C 10-Year Rainfall=4.90"Post-Condition Printed 3/10/2021Prepared by {enter your company name here}
Page 20HydroCAD® 10.00-26 s/n 09710 © 2020 HydroCAD Software Solutions LLC
Summary for Subcatchment 4S: Pre-Condition
[49] Hint: Tc<2dt may require smaller dt
Runoff = 2.06 cfs @ 12.08 hrs, Volume= 0.106 af, Depth> 2.26"
Runoff by SCS TR-20 method, UH=SCS, Weighted-CN, Time Span= 5.00-20.00 hrs, dt= 0.05 hrsNOAA 24-hr C 10-Year Rainfall=4.90"
Area (ac) CN Description0.314 58 Meadow, non-grazed, HSG B0.247 98 Paved roads w/curbs & sewers, HSG B0.561 76 Weighted Average0.314 55.97% Pervious Area0.247 44.03% Impervious Area
Tc Length Slope Velocity Capacity Description(min) (feet) (ft/ft) (ft/sec) (cfs)
0.5 50 0.0400 1.60 Sheet Flow, SheetSmooth surfaces n= 0.011 P2= 3.30"
0.3 70 0.0400 4.06 Shallow Concentrated Flow, SCF1Paved Kv= 20.3 fps
0.9 72 0.0400 1.40 Shallow Concentrated Flow, SCF2Short Grass Pasture Kv= 7.0 fps
1.7 192 Total
Subcatchment 4S: Pre-Condition
Runoff
Hydrograph
Time (hours)201918171615141312111098765
Flo
w (
cfs)
2
1
0
NOAA 24-hr C10-Year Rainfall=4.90"Runoff Area=0.561 ac
Runoff Volume=0.106 afRunoff Depth>2.26"
Flow Length=192'Slope=0.0400 '/'
Tc=1.7 minCN=76
2.06 cfs
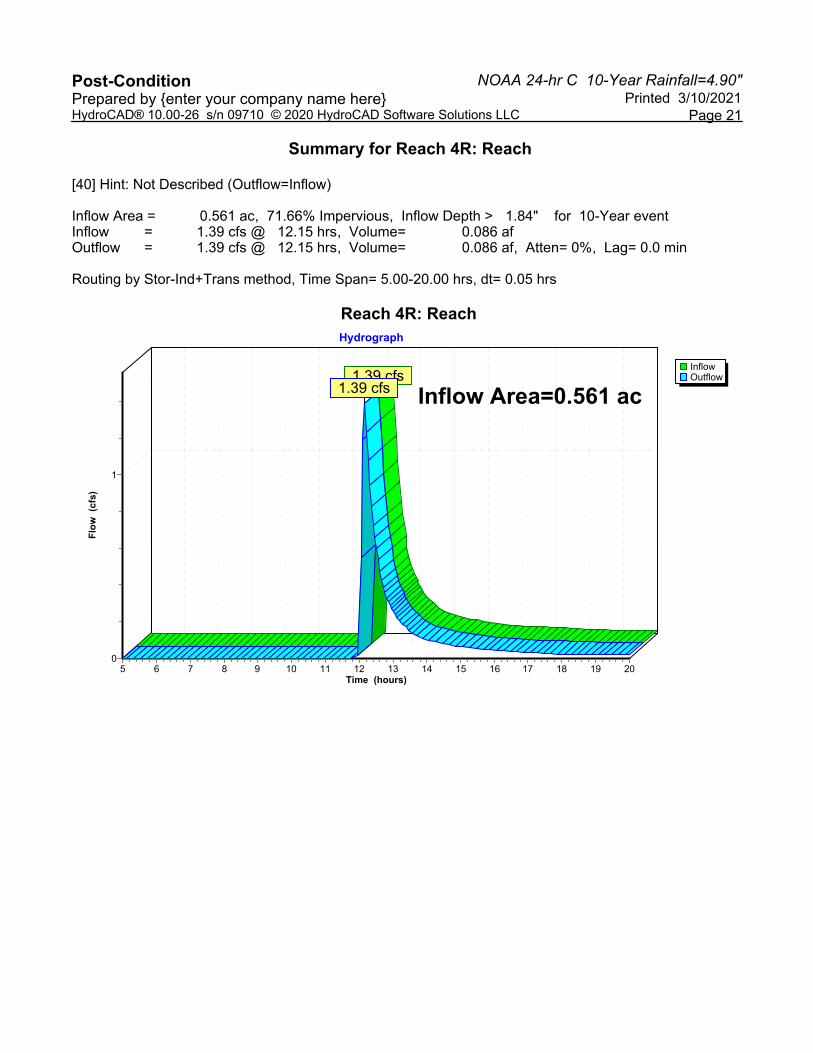
NOAA 24-hr C 10-Year Rainfall=4.90"Post-Condition Printed 3/10/2021Prepared by {enter your company name here}
Page 21HydroCAD® 10.00-26 s/n 09710 © 2020 HydroCAD Software Solutions LLC
Summary for Reach 4R: Reach
[40] Hint: Not Described (Outflow=Inflow)
Inflow Area = 0.561 ac, 71.66% Impervious, Inflow Depth > 1.84" for 10-Year eventInflow = 1.39 cfs @ 12.15 hrs, Volume= 0.086 afOutflow = 1.39 cfs @ 12.15 hrs, Volume= 0.086 af, Atten= 0%, Lag= 0.0 min
Routing by Stor-Ind+Trans method, Time Span= 5.00-20.00 hrs, dt= 0.05 hrs
Reach 4R: Reach
InflowOutflow
Hydrograph
Time (hours)201918171615141312111098765
Flo
w (
cfs)
1
0
Inflow Area=0.561 ac1.39 cfs
1.39 cfs
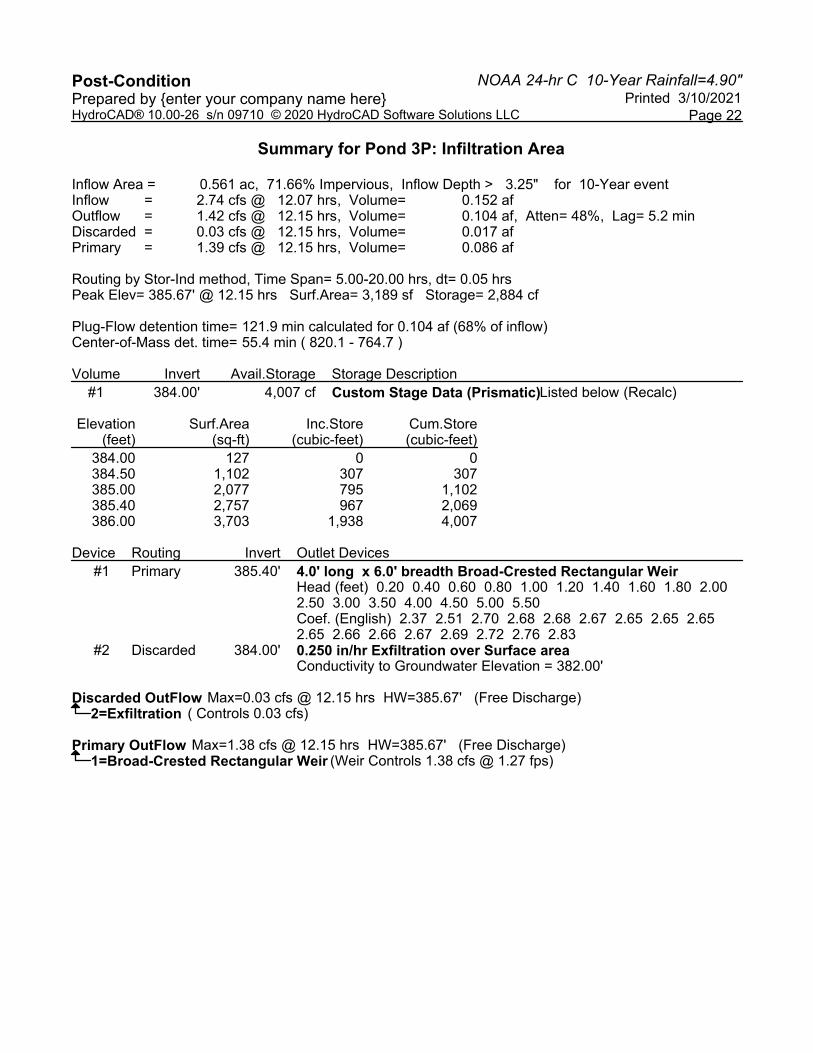
NOAA 24-hr C 10-Year Rainfall=4.90"Post-Condition Printed 3/10/2021Prepared by {enter your company name here}
Page 22HydroCAD® 10.00-26 s/n 09710 © 2020 HydroCAD Software Solutions LLC
Summary for Pond 3P: Infiltration Area
Inflow Area = 0.561 ac, 71.66% Impervious, Inflow Depth > 3.25" for 10-Year eventInflow = 2.74 cfs @ 12.07 hrs, Volume= 0.152 afOutflow = 1.42 cfs @ 12.15 hrs, Volume= 0.104 af, Atten= 48%, Lag= 5.2 minDiscarded = 0.03 cfs @ 12.15 hrs, Volume= 0.017 afPrimary = 1.39 cfs @ 12.15 hrs, Volume= 0.086 af
Routing by Stor-Ind method, Time Span= 5.00-20.00 hrs, dt= 0.05 hrsPeak Elev= 385.67' @ 12.15 hrs Surf.Area= 3,189 sf Storage= 2,884 cf
Plug-Flow detention time= 121.9 min calculated for 0.104 af (68% of inflow)Center-of-Mass det. time= 55.4 min ( 820.1 - 764.7 )
Volume Invert Avail.Storage Storage Description#1 384.00' 4,007 cf Custom Stage Data (Prismatic) Listed below (Recalc)
Elevation Surf.Area Inc.Store Cum.Store(feet) (sq-ft) (cubic-feet) (cubic-feet)
384.00 127 0 0384.50 1,102 307 307385.00 2,077 795 1,102385.40 2,757 967 2,069386.00 3,703 1,938 4,007
Device Routing Invert Outlet Devices#1 Primary 385.40' 4.0' long x 6.0' breadth Broad-Crested Rectangular Weir
Head (feet) 0.20 0.40 0.60 0.80 1.00 1.20 1.40 1.60 1.80 2.00 2.50 3.00 3.50 4.00 4.50 5.00 5.50 Coef. (English) 2.37 2.51 2.70 2.68 2.68 2.67 2.65 2.65 2.65 2.65 2.66 2.66 2.67 2.69 2.72 2.76 2.83
#2 Discarded 384.00' 0.250 in/hr Exfiltration over Surface area Conductivity to Groundwater Elevation = 382.00'
Discarded OutFlow Max=0.03 cfs @ 12.15 hrs HW=385.67' (Free Discharge)2=Exfiltration ( Controls 0.03 cfs)
Primary OutFlow Max=1.38 cfs @ 12.15 hrs HW=385.67' (Free Discharge)1=Broad-Crested Rectangular Weir (Weir Controls 1.38 cfs @ 1.27 fps)
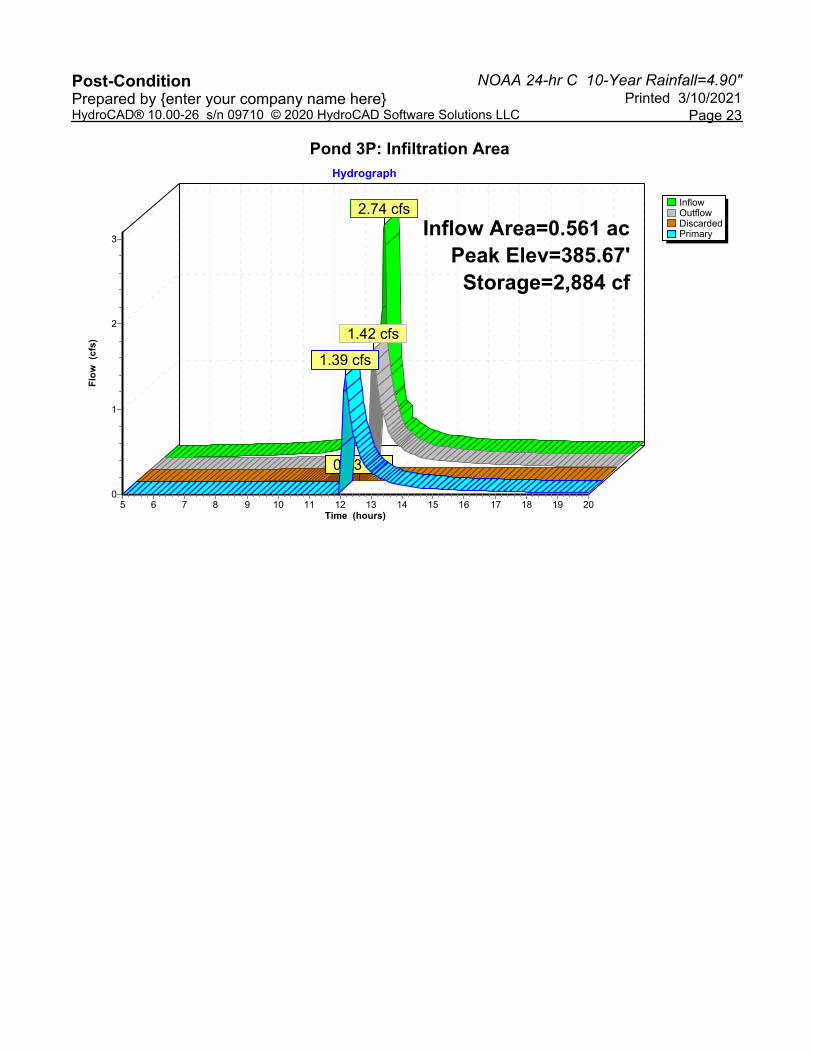
NOAA 24-hr C 10-Year Rainfall=4.90"Post-Condition Printed 3/10/2021Prepared by {enter your company name here}
Page 23HydroCAD® 10.00-26 s/n 09710 © 2020 HydroCAD Software Solutions LLC
Pond 3P: Infiltration Area
InflowOutflowDiscardedPrimary
Hydrograph
Time (hours)201918171615141312111098765
Flo
w (
cfs)
3
2
1
0
Inflow Area=0.561 acPeak Elev=385.67'
Storage=2,884 cf
2.74 cfs
1.42 cfs
0.03 cfs
1.39 cfs

NOAA 24-hr C 25-Year Rainfall=6.00"Post-Condition Printed 3/10/2021Prepared by {enter your company name here}
Page 24HydroCAD® 10.00-26 s/n 09710 © 2020 HydroCAD Software Solutions LLC
Time span=5.00-20.00 hrs, dt=0.05 hrs, 301 pointsRunoff by SCS TR-20 method, UH=SCS, Weighted-CN
Reach routing by Stor-Ind+Trans method - Pond routing by Stor-Ind method
Runoff Area=0.561 ac 71.66% Impervious Runoff Depth>4.23"Subcatchment 3S: Post Flow Length=192' Tc=1.2 min CN=87 Runoff=3.51 cfs 0.198 af
Runoff Area=0.561 ac 44.03% Impervious Runoff Depth>3.13"Subcatchment 4S: Pre-Condition Flow Length=192' Slope=0.0400 '/' Tc=1.7 min CN=76 Runoff=2.82 cfs 0.146 af
Inflow=2.40 cfs 0.131 afReach 4R: Reach Outflow=2.40 cfs 0.131 af
Peak Elev=385.79' Storage=3,254 cf Inflow=3.51 cfs 0.198 afPond 3P: Infiltration Area Discarded=0.03 cfs 0.019 af Primary=2.40 cfs 0.131 af Outflow=2.43 cfs 0.149 af
Total Runoff Area = 1.122 ac Runoff Volume = 0.344 af Average Runoff Depth = 3.68"42.16% Pervious = 0.473 ac 57.84% Impervious = 0.649 ac

NOAA 24-hr C 25-Year Rainfall=6.00"Post-Condition Printed 3/10/2021Prepared by {enter your company name here}
Page 25HydroCAD® 10.00-26 s/n 09710 © 2020 HydroCAD Software Solutions LLC
Summary for Subcatchment 3S: Post
[49] Hint: Tc<2dt may require smaller dt
Runoff = 3.51 cfs @ 12.07 hrs, Volume= 0.198 af, Depth> 4.23"
Runoff by SCS TR-20 method, UH=SCS, Weighted-CN, Time Span= 5.00-20.00 hrs, dt= 0.05 hrsNOAA 24-hr C 25-Year Rainfall=6.00"
Area (ac) CN Description0.159 58 Meadow, non-grazed, HSG B0.402 98 Paved roads w/curbs & sewers, HSG B0.561 87 Weighted Average0.159 28.34% Pervious Area0.402 71.66% Impervious Area
Tc Length Slope Velocity Capacity Description(min) (feet) (ft/ft) (ft/sec) (cfs)
0.5 50 0.0400 1.60 Sheet Flow, Sheet FlowSmooth surfaces n= 0.011 P2= 3.30"
0.7 142 0.0280 3.40 Shallow Concentrated Flow, SCFPaved Kv= 20.3 fps
1.2 192 Total
Subcatchment 3S: Post
Runoff
Hydrograph
Time (hours)201918171615141312111098765
Flo
w (
cfs)
3
2
1
0
NOAA 24-hr C25-Year Rainfall=6.00"Runoff Area=0.561 ac
Runoff Volume=0.198 afRunoff Depth>4.23"
Flow Length=192'Tc=1.2 min
CN=87
3.51 cfs

NOAA 24-hr C 25-Year Rainfall=6.00"Post-Condition Printed 3/10/2021Prepared by {enter your company name here}
Page 26HydroCAD® 10.00-26 s/n 09710 © 2020 HydroCAD Software Solutions LLC
Summary for Subcatchment 4S: Pre-Condition
[49] Hint: Tc<2dt may require smaller dt
Runoff = 2.82 cfs @ 12.08 hrs, Volume= 0.146 af, Depth> 3.13"
Runoff by SCS TR-20 method, UH=SCS, Weighted-CN, Time Span= 5.00-20.00 hrs, dt= 0.05 hrsNOAA 24-hr C 25-Year Rainfall=6.00"
Area (ac) CN Description0.314 58 Meadow, non-grazed, HSG B0.247 98 Paved roads w/curbs & sewers, HSG B0.561 76 Weighted Average0.314 55.97% Pervious Area0.247 44.03% Impervious Area
Tc Length Slope Velocity Capacity Description(min) (feet) (ft/ft) (ft/sec) (cfs)
0.5 50 0.0400 1.60 Sheet Flow, SheetSmooth surfaces n= 0.011 P2= 3.30"
0.3 70 0.0400 4.06 Shallow Concentrated Flow, SCF1Paved Kv= 20.3 fps
0.9 72 0.0400 1.40 Shallow Concentrated Flow, SCF2Short Grass Pasture Kv= 7.0 fps
1.7 192 Total
Subcatchment 4S: Pre-Condition
Runoff
Hydrograph
Time (hours)201918171615141312111098765
Flo
w (
cfs)
3
2
1
0
NOAA 24-hr C25-Year Rainfall=6.00"Runoff Area=0.561 ac
Runoff Volume=0.146 afRunoff Depth>3.13"
Flow Length=192'Slope=0.0400 '/'
Tc=1.7 minCN=76
2.82 cfs

NOAA 24-hr C 25-Year Rainfall=6.00"Post-Condition Printed 3/10/2021Prepared by {enter your company name here}
Page 27HydroCAD® 10.00-26 s/n 09710 © 2020 HydroCAD Software Solutions LLC
Summary for Reach 4R: Reach
[40] Hint: Not Described (Outflow=Inflow)
Inflow Area = 0.561 ac, 71.66% Impervious, Inflow Depth > 2.79" for 25-Year eventInflow = 2.40 cfs @ 12.12 hrs, Volume= 0.131 afOutflow = 2.40 cfs @ 12.12 hrs, Volume= 0.131 af, Atten= 0%, Lag= 0.0 min
Routing by Stor-Ind+Trans method, Time Span= 5.00-20.00 hrs, dt= 0.05 hrs
Reach 4R: Reach
InflowOutflow
Hydrograph
Time (hours)201918171615141312111098765
Flo
w (
cfs)
2
1
0
Inflow Area=0.561 ac2.40 cfs
2.40 cfs
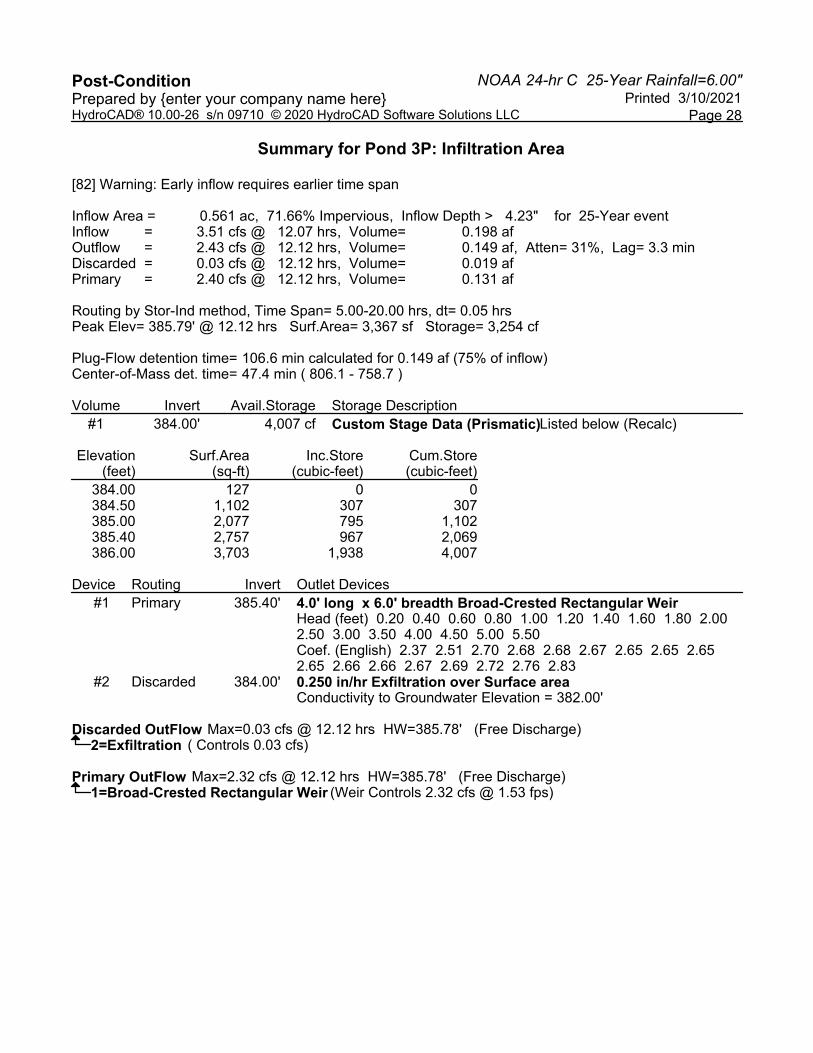
NOAA 24-hr C 25-Year Rainfall=6.00"Post-Condition Printed 3/10/2021Prepared by {enter your company name here}
Page 28HydroCAD® 10.00-26 s/n 09710 © 2020 HydroCAD Software Solutions LLC
Summary for Pond 3P: Infiltration Area
[82] Warning: Early inflow requires earlier time span
Inflow Area = 0.561 ac, 71.66% Impervious, Inflow Depth > 4.23" for 25-Year eventInflow = 3.51 cfs @ 12.07 hrs, Volume= 0.198 afOutflow = 2.43 cfs @ 12.12 hrs, Volume= 0.149 af, Atten= 31%, Lag= 3.3 minDiscarded = 0.03 cfs @ 12.12 hrs, Volume= 0.019 afPrimary = 2.40 cfs @ 12.12 hrs, Volume= 0.131 af
Routing by Stor-Ind method, Time Span= 5.00-20.00 hrs, dt= 0.05 hrsPeak Elev= 385.79' @ 12.12 hrs Surf.Area= 3,367 sf Storage= 3,254 cf
Plug-Flow detention time= 106.6 min calculated for 0.149 af (75% of inflow)Center-of-Mass det. time= 47.4 min ( 806.1 - 758.7 )
Volume Invert Avail.Storage Storage Description#1 384.00' 4,007 cf Custom Stage Data (Prismatic) Listed below (Recalc)
Elevation Surf.Area Inc.Store Cum.Store(feet) (sq-ft) (cubic-feet) (cubic-feet)
384.00 127 0 0384.50 1,102 307 307385.00 2,077 795 1,102385.40 2,757 967 2,069386.00 3,703 1,938 4,007
Device Routing Invert Outlet Devices#1 Primary 385.40' 4.0' long x 6.0' breadth Broad-Crested Rectangular Weir
Head (feet) 0.20 0.40 0.60 0.80 1.00 1.20 1.40 1.60 1.80 2.00 2.50 3.00 3.50 4.00 4.50 5.00 5.50 Coef. (English) 2.37 2.51 2.70 2.68 2.68 2.67 2.65 2.65 2.65 2.65 2.66 2.66 2.67 2.69 2.72 2.76 2.83
#2 Discarded 384.00' 0.250 in/hr Exfiltration over Surface area Conductivity to Groundwater Elevation = 382.00'
Discarded OutFlow Max=0.03 cfs @ 12.12 hrs HW=385.78' (Free Discharge)2=Exfiltration ( Controls 0.03 cfs)
Primary OutFlow Max=2.32 cfs @ 12.12 hrs HW=385.78' (Free Discharge)1=Broad-Crested Rectangular Weir (Weir Controls 2.32 cfs @ 1.53 fps)

NOAA 24-hr C 25-Year Rainfall=6.00"Post-Condition Printed 3/10/2021Prepared by {enter your company name here}
Page 29HydroCAD® 10.00-26 s/n 09710 © 2020 HydroCAD Software Solutions LLC
Pond 3P: Infiltration Area
InflowOutflowDiscardedPrimary
Hydrograph
Time (hours)201918171615141312111098765
Flo
w (
cfs)
3
2
1
0
Inflow Area=0.561 acPeak Elev=385.79'
Storage=3,254 cf
3.51 cfs
2.43 cfs
0.03 cfs
2.40 cfs

NOAA 24-hr C 50-Year Rainfall=6.53"Post-Condition Printed 3/10/2021Prepared by {enter your company name here}
Page 30HydroCAD® 10.00-26 s/n 09710 © 2020 HydroCAD Software Solutions LLC
Time span=5.00-20.00 hrs, dt=0.05 hrs, 301 pointsRunoff by SCS TR-20 method, UH=SCS, Weighted-CN
Reach routing by Stor-Ind+Trans method - Pond routing by Stor-Ind method
Runoff Area=0.561 ac 71.66% Impervious Runoff Depth>4.71"Subcatchment 3S: Post Flow Length=192' Tc=1.2 min CN=87 Runoff=3.88 cfs 0.220 af
Runoff Area=0.561 ac 44.03% Impervious Runoff Depth>3.56"Subcatchment 4S: Pre-Condition Flow Length=192' Slope=0.0400 '/' Tc=1.7 min CN=76 Runoff=3.19 cfs 0.167 af
Inflow=2.79 cfs 0.152 afReach 4R: Reach Outflow=2.79 cfs 0.152 af
Peak Elev=385.82' Storage=3,379 cf Inflow=3.88 cfs 0.220 afPond 3P: Infiltration Area Discarded=0.03 cfs 0.019 af Primary=2.79 cfs 0.152 af Outflow=2.82 cfs 0.171 af
Total Runoff Area = 1.122 ac Runoff Volume = 0.387 af Average Runoff Depth = 4.14"42.16% Pervious = 0.473 ac 57.84% Impervious = 0.649 ac
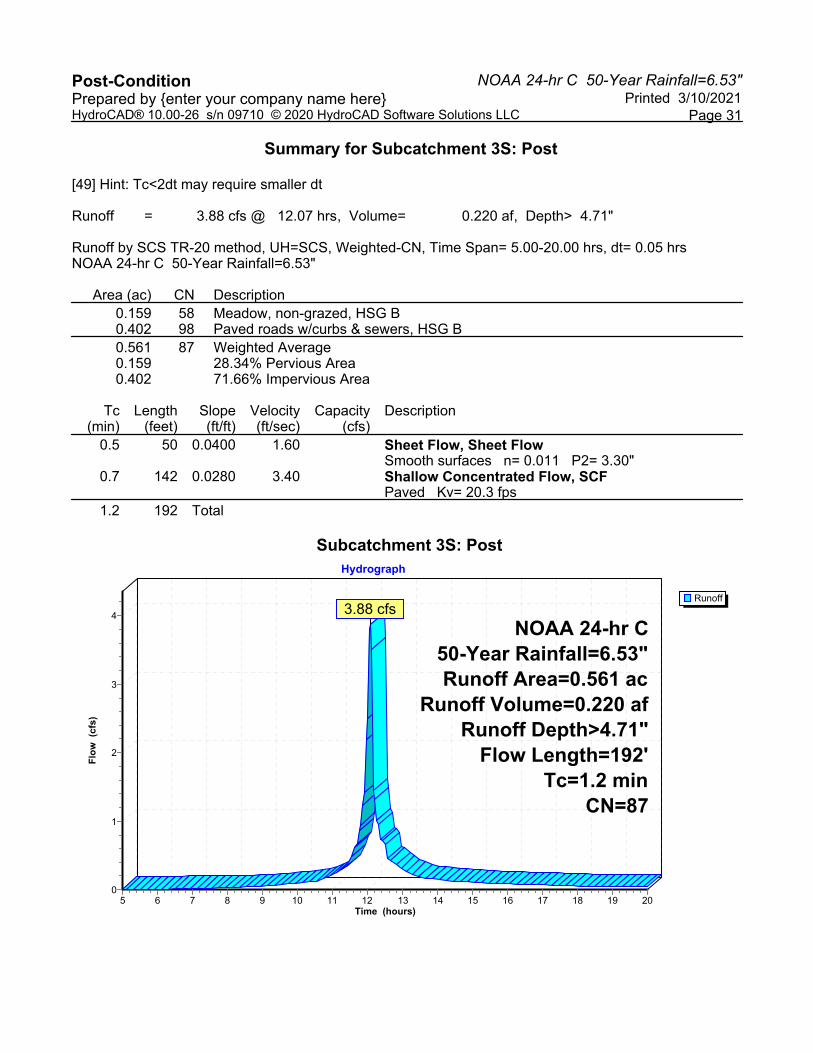
NOAA 24-hr C 50-Year Rainfall=6.53"Post-Condition Printed 3/10/2021Prepared by {enter your company name here}
Page 31HydroCAD® 10.00-26 s/n 09710 © 2020 HydroCAD Software Solutions LLC
Summary for Subcatchment 3S: Post
[49] Hint: Tc<2dt may require smaller dt
Runoff = 3.88 cfs @ 12.07 hrs, Volume= 0.220 af, Depth> 4.71"
Runoff by SCS TR-20 method, UH=SCS, Weighted-CN, Time Span= 5.00-20.00 hrs, dt= 0.05 hrsNOAA 24-hr C 50-Year Rainfall=6.53"
Area (ac) CN Description0.159 58 Meadow, non-grazed, HSG B0.402 98 Paved roads w/curbs & sewers, HSG B0.561 87 Weighted Average0.159 28.34% Pervious Area0.402 71.66% Impervious Area
Tc Length Slope Velocity Capacity Description(min) (feet) (ft/ft) (ft/sec) (cfs)
0.5 50 0.0400 1.60 Sheet Flow, Sheet FlowSmooth surfaces n= 0.011 P2= 3.30"
0.7 142 0.0280 3.40 Shallow Concentrated Flow, SCFPaved Kv= 20.3 fps
1.2 192 Total
Subcatchment 3S: Post
Runoff
Hydrograph
Time (hours)201918171615141312111098765
Flo
w (
cfs)
4
3
2
1
0
NOAA 24-hr C50-Year Rainfall=6.53"Runoff Area=0.561 ac
Runoff Volume=0.220 afRunoff Depth>4.71"
Flow Length=192'Tc=1.2 min
CN=87
3.88 cfs

NOAA 24-hr C 50-Year Rainfall=6.53"Post-Condition Printed 3/10/2021Prepared by {enter your company name here}
Page 32HydroCAD® 10.00-26 s/n 09710 © 2020 HydroCAD Software Solutions LLC
Summary for Subcatchment 4S: Pre-Condition
[49] Hint: Tc<2dt may require smaller dt
Runoff = 3.19 cfs @ 12.08 hrs, Volume= 0.167 af, Depth> 3.56"
Runoff by SCS TR-20 method, UH=SCS, Weighted-CN, Time Span= 5.00-20.00 hrs, dt= 0.05 hrsNOAA 24-hr C 50-Year Rainfall=6.53"
Area (ac) CN Description0.314 58 Meadow, non-grazed, HSG B0.247 98 Paved roads w/curbs & sewers, HSG B0.561 76 Weighted Average0.314 55.97% Pervious Area0.247 44.03% Impervious Area
Tc Length Slope Velocity Capacity Description(min) (feet) (ft/ft) (ft/sec) (cfs)
0.5 50 0.0400 1.60 Sheet Flow, SheetSmooth surfaces n= 0.011 P2= 3.30"
0.3 70 0.0400 4.06 Shallow Concentrated Flow, SCF1Paved Kv= 20.3 fps
0.9 72 0.0400 1.40 Shallow Concentrated Flow, SCF2Short Grass Pasture Kv= 7.0 fps
1.7 192 Total
Subcatchment 4S: Pre-Condition
Runoff
Hydrograph
Time (hours)201918171615141312111098765
Flo
w (
cfs)
3
2
1
0
NOAA 24-hr C50-Year Rainfall=6.53"Runoff Area=0.561 ac
Runoff Volume=0.167 afRunoff Depth>3.56"
Flow Length=192'Slope=0.0400 '/'
Tc=1.7 minCN=76
3.19 cfs
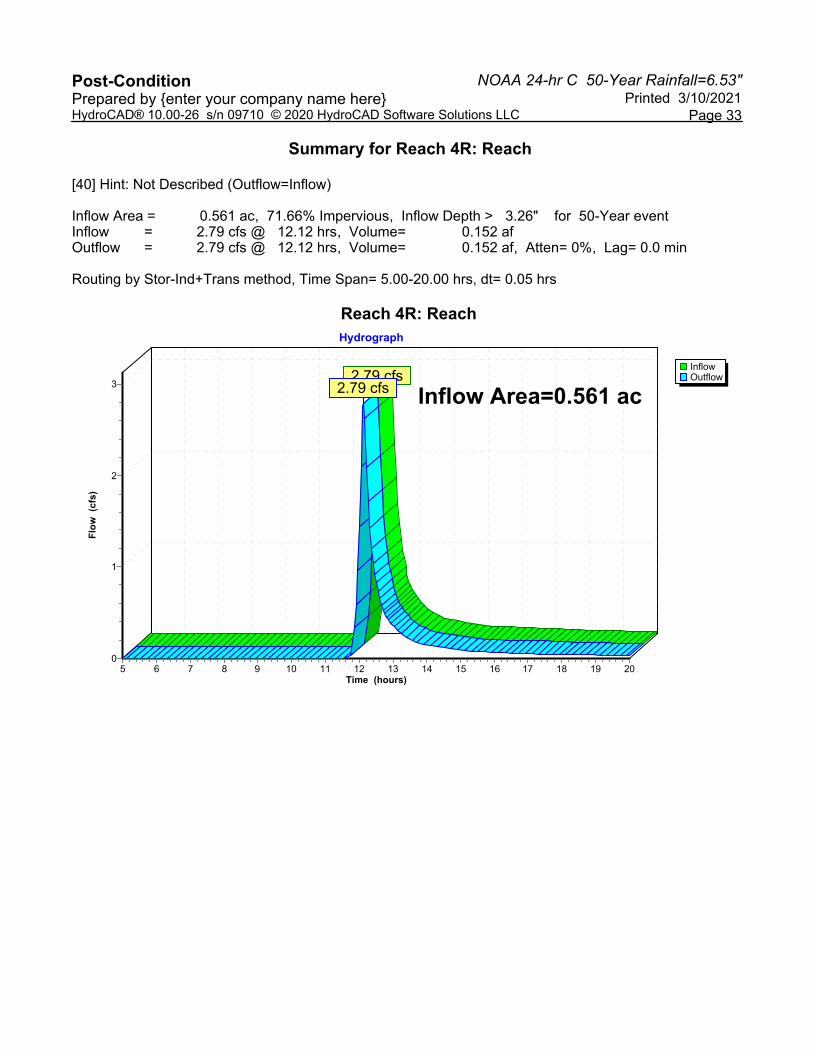
NOAA 24-hr C 50-Year Rainfall=6.53"Post-Condition Printed 3/10/2021Prepared by {enter your company name here}
Page 33HydroCAD® 10.00-26 s/n 09710 © 2020 HydroCAD Software Solutions LLC
Summary for Reach 4R: Reach
[40] Hint: Not Described (Outflow=Inflow)
Inflow Area = 0.561 ac, 71.66% Impervious, Inflow Depth > 3.26" for 50-Year eventInflow = 2.79 cfs @ 12.12 hrs, Volume= 0.152 afOutflow = 2.79 cfs @ 12.12 hrs, Volume= 0.152 af, Atten= 0%, Lag= 0.0 min
Routing by Stor-Ind+Trans method, Time Span= 5.00-20.00 hrs, dt= 0.05 hrs
Reach 4R: Reach
InflowOutflow
Hydrograph
Time (hours)201918171615141312111098765
Flo
w (
cfs)
3
2
1
0
Inflow Area=0.561 ac2.79 cfs
2.79 cfs

NOAA 24-hr C 50-Year Rainfall=6.53"Post-Condition Printed 3/10/2021Prepared by {enter your company name here}
Page 34HydroCAD® 10.00-26 s/n 09710 © 2020 HydroCAD Software Solutions LLC
Summary for Pond 3P: Infiltration Area
[82] Warning: Early inflow requires earlier time span
Inflow Area = 0.561 ac, 71.66% Impervious, Inflow Depth > 4.71" for 50-Year eventInflow = 3.88 cfs @ 12.07 hrs, Volume= 0.220 afOutflow = 2.82 cfs @ 12.12 hrs, Volume= 0.171 af, Atten= 27%, Lag= 3.0 minDiscarded = 0.03 cfs @ 12.12 hrs, Volume= 0.019 afPrimary = 2.79 cfs @ 12.12 hrs, Volume= 0.152 af
Routing by Stor-Ind method, Time Span= 5.00-20.00 hrs, dt= 0.05 hrsPeak Elev= 385.82' @ 12.12 hrs Surf.Area= 3,425 sf Storage= 3,379 cf
Plug-Flow detention time= 101.5 min calculated for 0.171 af (78% of inflow)Center-of-Mass det. time= 45.3 min ( 801.7 - 756.4 )
Volume Invert Avail.Storage Storage Description#1 384.00' 4,007 cf Custom Stage Data (Prismatic) Listed below (Recalc)
Elevation Surf.Area Inc.Store Cum.Store(feet) (sq-ft) (cubic-feet) (cubic-feet)
384.00 127 0 0384.50 1,102 307 307385.00 2,077 795 1,102385.40 2,757 967 2,069386.00 3,703 1,938 4,007
Device Routing Invert Outlet Devices#1 Primary 385.40' 4.0' long x 6.0' breadth Broad-Crested Rectangular Weir
Head (feet) 0.20 0.40 0.60 0.80 1.00 1.20 1.40 1.60 1.80 2.00 2.50 3.00 3.50 4.00 4.50 5.00 5.50 Coef. (English) 2.37 2.51 2.70 2.68 2.68 2.67 2.65 2.65 2.65 2.65 2.66 2.66 2.67 2.69 2.72 2.76 2.83
#2 Discarded 384.00' 0.250 in/hr Exfiltration over Surface area Conductivity to Groundwater Elevation = 382.00'
Discarded OutFlow Max=0.03 cfs @ 12.12 hrs HW=385.82' (Free Discharge)2=Exfiltration ( Controls 0.03 cfs)
Primary OutFlow Max=2.71 cfs @ 12.12 hrs HW=385.82' (Free Discharge)1=Broad-Crested Rectangular Weir (Weir Controls 2.71 cfs @ 1.63 fps)
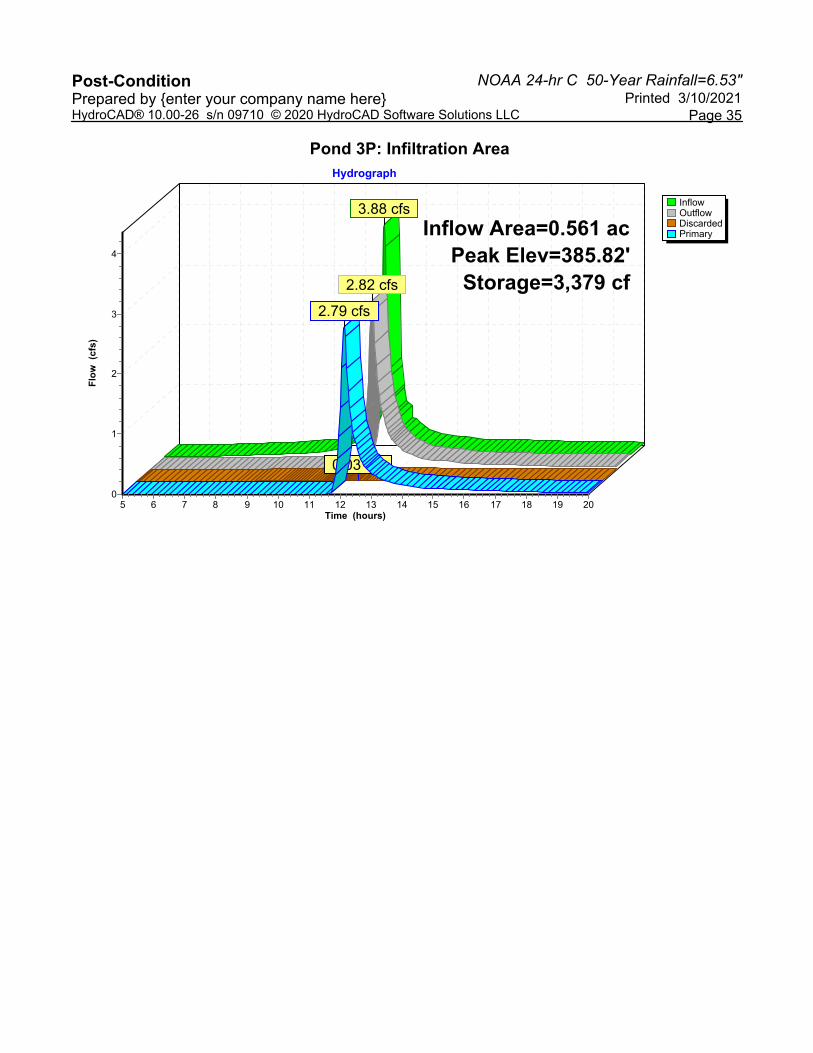
NOAA 24-hr C 50-Year Rainfall=6.53"Post-Condition Printed 3/10/2021Prepared by {enter your company name here}
Page 35HydroCAD® 10.00-26 s/n 09710 © 2020 HydroCAD Software Solutions LLC
Pond 3P: Infiltration Area
InflowOutflowDiscardedPrimary
Hydrograph
Time (hours)201918171615141312111098765
Flo
w (
cfs)
4
3
2
1
0
Inflow Area=0.561 acPeak Elev=385.82'
Storage=3,379 cf
3.88 cfs
2.82 cfs
0.03 cfs
2.79 cfs
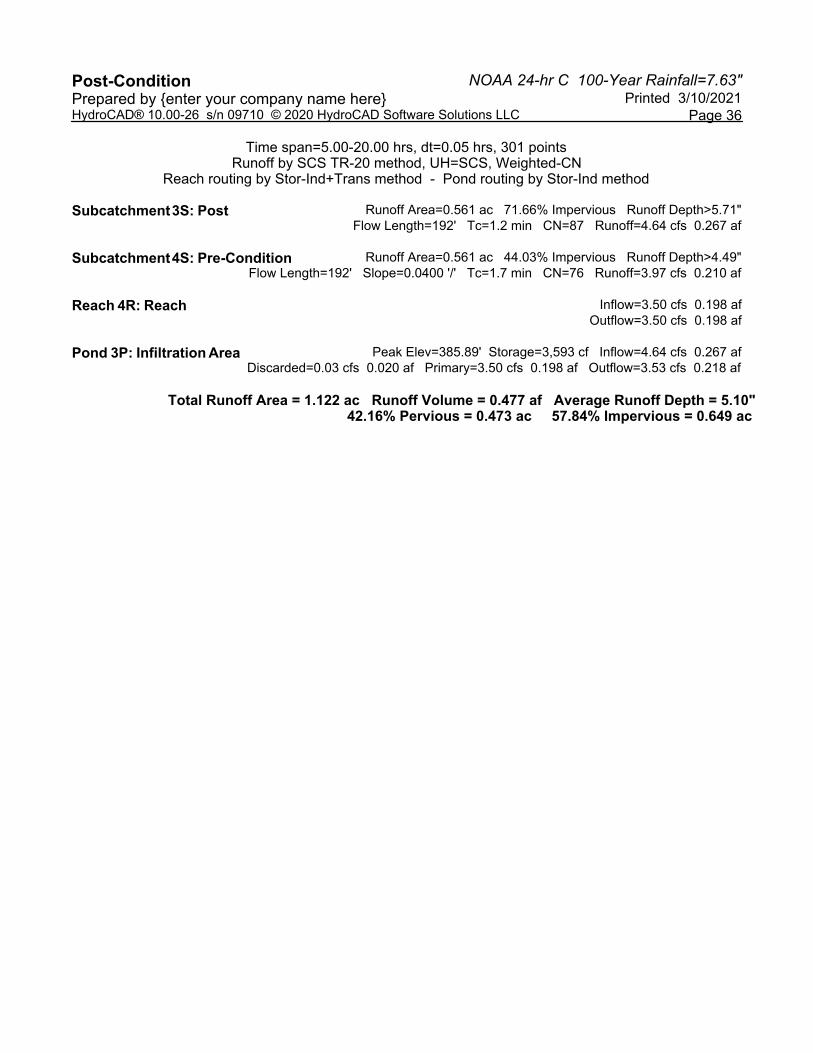
NOAA 24-hr C 100-Year Rainfall=7.63"Post-Condition Printed 3/10/2021Prepared by {enter your company name here}
Page 36HydroCAD® 10.00-26 s/n 09710 © 2020 HydroCAD Software Solutions LLC
Time span=5.00-20.00 hrs, dt=0.05 hrs, 301 pointsRunoff by SCS TR-20 method, UH=SCS, Weighted-CN
Reach routing by Stor-Ind+Trans method - Pond routing by Stor-Ind method
Runoff Area=0.561 ac 71.66% Impervious Runoff Depth>5.71"Subcatchment 3S: Post Flow Length=192' Tc=1.2 min CN=87 Runoff=4.64 cfs 0.267 af
Runoff Area=0.561 ac 44.03% Impervious Runoff Depth>4.49"Subcatchment 4S: Pre-Condition Flow Length=192' Slope=0.0400 '/' Tc=1.7 min CN=76 Runoff=3.97 cfs 0.210 af
Inflow=3.50 cfs 0.198 afReach 4R: Reach Outflow=3.50 cfs 0.198 af
Peak Elev=385.89' Storage=3,593 cf Inflow=4.64 cfs 0.267 afPond 3P: Infiltration Area Discarded=0.03 cfs 0.020 af Primary=3.50 cfs 0.198 af Outflow=3.53 cfs 0.218 af
Total Runoff Area = 1.122 ac Runoff Volume = 0.477 af Average Runoff Depth = 5.10"42.16% Pervious = 0.473 ac 57.84% Impervious = 0.649 ac

NOAA 24-hr C 100-Year Rainfall=7.63"Post-Condition Printed 3/10/2021Prepared by {enter your company name here}
Page 37HydroCAD® 10.00-26 s/n 09710 © 2020 HydroCAD Software Solutions LLC
Summary for Subcatchment 3S: Post
[49] Hint: Tc<2dt may require smaller dt
Runoff = 4.64 cfs @ 12.07 hrs, Volume= 0.267 af, Depth> 5.71"
Runoff by SCS TR-20 method, UH=SCS, Weighted-CN, Time Span= 5.00-20.00 hrs, dt= 0.05 hrsNOAA 24-hr C 100-Year Rainfall=7.63"
Area (ac) CN Description0.159 58 Meadow, non-grazed, HSG B0.402 98 Paved roads w/curbs & sewers, HSG B0.561 87 Weighted Average0.159 28.34% Pervious Area0.402 71.66% Impervious Area
Tc Length Slope Velocity Capacity Description(min) (feet) (ft/ft) (ft/sec) (cfs)
0.5 50 0.0400 1.60 Sheet Flow, Sheet FlowSmooth surfaces n= 0.011 P2= 3.30"
0.7 142 0.0280 3.40 Shallow Concentrated Flow, SCFPaved Kv= 20.3 fps
1.2 192 Total
Subcatchment 3S: Post
Runoff
Hydrograph
Time (hours)201918171615141312111098765
Flo
w (
cfs)
5
4
3
2
1
0
NOAA 24-hr C100-Year Rainfall=7.63"
Runoff Area=0.561 acRunoff Volume=0.267 af
Runoff Depth>5.71"Flow Length=192'
Tc=1.2 minCN=87
4.64 cfs
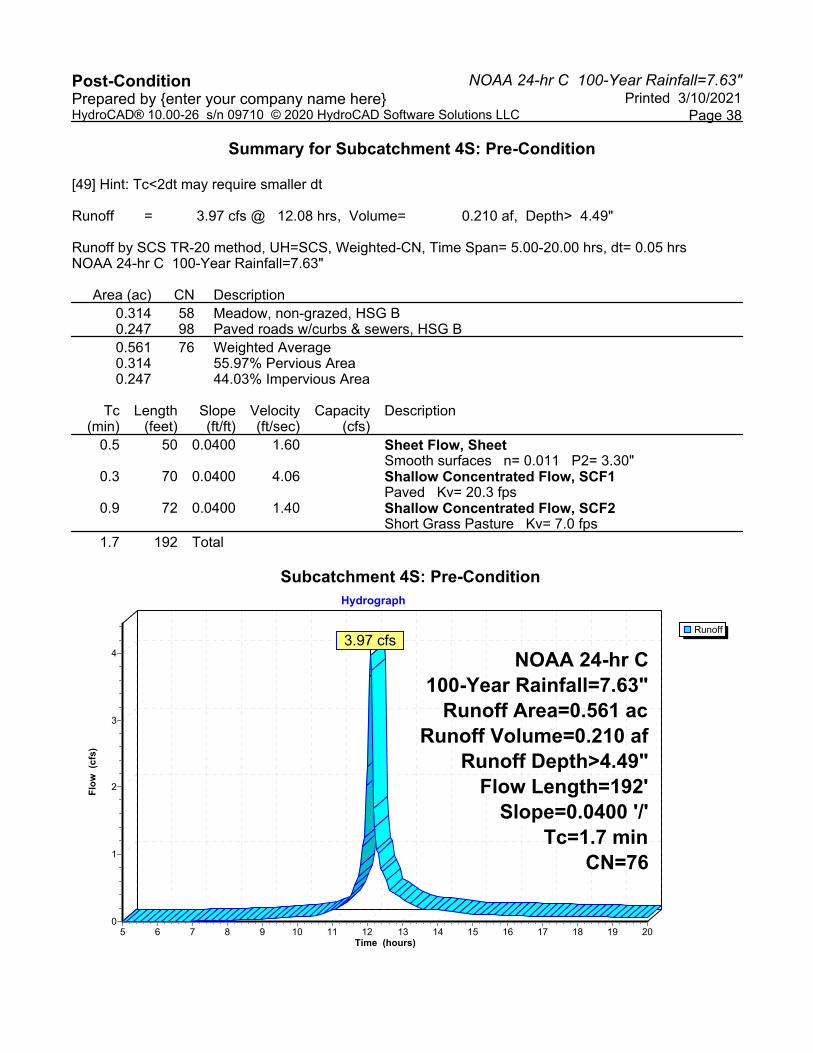
NOAA 24-hr C 100-Year Rainfall=7.63"Post-Condition Printed 3/10/2021Prepared by {enter your company name here}
Page 38HydroCAD® 10.00-26 s/n 09710 © 2020 HydroCAD Software Solutions LLC
Summary for Subcatchment 4S: Pre-Condition
[49] Hint: Tc<2dt may require smaller dt
Runoff = 3.97 cfs @ 12.08 hrs, Volume= 0.210 af, Depth> 4.49"
Runoff by SCS TR-20 method, UH=SCS, Weighted-CN, Time Span= 5.00-20.00 hrs, dt= 0.05 hrsNOAA 24-hr C 100-Year Rainfall=7.63"
Area (ac) CN Description0.314 58 Meadow, non-grazed, HSG B0.247 98 Paved roads w/curbs & sewers, HSG B0.561 76 Weighted Average0.314 55.97% Pervious Area0.247 44.03% Impervious Area
Tc Length Slope Velocity Capacity Description(min) (feet) (ft/ft) (ft/sec) (cfs)
0.5 50 0.0400 1.60 Sheet Flow, SheetSmooth surfaces n= 0.011 P2= 3.30"
0.3 70 0.0400 4.06 Shallow Concentrated Flow, SCF1Paved Kv= 20.3 fps
0.9 72 0.0400 1.40 Shallow Concentrated Flow, SCF2Short Grass Pasture Kv= 7.0 fps
1.7 192 Total
Subcatchment 4S: Pre-Condition
Runoff
Hydrograph
Time (hours)201918171615141312111098765
Flo
w (
cfs)
4
3
2
1
0
NOAA 24-hr C100-Year Rainfall=7.63"
Runoff Area=0.561 acRunoff Volume=0.210 af
Runoff Depth>4.49"Flow Length=192'
Slope=0.0400 '/'Tc=1.7 min
CN=76
3.97 cfs
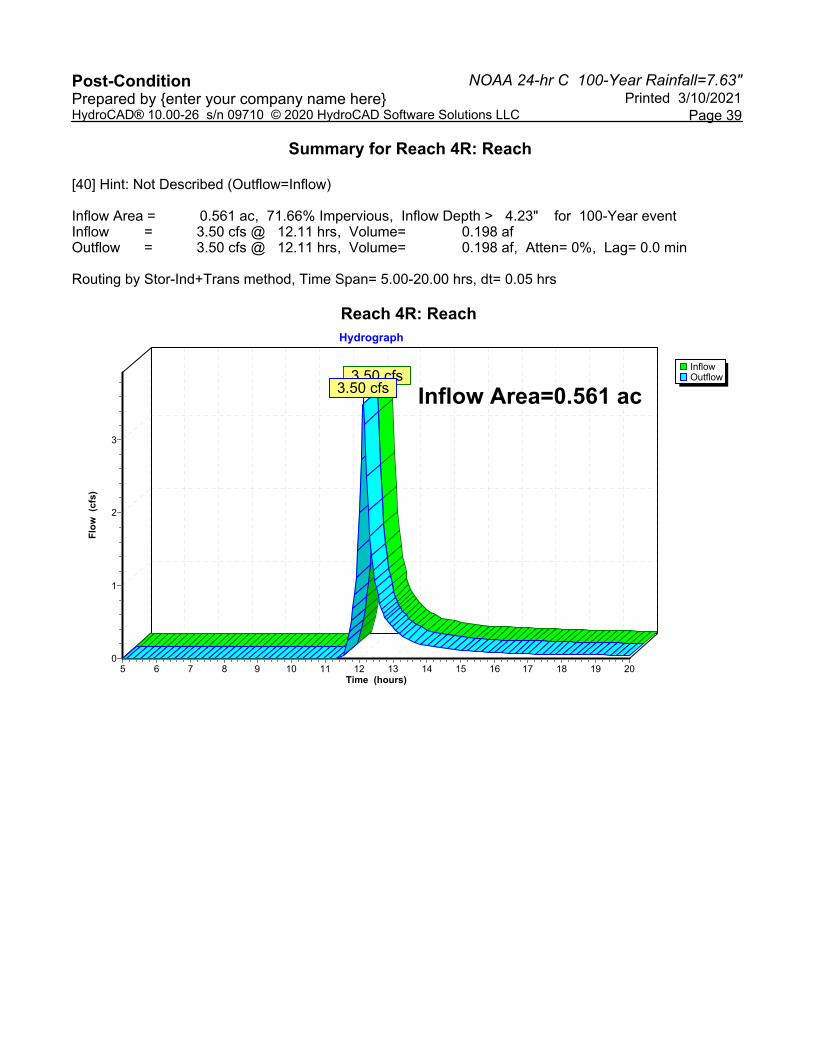
NOAA 24-hr C 100-Year Rainfall=7.63"Post-Condition Printed 3/10/2021Prepared by {enter your company name here}
Page 39HydroCAD® 10.00-26 s/n 09710 © 2020 HydroCAD Software Solutions LLC
Summary for Reach 4R: Reach
[40] Hint: Not Described (Outflow=Inflow)
Inflow Area = 0.561 ac, 71.66% Impervious, Inflow Depth > 4.23" for 100-Year eventInflow = 3.50 cfs @ 12.11 hrs, Volume= 0.198 afOutflow = 3.50 cfs @ 12.11 hrs, Volume= 0.198 af, Atten= 0%, Lag= 0.0 min
Routing by Stor-Ind+Trans method, Time Span= 5.00-20.00 hrs, dt= 0.05 hrs
Reach 4R: Reach
InflowOutflow
Hydrograph
Time (hours)201918171615141312111098765
Flo
w (
cfs)
3
2
1
0
Inflow Area=0.561 ac3.50 cfs
3.50 cfs

NOAA 24-hr C 100-Year Rainfall=7.63"Post-Condition Printed 3/10/2021Prepared by {enter your company name here}
Page 40HydroCAD® 10.00-26 s/n 09710 © 2020 HydroCAD Software Solutions LLC
Summary for Pond 3P: Infiltration Area
[82] Warning: Early inflow requires earlier time span
Inflow Area = 0.561 ac, 71.66% Impervious, Inflow Depth > 5.71" for 100-Year eventInflow = 4.64 cfs @ 12.07 hrs, Volume= 0.267 afOutflow = 3.53 cfs @ 12.11 hrs, Volume= 0.218 af, Atten= 24%, Lag= 2.8 minDiscarded = 0.03 cfs @ 12.11 hrs, Volume= 0.020 afPrimary = 3.50 cfs @ 12.11 hrs, Volume= 0.198 af
Routing by Stor-Ind method, Time Span= 5.00-20.00 hrs, dt= 0.05 hrsPeak Elev= 385.89' @ 12.11 hrs Surf.Area= 3,522 sf Storage= 3,593 cf
Plug-Flow detention time= 92.3 min calculated for 0.217 af (81% of inflow)Center-of-Mass det. time= 42.3 min ( 794.9 - 752.5 )
Volume Invert Avail.Storage Storage Description#1 384.00' 4,007 cf Custom Stage Data (Prismatic) Listed below (Recalc)
Elevation Surf.Area Inc.Store Cum.Store(feet) (sq-ft) (cubic-feet) (cubic-feet)
384.00 127 0 0384.50 1,102 307 307385.00 2,077 795 1,102385.40 2,757 967 2,069386.00 3,703 1,938 4,007
Device Routing Invert Outlet Devices#1 Primary 385.40' 4.0' long x 6.0' breadth Broad-Crested Rectangular Weir
Head (feet) 0.20 0.40 0.60 0.80 1.00 1.20 1.40 1.60 1.80 2.00 2.50 3.00 3.50 4.00 4.50 5.00 5.50 Coef. (English) 2.37 2.51 2.70 2.68 2.68 2.67 2.65 2.65 2.65 2.65 2.66 2.66 2.67 2.69 2.72 2.76 2.83
#2 Discarded 384.00' 0.250 in/hr Exfiltration over Surface area Conductivity to Groundwater Elevation = 382.00'
Discarded OutFlow Max=0.03 cfs @ 12.11 hrs HW=385.88' (Free Discharge)2=Exfiltration ( Controls 0.03 cfs)
Primary OutFlow Max=3.41 cfs @ 12.11 hrs HW=385.88' (Free Discharge)1=Broad-Crested Rectangular Weir (Weir Controls 3.41 cfs @ 1.79 fps)
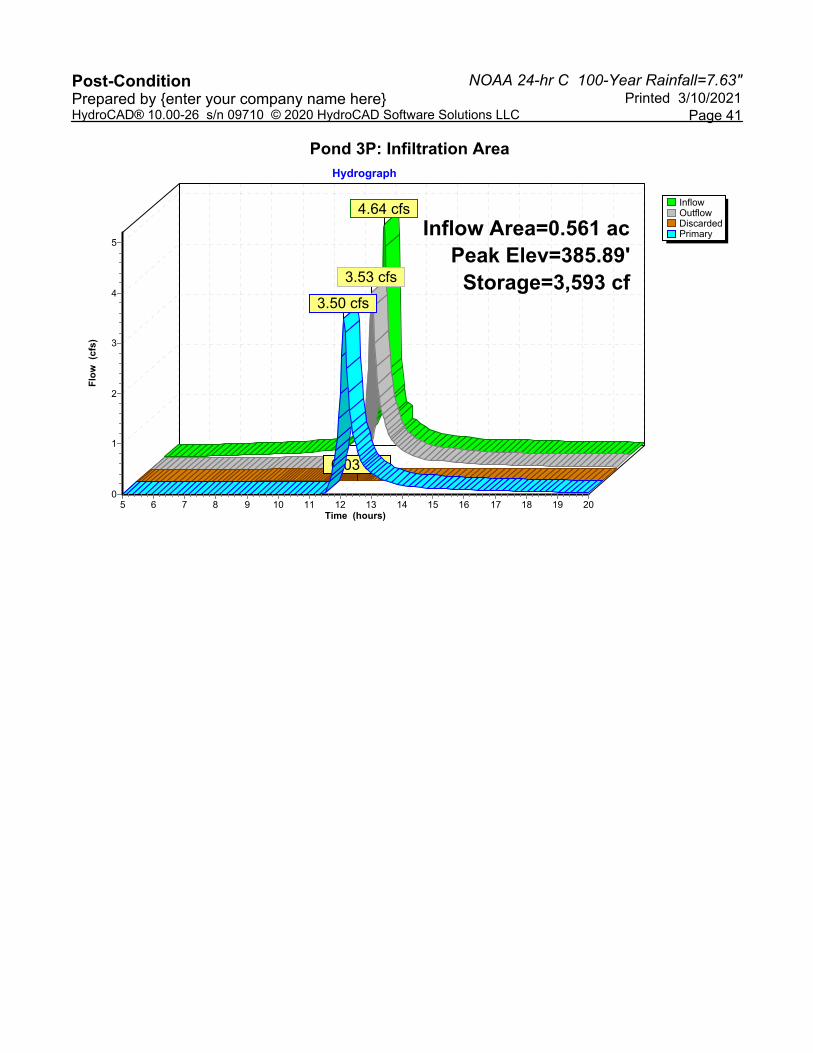
NOAA 24-hr C 100-Year Rainfall=7.63"Post-Condition Printed 3/10/2021Prepared by {enter your company name here}
Page 41HydroCAD® 10.00-26 s/n 09710 © 2020 HydroCAD Software Solutions LLC
Pond 3P: Infiltration Area
InflowOutflowDiscardedPrimary
Hydrograph
Time (hours)201918171615141312111098765
Flo
w (
cfs)
5
4
3
2
1
0
Inflow Area=0.561 acPeak Elev=385.89'
Storage=3,593 cf
4.64 cfs
3.53 cfs
0.03 cfs
3.50 cfs
ATTACHMENT 5 NON-STRUCTURAL AND STRUCTURAL WATER QUALITY
BMPS MAP
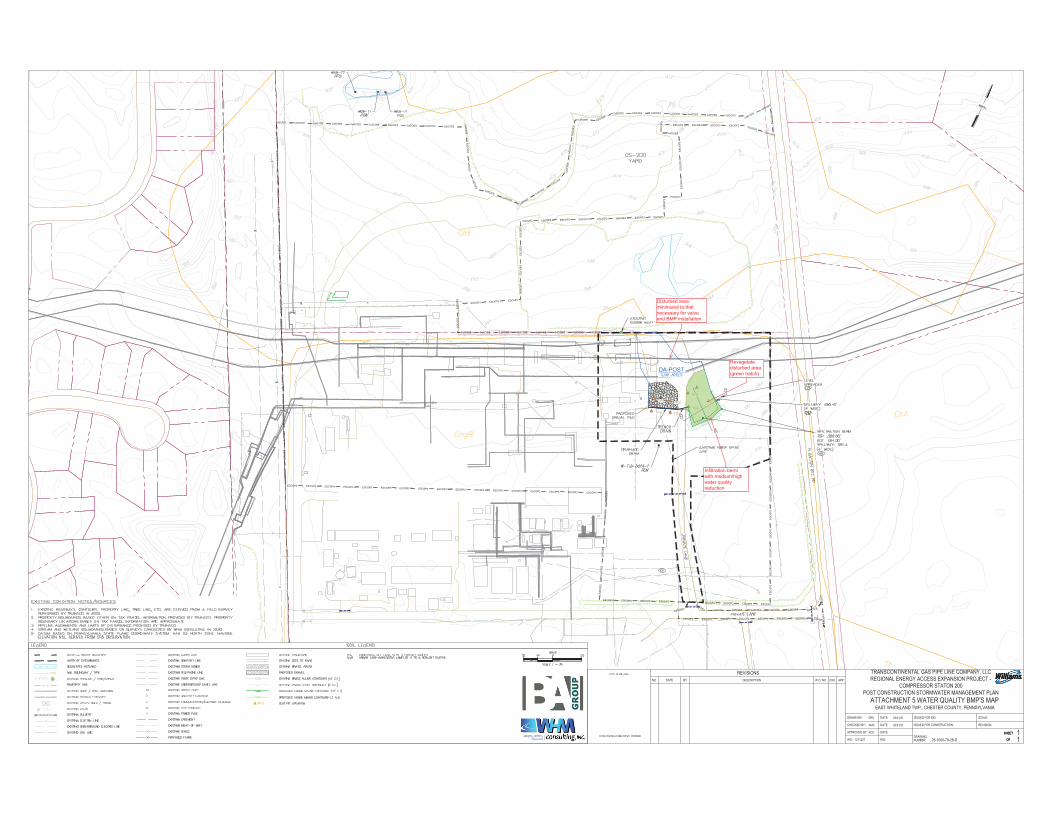
SHEET
OF
03/31/21
1211227 26-1000-70-28-D
KCC
KMC
DRV 03/31/21
SHEET
OFDRAWINGNUMBER:
ISSUED FOR CONSTRUCTION:
ISSUED FOR BID:
SHEET
OF
SCALE:DRAWN BY:
CHECKED BY:
APPROVED BY:
DATE:
DATE:
DATE:
NO. DATE BY W.O. NO. CHK. APP.DESCRIPTION
REVISIONS
WO:
REVISION:
RID:
TRANSCONTINENTAL GAS PIPE LINE COMPANY, LLCREGIONAL ENERGY ACCESS EXPANSION PROJECT -
COMPRESSOR STATON 200POST CONSTRUCTION STORMWATER MANAGEMENT PLAN
EAST WHITELAND TWP., CHESTER COUNTY, PENNSYLVANIA
51
ATTACHMENT 5 WATER QUALITY BMP'S MAP
1
Disturbed areaminimized to thatnecessary for valveand BMP installation
Revegetatedisturbed area(green hatch)
Infiltration bermwith medium/highwater qualityreduction

ATTACHMENT 6 OFFSITE DISCHARGE REPORT
Transcontinental Gas Pipe Line Company, LLC
Offsite Discharge Report
Regional Energy Access Expansion Project
Compressor Station 200
April 2021
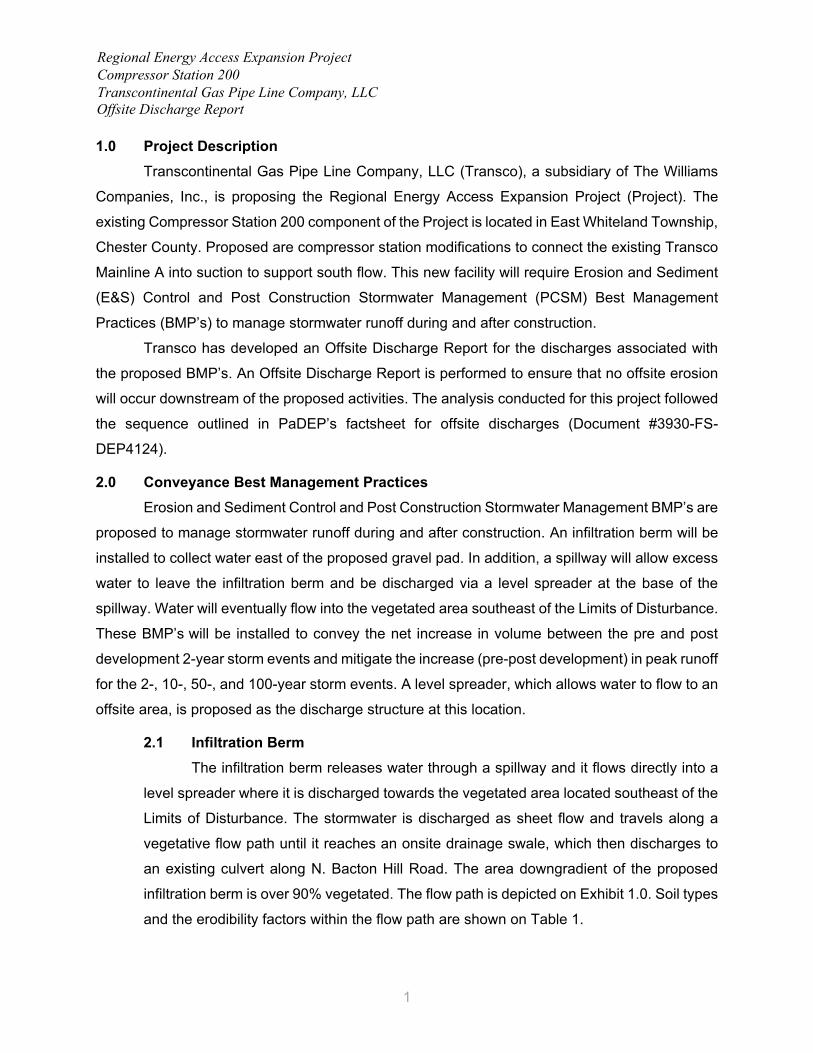
Regional Energy Access Expansion Project Compressor Station 200 Transcontinental Gas Pipe Line Company, LLC Offsite Discharge Report
1
1.0 Project Description Transcontinental Gas Pipe Line Company, LLC (Transco), a subsidiary of The Williams
Companies, Inc., is proposing the Regional Energy Access Expansion Project (Project). The
existing Compressor Station 200 component of the Project is located in East Whiteland Township,
Chester County. Proposed are compressor station modifications to connect the existing Transco
Mainline A into suction to support south flow. This new facility will require Erosion and Sediment
(E&S) Control and Post Construction Stormwater Management (PCSM) Best Management
Practices (BMP’s) to manage stormwater runoff during and after construction.
Transco has developed an Offsite Discharge Report for the discharges associated with
the proposed BMP’s. An Offsite Discharge Report is performed to ensure that no offsite erosion
will occur downstream of the proposed activities. The analysis conducted for this project followed
the sequence outlined in PaDEP’s factsheet for offsite discharges (Document #3930-FS-
DEP4124).
2.0 Conveyance Best Management Practices Erosion and Sediment Control and Post Construction Stormwater Management BMP’s are
proposed to manage stormwater runoff during and after construction. An infiltration berm will be
installed to collect water east of the proposed gravel pad. In addition, a spillway will allow excess
water to leave the infiltration berm and be discharged via a level spreader at the base of the
spillway. Water will eventually flow into the vegetated area southeast of the Limits of Disturbance.
These BMP’s will be installed to convey the net increase in volume between the pre and post
development 2-year storm events and mitigate the increase (pre-post development) in peak runoff
for the 2-, 10-, 50-, and 100-year storm events. A level spreader, which allows water to flow to an
offsite area, is proposed as the discharge structure at this location.
2.1 Infiltration Berm The infiltration berm releases water through a spillway and it flows directly into a
level spreader where it is discharged towards the vegetated area located southeast of the
Limits of Disturbance. The stormwater is discharged as sheet flow and travels along a
vegetative flow path until it reaches an onsite drainage swale, which then discharges to
an existing culvert along N. Bacton Hill Road. The area downgradient of the proposed
infiltration berm is over 90% vegetated. The flow path is depicted on Exhibit 1.0. Soil types
and the erodibility factors within the flow path are shown on Table 1.
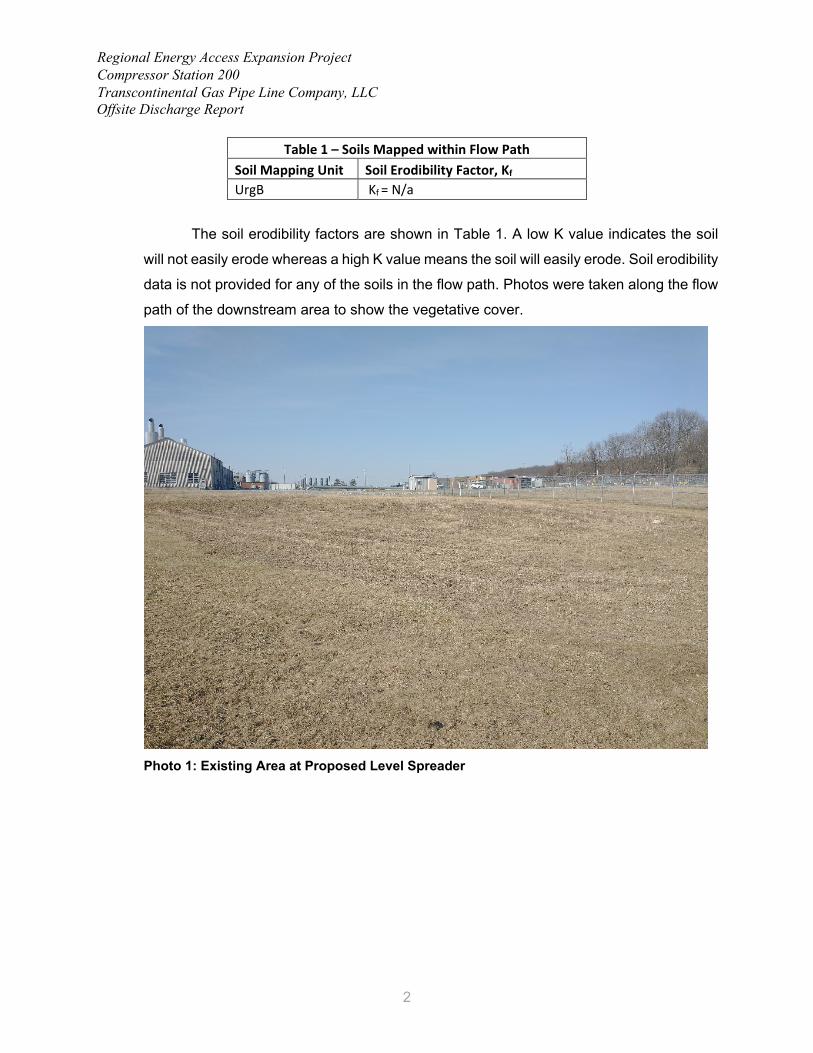
Regional Energy Access Expansion Project Compressor Station 200 Transcontinental Gas Pipe Line Company, LLC Offsite Discharge Report
2
Table 1 – Soils Mapped within Flow Path Soil Mapping Unit Soil Erodibility Factor, Kf UrgB Kf = N/a
The soil erodibility factors are shown in Table 1. A low K value indicates the soil
will not easily erode whereas a high K value means the soil will easily erode. Soil erodibility
data is not provided for any of the soils in the flow path. Photos were taken along the flow
path of the downstream area to show the vegetative cover.
Photo 1: Existing Area at Proposed Level Spreader
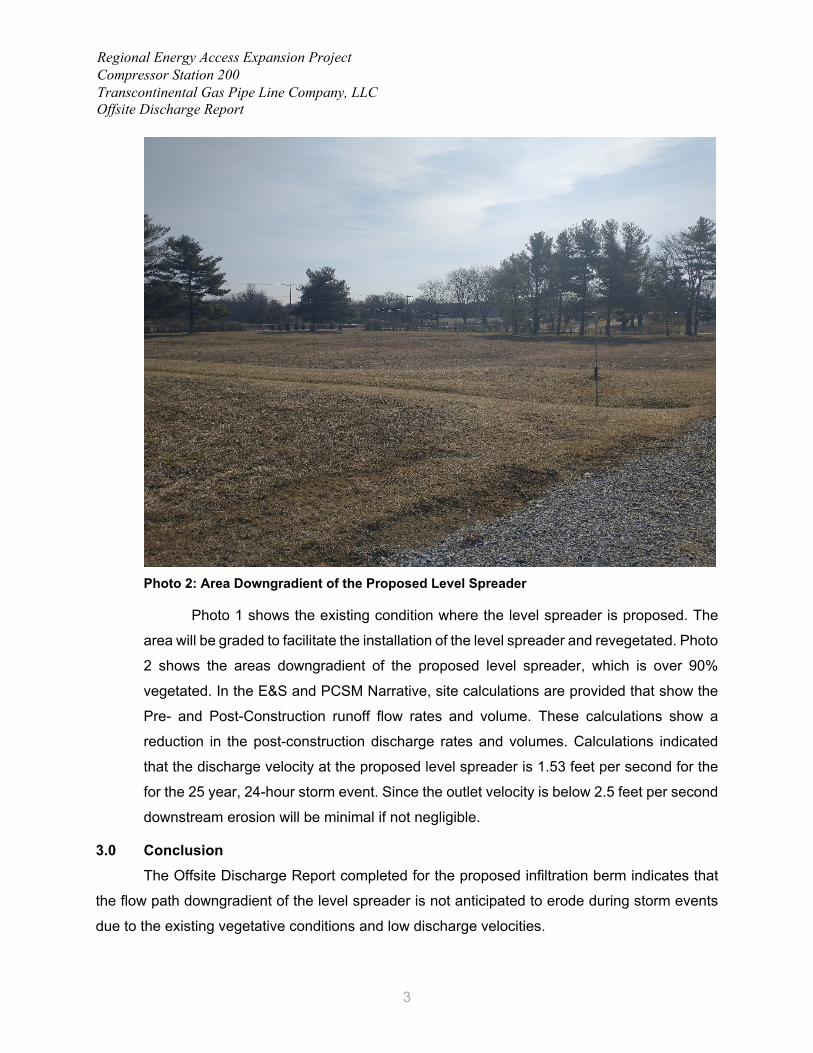
Regional Energy Access Expansion Project Compressor Station 200 Transcontinental Gas Pipe Line Company, LLC Offsite Discharge Report
3
Photo 2: Area Downgradient of the Proposed Level Spreader
Photo 1 shows the existing condition where the level spreader is proposed. The
area will be graded to facilitate the installation of the level spreader and revegetated. Photo
2 shows the areas downgradient of the proposed level spreader, which is over 90%
vegetated. In the E&S and PCSM Narrative, site calculations are provided that show the
Pre- and Post-Construction runoff flow rates and volume. These calculations show a
reduction in the post-construction discharge rates and volumes. Calculations indicated
that the discharge velocity at the proposed level spreader is 1.53 feet per second for the
for the 25 year, 24-hour storm event. Since the outlet velocity is below 2.5 feet per second
downstream erosion will be minimal if not negligible.
3.0 Conclusion The Offsite Discharge Report completed for the proposed infiltration berm indicates that
the flow path downgradient of the level spreader is not anticipated to erode during storm events
due to the existing vegetative conditions and low discharge velocities.
FO
FO
FO
FO
FO
F
O
FO
F
O
FO
UE
UE
UE
UE
UE
U
E
U
E
UE
UE
UE
UE
UE
UE
UE
UE
UE
U
E
OHE
OHE
OHE
O
H
E
OHE
OHE
OHE
OHE
OHE
OHE
OHE
OHE
OHE
OHE
OHE
OHE
OHE
G
G
G
G
G
G
G
G
S
A
N
SA
N
SAN
SAN
SAN
S
T
S
T
ST
ST
ST ST
ST
ESCGP3
ESCGP3
ESCGP3
ESCGP3
ESCGP3
ESCGP3
ESCGP3
ESCGP3
ESCGP3ESCGP
3ESCGP
3
ESCGP3ESCGP
3ESCGP
3
ESCGP3ESCGP3
ESCGP3
ESCGP3
ESCGP3
ESCGP3
ESCGP3
ESCGP3
ESCGP3
ESCGP3
ESCGP3
ESCGP3
ESCGP3
ESCGP3
ESCGP3
ESCGP3 ESCGP3 ESCGP3 ESCGP3
E
S
C
G
P
3
ESCGP3
E
S
C
G
P
3
ESCGP3ESCGP3ESCGP3ESCGP3ESCGP3
E
S
C
G
P
3
ESCGP3
ESCGP3
ESCGP3
TRANSCONTINENTAL GAS PIPE LINE COMPANY, LLCREGIONAL ENERGY ACCESS EXPANSION PROJECT
COMPRESSOR STATION 200

SECTION 3.3.2 DRAWINGS