tourism yield measures for cambodia
TRANSCRIPT

For Peer Review
Tourism Yield Measures for Cambodia
Journal: Current Issues in Tourism
Manuscript ID: CIT-0631.R2
Manuscript Type: Paper
Keywords: DEVELOPING COUNTRIES 1, IMPACTS, Policy Implementation, poverty alleviation, Cambodia
Abstract:
The paper develops new measures of tourism yield in the context of Cambodia a developing country in South East Asia. The paper first sets out some data regarding tourism to Cambodia and the reasons why tourism has been identified as a tool for economic development and poverty alleviation. It then sets out the method and findings of a study by the International Finance Corporation-Mekong Private Development Facility (IFC-MPDF) to develop
standard and extended measures of tourism yield to assess the pro-poor impact of international tourism to Cambodia. These yield measures extend earlier work undertaken by the first author. The paper then discusses the policy implications of the findings. It is concluded that while tourism goes some way to reducing poverty in Cambodia informed policy initiatives can enhance the effect. It is argued that different visitor yield measures provide an important basis for the development of strategies to increase tourism's pro-poor impact. A substantial barrier to the formulation of appropriate policies to increase the pro-poor benefits of Cambodia arises from the limited data available in poor countries generally.

For Peer Review
1
Tourism Yield Measures for Cambodia
Abstract
The paper develops new measures of tourism yield in the context of Cambodia a developing country in South East Asia. The paper first sets out some data regarding tourism to Cambodia and the reasons why tourism has been identified as a tool for economic development and poverty alleviation. It then sets out the method and findings of a study by the International Finance Corporation-Mekong Private Development Facility (IFC-MPDF) to develop standard and extended measures of tourism yield to assess the pro-poor impact of international tourism to Cambodia. These yield measures extend earlier work undertaken by the first author. The paper then discusses the policy implications of the findings. It is concluded that while tourism goes some way to reducing poverty in Cambodia informed policy initiatives can enhance the effect. It is argued that different visitor yield measures provide an important basis for the development of strategies to increase tourism's pro-poor impact. A substantial barrier to the formulation of appropriate policies to increase the pro-poor benefits of Cambodia arises from the limited data available in poor countries generally. Keywords: tourism yield, Cambodia, poverty alleviation, destination management.
Introduction
Tourism is widely regarded as a catalyst for growth (UNWTO 2007). Many researchers go further, however, and have argued that tourism development represents an effective use of resources to alleviate poverty (Ashley 2008, Harrison 2008, 2009;Meyer 2009). Additionally, tourism ranks highly in the development agenda of many national governments (UK, Thailand, Turkey, etc). An assumption that seems often to underpin this is that tourism growth conveys disproportionate benefits on the poorer members of society, primarily by stimulating the expansion of sectors that are assumed to be relatively labor-intensive. Consequently, policies that promote tourism are seen as ‘pro-poor’ in that they are often anticipated to create disproportionately more jobs for less-skilled (and thus poorer) workers (Wattanakuljarus and Coxhead 2008)
On what may be regarded as the ‘Standard View’ of tourism's economic impacts, claims that tourism reduces poverty are not surprising. This view is often used to support a “trickle-down” development concept, which assumes that the benefits of general economic growth will permeate to all sectors. On this view, increased tourism expenditure from inbound markets has direct, indirect and induced effects on a host destination, leading to increased production, income and employment (Nelson 2008). The extent to which production and employment in the destination is affected by visitor
Page 1 of 38
For Peer Review
2
expenditure depends importantly on the strengths of the business linkages between tourism and other sectors. The stronger the links between businesses within a destination the lower the level of ‘leakages’ from imports. The greater the extent to which tourism development generates increased production in the primary, secondary and tertiary sectors the greater is the tourism multiplier and consequent impact of injected expenditure on GDP and employment (Dwyer, Forsyth and Dwyer 2009). The 'Standard View' needs to be substantially qualified. The impact of increased tourism demand on income and employment depends on many factors (Dwyer et al 2000, 2004). In reality, economies experiencing an increase in tourism expenditure, particularly developing countries will face labour, land and capital constraints. In such circumstances, tourist expenditure is likely to result in increased prices rather than increases in output, income and employment. Factor constraints thus lead to interactive industry effects which change the industrial composition of an economy and hence the multiplier effects from any shock to tourism demand. An increase in tourism demand may be met in part by a net increase in domestic output but will also tend to crowd out other sectors of domestic activity. Unless there is significant excess capacity in tourism related industries, the primary effect of an economy-wide expansion in inbound tourism is to alter the industrial structure of the economy rather than to generate a large increase in aggregate economic activity. Its effect will thus show up as a change in the composition of the economy rather than as a net addition to activity (Dwyer et al 2004). Inbound tourism expenditure, particularly in developing countries, can alter consumption patterns via the demonstration effect and be inflationary (Sinclair 1998). This in turn can reduce overall tourism price competitiveness (Dwyer, Forsyth and Rao 2000). The growth in visitor spending might be valuable if it leads to diversification of output and reduced reliance on traditional exports (which are subject to vagaries of weather and world commodity markets). Structural change, however, implies adjustment costs. The latter are often ignored in discussions of the economic impacts of tourism development in general and in discussions regarding tourism's capacity to improve the welfare of the poorest people in the economy. As is the case with any expansion of exports, the growth of tourism can be expected to raise Gross Domestic Product (GDP) and household income in the destination. In this sense the sector may indeed offer pro-poor outcomes. But whether tourism growth reduces the relative deprivation of the poor is less obvious. If it does not, then government efforts to promote tourism growth may be inconsistent with the goal of reduced income inequality. Tourism expansion in a destination may well create jobs for unskilled workers, and this would have a direct poverty alleviation impact. However, as Wattanakuljarus and Coxhead (2008) have found, much of the gain from tourism growth accrues to factors other than unskilled labor, so income distribution may actually worsen. In addition, low-skill jobs in other sectors may be destroyed, and returns to agricultural land, from which the poor derive a considerable share of their income, may fall as tourism expands. Other recent studies (Blake et al. 2008; Scheyvens 2009; Harrison 2008) also show tourism doesn’t necessarily reduce poverty. For example, Blake et al. (2008) employing an economy-wide analysis of the distributional effects of tourism
Page 2 of 38

For Peer Review
3
expansion to determine whether and how tourism can contribute to poverty reduction, suggest caution when generalizing the effects of tourism growth on poverty within a country. In the case of Brazil, they highlight a strong reinforcement effect whereby the industries that reduce their output following a tourism demand increase are export industries that employ factors of production from the richer households. The authors conclude that the structure of earnings in non-tourism export sectors plays a significant role in determining the net poverty effects of tourism. These studies have interesting policy implications. One is that a tourism promotion campaign leading to increased international visitation may increase the gap between rich and poor. To address this increased inequality, additional policy instruments are required to correct for the inequalities occasioning tourism growth. In recent years an increasing number of researchers have argued that there is a need for critical reflection on the origins and approaches associated with pro-poor tourism. A special issue of Current Issues in Tourism was devoted to critiques of this notion (Hall 2007; Chok, Macbeth, and Warren 2007; Schilcher 2007; Scheyvens 2007). A major concern is that pro- poor tourism is another form of neoliberalism that fails to address the structural reasons for the north–south divide, as well as internal divides within developing countries. Regardless of the issues involved in the ongoing debate, the development of measures of the economic significance of different tourist origin markets is an important task which has important implications for destination marketing and management. It is this issue forms the primary focus of this paper. There are at least three reasons why we might expect the relationship between tourism growth and poverty reduction in a destination to not be as strong as some might assume. At each stage of the multiplier process there are two factors that limit the size of the economic impacts of a shock to tourism expenditure - leakages and factor constraints (Sinclair 1998). A third (and very much relatively neglected) reason involves factor ownership. While the first two factors limit the extent of the economic impacts of tourism on a destination, the third factor affects the resulting distribution of income (gainers and losers) from tourism growth as some of the above findings indicate. Given the insufficiency of relying on the possible 'multiplier effects of tourism expenditure to relieve poverty in any destination, a number of researchers are investigating the issues involved in 'pro-poor tourism' (Ashley 2008, Harrison 2008, 2009; Meyer 2009). Pro-poor tourism is a term used for national and local policies to develop types of tourism that reduce poverty (Ashley et al 2001; Ashley 2003). A study of particular interest has been that undertaken by the Mekong Private Sector Development Facility (MPDF) to study tourism's impact on the poor in Cambodia. MPDF is managed by the International Finance Corporation (IFC), the private sector arm of the World Bank Group and financed by donor countries and multilateral institutions including the Asian Development Bank, Australia, Canada, Finland, IFC, Ireland, Japan, New Zealand, the Netherlands, Norway, Sweden, Switzerland and the United Kingdom. The MPDF supports the development of private, small and medium scale enterprises (SME’s) in Vietnam, Laos and Cambodia to become the engines of economic growth and employment creation in the region.
Page 3 of 38

For Peer Review
4
Several aims have driven the work of the MPDF (IFC-MPDF 2007). These include: Is consumption across different industry sectors reaching the poor?; How can the tourism sector contribute to poverty reduction goals?; What are the points of intersection between poverty reduction and tourism development goals that need to be targeted for policy development?; Which policies or interventions would positively affect the growth of the tourism sectors and the benefits for the local populations? There are several aspects of the IFC-MPDF study that are instructive for research into tourism's effect on poverty reduction in developing countries. There are three issues in particular that we will discuss in this paper.
The first aspect of the IFC-MPDF study of interest is its use of value chain analysis to address the objective of poverty reduction in Cambodia. Value chains are a way of representing the series of transactions from the provision of inputs for a primary product to primary production, transformation, marketing to final consumption and subsequent recycling (Mitchell, Ashley and Man 2008). The tourism value chain is comprised of the suppliers of all the goods and services that go into the delivery of tourism products to consumers. This includes all suppliers of goods and services that may not necessarily be directly contracted by tour operators or by their agents or suppliers. A tourism value chain analysis maps the flow of goods, services and money through the tourism supply chain. Tourism destination supply chains are relatively complex, involving many components - not just accommodation, transport and excursions, but also bars and restaurants, handicrafts, food production, waste disposal, and the infrastructure (energy, water, roads) that supports tourism. Tourism spans many supply-chains. Within each of these, choices about sourcing local products, hiring local staff etc. can impact on the destination in a variety of ways both positive and negative. Analyzing the current spending within each key supply chain, builds up a more accurate picture on where local impact, destination and supply-chain competitiveness could be improved. By mapping the major value chains operating for key segments by destination, it is possible to identify the extent to which local sourcing of inputs occurs such as food and beverage, supplies, support services (laundry, guides, transport etc.). This is the key to identifying the major drivers impacting the overall contribution of tourism (UNESCAP 2007) – both from an economic and pro-poor standpoint, so as to identify the areas whereby pro-poor impact or net benefits could be improved. Much of this research confirms the importance of value chain analysis in developing strategies to improve tourism's effect on poverty reduction (Mitchell and Ashley, 2007) A second interesting aspect of the IFC-MPDF study is its innovative use of concepts of tourism yield that have been recently developed by researchers (Dwyer et al 2007; Dwyer and Forsyth 2008; Lundie et al 2008). These researchers have developed several different yield measures each of which provides information important for tourism planning and tourism marketing strategies. Some measures relate to expenditure injection per origin market which is perhaps the traditional 'yield' measure adopted by destination marketers. As these researchers acknowledge, however, expenditure measures have substantial
Page 4 of 38
For Peer Review
5
limitations for tourism policy formulation. Other yield measures emphasize the economic impacts of visitor expenditure, allowing the key constraints limiting tourism's economic impacts including effects on employment to be incorporated into the measures. Recognizing the relevance of this research to IFC-MPDF objectives, the measures developed by these researchers were extended to provide information on tourism's effect on poverty reduction in Cambodia. A third interesting aspect of the IFC-MPDF study, which relates to the development of yield measures, is its visitor-related perspective to policy formulation. While supply side analysis is essential to explore the links in the tourism value chain, it is recognized that the spending of tourists from different origin markets both in total and in expenditure patterns will have different economic effects in general and in the pro-poor impact on incomes and employment specifically. Measures of tourism yield can be important inputs into destination marketing strategies and infrastructure development. This demand-side perspective has been lacking in other studies of tourism's impact on the poor within destinations (Ashley 2006, Bennett et al. 1999, Bolwell 2008, Lin and Guzman 2007). The structure of this paper is as follows. The following section sets out some data regarding tourism to Cambodia and the reasons why tourism has been identified as a tool for economic development and poverty alleviation. Section Three sets out the method adopted by IFC-MPDF to develop standard and extended measures of tourism yield to assess the pro-poor impact of international tourism to Cambodia. Section Four presents the findings of the IFC-MPDF study using some extended concepts of tourism yield developed by the authors. Section Five discusses the policy implications of the findings. It is concluded that while tourism goes some way to reducing poverty in Cambodia informed policy initiatives can enhance the effect. It is argued that different visitor yield measures provide an important basis for the development of strategies to increase tourism's pro-poor impact. A substantial barrier to the formulation of appropriate policies to increase the pro-poor benefits of Cambodia arises from the limited data available in poor countries generally.
Tourism in Cambodia
Cambodia, which borders Thailand, Laos and Vietnam, has 181,000 square kilometers of surface area. In 2009 Cambodia's population was 14.8 million, GDP was US$10.9 billion in total and US$ 1,993.1 per capita. Real GDP declined by 2.0 per cent in 2009. Regarding the size of the travel and tourism (T&T) sector, international tourist arrivals in 2009 were estimated to be 2.045 million and international tourism receipts US$ 1.185 million (Blanke et al 2011). The World Economic Forum (Blanke et al 2011) estimates that in 2010, T&T industry direct GDP was US$1.033 billion, comprising 8.9 per cent of total Cambodian GDP, a figure which indicates the travel and tourism is more important to Cambodia than to neighbouring countries. Taking indirect effects into account the contribution of T&T to Cambodia was estimated to be US$2.136 billion in 2010,
Page 5 of 38

For Peer Review
6
comprising 18.4 per cent of Cambodia's GDP. This contribution is projected to grow at 4.8 % between 2011 and 2020. Direct T&T related employment was 509,000 in 2010, which comprised 6.8 per cent of the labour force. Taking indirect effects into account, T&T related employment was estimated to be 1.069 million in 2010. T&T related employment is, however, forecast to increase by only 1.5 per cent between 2011 and 2020 (Blanke et al 2011). In the 90’s, Cambodia’s tourism industry was dominated by arrivals from either Europe or North America. However, following the end of the Asian financial crisis in 1999, a significant shift took place, with an increasing proportion of tourists coming from within Asia itself. Initially led by Japan, this pattern of growth has continued to gain momentum with ever-increasing numbers arriving from Taiwan, Korea and China. The main origin markets of visitors to Cambodia are set out in Table 1.
INSERT TABLE1 HERE
As Table 1 shows, the top ten origins delivered 1.528 million tourists to Cambodia in 2008 (72% of the total) and injected US$571.8 million which was 69.5 % of total expenditure of US$823.4 million).The industry sectors which receive tourism expenditure are set out in Table 2. The largest expenditure item is Accommodation, followed by Food and Beverages and Shopping. Together these three items comprise 65 per cent of tourist expenditure in Cambodia. When expenditure on transportation is added (within and between towns and excursions/tours) these four items total $630.1 million or 76 per cent of all tourist expenditure.
INSERT TABLE 2 HERE
Tourism to Cambodia is still in a relatively under-developed state. Siem Reap is the main gateway and most visited destination in Cambodia. At least 70 % of international visitors visit Siem Reap where Angkor Wat is located. The country performs relatively poorly against 138 other countries on most of the indexes of destination competitiveness listed in the Travel and Tourism Competitiveness Index (Blanke et al 2011). Overall, it is ranked 109th out of 139 countires. In terms of the main pillars of competitiveness that form the Travel and Tourism Competitiveness Index, Cambodia was ranked 110th in respect of its T&T regulatory framework, and 118th in respect of its business environment and infrastructure. It performed relatively better in respect of T&T human, cultural and natural resources at 81st position. .
There are three areas, however, where Cambodia performs relatively well. These are: the prioritization of travel and tourism (13), affinity for travel and tourism (tourism openness) (21), and tourism price competitiveness (31). The objective of the indexes and rankings is to provide benchmarking tools that enable countries to identify key obstacles to
Page 6 of 38
For Peer Review
7
competitiveness, and to provide a platform for dialogue among government, business, and the community to discuss the best ways of removing them. These acknowledged strengths of Cambodia can be good bases upon which to develop a more competitive tourism sector internationally.
Method
A substantial barrier to the formulation of appropriate policies to increase the pro-poor benefits of Cambodia arises from the limited data available in poor countries generally. The framework used for this study was a three pronged approach – supply, demand and impact. The supply side was assessed using four broad sectors: (1) Accommodation- hotels, guesthouses; (2) Food and Beverage- restaurants, restaurants of hotels & guesthouses, markets, roadside vendors, suppliers (individual, wholesaler, producer); (3) Shopping and Souvenirs- shops, markets, roadside vendors, suppliers (individual, wholesaler, producer); and (4) Transportation services – motorbike taxi, taxi, tuk tuk, boat, tour guides, tour operator, travel agent. As indicated above expenditure of tourists in these four sectors comprises over three-quarters of total tourism expenditure in Cambodia. To capture a broad cross section of the market, supply-side businesses were chosen according to the main markets served (corresponding to the top 10 markets to Cambodia) and, where applicable, other variables according to their nature. Thus, hotels were selected across star ratings (an equal number of 1-5 star properties); restaurants were selected according to range of meal prices and seat capacity etc. The criterion used for the sample selection was whether the hotel was part of the Cambodian Hotels Association which ensured respondents attention to accuracy. Other businesses were randomly selected Questions ranged from operations to financial aspects and key market segments. For each of these sectors, staff surveys were also carried out simultaneously to assess their overall employment, level of salaries and benefits as well pro-poor aspects. A total of 374 self-administrated questionnaires were collected. Since the four main destinations of Cambodia (Siem Reap, Phnom Penh, Sihanoukville, Kratie) represent more than 90% of Cambodian international tourism (MOT, 2009), the survey was therefore completed in those areas, extrapolating the results to the total country (Table 3).
INSERT TABLE 3 HERE
The demand side focused on the top ten market segments to Cambodia, in the same four destinations. Accurate data on tourist markets to Cambodia is vague and sketchy. The Ministry of Tourism collects statistics on tourist markets through an exit survey and through tourist arrival and departure cards. The exit surveys are, however, dubious as there is no confirmation of the survey instrument, accuracy and timing of collection by the Ministry of Tourism. There are a number of reports and studies reporting on tourism markets in Cambodia – all of which differ (MOT 2006; JICA 2005; APP 2005). Particular information such as average length of stay or tourist expenditure varies widely,
Page 7 of 38

For Peer Review
8
and all data should be treated with caution. In order to gain a more accurate picture of tourists to Cambodia, IFC-MPDF conducted its own visitor surveys for this study. The visitors survey discussed below was undertaken at the main points of departure for tourists visiting Cambodia from May to September 2007. A self-completion questionnaire was distributed to ‘all’ visitors leaving Cambodia through the main exit points (Phnom Penh International Airport, Siem Reap International Airport, and four major border checkpoints: Poipet, Bavet, Koh Kong and Stung Treng. The objective of the survey was to gather data about the detailed composition of expenditure by key segments of international tourists in Cambodia. A total of one thousand and sixty-six independent travelers and nine hundred and thirteen group tourists were interviewed. Group tourists were asked to detail what was included in their tour packages. Since all meals and entrance fees and excursions were included in the tour price for the majority of group tourists, packages structures and contract rates for tour operators were studied and used to adjust the group tourists’ expenditures. For two Asian nationalities (Korean and Japanese) and westerners, group tours were followed and studied to compare the corporate rates paid by the tour companies for hotels and restaurants with the amount of expenditures declared by respondents. Adjustments were made on the basis that the majority of respondents did not provide answers to these two categories. Therefore corporate rates were used as a proxy value. An innovative method adopted by IFC-MPDF was to use the survey results to develop measures of tourism yield for Cambodia. These measures were based on the concepts developed by Dwyer et al (2007) and Dwyer and Forsyth (2008) who have argued that a focus on ‘yield’ is an important aspect of both business strategy and public policy to maintain and enhance the returns from tourism in destinations worldwide. Yield is a term which refers to the gain, in financial or economic benefits which a destination achieves from attracting particular types of tourists. A growing number of destinations (Bhutan, Maldives, Australia, etc.) now emphasize ‘high yield’ or ‘high expenditure’ of visitors as a primary objective of tourism policy (Dwyer and Forsyth 2008). In the IFC-MPDF study, however, the standard expenditure measures were extended to develop measures of 'local expenditure impact' and 'pro-poor impact' per visitor by origin market. The measures recognise that, while important to the economic contribution of tourism, the amount of tourism expenditure injected into Cambodia from inbound travel provides limited information as to the net revenues of suppliers of tourism product and even less information as to its benefits to the poorer sections of Cambodian society. More meaningful measures are those that allow for the leakages that are associated with the expenditure (both outside the local area and outside of Cambodia), and those that identify the extent to which benefits accrue to the poor.
Results
Table 4 provides a summary of the expenditure data from the survey undertaken by IFC-MPDF as well as various tourist yield measures that were estimated from the survey
Page 8 of 38

For Peer Review
9
results. Column 1 shows average expenditure for each of the top ten origin markets for the entire trip to Cambodia. The average over all visitors is US$387.40. Column 2 shows the average expenditure per day for each of the major origin markets for tourism to Cambodia. The average daily expenditure for all visitors is US$74.50. Column 3 shows the average length of stay (ALOS) in Cambodia of visitors from the different origins. The average length of stay for all visitors is 5.2 days. Columns 4 and 5 show, respectively, the amount of full time employment (FTE) associated with one million dollars expenditure and 1000 visitors from each visitor market.
INSERT TABLE 4 HERE
Yield as Tourist Daily Expenditure
Table 4 indicates that for the top ten origins, the tourists who inject an above average amount per trip into Cambodia come from China, UK Australia, Thailand, USA and Germany while those who inject a below average amount per trip come from Korea, Japan, Taiwan, Vietnam, Malaysia and France. In terms of daily expenditure Japan is the biggest spending market, followed by China, Korea, USA and Australia. Visitors from each of these markets inject an above average expenditure daily into Cambodia. The lowest spending markets per day are the European origins France, Germany, the UK, and the Asian markets of Thailand, Vietnam, Taiwan and Malaysia. Since the injected amounts depend upon total numbers of tourists by origin, their daily expenditure, and their length of stay, it is more informative to consider expenditure per night in association with duration of stay. We display this information in matrix form in Figure 1. The matrix consists of four quadrants. The horizontal and vertical axes indicate, respectively, average length of stay and average daily spend (US$). The average daily expenditure is $74.50 while the ALOS is 5.2 days.
INSERT FIGURE 1 HERE
The North West Quadrant comprises high daily spend, short stay travelers. For Cambodia these include Japan and Korea. The North East Quadrant comprises the highest yielding segments and comprises high daily spend, long stay travelers whose daily spend and length of stay lies above the average for the destination as a whole. For Cambodia these include China, Australia and the USA. The South East Quadrant comprises long stay/low spend markets. For Cambodia these include France, Germany, Thailand, UK, and Vietnam. The South West Quadrant contains the least attractive markets of short stay/low spend. For Cambodia these are Taiwan and Malaysia.
There is a presumption that segments that fall into the North East quadrant should carry a higher priority in terms of targeted marketing campaigns than other quadrants (Dwyer et al. 2007; Dwyer and Forsyth 2008). This would imply that of the major origin countries, China, Australia and the USA should figure prominently in Cambodia's international destination marketing efforts.
Page 9 of 38
For Peer Review
10
Despite the guidance which expenditure yield measures appear to offer destination marketers and planners, there are several limitations with expenditure as a measure of ‘yield’ which generally have failed to be acknowledged (Dwyer and Forsyth 2008). Of particular concern for any developing country such as Cambodia is the level of leakages that reduce the sales revenues retained by local suppliers as well as the multiplier effects of the injected expenditure. While a tourism satellite account (TSA) can be used to generate measures of the economic contribution of each visitor market, unfortunately no TSA exists for Cambodia. The authors thus were required to develop alternative ways of measuring the economic significance of Cambodia’s main origin markets.
Yield as Employment Generated
The Cambodia Ministry of Tourism uses the registration system of the Ministry of Commerce to estimate the level of employment in the tourism sector (2006). IFC-MPDF updated these data using direct surveys by phone to estimate tourism related employment in Cambodia. Columns 4 and 5 of Table 4 show the employment associated with expenditure from each visitor market. Differences in employment generated in each sector are associated with the types of goods and services purchased by tourists and the labour intensiveness of the process of production.
Employment Yield for a visitor market = Contribution to tourism employment of sales to the particular market / tourism consumption by the visitor market
Table 4, column 4, shows that expenditure by Koreans has the greatest impact on employment in Cambodia with 14 jobs created per $1 million of spent. The next largest employment generators are from China and USA (10 jobs per $1million). All other origin countries generate a below average number of jobs (8.1 jobs per $1 million). Origin countries with the smallest employment generation effects per $1million expenditure are Germany (3 jobs), and Vietnam, Australia, France (5 jobs). Figure 2 displays this information.
INSERT FIGURE 2 HERE
Yield as Direct Locally Retained Expenditure
Not all direct household income (wages and salaries) received by local residents continues as part of the circular flow of income. The main forms of leakages from the direct and secondary effects of a change in tourist expenditure are savings, taxes, and imports (Dwyer et al 2000). Savings represent a reduction in consumption and thus contribute nothing further to local economic stimulus. Some business earnings may be retained for a period to build up funds for later investment. Taxes, whether direct or indirect, also result in money being removed from the economy, at least in the short term. Taxes decrease the spending ability of taxpayers, both personal and corporate, and so
Page 10 of 38
For Peer Review
11
prevent these monies from being able to contribute to further economic stimulus. Savings and taxes of course are not removed from the local economy if they contribute to investment and public services. These elements are particularly important to supporting the poor in a developing economy. Imports of final goods and services associated with tourist expenditure represent an important type of leakage out of the host economy. Import leakages can take several forms, such as repatriation of profits to foreign corporations; servicing of debt to foreign lenders; remittance of incomes outside the study area, for example, by foreign workers; payment for imported consumption and capital goods; and promotion and advertising expenditure undertaken outside the destination. Each form of leakage results in money being taken out of the host economy, temporarily at least in the case of saving and tax. In aggregate, their presence means that fewer dollars are left to create subsequent flow-on effects in the destination economy. The exact size and nature of these leakages will depend on the characteristics of the destination. Smaller regions typically have greater leakages than larger regions because of their more limited industrial base. More of their inputs are likely to be imported and their larger firms are likely to have head offices elsewhere or have non-resident shareholders. All such leakages limit the size of the tourism multiplier (Dwyer et al 2005; Dwyer, Forsyth and Dwyer 2009:285). Unfortunately data on the nature and extent of leakages is often unavailable in many countries, particularly lesser developed countries (Sinclair 1998). For Cambodia, it is the import content of the goods sold to tourists that forms the bulk of the leakages from tourist expenditure. Recognizing that visitor expenditure levels in themselves do not indicate the sales revenues accruing to suppliers of goods and services to tourists net of imports, the IFC-MPDF conducted a survey of tourism operators in four major sectors (Accommodation, Food & Beverage, Shopping, Transportation) to determine the import content of tourist purchases. For purposes of estimating the local expenditure leakage, an ‘imported’ good or input need not be sourced internationally. To qualify as ‘imported’ it suffices that the item is produced outside of the area under study. Thus, analysis of the expenditure leakage from tourism expenditure in Siem Reap would treat souvenirs made in Phnom Penh as imported whereas this would be regarded as sourced domestically from the perspective of tourism to Cambodia. In the present study imports relate to the consumption of all goods and services sourced outside of Cambodia. To account for the leakages directly from final tourist expenditure, the authors have developed the concept of 'Direct Locally Retained Expenditure' (DLRE). DLRE = direct expenditure – direct leakages. This refers to the tourist expenditure that stays in Cambodia to initiate the multiplier process. DLRE is a measure of the amount of expenditure injected per visitor net of its import content. The study found that the average LEI across all supply chains was 63 per cent. The LEI for food and beverage were marginally above average, but given that these are labour intensive supply chains and Cambodia imported a large proportion of imported foodstuffs and beverages, it is likely that much of this comes through job based income rather than buying local supplies. All results are displayed in Table 5.
Page 11 of 38

For Peer Review
12
INSERT TABLE 5 Here The leakages from tourist expenditure on food and beverages and handicrafts were estimated through direct interviews with wholesalers and producers and from the tourists’ behaviours (shopping at market or in souvenir shops, using taxi or motorcycle…). Additionally, a panel of eight reviewers from the IFC-MPDF on tourism and private sector development in Cambodia evaluated the likelihood size of other leakages by looking at:
- The proportion of profit from foreign owned business being repatriated (estimated as 10-15% for high-end hotels)
- The proportion of salary or remittances being repatriated by foreign staff (estimated as 80% of 15% of the salary bill for high-end hotels)
- The proportion of operating costs being imported (estimated as 80% with a high proportion being fuel)
Two approaches, bottom up and top down processing, were tested to compare the results from these estimations. An average of 1% difference only was found for each supply chain. The example below for the accommodation (H=Hotel and GH=Guest Houses) sector reflects the bottom up approach:
LEIacc = ((NPacc>20× Xacc × (
(1−πH )
YH)× ((LEIL + LEIF +β(YN −πH ))+ (Xacc × a(
πH
YH)))
+((NPacc<20× Xacc × (
(1−πGH )
YGH)× ((LEIL + LEIF + β(YGH −πGH ))+ (Xacc × b(
πGH
YGH)))
20>accPN % of visitors staying in hotels with a room rate higher than US$ 20 per night
accX Sum of expenditure in accommodation
π Profit
HY Sum of incomes to Hotels with a room rate higher than US$ 20 per night
LLEI Estimated salary to local workers
FLEI Estimated Maximum of F&B that is spent on Cambodian products
Acc = Accommodation; H = Hotel; GH =Guest House
INSERT TABLE 6 HERE
Page 12 of 38

For Peer Review
13
Columns 1 and 2 of Table 6, show DLRE associated with different origin markets per trip and per day in Cambodia. In respect of total trip expenditure, column 1 indicates that the tourists who are associated with an above average DLRE per trip into Cambodia (that is more than US$248.80) come from China, UK Australia, Thailand, USA and Germany while those who inject a below average DLRE per trip come from Korea, Japan, Taiwan, Vietnam, Malaysia and France. Given their different expenditure patterns in Cambodia tourists from the different origin countries have different DLRE per day. As shown in column 2 of Table 6, the average DLRE per day for all origin markets is US$47.40. Origins with above average DLRE per day are Japan, Korea, China, Australia and USA. Figure 3 shows DLRE per day for the different origin markets according to the average length of stay in Cambodia. Figure 3 indicates that the origin markets that have an above average effect on DLRE in Cambodia and also are associated with an above average length of stay are China, Australia, USA. Those with below average DLRE and below average length of stay are Taiwan and Malaysia.
INSERT FIGURE 3 HERE Figure 3 displays information in a way that is useful to destination management. Those origin markets that have both a longer than average length of stay, and which also have a greater than average DLRE, are China, Australia and the USA. These markets should continue to be promoted for their expenditure contribution net of import content. Japan and Korea on the other hand have an above average DLRE but a lower than average length of stay in Cambodia. These markets should also continue to be promoted while exploring ways to increase the average period of their visitation to Cambodia. However, while the DLRE provides useful information on the amount of direct visitor expenditure retained in the destination and does have some useful input to Cambodia’s destination marketing effort, it does not address the issue of the distribution of that expenditure, particularly its impact on poverty reduction. To take account of the extent to which the spending of different origin markets helps to alleviate poverty in Cambodia, two pro-poor impact measures were developed. One relates to the share of income received by poor people while the other relates to employment created for the poorer residents.
Pro-poor Tourism Impact
Recognizing that the poor benefit from tourism through labour -income (direct and indirect employment) or income from the sale of goods and services to visitors, tourist philanthropy,and also through the provision of infrastructure, the IFC-MPDF sought to analyze the contribution of each supply chain to poverty reduction. The study shows that the accommodation, food and beverage and transport supply chains provided valuable employment to the poor and near poor. However, it also shows that the proportion of
Page 13 of 38

For Peer Review
14
incomes going to the poor and near poor, was not nearly proportional to the jobs. This is to be expected, as it indicates that the poor and near poor staff were in the relatively lower paid jobs, and less likely to be in the higher managerial roles. For the purpose of developing measures of pro poor impact, Cambodians’ whose livelihoods depend on tourism were classified into three groups- employees, direct suppliers of services to tourists and direct sellers of goods and services to the tourism industry. Employees receive a wage for providing their labour input to a tourism related supplier in each of the tourism related production sectors. As direct suppliers of goods and services to tourists, Cambodian residents negotiate sales directly with the tourists themselves. As suppliers of goods and services to tourism firms, Cambodian residents also negotiate sales with business operators. The total pro poor impact of tourist expenditure in total or by origin market is the addition of the three sources of pro poor income. This classification leads to the development of three types of pro-poor yield measures:
- Employee pro-poor income impact: (pro-poor employee income generated by tourist expenditure)/ (total expenditure of each visitor market)
- Tourism supplier pro-poor impact: (Direct Locally Retained Expenditure associated with purchases from poor suppliers)/ (total expenditure of each visitor market)
- Direct seller pro-poor impact: (purchases by tourists from direct sellers from poor background)/( total expenditure of each visitor market)
The employee pro-poor income impact (job based income) and the combined direct suppliers/direct seller pro-poor impacts are shown in Table 7. In all cases, a person was classified as coming from a poor background if the income per head in her/his family/household was smaller than the national poverty rate (US$ 14.00 per person per month) or this person had provided proxy indicators showing a poverty status (types of roof and wall).
INSERT TABLE 7 HERE The first column of Table 7 shows the employee pro-poor income impact. The measures were derived from estimates of the numbers employed within each of the four tourism linked sectors (Accommodation, Shopping, Food & Beverage, Transport) who are from poor backgrounds and the proportion of the wage bill that goes to them. People were interviewed at all levels of the business in order to represent all categories of workers. Thus, the job based income to the poor was calculated by multiplying the expenditure of tourists as a proportion of total sales in each of the four industry sectors by the associated share of salary going to the poor.
Page 14 of 38
For Peer Review
15
∑∑
−=
)( πX
LEPII
P
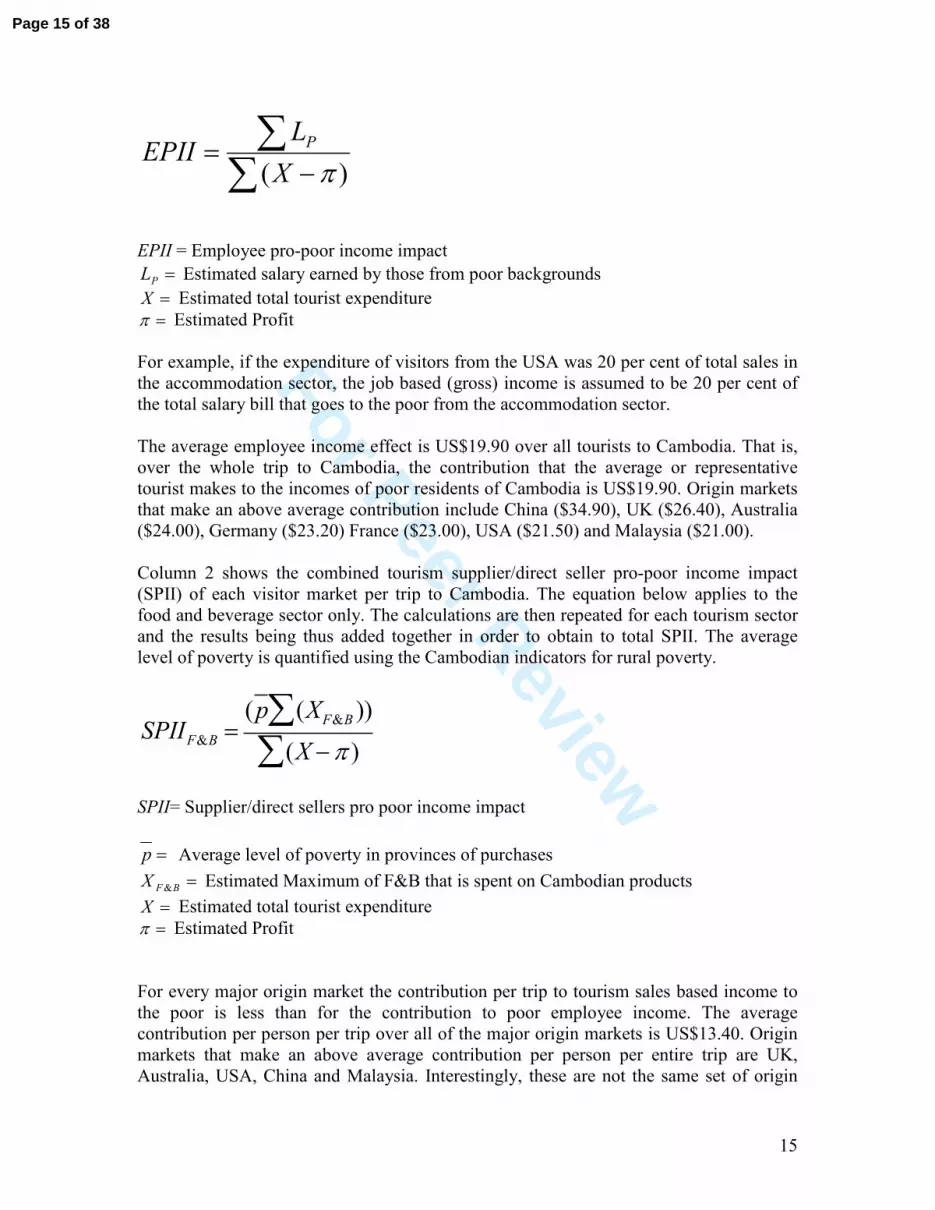
EPII = Employee pro-poor income impact
=PL Estimated salary earned by those from poor backgrounds
=X Estimated total tourist expenditure
=π Estimated Profit For example, if the expenditure of visitors from the USA was 20 per cent of total sales in the accommodation sector, the job based (gross) income is assumed to be 20 per cent of the total salary bill that goes to the poor from the accommodation sector. The average employee income effect is US$19.90 over all tourists to Cambodia. That is, over the whole trip to Cambodia, the contribution that the average or representative tourist makes to the incomes of poor residents of Cambodia is US$19.90. Origin markets that make an above average contribution include China ($34.90), UK ($26.40), Australia ($24.00), Germany ($23.20) France ($23.00), USA ($21.50) and Malaysia ($21.00). Column 2 shows the combined tourism supplier/direct seller pro-poor income impact (SPII) of each visitor market per trip to Cambodia. The equation below applies to the food and beverage sector only. The calculations are then repeated for each tourism sector and the results being thus added together in order to obtain to total SPII. The average level of poverty is quantified using the Cambodian indicators for rural poverty.
SPIIF&B =(p (XF&B ))∑
(X −π )∑
SPII= Supplier/direct sellers pro poor income impact
=p Average level of poverty in provinces of purchases
=BFX & Estimated Maximum of F&B that is spent on Cambodian products
=X Estimated total tourist expenditure
=π Estimated Profit For every major origin market the contribution per trip to tourism sales based income to the poor is less than for the contribution to poor employee income. The average contribution per person per trip over all of the major origin markets is US$13.40. Origin markets that make an above average contribution per person per entire trip are UK, Australia, USA, China and Malaysia. Interestingly, these are not the same set of origin
Page 15 of 38
For Peer Review
16
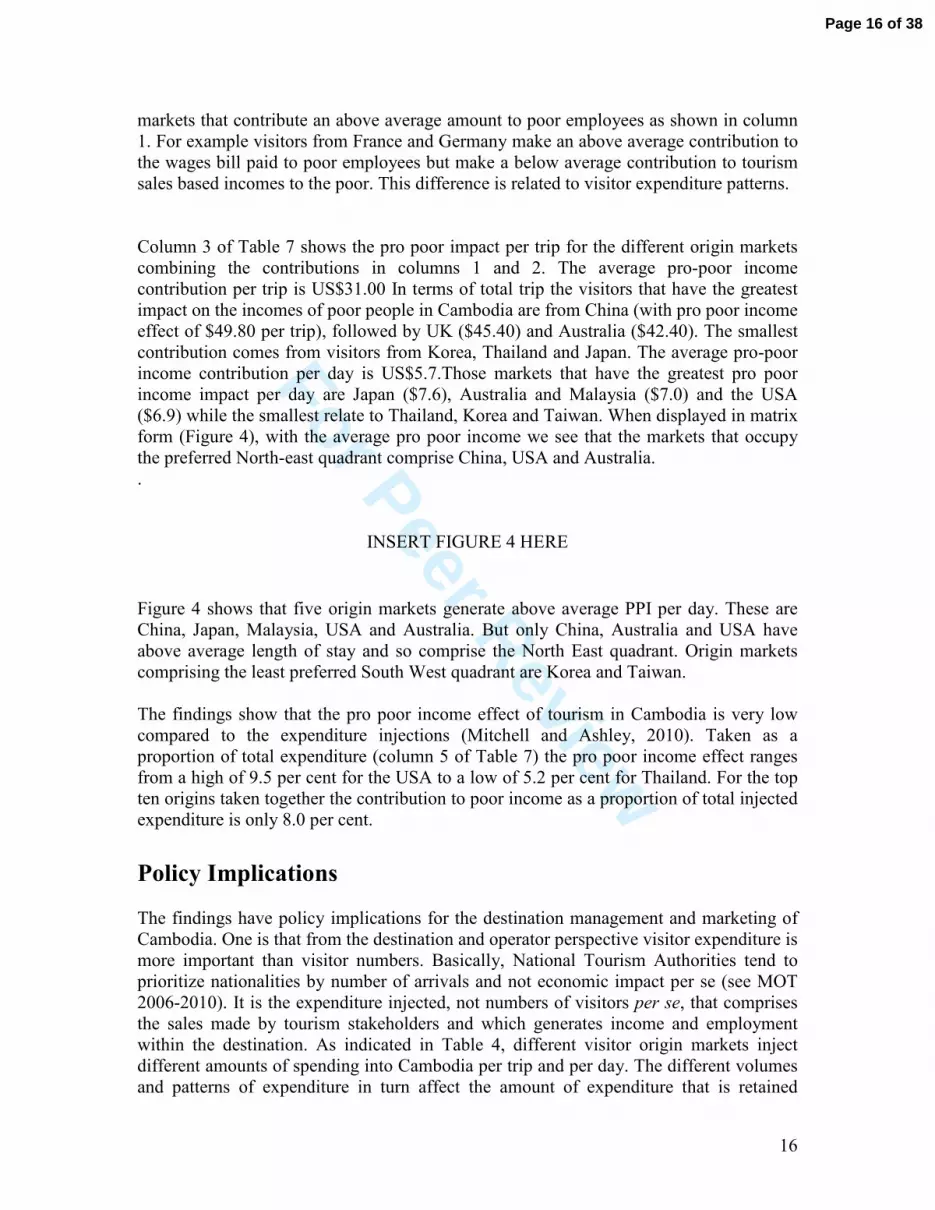
markets that contribute an above average amount to poor employees as shown in column 1. For example visitors from France and Germany make an above average contribution to the wages bill paid to poor employees but make a below average contribution to tourism sales based incomes to the poor. This difference is related to visitor expenditure patterns. Column 3 of Table 7 shows the pro poor impact per trip for the different origin markets combining the contributions in columns 1 and 2. The average pro-poor income contribution per trip is US$31.00 In terms of total trip the visitors that have the greatest impact on the incomes of poor people in Cambodia are from China (with pro poor income effect of $49.80 per trip), followed by UK ($45.40) and Australia ($42.40). The smallest contribution comes from visitors from Korea, Thailand and Japan. The average pro-poor income contribution per day is US$5.7.Those markets that have the greatest pro poor income impact per day are Japan ($7.6), Australia and Malaysia ($7.0) and the USA ($6.9) while the smallest relate to Thailand, Korea and Taiwan. When displayed in matrix form (Figure 4), with the average pro poor income we see that the markets that occupy the preferred North-east quadrant comprise China, USA and Australia. .
INSERT FIGURE 4 HERE
Figure 4 shows that five origin markets generate above average PPI per day. These are China, Japan, Malaysia, USA and Australia. But only China, Australia and USA have above average length of stay and so comprise the North East quadrant. Origin markets comprising the least preferred South West quadrant are Korea and Taiwan. The findings show that the pro poor income effect of tourism in Cambodia is very low compared to the expenditure injections (Mitchell and Ashley, 2010). Taken as a proportion of total expenditure (column 5 of Table 7) the pro poor income effect ranges from a high of 9.5 per cent for the USA to a low of 5.2 per cent for Thailand. For the top ten origins taken together the contribution to poor income as a proportion of total injected expenditure is only 8.0 per cent.
Policy Implications The findings have policy implications for the destination management and marketing of Cambodia. One is that from the destination and operator perspective visitor expenditure is more important than visitor numbers. Basically, National Tourism Authorities tend to prioritize nationalities by number of arrivals and not economic impact per se (see MOT 2006-2010). It is the expenditure injected, not numbers of visitors per se, that comprises the sales made by tourism stakeholders and which generates income and employment within the destination. As indicated in Table 4, different visitor origin markets inject different amounts of spending into Cambodia per trip and per day. The different volumes and patterns of expenditure in turn affect the amount of expenditure that is retained
Page 16 of 38

For Peer Review
17
locally, as well as its effect on job creation and the income of the poorer residents of Cambodia. In this respect, visitors from China would, on economic criteria at least, seem to be a particularly welcome source market given their important contributions to overall injected expenditure as well as locally retained expenditure, employment, and pro poor income effects. This flags the importance of a better understanding of the needs of visitors from China in respect of the types of goods and services they purchase during their Cambodian tourism experience. Given the importance of accessing visitor markets that are of greater economic significance to Cambodia, destination managers in both the public and private sectors of the Cambodian tourism industry should attempt to be more strategic in their marketing activity by targeting the higher impact markets. Associated with the absence of consumer surveys that provide useful information on visitor attitudes and characteristics for destination marketing purposes, it seems fair to say that Cambodia’s marketing effort lags behind other countries in its effectiveness. The data on visitor expenditure is confined to country origins with no satisfactory data available in respect of visitors by motivation or for special interest markets. There should be an attempt to better understand visitors, their expectations, needs, requirements, satisfaction and dissatisfactions to improve tourism experiences in Cambodia. This particularly applies to the higher yield markets of China, Australia, USA and UK. This type of knowledge can then be used not only to promote Cambodian tourism in a more targeted and cost effective way. Interestingly, since Cambodia is often part of a multi-destination trip including Lao PDR and Thailand or Vietnam, the forms of tourism that it develops can be those which complement the experiences offered in these destinations. Tourism authorities in various destinations world-wide are increasingly engaging in co-operative destination marketing efforts with a view to generating increased visitor flows and expenditure for their area of interest (Dwyer 2003). Indeed, a primary objective of cooperative marketing activity in the ASEAN region, often formalised in the ASEAN Tourism Agreement 2002 is to increase the expenditure injected into each destination thereby enhancing the economic contribution of tourism to that region (Wong et al 2010a, b). In itself, targeting ‘higher yield’ markets may not be enough. For one thing, bringing about a small change in a large market may be more difficult than bringing about a large change in a small market. Furthermore, the volume and patterns of expenditure may change over time for each of the different visitor source markets. It cannot be assumed that the high yield markets as identified in the study above will remain so over time. Also, some markets may decline in size while others may emerge or become larger over time. Indeed, it is likely to be harmful for Cambodia to focus on the high spenders market only. In fact, backpackers and low budget travellers (or low daily spenders) represent a significant segment for primary and secondary destinations (where high spenders do not go and poverty is greater). Paradoxically, the role played by some low spenders per day (eg. backpackers) may well be an important source of poverty alleviation depending on their length of stay and how they allocate expenditure. Recognising this, IFC-MPDF has recommended that Cambodian tourism operators attempt to change the content of their packages in order to make them more pro-poor. Unfortunately at this time the limited visitor spending data for Cambodia precludes a definitive answer as to visitor preferences
Page 17 of 38

For Peer Review
18
and the effects of spending of visitors from both major and minor markets. As Batra (2006) notes, there is no clear evidence that in the developed world more than a small minority of visitors emphasise environmental awareness when choosing products. In the Cambodian context this implies that tourists may be unaware of or uncaring about the pro-poor impact of their expenditure. If this is so, the impetus for any change will need to come from the supply side through more comprehensive analysis of the associations between existing tourism value chains and poverty alleviation.
A necessary condition for promotion of destination Cambodia to be more effective is the development of products and services to better match visitor needs and to market Cambodia more effectively internationally. Types of products and services with development potential include better quality items in the shopping sector including local handicrafts, and more innovative adventure, cultural and heritage tours. Not only does this make the destination potentially more interesting with the ability to offer a more varied set of tourism experiences but it is also likely to underpin an increase in average length of stay as well as greater repeat visitation. Since Cambodia is already price competitive the emphasis should be on quality products and services. A useful exercise would involve exploration of the influence of the life cycle stage of
destination Cambodia on the types of markets that should be targeted and the influence
of different yield measures on which markets are targeted. While the slowing growth rate of arrivals to Cambodia suggests that the destination has reached the mature or declining stage of the tourism life cycle, clearly there is scope for rejuvenation of the tourism product. Crucial to strategic development of new products and services Cambodia needs to significantly upgrade and modernise its infrastructures to support socioeconomic progress and tourism development. Poor tourism infrastructure in terms of roads, water, electricity and sanitation is a significant issue facing the growth of the industry in the future. Additionally, poor transport links impede tourism flows both to and within Cambodia (IFC-MPDF 2007). One of the most significant transport challenges in Cambodia is the role of international airlines in transporting visitors to Siem Reap and the Angkor Wat complex. On the Travel and Tourism Competitiveness Index Cambodia ranks well into the lower half of countries globally in respect of air and ground transport, tourism and ICT infrastructure (Blanke et al 2011). Of particular concern for future tourism growth is Cambodia’s extremely poor performance in respect of health and hygiene where it ranks with the lowest countries internationally. Destination managers should promote awareness of the community-level benefits from tourism-geared infrastructure e.g. roads which provide access to markets and hospitals, water, electricity etc. These represent increased net non-financial benefits to poor households, such as stronger local institutions, cultural pride, greater gender equity, improved natural resource management or social capital.
As important is tourism supply, the importance of the demand side cannot be overestimated. Studies show that several emerging values can be said to characterize tourists worldwide. These include: money rich-time poor, individualistic, experience seeking, desirous of self-improvement, demanding value for money, experimental but impatient, and safety conscious (Dwyer et al., 2009). Cambodian destination managers would do well to understand the changing values that drive world tourism. In this respect,
Page 18 of 38

For Peer Review
19
three such values - individualism, the search for a variety of authentic travel experiences and the desire for affordable visitor products and activities - seem to be particularly important in presenting opportunities for Cambodian tourism.
Individualism: People increasingly tailor holidays to meet their particular requirements. Increasingly ‘travelled’ consumers are seeking the unusual and the authentic experience rather than the shared, off-the-shelf holiday package (Dwyer et al 2009). People are increasingly interested in discovering, experiencing, participating in, learning about and more intimately being included in the everyday life of the destinations they visit. Consumers increasingly demand more choice, more interactivity and more personalized products from which to choose (Alford, 2005; Education Commission of the United States, 1999). As travellers become more experienced, they are no longer satisfied to be processed through an impersonal, non-interactive system of ‘mass tourism’. The ‘openness’ and hospitality of the Cambodian people (Blanke et al 2011) provides a good basis to develop tourism products and services tailored to individual needs. Seeking a variety of experiences: People increasingly expect a broad range of activities to be available at the destination (Elliot and Johns, 1993). One result of the experience economy and tourism has been a fragmentation of the tourist market into subsets of unique experiences. The evolving tourist is also referred to as the ‘experiential’ traveller. The experience economy is generally based on customized holidays and personalized services allowing travellers to participate more actively in the experiences (Nordin, 2005). There is a widespread view alternative forms of tourism such as backpacking, adventure tourism, cultural tourism, and ecotourism are better suited to fulfil the goals of developing countries, as they place emphasis on local economic development (Brohman, 1996). The UNWTO (2007) states that the expansion of such special niche markets aimed at experiential travellers has the potential to reduce poverty, augment social development, and promote sustainable development. Within Cambodia, development of activities outside of Siem Reap (Angkor Wat) and Phnom Penh which receive 85 per cent of tourist spending in Cambodia, can encourage tourists to visit secondary destinations. At all times, however, suppliers of existing and new products must consider where their offerings link within the value chain. The greater the extent to which new product and service development is sourced within Cambodia, the greater its potential to enhance tourism’s locally retained expenditure and its pro poor effects. Seeking value for money: People are typically becoming more critical, less loyal, seeking value for money, not necessarily low prices. People are prepared to pay good money for a quality experience and this might benefit the up-market end of the holiday market, involving perhaps exotic locations. Many internet users are experienced travellers, who have seen what package tours can offer, and are now demanding tailored holidays, or choices from ‘modules’ which can be combined to meet their overall requirements (Nordin, 2005). Emphasis is increasingly on ‘value for money’, as opposed to the cheapest package deal. Given that Cambodia is very price competitive already (Blanke et al 2009), this provides a good basis to develop the quality side of its tourism offerings.
Page 19 of 38
For Peer Review
20
As we have emphasised, whatever markets are developed in the future, Cambodia needs to address the issues of the amount of locally retained expenditure and the effects of tourist expenditure on alleviating poverty. The IFC-MPDF has identified four main areas which have potential to enhance DLRE if addressed. These are profit repatriation, salary repatriation, high costs of power and high imports of food and beverages, handicrafts, and miscellaneous products (IFC-MPDF 2007). Although there are no easy solutions to reducing leakages of tourism expenditure in developing countries (Sinclair 1998, Ashley et al 2001, 2004), it is clear that more efforts need to be put into local sourcing of as broad a range of tourism products and services as is possible while mindful of the requirements of the tourists. Regarding the problem of high import content of foodstuffs, promoting local produce as an appealing culinary experience is likely to be insufficient in itself. Its success will depend on the competitiveness of other economic sectors and more particularly agriculture. Cambodia is located between Thailand and Vietnam which produce fruits and vegetables throughout the year with a better quality and at a lower cost than Cambodia. Cambodia’s tourism and pro-poor agencies could address the quality and cost concerns and access to market issues associated with domestic fruit and vegetable production as part of an agritourism linkages project. Greater attention to domestic sourcing of foodstuffs could reduce the leakages associated with tourism expenditure. However, as Hall (2007) argues, unless structural changes are made, particularly with respect to agricultural trade, the hopes for poverty-reduction in any part of the developing world remain poor. Other initiatives to address the leakages problem could include the continuous investment in human resources development and training to upgrade professionalism and efficiency of tourist and related services while at the same time encouraging businesses to adopt a more localized input linkage orientation. Internet usage by local suppliers is very low and efforts should be made to have more take-up of technology for marketing and product development purposes. Educating visitors about the destination and briefing them about the opportunities that exist for them to have an even more enjoyable holiday by engaging with or buying directly to the local population is important. This can best be achieved through the guidebooks and pre-departure tour operator information and briefing meetings or leaflets in the destination. Another option is the identification of tourism linked products that could then be exported. Using tourism as an experimentation platform for locally produced items can offer strong opportunities to developing countries. <www.intracen.org>. More intensive value chain analysis which considers tourism’s links with supporting industries in Cambodia’s manufacturing and services sectors will be crucial to enhancing tourism’s pro poor effects. Pro poor benefits can accrue via increased access to the tourism value chain to more poor people, thus creating new entrants. This may result from the removal of barriers to entry to the existing value chain, developing new links to new supply inputs or tourism products that the poor can provide or expanding sub-sectors of the chain and/or expanding the relative share of products provided by the poor within the overall chain. The role that the civil society (NGOs) can play in assisting the government and also the private sector should be reinforced. Partnerships between the different actors is the key factor for success, as Harrison and Schipani (2007) found in
Page 20 of 38
For Peer Review
21
their study of Lao tourism and poverty alleviation. Specific strategies to action this agenda such as boosting their returns to current activities, helping them upgrade to new more profitable activities, expanding their volume of sales or increasing their labour income through training, have been discussed in detail by researchers (Ashley 2003, Ashley et al. 2001, 2004).
Influencing a wide range of mainstream tourism stakeholders to make their practices more pro-poor will be a major challenge. Powerful elites and industry lobby groups may resist initiatives which address structural inequities thereby changing the distribution of wealth. By implication, a supportive policy environment is important, but not sufficient, to promote poverty alleviation. This is the message delivered by many of the critics of pro poor tourism (Hall 2007; Chok et al 2007, Sheyvens 2007; Schilcher 2007). While the emphasis in this paper has been on alleviating poverty, it is recognized that Cambodia, like all other destinations, needs to attend to the social and environmental effects associated with tourism development. On the Environmental Performance Index formulated by the World Economic Forum, Cambodia ranks 148th out of 163 economies (Blanke et al 2011).The goal of sustainable tourism development is not the exclusive province of the developed countries. As the above discussion indicates, however, data is scarce even for the economic domain which provides the most opportunities for measurement. In the absence of hard data on the social and environmental impacts of tourism development it is difficult to say much about its ‘sustainability’. Indeed, a preference for visitors from particular countries may actually aggravate existing cultural tensions, and accelerate the loss of natural assets. The residents of a country can be impoverished culturally and environmentally even as tourism increases in economic significance (Dögan 1989, Mbaiwa 2004). It has also been argued that the simultaneous achievement of relatively high economic and environmental goals may not be possible, and that economic-environmental trade-offs may be necessary (Lundie et al. 2007). The focus on economic variables herein does not imply that the social and environmental effects are any less important.
Conclusions Cambodia, like many other developing countries, is seeking to expand its tourism sector. Tourism is widely regarded as an activity that alleviates poverty but circumstances that bring this about, and the extent to which poverty is reduced have not been studied in the detail that they deserve. In the absence of a tourism satellite account for Cambodia or a computable general equilibrium model that allows estimates of the economic impacts of different inbound markets, the yield measures developed above provide a new perspective on the effects of tourism to Cambodia across several types of outcomes recognizing that the expenditure volumes and patterns associated with the different markets imply different levels of leakages and make different contributions to poverty reduction. Adopting a demand side perspective the paper first developed expenditure measures for the top ten country origin markets to Cambodia. Tourists who inject an above average amount per trip into Cambodia come from China, UK Australia, Thailand, USA and
Page 21 of 38

For Peer Review
22
Germany. In terms of daily expenditure Japan is the biggest spending market, followed by China, Korea, USA and Australia. Visitors from each of these markets inject an above average expenditure daily into Cambodia. The matrix displays help to identify those markets that inject an above average amount per trip or per day associated with an above average length of stay. Based on the expenditure measures, three further yield measures were developed. These included direct locally retained expenditure, employment and pro poor income measures that indicate the effect that the visitor expenditure has on the incomes of people comprising the poorer sections of the community. The markets that combine an above average effect on the incomes of the poor with an above average length of stay are China, USA and Australia.
While the focus of the above has been the development of measures of tourism yield in respect of expenditure, direct locally retained expenditure, employment and pro poor incomes, it is recommended that Cambodia needs to shift from measuring impact to managing for impact. This means that measuring results after an intervention is not enough, and that monitoring incomes and opportunities is needed from the start, in order to guide new action. This flags once again the importance of value chain analysis in formulating policies to enhance tourisms economic impacts on the community. The ideal is to promote tourism growth in a way that enables the poor to actively participate in and significantly benefit from economic activity (Denman and Denman 2004, Mitchell and Ashley 2010). Unfortunately, we are still some distance from providing informed answers to the question of which policies or interventions would positively affect the growth of the tourism sectors and the benefits for the local populations.
Compared to similar studies (Mitchell and Ashley, 2010), the findings show that the pro poor income effect of tourism in Cambodia is very low compared to the expenditure injected into the destination. Taken as a proportion of total expenditure the pro poor income effect ranges from a high of 9.5 per cent for the USA to a low of 5.2 per cent for Thailand. For the top ten origins taken together the contribution to poor income as a proportion of total injected expenditure is only 8.0 per cent. It is concluded that while tourism goes some way to reducing poverty in Cambodia there is potential to enhance the share of tourism expenditure that goes to poor people. In respect of this it is likely that informed policy initiatives can enhance the effect. While space has precluded a detailed discussion here, there seems to be particular merit in adopting a value chain approach to tourism, and aligning tourism with wider thinking on value chains and on production, Incomes and employment of the poor. A focus on specific community tourism projects or small scale initiatives is not enough. Rather, an overview of the tourism value chain, and any pro poor potentials or modifications, is needed. A serious effort to reduce poverty in Cambodia, the same as for any lesser developed country, very likely requires the development of strong institutions capable of regulating the tourism industry and distributing assets in order to facilitate ‘pro-poor growth’ (Schilcher 2007). Whatever the policies adopted, however, the measures that have been developed here can prove useful in identifying some of the major economic effects of developing the various tourism origin markets. While the context of discussion was Cambodia the method adopted and the measures used can be developed for other
Page 22 of 38

For Peer Review
23
destinations with limited data availability and that lack tourism satellite accounts and economic models capable of estimating the impacts of tourism shocks on poverty alleviation. A substantial barrier to the formulation of appropriate policies to increase the pro-poor benefits of tourism to lesser developed economies and emerging destinations arises from the limited data available in poor countries generally. The different visitor yield measures as formulated in this study can provide an important basis for the development of strategies to increase tourism's pro-poor impact in lesser developed countries.
Acknowledgements
For further information regarding the Cambodia Tourism Impact Studies conducted by IFC-MPDF in 2007, please contact Kate Lloyd-Williams ([email protected]) or Dr. Frederic Thomas ([email protected]). The following people also made very significant contributions to the planning, gathering and/or analysis of data (in alphabetical order): Sharee Bauld, Thy Hourn, John Marsh, Brett Morgan, Men Prachvuthy, Allison Rossetto, Sour Sakara, Rupal Shah, Nigel Smith, and Kang Vannak. Additional thanks to Dr. Tim Conway, Dr. Jonathan Mitchell, Pamela Muckosy and Dr. Jim MacBeth for technical advice and peer reviews.
References
Asia Pacific Project (2005) Greater Mekong Sub-region Tourism Sector Strategy (TA 6179-GMS) submitted to the Asian Development Bank, vol. 1, final report, June 2005 Alford, P. (2005). Destination Marketing. London: Mintel. Ashley, C., Roe, D. and Goodwin, H. (2001) Pro-poor Tourism Strategies: Expanding Opportunities for the Poor.PPT Briefing No. 1. ODI, IIED, CRT Ashley, C. (2003) Methodology for Pro-Poor Tourism Case Studies. PPT Working Paper No. 10. ODI, London. Ashley, C., D. Meyer, D. Roe and H. Goodwin (2004), Pro-Poor Fact Sheet No. 10: International Tour Operators: Roles, Practices and Implications for Developing Countries, Pro-Poor Tourism Partnership. Ashley, C. and J. Mitchell (2008). Doing the right thing approximately not the wrong thing precisely: Challenges of monitoring impacts of pro-poor interventions in tourism value chains. Working Paper 291. ODI, Overseas Development Institute: 50. Batra A. (2006) “Tourism Marketing for Sustainable Development” ABAC Journal Vol. 26, No. 1 (January - April, 2006, pp. 59 - 65) 59. Bennett, O., D. Roe, et al. (1999). Sustainable tourism and poverty elimination study: A report to the Department for International Development, DFID: 99.
Page 23 of 38

For Peer Review
24
Blake, A., J.S. Arbache, M.T. Sinclair and V. Teles (2008), “Tourism and Poverty Relief”, Annals of Tourism Research, Vol. 35, No. 1, pp. 107-126. Blanke J., T. Chiesa and E Trujillo Herrera (2009), The Travel & Tourism Competitiveness Index 2009: Measuring Sectoral Drivers in a Downturn, WEF, Geneva, Switzerland Blanke J., and T. Chiesa (2011), The Travel & Tourism Competitiveness Report 2011: Beyond the Downturn WEF, Geneva, Switzerland Bolwell, D. and W. Weinz (2008). Reducing poverty through tourism. International Labour Office. Geneva, ILO Sectoral Activities Programme: 66. Brohman, J. (1996). New directions in tourism for Third World development. Annals of Tourism Research, 23(1), 48-70. Cambodian Ministry of Commerce “Commercial Registration Reform Plan”, Announcement No. 2106 MOC, September 08, 2006 Cambodian Ministry of Tourism (2006), “Annual report on tourism statistics”, Statistics and tourism information department, 42p. Cambodian Ministry of Tourism (2009), “Annual report on tourism statistics”, Statistics and tourism information department, 41p. Chok, S. J. Macbeth, C. Warren (2007) 'Tourism as a Tool for Poverty Alleviation: A Critical Analysis of 'Pro-Poor Tourism' and Implications for Sustainability', Current Issues in Tourism, 10: 2, 144 — 165 Denman, R. and Denman, J. (2004) Tourism and poverty alleviation recommendations for action. Madrid: World Tourism Organisation (Report nr. ISBN: 92-844-0701-X) Dogan, H. Z. (1989). "Forms of adjustment: sociocultural impacts of tourism." Annals of Tourism Research 16: 216-236. Dwyer L. (2003) “Cooperative Destination Marketing: revisiting the assumed economic impacts” Tourism Review International (formerly Pacific Tourism Review) Vol. 6, No. pp 95-106.
Dwyer L. (2005) “ Relevance of Triple Bottom Line Reporting to Achievement of Sustainable Tourism: a Scoping Study” Tourism Review International, Vol. 9, No. 1 pp 79-94. Dwyer L., P. Forsyth, J. Madden and R. Spurr (2000) “ Economic Impact of Inbound Tourism under Different Assumptions about the Macroeconomy”, Current Issues in Tourism Vol. 3 No. 4,pp 325-363,
Page 24 of 38

For Peer Review
25
Dwyer L., P. Forsyth and P. Rao (2000)"The Price Competitiveness of Travel and Tourism: a comparison of nineteen destinations" Tourism Management, Special issue: the Competitive Destination Vol. 21 No. 1 February pp 9-22. Dwyer L. and C.W. Kim (2003) “Destination Competitiveness: a Model and Indicators”, Current Issues in Tourism, Vol. 6, No. 5, pp 369-413 Dwyer, L.P. Forsyth, R. Spurr (2004) “Evaluating Tourism’s Economic Effects: New and Old Approaches” Tourism Management Vol 25, pp 307-317. Dwyer, L., P. Forsyth, R. Spurr & T. Ho (2005) Economic Impacts and Benefits of Tourism in Australia: a general equilibrium approach. Technical Report series, SustainableTourism CRC, Gold Coast, Australia. Dwyer, L., Forsyth, P., Fredline, L., Jago, L., Deery, M., & Lundie, S. (2007). Yield measures for Australia’s special interest inbound tourism markets. Tourism Economics,13(3), 421–440. Dwyer L., P. Forsyth (2008) “Economic Measures of Tourism Yield: what markets to target?” International Journal of Tourism Research Vol. 10, 155-168. Dwyer L, D. Edwards, N. Mistilis, N. Scott and C. Roman (2009) “Destination and Enterprise Management for a Tourism Future” Tourism Management 30 pp. 63-74 Dwyer, L. P. Forsyth, W. Dwyer (2009) ‘Tourism and Economic Development: Three Tools of Analysis’, Tourism Recreation Research Special Issue Project Planning and Development, Vol 34 (3) Education Commission of the United States. (1999). Future trends affecting education [electronic version]. Available from: <http://www.ecs.org/clearinghouse/13/27/1327.htm>. Accessed 11 October. Elliot, J., & Johns, N. (1993). The influence of international tourism trends on the design. International Journal of Contemporary Hospitality Management, 5(2), 6. Goodwin, H. (2008). "Pro-poor tourism: a response." Third World Quarterly 29(5): 869-871. Hall, C. Michael (2007) 'Pro-Poor Tourism: Do 'Tourism Exchanges Benefit Primarily the Countries of the South'?', Current Issues in Tourism, 10: 2, 111 — 118 Harrison, D. and S. Schipani (2007) 'Lao Tourism and Poverty Alleviation: Community-Based Tourism and the Private Sector', Current Issues in Tourism, 10: 2, 194 — 230 Harrison, D. (2008). "Pro-poor Tourism: a critique." Third World Quarterly 29(5): 851-868.
Page 25 of 38

For Peer Review
26
Harrison, D. (2009). "Pro-poor Tourism: Is There Value Beyond ‘Whose’ Rhetoric?" Tourism Recreation Research 34(2): 200-202. IFC-MPDF (2007), “Indicators in Tourism Value Chain Research and Lessons Learnt: Assessing the Impact of Tourism in Cambodia”, IFC-MPDF / SNV international conference on Poverty Alleviation through Tourism – Impact Measurement in Tourism Chain Development, Phnom Penh – Cambodia, December 2007. Lin, T. and F. D. D. Guzman (2007). Tourism for pro-poor and sustainable growth: Economic analysis of tourism projects. ERD Technical Note No. 20. A. D. Bank, Asian Development Bank. Lundie S., Dwyer L. and Forsyth P. (2007) “Environmental-Economic Measures of Tourism Yield” Journal of Sustainable Tourism Vol. 15, No. 5, pp. 1-18 Mbaiwa, J., 2004, The Socio-cultural Impacts of Tourism Development in the Okavango Delta, Botswana, journal of tourism and cultural change, Vol. 2, no. 3, 163-184 Meyer, D. (2009). "Pro-Poor Tourism: Is There Actually Much Rhetoric? And, If So, Whose?" Tourism Recreation Research 34(2): 197-199. Mitchell J., Ashley C. and Man S. (2008), “Can tourism offer pro-poor pathways to prosperity? Examining evidence on the impact of tourism on poverty”, ODI Briefing Paper 22, June 2007: http://www.odi.org.uk/resources/download/84.pdf Mitchell J. & Ashley C. (2007), “Doing the right thing approximately not the wrong thing precisely: Challenges of monitoring impacts of pro-poor interventions in tourism value chains”, ODI Working paper 291, 45p (http://www.odi.org.uk/resources/download/1590.pdf)
Mitchell J. & Ashley C. (2010), Tourism and Poverty Reduction: Pathways to Prosperity, Earthscan Publications, 176 p. Nelson M.C (2008) Travel & Tourism and the Common Good: A Call for Integrative Global Citizenship in J. Blanke and T. Chiesa “The Travel & Tourism Competitiveness Index: Assessing Key Factors Driving the Sector’s Development”, The Travel & Tourism Competitiveness Report 2007: Furthering the Process of Economic Development, WEF, Geneva, Switzerland. Nordin, S. (2005) Tourism of tomorrow – travel trends & forces of change ETOUR, European Tourism Research Institute. Scheyvens, R. (2007) 'Exploring the Tourism-Poverty Nexus', Current Issues in Tourism, 10: 2, 231— 254 Scheyvens, R. (2009). "Pro-Poor Tourism: Is There Value Beyond the Rhetoric?"
Page 26 of 38

For Peer Review
27
Tourism Recreation Research 34 (2): 191-196. Schilcher, D. (2007) 'Growth Versus Equity: The Continuum of Pro-Poor Tourism and Neoliberal Governance', Current Issues in Tourism, 10: 2, 166 — 193 Schwab K. and Porter E. M. (2009), “The global competitiveness report 2008-2009”, World Economic Forum, Geneva, Switzerland. 513p. Sinclair M.T. (1998), “Tourism and Economic Development: A Survey”, Journal of Development Studies Vol. 34, (5), June: 1-51. UNESCAP (2007), Study on the role of tourism in socio-economic development, ST/ESCAP/2478, 119p. UNWTO (2007). ST-EP Programme. Internet edition. Retrieved September 7, 2008 from http://www.unwto.org/step/pub/en/pdf/step_prog.pdf Wattanakuljarus, A. & Coxhead, I. (2008) Is tourism-based development good for the poor? A general equilibrium analysis for Thailand Journal of Policy Modeling, 30 (6), 929-955. Wong, E., N. Mistilis and L. Dwyer (2010a) “Understanding ASEAN tourism collaboration - the preconditions and policy framework formulation" forthcoming International Journal of Tourism Research.
Wong, E., N. Mistilis and L. Dwyer (2010b) “A Framework for Analyzing Intergovernmental Collaboration – The Case of ASEAN Tourism” forthcoming Tourism Management.
Page 27 of 38
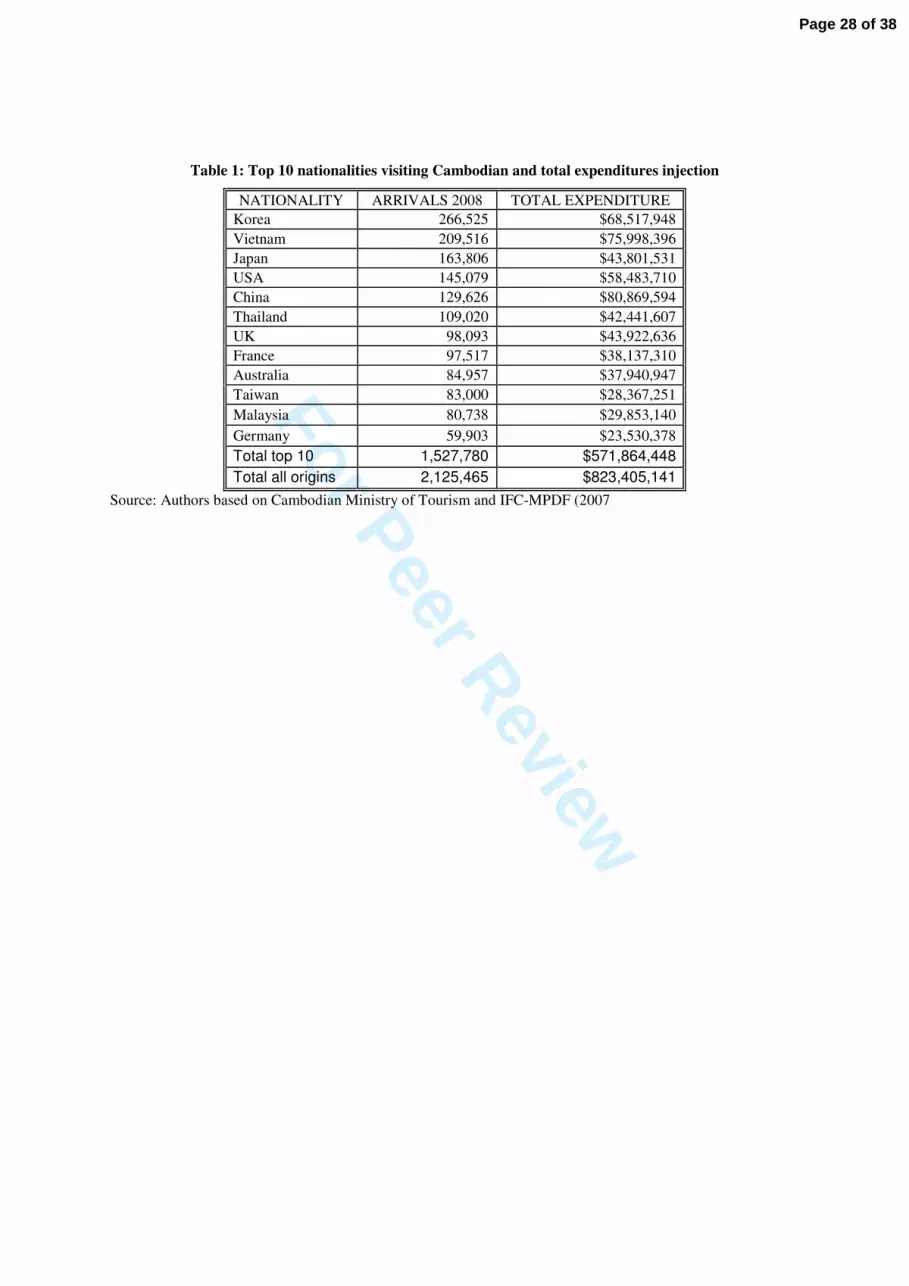
For Peer Review
Table 1: Top 10 nationalities visiting Cambodian and total expenditures injection
NATIONALITY ARRIVALS 2008 TOTAL EXPENDITURE
Korea 266,525 $68,517,948
Vietnam 209,516 $75,998,396
Japan 163,806 $43,801,531
USA 145,079 $58,483,710
China 129,626 $80,869,594
Thailand 109,020 $42,441,607
UK 98,093 $43,922,636
France 97,517 $38,137,310
Australia 84,957 $37,940,947
Taiwan 83,000 $28,367,251
Malaysia 80,738 $29,853,140
Germany 59,903 $23,530,378
Total top 10 1,527,780 $571,864,448
Total all origins 2,125,465 $823,405,141
Source: Authors based on Cambodian Ministry of Tourism and IFC-MPDF (2007
Page 28 of 38
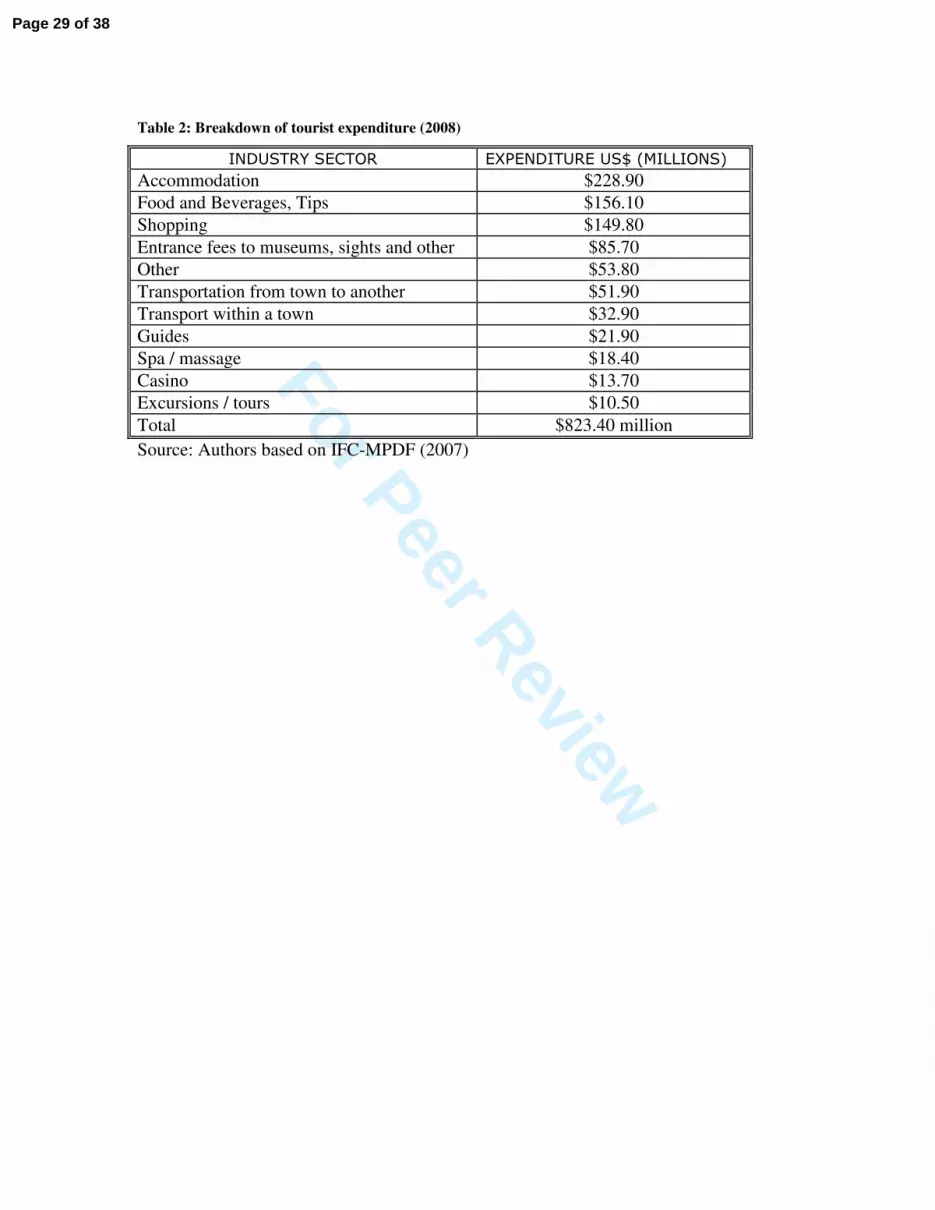
For Peer Review
Table 2: Breakdown of tourist expenditure (2008)
INDUSTRY SECTOR EXPENDITURE US$ (MILLIONS)
Accommodation $228.90
Food and Beverages, Tips $156.10
Shopping $149.80
Entrance fees to museums, sights and other $85.70
Other $53.80
Transportation from town to another $51.90
Transport within a town $32.90
Guides $21.90
Spa / massage $18.40
Casino $13.70
Excursions / tours $10.50
Total $823.40 million
Source: Authors based on IFC-MPDF (2007)
Page 29 of 38

For Peer Review
Table 3: Mapping the tourism supply chain – sample sizes by supply chain for Cambodia (2007)
SIEM REAP PHNOM PENH KRATIE SIHANOUKVILLE ACTUAL SURVEYED ACTUAL SURVEYED ACTUAL SURVEYED ACTUAL SURVEYED ACTUAL SURVEYED
Hotel 93 15 109 17 6 5 47 13 255 50 Accommodation
Guesthouse 176 19 245 15 15 11 109 23 545 68
Restaurants 93 21 202 19 24 19 67 15 386 74
Markets 1087 38 1472 180 400 51 538 86 3497 309
Roadside
vendors 496 41 34 17 97 10
627 68 F&B
Wholesaler
Supplier n.c. 18 n.c. 4
n.c 22
Shops 181 12 84 17 2 2 4 4 271 35
Markets 248 30 386 81 255 44 889 155 Shopping Roadside
vendors 407 81 6
488 6
Moto 1000 48 5000 7 60 5 160 4 6220 64
Tuk Tuk 3000 48 3000 12 100 2 6100 62
Taxi 450 24 400 1 18 8 130 2 998 35
Boat 100 18 65 0 20 5 20 205 23
Tour guides 1983 0 924 3 10 3 2917 6
Cyclo 145 5 145 5
Transportation
Tour Op. 128 225 10 4 6 359 14
Hotel 6423 238 3816 229 58 15 1291 52 11588 534
Guesthouse 1006 61 982 64 39 26 594 68 2621 219
Restaurants 1492 38 4426 107 181 107 781 59 6880 311 Staff
Shops 2280 37 493 65 11 8 2784 110
Total 20643 688 21974 850 938 235 4220 397 20643 47775 2170
Source: author interviews of suppliers to the Cambodian tourism industry
Page 30 of 38
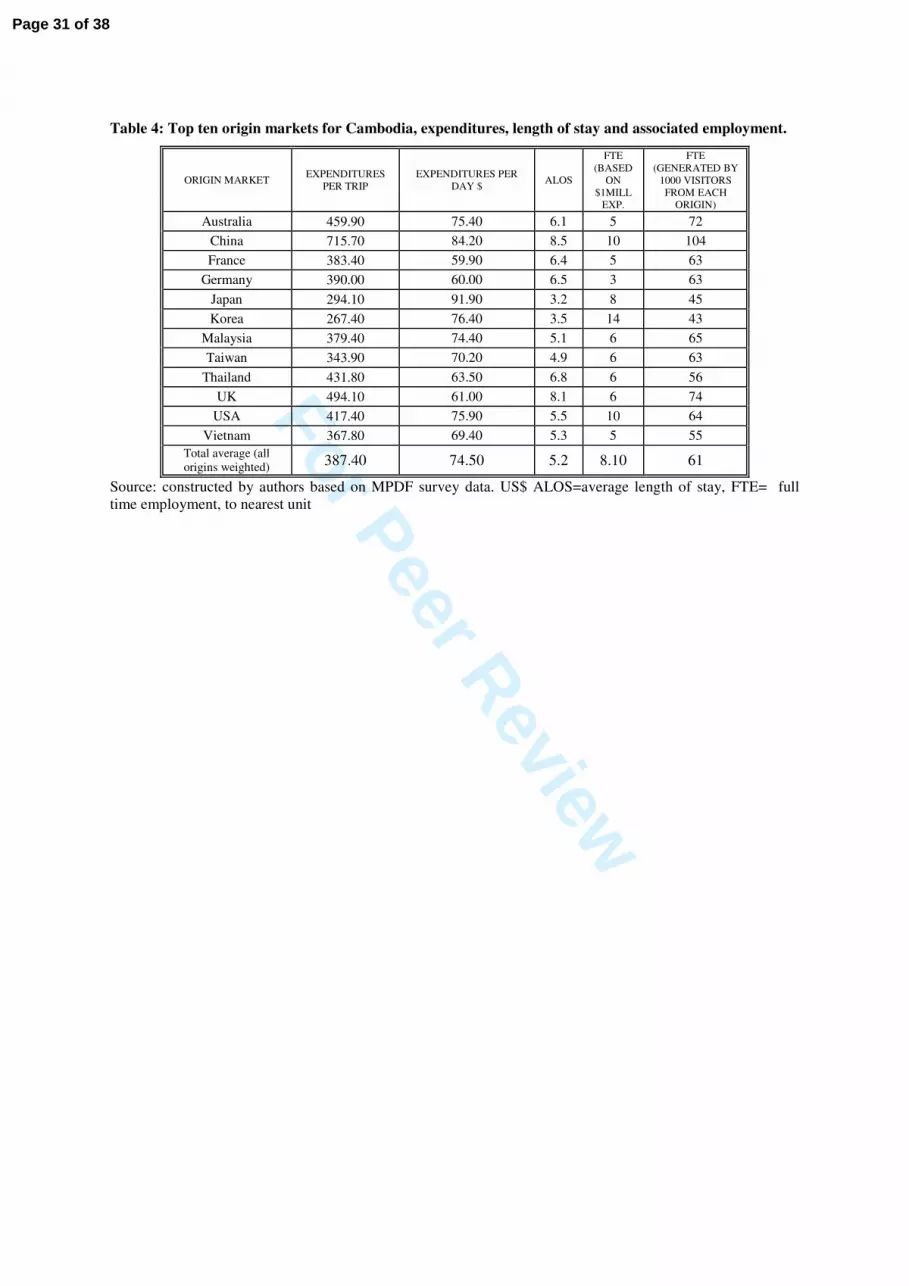
For Peer Review
Table 4: Top ten origin markets for Cambodia, expenditures, length of stay and associated employment.
ORIGIN MARKET EXPENDITURES
PER TRIP EXPENDITURES PER
DAY $ ALOS
FTE (BASED
ON $1MILL
EXP.
FTE (GENERATED BY
1000 VISITORS FROM EACH
ORIGIN)
Australia 459.90 75.40 6.1 5 72
China 715.70 84.20 8.5 10 104
France 383.40 59.90 6.4 5 63
Germany 390.00 60.00 6.5 3 63
Japan 294.10 91.90 3.2 8 45
Korea 267.40 76.40 3.5 14 43
Malaysia 379.40 74.40 5.1 6 65
Taiwan 343.90 70.20 4.9 6 63
Thailand 431.80 63.50 6.8 6 56
UK 494.10 61.00 8.1 6 74
USA 417.40 75.90 5.5 10 64
Vietnam 367.80 69.40 5.3 5 55
Total average (all origins weighted)
387.40 74.50 5.2 8.10 61
Source: constructed by authors based on MPDF survey data. US$ ALOS=average length of stay, FTE= full time employment, to nearest unit
Page 31 of 38

For Peer Review
Table 5: Direct Locally Retained Expenditures by supply chain
Supply Chain Direct Locally Retained Expenditure (%)
Guides 100.00
Entrance fees to museums, sights and other 70.00
Restaurants 68.10
Shopping 66.00
Hotels and Guest Houses 61.80
Transportation from town to another 60.00
Transport within a town 60.00
Excursion/tours 60.00
Spa/massage 50.00
Other 43.20
Casino 13.60
Based on formula for estimating DLRE
Page 32 of 38

For Peer Review
Table 6: Estimated Direct Locally Retained Expenditure in Cambodia by origin market
Origin DLRE PER TRIP
$ DLRE PER DAY $
China 421.70 49.50
UK 317.20 39.10
Australia 301.30 49.40
USA 267.50 48.70
Thailand 263.40 38.70
Germany 248.10 38.40
France 247.00 38.40
Malaysia 230.10 45.10
Vietnam 227.40 42.60
Taiwan 220.00 44.60
Japan 186.90 58.00
Korea 177.00 50.70
Total average (all origins weighted) 248.80 47.40
DLRE = Direct Locally Retained Expenditure = direct expenditure – direct leakages.
Page 33 of 38

For Peer Review
Table 7: Job and tourism sales based incomes to the poor by origin market
Employee PPI per trip
Tourism sales based income to the poor
per trip
PPI per trip PPI PER DAY
$
PPI AS % OF TRIP
EXP.
China $ 34.90 $ 14.90 $ 49.80 5.8 7.0
UK $ 26.40 $ 19.00 $ 45.40 5.6 9.2
Australia $ 24.00 $ 18.40 $ 42.40 7.0 9.2
Germany $ 23.20 $ 13.20 $ 36.40 5.6 9.3
France $ 23.00 $ 13.20 $ 36.20 5.6 9.4
USA $ 21.50 $ 16.40 $ 37.80 6.9 9.5
Malaysia $ 21.00 $ 14.70 $ 35.70 7.0 9.4
Vietnam $ 16.00 $ 10.90 $ 26.90 5.0 7.3
Taiwan $ 13.70 $ 11.60 $ 25.20 5.1 7.3
Thailand $ 13.60 $ 8.90 $ 22.50 3.3 5.2
Japan $ 13.20 $ 11.30 $ 24.50 7.6 8.3
Korea $ 8.80 $ 8.30 $ 17.20 4.9 6.4
Total average (all origins weighted)
$19.90 $13.40 $31.00 5.7 8.0
Employee PPI per trip = employee pro-poor income per trip = (poor employee % of wages) * (income % of total sales) * (tourist expenditure/ trip)
Tourism Sales based income to the poor per trip = the combined tourism supplier/direct seller pro-poor impact = (poor supplier % of purchase + % direct sellers from poor background) * (supplies % of total sales - leakage)* (tourist expenditures per trip)
PPI per trip = Employee PPI per trip + Tourism Sales based income to the poor per trip
Page 34 of 38
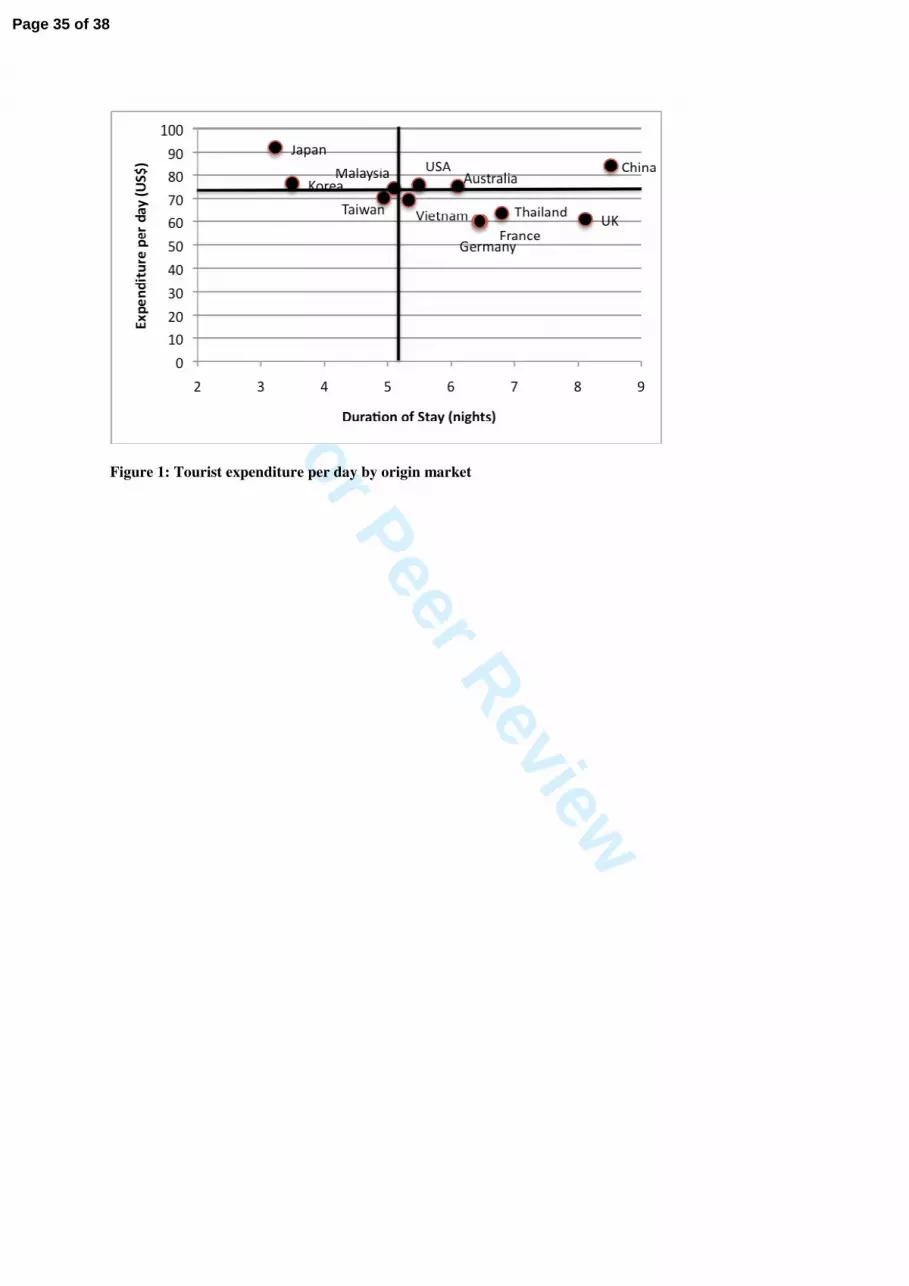
For Peer Review
Figure 1: Tourist expenditure per day by origin market
Page 35 of 38

For Peer Review
Figure 1: Employment associated with $1 million expenditure from major origin markets to
Cambodia
Page 36 of 38

For Peer Review
Figure 1: Direct locally retained expenditure in Cambodia by origin market and length of stay
Page 37 of 38
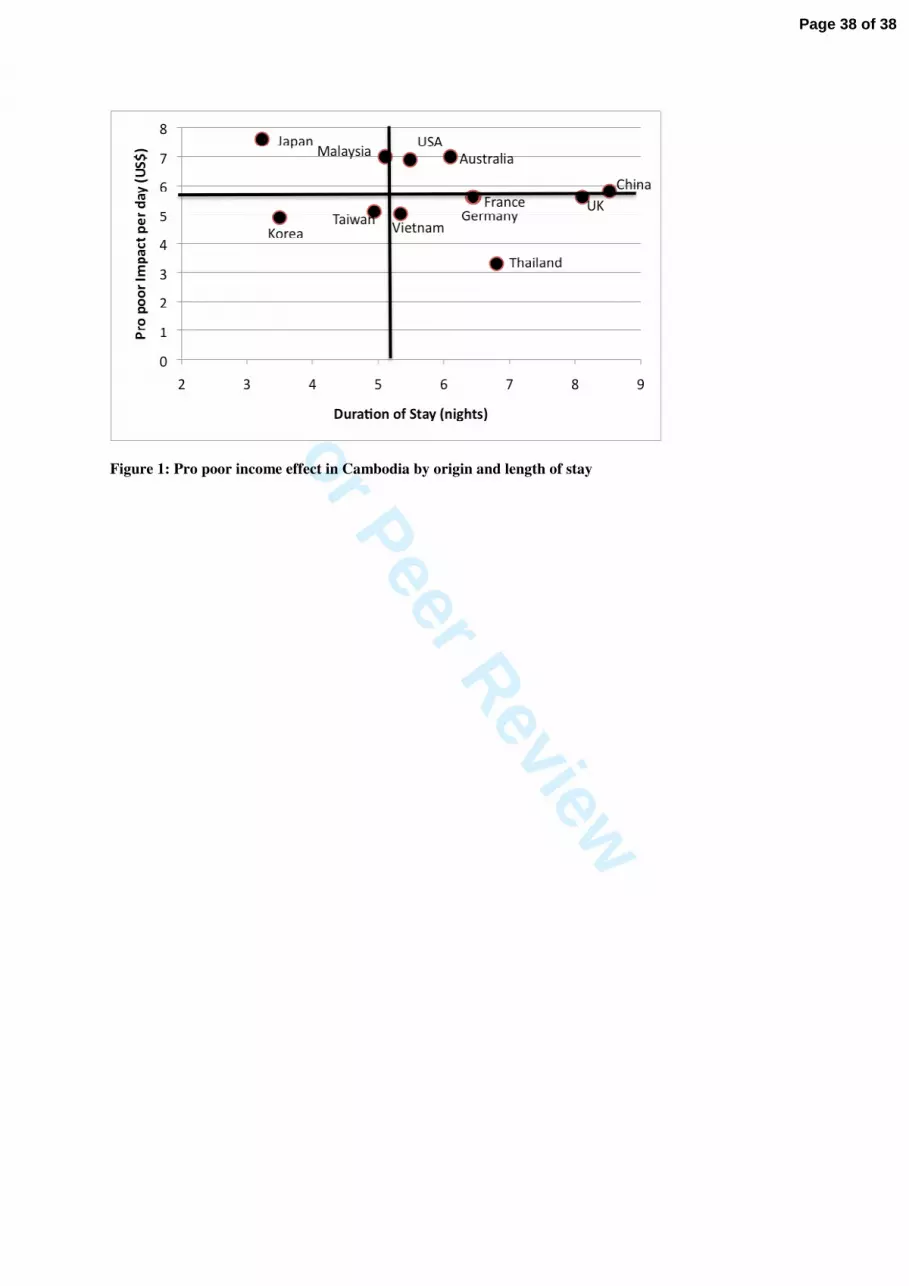
For Peer Review
Figure 1: Pro poor income effect in Cambodia by origin and length of stay
Page 38 of 38