tobacco rattle virus infection alters root volatile emissions to
TRANSCRIPT
Plant–virus–vector interactions:
Tobacco rattle virus infection alters
root volatile emissions to attract
nematode vectors
Pierre-Alain Guillaume van Griethuysen
PhD
University of York
Biology
June 2020
2
Abstract
Plant–virus–vector interactions mediate important ecological processes and can
significantly reduce crop production. Almost all plant viruses require vectors for
transmission and use sophisticated mechanisms to achieve this: they manipulate host
plants to release volatile chemical that attract their vectors. This chemoattraction has
been demonstrated in above-ground interactions but has never been studied in viruses
transmitted by soil-dwelling nematodes. Tobacco rattle virus (TRV) is an important pest
of potato, transmitted by trichodorid nematodes. This work uses a model plant system
to investigate the effects of TRV infection on host root architecture, root volatile
release and chemoattraction of its nematode vectors.
TRV infection alters root structure, producing a smaller and more compact root system.
It modifies root volatile profiles compared to uninfected plants, which leads to
trichodorids preferentially moving towards infected plants. The TRV genome contains
genes known as 2b and 2c; implicated for nematode transmission. Mutations in these
genes reduce the severity of root architecture symptoms, remove differences in the
profile of volatiles released from infected roots compared with uninfected ones and, in
the case of 2b, make plants less attractive to nematodes than plants infected with
viruses without mutations. The release of the volatile 2-ethyl-1-hexanol significantly
increased in roots infected by TRV. When added to uninfected plants, it made them
more attractive to nematodes than untreated counterparts.
This work demonstrates TRV manipulates the production of host root volatiles, leading
to increased attraction of trichodorid vectors. 2b and 2c are important in this
interaction and 2-ethyl-1-hexanol is a strong component of the attractant signal. This
new knowledge shows nematode transmitted viruses use similar mechanisms to attract
their vectors as their better-studied aboveground counterparts and contributes to the
study of volatile- mediated rhizosphere interactions with implications for agricultural
pest control.

3
Table of contents
Abstract ......................................................................................................... 2
List of figures ............................................................................................... 5
List of tables ................................................................................................. 8
Acknowledgements ....................................................................................... 9
Author’s declaration ..................................................................................... 10
Chapter 1 : General introduction ................................................................. 11
Plant–virus–vector interactions in ecology and agriculture ............................................ 11
Plant virus–vector relationships .................................................................................................... 12
Nematode vectors of plant viruses ............................................................................................... 16
Trichodoridae: vectors of tobraviruses ........................................................................................ 18
Global impact of tobraviruses ....................................................................................................... 21
Impact of plant volatiles ................................................................................................................. 24
Purpose of thesis ................................................................................................................... 27
Chapter 2 ..................................................................................................... 30
Introduction ........................................................................................................................... 30
Methods .................................................................................................................................. 38
Plant growth and infection ............................................................................................................. 38
Growth and root morphology ....................................................................................................... 42
Root VOC sampling ....................................................................................................................... 43
Trichodorid choice experiments ................................................................................................... 49
Statistical analysis ............................................................................................................................. 51
Results ..................................................................................................................................... 53
Growth and root morphology ....................................................................................................... 53
Root VOC sampling ....................................................................................................................... 57
Trichodorid assays ........................................................................................................................... 62
Discussion .............................................................................................................................. 65
Chapter 3 ..................................................................................................... 69
Introduction ........................................................................................................................... 69
Methods .................................................................................................................................. 73
TRV mutant design ......................................................................................................................... 73
Plant growth and infection ............................................................................................................. 73
Growth and root morphology ....................................................................................................... 74
Root VOC sampling ....................................................................................................................... 75
4
Trichodorid response ...................................................................................................................... 75
Statistical analysis ............................................................................................................................. 75
Results ..................................................................................................................................... 77
Growth and root morphology ....................................................................................................... 77
Root VOC sampling ....................................................................................................................... 84
Trichodorid response ...................................................................................................................... 86
Discussion .............................................................................................................................. 89
Chapter 4 ..................................................................................................... 94
Introduction ........................................................................................................................... 94
Methods .................................................................................................................................. 99
Plant growth and infection ............................................................................................................. 99
Trichodorid responses .................................................................................................................... 99
Results ................................................................................................................................... 101
Agrobacterium control + vs Agrobacterium control ...................................................................... 101
TRV-Δ2b infection + vs TRV wild-type infection .................................................................. 102
Discussion ............................................................................................................................ 104
Chapter 5 : General Discussion ................................................................. 107
Overview .............................................................................................................................. 107
Synthesis of findings ........................................................................................................... 108
Changes in biomass and root architecture as a result of infection .............................. 110
Presence of root volatile emissions as a result of viral infection ................................. 113
Removal of RNA-2 genes reduces effects of infection ................................................. 116
Trichodorids are attracted to TRV-infected plants ........................................................ 118
2-ethyl-1-hexanol as major causative agent of TRV-induced plant signals ................ 119
Implications for agricultural management of TRV and other nematode-transmitted
viruses ................................................................................................................................... 121
Summary and conclusions ................................................................................................. 126
List of references ....................................................................................... 127
5
List of figures
Figure 1.1 Taxonomy of phylum Nematoda highlighting the four clades of plant
parasitic nematodes.. ............................................................................................................. 17
Figure 1.2 Effects of trichodorid feeding on onion plants. ........................................ 19
Figure 1.3 Figure 1.3 Virus retention sites in the feeding apparatus of vector
nematodes.. .............................................................................................................................. 20
Figure 1.4 Electron micrograph of long and short Tobacco rattle virus particles
and symptoms of spraing disease in cut potato tubers. ............................................. 22
Figure 1.5 Genome organisation of various RNA-2 isolates showing the diversity
and distribution of genes. ................................................................................................... 23
Figure 1.6 Examples of volatile-mediated interactions that provided the
background for this thesis. .................................................................................................. 27
Figure 2.1 Hydroponic plants and volatile sampling. .................................................. 44
Figure 2.2 Semi-static headspace sampling with stainless steel canisters. ........... 45
Figure 2.3 Dynamic headspace sampling with adsorbent volatile collection traps.
...................................................................................................................................................... 48
Figure 2.4 Olfactometers with N. benthamiana plants. .............................................. 49
Figure 2.5 Baermann extraction funnels. ........................................................................ 51
Figure 2.6 Mean dry weights for above and belowground portions of N.
benthamiana plants grown in sand for root scanning different days post initial
infection. ................................................................................................................................... 54
Figure 2.7 Ratio of root dry weight (g) to total plant weight (g) of N.
benthamiana plants grown in sand for root scanning different days post initial
infection. ................................................................................................................................... 55
6
Figure 2.8 Root surface area:volume ratio and total root length (cm) of N.
benthamiana plants grown in sand for root scanning different days post initial
infection. ................................................................................................................................... 56
Figure 2.9 Mean dry weights for above and belowground portions of N.
benthamiana plants grown in hydroponics 7 days post infection. ........................... 57
Figure 2.10 Average root VOC fluxes from roots of plants infected with TRV. .. 59
Figure 2.11 Normalised expression of RNA-2 coat protein gene to two different
N. benthamiana reference genes (APR and EF1α) ...................................................... 60
Figure 2.12 Example chromatograms of dynamic headspace solvent-based root
VOC sampling. ........................................................................................................................ 61
Figure 2.13 Raw chromatogram of 4,5 dimethyliazole and β caryophellene at
concentrations of 10ng ml-1.. ............................................................................................... 62
Figure 2.14 Response of trichodorids within olfactometers presented with
uninfected and TRV infected plants.. ............................................................................... 63
Figure 2.15 Comparison of nematode movement towards infected plants with
two indicators for degree of infection.. ............................................................................ 64
Figure 3.1 Genome diagram of TRV isolate PpK20. ................................................... 71
Figure 3.2 The effect of infection with wild-type TRV and frameshift mutants on
root and shoot biomass across an infection timeline. ................................................. 78
Figure 3.3 The effect of infection with wild-type TRV and frameshift mutants on
root to total plant weight ratio across an infection timeline. ..................................... 79
Figure 3.4 The effect of infection with wild-type TRV and frameshift mutants on
total root length and root surface area across an infection timeline. ...................... 82
Figure 3.5 The normalised expression of TRV coat protein gene in N.
benthamiana roots across a 28-day infection timeline. ............................................... 83

7
Figure 3.6 Average root VOC fluxes from roots of plants infected with different
TRV treatments, showing the effects of 2b and 2c. ..................................................... 84
Figure 3.7 The relationship of 2-ethyl-1-hexanol (top) and 1,3-ditertbutylbenzene
(bottom) fluxes with viral load. .......................................................................................... 85
Figure 3.8 The preference of trichodorid nematodes given a choice between
plants infected with different TRV treatments. ............................................................. 87
Figure 3.9 The relationship of nematode preference and viral load ....................... 88
Figure 4.1 Synthesis of fatty-acid derived volatiles in plants..................................... 96
Figure 4.2 Amended olfactometer design for 2-ethyl-1-hexanol trials. ................... 99
Figure 4.3 The preference of trichodorid nematodes given a choice between
Agrobacterium-infected plants (“uninfected” with TRV) with or without the
addition of 2-ethyl-1-hexanol. ........................................................................................... 101
Figure 4.4 The preference of trichodorid nematodes given a choice between
TRV wild-type infected plants and TRV-Δ2b infected plants with added 2-ethyl-
1-hexanol. ................................................................................................................................ 102
Figure 4.5 The relationship of nematode preference and viral load. .................... 103
Figure 5.1 Main findings of thesis .................................................................................. 125

8
List of tables
Table 2.1 Composition and concentration of Hoagland’s nutrient solution......... 38
Table 2.2 TRV-1 and TRV-2 primers used to test successful infection of plants.
...................................................................................................................................................... 40
Table 2.3 RT-qPCR primers for the replicase gene on RNA1 and the coat protein
gene on RNA2 of TRV with two N. benthamiana reference genes. ....................... 42
Table 5.1 Summary of hypotheses relating to changes in biomass and root
architecture as a result of infection.. .............................................................................. 108
Table 5.2 Summary of hypotheses relating to presence of root volatile emissions
as a result of viral infection. .............................................................................................. 108
Table 5.3 Summary of hypotheses relating to the removal of RNA-2 genes
reducing effects of infection.. ........................................................................................... 109
Table 5.4 Summary of hypotheses relating to trichodorid attraction to plants
infected with different treatments. .................................................................................. 109
Table 5.5 Summary of hypotheses relating to effects of 2-ethyl-1-hexanol on
trichodorid attraction. ......................................................................................................... 109
9
Acknowledgements
I would like to begin by thanking my supervisors, Susan Hartley, Kelly Redeker, Roy
Neilson and Stuart MacFarlane for all of their help with this thesis, both in the lab and
outside it. I would particularly like to thank Sue and Kelly for their massive continued
support over a far longer time period than any of us imagined! Without their constant
encouragement, cajoling and chasing I would not be sat here typing these words with
this thesis otherwise ready to submit. Sue, for the tough love I needed and the detailed
plans and Kelly for always being there to talk to when I most needed and for the
endless technical help with GC disasters. I’m sorry we had to switch columns so many
times…Thank you to Roy for all the trichodorids and to Stuart for the long distance
help with TRV infections and letting me have half your office for a month and a half
and the lab expertise.
The Biology department at York is a wonderful place. I should know, I’ve been there
nearly 10 years. For all members of the department who have made these years that
much better; D0 and J1 labs past and present; I’ve been here too long to be able to list
all the names but particularly Phil, Pasky, Leda, Megan, Lucie and, although it was far
too brief, Jordan and Theo. I would like to thank my TAP panel, Louise Jones and
Katherine Denby for the insightful feedback and probing questions!
A mixed thank you to all my performing friends over the years; from Uni G&S to York
Opera and York Light. You have provided me with a wonderful new hobby and
provided relief in the most frustrating times, but the endless shows did nothing for my
productivity! Regardless, you are all wonderful, talented and lovely people who I could
count on and I am privileged to be friends with.
To my family, near and far. My parents and sister for their boundless support, in all
forms that it took and for always being there, through the highs and plunging lows of
the last 5 years. And finally, to Annabel, for always being here in whatever way I needed
you, too many to list, and the endless love and patience you’ve provided me. Thank you.

10
Author’s declaration
I declare that all the material in this thesis, apart from that described below, is a result of
my own work. The project was a HAPI (Horticulture and Potato Initiative) studentship
with funding from the BBSRC (Biotechnology and Biosciences Research Council), and
the thesis was written by me, with comments from Kelly Redeker, Roy Neilson and
Susan Hartley. This work has not previously been presented for an award at this, or any
other, University. All sources are acknowledged as references.
The experiments were planned by Pierre-Alain van Griethuysen, Susan Hartley, Kelly
Redeker, Stuart MacFarlane and Roy Neilson and carried out in the lab by Pierre-Alain
van Griethuysen at the University of York and James Hutton Institute. Virus constructs
and Agrobacterium cultures were designed and supplied by S MacFarlane and trichodorid
nematodes extracted and supplied by R Neilson.

11
Chapter 1 : General introduction
Plant–virus–vector interactions in ecology and agriculture
Plant viruses are arguably some of the most influential viruses on ecosystems, as
plants comprise up to 80% of global biomass (Lefeuvre et al. 2019). The abundance and
ubiquity of plant hosts allows for a broad diversity of plant viruses, with over 1,500
species currently described (Moreno and López-Moya 2020). Plant viruses manipulate
not only the host plant but also the movements and feeding behaviour of viral vectors;
those organisms that transport the virus from infected host to uninfected plants. Plant–
virus interactions therefore form an important basis for communication between
organisms within the ecosystem. These viral vectors are also an important food source
for other trophic levels, both predators and parasitoids. By affecting the distribution of
their prey, plant viruses affect these higher trophic levels.
Viruses make up 47% of emerging plant diseases and the majority of these are
transmitted by vectors (Whitfield et al. 2015). Newly emerged diseases can be
devastating for crops, particularly intensively farmed monocultures, and diseases caused
by viruses increase with intensification (Roossinck and Garcia-Arenal 2015). For
example, Rice yellow mottle virus, transmitted by beetles, has emerged as an
economically important disease, particularly in East Africa, as a result of intensification
(Rybicki 2015). Pathogens, including viruses, cause global crop losses of up to 16%
annually, a figure which is increasing even while food crop yields also increase, as
highlighted in the 2016 State of the World’s Plants report (RBG Kew 2016).
Some agricultural plant viruses, such as Cucumber mosaic virus, are transmitted by
multiple different vectors (Gallitelli 2000). Other virus–vector pairings are specific, and
display complex interactions, suggesting a long history of co-evolution (Mauck et al.
2012). These long-term co-evolutionary interactions may determine the host range of
the virus. A virus that relies upon generalist vectors that feed on a broad range of
plants, and is therefore presented with a range of different hosts, is more likely to
become a generalist themselves. Alternatively, viruses with vectors that are very selective
in their feeding are likely to specialise. This pattern may be different for non-circulative
viruses; for instance, aphid vectors of Cucumber mosaic quickly probe plants even if
they do not feed on them. This allows non-circulative viruses held in aphid mouthparts

12
to quickly enter the plant, whereas circulative viruses require a longer feed for successful
transmission.
Controlling viral diseases in agricultural systems is an acknowledged challenge
for the 21st century. The begomovirus Africa cassava mosaic virus (ACMV) and other
related viruses, transmitted by the whitefly Bemisia tabaci (McCallum et al. 2017), are a
major threat to food security on the African continent with particular challenges for
farming families who rely on cassava as a dietary staple (Rybicki and Pietersen 1999).
The most widely adopted way of controlling these pathogens is the development of
resistant varieties of cassava, rather than direct control of the vector or virus
(McCallum et al. 2017). Cucumber mosaic virus, with its broad host range, is responsible
for crop losses in several different crops, including tomato, melon, peppers and
sunflowers (Gallitelli 2000). Cucumber mosaic virus is also challenging to control.
Conventional measures are not very effective (Scholthof et al. 2011), as insecticides
work too slowly to kill aphids before they are able to transmit the virus, due to its non-
circulative transmission mechanism (Mauck et al. 2010).
This illustrates that in order to better manage agricultural viruses it is important to
understand the various interactions between plants, viruses and their vectors.
Transmission dynamics are mediated by complex interactions between all three parties,
both in terms of attraction and in transmission mechanism between plant and vector
(Mauck et al. 2014).
Plant virus–vector relationships
In order to survive, viruses need to propagate and be transmitted to new indivudals.
A unique challenge for plant viruses is that their hosts are sessile, which makes direct
contact between infected and uninfected individuals more difficult. Transmission can
either be horizontal, from one individual to another, or vertical, from one individual to
progeny. Some viruses can be transmitted through seeds and pollen, providing two
sources of vertical transmission (Hamelin et al. 2016) and while rare examples of
horizontal transmission by direct contact do exist (Lefeuvre et al. 2019), in the majority
of cases this transfer is carried out by transmission vectors (Whitfied et al. 2015). Of
those vectors, over 70% are insects (Dietzgen et al. 2016), primarily hemipterans such as
aphids, whitefly, leafhoppers, planthoppers and thysanopterans (thrips) (Claflin et al.
2017, Moritz et al. 2004, Safari et al. 2019), which are well adapted to transmitting viruses
due to their piercing and sucking mouthparts (Lefeuvre et al. 2019). A smaller number
13
of plant viruses are transmitted by mites (Rodrigues and Childers 2013) nematodes
(Taylor and Brown, 1997), fungi (Campbell 1996) and protists (Tamada et al. 2013).
Relationships between virus and vector vary in length and specificity (Dáder et al.
2017, Whitfield et al. 2015). Some viruses occupy their vectors transiently, and are
known as non-circulative, whereas circulative viruses enter the body of the vector,
usually an insect. Non-circulative viruses can either be very short-lived and remain in
the mouthparts of the vector, persisting for just minutes, or be semi-persistent and have
the potential to remain within the insect until the next moult, with precise interactions
between viral capsids and specific retention sites within the vector (Zhou et al. 2018).
Circulative viruses enter the vector body and pass into the cells; of these some even
propagate within the vector tissues (Whitfield et al. 2015). Therefore, it can be
disingenuous to call some of these viruses purely “plant viruses” as they colonise and
propagate in the non-plant vectors that transport them, and many potentially evolved
from viruses that had non-plant hosts (Lefeuvre et al. 2019).
Typically, non-circulative viruses tend to be more generalist (Lefeuvre et al. 2019),
while circulative viruses have higher virus–vector specificity. Gallet et al. (2018)
suggested this to be due to an increased need for specificity of the protein–protein
interactions between viral and vector proteins for circulative viruses. While circulative
viruses must bind to epithelial cells in the gut before being endocytosed (Ammar et al.
2009), non-circulative viruses bind to cuticles in mouthparts (Webster et al. 2018) with
the foregut as the primary target for semi-persistent viruses (Deshoux et al. 2018).
These interactions are not limited to purely viral–vector relationships. The
multitrophic interactions of plant, virus and vector are co-evolved and complex
(Pinheiro et al. 2019). Plants defend themselves against both virus and vector and it has
been suggested that the virus/vector pair collaborate in response in a continuing
evolutionary tug of war (Kersch-Becker and Thaler 2014).
Plant viruses affect plants in several ways and are often thought of as purely
pathogenic, imposing a burden and producing purely negative consequences for the
host. However, plants can be infected with multiple viruses at a time (Moreno et al.
2020) and not all have necessarily negative impacts on the host (Lefeuvre et al. 2019),
although interactions between multiple viruses can often exacerbate symptoms of
disease (Xu et al. 2003). It has been suggested that viruses may not be purely
14
antagonistic in their indigenous systems, causing little harm to their natural, uncultivated
hosts, with suggestions that they may even lead to mutualisms (Roossinck 2015, Shates
et al. 2019). Generally, viral infections still cause harm to their hosts, even if this may be
reduced with less severe disease symptoms in unmanaged, stable populations (Fraile et
al. 2017, Malmstrom and Alexander 2016). New diseases emerge when new ecological
conditions are encountered and almost all studies of new disease emergence are centred
on agriculture (Lefeuvre et al. 2019), where diseases move from wild hosts to managed
cultures across borders between natural and managed ecosystems known as the “agro-
ecological interface” (Alexander et al. 2014). Viral infection can cause many
physiological changes within the host plant, often influencing the behaviour of their
vectors, leading to greater dispersal rates. These have been reviewed extensively in the
past decade (Carr et al. 2018, Dáder et al. 2017, Eigenbrode et al. 2018, Mauck et al.
2018), but these reviews have focused on insect vectors due to insufficient data for
other vectors, such as nematodes. Viruses may indirectly affect their vectors by making
host plants more attractive, leading to increased settling and feeding on infected plants
(Eigenbrode et al. 2018), although specific feeding behaviours may be driven through
different functional outcomes depending upon the circulatory nature of the virus
(Mauck et al. 2012). Non-circulative viruses only persist in the vector for minutes but
are quickly taken up; so making the plant unpalatable, or of lower nutritional value, to
encourage the vector to find a different plant quickly may benefit transmission (Hodge
and Powell 2008). Circulative viruses on the other hand are less easily taken up, and
persist in the vector for longer, so increased palatability of the plant and improved
survival rates through enhanced nutrition of the vector are preferable (Legarrea et al.
2015, Mauck et al. 2010). Circulative viruses that enter the tissues of their insect vectors
can directly modify the behaviour of their vectors. This causes viruliferous vectors to
prefer feeding on uninfected plants, while non-viruliferous vectors tend to prefer
infected plants (Dáder et al. 2017).
There are two main mechanisms by which viruses can directly attract above-
ground vectors to settle on host plants: colour and odour (Fereres and Moreno 2009).
Aphids and other hemipteran insects are attracted to the colour yellow (Döring and
Chittka 2007), and changes in leaf colour to lighter colours including yellow is a
symptom of many different viral infections (Li et al. 2016). Preference tests carried out
in light vs dark conditions confirm the importance of these visual cues (Eigenbrode et
al. 2018). Olfactory attraction is mediated by volatiles released by infected plants. These

15
differ from healthy plants, apparently either by increasing the total concentration of
emitted volatiles or by altering the concentration of a few compounds within the blend
of volatiles emitted (Eigenbrode et al. 2018). The volatile cocktail emitted by virus-
infected plants form crucial, long-range cues for vector behaviour in choosing hosts
(Fereres et al. 2016). Understanding the volatile chemical cues that influence vectors is
helpful to understand vector behaviour and could lead to options for better agricultural
control. For example, volatile cues and vector preference from Barley yellow dwarf
virus (BYDV) pathosystems have been well studied (Bosque-Pérez and Eigenbrode
2011, Ingwell et al. 2012), identifying (Z)-3-hexenyl-acetate as being present at
significantly elevated concentrations, and overall volatile organic compound (VOC)
concentrations being higher in the headspace of infected plants (Jiménez -Martinez et al.
2004). (Z)-3-hexenyl-acetate and several other compounds were found to be attractants
for aphid vectors (Medina-Ortega et al. 2009). This may inform future integrated control
methods for BYDV, although due to its highly effective dispersal, understanding the
spatial and temporal dynamics is crucial (Van den Eynde et al. 2020) and identifying viral
resistance in crop plants a critical focus (Choudhury et al. 2019). BYDV is transmitted
by over 25 species of aphids and is probably the most economically important cereal
virus (Walls et al. 2019). It can cause losses of 11-33% (Miller et al. 1997), and
sometimes up to 80%, of spring cereals (Perry et al. 2000). Most of the work on
identifying chemical cues from plants infected with viruses has been carried out on
those transmitted by aphids. While these aboveground virus–vector systems, particularly
aphids, have been well researched, little is known about chemical cues and vector
attraction for viruses spread by non-insect, subsurface vectors such as nematode-
transmitted viruses.

16
Nematode vectors of plant viruses
Nematodes, otherwise known as “roundworms”, are a species-rich group of
invertebrates that have spread to occupy incredibly diverse environments across the
globe. They are ubiquitous in soils, freshwater, estuarine and marine sediments and exist
at the extreme boundaries of life. Of these, it is estimated that there are over 41,000
species of plant parasitic nematodes, which constitutes about 15% of described
nematode species (Quist et al. 2015). Plant parasitism evolved at least four times,
forming four distinct lineages (Figure 1.1). It is likely that plant parasitism evolved from
fungal feeding and each plant-parasitic clade contains basal species that are fungivores
(Quist et al. 2015). While the majority of plant-parasitic nematodes feed on plant roots,
a small number are aerial nematodes, which enter plants through the roots, travel
upwards through the shoot and feed and reproduce on aerial plant tissue (Chin et al.
2018). Root parasitic nematodes can be endo- or ectoparasites; a few enter plant roots
and feed and reproduce therein, while most feed externally and reproduce in the soil
matrix.
All nematode vectors of plant viruses belong to those two most basal clades,
(Figure 1) within Dorylaimida (Longidorus, Paralongidorus and Xiphinema spp., Taylor and
Brown 1997) and Triplonchida (Paratrichodorus and Trichodorus spp., Taylor and Brown
1997). They are all migratory ectoparasites, able to move between suitable host plants
and feed on the roots. They are also all polyphagous (King et al. 2011), able to feed on a
variety of host plants, and depending on the species they feed on different parts of the
roots (Taylor and Brown 1997). Some feed on root tips (Longidorus, Xiphinema), others
on the root elongation zone (1-3mm behind the root tips) (Paratichodorus, Trichodorus,
Nanidorus) or other parts of the actively growing root (Xiphinema).

17
Figure 1.1 Taxonomy of phylum Nematoda highlighting the four clades of plant
parasitic nematodes. (from Quist et al. 2015). The different mouthparts (onchiostyle,
odontostyle and stomatostylet) are illustrated, although the morphology of
stomatostylets in Clade 10 will differ from those pictured. All virus-vector nematodes are
in Clades 1 and 2.
18
Trichodoridae: vectors of tobraviruses
There are currently 116 described species in the family Trichodoridae (Subbotin et
al. 2020) and the didelphic genera of Trichodorus, Paratrichodorus and Nanidorus contain
the 14 species known to act as vectors to the tobraviruses. The tobraviruses are a genus
of three viruses—Tobacco rattle virus (TRV), Pea early browning virus (PEBV) and
Pepper ringspot virus (PepRSV)—that are transmitted by trichodorid nematodes. The
distribution of trichodorids is global (Taylor and Brown 1997), but particularly
widespread in North America and Europe (Duarte et al. 2011), with the highest number
of species per country (15) in Spain (Subbotin et al. 2020). In the UK, the most
important and well distributed species are Paratrichodorus pachydermus, Trichodorus primitivus
and Trichodorus similis (Boutsika et al. 2004) with high concentrations in eastern Scotland,
Yorkshire and East Anglia. P. anemones, another vector species, is rare outside Yorkshire
(Holeva et al. 2006). Trichodorids are almost exclusively found in free-draining sandy
soils and rarely found in clay or silt-based soils, although exceptions exist (Taylor and
Brown 1997). Small nematodes like trichodorids rely on films of water to move through
soils and it has been suggested that densely packed soils of predominantly small
particles such as silt and clay are impassable to trichodorids (Jones et al. 1969).
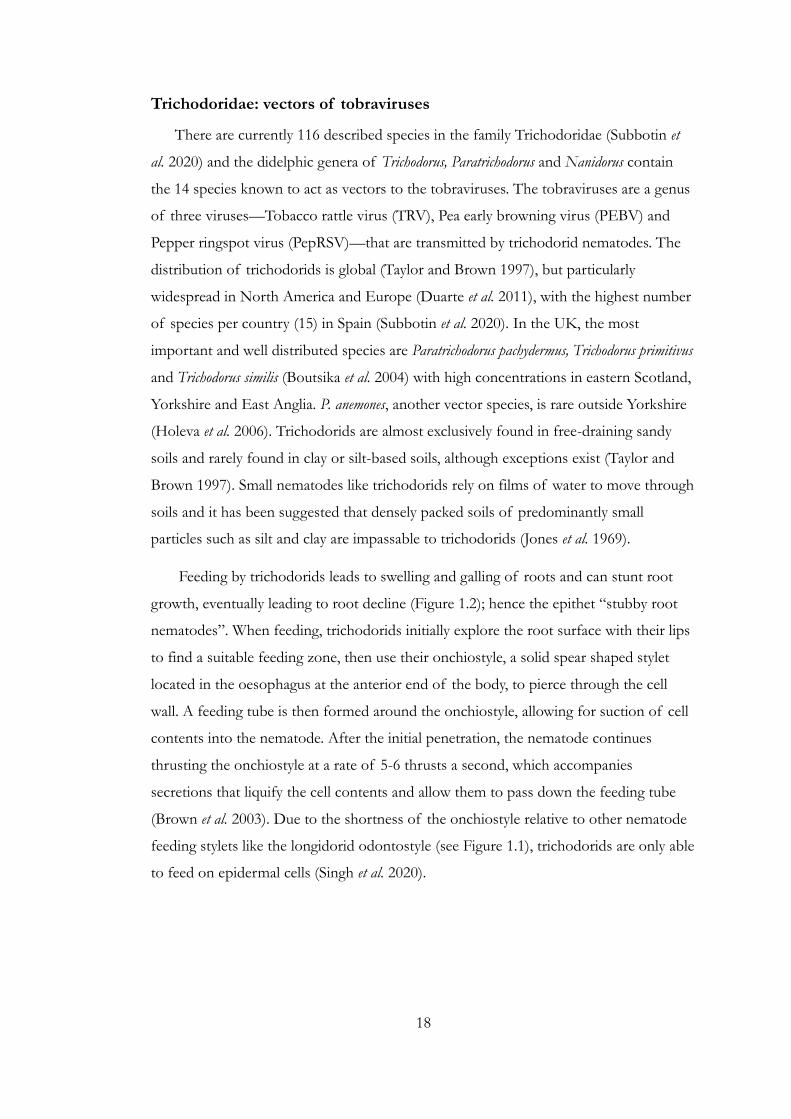
Feeding by trichodorids leads to swelling and galling of roots and can stunt root
growth, eventually leading to root decline (Figure 1.2); hence the epithet “stubby root
nematodes”. When feeding, trichodorids initially explore the root surface with their lips
to find a suitable feeding zone, then use their onchiostyle, a solid spear shaped stylet
located in the oesophagus at the anterior end of the body, to pierce through the cell
wall. A feeding tube is then formed around the onchiostyle, allowing for suction of cell
contents into the nematode. After the initial penetration, the nematode continues
thrusting the onchiostyle at a rate of 5-6 thrusts a second, which accompanies
secretions that liquify the cell contents and allow them to pass down the feeding tube
(Brown et al. 2003). Due to the shortness of the onchiostyle relative to other nematode
feeding stylets like the longidorid odontostyle (see Figure 1.1), trichodorids are only able
to feed on epidermal cells (Singh et al. 2020).
19
Figure 1.2 Effects of trichodorid feeding on onion plants. (photo by Dr Hajihassani,
University of Georgia).
Virus particles are included in the liquified contents of cells that are ingested
through the feeding tube and are retained in the feeding apparatus of nematodes,
bound to the cuticular lining of the oesophagus in trichodorids (Taylor and Robertson
1970 and Figure 1.3). Retained virus is released during feeding when the initial gland
secretions are released and wash over the virus; this is thought to occur as a result of
changes in pH, which brings dissociation from retention sites (Taylor and Robertson
1977).

20
Figure 1.3 Figure 1.3 Virus retention sites in the feeding apparatus of vector nematodes.
(from Taylor and Brown 1997).
Like most nematodes, trichodorids have six life stages: egg, four juvenile stages and
adult. However, unlike endoparasites, of either plants or animals, all stages take place in
soils. Trichodorids moult between juvenile instars and before becoming adults, in which
the cuticle separates from the underlying layers, a new cuticle forms and the old one
sheds. This shedding includes the oesophageal lining, including the odontostyle, which
leads to loss of any retained virus during moulting (Singh et al. 2020). Apart from this
loss, viruses can persist for a long time within their vector, and it has been demonstrated
that trichodorids are capable of serially infecting multiple plants (van Hoof 1964).
Nematode chemotaxis is well documented in the literature, Nematode chemotaxis is
well documented in the literature, with attractive compounds ranging from ketones and
terpenes to organic acids, alcohols and carbon dioxide (Rasmann et al. 2012)..
Chemotaxis has been shown to exist in at least three of up to seven taxonomically
heterogeneous functional types: plant-parasitic (e.g. Ali et al. 2011, Wang et al. 2009,
Farnier et al. 2012 ), entomopathogenic (e.g. O’Halloran and Burnell 2003, Hallem et al.
2011, Ali et al. 2011, Rasmann et al. 2005) and the bacteriovorous (Hallem et al. 2011).
However, no published examples of trichodorid chemotaxis exist. Nematodes have

21
internal and cuticular sense organs; the internal sense organs are thought to respond to
light and mechanical cues, while the cuticular respond to a wider range of cues
including chemical (Rasmann et al. 2012). The most important sense organs for
chemoattraction are the amphids, which are pairs of innervated depressions in the
cuticle found at the anterior end of the nematode. Many nematodes, such as
Caenorhabditis elegans, have further chemoreceptors at the posterior end called phasmids
(Hilliard et al. 2002), but these are lacking in trichodorids (Holterman et al. 2006). There
is well-documented evidence of root volatile organic compounds (root VOCs) being
released as a result of plant wounding by herbivores, attracting entomopathogenic
nematodes (reviewed in Turlings et al. 2012).
It would seem very likely that there exists a combination of these two systems,
wherein trichodorid vectors respond to similar attracting signals from plant roots, which
in this case are exaggerated by viral infection.
Global impact of tobraviruses
. The type virus, TRV, has a wide host range of over 50 plant families and is the
cause of multiple diseases in crop plants: stem mottle and spraing disease in potato,
rattle in tobacco (so named because infected leaves dried and rattled in the wind) , and
yellow blotch in sugar beet, as well as diseases in horticultural plants and weeds (King et
al. 2011). In some cultivars of potato, TRV infection can produce arcs, flecks and rings
of necrotic material in the tubers (MacFarlane 2010), referred to as spraing (UK) or
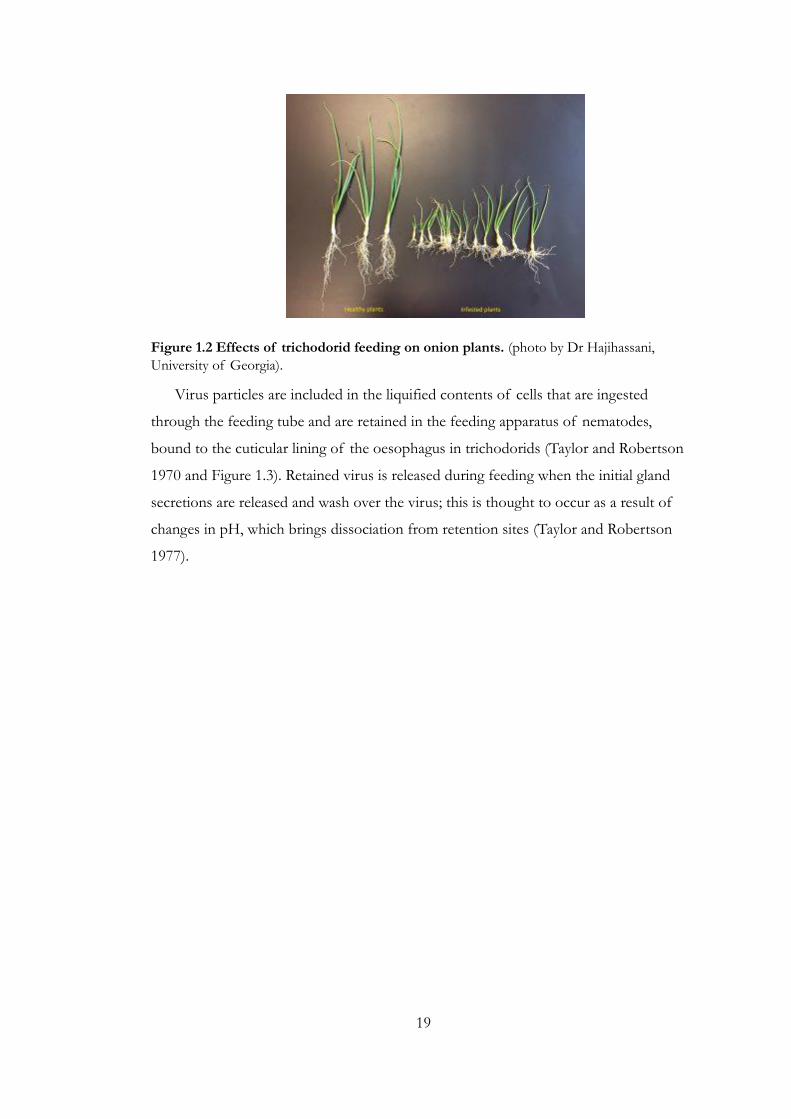
corky ringspot (USA) disease. These marks (Figure 1.4), combined with a reduction in
size of the tubers, can make the crops unmarketable (Sahi et al. 2016).
22
Virus populations that exist now were probably established in the last 150 years,
with movement via agricultural practice of infected potato seed tubers (Dale and
Neilson 2006), a problem potentially exacerbated by the movement of infected
symptomless tubers that were then a source of virus for transmission (Xenophontos et
al. 1998). This has led to the virus becoming established in large, static nematode
populations with common weed species acting as reservoirs for the virus in the field
between potato harvests and during crop rotations. Current methods for controlling
free living plant-parasitic nematodes such as trichodorids are inefficient and rely on
nematicides such as aldicarb, which has been withdrawn in the UK (Dale and Nielson
2006). Combined costs of damage to potato crops and nematicide application have
been conservatively estimated to be £2.2 million per annum in the UK (Dale and
Nielson 2006).
The TRV genome is split into two single-stranded, positive-sense RNAs that are
encapsidated separately in two rod shaped particles of different lengths (Figure 1.4,
MacFarlane 1999). The larger (L) particle that contains RNA-1 is about 185 nm in
length and carries a replicase gene, a movement protein (1a) gene and a cysteine-rich
protein gene (1b), and is involved in replication, co-ordination and movement. The
smaller (S) contains RNA-2 which carries the gene for the viral coat protein (CP) but
Figure 1.4 Electron micrograph of long and short Tobacco rattle virus particles and
symptoms of spraing disease in cut potato tubers. (from MacFarlane 2008 and
hutton.ac.uk). The bipartite Tobacco rattle virus genome is encapsidated separately in two
particles of different sizes and can cause spraing disease when present in potato tubers. The
scale in the micrograph=100nm.

23
also encodes one or two non-structural proteins, 2b and 2c (Figure 1.5, MacFarlane
2010), depending on the isolate. The structure and size of these genes can vary between
isolates (Vassilakos et al. 2001) which impacts the size of the particle; the particle can
range from 46-115nm in length (MacFarlane 2008).
Early work on TRV identified two different types of infection: non-multiplying
(NM) and multiplying, or particle producing (M) (Harrison and Robinson 1978), with
the latter being a full infection with both RNA particles present. Non-multiplying
infections occur when only RNA-1 is present and are non-transmissible by nematodes.
Although they cannot form encapsidated particles due to the lack of CP gene they are
able to spread systemically through plants and were reported to cause more severe
symptoms in potato (MacFarlane 1999).
Potato cultivars differ in their ability to resist TRV infection and can be split into
three categories depending on their response to infection (Dale and Neilson 2006). The
first are fully resistant (TRV-resistant) to infection and do not exhibit spraing symptoms
to any isolates, apart from to the PpO85 resistance-breaking isolate (Robinson 2004).
The second are spraing reactant (TRV-sensitive) and exhibit an intermediate response to
infection through production of spraing symptoms. This infection is usually a NM
infection (MacFarlane 2010) and transmission is only possible vertically through
daughter tubers. The third group are tolerant (TRV-susceptible). These are often
infected with full (M) infection with both virus particles, although they do not exhibit
Figure 1.5 Genome organisation of various RNA-2 isolates showing the diversity and
distribution of genes (from Sahi 2016). Isolate name and the RNA-2 size are shown at the
right of the figure. The gene names are shown under the diagrams and boxes with the same fill
pattern denote genes conserved across isolates. Expression of SYM genes shown with ? have
been not demonstrated experimentally.
24
spraing symptoms, other than a reduction in number and size of tubers, affecting crop
yield (Dale et al. 2000, 2004).
Different tobravirus isolates have virus–vector specificity with different trichodorid
species e.g. TRV isolate PpK20 is transmitted by Paratrichodorus pachydermus and not
Trichodorus primitivus while PEBV isolate TpA56 is transmitted by T. primitivus and not P.
pachydermus (MacFarlane et al. 1999). TRV PaY4 can be transmitted by P. pachydermus and
Paratrichodorus anemones, which can transmit PEBV but not TRV PpK20 (Vassilakos et al.
2001). It has been suggested that the selection of isolate–vector pairing is due to an
interaction between the CP and 2b protein acting together.
2b has been implicated for nematode transmission, as a protein encoded for by the
2b gene specifically has been suggested to form a bridge between the nematode
esophogeal surface and the virus particle (Bragard et al. 2013) and transmission cannot
occur without it for TRV PpK20, PaY4 or PEBV TpA56 (Hernández et al. 1997,
Vassilakos et al. 2001). It is also required for efficient movement of the virus into the
root (Valentine et al. 2004). The 2c protein greatly increases efficiency of transmission in
PEBV TpA56 (MacFarlane et al. 1996, Schmitt et al. 1998) but does not appear to be
required for TRV PpK20 nematode transmission (Hernández et al. 1997). Some TRV
isolates, which probably arose through deletion and recombination of RNA-2, are
missing one or both 2b and 2c genes, making transmission by nematodes impossible.
Impact of plant volatiles
Plant volatiles, or volatile organic compounds (VOCs), are a subset of secondary
metabolites produced within plants. Plant secondary metabolites (PSM) are specialised
and specific substances that are not associated with essential functions of metabolism
(Field et al. 2006) but contribute to plant fitness by responding to changes in the
environment (Bourgaud et al. 2001). PSMs exuded by plant roots into the rhizosphere
can help with foraging and uptake of scarce or biologically unavailable micronutrients
(Metlen et al. 2009), such as through the release of carboxylates from cluster-roots to
assist with phosphorus uptake (Li et al. 2007). They also have a role in plant protection,
from abiotic stresses and herbivore defence to host pathogen resistance, including
viruses (e.g. Berini et al. 2018, Joo et al. 2019, Lan et al. 2020, Landoni et al. 2020).
PSMs fulfil another important ecological role for plants: communicating with other
organisms (Massalha et al. 2017), including signalling danger to other parts of the same
25
plant or other plants (Karban et al. 2006). Some PSMs are attractants for pollinators and
seed dispersers (Midgley et al. 2015, Schiestl and Roubik 2003, Suinyuy and Johnson
2018) while others mediate interactions with beneficial microbes, such as flavonoids
acting as chemoattractants for rhizobia in legumes or root exudates recruiting microbes
to attack plant-parasitic nematodes (Cooper 2007, Topalović et al. 2020).
Roots tend to release a mixture of exudate, including low volatility, soluble
compounds for short-distance communication and high volatility compounds that travel
further and faster through gaseous diffusion than soluble compounds (Massalha et al.
2017). These root VOCs are often distinct from those released from leaves and the
profiles show little or no overlap within species (Peñuelas et al. 2014). Root-derived
VOCs are used for a variety of interactions with other organisms, including
neighbouring plants (Ens et al. 2009, Jassbi et al. 2010) and herbivores (Hu et al. 2018).
Volatiles can also be used to modify plant–herbivore interactions of neighbouring
plants, making competitors more susceptible to attack (Huang et al. 2019). Root VOCs
are incredibly diverse, and mixes can include fatty acid derivatives, terpenes,
phenylpropanoids and benzenoids, as well as sulphur-containing compounds including
glucosinolate-breakdown products (Peñuelas et al. 2014).
Viruses can induce changes in the volatiles produced from infected plants and use
these to indirectly attract insect vectors (Claudel et al. 2018). While a majority of work
has focused on aphid-transmitted viruses from the family Luteoviridae (Bosque-Pérez and
Eigenbrode 2011), such as Potato leaf roll virus, Barley yellow dwarf virus, and Turnip
yellows virus, this mechanism is found in other virus families and with different insect
vectors. For example, two aphid-borne raspberry viruses, Black raspberry necrosis
(Secoviridae) and Raspberry mottle virus (Closteroviridae), altered volatile emissions and
increased the soluble amino acid concentrations in leaves (McMenemy et al. 2012).
Whitefly has been shown to respond to volatiles produced by Tomato chlorosis virus
and Tomato severe rugose virus (Fereres et al. 2016), a crinivirus and a begomovirus
respectively, and Maize chlorotic mottle virus has been shown to attract vector thrips
(Mwando et al. 2018).
It is possible that volatiles may also play a role in the preferences seen between
viruliferous and non-viruliferous vectors of circulative plant viruses (Fereres et al. 2016,
Medina-Ortega et al. 2009, Ngumbi et al. 2007), where viruliferous vectors prefer healthy
plants and non-viruliferous, infected plants (Ingwell et al. 2012, Rajabaskar et al. 2014).

26
TRV infection has been shown to affect leaf secondary metabolites within plant tissues
(Fernández-Calvino et al. 2014) but no study on volatile emissions either above or
belowground has been carried out.

27
Purpose of thesis
This thesis sets out to explore the effects of TRV infection on root volatile
emissions and how these affect the behaviour of vector trichodorids, in order to better
understand the plant–virus–vector interactions around transmission to potentially
inform pest management. With the knowledge that plant viruses use volatile cues to
attract aboveground vectors for transmission, and that examples exist of nematodes
responding and moving towards root-derived VOCs, we sought to affirm that TRV–
trichodorid interactions make use of attractant volatile cues to aid transmission and to
identify which chemical(s), if any, define this signal (Figure 1.6).
Figure 1.6 Examples of volatile-mediated interactions that provided the background for this thesis. Viruses mediate green leaf volatiles to attract vector arthropods, and belowground herbivory stimulates release of root VOCs which recruits entomopathogenic nematodes.
While the act of transmission of TRV by trichodorid nematodes is well
understood, including the genetic differences between some of the different isolates,
the presence of an attraction effect towards infected plants was unknown, as was any
potential cause for that signal. In addition, the direct effects of TRV infection on root
growth in isolation from trichodorid feeding were not well understood.
Chapter 2 explores the foundational elements of this research question. Three
aspects were under investigation: 1) if the changes seen in root architecture after
feeding by trichodorids (stubby root nematodes) are due entirely to the action of
nematode feeding, or if TRV infection alters root architecture in a way to be partially
responsible for these effects; 2) if TRV-infected plants release different volatiles, or
volatiles at more elevated concentrations than uninfected plants, in line with previous
28
work on other plant viruses; and 3) if trichodorid nematodes preferentially move
towards TRV-infected plants when offered a choice between infected and uninfected
plants.
Using Nicotiana benthamiana (Solanaceae) as a model organism, plants were
infected with TRV and measures of different root morphological traits were taken, and
root volatiles analysed. This is the first study to have looked at the volatiles emitted
from the roots of TRV-infected plants. Some plants were also infected with a TRV
mutant missing two non-structural genes from RNA-2 that have been implicated in
nematode transmission of TRV. Trichodorids were tested in olfactometers and given a
choice between an uninfected plant and a plant infected with TRV. These initial
experiments were necessary to show that these interactions were taking place, before
trying to identify chemoattractant agents or the genetic underpinnings in viral infection
responsible for this volatile manipulation.
The experiments in Chapter 2 were exploratory and proof of concepts to
identify whether these effects were present. In Chapter 3, I refined our methodology
and confirmed my original research questions. The hypothesis that the effects seen on
root morphology are transient was tested by extending the length of the experiment,
and plants infected with TRV mutants with loss of function mutations in just one of
the RNA 2-genes were compared to uninfected and wild-type TRV-infected plants for
root architecture and volatile emission. In order to see greater difference in root volatile
emissions, the sampling time of the volatile experiments was increased. RNA-2 2b loss
of function mutants were also tested against uninfected plants and wild-type infected
plants in nematode preference trials.
In Chapter 4, the volatile found to be most expressed in the VOC profiles of
infected roots, 2-ethyl-1-hexanol, was investigated to see if it was the causative agent of
the attraction seen in previous chapters. The first hypothesis is that addition of 2-ethyl-
1-hexanol to the rhizosphere of an uninfected plant makes it more attractive than a
control uninfected plant. The second hypothesis is that addition of 2-ethyl-1-hexanol to
a 2b mutant infected plant makes it as attractive to trichodorids as a wild-type TRV
infected plant.
The final chapter is a discussion of the results presented in this thesis and the evidence
they provide for suggesting that TRV–trichodorid interactions are mediated by volatile
29
cues. It draws together the evidence from the other chapters with regards to the
presence of a volatile signal, how this seems to be affected by the presence of certain
RNA-2 genes, how these may affect infection intensity and so the strength of the signal
and the possibility of 2-ethyl-hexanol as the first identified compound of that signal. It
reflects on the importance of developing understanding of virus–vector relationships in
neglected belowground systems and how this information fits into the understanding of
chemically mediated plant interactions. It explores the ecological context of this plant–
virus–vector interaction, and the ramifications for TRV as an agricultural pest; how this
information may be applicable within that context; and that root volatile emissions may
be important when considering resistance for TRV for crops and as part of an
integrated pest management solution.

30
Chapter 2
Introduction
Multitrophic interactions, in which plant viruses alter host plants to manipulate
vectors in order to aid transmission to novel hosts, are common (Ziegler-Graff 2020).
As previously discussed, the majority of these are spread by insects (Bragard et al. 2013,
Dietzgen et al. 2016, Ziegler-Graff 2020), particularly hemipteran insects such as aphids,
whitefly and mealybugs (Hogenhout et al. 2008), which are well adapted for virus
transmission. Of the remainder, most are transmitted by soil borne vectors,
predominantly nematodes (Bragard et al. 2013). Trichodorid nematodes are root feeding
nematodes that are vectors for the tobraviruses: Tobacco rattle virus (TRV), Pea early
browning virus (PEBV) and Pepper ringspot virus (PepRSV).
Nicotiana bemthamiana is a widely used model organism in plant virology (Bhaskar
et al. 2009, Goodin et al. 2008, Hogenhout et al. 2009, Ma et al. 2012) due its
susceptibility to pathogens, including viruses, compared to other model organisms such
as Arabidopsis thaliana and continues to be used in a variety of host–pathogen research
(e.g. Ibrahim et al. 2020, Nath et al. 2020, Prator et al. 2020). A reason for this hyper
susceptibility to plant viruses is due to a naturally occurring mutation in an RNA-
dependent RNA polymerase gene (Yang et al. 2004).
N. benthamiana is attractive as a model organism in this study as it is much easier
to infect mechanically than potato; is quicker to grow and remains a manageable size for
data collection; and it is susceptible to a variety of plant viruses, including TRV. N.
benthamiana is easy to infect with TRV using agroinfiltration. In agroinfiltration, transfer
DNA (T-DNA) of the tumour-inducing plasmid Agrobacterium tumefaciens, a bacterial
pathogen of dicot plants with a broad host range, is transformed to carry binary vectors
containing the viral genome (Du et al 2014, MacFarlane 2010). A suspension containing
the transformed Agrobacterium is inoculated with a needleless syringe to the abaxial
surface of leaves (Du et al. 2014, Goodin et al. 2008, Senthil-Kumar and Mysore 2014).
This then enables viral particles to spread through the plant, including into the roots
(Valentine et al. 2004). Mechanical infection of potato is unreliable, often leading to
localised, low level infection (Ghazala and Varrelmann 2007, Sahi et al. 2016) and
infrequent system spreading of TRV to other tissues (Sahi et al. 2016) including roots.
Potato can be more reliably infected by the feeding action of viruliferous nematodes in

31
field conditions, but this is not satisfactory for this study, as it is impossible to know the
time of infection. If effects of infection are transient, no comparisons can be made
between plants. For these reasons, even though the sensitivity of N. bethamiana to plant
viruses may increase the severity of symptoms of TRV infection compared to natural
environments, it was an ideal candidate for these investigations.
Kollman and colleagues (2007) found differences in aboveground biomass of
Impatiens glandulifera in continental Europe due to potential TRV infection. In potato,
TRV infection affects plant emergence, crop yield and overall reduced biomass (Dale et
al. 2000, 2004). However, infection has not been shown to have stronger or targeted
effects on root allocation and biomass. TRV infection has been shown to be transient
and viral load reduces 10 days post-infection (Valentine et al. 2004, Vassilikos et al. 2001).
However, even a transient viral infection can impact biomass production and allocation,
altering root morphology. There are many examples of plant–virus interactions where
infection had a significant effect on growth (Chen et al. 2017, Dolenc et al. 2000),
aboveground architecture and leaf size and colour (Bazzini et al. 2011, Zaitlin and Hull
1987).
Root architecture has been shown to be sensitive to a variety of different
infections and attacks (e.g. Cordovez et al. 2017, Hetrick 1991, Hishi et al. 2017, Hodge
2004, Lu et al. 2020, Ma et al. 2013, Razavi et al. 2017, Treonis et al. 2007 Villordon and
Clark 2014). These range from beneficial mycorrhizal colonisation to nematodes, fungal
pathogens, and viruses, but no information exists in the literature on the impact of
TRV infection on this trait. Trichodorid feeding can result in decline of root growth
(Pitcher 1967) and development of root swelling and galling in certain plant species
(Taylor and Brown 1997), but there have been no studies to confirm if this effect is
exacerbated by TRV infection of the host plants, or if viral infection has no effect. If
this reduction in root growth is partially due to TRV infection, decreases in plant
biomass may be greater for root systems than above ground.
For successful vector-borne transmission, the virus must be able to enter the
vector from the host, persist long enough within the vector to reach another host and
be able to leave the vector and successfully infect the new host. These processes are well
understood for TRV virus–vector interaction (MacFarlane 2010). When trichodorid
juveniles and adults feed on roots, they disrupt and destroy cells around the feeding site
with injected enzymes delivered by a hollow stylet-shaped mouthpart and the resulting
32
plant tissues, including viral material, are ingested. The viral particles can remain in the
nematode for up to two years but are non-persistent (Ng and Falk 2006), which means
they do not enter the body of the nematode; they remain in the nematode oesophagus
(Taylor and Robertson 1970) before being regurgitated with the digestive enzymes at a
novel feeding site.
However, at present little is known about the mechanism with which TRV
attracts potential vectors to infected plants, or if such a mechanism exists. There are
multiple ways in which viruses can alter their host to manipulate their vectors.
Alterations to host physiology to attract vectors with sensory cues and changes to
feeding behaviour are two of these mechanisms and are covered in multiple recent
reviews, which focus on aboveground insect–vector interactions (Blanc and Michalakis
2016, Carr et al. 2018, Dáder et al. 2017, Eigenbrode et al. 2018, Mauck 2016). The
translation of these well-known mechanisms in aboveground systems to this virus–
vector relationship is important for understanding drivers of transmission of TRV.
A possible explanation for attraction to infected plants is the production of
sensory volatiles, which are released into the rhizosphere and detected by trichodorids.
The manipulation of plant volatiles by viruses to attract vectors is well documented and
reviewed (Groen et al. 2016, Hammerbacher et al. 2019, Roossinck 2015), as is nematode
response to chemical cues, including volatiles (Rasmann et al. 2012), but the response of
nematode vectors to virus-mediated volatiles has not been studied.
There are many common techniques for sampling and analysing volatiles and
other compounds produced and released by plants. The most suitable method will
depend on the biological questions asked, the conditions the plant is in and what part
of the plant is being sampled (Tholl et al. 2006). Some techniques involve destructive
sampling of plant tissues (Rasmann et al. 2005), which are easier to carry out and can
have a greater accuracy in collection of volatiles produced within tissues, but they are
not necessarily an accurate measure of what is released and detectable in the
environment. They may also produce additional volatiles from a wounding response.
Non-destructive sampling techniques present the challenge of isolating the plant
material being tested (e.g roots, leaves, flowers) from the rest of the plant and only
sampling compounds produced and emitted from those areas, while simultaneously
avoiding loss of sample (REF). Whether the sampling is destructive or non-destructive,
there are then multiple options of collection technique, and different collection

33
techniques can create bias towards different classes of volatile or semi-volatile
compounds (Rering et al. 2020).
These collection methods can be separated into static and dynamic headspace
techniques. In static techniques, the plant or section being sampled are fully enclosed in
a chamber and emitted volatiles are allowed to accumulate within the chamber before
being sampled. These volatiles can either be trapped on an adsorbent, such as solid
phase microextraction (SPME) fibres, or a direct subsample of the air removed for
analysis. SPME is an incredibly popular sampling technique that relies on the collection
of volatiles or semi-volatiles on a fibre and the subsequent thermal desorption to a gas
chromatograph. Part of the power of this analysis method is the ability to switch
between different fibre types to collect different classes of volatiles and semi-volatiles
(Alborn et al. 2021, Pontes et al. 2012, Rering et al. 2018), giving excellent ability to
collect different compounds. In both cases, there is no contamination or dilution of the
sampled volatiles due to a continuous air stream. Conversely, this also results in
accumulation of moisture and heat, particularly if the plant is being sampled under
illumination, either during daylight in the field or in lab conditions in a light cycle, which
can affect the volatiles collected (Tholl et al. 2006). A further limitation of SPME static
sampling is that the resultant volatile profiles may not be true to the gas phase
composition and may bias the resulting chromatogram patterns towards the compounds
the fibre is better at ab/adsorbing (Alborn et al. 2021). Direct headspace subsampling
with air that is subsequently cryofocused on-column before injection to a gas
chromatograph does not suffer from these drawbacks but can have poor effectiveness
and miss compounds at low concentrations (Rering et al. 2020).
Dynamic headspace techniques have a continuous flow of air flowing through
the sampling chamber as a carrier gas, which is often air filtered through a trap to scrub
impurities and contaminants, such as activated charcoal. The air leaving the chamber
passes through an ad/absorbent trap filled with polymers such as Porapak Q/Super
Q/Hayasep Q that are preconditioned before use with a solvent (e.g. Jassbi et al. 2010,
Steen et al. 2019, Thöming et al. 2014). The compounds are then eluted with a solvent,
and an internal standard may be added, which helps with quantification of the total
amount of compounds collected and injected onto a gas chromatograph. Instead of
solvent extraction, adsorbent materials such as Tenax can be used for thermal
desorption rather than the polymers mentioned above. Solvent extraction has

34
drawbacks in terms of dilution of the sample in the solvent and reduced extraction
efficiency compared to thermal desorption. On the other hand, it does allow repeated
sample injections and avoids artifacts due to the breakdown of thermally instable
compounds (Tholl et al. 2006). Integration of SPME fibre methods with dynamic
headspace technique in solventless volatile collection methods have been very popular
and different methods have been compared extensively (Alborn et al. 2021, Rering et al.
2020, Yuang et al. 2013). Dynamic headspace techniques hold advantages over many
static headspace methods in being able to pre-concentrate the collection of volatiles and
semi-volatiles onto a trap and to compare volatile emissions at different time points.
Static headspace cannot do this effectively as not all compounds are removed from the
chamber in sampling, so accumulation of compounds of interest interferes with
potential changes in emission rates over time. However, dynamic headspace sampling
requires sampling times lasting multiple hours (Steen et al. 2019), which subjects plants
to considerable water stress when sampling root tissues.
Here, Nicotiana benthamiana is employed as a model organism to provide an initial
overview of the effects of TRV infection on plant biomass and root allocation; the
differences in root volatiles emitted from intact root systems between infected and
uninfected plants; and to test whether TRV-infected plants are more attractive to
trichodorid nematodes than uninfected plants. The potential hypersensitivity to viral
infections reported in N. benthamiana may be of benefit in this initial study to try to
identify novel effects of TRV infection.
Many different isolates of TRV exist, and these are specific to different
trichodorid species, with some specific isolate–species pairings (Asfaq et al. 2011,
Boutsika et al. 2004, Crosslin et al. 2003, Holeva et al. 2006, MacFarlane and Brown 1995,
Ploeg and Brown 1997, Ploeg et al. 1992). This presents a complication because while
the genome of RNA-1 is relatively conserved across isolates, different isolates of TRV
RNA-2 do not have conserved sequences, and as such there is no standardised RT-
qPCR test for all isolates (Sahi et al. 2016). Therefore, in order to accurately compare
levels of infection, all plants must be infected with the same RNA-2 isolate.
The RNA-2 isolate used in this study was TRV-PpK20. This isolate is one of
the earliest TRV isolates to have a well-characterised virus–vector interaction
(Hernández et al. 1995) and is one of the best understood. It is also transmitted by
Paratrichodorus pachydermus, one of the most economically important and widespread

35
trichodorid nematodes in the UK (Boutsika et al. 2004). The trichodorids used in this
work are bulk populations from agricultural soil samples from across the UK, but
particularly from Scotland, where this isolate was first identified. TRV-PpK20 has three
genes present on RNA-2, the coat protein gene (CP) and two non-structural genes, 2b
and 2c (Hernández et al. 1995, Hernández et al. 1996, MacFarlane 1999). 2b is necessary
for nematode transmission (Hernández et al.1995, MacFarlane et al. 1996), possibly due
to the formation of bridges linking the 2b protein to sites within the nematode
oesophagus, enabling retention within the vector (MacFarlane 1999).
This study investigated root morphology, root volatile emissions and nematode
attraction, all of which relied on whole root systems and non-destructive sampling in
the case of volatile capture, and non-disruptive sampling for testing nematode
attractiveness. Growing plants in soil or within substrate poses additional complications
for non-destructive sampling of roots compared to hydroponic systems due to the
increased potential of damage to roots.
Work on root architecture is challenging, due to the difficulty of observing roots
in soils and harvesting plants without causing damage to fine roots. Techniques like
microrhizotrons (Bates 1937, Bragg et al. 1983, Faget et al. 2010, Lu et al. 2019, Lu et al.
2020, Svane et al. 2019) allow collected measurements over time in situ, avoiding the risk
of destruction of the finer architecture. However, image analysis is time consuming,
especially when analysing entire root systems, and these approaches can lead to
underestimates in root length (Vamerali et al. 2012). Without extracting the roots, it is
also impossible to remove some material to test for successful transmission of the virus
to the roots. Computerised analysis of scanned images of whole extracted root systems
can give fast and accurate measures of root morphological traits (Bouma et al. 2000,
Himmelbauer 2004, Pierret et al. 2013, Songsri et al. 2008). Downsides of this method
include the lack of 3D information, as the roots must be scanned flat, and loss of finer
sensitivity when harvesting, although this can be reduced by growing plants in a
substrate that requires less destructive harvesting than soil, such as sand. Use of
hydroponics or aeroponics, where plants are grown with roots immersed in nutrient
solution or exposed to nutrient mist in a closed system (Chen et al. 2011, Liu et al. 2018,
Kratsch et al. 2006), minimises disturbance and removes destructive sampling, but both
methods have been shown to produce significantly altered root systems to plants grown
in substrate (Graves 1992, Liu et al. 2018, Sankhalkar et al. 2019) and may confound

36
observations and wider conclusions on the effect of TRV infection on root
morphology.
The removal of stressful harvesting does make hydroponics attractive to study
root volatile emissions from intact roots. Plant stress can lead to changes in root
volatiles (Copolovici et al. 2012, Holopainen and Gershenzon 2010, Loreto and
Schnitzler 2010, Timmusk et al. 2014) and mitigating root stress, both through physical
disturbance and water stress from a time-consuming extraction, are worth the trade-off
of a more artificial environment. Two types of volatile extraction were tested in this
investigation, in order to try to identify as many compounds of interest as possible.
As volatiles and semi-volatiles of interest released from TRV infected roots are
currently unknown, direct headspace sampling was chosen as the first sampling method.
This avoids any biases of SPME fibre or adsorbent polymer choice on the types of
volatiles and semi-volatiles collected (Arban et al. 2021, Tholl et al. 2006) and allows the
broadest capture in terms of analysis. Unlike other static-headspace sampling
techniques, it also allows quantification of concentration within the gaseous phase
(Redeker et al. 2018). A dynamic headspace method using solvent extraction was also
used to trial a methodology that allowed repeated sample injections and reduced manual
handling at analysis, allowing a greater number of samples to be tested than with direct
headspace sampling.
Here, the effects of infection on root architecture and plant biomass, whole
root volatile emissions and nematode attraction were compared. This allowed testing of
the following hypotheses:
There is a cost to infection that will show as a significant decrease in above and
belowground biomass and differences in the root architecture in TRV-infected
plants compared to uninfected plants. Significant differences in root architecture
between uninfected and infected plants exist.
There will be a significant reduction in the root to total plant weight ratio in
TRV-infected plants.
TRV-infected plants will show different root volatile emission profiles than
uninfected plants.

37
Trichodorids will preferentially move towards TRV-infected plants in
olfactometer assays.
There will be a positive relationship between level of infection and
attractiveness to nematodes, and between level of infection and emission levels
of VOCs elevated under infection.
.

38
Methods
Plant growth and infection
Seeds of N. benthamiana were sterilised by exposure to 100% ethanol in
Eppendorf tubes for 2 minutes, followed by centrifugation, removal of the ethanol and
addition of 50% commercial bleach solution. The bleach and seed solution were left for
15 minutes then centrifuged, the bleach removed, and the seeds rinsed five times with
distilled water. Seeds were germinated on moist filter paper in a Petri dish at 20°C in a
controlled growth room with 16h/8h light and dark intervals, then transferred to trays
of the 90:10 mix of autoclaved sand:John Innes no2 compost. Seedlings were watered
with ½ strength Hoagland’s nutrient solution (Table 2.1) until two true leaves had
expanded, and were then potted on to different media, depending on the experiment.
Plants for volatile experiments went to 1L pots filled with nutrient solution (see Root
VOC Sampling, Figure 2.1a); plants for root morphology were grown in 1L pots filled
with autoclaved sand (see Root Morphology); and plants used in trichodorid assays were
planted directly in the external chambers of the olfactometers (see Trichodorid
Response).
Table 2.1 Composition and concentration of Hoagland’s nutrient solution
Compound Formula Concentration in full strength solution (µM)
Magnesium sulphate heptahydrate
MgSO4.7H2O 1079.14
Calcium nitrate tetrahydrate
Ca(NO3)2.4H2O 6034.30
Potassium nitrate KNO3 4131.68
Potassium phosphate KH2PO4 1906.25
Managnous sulphate tetrahydrate
MnSO4.4H2O 3.63
Boric acid H3BO3 48.03
Sodium molybdate dihydrate
Na2MoO4.2H2O. 0.50
Zinc sulphate heptahydrate
ZnSO4.7H2O 2.02
Cupric sulphate pentahydrate
CuSO4.5H2O 0.36
Fe-EDTA C10H12N2NaFeO8 64.73
39
Seven days prior to testing, plants were infected with Agrobacterium tumefaciens
strain GV3101 (Holsters et al. 1980) cultures that were transformed with TRV RNA-1 or
RNA-2 isolates. TRV RNA-1 is isolate Pp085 and TRV RNA-2 is PpK20, cloned by S.
MacFarlane. All infections used the same TRV RNA-1 culture, but two different TRV
RNA-2 cultures were used. One was transformed with wild-type TRV RNA-2 and the
other with a mutant where the 2b and 2c genes were removed and replaced with a
Green Fluorescent Protein (GFP) gene. Wild-type RNA-2 (TRV wild-type) was used in
all experiments and the mutant (TRV-Δ2) was used as an additional treatment in the
root volatile experiments. Infection solutions were prepared by making overnight stocks
of each culture from frozen glycerol stocks pricked into 2ml of 25g/L LB liquid
medium (Sigma Aldrich LB Broth [Miller]) with added kanamycin (50mg/ml) and
rifampicin (10mg/ml). These were incubated at 28°C at 120rpm for 10-12 hours, then
0.5ml of the overnight stock were subcultured into 10ml of fresh LB liquid medium
containing kanamycin (50mg/ml) and rifampicin (10mg/ml) and incubated again for 6
hours in the same conditions. The absorbance of the cultures was measured with a
spectrophotometer (Biochrom) at OD600 using LB liquid medium with added antibiotics
as a blank. If an OD600 of 0.5-0.6 was reached, the cells were used.
The resulting cells were spun down at 3000g for 5 minutes and re-suspended in
10ml of an induction buffer of 195mg (N-morpholino)ethanesulfonic acid (MES)
dissolved in 100ml dH2O with 200µl of 200µM acetosyringone added. These were then
incubated at 20°C at 50rpm for 3 hours. The cells were spun down again and
resuspended in 10ml infiltration buffer of 97.6mg of MES dissolved in 100ml dH2O.
and checked by spectrophotometer, using infiltration buffer as a blank, for a desired
OD600 of 03-0.5.
The separate cultures were combined to give a culture containing equal
concentrations of RNA-1 and RNA-2, based on the spectrophotometer readings. 0.5ml
of the combined culture was inoculated onto the apoplast of each leaf using a
needleless syringe (Senthil-Kumar and Mysore 2014). Four leaves were inoculated per
plant. “Uninfected” plants were inoculated with untransformed Agrobacterium, incubated
in the same conditions, to control for any side effects of Agrobacterium infection.
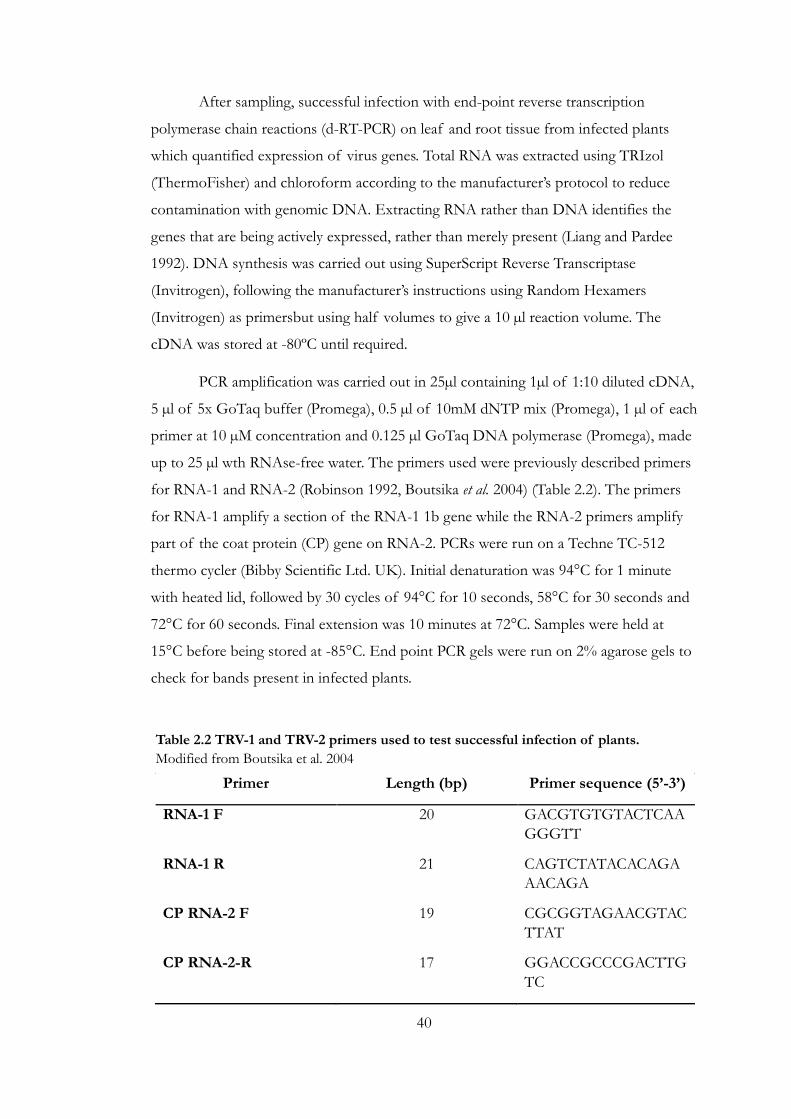
40
After sampling, successful infection with end-point reverse transcription
polymerase chain reactions (d-RT-PCR) on leaf and root tissue from infected plants
which quantified expression of virus genes. Total RNA was extracted using TRIzol
(ThermoFisher) and chloroform according to the manufacturer’s protocol to reduce
contamination with genomic DNA. Extracting RNA rather than DNA identifies the
genes that are being actively expressed, rather than merely present (Liang and Pardee
1992). DNA synthesis was carried out using SuperScript Reverse Transcriptase
(Invitrogen), following the manufacturer’s instructions using Random Hexamers
(Invitrogen) as primersbut using half volumes to give a 10 µl reaction volume. The
cDNA was stored at -80ºC until required.
PCR amplification was carried out in 25µl containing 1µl of 1:10 diluted cDNA,
5 µl of 5x GoTaq buffer (Promega), 0.5 µl of 10mM dNTP mix (Promega), 1 µl of each
primer at 10 µM concentration and 0.125 µl GoTaq DNA polymerase (Promega), made
up to 25 µl wth RNAse-free water. The primers used were previously described primers
for RNA-1 and RNA-2 (Robinson 1992, Boutsika et al. 2004) (Table 2.2). The primers
for RNA-1 amplify a section of the RNA-1 1b gene while the RNA-2 primers amplify
part of the coat protein (CP) gene on RNA-2. PCRs were run on a Techne TC-512
thermo cycler (Bibby Scientific Ltd. UK). Initial denaturation was 94°C for 1 minute
with heated lid, followed by 30 cycles of 94°C for 10 seconds, 58°C for 30 seconds and
72°C for 60 seconds. Final extension was 10 minutes at 72°C. Samples were held at
15°C before being stored at -85°C. End point PCR gels were run on 2% agarose gels to
check for bands present in infected plants.
Primer Length (bp) Primer sequence (5’-3’)
RNA-1 F 20 GACGTGTGTACTCAA
GGGTT
RNA-1 R 21 CAGTCTATACACAGA
AACAGA
CP RNA-2 F 19 CGCGGTAGAACGTAC
TTAT
CP RNA-2-R 17 GGACCGCCCGACTTG
TC
Table 2.2 TRV-1 and TRV-2 primers used to test successful infection of plants.
Modified from Boutsika et al. 2004

41
RT-qPCR was used for quantification of infection. N. benthamiana reference
genes were chosen from housekeeping genes that are vital to cellular metabolism and so
ubiquitously expressed in all cells of the plant to act as internal controls. The internal
standard reference genes APR and EF1α were selected due to their stability in N.
benthamiana under TRV infection (Liu et al. 2012) (Table 2.3). APR codes for an adenine
phosphoribosyltransferase-like enzyme that recycles adenine into adenylate nucleotides
using cytokinins as substrates (Allen et al. 2002, Mok and Mok 2001). EF1α is the alpha
subunit of elongation factor-1 and plays a central role in polypeptide chain elongation in
all eukaryotes, including plants (Pokalsky et al. 1989). EF1α promotes the GTP-
dependent binding of aminoacyl-tRNA to the A-site of ribosomes during protein
biosynthesis. qPCR primers were used for the replicase gene on TRV RNA-1 and the
coat protein on TRV RNA-2 (Sahi et al. 2016) (Table 2.3). qPCR was carried out in 10 µl
reactions, prepared over ice. Each reaction mix contained: 0.2 µl cDNA diluted in 4.4 µl
RNAse-free water, 5 µl of 2X SYBR Green Power mix (Applied Biosystems) and 0.2 µl
of each primer. Each cDNA sample was run with 2 primer pairs (RNA1 and RNA2)
and 2 housekeeping genes (APR and EF1α) and in triplicate, so 12 reactions were run
per cDNA sample. These were run and analysed on a StepOnePlus real-time PCR
system (Applied Biosystems). The initial denaturation was 10 minutes at 95°C followed
by 40 cycles of 95°C for 15 seconds and 60°C for 1 minute.
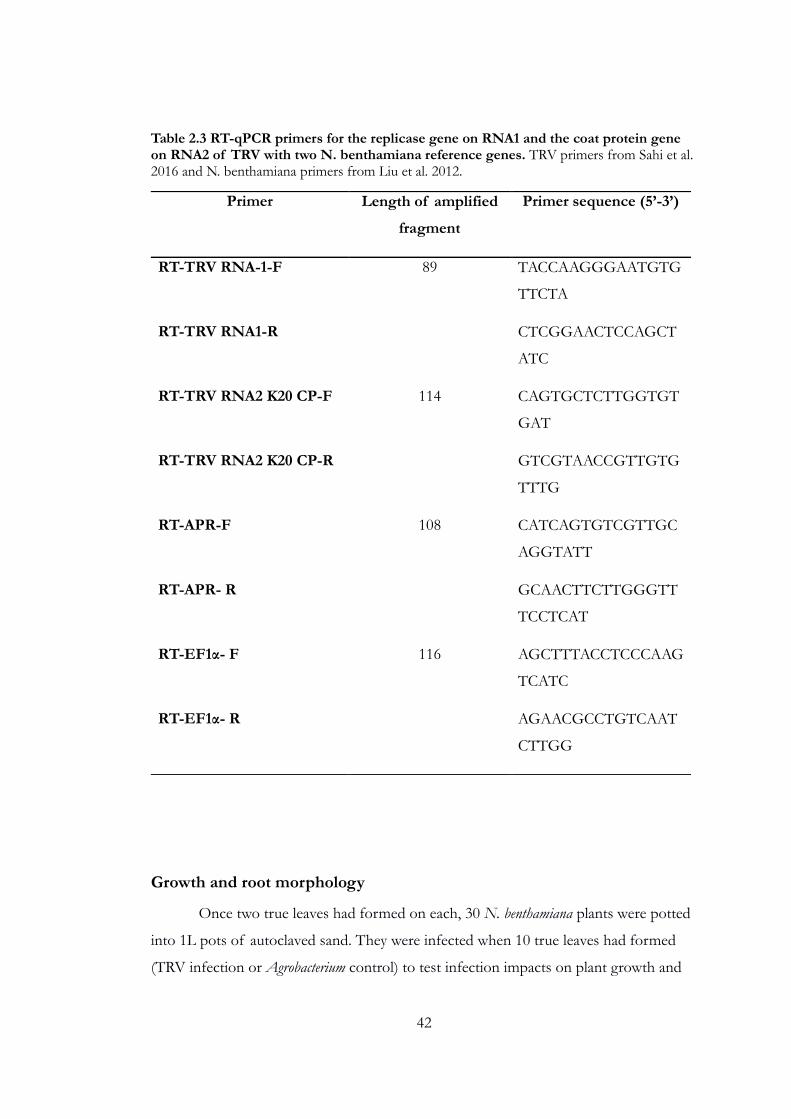
42
Table 2.3 RT-qPCR primers for the replicase gene on RNA1 and the coat protein gene on RNA2 of TRV with two N. benthamiana reference genes. TRV primers from Sahi et al. 2016 and N. benthamiana primers from Liu et al. 2012.
Growth and root morphology
Once two true leaves had formed on each, 30 N. benthamiana plants were potted
into 1L pots of autoclaved sand. They were infected when 10 true leaves had formed
(TRV infection or Agrobacterium control) to test infection impacts on plant growth and
Primer Length of amplified
fragment
Primer sequence (5’-3’)
RT-TRV RNA-1-F 89 TACCAAGGGAATGTG
TTCTA
RT-TRV RNA1-R CTCGGAACTCCAGCT
ATC
RT-TRV RNA2 K20 CP-F 114 CAGTGCTCTTGGTGT
GAT
RT-TRV RNA2 K20 CP-R GTCGTAACCGTTGTG
TTTG
RT-APR-F 108 CATCAGTGTCGTTGC
AGGTATT
RT-APR- R GCAACTTCTTGGGTT
TCCTCAT
RT-EF1α- F 116 AGCTTTACCTCCCAAG
TCATC
RT-EF1α- R AGAACGCCTGTCAAT
CTTGG

43
root morphology. Sand was used as the solid growth medium to allow extraction of
clean whole root systems for accurate root scans.
Plants were fed with 250ml ½ strength Hoaglands twice weekly and watered
with dH2O as needed. Five plants per treatment (TRV-infected and Agrobacterium
controls) were harvested at 4-, 7- and 14-days post infection (dpi); weighed; and
parameters measured following Gamalero et al. (2002): root and shoot fresh weight, total
root length, total root surface area, total root volume, number of tips and degree of
root branching (tip number divided by total root length). These were collected by
carefully spreading the root system in a thin layer of water on a transparent tray and
scanning them. These images were then analysed using WINRhizo software (Regent
Instruments, Canada) that pulls out the parameters from the image using a
skeletonization method (Himmelbauer 2004). Small samples of the root and shoot
tissue were removed after this procedure, flash frozen and stored at -80°C before RNA
extraction to test for successful infection and viral load.
Root VOC sampling
Direct headspace semi-static sampling
For the direct headspace sampling, 18 N. benthamiana plants were grown in
individual hydroponic pots (Figure 2.1a) in ½ strength Hoagland’s that was changed
weekly so that plants could be instantly removed from their pots and placed in the
sampling chamber. Once 10 true leaves had formed, plants were either infected with
wild-type TRV (“infected-wild-type”), a TRV mutant that was missing genes 2b and 2c
from RNA-2 (“infected-mutant”) or untransformed Agrobacterium, and sampled 7 dpi
(Figure 2.1b).
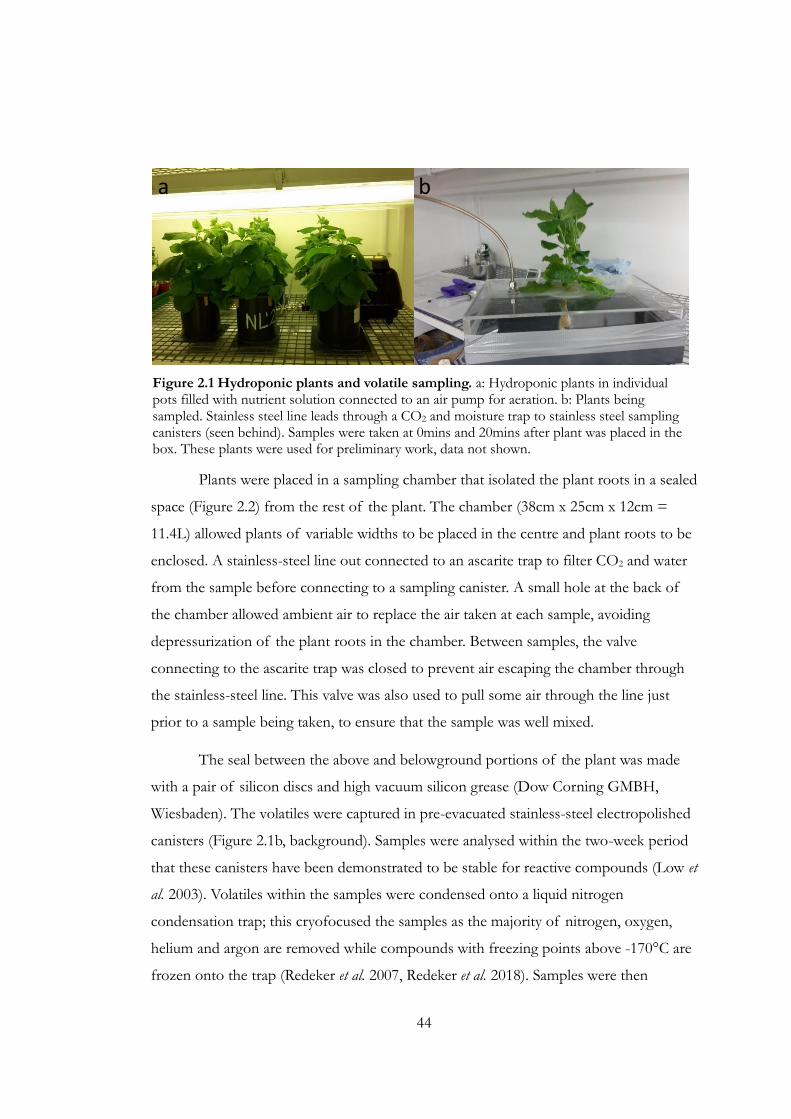
44
Plants were placed in a sampling chamber that isolated the plant roots in a sealed
space (Figure 2.2) from the rest of the plant. The chamber (38cm x 25cm x 12cm =
11.4L) allowed plants of variable widths to be placed in the centre and plant roots to be
enclosed. A stainless-steel line out connected to an ascarite trap to filter CO2 and water
from the sample before connecting to a sampling canister. A small hole at the back of
the chamber allowed ambient air to replace the air taken at each sample, avoiding
depressurization of the plant roots in the chamber. Between samples, the valve
connecting to the ascarite trap was closed to prevent air escaping the chamber through
the stainless-steel line. This valve was also used to pull some air through the line just
prior to a sample being taken, to ensure that the sample was well mixed.
The seal between the above and belowground portions of the plant was made
with a pair of silicon discs and high vacuum silicon grease (Dow Corning GMBH,
Wiesbaden). The volatiles were captured in pre-evacuated stainless-steel electropolished
canisters (Figure 2.1b, background). Samples were analysed within the two-week period
that these canisters have been demonstrated to be stable for reactive compounds (Low et
al. 2003). Volatiles within the samples were condensed onto a liquid nitrogen
condensation trap; this cryofocused the samples as the majority of nitrogen, oxygen,
helium and argon are removed while compounds with freezing points above -170°C are
frozen onto the trap (Redeker et al. 2007, Redeker et al. 2018). Samples were then
a b
Figure 2.1 Hydroponic plants and volatile sampling. a: Hydroponic plants in individual pots filled with nutrient solution connected to an air pump for aeration. b: Plants being sampled. Stainless steel line leads through a CO2 and moisture trap to stainless steel sampling canisters (seen behind). Samples were taken at 0mins and 20mins after plant was placed in the box. These plants were used for preliminary work, data not shown.

45
transferred to an Agilent DB-5 column or Agilent PoraPlot Q column, depending on
method (see below) and analysed by gas chromatography-mass spectrometry (GC:MS).
Samples were taken within 1 minute (time=0), providing a baseline sample of
background air, and 20 minutes (time=20) after the first sample was collected.
Compared to other studies (Durenne et al. 2018, Movafeghi et al. 2010, Souza Silva et al.
2017), 20 minutes is a shorter length of time for collecting plant-emitted volatiles, but
this short time was chosen to minimise the effects of water stress on the plants, which
may affect volatile emissions (Salerno et al. 2017, Griñán et al. 2019). Most head-space
sampling of intact plants have focused on whole plant or aboveground portions of
plants (e.g. Aharoni et al. 2003, Durenne et al. 2019, Gross et al. 2019, Rid et al. 2016)
which allows reduction of plant stress through the use of pots or roots placed in
beakers of water. However, as root volatiles were the target of this investigation, this
was not possible.
Samples were randomly allocated to one of two analytical methods, each of
which targeted different molecular sizes of compounds. One method gave greater
sensitivity for smaller compounds (<C6), both in terms of the GC column used and a
slower initial ramp and masses up to 150 atomic mass units (amu). They were run on a
Figure 2.2 Semi-static headspace sampling with stainless steel canisters. I) Sampling
chamber: The stainless-steel line out (II) connects to an ascarite trap (III) before connecting to
a sampling canister (IV) via a valve. A small hole at the back of the chamber allows ambient air
to replace the air taken at each sample, avoiding depressurization of the plant roots in the
chamber (V).
I
II
III
v
IV
V

46
25m PoraPlotQ column (Agilent) with 0.32ID and 5µm wall thickness with an initial
oven temperature of 30°C, held for 5 minutes, then a first ramp of 10°Cmin-1 to 90°C
(no hold), a second ramp of 2°C min-1 to 150°C (no hold) and a final ramp and bake-
out of 10°C min-1 to 220°C with a 5 minute final hold for a total runtime of 53 minutes
(Redeker et al. 2018).
The second method targeted larger molecular weight compounds (<C20), with
masses up to 450amu. Samples were run on a 30m DB-5 column (Agilent) with an initial
oven temperature of 30°C, held for 5 minutes, first ramp of 4°C min-1 to 250°C (no
hold) and a second ramp and bake-out of 40°C min-1 to 325°C with a 5 minute final
hold (total runtime of 66 minutes). For both methods, 46 was the smallest mass
examined, in order to avoid CO2 contamination, which was likely to saturate the
detector. Peak areas were calculated using Agilent ChemStation Data Analysis software,
which also gave a putative identification of compounds.
Peak areas were initially converted to concentration in parts per trillion (pptr)
using a calibration slope derived from internal standard testing and the number of
moles of gas injected, divided by the molar volume of gas (22.4L mol-1) i.e. the space 1
mole of gas occupies at standard temperature and pressure.
𝑐𝑜𝑛𝑐. (𝑝𝑝𝑡𝑟) =1012(𝑝𝑒𝑎𝑘 𝑎𝑟𝑒𝑎 ∗ 𝑐𝑎𝑙𝑖𝑏𝑟𝑎𝑡𝑖𝑜𝑛 𝑠𝑙𝑜𝑝𝑒)
𝑚𝑜𝑙𝑒𝑠 𝑖𝑛 𝑠𝑎𝑚𝑝𝑙𝑒/22.4
The number of moles in the sample are calculated using the combined volume
of the canister and condensation line (1000ml or 500ml depending on the size of
canister used + 33.35ml), the pressure of the injected sample and the conversion factor
from torr to atmospheres:
𝑚𝑜𝑙𝑒𝑠 𝑖𝑛 𝑠𝑎𝑚𝑝𝑙𝑒 = (𝑐𝑎𝑛𝑖𝑠𝑡𝑒𝑟 𝑣𝑜𝑙 + 𝑙𝑖𝑛𝑒 𝑣𝑜𝑙𝑢𝑚𝑒)𝑝𝑟𝑒𝑠𝑠𝑢𝑟𝑒 𝑜𝑓 𝑠𝑎𝑚𝑝𝑙𝑒
760
These concentrations were then converted to fluxes of each compound in µg
min-1g dry root weight-1:
𝑓𝑙𝑢𝑥 (µ𝑔 𝑚𝑖𝑛−1𝑔−1)
=(𝑐𝑜𝑛𝑐. 𝑎𝑡 𝑡 = 20 − 𝑐𝑜𝑛𝑐. 𝑎𝑡 𝑡 = 0) ∗ (
11.422.4) ∗ 𝑚𝑜𝑙𝑒𝑐𝑢𝑙𝑎𝑟 𝑤𝑒𝑖𝑔ℎ𝑡 𝑜𝑓 𝑐𝑜𝑚𝑝𝑜𝑢𝑛𝑑 ∗ 106
𝑡𝑖𝑚𝑒 𝑑𝑖𝑓𝑓𝑒𝑟𝑒𝑛𝑐𝑒 ∗ 𝑑𝑟𝑦 𝑤𝑒𝑖𝑔ℎ𝑡 𝑜𝑓 𝑟𝑜𝑜𝑡𝑠

47
The concentration at 0 minutes, as a baseline estimate of the ambient air, was
subtracted from the concentration at 20 minutes to give the change in concentration.
This was multiplied by molar amount of air in the sampling chamber (11.4L / 22.4L
mol-1). This is the number of moles of compound generated or consumed during the
time between samples. This value was multiplied by the molecular weight of each
compound (g mol-1) and by 106 to convert from grams to micrograms. Finally, it was
divided by the time between samples and the dry weight of the plant’s roots to give the
flux per minute and per gram of dry root weight. Means and standard errors of these
fluxes were calculated.
After sampling, the plants were harvested and separated into above and
belowground portions. This cutoff was where the plant entered the growth medium if
in substrate or where the opaque foam bung that held the plant in the hydroponic pots
was attached to the plant. Fresh weight was recorded for both above and belowground
biomass and samples of ~100mg (90-150mg) were flash frozen in liquid N2 then stored
at -80°C for RNA extraction. After 3 days drying at 70°C, above and belowground dry
weights were recorded and corrected for the weight of tissue removed for RNA
extraction.
Dynamic solvent-based headspace sampling
36 N. benthamiania plants were grown in the same conditions as the static
headspace sampling mentioned above in individual hydroponic pots. They were also
infected when 10 true leaves had formed, either with wild-type TRV (“infected-wild-
type”) or untransformed Agrobacterium, and sampled at 7, 10 and 14 dpi. This was
changed from the static headspace sampling in order to be able to directly compare with
that technique at 7 dpi, but also to take advantage of the ability to collect and analyse a
greater number of samples.
The sampling setup was similar to that used in semi-static headspace sampling,
but slightly altered (Figure 2.3). Instead of the outlet from the sampling chamber
leading to a canister, the air passed over a glass tube filled with 70mg Porapak Q
adsorbent (80-100 mesh, Sigma). Incoming air was passed through activated charcoal to
filter it (de Moras et al. 1998) and strip it of any volatiles already present in the lab air.
The incoming air was pumped into the chamber at a higher rate (700ml min-1) than the

48
air pulled out over the trap (400ml min-1) in order to create a positive pressure difference
in the sampling box and prevent air entering that had not passed through the charcoal
filter (Jassbi et al. 2010). Plant roots were kept in the chamber for 45 minutes as a
tradeoff between capturing enough emitted compounds and putting the plants under
excessive stress and the chamber was left empty for 20 minutes between samples to
allow any residual plant released volatiles from the previous sample to pass through the
system. Lab air blanks were taken for 45 minutes at the beginning of each sampling day.
The traps were eluted with three washes of 200µl dichloromethane (DCM). Each wash
was sampled to ascertain how many washes were required to elute all compounds of
interest. Before and after use, traps were rinsed twice with DCM and dried under a
helium stream. Traps were stored at 115°C when not used.
Measurement of the samples were carried out using the same GC:MS combination as
described above, using the second method for larger compounds. Injection was carried
out using an autosampler and the chromatograph was operated in splitless mode with an
injection volume of 1µl. In addition to the lab air blanks from the start of each day,
DCM blanks were also run to ensure no contamination from the carrier solvent.
I
II
III
IV
V
Figure 2.3 Dynamic headspace sampling with adsorbent volatile collection traps. I)
Sampling chamber: The stainless-steel line out (II) connects to a volatile collection trap filled
with Porapak Q (III) before connecting to a flowmeter (IV) and pump with flow rate set to
400ml min-1. Air coming into the chamber was pumped in through an activated charcoal trap
(V), with a flowmeter ensuring the flow rate stayed at 700ml min-1.

49
Standards of known nematode chemoattractants β-caryophellene (Hammack 2001,
Rasmann et al. 2005, Sadeh et al. 2017), α-pinene (Hallem et al. 2011, Zaka et al. 2015,
Zhao et al. 2007), limonene (Sadeh et al. 2017) and linalool (Hallem et al. 2011, Hammack
2001) were run on the GC:MS using the same injection method and the same analysis
method as both the canister samples and the volatile collection trap samples. These were
run at a range of concentrations from 1ng ml-1 to 5µg ml-1. This was to ensure that the
analysis method could detect these compounds, to confirm that if they were absent
from the sample chromatograms, it was not due to inadequacies of the GC:MS analysis
method.
After sampling, the plants were harvested as in the direct headspace method and tested
for successful infection.
Trichodorid choice experiments
Olfactometers were built using cut 50ml falcon tubes and PTFE tubing. The
PTFE “arms” leading to the outer pots were 80mm long in total. The longest section of
the arm was 50mm, leading from the central pot towards the outer pots, before being
blocked by a 2 micron mesh (TWP Inc. CA, USA). A 20mm piece then connected the
30mm portion of the arm to the outer pots. Each olfactometer had two outer pots; one
contained a plant infected with wild-type TRV, the other with untransformed
Figure 2.4 Olfactometers with N. benthamiana plants.
Plants were grown in different tubes and moved to the
olfactometer one day before testing.

50
Agrobacterium controls that were moved to the pots 24 hours before the trials.
The olfactometers were filled with washed and autoclaved sand that was kept at 20%
moisture by volume until the start of the experiment. The pots were not handled during
the trial to avoid disturbance.
Nematodes used in experimental work were extracted from a 200 g subsample
(Wiesel et al. 2015) from agricultural soil samples using a sieving and decanting modified
Baermann funnel extraction method (as detailed in Brown and Boag 1988). After c. 48
h, extracted nematodes were collected in 20 ml of water and left to settle for c. 2 hours
and excess water decanted. Trichodorids were hand-picked into distilled water in 2ml
Eppendorf tubes under low-powered microscopy and stored at 4ºC until required.
Seven days post infection, 50 nematodes were added to the central pot. Four 50
nematode replicates were run (Figure 2.4) and the direction of the treatments (left or
right pot) was randomly allocated for each replicate. The experiment was repeated two
more times to give 12 replicate data points. The clear plastic pots were wrapped in
aluminium foil to exclude light and the experiment was kept at 23-24°C for 24 hours.
Nematodes were extracted after the assay using a simplified version of the
Brown and Boag Baermann funnel method where only the final separation step was
required. The sand from each section (infected arm, control arm and central pot) was
placed in individual Baermann extraction funnels filled with dH2O (Figure 2.5) such that
three funnels were required per olfactometer. After c. 48 hours, the nematodes had
collected in the water at the bottom of the funnel and 5-10ml of this water, including
the nematodes, was collected in 50ml plastic tubes and stored at 4ºC until counted.
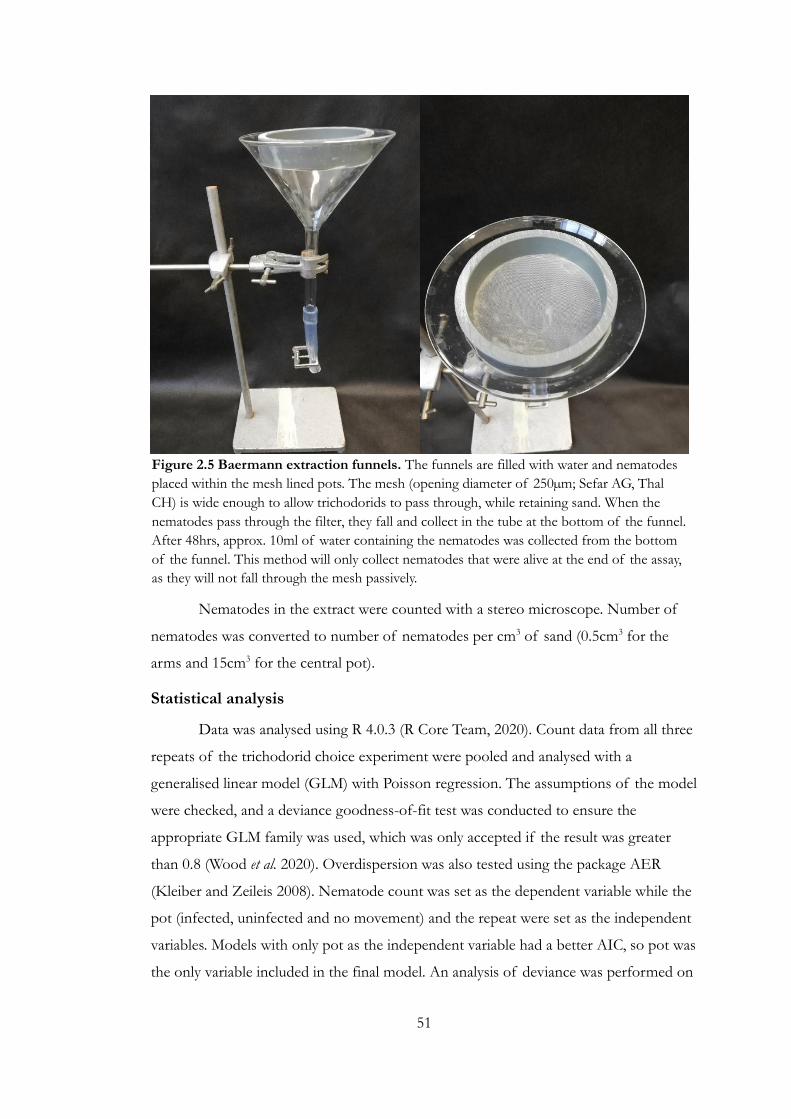
51
Nematodes in the extract were counted with a stereo microscope. Number of
nematodes was converted to number of nematodes per cm3 of sand (0.5cm3 for the
arms and 15cm3 for the central pot).
Statistical analysis
Data was analysed using R 4.0.3 (R Core Team, 2020). Count data from all three
repeats of the trichodorid choice experiment were pooled and analysed with a
generalised linear model (GLM) with Poisson regression. The assumptions of the model
were checked, and a deviance goodness-of-fit test was conducted to ensure the
appropriate GLM family was used, which was only accepted if the result was greater
than 0.8 (Wood et al. 2020). Overdispersion was also tested using the package AER
(Kleiber and Zeileis 2008). Nematode count was set as the dependent variable while the
pot (infected, uninfected and no movement) and the repeat were set as the independent
variables. Models with only pot as the independent variable had a better AIC, so pot was
the only variable included in the final model. An analysis of deviance was performed on
Figure 2.5 Baermann extraction funnels. The funnels are filled with water and nematodes
placed within the mesh lined pots. The mesh (opening diameter of 250µm; Sefar AG, Thal
CH) is wide enough to allow trichodorids to pass through, while retaining sand. When the
nematodes pass through the filter, they fall and collect in the tube at the bottom of the funnel.
After 48hrs, approx. 10ml of water containing the nematodes was collected from the bottom
of the funnel. This method will only collect nematodes that were alive at the end of the assay,
as they will not fall through the mesh passively.

52
the model with Tukey HSD post hoc tests with p value adjustment to investigate
significance.
Comparisons between nematode numbers and expression of viral RNA was
carried out with linear regression. All other data were analysed using analysis of
variance, or Kruskal-Wallis test by ranks if the assumptions for analysis of variance were
not met and the data could not be transformed (Kruskal and Wallis 1952). Analysis of
variance model assumptions were checked with Shapiro-Wilk normality tests and
Levene’s test for homogeneity of variance. Tukey HSD post hoc tests were used when
two or more levels of an interaction were significant. Several other R packages were
used: arm () was used to visualise output from the GLM, emmeans (Lenth 2021) to
carry out post hoc comparisons on the GLM and car (Fox and Weisberg 2019) to carry
out Levene’s test for homogeneity of variance.

53
Results
Growth and root morphology
In root scans of infected plants (Figure 2.6), there was a significant difference
in root and shoot dry weight between treatments (root: ANOVA F(1, 30)=7.5, p<0.05,
shoot: ANOVA F(1, 30)12.7, p<0.01) and day (root: ANOVA F(2,30)=30.3, p<0.001, shoot:
ANOVA F(2, 30)=3.5, p<0.05). The cost of infection being apparent from 7 days post
infection (dpi), with uninfected plants having significantly (p<0.05) more root biomass
than infected plants. There was also a trend towards more shoot biomass, although this
was not significant. These patterns were mirrored with fresh weight data (not shown).
These effects were both more significant and more severe for both above and
belowground biomass 14 dpi (p<0.001 for shoot and p<0.01 for root). Shoot dry
weight at 14 dpi was 0.397g±0.019 and 0.165g±0.018 for uninfected and infected plants
respectively; compared to 0.235±0.032 and 0.204±0.021 for uninfected and infected
plants at 7 dpi. Belowground, root biomass at 14 dpi was 0.066±0.001 (uninfected) and
0.043±0.001 (infected) and at 7 dpi: 0.030±0.002 (uninfected) and 0.017±0.002
(infected). The interaction between infection/control and day was significant as the
relationship between treatments changes between the days, particularly for root biomass
(Figure 2.6).
There was a significant interaction between the effects of treatment and
sampling day (ANOVA F(2, 30)=5.0, p<0.05) in root weight to total weight ratio (Figure
2.7) between control and wild-type infected plants. At 7 dpi , the ratio of root to total
plant weight was significantly greater for control plants than uninfected plants(p<0.05).
This ratio reverses strongly by 14 dpi, with infected plants having a significantly greater
proportion of total weight allocated to roots (p<0.001).
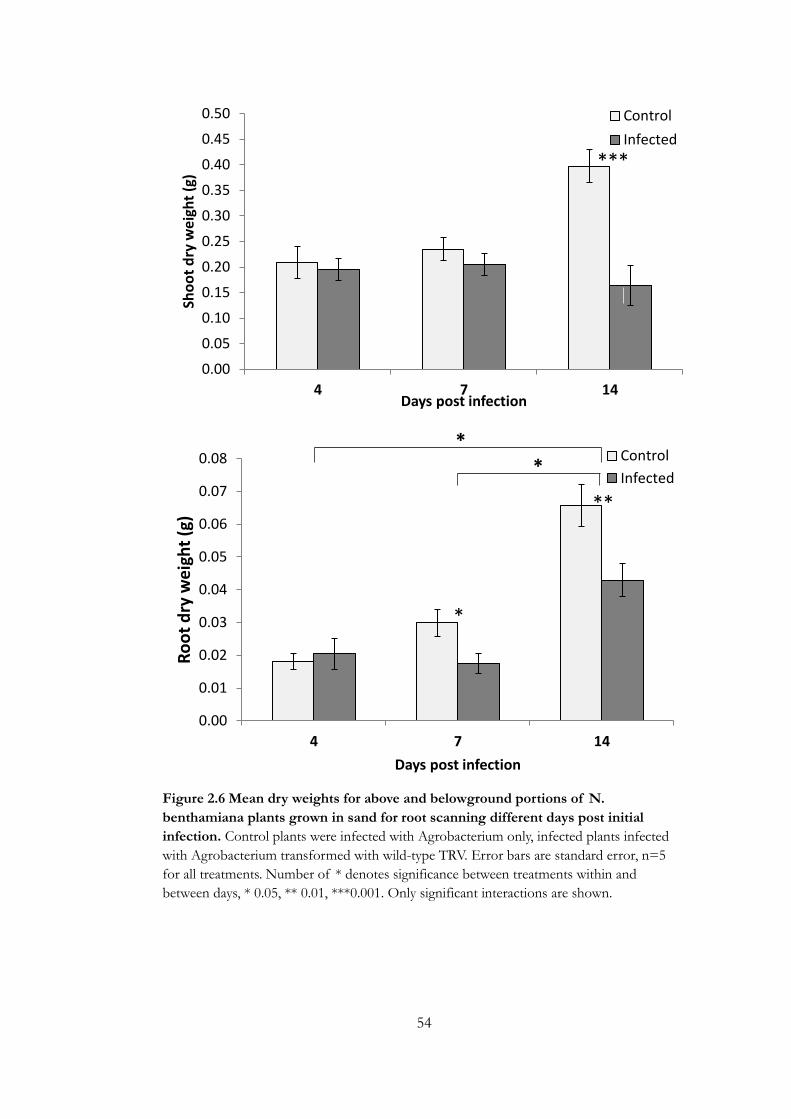
54
0.00
0.01
0.02
0.03
0.04
0.05
0.06
0.07
0.08
4 7 14
Ro
ot
dry
we
igh
t (g
)
Days post infection
Control
Infected
**
*
* *
0.00
0.05
0.10
0.15
0.20
0.25
0.30
0.35
0.40
0.45
0.50
4 7 14
Sho
ot
dry
wei
ght
(g)
Days post infection
Control
Infected
***
Figure 2.6 Mean dry weights for above and belowground portions of N.
benthamiana plants grown in sand for root scanning different days post initial
infection. Control plants were infected with Agrobacterium only, infected plants infected
with Agrobacterium transformed with wild-type TRV. Error bars are standard error, n=5
for all treatments. Number of * denotes significance between treatments within and
between days, * 0.05, ** 0.01, ***0.001. Only significant interactions are shown.
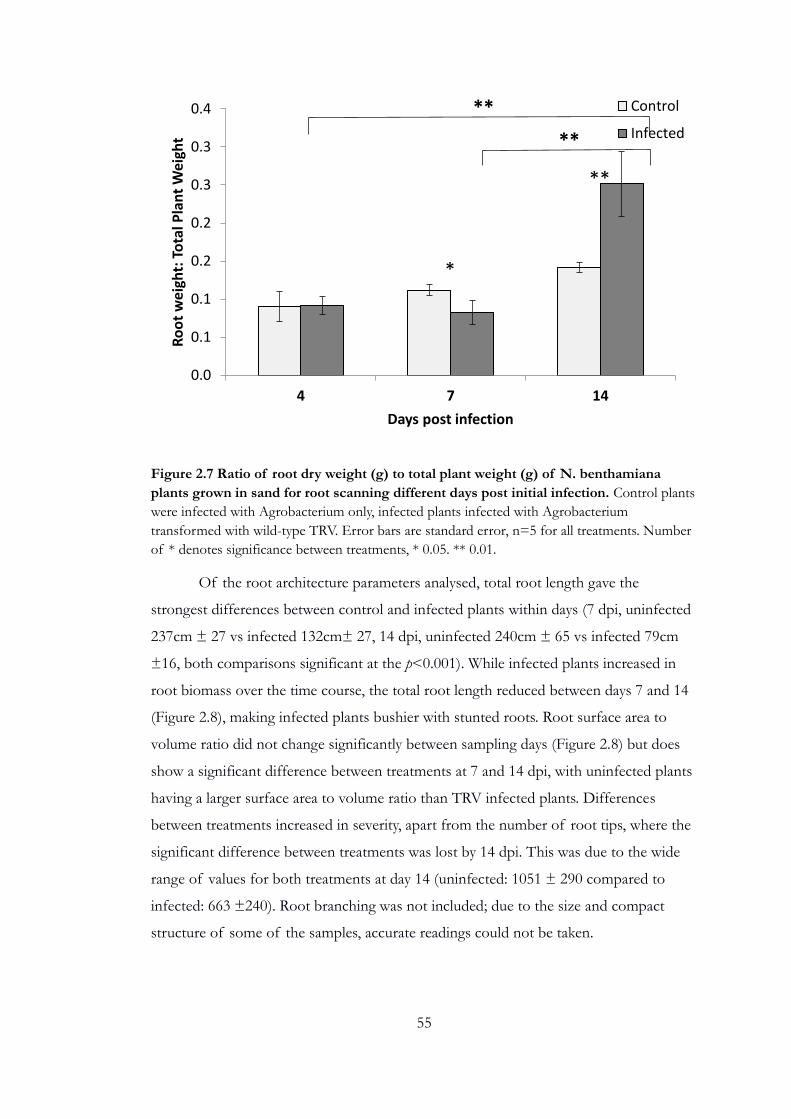
55
Figure 2.7 Ratio of root dry weight (g) to total plant weight (g) of N. benthamiana
plants grown in sand for root scanning different days post initial infection. Control plants
were infected with Agrobacterium only, infected plants infected with Agrobacterium
transformed with wild-type TRV. Error bars are standard error, n=5 for all treatments. Number
of * denotes significance between treatments, * 0.05. ** 0.01.
Of the root architecture parameters analysed, total root length gave the
strongest differences between control and infected plants within days (7 dpi, uninfected
237cm ± 27 vs infected 132cm± 27, 14 dpi, uninfected 240cm ± 65 vs infected 79cm
±16, both comparisons significant at the p<0.001). While infected plants increased in
root biomass over the time course, the total root length reduced between days 7 and 14
(Figure 2.8), making infected plants bushier with stunted roots. Root surface area to
volume ratio did not change significantly between sampling days (Figure 2.8) but does
show a significant difference between treatments at 7 and 14 dpi, with uninfected plants
having a larger surface area to volume ratio than TRV infected plants. Differences
between treatments increased in severity, apart from the number of root tips, where the
significant difference between treatments was lost by 14 dpi. This was due to the wide
range of values for both treatments at day 14 (uninfected: 1051 ± 290 compared to
infected: 663 ±240). Root branching was not included; due to the size and compact
structure of some of the samples, accurate readings could not be taken.
0.0
0.1
0.1
0.2
0.2
0.3
0.3
0.4
4 7 14
Ro
ot
wei
ght:
To
tal P
lan
t W
eigh
t
Days post infection
Control
Infected**
**
*
**
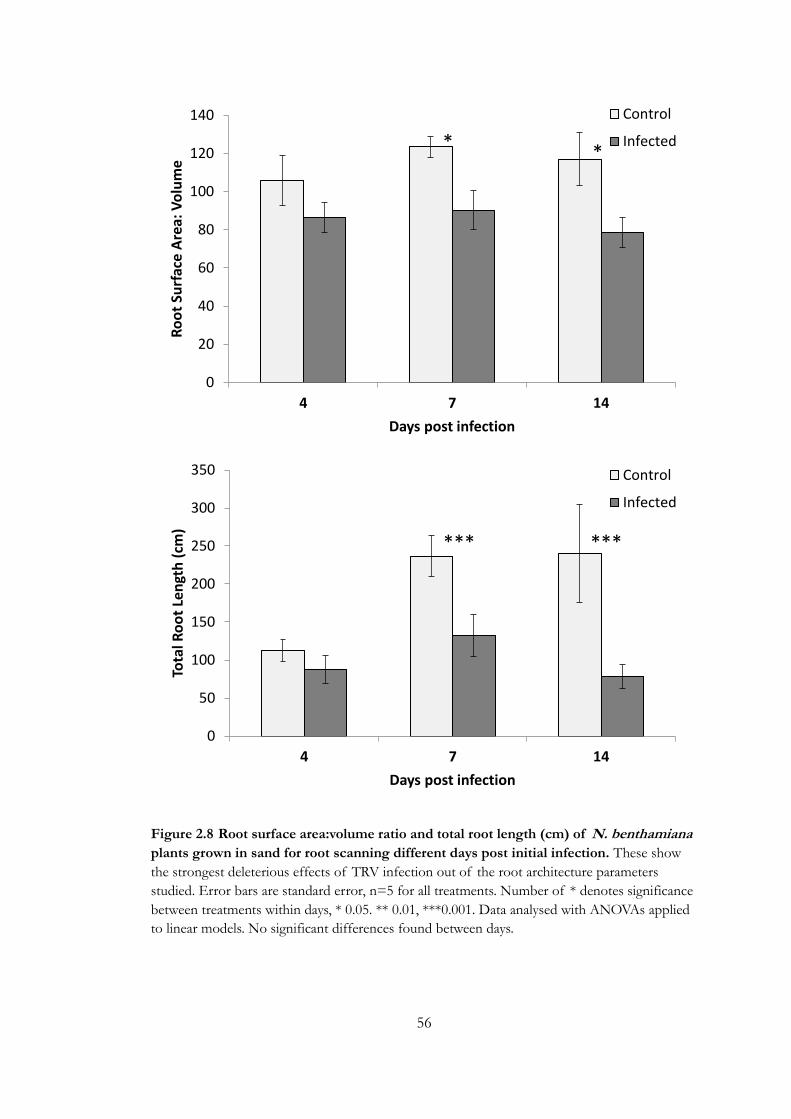
56
Figure 2.8 Root surface area:volume ratio and total root length (cm) of N. benthamiana
plants grown in sand for root scanning different days post initial infection. These show
the strongest deleterious effects of TRV infection out of the root architecture parameters
studied. Error bars are standard error, n=5 for all treatments. Number of * denotes significance
between treatments within days, * 0.05. ** 0.01, ***0.001. Data analysed with ANOVAs applied
to linear models. No significant differences found between days.
0
20
40
60
80
100
120
140
4 7 14
Ro
ot
Surf
ace
Are
a: V
olu
me
Days post infection
Control
Infected
0
50
100
150
200
250
300
350
4 7 14
Tota
l Ro
ot
Len
gth
(cm
)
Days post infection
Control
Infected
*
1a
*** ***
1a
*
1a

57
Root VOC sampling
Direct headspace semi-static sampling
Hydroponically grown plant biomass showed significant reduction in both above
and belowground biomass in wild-type TRV infected plants (0.78g±0.16 aboveground
and 0.09g±0.02 belowground) compared to Agrobacterium infected controls (1.85g±0.44
aboveground and 0.36g±0.11 belowground) (Figure 2.9). Average dry shoot and dry
weight of wild-type TRV-infected plants and control plants differed significantly from
each other (both p< 0.01). Infection with TRV RNA-2 mutants missing 2b and 2c
showed an intermediate effect of infection with no significant difference between
mutant-infected plants (1.22g±0.47) and either control (1.85g±0.44) or wild-type
infected plants (0.78g±0.16) for dry shoot weight. For dry root weight, there was a
significant difference between control (0.36g ±0.11) and mutant infected plants
(0.15g±0.05, Kruskal-Wallis χ2=11.8, df=2, p<0.01), but none between mutant-infected
plants and wild-type infected plants. Other root architecture parameters were not
recorded, but on visual observation, root length was reduced and root diameter larger
than plants grown in sand.
Figure 2.9 Mean dry weights for above and belowground portions of N. benthamiana
plants grown in hydroponics 7 days post infection. Aboveground biomass is shown along
the positive axis, with belowground biomass along the negative. Control plants were infected
with Agrobacterium only, while both TRV treatments were infected with Agrobacterium
transformed with TRV. Central bar shows data from mutant RNA-2 where 2b and 2c have been
removed whilst the right bar shows a wild-type RNA-2 genome. RNA-1 was untransformed in
both cases. Error bars are standard error, n=6 for all treatments. * p<0.05, ** p<0.01.
-1
-0.5
0
0.5
1
1.5
2
2.5
Control TRV Δ2 TRV wild-type
Pla
nt
dry
wei
ght
(g)
**
*
** **

58
The canister samples were analysed by comparing profiles of t=20
chromatograms to the t=0 baselines. Peaks that were present in t=20 samples but
missing or reduced at least twofold in the lab air were flagged up as potential plant
volatile candidates for infection-dependent compounds. Nine compounds of potential
interest were flagged up from the method looking at <C20 compounds, but none were
found from the <C6 compound assay. Peak areas for selected compounds were
recorded and their mass spectra were putatively identified using the inbuilt NIST
database (Agilent ChemStation Data Analysis). Peak areas were converted fluxes of µg
min-1 g dry root weight-1 as described in Chapter 2 Methods. Of the nine compounds
selected, four compounds of interest (Figure 2.10) showed significant differences
between treatments; putatively identified as 2-ethyl-1-hexanol (K-W, chi=6.22, d.f.=2,
p<0.05), m-ditertbutylbenzene (K-W, chi=8.3158, d.f=2, p<0.05), 2,4, ditertbutylphenol
(K-W, chi=6.86, d.f.=2, p<0.05) and 2,6, ditertbutylquinone (K-W, chi=9.32, d.f.=2,
p<0.01). For all compounds, significant differences were found between wild-type TRV-
infected plants and the other treatments (all significant at p<0.05), with no differences
between mutant-infected plants and Agrobacterium controls.

59
Figure 2.10 Average root VOC fluxes from roots of plants infected with TRV. Control plants were infected with Agrobacterium only, while both TRV treatments were infected with Agrobacterium transformed with TRV. TRV-2 (CP+2b+2c) are plants infected with wild-type TRV with an intact RNA-2, whereas TRV-2 (CP+GFP) were plants infected with mutant TRV missing two genes from RNA-2. The fluxes are shown at two scales due to variability in the size of fluxes and are µg min-1 g-1- root dry weight. Error bars are standard error, n=6 for all treatments. * p<0.05.
-5.E-02
0.E+00
5.E-02
1.E-01
2.E-01
2.E-01
3.E-01
2-ethyl-1-hexanol 2,6 ditertbutylquinone
VO
C F
lux
(µg/
min
/g r
oo
t d
ry w
eigh
t)
Control
TRV wild-type
TRV Δ2
-5.E-03
-3.E-03
0.E+00
3.E-03
5.E-03
8.E-03
1.E-02
m-ditertbutylbenzene 2,4, ditertbutylphenolVO
C F
lux
(µg/
min
/g r
oo
t d
ry w
eigh
t)
Control
TRV wild-type
TRV Δ2
* *
* *
* *
* *
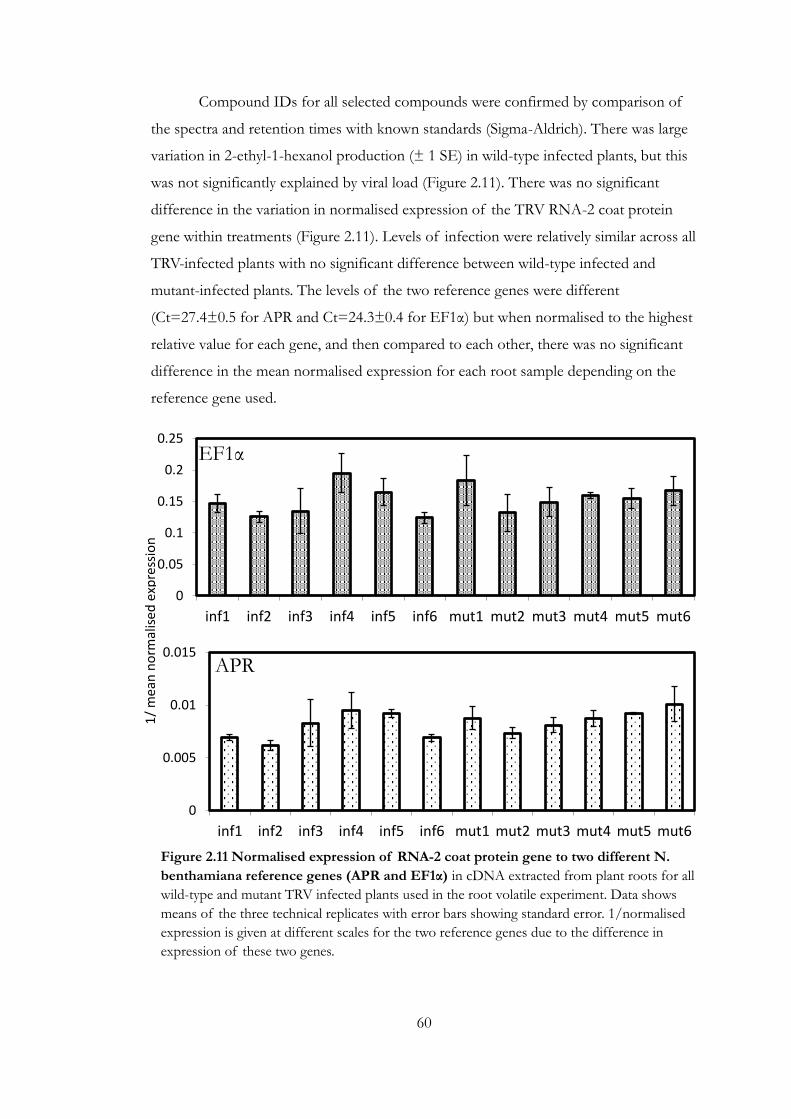
60
Compound IDs for all selected compounds were confirmed by comparison of
the spectra and retention times with known standards (Sigma-Aldrich). There was large
variation in 2-ethyl-1-hexanol production (± 1 SE) in wild-type infected plants, but this
was not significantly explained by viral load (Figure 2.11). There was no significant
difference in the variation in normalised expression of the TRV RNA-2 coat protein
gene within treatments (Figure 2.11). Levels of infection were relatively similar across all
TRV-infected plants with no significant difference between wild-type infected and
mutant-infected plants. The levels of the two reference genes were different
(Ct=27.4±0.5 for APR and Ct=24.3±0.4 for EF1α) but when normalised to the highest
relative value for each gene, and then compared to each other, there was no significant
difference in the mean normalised expression for each root sample depending on the
reference gene used.
0
0.05
0.1
0.15
0.2
0.25
inf1 inf2 inf3 inf4 inf5 inf6 mut1 mut2 mut3 mut4 mut5 mut6
0
0.005
0.01
0.015
inf1 inf2 inf3 inf4 inf5 inf6 mut1 mut2 mut3 mut4 mut5 mut6
APR
EF1α
1/
mea
n n
orm
alis
ed e
xpre
ssio
n
Figure 2.11 Normalised expression of RNA-2 coat protein gene to two different N.
benthamiana reference genes (APR and EF1α) in cDNA extracted from plant roots for all
wild-type and mutant TRV infected plants used in the root volatile experiment. Data shows
means of the three technical replicates with error bars showing standard error. 1/normalised
expression is given at different scales for the two reference genes due to the difference in
expression of these two genes.

61
Dynamic solvent-based headspace sampling
These samples were analysed by comparing profiles of t=45 chromatograms to
the lab air blanks (example given in Figure 2.12). Any peaks present in the sample or
missing or reduced by a factor of 2x in the lab air blanks would be flagged as a
compound of interest. Across all three time points, when comparing with lab air blanks,
no compounds of interest were found in either infected or Agrobacterium control plant
samples. The DCM blanks showed no discernible peaks. Infection testing with end
point RT-PCR showed that all plants were successfully infected. RT-qPCR was not
carried out on these plants, due to the lack of volatiles of interest present in these
samples.
Figure 2.12 Example chromatograms of dynamic headspace solvent-based root VOC sampling. The chromatograms are staggered to show the similarities in traces between treatments with time post injection on the X axis and abundance on the Y axis with arbitrary units due to the stagger. There are no peaks present in the dichloromethane blank, showing no contamination of the solvent used, but no significant differences in peaks present in the lab air compared to Agrobacterium control infected plants and TRV infected plants. All peaks identified with this method were compounds present in the background air This pattern was repeated across all samples analysed. The samples used here for examples are all from 7 days post infection.
4.0
91
5.0
35.
96
96.
90
77.
84
68.
78
59.
72
410
.662
11.6
0112
.54
13.4
7814
.417
15.3
5616
.295
17.2
3318
.172
19.1
1120
.05
20.9
8821
.927
22.8
6623
.804
24.7
4325
.682
26.6
2127
.559
28.4
9829
.437
30.3
7631
.314
32.2
5333
.192
34.1
31
Time (minutes)
Control
TRV wild-type
Lab air
DCM Blank
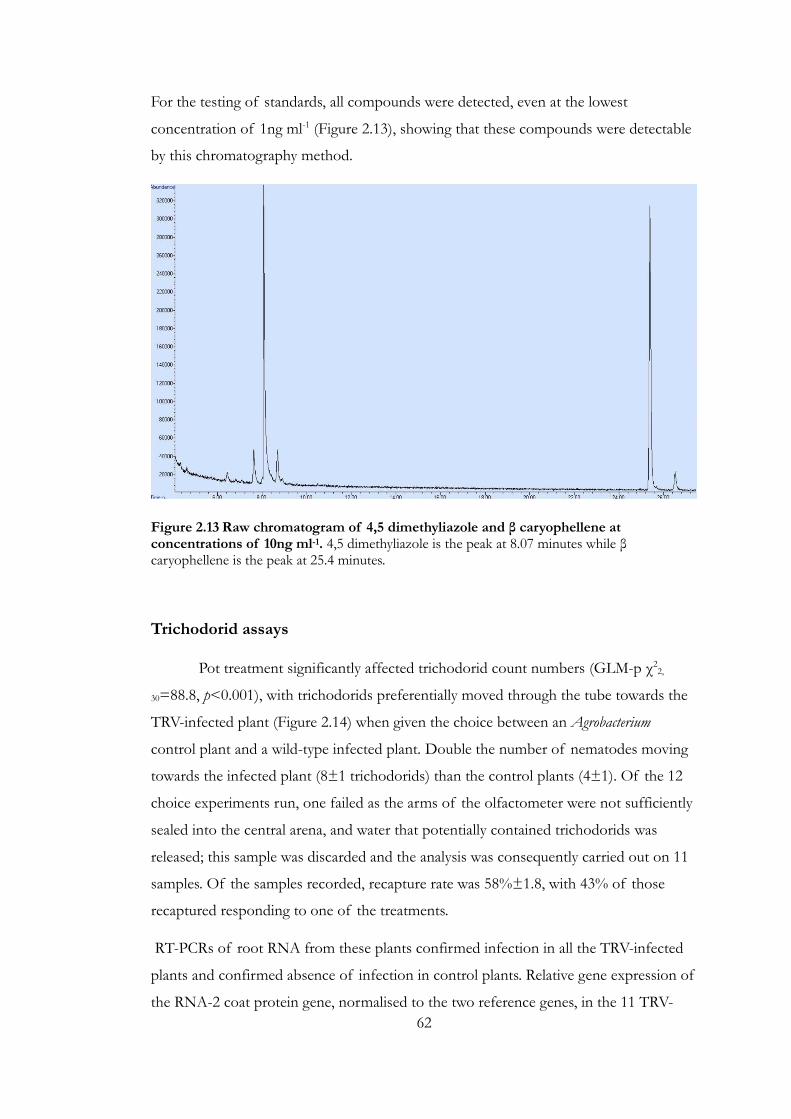
62
For the testing of standards, all compounds were detected, even at the lowest
concentration of 1ng ml-1 (Figure 2.13), showing that these compounds were detectable
by this chromatography method.
Figure 2.13 Raw chromatogram of 4,5 dimethyliazole and β caryophellene at concentrations of 10ng ml-1. 4,5 dimethyliazole is the peak at 8.07 minutes while β caryophellene is the peak at 25.4 minutes.
Trichodorid assays
Pot treatment significantly affected trichodorid count numbers (GLM-p χ22,
30=88.8, p<0.001), with trichodorids preferentially moved through the tube towards the
TRV-infected plant (Figure 2.14) when given the choice between an Agrobacterium
control plant and a wild-type infected plant. Double the number of nematodes moving
towards the infected plant (8±1 trichodorids) than the control plants (4±1). Of the 12
choice experiments run, one failed as the arms of the olfactometer were not sufficiently
sealed into the central arena, and water that potentially contained trichodorids was
released; this sample was discarded and the analysis was consequently carried out on 11
samples. Of the samples recorded, recapture rate was 58%±1.8, with 43% of those
recaptured responding to one of the treatments.
RT-PCRs of root RNA from these plants confirmed infection in all the TRV-infected
plants and confirmed absence of infection in control plants. Relative gene expression of
the RNA-2 coat protein gene, normalised to the two reference genes, in the 11 TRV-
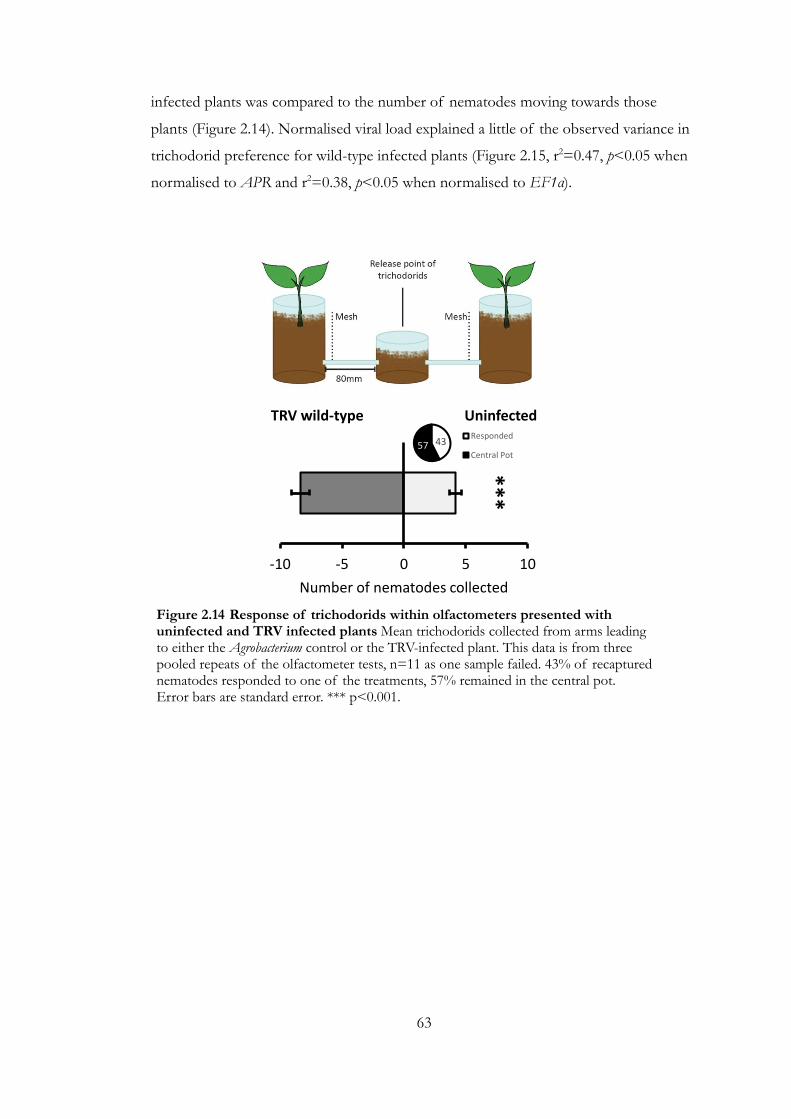
63
infected plants was compared to the number of nematodes moving towards those
plants (Figure 2.14). Normalised viral load explained a little of the observed variance in
trichodorid preference for wild-type infected plants (Figure 2.15, r2=0.47, p<0.05 when
normalised to APR and r2=0.38, p<0.05 when normalised to EF1α).
-10 -5 0 5 10
Number of nematodes collected
***
TRV wild-type Uninfected
4357Responded
Central Pot
Figure 2.14 Response of trichodorids within olfactometers presented with uninfected and TRV infected plants Mean trichodorids collected from arms leading to either the Agrobacterium control or the TRV-infected plant. This data is from three pooled repeats of the olfactometer tests, n=11 as one sample failed. 43% of recaptured nematodes responded to one of the treatments, 57% remained in the central pot. Error bars are standard error. *** p<0.001.

64
Figure 2.15 Comparison of nematode movement towards infected plants with two indicators for degree of infection. Both are relative abundances of TRV RNA-2 coat protein gene normalised to a different N. benthamiana reference gene.
5
7
9
11
13
15
17
19
21
23
25
0.4 0.5 0.6 0.7 0.8 0.9 1 1.1
Nu
mb
er o
f n
emat
od
es /
cm3
Relative normalised gene expression TRV RNA-2
EF1a APR

65
Discussion
TRV infection had a deleterious effect on plant growth, allocating residual
growth capacity to root systems and accelerating these impacts between 7 and 14 dpi.
As predicted, there was a significant decline in total plant biomass with infection,
inclusive of stunted root elongation which reduced the surface area to volume ratio of
the roots. The number of root tips was also reduced in infected plants, showing a
decline in root proliferation. At 7 days, infected plant root mass constituted a lower
percentage of overall plant biomass than in controls, despite relatively equivalent
aboveground biomass, showing that the reduction in biomass from infection through to
day 7 was stronger in the root system in infected plants. There was a switch in the trends
of root:shoot ratio between infected and uninfected plants between 7 and 14 dpi, with
infected plants allocating a greater proportion of their total weight to roots, which may
be an attempt for infected plants to redirect residual growth capacity to the roots, to try
and provide more resources for growth.
These infection effects may be transient (Fernández -Calvino et al. 2014,
Valentine et al. 2004), reducing in intensity and significance as time passes after infection
(Shaw et al. 2014). This may explain why no published papers remark on deleterious
effects of TRV infection on root systems, and only record tuber yield when looking at
potatoes (Dale et al. 2000, 2004). Historically, the negative effects seen on growth,
particularly in roots, in the trichodorid–TRV relationship in plants have been assigned to
the trichodorids rather than the virus, such that trichodorids are referred to as “stubby
root nematodes”, ostensibly because of the reduced root mass due to their feeding on
plant roots (e.g. Ruehle 1969, Standifer and Perry 1960, Whitehead et al. 1970, Yokoo
1964). These data suggest that viral infection may contribute to the damage and
reduction in growth attributed solely to trichodorid infestations. It is clear that TRV
infection does cause significant differences in both above and belowground biomass, at
least until day 14 post infection. There was no significant difference in average root
diameter, so whether the effects on roots are due to a change in root architecture or just
reduced growth is less clear; however, due to the significant reduction in root length in
infected plants at 14 dpi even while belowground biomass starts to recover, it suggests
that the effect is less likely to be merely due to overall decline in growth with infection.
Using the direct headspace sampling method, four volatile compounds were
identified as being overproduced in wild-type TRV-infected plants compared to plants
66
infected with either 2b- and 2c-missing TRV mutants or Agrobacterium controls. These
were 2-ethyl-1-hexanol, 1,4-di-tertbutylbenzene, 2,6 ditertbutylquinone and 2,4
diterbutylphenol. 2-ethyl-1-hexanol is produced by many different plant species,
including wheat (Birkett et al. 2004, Cruz et al. 2012), tobacco (Wei et al. 2004), lychee
(Mahattanatawee et al. 2007, Wu et al. 2009) and olives (Ribeiro et al. 2008). It has
reported bactericidal (Nakamura and Hatanaka 2002) and antifungal effects (Cruz et all.
2012, Fernando et al. 2005) as well as attractant effects on arthropod pests (Birkett et al.
2004). Insertion of the Aspergillus niger β-glucosidase gene, BGL1, by Cauliflower mosaic
virus into Nicotiana tabacum leaves also increases production of 2-ethyl-1-hexanol
compared to control plants (Wei et al. 2004). This would make it an ideal candidate for
upregulated production through viral infection as it has been found to be commonly
produced in multiple plant species. It has also been shown to be the result of an array
of biotic attacks and stresses, such as beetle herbivory (Heil and Bueno 2007), fungal
parasitism (Castelyn et al. 2015, de Lacy Costello et al. 2001) and pathogenic bacteria
(Fernando et al. 2005, Yi et al. 2009). However, production of 2-ethyl-1-hexanol has not
yet been reported as a result of viral infection. There are some concerns that 2-ethyl-1-
hexanol can be a contaminant from industrial plasticisers in volatile sampling (Yi et al.
2009) but this does not explain the large difference found between treatments, although
it may mean that the baseline levels of 2-ethyl-1-hexanol are affected and so slightly
higher. Even with a potentially elevated and noisier baseline that could have affected
starting concentrations, this investigation still identified significant differences in 2-ethyl-
1-hexanol fluxes.
1, 4-di-tertbutylbenzene is produced by beech roots (Voglar et al. 2019), rhizobia
associated with plant roots (Sang et al. 2011), the biocontrol fungus Trichoderma asperellum
(Srinivasa et al. 2017) and the flowers of orchids (Baek et al. 2019). In this context, it is
unlikely that these fluxes are the result of microbially-derived compounds as the plants
were grown hydroponically and the roots rinsed prior to analysis. While there may still
be bacteria associated with the roots, this is less likely. Production has not been reported
to correspond to biotic or abiotic stress in plant roots (Voglar et al. 2019), nor does it
have any reported antibiotic properties when tested (Sang et al. 2011). The likelihood of
this compound being produced by root-associated microbes in this investigation is low,
as the plants were grown hydroponically and rinsed before sampling.
67
Neither of the two remaining compounds have been identified in the literature
as being produced by plants or microbes. It may be that they are produced as a result of
contamination, and this study is repeated (Chapter 3) as a preliminary assay, with limited
replicates, to identify and confirm the presence of virally mediated root volatiles and to
confirm both the identity and role of these reported compounds in viral transmission.
The mutant infection treatment missing 2b and 2c showed volatile production
that was statistically similar to the controls. This suggests that the observed differences
in trace gas production were caused by products or interactions of one or both genes on
infection. Alternatively, it is possible that the mutant infection was less deleterious to the
plant and so did not elicit such a strong response, which is supported by the less severe
effect on shoot and root biomass caused by the mutant infection than wild-type
infection. In Chapter 3, two additional mutant treatments are tested to ascertain the
effects of losing the functional effects of 2b and 2c in isolation. This way, any effects of
a loss of function of one gene can be tested without confounding effects of the other.
Attempts to collect volatile and semi-volatile samples using the volatile
collection traps failed to find any compounds released by N. benthamiana plant roots,
irrespective of infection treatment. As the gas chromatography method used was the
same as that for the analysis of the canister samples, and because all tested standards
were detected using this method, even at very low concentration, it is unlikely that the
lack of peaks can be attributed to this. As peaks were present in the lab air samples that
were not present in the DCM blanks, the volatile traps had captured some volatiles, so it
is also unlikely to be the fault of the polymers. Porapak Q as an adsorbent has a high
affinity for lipophilic to medium polarity organic compounds of intermediate molecular
weight. It is suitable for a wide range of VOCs including oxygenated compounds (Tholl
et al. 2006) and should have captured some of the compounds seen in the canister
samples, including 2-ethyl-1-hexanol. It is probable that there was a fault in the setup of
the sampling equipment, and that the air being pulled over the traps was not solely from
the sampling chamber. It is also likely that the plants were not left long enough in the
sampling chamber for enough volatiles to have accumulated in the traps to give visible
peaks. Other studies using adsorbent matrices to sample compounds from plants
typically leave the plant material in the sampling apparatus for at least one and
sometimes up to 10 hours (e.g. Bera et al. 2018, Mozūraitis et al. 2020, Steen et al. 2019).
This is not a possibility for these investigations, as to leave roots exposed for that length

68
of time would cause drought stress on the plant, with a possible associated effect on
volatile emissions (Salerno et al. 2017). Considering these factors, future volatile analysis
in this thesis was carried out using the canisters and static headspace collection methods.
The olfactometer tests strongly indicate that trichodorids are responding
positively to signals coming from TRV-infected plants that are not present in
Agrobacterium-infected controls. This effect was significant in all three repeats of this trial
and the RT-qPCR data shows that the strength of the movement correlates positively
with increasing levels of infection. This is the first documented proof of trichodorids
responding to TRV-infected plants and of potential chemotaxis for these nematodes,
but it fits in with the understanding of how nematodes in general orient themselves in
their soil environment and find food sources (Kergunteuil et al. 2019, Mondal et al. 2019,
Oota et al. 2019, Rasmann et al. 2012, Schratzberger et al. 2019). With further work, the
four compounds identified in the root volatile portion of this investigation should be
tested on trichodorids in order to attempt to pinpoint the cause for this response. 2-
ethyl-1-hexanol was selected for testing in Chapter 4, as it was produced in much larger
quantities than the other identified compounds and has been documented in a wide
variety of plant–pest interactions (p56-7). The Δ2b mutant mentioned above is tested in
olfactometer assays against wild-type TRV-infected plants and control plants (Chapter 3)
to see if there is variation in the strength of the attraction of the mutant treatments
compared to wild-type.
This work has demonstrated that TRV infection has wide-ranging effects on
plants and on plant–nematode interactions that were previously unknown. Infection
does cause trichodorids to alter their behaviour and move towards infected plants which
would help increase uptake of the virus by trichodorids and so theoretically increase
transmission rates. This may be a driver in the huge variation in in-field transmission
efficiencies of TRV (Ploeg et al. 1989). The volatile study has suggested a group of
potential compounds that are overexpressed by wild-type infected plants compared to
control plants. These compounds, either alone or in a blend of chemicals or even in
concert with other factors, may explain the attractant effect seen in the olfactometer
assays.

69
Chapter 3
Introduction
Work in the previous chapter showed clear effects of TRV infection on N.
benthamiana plants; from impacting above and belowground growth and biomass
allocation to the compounds released by living plant roots. There was also a significant
difference in the preference of trichodorid nematodes when presented with plants
infected with wild-type TRV and control plants. For effective viral control it is critical to
establish which part of the virus is most responsible for the observed plant behaviour.
Plant biomass data from Chapter 2 (Figure 2.8) demonstrated that plants infected with a
TRV mutant that was missing two genes from RNA-2 responded in a similar way to
uninfected plants in some respects (volatile fluxes, Figure 2.9). In terms of plant
biomass and allocation, mutant-infected plants showed a reduced impact of infection
(hydroponic plant weights, Figure 2.8) and showed an intermediate response between
uninfected and wild-type infected plants.
While the previous work answers some questions about the direct effects of
infection, it does generate others. Strong effects of infection were seen but the
permanence of these effects was not rigorously tested. Apart from spraing symptoms in
potato, the initial reduction in root to total plant biomass and dramatic reversal at 14
days post infection (dpi) with TRV infection have not been reported in the literature,
while aboveground effects are well documented across different hosts (Otulak et al.
2012). This contradiction between our previous results and the published literature
could be due to the temporary nature of TRV infection, consistent with previous
reports of recovery from TRV symptoms in N. benthamiana from 18 dpi (Cadman and
Harrison 1959, Ratcliff et al. 1999, 2001, Shaw et al. 2014). If this is the case, this has
ramifications for agricultural systems since the time of infection may alter the severity
of crop symptoms, e.g. potato seedlings that are virally infected may not be infected
when tubers are set and spraing symptoms may not appear unless re-transmission
occurs (Harrison and Robinson 1986, MacFarlane 1999). In order to address this, it is
important to extend the timeline of infection further to see if and when recovery
occurs. Linking this timeline to growth parameters such as those introduced in the last
chapter (e.g. root length, root:total plant biomass allocation, root surface area) would
also show if the infection effects mirror infection levels completely, or whether there is
a lag period. It has been documented that TRV takes up to 4 days from leaf inoculation

70
to travel to the roots of N. benthamaiana plants and that infection peaks between 7 and 8
dpi (Valentine et al. 2004). In addition to this, it may be that the most deleterious effects
do not occur at peak infection levels and may be noticed even after the expression of
TRV genes is reduced; therefore, the full infection course should be sampled.
This requires further information on how TRV infection is driving these
observable effects, including what part of the virus is responsible. Plant biomass data
from Chapter 2 (Figure 2.8) showed that plants infected with a TRV mutant that was
missing two genes from RNA-2 showed a reduced response to infection than plants
infected with wild-type TRV.
RNA-2 is the second component of TRV’s bipartite RNA genome (Lindner et
al. 2018). It encodes the coat protein gene, which is responsible for production of the
protein capsid around the viral genome and one or more non-structural genes
associated with nematode transmission (Adams et al. 2012, Koenig et al. 2016, Lindner et
al. 2018, MacFarlane 1999, MacFarlane et al. 1995, Ploeg et al. 1993b, Sahi et al. 2016),
depending on the TRV isolate (Figure 1.5). The serotype used in these investigations,
TRV-PpK20, has two genes in addition to the gene encoding for the coat protein, which
are identified as 2b and 2c (Figure 3.1). TRV-PpK20 is one of the most well-reported
serotypes and is known to be transmitted by a single species of trichodorid,
Paratrichodorus pachydermus (Hernández et al. 1995, Ploeg et al. 1993a). It was first isolated
in Kinshaldy, Scotland (Ploeg et al. 1992).
In TRV-PpK20, 2b has been shown to be essential for virus transmission by
nematodes (Hernández et al. 1996, MacFarlane et al. 1996, Visser and Bol 1999), and this
may be due to the formation of link bridges between the 2b protein and the nematode
oesophagus (MacFarlane 1999). 2b genes from different TRV isolates and closely-related
viruses (Pea early browning virus (PEBV) and Pepper ringspot virus (PepRSV)) have
limited similarity (Figure 1.5, Tavares-Esashika et al. 2020) and it has been suggested that
variations in 2b may determine vector species specificity (MacFarlane 1999). 2c proteins
have much less similarity across isolates than 2b and their effect is not well understood.
In an isolate of PEBV (TpA56), deletion or frame-shift mutation of 2c had a negative
effect on nematode transmission (MacFarlane et al. 1996, Schmitt et al. 1998), but this
effect was not seen for 2c genes in TRV-PpK20 (Hernández et al. 1996) or PaY4
(Vassilikos et al. 2001), whereas 2b remained essential. This isolate was chosen for this
investigation since it is i) an isolate common to the UK and ii) well reported with a well-
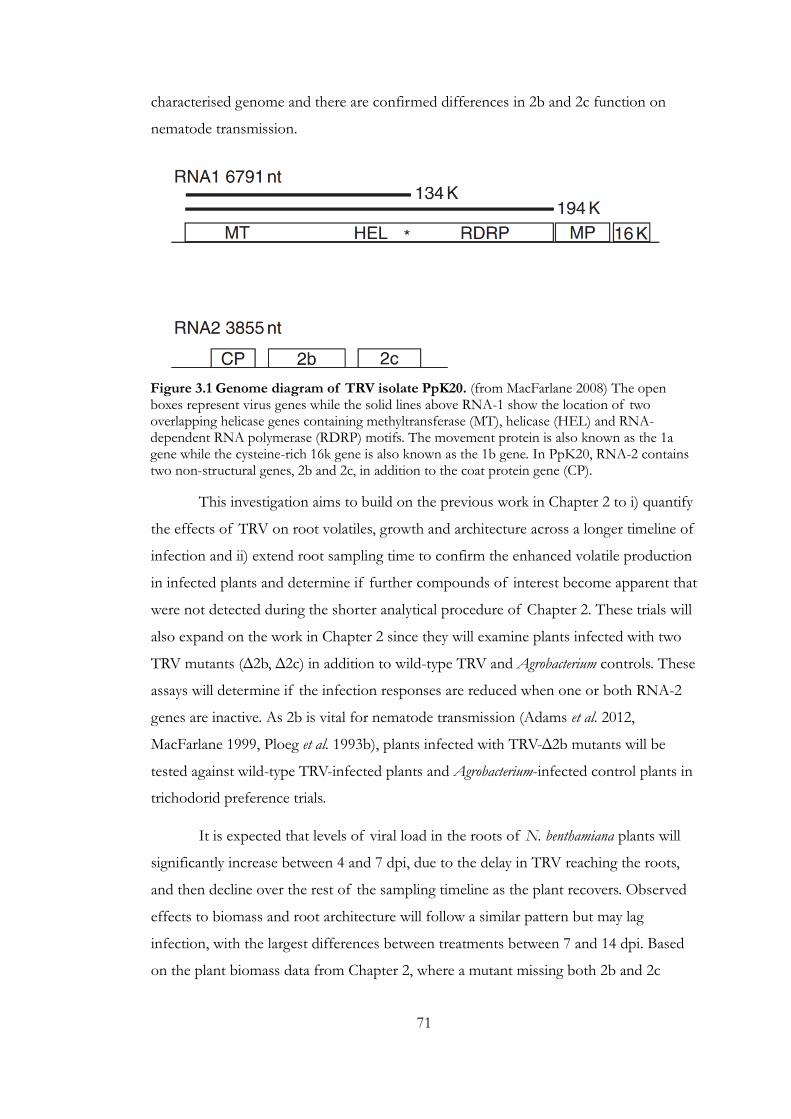
71
characterised genome and there are confirmed differences in 2b and 2c function on
nematode transmission.
This investigation aims to build on the previous work in Chapter 2 to i) quantify
the effects of TRV on root volatiles, growth and architecture across a longer timeline of
infection and ii) extend root sampling time to confirm the enhanced volatile production
in infected plants and determine if further compounds of interest become apparent that
were not detected during the shorter analytical procedure of Chapter 2. These trials will
also expand on the work in Chapter 2 since they will examine plants infected with two
TRV mutants (Δ2b, Δ2c) in addition to wild-type TRV and Agrobacterium controls. These
assays will determine if the infection responses are reduced when one or both RNA-2
genes are inactive. As 2b is vital for nematode transmission (Adams et al. 2012,
MacFarlane 1999, Ploeg et al. 1993b), plants infected with TRV-Δ2b mutants will be
tested against wild-type TRV-infected plants and Agrobacterium-infected control plants in
trichodorid preference trials.
It is expected that levels of viral load in the roots of N. benthamiana plants will
significantly increase between 4 and 7 dpi, due to the delay in TRV reaching the roots,
and then decline over the rest of the sampling timeline as the plant recovers. Observed
effects to biomass and root architecture will follow a similar pattern but may lag
infection, with the largest differences between treatments between 7 and 14 dpi. Based
on the plant biomass data from Chapter 2, where a mutant missing both 2b and 2c
Figure 3.1 Genome diagram of TRV isolate PpK20. (from MacFarlane 2008) The open boxes represent virus genes while the solid lines above RNA-1 show the location of two overlapping helicase genes containing methyltransferase (MT), helicase (HEL) and RNA-dependent RNA polymerase (RDRP) motifs. The movement protein is also known as the 1a gene while the cysteine-rich 16k gene is also known as the 1b gene. In PpK20, RNA-2 contains two non-structural genes, 2b and 2c, in addition to the coat protein gene (CP).

72
genes was tested, I hypothesise that the two mutant treatments will show intermediate
effects between control plants and wild-type infected plants.
Root VOC data is expected to show a significant difference in production of the
four compounds previously identified between wild-type infected plants and control
plants. Plants infected with mutant versions of TRV are hypothesised to show an
intermediate response. Roots that are sampled over longer times will show increased
production of a range of compounds when compared to shorter sampling timeframes.
Based on my previous work I expect that trichodorids will preferentially move
towards wild-type infected plants over TRV-Δ2b infected plants and towards TRV-Δ2b
infected plants over control plants. I further postulate that there will be a positive
relationship between level of infection and i) attractiveness to nematodes and ii)
emission of VOCs elevated under wild-type infection.
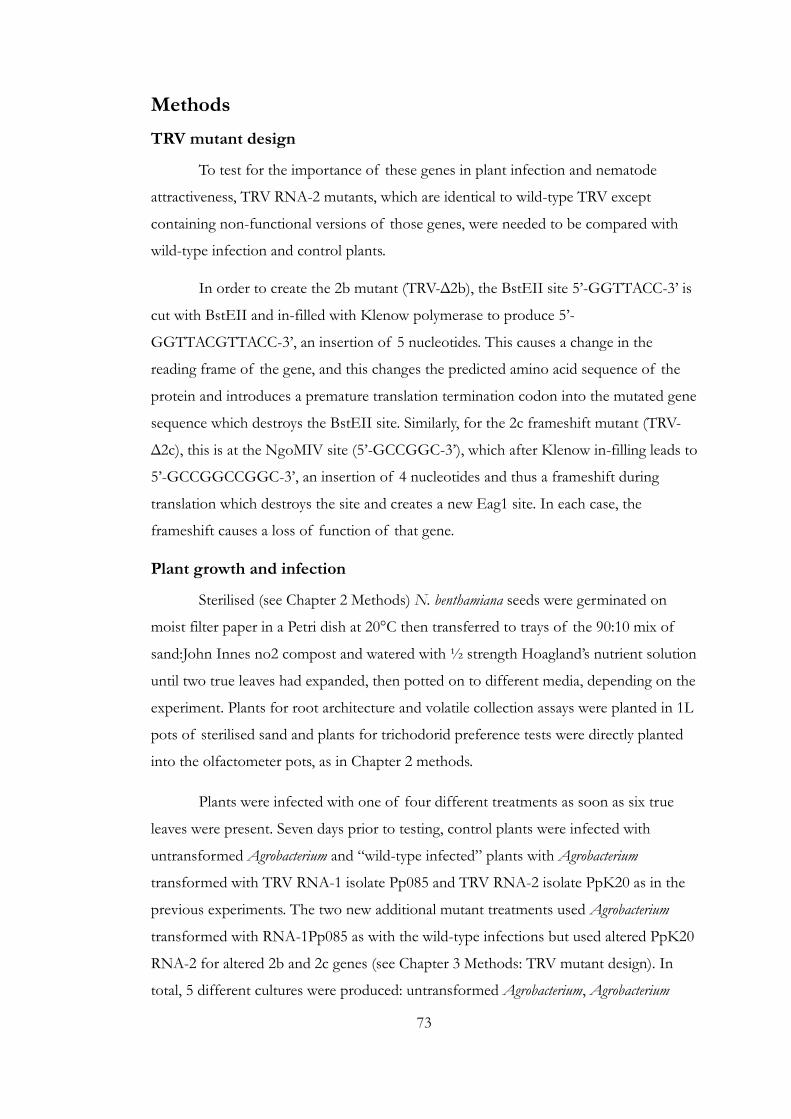
73
Methods
TRV mutant design
To test for the importance of these genes in plant infection and nematode
attractiveness, TRV RNA-2 mutants, which are identical to wild-type TRV except
containing non-functional versions of those genes, were needed to be compared with
wild-type infection and control plants.
In order to create the 2b mutant (TRV-Δ2b), the BstEII site 5’-GGTTACC-3’ is
cut with BstEII and in-filled with Klenow polymerase to produce 5’-
GGTTACGTTACC-3’, an insertion of 5 nucleotides. This causes a change in the
reading frame of the gene, and this changes the predicted amino acid sequence of the
protein and introduces a premature translation termination codon into the mutated gene
sequence which destroys the BstEII site. Similarly, for the 2c frameshift mutant (TRV-
Δ2c), this is at the NgoMIV site (5’-GCCGGC-3’), which after Klenow in-filling leads to
5’-GCCGGCCGGC-3’, an insertion of 4 nucleotides and thus a frameshift during
translation which destroys the site and creates a new Eag1 site. In each case, the
frameshift causes a loss of function of that gene.
Plant growth and infection
Sterilised (see Chapter 2 Methods) N. benthamiana seeds were germinated on
moist filter paper in a Petri dish at 20°C then transferred to trays of the 90:10 mix of
sand:John Innes no2 compost and watered with ½ strength Hoagland’s nutrient solution
until two true leaves had expanded, then potted on to different media, depending on the
experiment. Plants for root architecture and volatile collection assays were planted in 1L
pots of sterilised sand and plants for trichodorid preference tests were directly planted
into the olfactometer pots, as in Chapter 2 methods.
Plants were infected with one of four different treatments as soon as six true
leaves were present. Seven days prior to testing, control plants were infected with
untransformed Agrobacterium and “wild-type infected” plants with Agrobacterium
transformed with TRV RNA-1 isolate Pp085 and TRV RNA-2 isolate PpK20 as in the
previous experiments. The two new additional mutant treatments used Agrobacterium
transformed with RNA-1Pp085 as with the wild-type infections but used altered PpK20
RNA-2 for altered 2b and 2c genes (see Chapter 3 Methods: TRV mutant design). In
total, 5 different cultures were produced: untransformed Agrobacterium, Agrobacterium

74
transformed with TRV RNA-1 and Agrobacterium transformed with the three TRV
RNA-2 variants (wild-type, Δ2b and Δ2c).
Infection solutions were prepared by making overnight stocks of each culture
from frozen glycerol stocks and preparing infiltration cultures of mixed RNA-1/RNA-2
or untransformed Agrobacterium as described previously. All the TRV treatments used the
same RNA-1 culture, so triple volumes were produced compared to the RNA-2 variants.
Once mixed, 0.5ml of the combined infiltration medium were inoculated onto the
apoplast of each leaf using a needleless syringe (Senthil-Kumar and Mysore 2014) and
four leaves were inoculated per plant as in previous experiments (Chapter 2).
Successful infection was tested for with end-point RT-PCRs on leaf and root
tissue from infected plants to check for expression of virus genes using primers from
the 2004 paper by Boutsika and colleagues (Table 2.1). Quantification of infection was
carried out for all investigation, normalised with the same N. benthamiana reference
genes for internal control as previous work (Liu et al. 2012, see Table 2.2). In all
investigations, shoot and root fresh weight was recorded and small samples of both leaf
and root tissue were flash frozen in liquid nitrogen for RNA extraction and
quantification of infection. The remaining plant material was dried at 70ºC for 3 days
before dry weights were recorded.
Growth and root morphology
For this experiment 100 N. benthamiana plants that were potted onto 1L sand
pots were used. Growth conditions were the same as the first root morphology
experiment; plants were fed with 250ml ½ strength Hoaglands twice weekly and watered
with dH2O daily. Previously plants were harvested at 4-, 7- and 14-days post infection
(dpi) and quantification of infection suggested there was a peak in viral load at 7 dpi and
a slight, non-significant decrease between 7 and 14 dpi. To quantify the full infection
time course, plants were also sampled at 21 and 28 dpi (Fernández -Calvino et al. 2014,
Otulak et al. 2012, Valentine et al. 2004). Five plants per treatment were harvested at each
time point, weighed, and growth parameters recorded as in the first experiment: root
and shoot fresh weight, total root length, total root surface area, total root volume,
number of tips and degree of root branching (tip number divided by total root length
using WINRhizo software (Regent Instruments, Canada) on scanned imaged of the
roots).
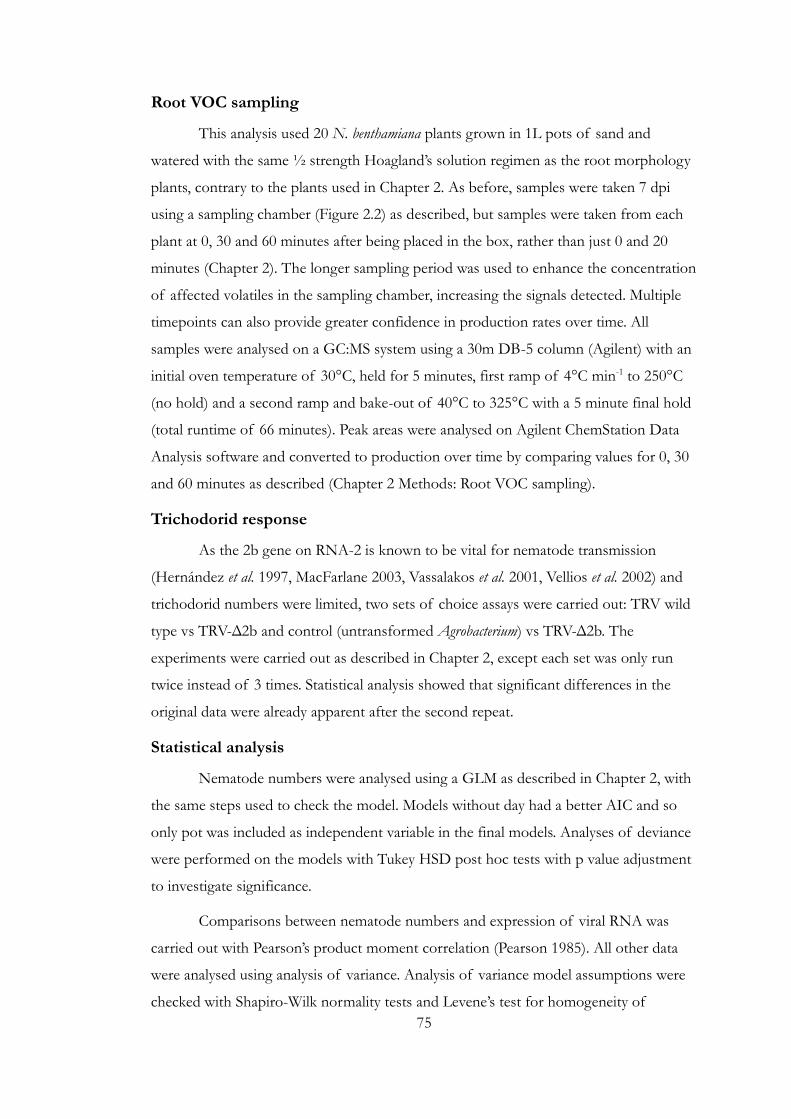
75
Root VOC sampling
This analysis used 20 N. benthamiana plants grown in 1L pots of sand and
watered with the same ½ strength Hoagland’s solution regimen as the root morphology
plants, contrary to the plants used in Chapter 2. As before, samples were taken 7 dpi
using a sampling chamber (Figure 2.2) as described, but samples were taken from each
plant at 0, 30 and 60 minutes after being placed in the box, rather than just 0 and 20
minutes (Chapter 2). The longer sampling period was used to enhance the concentration
of affected volatiles in the sampling chamber, increasing the signals detected. Multiple
timepoints can also provide greater confidence in production rates over time. All
samples were analysed on a GC:MS system using a 30m DB-5 column (Agilent) with an
initial oven temperature of 30°C, held for 5 minutes, first ramp of 4°C min-1 to 250°C
(no hold) and a second ramp and bake-out of 40°C to 325°C with a 5 minute final hold
(total runtime of 66 minutes). Peak areas were analysed on Agilent ChemStation Data
Analysis software and converted to production over time by comparing values for 0, 30
and 60 minutes as described (Chapter 2 Methods: Root VOC sampling).
Trichodorid response
As the 2b gene on RNA-2 is known to be vital for nematode transmission
(Hernández et al. 1997, MacFarlane 2003, Vassalakos et al. 2001, Vellios et al. 2002) and
trichodorid numbers were limited, two sets of choice assays were carried out: TRV wild
type vs TRV-Δ2b and control (untransformed Agrobacterium) vs TRV-Δ2b. The
experiments were carried out as described in Chapter 2, except each set was only run
twice instead of 3 times. Statistical analysis showed that significant differences in the
original data were already apparent after the second repeat.
Statistical analysis
Nematode numbers were analysed using a GLM as described in Chapter 2, with
the same steps used to check the model. Models without day had a better AIC and so
only pot was included as independent variable in the final models. Analyses of deviance
were performed on the models with Tukey HSD post hoc tests with p value adjustment
to investigate significance.
Comparisons between nematode numbers and expression of viral RNA was
carried out with Pearson’s product moment correlation (Pearson 1985). All other data
were analysed using analysis of variance. Analysis of variance model assumptions were
checked with Shapiro-Wilk normality tests and Levene’s test for homogeneity of

76
variance. All root architecture parameters were transformed using cube root
transformation to fit the analysis of variance assumptions. All qPCR data was also
transformed using cube root transformation. The root architecture data were analysed
per timepoint, as well as across the entire dataset. The R packages car (Fox and
Weisberg 2019) was used to carry out Levene’s test for homogeneity of variance,
emmeans (Lenth 2021) to carry out post hoc comparisons on the GLMs and AER
(Kleiber and Zeileis 2008) to check overdispersion of the GLM data. The packages car,
rcompanion (Mangiafico 2020) and MASS (Venables and Ripley 2002) were used for
data transformation and visualisation.

77
Results
Growth and root morphology
There was a significant effect on infection on both shoot and root biomass 7
and 14 dpi (ANOVAs-Day 7: F(3,16)=4.1, p<0.05 [shoot dry], F(3,16)=15.51, p<0.001 [root
dry], Day 14: F(3,16)=4.88, p<0.05 [shoot dry], F(3,16)=11.32, p<0.001 [root dry]), showing
that TRV infection has a negative effect on plant growth and that this is more marked in
roots than shoots (Figure 3.2). No significant effect of infection on root or shoot
biomass was seen at 4 dpi, as in previous work (Chapter 2). The extended timepoints of
21 and 28 dpi show that any differences between treatments are no longer significant.
Post-hoc tests show that Agrobacterium-infected control plants are the largest and differ
significantly compared to wild-type TRV-infected plants for fresh and dry weights of
root and shoot portions of the plants. The TRV mutant treatments show an
intermediate response between control and wild-type infection. Plants infected with
TRV with an altered 2c gene (TRV-Δ2c) only differed significantly from control plants
in root dry weight at 14 dpi (0.03g±0.006 and 0.07g±0.011 respectively, p<0.05); for
other measures, they were similar in size to control plants. For root biomass, they were
significantly larger than wild-type infected plants at 7 dpi (fresh and dry weight p<0.05).
Plants infected with 2b-altered TRV (TRV-Δ2b) never differed from wild-type plants,
although Figure 3.2 suggests that they may have been slightly larger and had significantly
smaller roots than control plants at 7 and 14 dpi (p<0.001, for root fresh and dry at
both timepoints). These suggest slightly reduced costs of infection for these mutant
infections, especially for TRV-Δ2c plants.
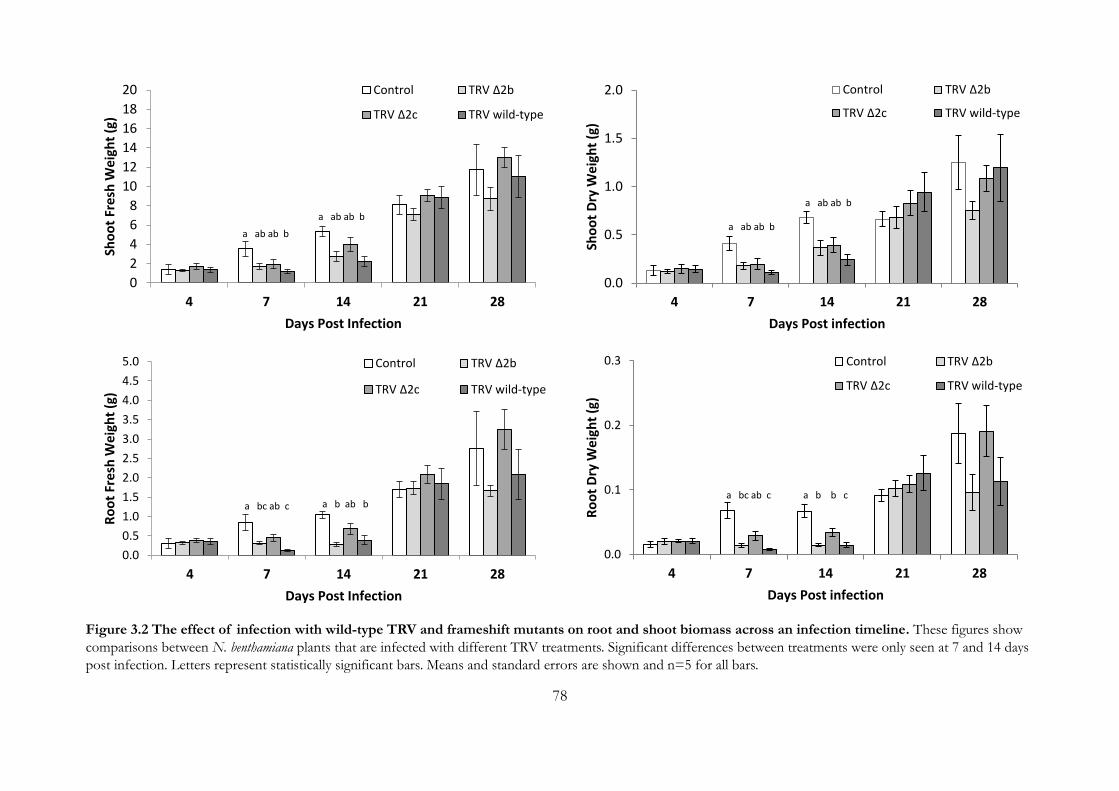
78
0
2
4
6
8
10
12
14
16
18
20
4 7 14 21 28
Sho
ot
Fre
sh W
eig
ht
(g)
Days Post Infection
Control TRV Δ2b
TRV Δ2c TRV wild-type
0.0
0.5
1.0
1.5
2.0
2.5
3.0
3.5
4.0
4.5
5.0
4 7 14 21 28
Ro
ot
Fre
sh W
eig
ht
(g)
Days Post Infection
Control TRV Δ2b
TRV Δ2c TRV wild-type
0.0
0.1
0.2
0.3
4 7 14 21 28R
oo
t D
ry W
eig
ht
(g)
Days Post infection
Control TRV Δ2b
TRV Δ2c TRV wild-type
0.0
0.5
1.0
1.5
2.0
4 7 14 21 28
Sho
ot
Dry
We
igh
t (g
)
Days Post infection
Control TRV Δ2b
TRV Δ2c TRV wild-type
Figure 3.2 The effect of infection with wild-type TRV and frameshift mutants on root and shoot biomass across an infection timeline. These figures show
comparisons between N. benthamiana plants that are infected with different TRV treatments. Significant differences between treatments were only seen at 7 and 14 days
post infection. Letters represent statistically significant bars. Means and standard errors are shown and n=5 for all bars.
a ab ab b
a ab ab b a ab ab b
a ab ab b
a bc ab c a b ab b a bc ab c a b b c
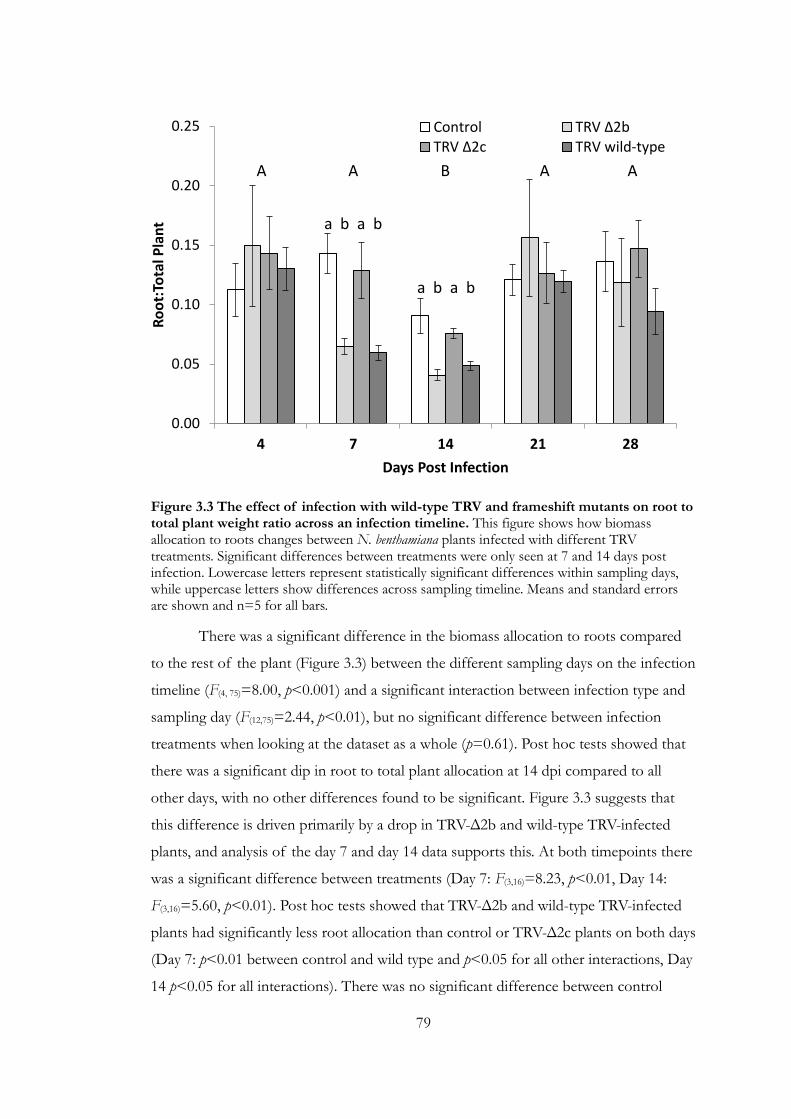
79
Figure 3.3 The effect of infection with wild-type TRV and frameshift mutants on root to total plant weight ratio across an infection timeline. This figure shows how biomass allocation to roots changes between N. benthamiana plants infected with different TRV treatments. Significant differences between treatments were only seen at 7 and 14 days post infection. Lowercase letters represent statistically significant differences within sampling days, while uppercase letters show differences across sampling timeline. Means and standard errors are shown and n=5 for all bars.
There was a significant difference in the biomass allocation to roots compared
to the rest of the plant (Figure 3.3) between the different sampling days on the infection
timeline (F(4, 75)=8.00, p<0.001) and a significant interaction between infection type and
sampling day (F(12,75)=2.44, p<0.01), but no significant difference between infection
treatments when looking at the dataset as a whole (p=0.61). Post hoc tests showed that
there was a significant dip in root to total plant allocation at 14 dpi compared to all
other days, with no other differences found to be significant. Figure 3.3 suggests that
this difference is driven primarily by a drop in TRV-Δ2b and wild-type TRV-infected
plants, and analysis of the day 7 and day 14 data supports this. At both timepoints there
was a significant difference between treatments (Day 7: F(3,16)=8.23, p<0.01, Day 14:
F(3,16)=5.60, p<0.01). Post hoc tests showed that TRV-Δ2b and wild-type TRV-infected
plants had significantly less root allocation than control or TRV-Δ2c plants on both days
(Day 7: p<0.01 between control and wild type and p<0.05 for all other interactions, Day
14 p<0.05 for all interactions). There was no significant difference between control
0.00
0.05
0.10
0.15
0.20
0.25
4 7 14 21 28
Ro
ot:
Tota
l Pla
nt
Days Post Infection
Control TRV Δ2bTRV Δ2c TRV wild-type
a b a b
a b a b
A A B A A

80
plants and TRV-Δ2c infected plants or between TRV wild-type and TRV-Δ2b infected
plants. This suggests that in addition to making plants smaller, infection also
temporarily alters the relative size of root systems to the whole plant.
Infection also affected other aspects of the N. benthamiana plant architecture
(Figure 3.4). Infection reduced total root length (Day 7: F(3,16)=8.23, p=0.01, Day 14:
F(3,16)=13.81, p=0.001) with significant differences between control and wild-type
infected (p<0.001 both days) and control and TRV-Δ2b infected plants (p<0.001 both
days). Plants infected with TRV-Δ2c had significantly longer roots than either TRV-Δ2b
(p<0.05 at day 7, p<0.01 at day 14) or wild-type (p<0.01 at day 7, p<0.05 at day 14)
infected plants across both days but were not significantly different to control plants.
Root surface area (Day 7: F(3,16)=25.27, p<0.001, Day 14: F(3,16)=8.38, p<0.01)
and volume (Day 7: F(3,16)=10.82, p<0.001, Day 14: F(3,16)=7.19, p<0.01) also showed
differences at these two timepoints (Figure 3.4). At 7 dpi, control plants had
significantly greater surface area than TRV-Δ2b (p<0.001), TRV-Δ2c (p<0.01) and wild-
type infected plants (p<0.001) and TRV-Δ2c infected plants had greater surface area
than wild-type infected plants (p<0.01). This difference was slightly reduced at 14 dpi,
with the only significant differences seen between control and TRV-Δ2b (p<0.01) and
wild-type (p<0.01) infected plants, with TRV-Δ2c infected plants giving an intermediate,
but not significantly different response (Figure 3.4). For root volume, the strongest
effect was also seen 7 dpi. Control plants had significantly greater volume than TRV-
Δ2b (p<0.01 both days) and wild-type (Day 7: p<0.001, Day 14 p<0.01) infected plants
at both timepoints and greater than TRV-Δ2c (p<0.05) infected plants at 7 dpi. The data
for root volume is not shown, as it mirrors that of root surface area.
For total root length, total root surface area and total root volume there were no
significant differences between treatments at 21 or 28 dpi. Figure 3.4 suggests a
significant increase for both metrics in plants infected with TRV-Δ2c (root length: 1056
cm ± 55, surface area: 213.3 ± 36.8) at 21 dpi compared to control and TRV-Δ2b
plants, but the overall variability at that time point is too high for a significant result.
There was no overall significant effect on root length, root surface area or root
volume across with infection treatment across the whole timeline. There were no
significant differences found in number of root tips, average root diameter or surface
area to volume ratio either across the whole timeline or at 7 and 14 dpi.

81
There was a significant difference in viral RNA load across days for both
housekeeping genes used (EF1α F(4,59)=1100.87 p<0.001, APR: F(4,59)=1498.67 p<0.001)
with a significant increase at 7 and 14 dpi (Figure 3.5) which then drops off again
between 14 and 21 dpi. At 4 dpi, there are some detectable levels of infection for wild-
type plants whereas there is none for either of the mutant infected treatments. No
significant difference between treatments was found at any other timepoint, even when
analysing each timepoint in isolation.
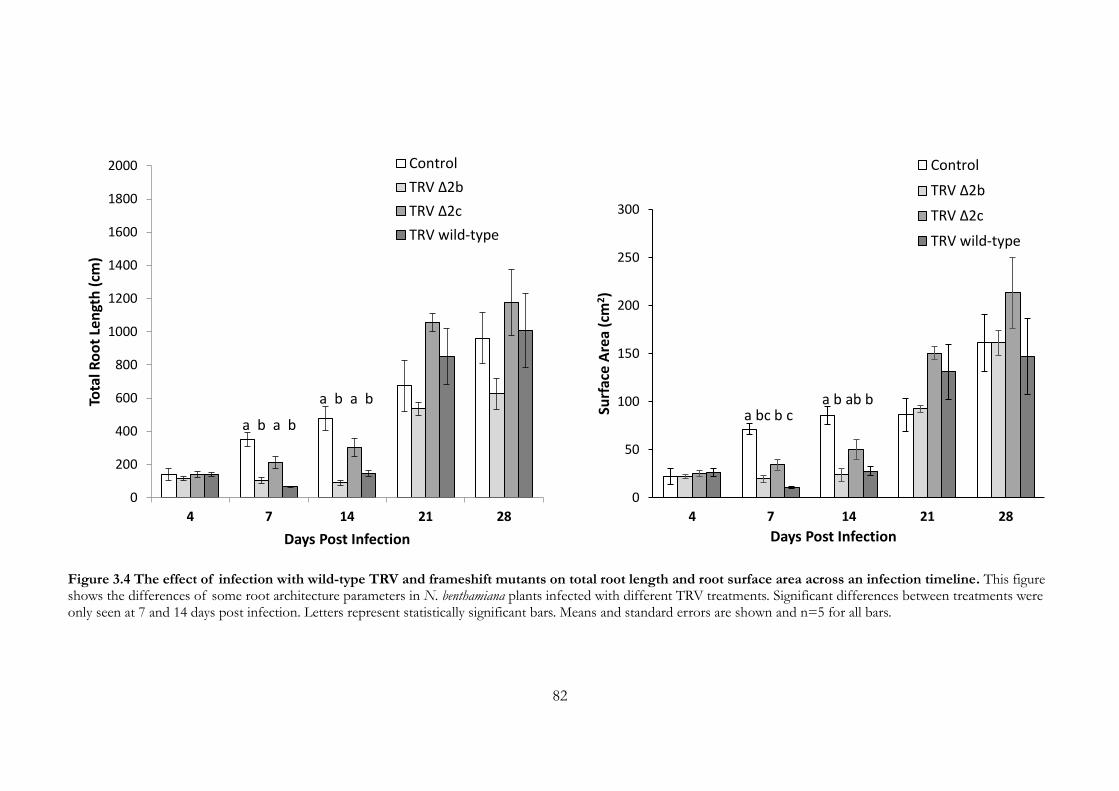
82
0
200
400
600
800
1000
1200
1400
1600
1800
2000
4 7 14 21 28
Tota
l Ro
ot
Len
gth
(cm
)
Days Post Infection
Control
TRV Δ2b
TRV Δ2c
TRV wild-type
0
50
100
150
200
250
300
4 7 14 21 28
Surf
ace
Are
a (c
m2)
Days Post Infection
Control
TRV Δ2b
TRV Δ2c
TRV wild-type
Figure 3.4 The effect of infection with wild-type TRV and frameshift mutants on total root length and root surface area across an infection timeline. This figure shows the differences of some root architecture parameters in N. benthamiana plants infected with different TRV treatments. Significant differences between treatments were only seen at 7 and 14 days post infection. Letters represent statistically significant bars. Means and standard errors are shown and n=5 for all bars.
a b a b
a b a b a bc b c
a b ab b
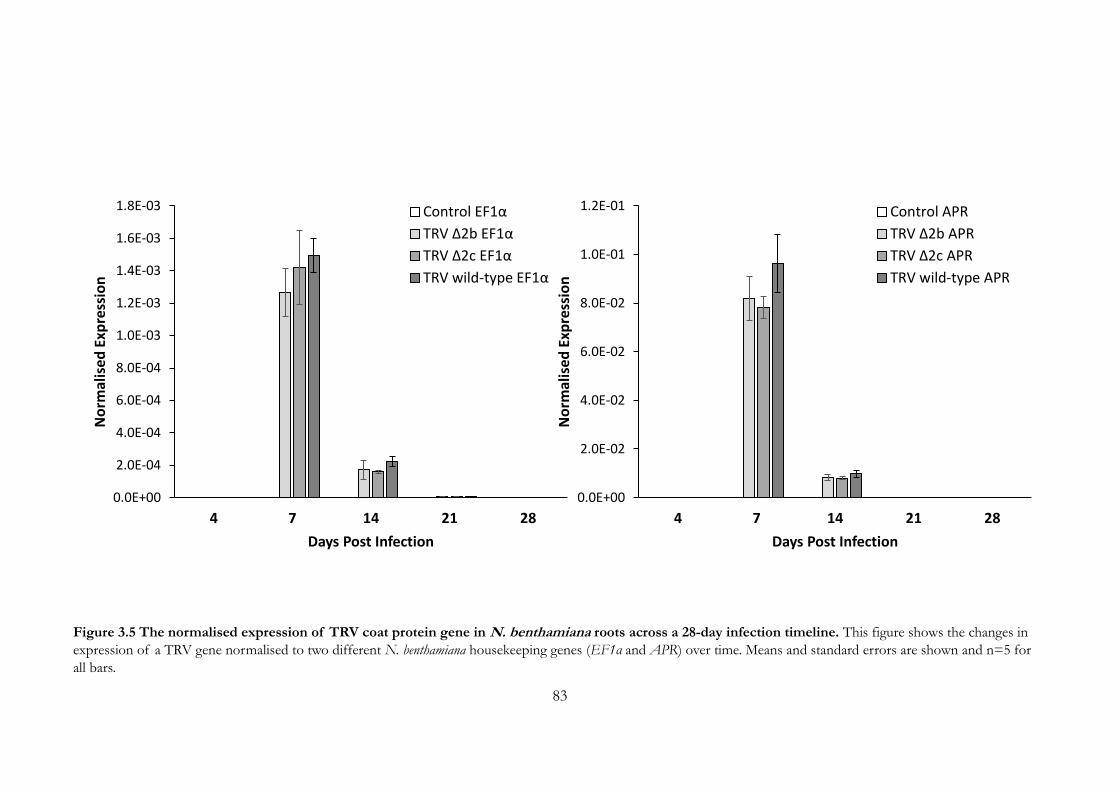
83
0.0E+00
2.0E-04
4.0E-04
6.0E-04
8.0E-04
1.0E-03
1.2E-03
1.4E-03
1.6E-03
1.8E-03
4 7 14 21 28
No
rmal
ise
d E
xpre
ssio
n
Days Post Infection
Control EF1α
TRV Δ2b EF1α
TRV Δ2c EF1α
TRV wild-type EF1α
0.0E+00
2.0E-02
4.0E-02
6.0E-02
8.0E-02
1.0E-01
1.2E-01
4 7 14 21 28
No
rmal
ised
Exp
ress
ion
Days Post Infection
Control APR
TRV Δ2b APR
TRV Δ2c APR
TRV wild-type APR
Figure 3.5 The normalised expression of TRV coat protein gene in N. benthamiana roots across a 28-day infection timeline. This figure shows the changes in
expression of a TRV gene normalised to two different N. benthamiana housekeeping genes (EF1α and APR) over time. Means and standard errors are shown and n=5 for
all bars.

84
Root VOC sampling
Of the root volatiles found in the previous investigation (Chapter 2), only 2-
ethyl-1-hexanol and 1,3-ditertubutylbenzene were detected in this experiment. Both 2-
ethyl-1-hexanol and 1,3-ditertubutylbenzene showed similar trends to before, with
significant differences (Figure 3.6) in volatile production between control, mutant TRV
and wild-type TRV-infected plants (F(3,17)=5.02, p<0.05 for 2-ethyl-1-hexanol and
F(3,17)=3.25, p<0.05 for 1,3-ditertubutylbenzene). Wild-type TRV-infected plants
produced significantly more 2-ethyl-1-hexanol (p<0.01 compared to control and TRV-
Δ2b, and p<0.05 compared to TRV-Δ2c) and 1,3-ditertubutylbenzene (p<0.05 for all,
only at 60 mins timepoint) than other treatments (Figure 3.6). For all treatments, there
seemed to be an increase in flux rate for both compounds between the 20 and 60
minutes timepoints (data not shown), but post hoc tests showed this was only
significant for TRV wild-type 2-ethyl-1-hexanol (p<0.001) and 1,3-ditertubutylbenzene
(p<0.05) and TRV-Δ2c 2-ethyl-1-hexanol (p<0.05).
Figure 3.6 Average root VOC fluxes from roots of plants infected with different TRV
treatments, showing the effects of 2b and 2c. Data is only shown from 60 minutes after
plants were placed in the headspace sampler as the previous timepoint (20 minutes) showed
little significant differences between treatments. The fluxes are shown at two scales and are µg
min-1 g-1 root dry weight. In comparisons between treatments for the same compound, bars
with different letters are statistically different from each other, error bars are standard error,
n=5 for all treatments.
-2.5E-02
0.0E+00
2.5E-02
5.0E-02
7.5E-02
1.0E-01
1.3E-01
1.5E-01
2-ethyl-1-hexanol 1,3-ditertbutylbenzene
VO
C F
lux
(µg/
min
/g r
oo
t d
ry
wei
ght)
Control 60
TRV Δ2b 60
TRV Δ2c 60
TRV wild-type 60
a a a b
a a a b

85
There was no significant difference in viral load across the three infection
treatments. Normalised viral load explained nearly all of the observed variance in 2-ethyl-
1-hexanol emissions for wild-type infected plants (Figure 3.7 top; r2=0.99, p<0.001) and
some of the variance for TRV-Δ2b infected plants (Figure 3.7top; r2=0.94, p<0.01).
Figure 3.7 The relationship of 2-ethyl-1-hexanol (top) and 1,3-ditertbutylbenzene
(bottom) fluxes with viral load. Comparison of root volatile emissions from plants infected
with wild-type TRV and mutant TRV with altered 2c genes. With relative viral load normalised
to two N. benthamiana housekeeping genes, APR and EF1α. Lines of best fit are for wild-type
infected plants.
-2.0E-02
-1.0E-02
0.0E+00
1.0E-02
2.0E-02
3.0E-02
4.0E-02
0.5 0.6 0.7 0.8 0.9 1
dit
ertb
uty
lben
zen
e fl
ux
(µg/
min
/g r
oo
t d
ry w
eig
ht)
Relative normalised TRV coat protein gene expression
TRV wild-type APR TRV Δ2c APR TRV Δ2b APR
-5.0E-02
0.0E+00
5.0E-02
1.0E-01
1.5E-01
2.0E-01
0.5 0.6 0.7 0.8 0.9 1
2-e
thyl
-1-h
exan
ol f
lux
(µg/
min
/g r
oo
t d
ry w
eigh
t)
Relative normalised TRV coat protein gene expression
TRV wild-type APR TRV Δ2c APR TRV Δ2b APR
86
There was no significant relationship between viral load and 2-ethyl-1-hexanol
production and in TRV-Δ2c infected plants (Figure 3.7 top; r2=0.54, p=0.16) and no
significant relationships between viral load and 1,3-ditertbutylbenzene production in any
of the treatments (Figure 3.7 bottom: wild-type- r2=0.26, p=0.39, Δ2b- r2=0.01, p=0.86,
Δ2c- r2=0.15, p=0.51).
Trichodorid response
Building on the preference tests in Chapter 2, trichodorid preference was tested
in a factorial design with wild-type TRV-infected plants, TRV-Δ2b infected plants and
Agrobacterium control-infected plants (Figure 3.8). The control vs wild-type comparison
is reprinted from Chapter 2 for visual comparison. Trichodorids preferred wild-type
infected plants to plants infected with the Δ2b mutant (GLM-p χ22, 21=55.89, p<0.001,
post hoc p<0.05), but while the model showed a significant difference in the
distribution of nematodes between the central pot and two arms, (GLM-p χ22, 21=41.2,
p<0.001), Tukey HSD post hoc tests showed there was no significant difference in
preference between Agrobacterium control plants and Δ2b mutant-infected plants
(p=0.36).
Across these assays, the average recapture rate was 61.75% ±2.53, with an
average of 46% of recaptured nematodes responding to a treatment.

87
Figure 3.8 The preference of trichodorid nematodes given a choice between plants
infected with different TRV treatments. This figure shows the number of trichodorids that
moved down an olfactometer arm towards N. benthamiana plants infected with either wild type,
TRV-Δ2b or control Agrobacterium (uninfected). 3.8a shows the olfactometer setup including
central release of trichodorids. Pie charts show % of recaptured nematodes that responded to
treatments. Means and standard errors are shown and n=11 for 3.8b, n=8 for 3.8c and d. 3.8b
contains data presented in Chapter 2 (Figure 2.11). ns p>0.05 * p<0.05, *** p<0.001.
-10 -5 0 5 10
Number of nematodes collected
***
TRV wild-type Uninfected
TRV wild-type TRVΔ2b
-10 -5 0 5 10
Number of nematodes collected
*
Uninfected TRVΔ2b
-10 -5 0 5 10
Number of nematodes collected
ns
a
b
c
d
4357
Responded
Central Pot
4555
Responded
Central Pot
4753
Responded
Central Pot
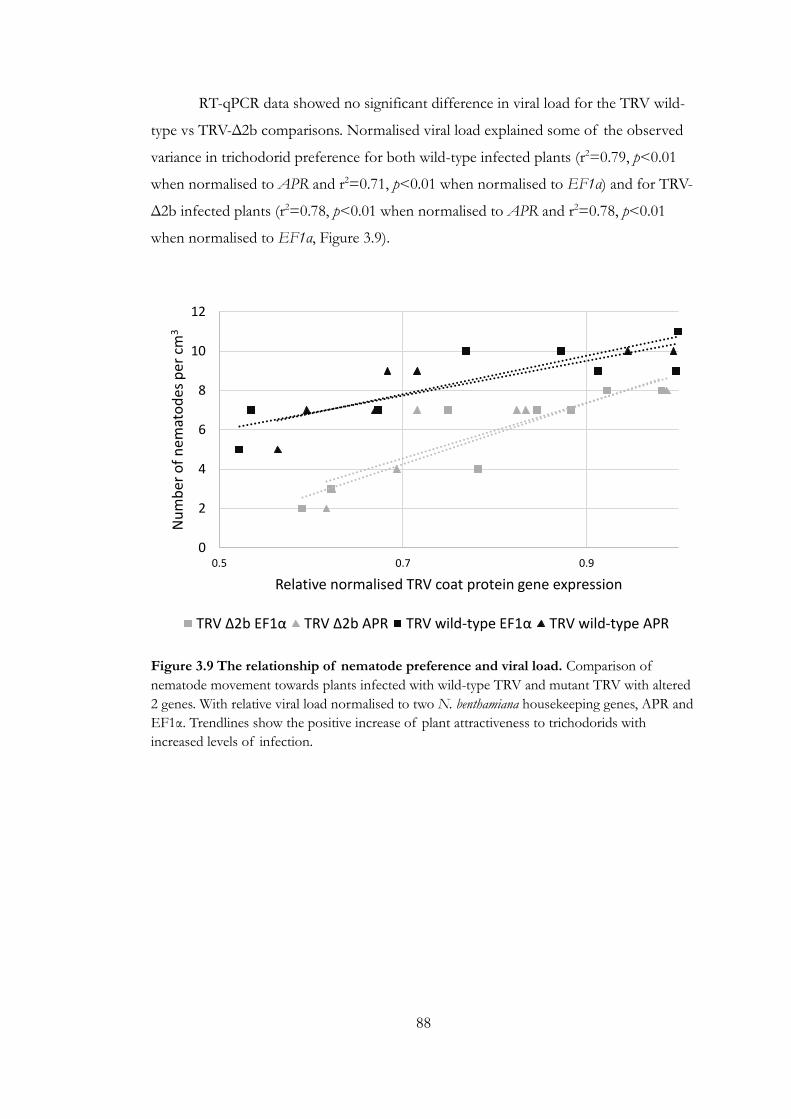
88
RT-qPCR data showed no significant difference in viral load for the TRV wild-
type vs TRV-Δ2b comparisons. Normalised viral load explained some of the observed
variance in trichodorid preference for both wild-type infected plants (r2=0.79, p<0.01
when normalised to APR and r2=0.71, p<0.01 when normalised to EF1α) and for TRV-
Δ2b infected plants (r2=0.78, p<0.01 when normalised to APR and r2=0.78, p<0.01
when normalised to EF1α, Figure 3.9).
Figure 3.9 The relationship of nematode preference and viral load. Comparison of
nematode movement towards plants infected with wild-type TRV and mutant TRV with altered
2 genes. With relative viral load normalised to two N. benthamiana housekeeping genes, APR and
EF1α. Trendlines show the positive increase of plant attractiveness to trichodorids with
increased levels of infection.
0
2
4
6
8
10
12
0.5 0.7 0.9
Nu
mb
er o
f n
emat
od
es p
er c
m3
Relative normalised TRV coat protein gene expression
TRV Δ2b EF1α TRV Δ2b APR TRV wild-type EF1α TRV wild-type APR
89
Discussion
For all infection treatments, where deleterious effects of infection were found
for plant biomass and root growth, these were found at 7- and 14-days post infection.
There was strong evidence of recovery in N. benthamiana roots and shoots after 21 dpi
in plant biomass and the root architecture parameters studied. Viral activity in the roots
peaked at 7 dpi, and the predicted lag between viral load and symptoms appears to be
on the order of 7 days, since by 21 days post-viral load had declined to negligible levels..
This ties in to what has been established in the literature for TRV infection in N.
benthamiana, with peak infection in the roots 6-8 dpi (Fernández-Calvino et al. 2014,
Shaw et al. 2014, Valentine et al. 2004) and recovery from 18 dpi (Ratcliff et al. 1997,
1999, Shaw et al. 2014). In these cases, viral replication was still maintained and
detectable, although at a much lower level than at peak infection. This difference may be
due to these examples using leaf samples, compared to the root samples used in this
investigation. The lag between peak infection and progression of symptoms in leaves is
like that seen in roots in this investigation, both for TRV and other plant viruses, even
if it occurs sooner (Bubici et al. 2015, Rimbaud et al. 2015, Valentine et al. 2004).
The reduction of viral accumulation over an infection timeline was initially
linked to RNA silencing (Ma et al. 2015, Ratcliff et al. 1999), but it has been suggested
that the nucleolus (Hiscox 2007, Greco 2009, Kalinina et al. 2018, Taliansky et al. 2010)
and Cajal bodies (Love et al. 2017, Shaw et al. 2019) which are sub-nuclear structures
contained in the nucleus have roles in responses to viral infection. Coilin, a protein
produced by Cajal bodies, has been implicated for recovery from infection and
suppressing host infection for TRV infections in N. benthamiana specifically (Shaw et al.
2014). N. benthamiana plants where coilin production had been knocked down (KD
plants) did not recover from infection, and the leaves continued exhibiting severe
systemic symptoms e.g. curling leaf malformation and necrosis (Shaw et al. 2014). Coilin
seems to respond to TRV infection by recognising the protein products of TRV
cysteine-rich 16K gene present on RNA-1 (Fernández-Calvino et al. 2016) and activating
salicylic-dependant defence pathways (Shaw et al. 2019).
Differences were seen in the severity of infection symptoms with different
mutant infection treatments. Plants infected with wild-type TRV and TRV-Δ2b always
displayed the most severe stunting of root growth compared to shoot growth and
reduction in root length and root surface area. Plants infected with TRV-Δ2c showed an

90
intermediate response and Agrobacterium control-infected plants were the least affected.
This suggests that there is quite a large cost to the plant when 2c is present, since
making it non-functional seemed to reduce the magnitude of several symptoms.
Removing functional 2b (TRV-Δ2b) does not appear to have a substantial fitness cost
from infection when compared to wild-type plants.
Comparing trends in root architecture between 4 and 14 dpi between the
experiments described in Chapter 2 and Chapter 3 throws up some differences in
certain root growth responses. Root dry weight in particular, which then affects the root
to total plant root weight. This could be of concern, especially for the Agrobacterium
controls, for the reproducibility of the investigations and conclusions that may be
drawn on the effects of TRV infection on root parameters. However, the main driver of
this difference was that root weight did not significantly increase for all treatments in
this second experiment, presented in Chapter 3. This suggests that all plants in this
investigation were impacted equally by this effect, which may be external in nature. A
wide variety of external factors can impact root growth (Walter et al. 2009) including
growth conditions. Unfortunately, between the two investigations, certain external
parameters were changed. Firstly, the seeds used were from different batches, and the
conditions and environment of the parent plants may have been different, which could
have affected the growth rates of the seedlings (Elwell et al. 2011). Secondly, the growth
room used was changed, and while the temperature the rooms were set to and the
day/night cycle were unchanged, there may have been differences in humidity or the
light the plants were exposed to, both in terms of wavelengths and intensity, which
could also have impacted root growth rates (Johkan et al. 2010). With these extra factors,
it is challenging to draw meaningful conclusions about differences between the two
investigations. The key finding then, is that infected plants responded differently to
control plants across an infection timeline in both, showing that TRV infection has an
impact on root growth.
TRV constructs with the 2b gene present have been found to move and infect
leaves and root meristem more efficiently than those without (Valentine et al. 2004) and
the 2b protein produced may antagonise host defences (MacFarlane 2010). It has been
suggested that 2b protein interacts with the TRV coat protein (Holeva and MacFarlane
2006) in order to form a bridge between the virus particle and the nematode feeding
apparatus (Velios et al. 2002), but this effect seems not to come at too high a cost to the
91
plant host. It is hard to pinpoint the role of 2c, as previously mentioned. Different
RNA-2 isolates are very variable in the genes present and the 2c genes may have
different functions in different isolates of TRV. In TRV-PpK20, 2c is not essential for
nematode transmission (Hernández et al. 1996, MacFarlane et al. 1996, Schmitt et al.
1998, Vassilikos et al. 2001). When both 2b and 2c were removed from TRV-PpK20 and
it was inoculated into two different potato cultivars, atypical extreme and hypersensitive-
like resistance were observed (Ghazala and Varrelmann 2007).
Plants were sampled for root VOCs 30 and 60 minutes after being placed in the
sampling chamber; the results from both timepoints showed similar trends, with
differences more marked at 60 minutes. This may be because plants left in the chamber
for an extended time suffered abiotic stress on the plant roots (Salerno et al. 2017,
Timmusk et al. 2014, Vives-Peris et al. 2017), which led to an interaction between
infection and stress, causing greater emissions of stress-related compounds. There were
significant differences in 2-ethyl-1-hexanol production between plants infected with
wild-type TRV and the two mutant treatments, with both types of mutant-infected
plants having significantly lower production of 2-ethyl-1-hexanol than wild-type
infected plants and no difference compared to control plants. This pattern was
replicated for 1,3-ditertbutylbenzene, but not for the other two compounds previously
identified; 2,6-ditertbutylquinone and 2,4-ditertbutylphenol.
The products of 2b and 2c are relatively simple proteins and the function of the
2b protein appears to be well understood (MacFarlane 2010). Combined with
statistically similar reductions in production of both VOCs for both mutant treatments
compared to wild-type infected plants, it is unlikely that the gene products of 2b and 2c
are directly responsible for VOC production. It is currently not possible to confirm if
this is the case, but they do influence VOC fluxes. It is more likely that either i) VOC
emissions are elevated as a by-product of the plants being under infection stress, or ii)
the gene products are modifying existing plant metabolism to generate compounds of
interest, neither of which is contradicted by the increase in production seen with
increase of viral activity. It is reasonable to suggest that as viral load increases, overall
stress on the plants is increased, which can lead to overproduction of 2-ethyl-1-hexanol
particularly. If it is a stress response, it may have been expected that production would
mirror the differences between treatments seen in the root architecture and biomass
investigations, with Δ2b mutant infections showing similar VOC production to wild-

92
type and Δ2c mutant infections staying like control plants. There was only one
timepoint (7 dpi) for VOC analysis, so in order to confirm that this is the relationship
that is seen across the infection timeline, it may be helpful to also sample plants at
multiple points between 6 and 14 dpi. In this investigation, only one timepoint was
selected due to constraints with equipment and the length of analysis of samples
coupled with the 2-week shelf life of the samples in the canisters before degradation
(Low et al. 2003).
Trichodorid preference trials built on the work in the previous chapter that
demonstrated that wild-type TRV-infected plants were more attractive than
Agrobacterium infected controls by showing that Δ2b infected plants are of an
intermediate attractiveness compared to wild-type and control infected plants. This
suggests that the root VOCs found may have an attractant effect on trichodorids, as
they were elevated in wild-type infected plants, but that they cannot explain all of the
differences between treatments, otherwise there would not have been any difference in
attractiveness between Δ2b infected plants and controls. This may be due to some
further unidentified compounds that are produced by plant roots; potentially some
semi-volatiles that were not picked up with the sampling method. It is well documented
that differences in volatile and semi-volatile sampling preparation methods and final
determination method can affect what compounds are detected, and also the ratio of
compounds (Agelopoulos and Pickett 1998, Met and Yeşilçubuk 2017, Sghaier et al.
2016, Soria et al. 2015), with certain compounds only detected in one sampling method
(Met and Yeşilçubuk 2017). Between the root VOC investigations in the previous
chapter and the ones described here, other methods of volatile and semi-volatile
extraction were trialled for this system including frozen root extraction (Rasmann et al.
2005), adsorbent packed columns in a dynamic headspace (Trujillo-Rodríguez et al.
2017) and desorption of semi-volatiles from growth media using dichloromethane as a
solvent. There were problems of sensitivity associated with all these techniques and
they did not lead to the identification of any novel compounds.
It will be important to test 2-ethyl-1-hexanol and 1,3-ditertbutylbenzene on
trichodorids to see if hypothesised attractant effects can be demonstrated. As the
emission of 2-ethyl-1-hexanol from plant roots was nearly 10x greater than that of 1,3-
ditertbutylbenzene, and numbers of trichodorids available for testing is limited due to
difficulties of culturing trichodorids (Neilson pers. comms.), 2-ethyl-1-hexanol will be

93
tested in preference. The comparison of the attractiveness of Δ2c infected plants
compared to Δ2b and controls on trichodorids would also be informative; as both Δ2b
and Δ2c infection showed control-like emissions of the potential attractants but Δ2b-
infected plants were still more attractive than controls, any differences in attractiveness
with Δ2c may help to understand what this difference may be based on. It may also be
interesting to compare attractiveness of infection of wild-type TRV of isolates where
2c is also non-essential for nematode transmission, but the structure of RNA-2 is very
different (e.g. PaY4). If attractiveness of infected plants is due to by-products of
infection stress making plants more visible to nematodes, rather than a coupled virus–
vector relationship, then it may be that similar volatiles are produced by other potato
viruses not transmitted by nematodes e.g. Potato virus X (no vector), or viruses with
different soil borne vectors: Potato mop-top virus (cercozoan), Tobacco necrosis virus
(fungi), or nematode-spread nepoviruses (Hewitt et al. 1958, Lister 1964, Smith 1946).
This work has further demonstrated the severe belowground effects of TRV
infection on plants but has shown that these effects are transient in line with recovery
times described in the literature and provided more evidence that two root VOCs, 2-
ethyl-1-hexanol and 1,3-ditertbutylbenzene are produced as a result of wild-type
infection and that production increases as viral load increases. It suggests that infection
severity decreases when RNA-2 genes 2b (volatile emissions) and 2c (infection
symptoms and volatile emissions) are not present, and that absence of 2b makes TRV-
infected plants less attractive to trichodorid vectors. This is important information in
trying to understand the relationship between TRV infection and transmission rates.

94
Chapter 4
Introduction
It has been demonstrated that N. benthamiana plants are more attractive to
trichodorid nematodes with increasing viral activity, especially for wild-type infections
(Chapter 2), but this positive relationship is also seen in plants infected with TRV-Δ2b
mutants (Chapter 3). In TRV wild-type plants, increasing viral load also correlates with
increased 2-ethyl-1-hexanol production from roots, which is not seen for control or
TRV mutant-infected plants.
As discussed, 2-ethyl-1-hexanol is a widespread phytochemical and is produced
in varied plant species and from different parts of those plants. It is commonly a green
leaf volatile, from trees to grasses such as maize and wheat, chickpea, lima beans and
aquatic ferns (Cruz et al. 2012, Khedive et al. 2017, Pereira et al. 2009, Solé et al. 2010, Yi
et al. 2009). In some of these cases, it may be emitted as a response to biotic stress and
attack from different sources. 2-ethyl-1-hexanol is also released from flowers of plants,
where seems to have a role in attracting honeybee (Rering et al. 2018) and bumblebee
(Schaeffer et al. 2019) pollinators, along with other volatile compounds, and production
is elevated when nectar-inhabiting microorganisms are present, particularly yeasts
(Rering et al. 2018, Schaeffer et al. 2019). It has been suggested that yeast species
produce 2-ethyl-1-hexanol and other volatile compounds to inhibit growth of other
microbes in the nectar (Sobhy et al. 2018).
Most relevant to this investigation, 2-ethyl-1-hexanol has been shown to be
produced by plant roots in chickpea (Bazghaleh et al. 2016) and potato tubers (de Lacy
Costello et al. 2001). In both of those cases, it was produced as a response to fungal
attack.
Nematodes have been shown to be attracted to a wide range of different
belowground compounds, as previously discussed in Chapter 1. Functionally different
nematodes (plant-feeding, plant-associated, fungal hyphae-feeding, bacterial-feeding,
unicellular eukaryote-feeding, animal-parasitic and omnivorous) can be attracted by the
same phytochemical (reviewed in Rasmann et al. 2012), with CO2 being the most
common across different phylogenies and functional groups (Gaugler et al. 1980,
Johnson and Nielsen 2012, McCallum and Dusenbery 1992, O’Halloran and Burnell
2003, Pline and Dusenbery 1987, Robinson 1995). Some compounds act to attract

95
multiple organisms with the same signal; for instance, sesquiterpenes released by Citrus
spp. trees as a response to herbivore attack are attractive to both plant parasitic
nematodes (Tylenchus) and entomopathogenic predators of the herbivore (Ali et al.
2011). Although nematode and plant interactions involving phytochemicals continue to
be actively researched, the work primarily focuses on entomopathogenic nematodes
(EPNs) (Andaló et al. 2017, Kergunteuil et al. 2018, 2019, 2020, Mondal et al. 2019) and
endoparasitic plant nematodes (Borges 2018, Čepulytė et al. 2018, Khaki et al. 2017,
Neupane et al. 2019, Oota et al. 2019, Yousuf et al. 2018). Trichodorids are free-living
plant parasites and belong to an entirely different clade of nematodes: Enoplia. No
current information exists on what their potential chemoattractants may be. It is likely
that they would respond to CO2 and some terpenes, as responses to these seem to be
conserved across phylogenies, possibly as a result of convergent evolution (Rasmann et
al. 2012).
2-ethyl-1-hexanol is a branched 8-carbon alcohol. Work on EPNs from different
clades has shown positive responses to a variety of alcohols, including plant-derived
alcohols (Hallem et al. 2011, O’Halloran and Burnell 2003) such as 1-hexanol. All plant-
derived alcohols are fatty acid derivatives; one pathway includes those formed from
linolenic acid, a C18 unsaturated fatty acid (Figure 4.1, Dudareva et al. 2013). These
precursors are oxygenated to form two intermediates (Figure 4.1) (Feussner and
Wasternack, 2002) and these intermediates are further reduced by alcohol
dehydrogenases (Gigot et al. 2010). 2-ethyl-hexanol could be a modification of 1-
hexanol synthesised through this pathway. Alcohols are often esterified (D’Auria et al.
2007), or further modified; for instance, methyl jasmonate is produced from one
intermediate via the allene oxide synthase branch, separate to these reductions via
alcohol dehydrogenase (Song et al. 2005). Many of these alcohols and modified
compounds are classified as defensive green leaf volatiles and are released from plants
as a response to wounding. These compounds form an important class of
phytochemicals involved in multi-trophic interactions (e.g. Engelberth 2020, Joo et al.
2019, McMenemy et al. 2012, Michereff et al. 2019), and as cues for herbivores to find
targets (e.g. Ahmed et al. 2019, Karmakar et al. 2018, McArthur et al. 2019).

96
Figure 4.1 Synthesis of fatty-acid derived volatiles in plants. (From Dudareva et al. 2013) Showing the different paths that linoleic and linolenic acid precursors form methyl jasmonate via jasmonic acid (JA) and other volatiles via the “lipoxygenase (LOX) pathway” including hexanol, a probable precursor to 2-ethyl-1-hexanol.
Most nematodes studied respond to multiple different compounds including
CO2 (as reviewed in Rasmann et al. 2012). If 2-ethyl-1-hexanol is a chemoattractant to
trichodorids, it is likely to be part of a panoply of chemical cues that the nematodes
exploit in order to locate suitable plants, including 1,3-ditertbutylbenzene (Chapter 3).
The testing of potential chemoattractants using olfactometers is common
within the context of plant-mediated multitrophic interactions, both on herbivores
(Arif et al. 2020, Dada et al. 2020, Dardouri et al. 2019, Markheiser et al. 2020, Mitra et al.
2020) and natural enemies of those herbivores, either predators or parasitoids recruited
by phytochemicals (Cai et al. 2020, Colazza et al. 2004, De Boer and Dicke 2004, De
Boer et al. 2004). Nearly all studies using olfactometers have studied systems of
aboveground herbivorous arthropods, such as aphids, caterpillars, mites, and beetles
(Cai et al. 2020, Dardouri et al. 2019, De Boer et al. 2004, Mitra et al. 2020, Vuorinen et al.
2004). These studies generally used Y tube olfactometers, where individuals are placed
at the bottom end of a branched olfactometer and given two options, either i) the
compound of interest or sample of interest or ii) a relevant control. Attractiveness is
quantified by the percentage of individuals moving towards the attractant and

97
compared to those moving towards the control (Vuorinen et al. 2004, Dicke et al. 1990).
Y tube olfactometers limit the options to a binary choice, and for this reason, multiple-
armed olfactometers have been developed in order to allow for fully factorial
experimental designs (Turlings et al. 2004).
Studies carried out on belowground systems pose unique challenges. Due to the
need for a soil or soil-like substrate, the organisms tested cannot be readily observed. In
order to address this issue, the studied organisms are allowed to move towards the
attractant but are stopped from reaching it by an impenetrable mesh (Ali et al. 2010,
Hiltpold et al. 2011, Rasmann and Turlings 2008, Rasmann et al. 2005, Rivera et al. 2017,
Willett et al. 2017) and are extracted from the substrate at that point. Inevitably, some
organisms are not recovered and in larger multi-armed olfactometer studies it is not
feasible to perform extraction on the entire substrate (Ali et al. 2010). For studies
utilizing easily culturable organisms, such as EPNs, this is less of an issue, as thousands
(Ali et al. 2010, Oliveira-Hofman et al. 2019, Rasmann et al. 2005, Rivera et al. 2017,
Tourtois et al. 2017) can be released. However, for organisms that are unculturable and
require specialist harvesting from natural field samples, it can be a limiting factor, as in
this investigation. Additionally, trichodorid nematodes are much slower than EPNs, so
the length of the arms used in these investigations (Figure 4.2) were adjusted from
designs in the literature based on EPN movement rates (Ali et al. 2010, Rasmann et al.
2005. Willett et al. 2017).
These olfactometer experiments aim to explore the role of 2-ethyl-1-hexanol, as
a primary chemical signal, on trichodorid behaviour. I hypothesise that it is an attractant
to trichodorid nematodes, as is suggested by previous work presented in this thesis. It
has been demonstrated that N. benthamiana plants infected with wild-type TRV produce
significantly more 2-ethyl-1-hexanol than control plants or plants infected with TRV
mutants with altered RNA-2 genes, and that trichodorids preferentially move towards
wild-type infected plants over control or Δ2b mutant-infected plants. The two
experiments presented here explore the mechanism of this preference through the
analysis of nematode preference for 2-ethyl-1-hexanol in olfactometer tests and
whether the addition of 2-ethyl-1-hexanol overcomes the reduced attraction previously
seen in TRV-Δ2b mutant infections compared to wild-type infection. In the first
olfactometer test, trichodorids will be given a choice between Agrobacterium-infected
(non-viral) controls with and without the addition of 2-ethyl-1-hexanol. In the second,
98
plants infected with TRV-Δ2b mutants with added 2-ethyl-1-hexanol will be compared
to plants infected with wild-type TRV.
• In the first test, the choice of Agrobacterium control plants + 2-ethyl-1-
hexanol vs Agrobacterium control plants, it is expected that trichodorids
will significantly move towards the plants with added 2-ethyl-1-hexanol,
as it is expected that 2-ethyl-1-hexanol is acting as a foraging cue.
• In the second test it is hypothesised that there will be no significant
difference in preference between wild-type infected plants and TRV-Δ2b
infected plants with added 2-ethyl-1-hexanol, as the additional presence
of the dominant foraging cue, 2-ethyl-1-hexanol, will raise the profile of
the mutant infected plant to be as attractive as the wild-type infected
plant that is naturally releasing 2-ethyl-1-hexanol.
• I further hypothesise that, as in previous investigations, there will be a
positive relationship between TRV infection levels and nematode
movement, where tested plants are infected with TRV.

99
Methods
Plant growth and infection
Plants were prepared as in previous olfactometer tests (see Chapters 2 and 3)
and planted directly into the olfactometer pots once two true leaves had expanded.
Plants for “control vs control + 2-ethyl-1-hexanol” trials were infected with
untransformed Agrobacterium. Plants used for “TRV wild-type vs TRV-Δ2b + 2-ethyl-1-
hexanol” were infected with Agrobacterium transformed with unmodified TRV (“wild
type”) and with unmodified TRV RNA-1 and altered TRV RNA-2 with non-functional
2b gene (TRV-Δ2b). Infection solutions were prepared as previously described
(Chapters 2 and 3) and plants were inoculated 7 days after being planted into the
olfactometers.
Shoot and root fresh weight was recorded and <100mg samples of root tissue
were flash frozen for RNA extraction and quantification of infection through RT-qPCR
(see Chapters 2 and 3). The remaining plant material was dried at 70ºC for 3 days before
dry weights were recorded.
Trichodorid responses
In order to test the effects of 2-ethyl-1-hexanol on trichodorids, an amended
olfactometer design was used (Figure 4.2). This allowed liquid 2-ethyl-1-hexanol to be
added to the root system of one of the plants, close to the arm leading to the central
pot. The added 2-ethyl-1-hexanol could then reach equilibrium with the vapour phase
and diffuse via the gaseous phase of the sand matrix.
Figure 4.2 Amended olfactometer design for 2-ethyl-1-hexanol trials. Glass capillary tubes were inserted to the rooting depth with the N. benthamiana seedlings as they were transplanted. The tubes were capped with parafilm to prevent volatile compounds escaping the test environment through the capillary. Capillaries were added to both sides to mitigate any effect the presence of the capillaries may have had on volatile emissions. Olfactometer pots were constructed as previously described.

100
The trial was run for 48 hours after 50 nematodes were added to the central pot.
Estimates of 2-ethyl-hexanol released from N. benthamiana plants at 7 dpi were
calculated as being 31-67 µg per plant over 48 hours. This was based on an average flux
of 0.18 µg min-1 g root dry weight-1 (Figure 3.6) for wild-type TRV-infected plants, and
root dry weights ranging from 0.06-0.13g for plants used in VOC analysis (Chapter 3,
data not shown). Based on the density of liquid 2-ethyl-1-hexanol standard (Sigma-
Aldrich, 833 kg m-3), 37-81µl of standard would be added for similar production to
wild-type infected plants.
Doses of 2-ethyl-1-hexanol were calculated so that over the run, double the
upper bound of this estimate was added to improve the likelihood of detection, in line
with other work (Rasmann et al. 2005), and 160µl were added over the run. 16µl of
standard were added to one pot via the capillary at 0, 4, 24 and 28 hrs and 48µl were
added at 8 and 32hrs after the start of the trial to allow for sufficient overnight soil
concentrations. The nematodes from the central pot and the two arms leading to the
planted pots were extracted from the sand by Baermann funnel, collected after 48 hours
in the funnels (see Chapters 2 and 3) and counted under a dissecting microscope.
There were two sets of trials: a comparison between the attractiveness of
control plants with added 2-ethyl-1-hexanol to other control plants and a second that
compared plants infected with TRV-Δ2b with added 2-ethyl-1-hexanol to plants
infected with wild-type TRV. As in Chapter 3, each trial was run twice, with 4 replicates
per trial. Trichodorid count data were analysed using a generalised linear model with
Poisson distribution as previously explained in Chapter 2 and 3 methods. For both
models, AIC was better with only pot as an independent factor, so sampling run was
removed from the model
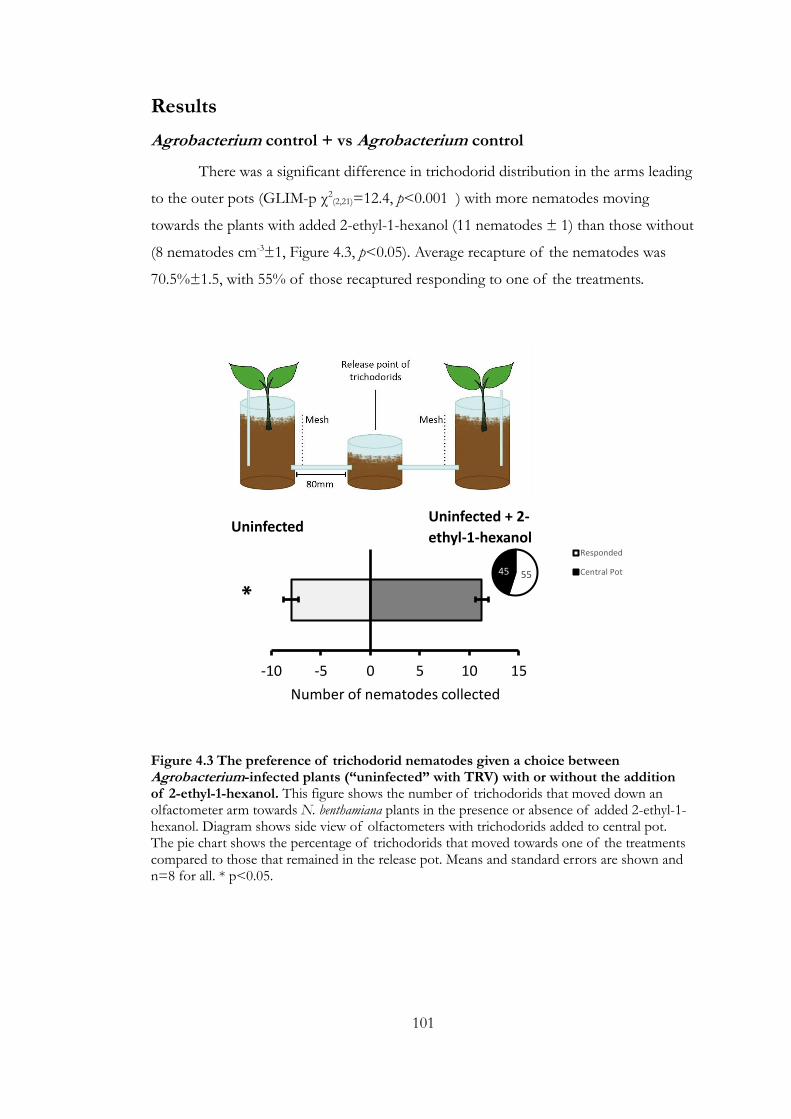
101
Results
Agrobacterium control + vs Agrobacterium control
There was a significant difference in trichodorid distribution in the arms leading
to the outer pots (GLIM-p χ2(2,21)=12.4, p<0.001 ) with more nematodes moving
towards the plants with added 2-ethyl-1-hexanol (11 nematodes ± 1) than those without
(8 nematodes cm-3±1, Figure 4.3, p<0.05). Average recapture of the nematodes was
70.5%±1.5, with 55% of those recaptured responding to one of the treatments.
Figure 4.3 The preference of trichodorid nematodes given a choice between Agrobacterium-infected plants (“uninfected” with TRV) with or without the addition of 2-ethyl-1-hexanol. This figure shows the number of trichodorids that moved down an olfactometer arm towards N. benthamiana plants in the presence or absence of added 2-ethyl-1-hexanol. Diagram shows side view of olfactometers with trichodorids added to central pot. The pie chart shows the percentage of trichodorids that moved towards one of the treatments compared to those that remained in the release pot. Means and standard errors are shown and n=8 for all. * p<0.05.
-10 -5 0 5 10 15
Number of nematodes collected
* Uninfected
Uninfected + 2-
ethyl-1-hexanol
5545
Responded
Central Pot
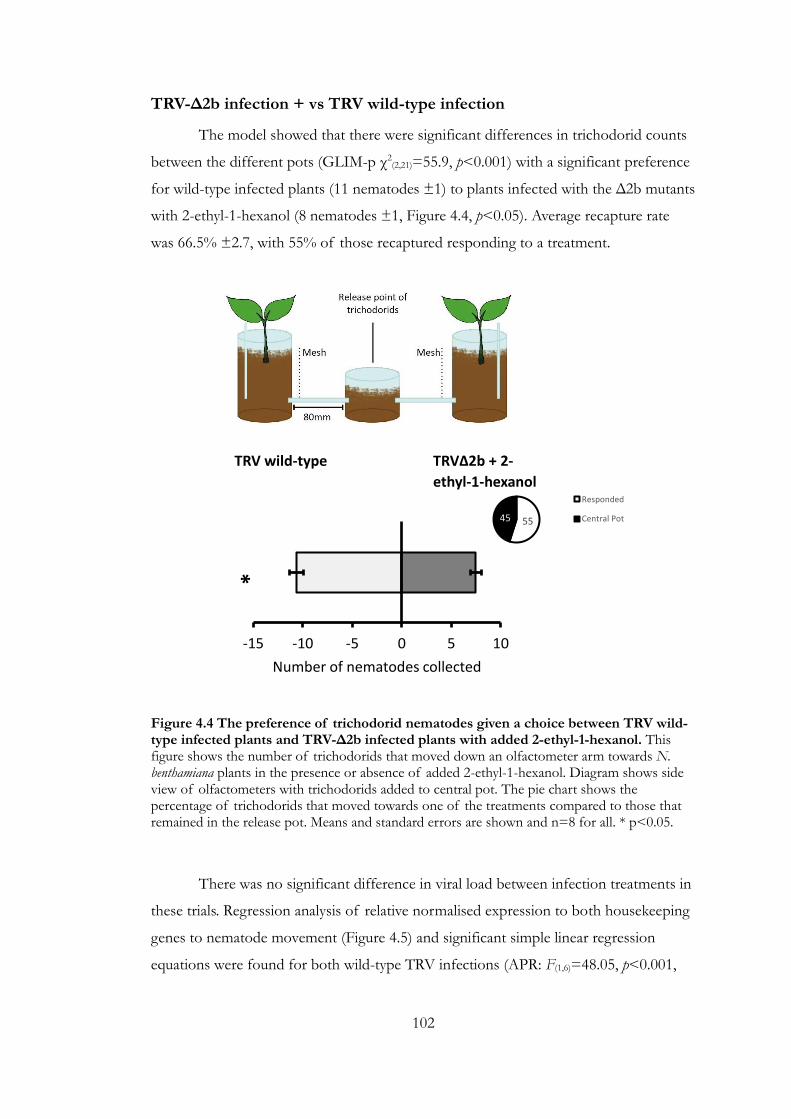
102
TRV-Δ2b infection + vs TRV wild-type infection
The model showed that there were significant differences in trichodorid counts
between the different pots (GLIM-p χ2(2,21)=55.9, p<0.001) with a significant preference
for wild-type infected plants (11 nematodes ±1) to plants infected with the Δ2b mutants
with 2-ethyl-1-hexanol (8 nematodes ±1, Figure 4.4, p<0.05). Average recapture rate
was 66.5% ±2.7, with 55% of those recaptured responding to a treatment.
There was no significant difference in viral load between infection treatments in
these trials. Regression analysis of relative normalised expression to both housekeeping
genes to nematode movement (Figure 4.5) and significant simple linear regression
equations were found for both wild-type TRV infections (APR: F(1,6)=48.05, p<0.001,
Figure 4.4 The preference of trichodorid nematodes given a choice between TRV wild-type infected plants and TRV-Δ2b infected plants with added 2-ethyl-1-hexanol. This figure shows the number of trichodorids that moved down an olfactometer arm towards N. benthamiana plants in the presence or absence of added 2-ethyl-1-hexanol. Diagram shows side view of olfactometers with trichodorids added to central pot. The pie chart shows the percentage of trichodorids that moved towards one of the treatments compared to those that remained in the release pot. Means and standard errors are shown and n=8 for all. * p<0.05.
TRV wild-type
-15 -10 -5 0 5 10
Number of nematodes collected
TRVΔ2b + 2-
ethyl-1-hexanol
*
5545
Responded
Central Pot
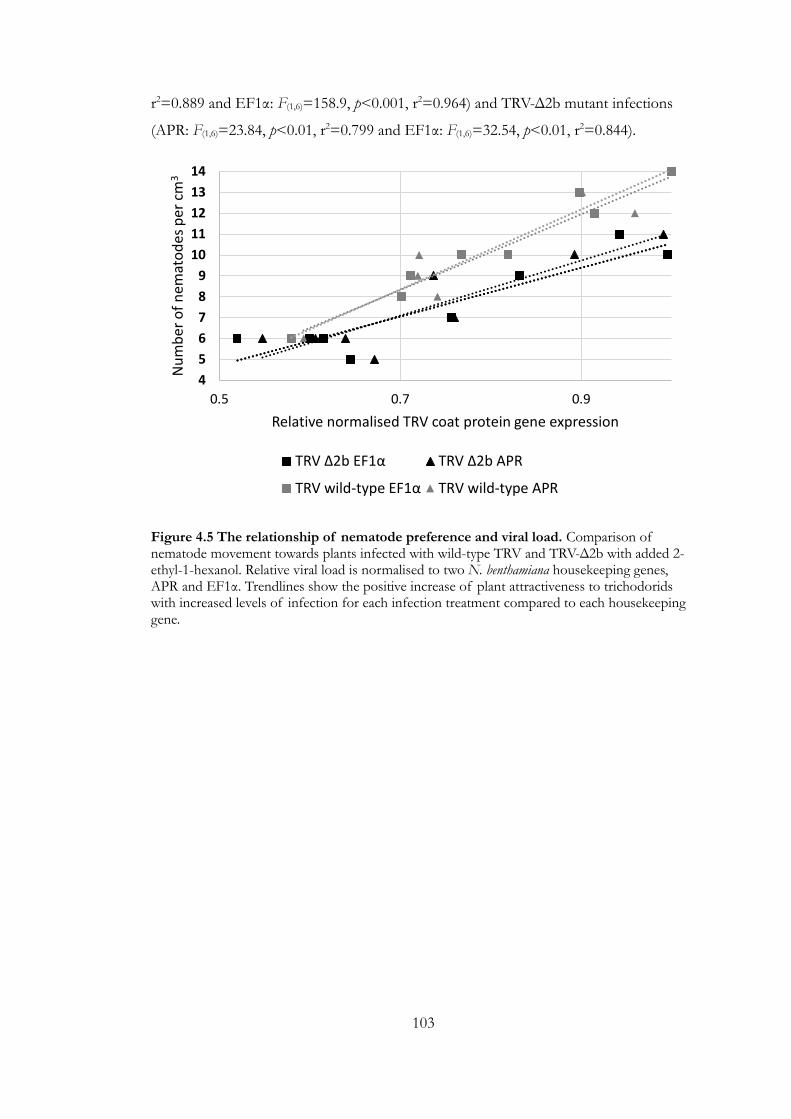
103
r2=0.889 and EF1α: F(1,6)=158.9, p<0.001, r2=0.964) and TRV-Δ2b mutant infections
(APR: F(1,6)=23.84, p<0.01, r2=0.799 and EF1α: F(1,6)=32.54, p<0.01, r2=0.844).
Figure 4.5 The relationship of nematode preference and viral load. Comparison of nematode movement towards plants infected with wild-type TRV and TRV-Δ2b with added 2-ethyl-1-hexanol. Relative viral load is normalised to two N. benthamiana housekeeping genes, APR and EF1α. Trendlines show the positive increase of plant attractiveness to trichodorids with increased levels of infection for each infection treatment compared to each housekeeping gene.
4
5
6
7
8
9
10
11
12
13
14
0.5 0.7 0.9
Nu
mb
er o
f n
emat
od
es p
er c
m3
Relative normalised TRV coat protein gene expression
TRV Δ2b EF1α TRV Δ2b APR
TRV wild-type EF1α TRV wild-type APR

104
Discussion
There was a significant difference in attractiveness between Agrobacterium-
infected control plants with and without the addition of 2-ethyl-1-hexanol, with the
presence of the compound increasing nematode preference. This strongly suggests that
trichodorids can both detect this compound and that it may constitute an important
component of the chemical cues that they use to orient themselves in the soil (Rasmann
et al. 2012). As 2-ethyl-1-hexanol can be produced in plants as a result of biotic stress
(Castelyn et al. 2015, de Lacy Costello et al. 2001, Fernando et al. 2005, Heil and Bueno
2007, Yi et al. 2009), it may form a reliable signal for foraging trichodorids searching for
a food source. While the observed difference in nematode movement preference is
significant, there was still substantial movement towards the control plant with no
added 2-ethyl-1-hexanol. As previous work has shown (Chapters 2 and 3), uninfected
N. benthamiana plants do not release detectable amounts of 2-ethyl-1-hexanol from their
roots, so the observed nematode attraction cannot be explained by background
production of this individual compound. This suggests that while 2-ethyl-1-hexanol is
acting as an important foraging cue for trichodorids, it may not constitute the entire
signal. Nematodes, in general, respond to basic environmental cues like CO2 gradients
(reviewed in Rasmann et al. 2012), and while this has not been specifically tested for
trichodorids, these responses are seen across phylogenetic and functional groups
(Rasmann et al. 2012). It seems likely that trichodorids would also respond to several of
these biological cues.
When plants infected with wild-type TRV were compared to plants infected
with TRV-Δ2b with added 2-ethyl-hexanol, there was also a significant difference in
preference, with trichodorids moving more towards wild-type infected plants. This ran
contrary to the hypothesis that the addition of 2-ethyl-1-hexanol would “repair” the
reduction in attractiveness between wild-type TRV and TRV-Δ2b seen in previous work
(Chapter 3). This hypothesis was based on the evidence that 2-ethyl-1-hexanol made
plants more attractive (first comparison) and that TRV-Δ2b plants were not significantly
different from wild-type TRV infected plants in any of the root parameters analysed
previously (total root length, root surface area, root fresh and dry weight or root to total
plant weight) apart from volatile production. This previous work (Chapters 2 and 3)
suggested that the only detectable differences in infection were root VOC production,
and the addition of root VOC that was demonstrably attractive to trichodorids would

105
remove the difference in attractiveness between treatments. Even with addition of 2-
ethyl-1-hexanol to TRV-Δ2b infected plants, trichodorids again preferred plants with
increasing viral loads (Figure 4.5), which matches the previous findings of these
investigations.
This supports the conclusion that 2-ethyl-1-hexanol is not the sole driver of
plant-nematode interaction but may be part of a more complex cocktail of chemical
cues produced by TRV-infected plants. Other work on exudates of plants infested by
biotic agents, including arthropods (Krips et al. 2001, Kuhns et al. 2014, Penaflor et al.
2011) and nematodes (Hallem et al. 2011, Zhao et al. 2007), found that a variety of
compounds were released by infected roots. When root exudates are tested in choice
experiments on other nematodes, the full mixture of root exudates has the greatest
effect on behaviour (Beeman et al. 2019, Wang et al. 2020). This work has already shown
that this is the case for this interaction, with in vivo releases from infected plants
attracting trichodorids (Figures 2.11 and 3.8). The purpose of the work in this chapter
was to highlight and define a chemical compound that is involved in these interactions
that is modified by viral infection.
We were unable to test 1,3-ditertbutylbenzene, and it is possible we were unable
to collect and detect other attractants that were being released by plant roots. An early
concern was that no terpenes were detected from samples, since these are a well-
established and important group of attractant phytochemicals (Ali et al. 2011,
Avellaneda et al. 2019, Krips et al. 2001, Kuhns et al. 2014, Penaflor et al. 2011, Zhao et al.
2007). Standards for well-documented attractants β-caryophellene (Hammack 2001,
Rasmann et al. 2005, Sadeh et al. 2017), α-pinene (Hallem et al. 2011, Zaka et al. 2015,
Zhao et al. 2007), limonene (Sadeh et al. 2017) and linalool (Hallem et al. 2011,
Hammack 2001) were obtained. These were run using the gas chromatography method
described in Chapters 2 and 3 and were detected with similar response factors to other
compounds quantified in this research. Chromatograms, mass spectra and retention
times of a range of isoprenoid standards were compared to the chromatograms of
samples collected and no evidence was found to suggest they were present.
Isoprenoids are not the only possibility for further important chemical cues. The
analytical methods that we chose allowed us to capture and analyse a broad range of
compounds but is biased towards high volatility compounds (Redeker et al. 2018).
Alternative methods using volatile adsorptive packing collection traps, which allow for
106
the concentration of lower volatility compounds (Phillips 1997, Poli et al. 2005, Ras et al.
2009, Xiu et al. 2019), were tested, but no novel compounds were detected.
It is unlikely that there was insufficient 2-ethyl-1-hexanol added for the
trichodorids to respond to. Based on the two averages (data from Chapters 2 and 3) for
2-ethyl-1-hexanol emissions from wild-type infected plants, we estimate biological
production to be 0.15-0.18µg min-1 g dry root weight-1, which is 25.92-67.39µg/plant
over 48 hours, using the range of plant root measures from Chapters 2 and 3.
Converting into ml for use with liquid standard gives estimates of 31.1-80.9 µl of 2-
ethyl-1-hexanol. The amount added in these experiments was double the largest
estimate and is in line with previously published work (Ali et al. 2011, Rasmann et al.
2005).
A shortage of trichodorids meant that we could not test the attractiveness of
ditertbutylbenzene, the second VOC of interest, which has also been reported to be
produced by tree roots (Voglar et al. 2019). As this compound is produced in much
lower quantities than 2-ethyl-1-hexanol, the priority was to test the latter as it is more
likely to be biologically relevant. Further trichodorid testing, in addition to exploring the
effects of ditertbutylbenzene, could involve manipulating CO2 gradients to confirm
whether they respond to CO2 in similar ways to other nematode species. As roots create
a CO2 gradient (Johnson et al. 2006, Reinecke et al. 2008), this would seem a logical
foraging cue for trichodorids to orient themselves in the soil. Tests that start to mimic
field conditions more closely, and using potatoes rather than a model plant species, may
give even more valuable information that is more specific to the agricultural reality.
These experiments have shown that 2-ethyl-1-hexanol is an important
chemoattractant phytochemical for this interaction, and that it forms a significant part
of the total signal that trichodorids respond to. In absence of viral infection, it seems to
drive trichodorid attraction towards plants, but when compared to a wild-type TRV
infection, trichodorids do not respond to 2-ethyl-1-hexanol addition. This finding is
valuable both for our understanding of nematode chemotaxis, giving novel information
on a previously unstudied compound and nematode group, as well as being valuable
information for understanding the attraction behind the transmission of TRV in arable
systems.
107
Chapter 5 : General Discussion
Overview
In the context of Tobacco rattle virus, exploring the impacts of infection on the
structure of root systems and the effects of chemical signals from infected roots on
trichodorid behaviour has ecological and agricultural implications in understanding and
potentially managing this important pest. Sub-surface plant viruses transmitted by
nematodes, including trichodorids, face similar challenges to attracting vectors as
aboveground vector-borne viruses while operating in different environments (Shelef et
al. 2019). Understanding rhizosphere interactions aids overall understanding of above-
and belowground biota (Wardle et al. 2004). This thesis aims to further current
understanding of TRV–trichodorid relationships by using an N. benthamiana model plant
system to show the physiological effects of infection, including identifying chemical
cues for attraction and the effects of those chemicals on the movement of vector
nematodes. It also explores the potential impacts of two TRV genes on the strength of
these physiological responses.
Through the experiments described in Chapters 2, 3 and 4, I explored infection
effects within the N. benthamiana system, discovering impacts on growth and structure
of host root systems, differences in root VOCs emitted and influences on trichodorid
attraction. Focusing on potential causes behind these observations, I investigated how
the absence of two genes on the smaller virus particle, RNA-2, of TRV altered these
effects. A reduction in the strength of effects became evident as these genes were
absent, including reduction in vector attractiveness. Finally, I looked at how one
candidate VOC for chemoattraction affected the movement of trichodorids towards
plants, showing that it increased trichodorid preference and is likely to be part of a
more complex signal. In this final chapter, I bring together the results from these
investigations to draw conclusions about these interactions and explore the context of
these findings and possible implications for future work.

108
Synthesis of findings
Table 5.2 Summary of hypotheses relating to presence of root volatile emissions as a
result of viral infection. The chapter that each hypothesis relates to is given, along with the
outcome. Further details are given in the relevant section of this chapter.
Chapter Hypothesis Accepted/Rejected
2 Wild-type TRV infection causes a significant reduction in aboveground biomass vs uninfected plants
?- difference only seen
14 dpi
2 Wild-type TRV infection causes a significant reduction in belowground biomass vs uninfected plants
✔- differences seen 7 and 14 dpi
2 Wild-type TRV infection causes a significant reduction in root:total plant allocation vs uninfected plants
X- reduction seen at 7pi, increase at 14 dpi
2 Wild-type TRV infection causes a significant reduction in root surface area: volume vs uninfected plants
✔- differences seen 7 and 14 dpi
2 Wild-type TRV infection causes a significant reduction in root length vs uninfected plants
✔- differences seen 7 and 14 dpi
3 Significantly elevated viral loads 7 days post infection in infected plants vs other timepoints (4,14- and 21-days post infection)
✔
3 Most significant reduction in aboveground biomass between wild-type TRV infected and uninfected plants at 7- or 14-days post infection.
✔
3 Most significant reduction in belowground biomass between wild-type TRV infected and uninfected plants at 7- or 14-days post infection.
✔
3 Most significant reduction in root:total plant allocation between wild-type TRV infected and uninfected plants at 7- or 14-days post infection.
✔
3 Most significant reduction in root surface area:volume between wild-type TRV infected and uninfected plants at 7- or 14-days post infection.
✔
3 Most significant reduction in root length between wild-type TRV infected and uninfected plants at 7- or 14-days post infection.
✔
Chapter Hypothesis Accepted/Rejected 2 Significant difference in rVOC emissions from infected plants than
uninfected plants ✔- differences seen for canister sampling method, not volatile collection traps
3 Significantly greater 2-ethyl-1-hexanol, 1,3-ditertbutylbenze, 2,6-diterbutylquinone and 2,4-ditertbutylphenol emissions from roots of infected plants
?-only 2-ethyl-1-hexanol
and 1,3-ditertbutylbenze identified
3 Increased emissions from plants sampled for longer (canister method: 60 mins vs 20 mins)
✔
2 &3 Viral load will explain a significant amount of the observed variance in root VOC emissions from infected plants
?- not in Chapter 2, only
2-ethyl-1-hexanol in Chapter 3
Table 5.1 Summary of hypotheses relating to changes in biomass and root architecture as a result
of infection. The chapter that each hypothesis relates to is given, along with the outcome. Further details
are given in the relevant section of this chapter.
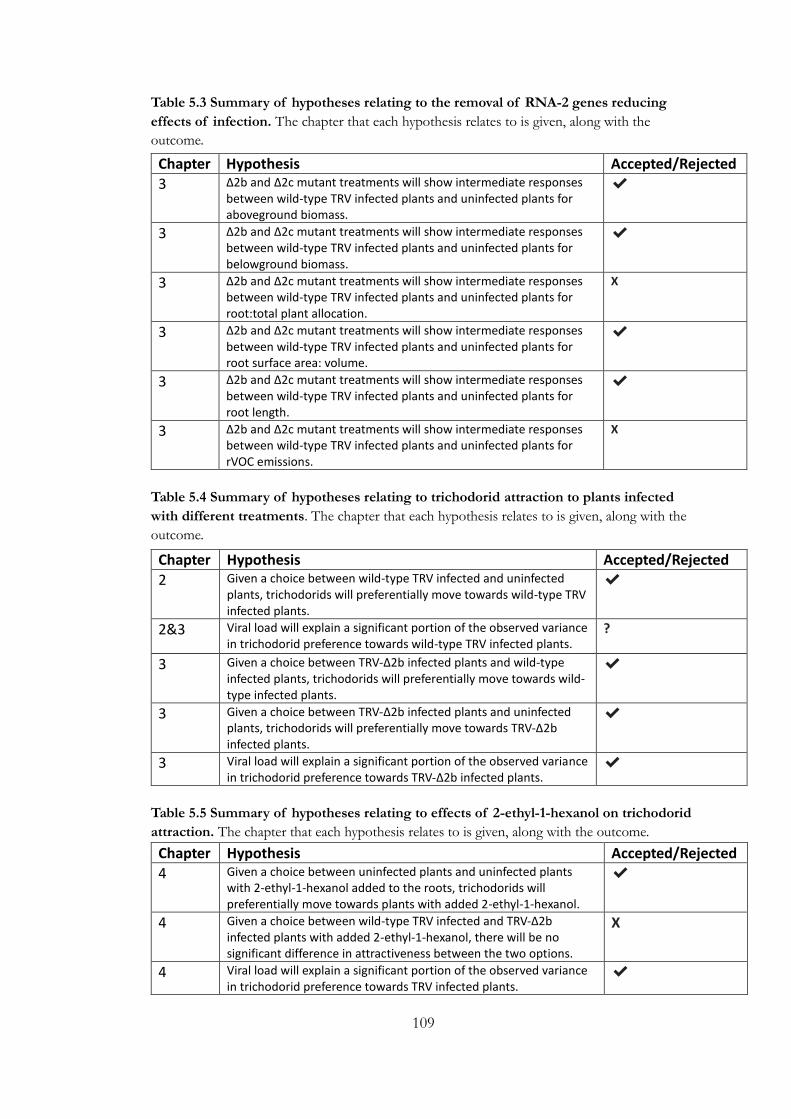
109
Table 5.3 Summary of hypotheses relating to the removal of RNA-2 genes reducing
effects of infection. The chapter that each hypothesis relates to is given, along with the
outcome.
Table 5.4 Summary of hypotheses relating to trichodorid attraction to plants infected
with different treatments. The chapter that each hypothesis relates to is given, along with the
outcome.
Table 5.5 Summary of hypotheses relating to effects of 2-ethyl-1-hexanol on trichodorid
attraction. The chapter that each hypothesis relates to is given, along with the outcome.
Chapter Hypothesis Accepted/Rejected
3 Δ2b and Δ2c mutant treatments will show intermediate responses between wild-type TRV infected plants and uninfected plants for aboveground biomass.
✔
3 Δ2b and Δ2c mutant treatments will show intermediate responses between wild-type TRV infected plants and uninfected plants for belowground biomass.
✔
3 Δ2b and Δ2c mutant treatments will show intermediate responses between wild-type TRV infected plants and uninfected plants for root:total plant allocation.
X
3 Δ2b and Δ2c mutant treatments will show intermediate responses between wild-type TRV infected plants and uninfected plants for root surface area: volume.
✔
3 Δ2b and Δ2c mutant treatments will show intermediate responses between wild-type TRV infected plants and uninfected plants for root length.
✔
3 Δ2b and Δ2c mutant treatments will show intermediate responses between wild-type TRV infected plants and uninfected plants for rVOC emissions.
X
Chapter Hypothesis Accepted/Rejected
2 Given a choice between wild-type TRV infected and uninfected plants, trichodorids will preferentially move towards wild-type TRV infected plants.
✔
2&3 Viral load will explain a significant portion of the observed variance in trichodorid preference towards wild-type TRV infected plants.
?
3 Given a choice between TRV-Δ2b infected plants and wild-type infected plants, trichodorids will preferentially move towards wild-type infected plants.
✔
3 Given a choice between TRV-Δ2b infected plants and uninfected plants, trichodorids will preferentially move towards TRV-Δ2b infected plants.
✔
3 Viral load will explain a significant portion of the observed variance in trichodorid preference towards TRV-Δ2b infected plants.
✔
Chapter Hypothesis Accepted/Rejected
4 Given a choice between uninfected plants and uninfected plants with 2-ethyl-1-hexanol added to the roots, trichodorids will preferentially move towards plants with added 2-ethyl-1-hexanol.
✔
4 Given a choice between wild-type TRV infected and TRV-Δ2b infected plants with added 2-ethyl-1-hexanol, there will be no significant difference in attractiveness between the two options.
X
4 Viral load will explain a significant portion of the observed variance in trichodorid preference towards TRV infected plants.
✔

110
Changes in biomass and root architecture as a result of
infection
Infection with TRV results in a variety of symptoms, depending on the host
plant, both in above and belowground tissues, and these have been well characterised
for crop and ornamental plant hosts (Taylor and Brown 1997). Although response to
infection varies across species, within species and across plant tissues (Harrison 1968),
there has been little research focus on retardation of belowground growth, nor whether
the structure of roots change with infection. My preliminary research that tested model
plants for TRV and trichodorid work (Nicotiana benthamiana, Arabidopsis thaliana, Lactuca
sativa and Petunia x hybrida) for successful infection and plant growth responses (data not
in thesis) suggested that infected N. benthamiana plants had reduced root systems with
roots appearing shorter in length, as well as overall reduction in plant size compared to
uninfected plants.
The feeding action of trichodorid nematodes has long been associated with “stubby
root” symptoms as well as galling and swelling of roots (Christie and Perry 1951,
Pitcher 1967), and the intensity of the plant response increases with both density of
trichodorids present and the type of plant species (Winfield and Cooke 1975). My
preliminary work suggested that TRV infection may play a role in these reported effects.
Based on this, we hypothesised that there would be a decrease in above and
belowground biomass as a result of infection, but that these effects would be more
severe in roots, leading to an overall reduction in plant biomass and root:shoot ratios in
infected plants. The root parameters analysed included total root length, average root
diameter, root surface area and root volume.
This work was presented in Chapter 2, and most of these hypotheses were accepted
(Table 5.1); wild-type TRV infection did significantly reduce aboveground and
belowground biomass, although a significant reduction in the former was only evident
two weeks after infection, whereas differences were seen in the latter at 7 and 14 days
post infection. Infected plants also had reduced root systems compared to their total
plant biomass. These root systems had a reduced total root length and surface area to
volume ratio. This drives a stronger reduction in root systems relative to aboveground
biomass when compared to healthy plants. Therefore, in addition to deviation from the
normal growth of plants, such as reduction in total size, retarded growth and delayed
senescence (Dale et al. 2004), I propose that TRV infection may play a role in causing
111
the observed and well characterised “stubby root” effects of trichodorid feeding (Coiro
and Sasanelli 1994, Otulak et al. 2012, Whitehead and Hooper 1970). The hypothesis
that infected plants had reduced root systems relative to the total plant mass was
rejected as while this was seen 7 days post infection, the opposite was seen 14 days post
infection. However, this increase in root mass still supports the idea that TRV infection
could be at least partially responsible for the “stubby root” effects seen, as root lengths
were still reduced compared to infected plants.
Trichodorid feeding can result in long-term root symptoms that may not become
apparent until harvest (Brown and Sykes 1971). The TRV infection itself, however,
appears to be transient (Cadman and Harrison 1959, Shaw et al. 2014), with viral load
dropping to low levels from 18 days post-infection when plants enter the recovery
phase (Ratcliff et al. 1997, 1999). However, the virus is often present at low levels even
if the infected plant no longer demonstrates symptoms (Ma et al. 2015, Xenophontos et
al. 1998) and developed resistance to subsequent reinfection with TRV is observed
(Ratcliff et al. 1999, Shaw et al. 2019). The time course of infection and the appearance
of symptoms vary with species of plant host (Cadman and Harrison 1959, Schmelzer
1957) and mechanism of infection. For example, potato and tobacco plants planted in
Trichodorus primitivus-infested soil still showed symptoms of infection 4 weeks after
exposure to viruliferous nematodes (Otulak et al. 2012), whereas N. benthamiana plants
mechanically infected with the virus showed recovery from symptoms 21 days after
infection (Shaw et al. 2019). The work in Chapter 3 tested the hypotheses that that viral
load in the N. benthamiana variety used peaked around 7 days post infection, and the
symptoms of infection as identified in the previous chapter would be strongest at the
same time or lag slightly behind peak viral load and be strongest 14 days post infection.
The infection timeline used follows a similar course to that seen in the work by Shaw
and colleagues and was carried on to 28 days, to see if differences in architecture
parameters between wild-type infected and control uninfected plants started to
disappear from 21 days post infection, due to recovery (Shaw et al. 2014, 2019).
The data supported these hypotheses (Chapter 3 hypotheses, Table 5.1), although
there was disagreement in the data from Chapters 2 and 3 on the root to total plant
weight ratio; work in Chapter 2 suggested increased allocation to the roots between 14
days post infection, whereas Chapter 3 showed the opposite. These differences are likely
due to the growth stage of plant treatments, as plants in Chapter 3 were infected when

112
smaller to ensure that plants at 28 days post-infection would be small enough to sample
properly in the root scanner. It may be that larger plants recover more quickly, and this
recovery begins with increasing resource allocation to root systems. While the infected
plants recovered biomass over time, inoculated and systemically infected leaves retained
the visual symptoms of infection (mottling and necrotic zones), even as new leaves
showed few symptoms.
These findings suggest that biomass and root/shoot effects are transient, with the
time frame of infection-dependent outcomes in line with previous work on N.
benthamiana. TRV infection may exacerbate trichodorid feeding symptoms in certain
conditions, rather than being an underlying cause. Not all trichodorid populations that
damage plants are viruliferous; estimates range from approximately 10% in the Pacific
Northwest (Mojtahedi et al. 2003) to 12-42% of viruliferous populations in Flanders,
Belgium (reviewed in Ploeg and Decraemer 1997). Cooper (1971) estimated that 12%
of Scottish potatoes are grown in soil containing TRV, whereas 15-20% are grown in
trichodorid-infected soils, and while TRV has a wide host range (Taylor and Brown
1997), it does not infect all plants affected by trichodorids such as apple (Pitcher 1967)
or sweetcorn (Christie and Perry 1951).
These findings suggest that TRV infection may have some additional physical
effects on belowground root systems that have not previously been reported (Conti and
Masenga 1977, Cremer and Schenk 1967, Dale 2009, Harrison and Robinson 1978) and
provide novel information on how TRV infection affects belowground systems. The
observed root physiology and biomass effects are transient, which may explain why they
have not been previously reported, especially as research on field-grown TRV-infected
plants tends to focus on final outcomes (Dale et al. 2000, 2004). If these responses are
replicated in other species, it may have implications for nematode feeding and viral
transmission. Trichodorids feed primarily on epidermal cells just behind the elongation
zone at the root tip, feeding for no more than 6 minutes on individual cells (Wyss 1977,
1982) then moving to other sites (Taylor and Brown 1997). They are also readily
disturbed by other nematodes, causing them to abandon feeding on that cell and to
move to another (Karanastasi et al. 2003). When enough nematodes converge on an area
of a root system, this leads to a decline in the roots and the movement of the
nematodes to other zones (Pitcher 1967). Root tips of high viral load plants, 7-14 days
post infection, are closer together due to reduced overall root length, which may cause a

113
combination of i) increased disturbance by other nematodes due to reduced space
between feeding zones and ii) quicker depletion of high quality feeding areas due to
smaller root systems. These effects may cause trichodorids that have fed successfully,
and may therefore be carrying TRV, to move on to new, uninfected hosts.
Presence of root volatile emissions as a result of viral
infection
Plant roots release a plethora of compounds into the rhizosphere and low
molecular weight secondary metabolites such as amino acids, organic acids, sugars and
phenolics are important constituents (Bais et al. 2006). Volatile organic compounds
(VOCs) form about 1% of all root-released exudates (Venturi and Keel, 2016). Volatiles
are particularly interesting as chemoattractants, because they can easily diffuse through
gas- and water-filled pores, depending on their solubility, and so have a wider range in
soils than water-soluble, non-gaseous exudates (Schulz-Bohm et al. 2018).
VOCs are an important group of molecules within the rhizosphere, used as
intra- and interspecies signals, mediating interactions between different groups of
organisms (Venturi and Keel 2016) and most commonly produced by plant roots and
microbes (Peñuelas et al. 2014). VOCs are thought to be important in plant–microbe
interactions; volatiles from plant growth promoting rhizobacteria (PGPR) directly
improve plant growth (Delaplace et al. 2015, Fincheira et al. 2016), alter root architecture
(Bavaresco et al. 2020) and improve resistance to stress and diseases (Naznin et al. 2014).
Root VOCs can act as a carbon source for bacteria (Macey et al. 2020) and are used to
attract bacteria to roots (Schulz-Bohm et al. 2018) and communicate with other plants,
both in mutually beneficial and antagonistic interactions (Ens et al. 2009, Huang et al.
2019, Jassbi et al. 2010). Root herbivory is a common stimulus for the release of VOCs
and different VOC groups have been detected in response to herbivory: fatty acid
derivates, such as aldehydes (Robert et al. 2012); ketones and alcohols (Lawo et al. 2011,
Palma et al. 2012); acids (Dudareva et al. 2006); terpenes (Ali et al. 2011, Jassbi et al. 2010,
Rasmann et al. 2011, Rasmann and Turlings 2008); thiocyanates, isothiocyanates and
other sulphur-containing compounds (Crespo et al. 2012). Some of these volatiles
attract natural enemies of the feeding herbivores, including some species of nematode
(Ali et. al. 2010, Degenhardt et al. 2009, Rasmann et al. 2005). These herbivory-response
VOCs may also attract plant-parasitic nematodes (Ali et al. 2010).

114
In the initial work presented in Chapter 2, it was hypothesised that TRV-infected
plants would show different root VOC profiles to uninfected plants, as many plant
viruses have been documented as driving differential release of plant volatiles relative to
uninfected plants, attracting vectors to enable spread to new hosts (e.g. Claudel et al.
2018, McMenemy et al. 2012), and nematodes are known to respond to root VOCs. The
exact volatiles that were expected were unknown as no work had been carried out on
volatiles emitted from roots of TRV infected plants. Significant differences were
detected in volatiles emitted between wild-type infected plants and uninfected plants
(Chapter 2, Table 5.2) sampled with the canister method.
It appears to be rare for novel products to be released by infected plants; infection
either increases the total concentration of emitted volatiles or alters the concentration
of a few compounds within the blend emitted (Eigenbrode et al. 2018). The findings of
this research were consistent with these previous observations. The four compounds
that showed significant differences between infected and uninfected treatments were
also present in the chromatograms of samples from uninfected plants, just at much
lower concentrations. When this experiment was repeated (Chapter 3), it was
hypothesised that these same four compounds would be present again and with
significantly greater emissions from the roots of infected plants than uninfected plants.
Only two of the four, 2-ethyl-1-hexanol and 1,3-ditertbutylbenzene, were identified in
the traces. It is possible that the other two compounds were produced by an alternate
source, potentially microbial.
2-ethyl-1-hexanol can be produced by Bacillus spp. as well as plants (Almenar et
al. 2007, Suryadi et al. 2019) and has been suggested to have anti-fungal properties
(Almenar et al. 2007, Cruz et al. 2012). If 2-ethyl-1-hexanol is being produced by
rhizosphere-associated microbes such as Bacillus, then this may help boost the signal for
passing nematodes and increase attraction. However, many soil organisms are able to
use 2-ethyl-1-hexanol as a carbon source, and oxidise it to ethylhexanoic acid, which is
far less volatile (Nalli et al. 2006). This may reduce its diffusion distance, depending on
the microbial community within the rhizobiome.
Aboveground, 2-ethyl-1-hexanol has been shown to be an important
component of Prunus persica floral scents, attracting pollinators to flower heads in a
variety of growing conditions (Du et al. 2018). As part of a six-component blend, it was
found to be attractive to female orange wheat blossom midges on wheat (Birkett et al.

115
2004). Sun and colleagues (2019) found that belowground feeding of Bikasha collaris
larvae on plants stimulated the release of 2-ethyl-hexanol from leaves, attracting adult
conspecifics to the aboveground portion of the plant to feed. The action of the adults
feeding aboveground increased root nutrient allocation and improved larval
performance. Not only does 2-ethyl-1-hexanol mediate belowground and aboveground
signalling, but it is also shaping dynamics where the rhizosphere and phyllosphere may
interact.
The biosynthesis of 2-ethyl-1-hexanol in plants is likely to be ethylation of
hexanol produced in the fatty acid pathway (see Dudareva et al. 2013). Other end
products of this pathway include 3-hexenyl acetate, 2-hexenal, 1-hexanol, octanal, 3-
hexen-1-ol, decanal and undecanal. These have been well studied in terms of volatile
signalling including host location (Engelberth 2020, Hu et al. 2018 Joo et al. 2019,
McMenemy et al. 2012, Michereff et al. 2019, Webster et al. 2008), and by comparison
2-ethyl-1-hexanol is poorly represented. It is rare that it is identified as a major player in
signals, showing little chemoattraction when tested, and is often a background
component to volatile blends (Almenar et al. 2007, Birkett et al. 2004, Dias et al. 2016). It
may be that it has a larger role in these interactions than previously thought, or that its
impact is greater in the rhizosphere, which is less well studied. It is also possible that in
some studies it has simply not been detected, as methodologies in collection and
sampling of volatiles can affect the stability and detection of volatiles and cause losses
from the sample (Kim and Kim 2012, Ullah et al. 2014).
It was hypothesised that viral load would explain a significant portion of the
variation in root VOC emissions. This hypothesis was not met in the data from Chapter
2, and in Chapter 3, only 2-ethyl-1-hexanol emissions were significantly explained by
viral load, with an incredibly high percentage of the variation explained by viral load in
roots. This could suggest, as above, that not all of the emissions seen in Chapter 2 were
directly attributed to TRV infection, or that the growth conditions also influenced and
possibly exacerbated signals linked to infection. It may be that these compounds are not
directly induced by infection as an overproduction of existing plant metabolism, but are
instead a stress response (Holopainen and Gershenzon 2010, Sharkey et al. 2008) as a
by-product of infection, but this has not been tested in this investigation.
This work has demonstrated, for the first time, that root VOC emissions are altered
by infection with a nematode-transmitted virus and suggests that TRV utilises similar
116
VOC-dependent mechanisms to attract transmission vectors as aboveground viruses
(Mauck et al. 2012, 2014). It is important to note that this has been carried out on intact
and living roots and that these compounds would be released in normal conditions,
unlike work carried out on destructively processed tissues (Joo et al. 2019, Rasmann et al.
2005).
Removal of RNA-2 genes reduces effects of infection
The genome of TRV is split into two particles of rod-shaped RNA, and the
smaller RNA-2 contains genes necessary for nematode transmission of TRV
(Hernández et al. 1995, MacFarlane et al. 1996). The size and organisation of this
particle is extremely variable between different TRV isolates; usually the coat protein
(CP) gene is located near the 5’ end (Goulden et al. 1990) and is followed by one or
more non-structural protein-encoding genes (2b and 2c). However, some strains only
contain the CP gene, such as TRV-PSG (Cornelissen et al. 1986) and are not transmitted
by nematodes.
In some tobravirus isolates, such as PEBV-TpA56, both 2b and 2c are involved in
nematode transmission (Hernández et al. 1995, MacFarlane et al. 1996, MacFarlane 2003,
Ploeg et al. 1993a,b) while in others, such as TRV-PpK20 used in these investigations,
only 2b is essential (Hernández et al. 1995) and the function of 2c is unknown. As the
2b protein is vital for nematode transmission, and has also been suggested to have
antagonistic effects on plant defences (Valentine et al. 2004), I hypothesised that plants
infected with TRV RNA-2 mutants missing 2b (TRV-Δ2b) would lead to a less severe
infection than wild-type, and also that infection with the TRV-Δ2b mutant would show
intermediate responses in plant growth and root architecture measures compared to
wild-type TRV infected plants and uninfected plants. While the function of 2c is
unknown for TRV-PpK20, it is likely to play some role in infection, and TRV-Δ2c
infected plants were also hypothesised to show less severe effects of infection.
Responses varied in significance for effects on root architecture parameters and
biomass, but plants infected with TRV-Δ2b showed responses broadly similar to plants
infected with wild-type TRV, whereas plants infected with TRV-Δ2c showed
intermediate responses. Notably, TRV-Δ2c mutants showed similar ratios to uninfected
plants at 7 and 14 days post infection for root to total plant biomass. This suggests that
removal of 2c from TRV-PpK20 stops the changes to root systems with infection. I
further hypothesised that plants infected with both mutants would show intermediate

117
changes to root VOC profiles compared to wild-type infected plants and uninfected
plants, but all differences in root volatile fluxes from mutant-infected plants compared
to uninfected plants were non-significant.
While isolates completely lacking in 2b and 2c exist and can still cause spraing
and stem-mottle symptoms in potato (Garbaczewska et al. 2012), Ghazala and
Varrelmann (2007) found that removing 2b and 2c from TRV-PpK20 leads to extreme
and hypersensitive-like resistance in some susceptible varieties of potato. Extreme
resistance to plant viruses is typified as strong and durable resistance, with reduced or
no visible symptoms of infection (Flis et al. 2005), while hypersensitive resistance results
in rapid necrotic reactions, either locally or systemically (Valkonen et al. 1998) as a
programmed cell death response to contain viruses at the infection site (de Ronde et al.
2014). The results of these experiments suggest than in N. benthamiana, infections with
mutants missing either one of the 2b or 2c genes reduces severity of infection, although
necrotic lesions and deleterious effects on plant growth were still observed. Just as
vector specificity in TRV may occur as a result of interactions of 2b and CP
(MacFarlane 2010, Vassilakos et al. 2001), the severity of symptoms, including changes
in emitted volatiles, could be due to interactions between 2b and 2c.
However, the response of TRV-Δ2c mutant-infected plants that bear similarities to
uninfected plants—particularly for root to total biomass and, to a lesser degree, for total
root length—may have consequences for feeding behaviour and transmission if, as
suggested above, the reduced root systems make disturbance and dispersal of feeding
trichodorids more likely. This may be a contributory factor to the differential
transmission rates seen for different TRV serotypes (Ploeg et al. 1989,1992). TRV RNA-
2 is not conserved across different TRV serotypes (Figure 1.5) and 2c is not always
present (MacFarlane 1999). When it is, 2c often changes in size and known function
across serotypes (MacFarlane et al. 1996), which may have an impact on root
architecture of plants infected by different TRV serotypes.
As well as being essential for nematode transmission and having a role in vector
specificity (MacFarlane 2010), the TRV RNA-2b gene product (40kDa) has been
reported to have a role in colonisation of TRV through the host plant from the
inoculation zone, and also as a possible antagonist to host defences (Valentine et al.
2004). In Cucumber mosaic virus, the unrelated 2b gene encodes for a small (12kDa)
protein that inhibits host defences (Ziebell et al. 2011). It also seems to have a role in

118
altering host VOC emissions in Nicotiana tabacum (Tungadi et al. 2017), which suggests
that these smaller non-structural virus proteins may be multifunctional in their roles,
including altering volatile products.
Trichodorids are attracted to TRV-infected plants
Just as arthropod vectors that transmit viruses aboveground are preferentially
attracted to viruliferous plants (Bosque-Perez and Eigenbrode 2011, Fereres et al. 2016,
Mwando et al. 2018), I hypothesised that trichodorids would preferentially move towards
plants infected with TRV over uninfected plants, which was demonstrated, with greater
attraction with increasing viral load. While trichodorids have been observed orienting
themselves towards host plants and aggregating at the elongation zone of growing roots
(Taylor and Brown 1997), and so must be able to respond to chemical cues from host
plants in order to find appropriate feeding locations, this is the first time trichodorids
have been shown to be recruited by a chemical signal from TRV infected plants.
The TRV-2b gene is essential for nematode transmission, so TRV-Δ2b infected
plants were hypothesised to be less attractive than wild-type infected plants, and these
plants showed intermediate attraction; more attractive than uninfected plants but
significantly less attractive to trichodorids than wild-type infected plants. This could be
due to a difference in volatile signals between these infection treatments. However, the
preference of mutant-infected plants over uninfected plants in the absence of a
detected difference in root VOC profile suggests that more chemical cues are present
and not yet identified.
In other plant–virus–vector systems, viruliferous and non-viruliferous vectors
behave differently to volatiles released from infected plants, both in terms of initial
attraction and feeding behaviours (Dáder et al. 2017, Fereres et al. 2016, Rajabaskar et al.
2014). Therefore, a potential further research project should test viruliferous versus
non-viruliferous trichodorid populations to see if they respond differently to
uninfected/infected plants; or it may use unseparated nematodes, such as in this work,
but test collected nematodes for presence of TRV (Boutsika et al. 2004, Holeva et al.
2006) to see if viruliferous and non-viruliferous individuals within a total population
behave differently.

119
2-ethyl-1-hexanol as major causative agent of TRV-induced
plant signals
As the compound most strongly affected by TRV infection, I hypothesised that
2-ethyl-1-hexanol, a fatty acid-derived plant alcohol, would form part of trichodorid
foraging cues and be attractive to trichodorids. Fatty acid-derived alcohols and esters
form an important class of phytochemicals, derived from linoleic or linolenic acids
(Dudareva et al. 2013), and are released in volatile blends from roots under herbivory,
such as grapevine attacked by phylloxera (Lawo et al. 2011) and red clover by root borer
(Palma et al. 2012). They are involved in many multitrophic interactions above ground,
including virus vector attraction (Jiménez‐Martínez et al. 2004, Raguso and Roy 1998,
Shapiro et al. 2012). 2-ethyl-1-hexanol has been shown to be part of a volatile blend
released from carrot and potato roots damaged by wireworms and cockchafer larvae
(Weissteiner 2010, Weissteiner and Schulz 2006). This may be an attractant for
entomopathogenic nematodes, although it appears to act inconsistently between species
(Laznik and Trdan 2016).
The rhizosphere has been defined as the 1-3mm zone around roots shaped by
the root system of plants and is directly influenced by root exudates and associated soil
microorganisms (Sasse et al. 2018, Venturi and Keel 2016). Since volatiles and other
gases drive signalling and other biogeochemical processes around plant roots, it has
been proposed that this wider, volatile-influenced volume should be taken into
consideration as part of the rhizosphere (de la Porte et al. 2020). For example, O2 is
depleted around the roots as a result of root and microbial respiration, and gradients of
O2 from the root surface extended out 1-2cm (Uteau et al. 2015). Likewise, volatiles
released by Carex plants can recruit soil bacteria from over 10cm away (Schulz-Bohm et
al. 2018) and entomopathogenic nematodes are able to sense the release of (E)-β-
caryophellene from maize roots over 50cm away (Turlings et al. 2012). In this study, 2-
ethyl-1-hexanol helped recruit trichodorid nematodes from over 8cm away, and similar
fatty acid-derived compounds have been found to maintain concentrations in the soil up
to 12cm away from their source (Schulz-Bohm et al. 2018), suggesting that it may be an
effective signalling molecule at longer distances than tested here.
I found that the addition of 2-ethyl-1-hexanol to the rhizosphere of uninfected
N. benthamiana plants made them significantly more attractive to trichodorids than
untreated control plants (Chapter 4). I then compared wild-type TRV-infected plants

120
against TRV-Δ2b infected plants (Chapter 4). The mutant infected plants had proven to
be of intermediate attraction between wild-type infected and uninfected plants, with no
elevated release (relative to uninfected controls) of 2-ethyl-1-hexanol in the volatile
profiles. I hypothesised that 2-ethyl-1-hexanol would enhance the attractiveness of
mutant-infected plants to the same level as wild-type plants and remove differences in
attractiveness between those treatments. The results show that while addition of 2-
ethyl-hexanol reduces the difference in attraction between untreated TRV-Δ2b infected
plants and wild-type infected plants, nematodes still significantly prefer wild-type TRV-
infected plants. This suggests that while 2-ethyl-1-hexanol is attractive to trichodorids,
the observed differences in attraction between infections with and without 2b cannot be
explained by the reduced 2-ethyl-1-hexanol emissions from mutant infected plants.
Testing the motility of trichodorids directly in arenas (Liu et al. 2019, Maleita et al. 2017,
Qi et al. 2015) would not only allow direct observation of 2-ethyl-1-hexanol attraction,
but also enable testing of 1,3-ditertbutylbenzene and volatile combinations, as well as
degassed, non-volatile root exudates and metabolites from infected plants (Čepulytė et
al. 2018)
In other virus–vector systems, infection often affects more than one plant-
produced VOC, and it is these blends of volatiles that have the largest effect on vectors
(Eigenbrode et al. 2018). This is likely in this system with 2-ethyl-1-hexanol not solely
responsible for influencing trichodorid attraction, as suggested by significant movement
to plants infected with TRV-Δ2b over uninfected plants when there was no significant
difference in 2-ethyl-1-hexanol emissions between those treatments. 2-ethyl-1-hexanol
appears to be a strong attractant in the absence of other infection signals but when
compared to the complete wild-type infection, other factors beyond 2-ethyl-1-hexanol
appear to be required for comparable attraction. These could be other root VOCs, such
as 1,3-ditertbutylbenzene, or further undetected compounds such as soluble, non-
volatile root exudates (Peñuelas et al. 2014) released with infection that combine to give
the full signal seen with full TRV infection. Chemical signalling belowground is
incredibly important over long distances for many different organisms, including
nematodes. Nematodes are able to detect multiple stimuli including photic, electrical,
mechanical and thermal (Jones 2002), but chemical signals are among the most
important cues for nematodes (Rasmann et al. 2012). The largest chemoreceptor organ
for nematodes are amphids (Rasmann et al. 2012), located in the head, and contain a

121
group of neurons, whose cell bodies lie in a cuticle lined pit (Jones 1979) with a gap
leading to the exterior.
This is the first time a chemoattractant has been demonstrated for trichodorid
nematodes, but also for any plant-parasitic nematodes outside the order Tylenchida
(Chin et al. 2018, Rasmann et al. 2012, Sikder and Vestergård 2019). Plant-parasitic
nematodes are split into three orders: Triplonchida, Dorylaimida and Tylenchida. The
first two contain all known nematode vectors of plant viruses—trichodorids
(Triplonchida) and longidorids (Dorylaimida) (Decraemer and Robbins 2007, Subbotin
et al. 2020, Taylor and Brown 1997)—which makes this the first demonstrated example
of chemotaxis recorded for any nematode vectors of plant viruses. These findings have
potential implications for plant diseases caused by longidorid-transmitted viruses,
primarily nepoviruses (Taylor and Brown 1997), and are important for expanding
knowledge of nematode chemotaxis, both in terms of novel chemoattractants and
information about less-studied nematode groups (Rasmann et al. 2012).
Implications for agricultural management of TRV and other
nematode-transmitted viruses
In agriculture, spraing disease is managed either through the growth of TRV-
resistant cultivars or through control of trichodorid vectors. There are complications
with the latter, as trichodorids are polyphagous and can overwinter on weed species
(Davis 1975, Mojtahedi et al. 2003). Nematicides are increasingly controlled due to
environmental and human health safety concerns (Ingham et al. 2000, Kerry 2003). In
the UK, there are only two nematicides authorised for use on free-living nematodes
(EU Directive 91/414/EC): Nemathorin (active ingredient fosthiazate) and Vydate
(active ingredient oxamyl). Even using nematicides, control is difficult as populations
must be severely reduced to reduce incidence of spraing disease, therefore often
requiring multiple costly applications of nematicides (Ingham et al. 2007).
As a result, growing TRV-resistant cultivars is the preferred method of reducing
crop losses due to spraing and plant viruses. It is more effective, economical and
reduces environmental impact. The resistance to TRV in commercial potato varieties is
tested by screening tubers grown in viruliferous nematode-infested soils, either in the
glasshouse or in the field (Dale and Neilson 2006, Dale and Solomon 1988), then

122
scoring them for spraing symptoms in tubers. Especially in glasshouse trials, this does
not take into consideration nematode preference for alternative food sources that may
be available; if 2-ethyl-1-hexanol can be shown to be released from potato roots in
addition to N. benthamiana roots, then screening potato varieties by 2-ethyl-1-hexanol
emissions may provide another axis to cultivar selection. Growers could then pick
varieties that are both more resistant to TRV and are less attractive to trichodorids in
the case of infection. In addition, possible companion plants with high emissions of 2-
ethyl-1-hexanol from uninfected roots could be planted alongside less attractive potato
varieties to further reduce the likelihood of trichodorid feeding (Shelton and Badenes-
Perez 2006). Commercial cultivars showing resistance to spraing have been divided into
three classes, depending on the strength of resistance and severity of symptoms (Dale
and Neilson 2006, Robinson and Dale 1994). Selecting resistant varieties to test from
across the three classes would show if volatile emissions, particularly 2-ethyl-1-hexanol
and 1,3-ditertbutylbenzene, change with increasing resistance. A complicating factor in
cultivar selection is the symptomless expression of TRV in some cultivars
(Xenophontos et al. 1998). These tubers produce systemically-infected plants with
symptomless daughter tubers that themselves are a source of TRV for nematode
transmission.
The withdrawal of around 20% of pesticide active ingredients by EU directive
and the promotion of low pesticide-input faming in member states has created an
increased drive for integrated pest management (Hillocks 2012). In the future, the UK
will have to produce increasingly great amounts of food with less reliance on pesticides.
This will impact control of all free-living plant parasitic nematodes, including
trichodorids. Unlike Europe and North America, the UK was slow to start looking for
new methods of integrated pest management for the purpose of controlling free-living
nematodes (Neilson 2016). In addition to breeding for resistance and crop rotation
influenced by the monitoring of free-living nematodes, direct management of free-
living nematodes can be attempted with tillage regimes, biological control agents, soil
amendments and cover crops (Neilsen 2016).
Cover cropping can be used for multiple purposes, including weed suppression
during growth, and then incorporated into the soil as a green manure for nutrients
(Campiglia et al. 2009) or as a biofumigant; especially cruciferous species of Brassicaceae
(Doheny-Adams et al. 2018). The addition of a cover crop grown alongside a main crop
123
is called companion planting. Companion planting in a variety of push-pull systems is a
well-established concept in sustainable and integrated pest management (Conboy et al.
2019, Pickett and Khan 2016, Sarkar et al. 2018) and examples exist of successful
implementation in developing countries (reviewed in Hokkanen 1991). Trap plants can
attract potential pests through release of volatile compounds or arresting visual cues
that divert movement towards crop species, and planting multiple trap plants that
combine multiple different cues can be more effective (Eigenbrode et al. 2016). For
nematodes, Tagetes cultivars have been suggested for control of some plant-parasitic
nematodes (Hook et al. 2010), particularly Meloidogyne species (El-Hamawi et al. 2004,
Ploeg and Maris 1999, Pudasaini et al. 2006), but their effectiveness as companion plants
in intercropping systems is variable and limited (Hook et al. 2010, Powers et al. 1993).
They have also been implicated as having potential negative impacts on beneficial
organisms that may control free-living nematodes (Owino 1992).
Plants that are damaged by pests can release stress-related signals, either
aboveground (Pickett et al. 2012) or through the rhizosphere (Birkett et al. 2001),
including via shared arbuscular mycorrhizal networks (Babikova et al. 2013a,b) that lead
to indirect defence priming in undamaged plants nearby. A key challenge in these
systems is the dispersal of the pests from the trap plants back to the crop; they must be
retained or experience elevated mortality on the trap plants. This is particularly an issue
for high-dispersal winged arthropods. Plant-parasitic nematodes rarely travel more than
several metres annually through active dispersal (Taylor and Brown 1997), so trap plants
cannot attract nematode pests from large distances. This would require close association
of trap species with crop plants in order to be effective. This close association increases
the risk of pest dispersal back to crop plants. Plant parasitic nematodes can also be
passively transported in plant material or agricultural equipment, or by soil and wind
erosion; primarily by surface runoff of water following rainfall events (reviewed in
Baxter et al. 2013). Therefore, agricultural practice and field physical conditions must be
taken into account when predicting potential movement of nematodes.
However, transience of symptoms of infection found in this investigation has
implications for spraing disease in potato. Plants that were infected before tuber
formation did not show any symptoms of spraing in the tubers at harvest and direct
feeding by trichodorids on tubers, rather than plant roots, was required for disease
development (van Hoof 1964). Potentially, trichodorids in an intercropping system
124
would only need to be attracted from crop plants during tuber formation, rather than
the entire growing season. This may reduce the importance of back dispersal or finding
nematicidal trap plants, although it would require precise knowledge of the start of
tuber formation, which varies by cultivar and growing conditions.
The presence of intact TRV RNA-2 genes seemed to affect the volatile profiles
in this investigation, which could have implications for other nematode transmissive
isolates of TRV with different RNA-2 genes, such as TRV-TpO1 (MacFarlane 1999)
which encodes a 2c protein half the size of that of TRV-PpK20 used in this
investigation. Future work could focus on testing volatile profiles for this and other
isolates of TRV and PEBV. A particularly interesting comparison would be to look at
TRV-PaY4, which is usually transmitted by Paratrichodorus anemones (Vassilakos et al. 2001)
but can also be transmitted by P. pachydermus. It is currently the only tobravirus isolate to
not have strict vector specificity. RNA-2 isolates that are naturally missing 2b and 2c
(MacFarlane 1999) should also be compared; it would be expected that they may behave
similarly to the Δ2b and Δ2c mutants studied here. More broadly, the information learnt
in this nematode–virus system could be applied to longidorid transmitted viruses, such
as Grapevine fanleaf virus (Hewitt et al. 1958) which can cause economically important
decline of harvest of up to 60% of fruit yield (Martelli 2014, Rudel 1985).

125
Absence of RNA-2 genes reduces
infection effects
- Plants infected with mutants missing 2b and
2c genes show intermediate response for root
parameters and VOC emissions
- Plants infected with mutants missing 2b are
significantly less attractive to vectors than
wild-type infected plants
(Chapter 3)
Effects of
TRV
infection
TRV infection alters root system
architecture
- Infection causes decline of total plant
growth
- This effect is more marked in roots and
causes reduction in root:total plant biomass
- There is a reduction in root surface area,
driven by a reduction in root length, causing
“stubby roots”
- As infection reduces over time, plants
reinvest in root systems and the observed
effects are transient
(Chapters 2 and 3)
TRV infection changes root VOC
emissions
- Infection changes the fluxes of root
volatiles
- Changes in emissions found in compounds
emitted by uninfected plant roots
- 2-ethyl-hexanol and di-tertbutylbenzene are
the most significantly affected compounds
and increasing fluxes are positively correlated
with infection intensity.
(Chapters 2 and 3)
TRV infection increases
attractiveness of plants to
trichodorid vectors
- Significant increase in
movement towards infected
plants vs uninfected
- Significant correlation
between nematode density and
infection intensity
(Chapters 2 and 3)
2-ethyl-1-hexanol is a chemoattractant for
trichodorids
- 2-ethyl-1-hexanol addition to the rhizosphere
of uninfected plants makes them significantly
more attractive than untreated plants
- Addition of 2-ethyl-1-hexanol to 2b mutant
infected plants does not significantly alter
attractiveness when tested against wild-type
infected plants
(Chapter 4)
Figure 5.1 Main findings of thesis

126
Summary and conclusions
TRV–trichodorid interactions sit at the confluence of our understanding of
plant virus–vector relationships, nematode chemotaxis and plant-mediated rhizosphere
signalling, but while trichodorid feeding mechanisms have been well studied and
characterised (see Tyler and Brown 1997) there is a paucity of background information
to understand the wider picture of nematode foraging mechanisms. Work on plant
virus–vector is dominated by studies on aboveground arthropod vectors, while
nematode chemotaxis has focused on entomopathogenic and tylenchid plant-parasitic
nematodes. Unlike aboveground interactions, nematode vectors can only rely on
chemical and physical gradients to orient themselves towards plants, and chemical
signals are readily consumed by the rhizobiome as carbon sources and broken down to
other products, further complicating signals. Among this tumultuous backdrop,
trichodorids must find a source, and TRV novel hosts, to allow it to spread.
The work in this thesis has shed light on this previously understudied
interaction by using a model plant system. It has shown that TRV-infected plants have
altered root systems and release root VOCs in response to infection, which attract
vectors to infected plants and may encourage dispersal of viruliferous nematodes post
feeding, as well as starting to suggest the molecular causes behind these effects (Figure
5.1). It has started to explore what compounds may be responsible for this signal and
suggested a root VOC, 2-ethyl-1-hexanol, as being a driver of the nematode behaviours
recorded.
Using this information as a starting point, there is potential to uncover more
information on how trichodorid–virus interactions affect each other and are affected by
the environment they are in; how viruliferous and non-viruliferous populations may
differ and how these relationships may differ for other nematode–virus pairings; and
how the rhizosphere fauna may influence chemical signals such as 2-ethyl-hexanol, with
implications for pest management of viral disease in agriculture.

127
List of references
Adams, M.J., Heinze, C., Jackson, A.O., Kreuze, J.F., Macfarlane, S.A. and Torrance, L.,
(2012). ‘Family Virgaviridae’ in King, A.M.Q., Adams, M.J., Carstens, E.B. and
Lefkowitz, E.J., (eds.) Virus Taxonomy: Ninth Report of the International Committee on
Taxonomy of Viruses:1139-1162. USA:Elsevier Academic Press.
Agelopoulos, N.G. and Pickett, J.A., (1998). Headspace analysis in chemical ecology:
effects of different sampling methods on ratios of volatile compounds present in
headspace samples. Journal of Chemical Ecology 24:1161-1172.
Aharoni, A., Giri, A.P., Deuerlein, S., Griepink, F., de Kogel, W.J., Verstappen, F.W.,
Verhoeven, H.A., Jongsma, M.A., Schwab, W. and Bouwmeester, H.J., (2003).
Terpenoid metabolism in wild-type and transgenic Arabidopsis plants. The Plant
Cell 15(12):2866-2884.
Ahmed, N., Darshanee, H.L.C., Khan, I.A., Zhang, Z.-F. and Liu, T.-X., (2019). Host
selection behavior of the green peach aphid, Myzus persicae, in response to volatile
organic compounds and nitrogen contents of cabbage cultivars. Frontiers in Plant Science
10, art. no. 79.
Alborn, H.T., Bruton, R.G. and Beck, J.J., (2021). Sampling of volatiles in closed
systems: a controlled comparison of three solventless volatile collection methods.
Journal of Chemical Ecology :1-11.
Alexander, H.M., Mauck, K.E., Whitfield, A.E., Garrett, K.A. and Malmstrom, C.M.,
(2014). Plant-virus interactions and the agro-ecological interface. European Journal of Plant
Pathology 138:529-547.
Ali, J.G., Alborn, H.T. and Stelinski, L.L., (2010). Subterranean herbivore-induced
volatiles released by citrus roots upon feeding by Diaprepes abbreviatus recruit
entomopathogenic nematodes. Journal of Chemical Ecology 36:361-368.
Ali, J.G., Alborn, H.T. and Stelinski, L.L., (2011). Constitutive and induced subterranean
plant volatiles attract both entomopathogenic and plant parasitic nematodes. Journal of
Ecology 99:26-35.
Allen, M., Qin, W., Moreau, F. and Moffatt, B., (2002). Adenine
phosphoribosyltransferase isoforms of Arabidopsis and their potential contributions to
adenine and cytokinin metabolism. Physiologia Plantarum 115:56-68.
Almenar, E., Del Valle, V., Catala, R. and Gavara, R., (2007). Active package for wild
strawberry fruit (Fragaria vesca L.). Journal of Agricultural and Food Chemistry 55:2240-2245.
Ammar, E.D., Tsai, C.W., Whitfield, A.E., Redinbaugh, M.G. and Hogenhout, S.A.,
(2009). Cellular and molecular aspects of rhabdovirus interactions with insect and plant
hosts. Annual Review of Entomology 54:447-468.
128
Andaló, V., Moreira, G.F. and Moino Junior, A., (2017). Host-seeking behavior of the
Heterorhabditis amazonensis nematode in response to stimulant sources. Pesquisa
Agropecuária Tropical 47:265-272.
Arif, M.A., Guarino, S., Colazza, S. and Peri, E., (2020). The role of (E)-2-octenyl
acetate as a pheromone of Bagrada hilaris Burmeister: laboratory and field
evaluation. Insects 11:109.
Avellaneda, J., Díaz, M., Coy-Barrera, E., Rodríguez, D. and Osorio, C., (2019). Rose
volatile compounds allow the design of new control strategies for the western flower
thrips (Frankliniella occidentalis). Journal of Pest Science 94:129-142.
Babikova, Z., Gilbert, L., Bruce, T.J.A., Birkett, M.A., Caulfield, J.C., Woodcock, C.M.,
Pickett, J.A. and Johnson, D., (2013a). Underground signals carried through fungal
networks warn neighbouring plants of aphid attack. Ecology Letters 16:835-843.
Babikova, Z., Johnson, D., Bruce, T.J.A., Pickett, J.A. and Gilbert, L., (2013b). How
rapid is aphid‐induced signal transfer between plants via common mycelial networks?
Communicative & Integrative Biology 6:e325904.
Baek, Y.S., Ramya, M., An, H.R., Park, P.M., Lee, S.Y., Baek, N.I. and Park, P.H.,
(2019). Volatiles profile of the floral organs of a new hybrid Cymbidium, ‘Sunny Bell’
using headspace solid-phase microextraction gas chromatography – mass spectrometry
analysis. Plants 8:251.
Bais, H.P., Weir, T.L., Perry, L.G., Gilroy, S. and Vivanco, J.M., (2006). The role of root
exudates in rhizosphere interactions with plants and other organisms. Annual Review of
Plant Biology, 57:233-266.
Bates, G.H., (1937). A device for the observation of root growth in the soil. Nature
139:966-967.
Bavaresco, L.G., Osco, L.P., Araujo, A.S.F., Mendes, L.W., Bonifacio, A. and Araújo, F.F.,
(2020). Bacillus subtilis can modulate the growth and root architecture in soybean through
volatile organic compounds. Theoretical and Experimental Plant Physiology 32:99-108.
Baxter, C., Rowan, J.S., McKenzie, B.M. and Neilson, R., (2013). Understanding soil
erosion impacts in temperate agroecosystems: Bridging the gap between
geomorphology and soil ecology using nematodes as a model organism. Biogeosciences
10:7133-7145.
Bazghaleh, N., Hamel, C., Gan, Y., Knight, J.D., Vujanovic, V., Cruz, A.F. and Ishii, T.,
(2016). Phytochemicals induced in chickpea roots selectively and non-selectively
stimulate and suppress fungal endophytes and pathogens. Plant and Soil 409:479-493.
Bazzini, A.A., Manacorda, C.A., Tohge, T., Conti, G., Rodriguez, M.C., Nunes-Nesi, A.,
Villanueva, S., Fernie, A.R., Carrari, F. and Asurmendi, S., (2011). Metabolic and
miRNA profiling of TMV infected plants reveals biphasic temporal changes. PLoS One
6:e28466.

129
Beeman, A.Q., Njus, Z.L., Pandey, S. and Tylka, G.L., (2019). The effects of ILeVO and
VOTiVO on root penetration and behavior of the soybean cyst nematode, Heterodera
glycines. Plant Disease 103:392-397.
Bera, P., Chakrabarti, S., Gaikwad, N.K., Kutty, N.N., Barman, M. and Mitra, A.,
(2019). Developmental variation in floral volatiles composition of a fragrant orchid
Zygopetalum maculatum (Kunth) Garay. Natural Product Research 33(3):435-438.
Berini, J.L., Brockman, S.A., Hegeman, A.D., Reich, P.B., Muthukrishnan, R.,
Montgomery, R.A. and Forester, J.D., (2018). Combinations of abiotic factors
differentially alter production of plant secondary metabolites in five woody plant species
in the boreal-temperate transition zone. Frontiers in Plant Science 9:1257.
Bhaskar, P.B., Venkateshwaran, M., Wu, L., Ane, J.M. and Jiang, J., (2009).
Agrobacterium-mediated transient gene expression and silencing: a rapid tool for
functional gene assay in potato. PLoS One 4:e5812.
Birkett, M.A., Bruce, T.J., Martin, J.L., Smart, L.E., Oakley, J.O.N. and Wadhams, L.J.,
(2004b). Responses of female orange wheat blossom midge, Sitodiplosis mosellana, to
wheat panicle volatiles. Journal of Chemical Ecology 30:1319-1328.
Birkett, M.A., Chamberlain, K., Hooper, A.M. and Pickett, J.A., (2001). Does allelopathy
offer real promise for practical weed management and for explaining rhizosphere
interactions involving higher plants? Plant and Soil 232:31-39.
Blanc, S. and Michalakis, Y., (2016). Manipulation of hosts and vectors by plant viruses
and impact of the environment. Current Opinion in Insect Science 16:36-43.
Borges, D.F., Lopes, E.A., Côrtes, F.R., Visôtto, L.E., Valente, V.M.M. and Souza,
M.F., (2018). Nematicidal potential of essential oils of Ageratum fastigiatum, Callistemon
viminalis and Schinus terebinthifolius. Bioscience Journal 34:90-96.
Bosque-Pérez, N.A. and Eigenbrode, S.D., (2011). The influence of virus-induced
changes in plants on aphid vectors: insights from luteovirus pathosystems. Virus
Research 159:201-205.
Bouma, T.J. and Bryla, D.R., (2000). On the assessment of root and soil respiration for
soils of different textures: interactions with soil moisture contents and soil CO2
concentrations. Plant and Soil 227:215-221.
Bourgaud, F., Gravot, A., Milesi, S. and Gontier, E., (2001). Production of plant
secondary metabolites: a historical perspective. Plant Science 161:839-851.
Boutsika, K., Phillips, M.S., MacFarlane, S.A., Brown, D.J.F., Holeva, R.C. and Blok,
V.C., (2004). Molecular diagnostics of some trichodorid nematodes and associated
Tobacco rattle virus. Plant Pathology 53:110-116.
Bragard, C., Caciagli, P., Lemaire, O., Lopez-Moya, J.J., MacFarlane, S., Peters, D., Susi,
P. and Torrance, L., (2013). Status and prospects of plant virus control through
interference with vector transmission. Annual Review of Phytopathology 51:177-201.

130
Bragg, P.L., Govi, G. and Cannell, R.Q., (1983). A comparison of methods, including
angled and vertical minirhizotrons, for studying root growth and distribution in a spring
oat crop. Plant and Soil 73:435-440.
Brown, D.J.F. and Boag, B., (1988). An examination of methods used to extract virus
vector nematodes (Nematoda: Longidoridae and Trichodoridae) from soil samples.
Nematologia Mediterranea 16:93-99.
Brown, D., Karanastasi, E. and Wyss, U., (2003). An in vitro examination of the feeding
behaviour of Paratrichodorus anemones (Nematoda: Trichodoridae), with comments on the
ability of the nematode to acquire and transmit Tobravirus particles. Nematology 5:421-
434.
Brown, E.B. and Sykes, G.B., (1971). Studies on the relation between density of
Longidorus elongatus and growth of sugar beet, with supplementary observations on
Trichodorus spp. Annals of Applied Biology 68:291-298.
Bubici, G., Carluccio, A.V., Cillo, F. and Stavolone, L., (2015). Virus-induced gene
silencing of pectin methylesterase protects Nicotiana benthamiana from lethal symptoms
caused by Tobacco mosaic virus. European Journal of Plant Pathology 141:339-347.
Cadman, C.H. and Harrison, B.D., (1959). Studies on the properties of soil‐borne
viruses of the tobacco‐rattle type occurring in Scotland. Annals of Applied Biology
47:542-556.
Cai, Z., Ouyang, F., Su, J., Zhang, X., Liu, C., Xiao, Y., Zhang, J. and Ge, F., (2020).
Attraction of adult Harmonia axyridis to volatiles of the insectary plant Cnidium monnieri.
Biological Control 143:e104189.
Campbell, R.N., (1996). Fungal transmission of plant viruses. Annual Review of
Phytopathology 34:87-108.
Campiglia, E., Paolini, R., Colla, G. and Mancinelli, R., (2009). The effects of cover
cropping on yield and weed control of potato in a transitional system. Field Crop Research
112:16-23.
Carr, J.P., Donnelly, R., Tungadi, T., Murphy, A.M., Jiang, S., Bravo-Cazar, A., Yoon,
J.Y., Cunniffe, N.J., Glover, B.J. and Gilligan, C.A., (2018). Viral manipulation of plant
stress responses and host interactions with insects. Advances in Virus Research 102:177-
197.
Castelyn, H.D., Appelgryn, J.J., Mafa, M.S., Pretorius, Z.A. and Visser, B., (2015).
Volatiles emitted by leaf rust infected wheat induce a defence response in exposed
uninfected wheat seedlings. Australasian Plant Pathology 44:245-254.
Čepulytė, R., Danquah, W.B., Bruening, G. and Williamson, V.M., (2018). Potent
attractant for root-knot nematodes in exudates from seedling root tips of two host
species. Scientific Reports 8:1-10.
131
Chen, Y., Chen, Q., Li, M., Mao, Q., Chen, H., Wu, W., Jia, D. and Wei, T., (2017).
Autophagy pathway induced by a plant virus facilitates viral spread and transmission by
its insect vector. PLoS Pathogens 13:e1006727.
Chen, Y.L., Dunbabin, V.M., Diggle, A.J., Siddique, K.H. and Rengel, Z., (2011).
Development of a novel semi-hydroponic phenotyping system for studying root
architecture. Functional Plant Biology 38:355-363.
Chin, S., Behm, C.A. and Mathesius, U., (2018) Functions of flavonoids in plant–
nematode interactions. Plants 7:art. no. 85.
Choudhury, S., Larkin, P., Xu, R., Hayden, M., Forrest, K., Meinke, H., Hu, H., Zhou,
M. and Fan, Y., (2019). Genome wide association study reveals novel QTL for barley
yellow dwarf virus resistance in wheat. BMC Genomics 20:891.
Christie, J.R. and Perry, V.G., (1951). A root disease of plants caused by a nematode of
the genus Trichodorus. Science 113:491-493.
Claflin, S.B., Power, A.G. and Thaler, J.S., (2017). Aphid density and community
composition differentially affect apterous aphid movement and plant virus transmission.
Ecological Entomology 42:245-254
Claudel, P., Chesnais, Q., Fouché, Q., Krieger, C., Halter, D., Bogaert, F., Meyer, S.,
Boissinot, S., Hugueney, P., Ziegler-Graff, V. and Ameline, A., (2018). The aphid-
transmitted Turnip yellows virus differentially affects volatiles emission and subsequent
vector behavior in two Brassicaceae plants. International Journal of Molecular Sciences
19:2316.
Coiro, M.I. and Sasanelli, N., (1994). The life cycle and reproductive potential of
individual Trichodorus sparsus (Nematoda) on S. Lucie cherry. Nematologia Mediterranea
22:233-236.
Colazza, S., McElfresh, J.S. and Millar, J.G., (2004). Identification of volatile
synomones, induced by Nezara viridula feeding and oviposition on bean spp., that attract
the egg parasitoid Trissolcus basalis. Journal of Chemical Ecology 30:945-964.
Conboy, N.J.A., McDaniel, T., Ormerod, A., George, D., Gatehouse, A.M.R., Wharton,
E., Donohoe, P., Curtis, R. and Tosh, C.R., (2019). Companion planting with French
marigolds protects tomato plants from glasshouse whiteflies through the emission of
airborne limonene. PLoS One 14:e0213071.
Conti, M. and Masenga, V., (1977). Identification and prevalence of pepper viruses in
Northwest Italy. Phytopathologisches Zeitschrift 90:212-222
Cooper, J.E., (2007). Early interactions between legumes and rhizobia: disclosing
complexity in a molecular dialogue. Journal of Applied Microbiology 103:1355-1365.
Cooper, J.I., (1971). The distribution in Scotland of tobacco rattle virus and its
nematode vectors in relation to soil type. Plant Pathology 20:51-58.
132
Copolovici, L., Kännaste, A., Pazouki, L. and Niinemets, Ü., (2012). Emissions of green
leaf volatiles and terpenoids from Solanum lycopersicum are quantitatively related to the
severity of cold and heat shock treatments. Journal of Plant Physiology 169:664-672.
Cordovez, V., Mommer, L., Moisan, K., Lucas-Barbosa, D., Pierik, R., Mumm, R.,
Carrion, V.J. and Raaijmakers, J.M., (2017). Plant phenotypic and transcriptional changes
induced by volatiles from the fungal root pathogen Rhizoctonia solani. Frontiers in Plant
Science 8:1262.
Cornelissen, B.J.C., Linthorst, H.J.M., Brederode, F.T. and Bol, J.F., (1986). Analysis of
the genome structure of Tobacco rattle virus strain PSG. Nucleic Acids Research 14:2157-
2169.
Cremer, M.G. and Schenk, P.K., (1967). Notched leaf in Galdiolus spp. caused by viruses
of the Tobacco rattle virus group. Netherlands Journal of Plant Pathology 73:33-48
Crespo, E., Hordijk, C.A., de Graaf, R.M., Samudrala, D., Cristescu, S.M., Harren, F.J.
and van Dam, N.M., (2012). On-line detection of root-induced volatiles in Brassica nigra
plants infested with Delia radicum L. root fly larvae. Phytochemistry, 84:68-77.
Crosslin, J.M., Thomas, P.E. and Hammond, R.W., (2003). Genetic variability of
genomic RNA 2 of four Tobacco rattle tobravirus isolates from potato fields in the
Northwestern United States. Virus Research 96:99-105.
Cruz, A.F., Hamel, C., Yang, C., Matsubara, T., Gan, Y., Singh, A.K., Kuwada, K. and
Ishii, T., (2012). Phytochemicals to suppress Fusarium head blight in wheat–chickpea
rotation. Phytochemistry 78:72-80.
Dada, T.E., Liu, J., Johnson, A.C., Rehman, M. and Gurr, G.M., (2020). Screening
barrier plants to reduce crop attack by sweet potato weevil (Cylas formicarius). Pest
Management Science 76:894-900.
Dáder, B., Then, C., Berthelot, E., Ducousso, M., Ng, J.C. and Drucker, M., (2017).
Insect transmission of plant viruses: multilayered interactions optimize viral
propagation. Insect Science 24:929-946.
Dale, M.F.B., (2009). Tobacco rattle virus in potatoes. Aspects of Applied Biology 94:41-47.
Dale, M.F.B. and Neilson, R., (2006). Research review: free-living nematodes and
spraing. British Potato Council Research Review:1-62.
Dale, M.F.B., Robinson, D.J., Griffiths, D.W., Todd, D. and Bain, H., (2000). Effects of
tuber-borne M-type strain of Tobacco rattle virus on yield and quality attributes of
potato tubers of the cultivar Wilja. European Journal of Plant Pathology 106:275-282.
Dale, M.F.B., Robinson, D.J. and Todd, D., (2004) Effects of systemic infections with
Tobacco rattle virus on agronomic and quality traits of a range of potato cultivars. Plant
Pathology 58:788-93.
133
Dale, M.F.B. and Solomon, R.M., (1988). A glass house test to assess the sensitivity of
potato cultivars to Tobacco rattle virus. Annals of Applied Biology 112:225-229.
Dardouri, T., Gautier, H., Ben Issa, R., Costagliola, G. and Gomez, L., (2019).
Repellence of Myzus persicae (Sulzer): evidence of two modes of action of volatiles from
selected living aromatic plants. Pest Management Science 75:1571-1584.
D'Auria, J.C., Pichersky, E., Schaub, A., Hansel, A. and Gershenzon, J., (2007).
Characterization of a BAHD acyltransferase responsible for producing the green leaf
volatile (Z)‐3‐hexen‐1‐yl acetate in Arabidopsis thaliana. The Plant Journal 49:194-207.
Davis, J.R. and Allen, T.C., (1975). Weed hosts of the Tobacco rattle virus in
Idaho. American Potato Journal 52:1-8.
De Boer, J.G. and Dicke, M., (2004). The role of methyl salicylate in prey searching
behavior of the predatory mite Phytoseiulus persimilis. Journal of Chemical Ecology 30:255-
271.
De Boer, J.G., Posthumus, M.A. and Dicke, M., (2004). Identification of volatiles that
are used in discrimination between plants infested with prey or nonprey herbivores by a
predatory mite. Journal of Chemical Ecology 30:2215-2230.
Decraemer, W. and Robbins, R.T., (2007). The who, what and where of Longidoridae and
Trichodoridae. Journal of Nematology 39:295.
Degenhardt, J., Hiltpold, I., Köllner, T.G., Frey, M., Gierl, A., Gershenzon, J., Hibbard,
B.E., Ellersieck, M.R. and Turlings, T.C., (2009). Restoring a maize root signal that
attracts insect-killing nematodes to control a major pest. Proceedings of the National
Academy of Sciences 106:13213-13218.
de Lacy Costello, B.P.J., Evans, P., Ewen, R.J., Gunson, H.E., Jones, P.R., Ratcliffe,
N.M. and Spencer‐Phillips, P.T., (2001). Gas chromatography–mass spectrometry
analyses of volatile organic compounds from potato tubers inoculated with Phytophthora
infestans or Fusarium coeruleum. Plant Pathology 50:489-496.
Delaplace, P., Delory, B.M., Baudson, C., de Cazenave, M.M.S., Spaepen, S., Varin, S.,
Brostaux, Y. and du Jardin, P., (2015). Influence of rhizobacterial volatiles on the root
system architecture and the production and allocation of biomass in the model grass
Brachypodium distachyon (L.) P. Beauv. BMC Plant Biology 15:195.
de la Porte, A., Schmidt, R., Yergeau, É. and Constant, P., (2020). A gaseous milieu:
Extending the boundaries of the rhizosphere. Trends in Microbiology 28:536-542.
de Ronde, D., Butterbach, P. and Kormelink, R., (2014). Dominant resistance against
plant viruses. Frontiers in Plant Science 5:307.
Deshoux, M., Monsion, B. and Uzest, M., (2018). Insect cuticular proteins and their role
in transmission of phytoviruses. Current Opinion in Virology 33:137-143.

134
Dias, A.M., Pareja, M., Laia, M., Blassioli-Moraes, M.C., Borges, M. and Laumann, R.A.,
(2016). Attraction of Telenomus podisi to volatiles induced by Euschistus heros in three
different plant species. Arthropod-Plant Interactions 10:419-428.
Dietzgen, R.G., Mann, K.S. and Johnson, K.N., (2016). Plant–virus interactions: current
and potential future research directions. Viruses 8:303.
Doheny-Adams, T., Barker, A., Lilley, C.J., Wade, R.N., Ellis, S., Atkinson, H.J., Urwin,
P.E., Redeker, K.R. and Hartley, S.E., (2018). Potential isothiocyanate release remains
constant across biofumigant seeding rates. Journal of Agricultural and Food Chemistry
66:5108-5116.
Dolenc, J., Vilhar, B. and Dermastia, M., (2000). Systemic infection with potato virus Y
alters the structure and activity of the shoot apical meristem in a susceptible potato
cultivar. Physiological and Molecular Plant Pathology 56:33-38.
Döring, T.F. and Chittka, L., (2007). Visual ecology of aphids – a critical review on the
role of colours in host finding. Arthropod-Plant Interactions 1:3-16.
Du, J., Rietman, H. and Vleeshouwers, V.G., (2014). Agroinfiltration and PVX
agroinfection in potato and Nicotiana benthamiana. Journal of Visualized Experiments
83:e50971.
Du, X., Witzgall, P., Wu, K., Yan, F., Ma, C., Zheng, H., Xu, F., Ji, G. and Wu, X.,
(2018). Volatiles from Prunus persica flowers and their correlation with flower-visiting
insect community in Wanbailin Ecological Garden, China. Advances in Entomology 6:116-
133.
Duarte, I.M., Almeida, M.T.M., Duarte, M.M., Brown, D.J.F. and Neilson, R., (2011).
Molecular diagnosis of trichodorid species from Portugal. Plant Pathology 60:586-594.
Dudareva, N., Klempien, A., Muhlemann, J.K. and Kaplan, I., (2013). Biosynthesis,
function and metabolic engineering of plant volatile organic compounds. New Phytologist
198:16-32.
Dudareva, N., Negre, F., Nagegowda, D.A. and Orlova, I., (2006). Plant volatiles: recent
advances and future perspectives. Critical Reviews in Plant Sciences 25:417-440.
Durenne, B., Blondel, A., Druart, P. and Fauconnier, M.L., (2018). A laboratory high‐
throughput glass chamber using dynamic headspace TD‐GC/MS method for the
analysis of whole Brassica napus L. plantlet volatiles under cadmium‐related abiotic
stress. Phytochemical Analysis 29:463-471.
Durenne, B., Blondel, A., Druart, P. and Fauconnier, M.L., (2019). Epoxiconazole
exposure affects terpenoid profiles of oilseed rape plantlets based on a targeted
metabolomic approach. Environmental Science and Pollution Research 26:17362-17372.
Eigenbrode, S.D., Birch, A.N.E., Lindzey, S., Meadow, R. and Snyder, W.E., (2016). A
mechanistic framework to improve understanding and applications of push‐pull
systems in pest management. Journal of Applied Ecology 53:202-212

135
Eigenbrode, S.D., Bosque-Pérez, N.A. and Davis, T.S., (2018). Insect-borne plant
pathogens and their vectors: ecology, evolution, and complex interactions. Annual
Review of Entomology 63:169-191.
El-Hamawi, M.H., Youssef, M.M.A. and Zawam, H.S., (2004). Management of
Meloidogyne incognita, the root-knot nematode, on soybean as affected by marigold and sea
ambrosia (damsisa) plants. Journal of Pest Science 77:95-98.
Elwell, A.L., Gronwall, D.S., Miller, N.D., Spalding, E.P. and Durham Brooks, T.L.,
(2011). Separating parental environment from seed size effects on next generation
growth and development in Arabidopsis. Plant, Cell & Environment 34(2):291-301.
Engelberth, J., (2020). Primed to grow: a new role for green leaf volatiles in plant stress
responses. Plant Signaling & Behavior 15:art. no. 1701240.
Ens, E.J., Bremner, J.B., French, K. and Korth, J., (2009). Identification of volatile
compounds released by roots of an invasive plant, bitou bush (Chrysanthemoides monilifera
spp. rotundata), and their inhibition of native seedling growth. Biological Invasions 11:275-
287.
Faget, M., Liedgens, M., Stamp, P., Flütsch, P. and Herrera, J.M., (2010). A minirhizotron
imaging system to identify roots expressing the green fluorescent protein. Computers and
Electronics in Agriculture 74:163-167.
Farnier, K., Bengtsson, M., Becher, P.G., Witzell, P., Witzell, S. and Manduric, S., (2012).
Novel bioassay demonstrates attraction of the white potato cyst nematode Globodera
pallida Stone to non-volatile and volatile host plant cues. Journal of Chemical Ecology
38:795-801.
Fereres, A. and Moreno, A., (2009). Behavioural aspects influencing plant virus
transmission by homopteran insects. Virus Research 141:158-168.
Fereres, A., Peñaflor, M.F.G., Favaro, C.F., Azevedo, K.E., Landi, C.H., Maluta, N.K.,
Bento, J.M.S. and Lopes, J.R., (2016). Tomato infection by whitefly-transmitted
circulative and non-circulative viruses induce contrasting changes in plant volatiles and
vector behaviour. Viruses 8:225.
Fernández‐Calvino, L., Guzmán‐Benito, I., Del Toro, F.J., Donaire, L., Castro‐Sanz,
A.B., Ruíz‐Ferrer, V. and Llave, C., (2016). Activation of senescence‐associated Dark‐
inducible (DIN) genes during infection contributes to enhanced susceptibility to plant
viruses. Molecular plant pathology 17:3-15.
Fernández-Calvino, L., Osorio, S., Hernández, M.L., Hamada, I.B., del Toro, F.J.,
Donaire, L., Yu, A., Bustos, R., Fernie, A.R., Martinez-Rivas, J.M. and Llave, C., (2014).
Virus-induced alterations in primary metabolism modulate susceptibility to Tobacco
rattle virus in Arabidopsis. Plant Physiology 166:1821-1838.
136
Fernando, W.D., Ramarathnam, R., Krishnamoorthy, A.S. and Savchuk, S.C., (2005).
Identification and use of potential bacterial organic antifungal volatiles in biocontrol.
Soil Biology and Biochemistry 37:955-964.
Feussner, I. and Wasternack, C., (2002). The lipoxygenase pathway. Annual Review of
Plant Biology 53:275-297.
Field, B., Jordán, F. and Osbourn, A., (2006). First encounters – deployment of
defence‐related natural products by plants. New Phytologist 172:193-207.
Fincheira, P., Venthur, H., Mutis, A., Parada, M. and Quiroz, A., (2016). Growth
promotion of Lactuca sativa in response to volatile organic compounds emitted from
diverse bacterial species. Microbiological Research 193:39-47.
Flis, B., Hennig, J., Strzelczyk-Żyta, D., Gebhardt, C. and Marczewski, W., (2005). The
Ry-f sto gene from Solanum stoloniferum for extreme resistant to potato virus Y maps to
potato chromosome XII and is diagnosed by PCR marker GP122 718 in PVY resistant
potato cultivars. Molecular Breeding 15:95-101.
Fox, J. and Weisberg S., (2019). An R Companion to Applied Regression. 3rd ed. Thousand
Oaks: Sage. Available at: https://socialsciences.mcmaster.ca/jfox/Books/Companion/.
Fraile, A., McLeish, M.J., Pagán, I., González-Jara, P., Piñero, D. and García-Arenal, F.,
(2017). Environmental heterogeneity and the evolution of plant-virus interactions:
viruses in wild pepper populations. Virus Research 241:68-76.
Gallet, R., Michalakis, Y. and Blanc, S., (2018). Vector-transmission of plant viruses and
constraints imposed by virus–vector interactions. Current Opinion in Virology 33:144-150.
Gallitelli, D., (2000). The ecology of Cucumber mosaic virus and sustainable agriculture.
Virus Research 71:9-21.
Gamalero, E., Martinotti, M.G., Trotta, A., Lemanceau, P. and Berta, G., (2002).
Morphogenetic modifications induced by Pseudomonas fluorescens A6RI and Glomus
mosseae BEG12 in the root system of tomato differ according to plant growth
conditions. New Phytologist 155(2):293-300.
Garbaczewska, G., Otulak, K., Chouda, M. and Chrzanowska, M., (2012).
Ultrastructural studies of plasmodesmatal and vascular translocation of Tobacco rattle
virus (TRV) in tobacco and potato. Acta Physiologiae Plantarum 34:1229-1238
Gaugler, R., Lebeck, L., Nakagaki, B. and Boush, G.M., (1980). Orientation of the
entomogenous nematode Neoaplectana carpocapsae to carbon dioxide. Environmental
Entomology 9:649-652.
Ghazala, W. and Varrelmann, M., (2007). Tobacco rattle virus 29K movement protein is
the elicitor of extreme and hypersensitive-like resistance in two cultivars of Solanum
tuberosum. Molecular Plant-Microbe Interactions 20:1396-1405.
Gigot, C., Ongena, M., Fauconnier, M.L., Wathelet, J.P., Du Jardin, P. and Thonart, P.,
(2010). The lipoxygenase metabolic pathway in plants: potential for industrial
137
production of natural green leaf volatiles. Biotechnology, Agronomy, Society & Environment
14(3):451-460.
Goodin, M.M., Zaitlin, D., Naidu, R.A. and Lommel, S.A., (2008). Nicotiana benthamiana:
its history and future as a model for plant-pathoden interactions. Molecular Plant-Microbe
Interactions 21:1015-1026.
Goulden, M.G., Lomonossoff, G.P., Davies, J.W. and Wood, K.R., (1990). The complete
nucleotide sequence of PEBV RNA2 reveals the presence of a novel 235 open reading
frame and provides insights into the structure of tobraviral subgenomic promoters.
Nucleic Acids Research 18:4507-4512
Graves, W.R., (1992). Influence of hydroponic culture method on morphology and
hydraulic conductivity of roots of honey locust. Tree Physiology 11:205-211.
Greco, A., (2009). Involvement of the nucleolus in replication of human viruses. Reviews
in Medical Virology 19:201-214.
Griñán, I., Galindo, A., Rodriguez, P., Morales, D., Corell, M., Centeno, A., Collado-
Gonzalez, J., Torrecillas, A., Carbonell-Barrachina, A.A. and Hernández, F., (2019).
Volatile composition and sensory and quality attributes of quince (Cydonia oblonga Mill.)
fruits as affected by water stress. Scientia Horticulturae 244:68-74.
Groen, S.C., Jiang, S., Murphy, A.M., Cunniffe, N.J., Westwood, J.H., Davey, M.P., Bruce,
T.J., Caulfield, J.C., Furzer, O.J. and Reed, A., (2016). Virus infection of plants alters
pollinator preference: a payback for susceptible hosts? PLoS Pathogens 12:e1005790.
Gross, J., Gallinger, J. and Rid, M., (2019). ‘Collection, identification, and statistical
analysis of volatile organic compound patterns emitted by phytoplasma infected plants’,
in Musetti, R. and Pagliari, L., (eds.) Phytoplasmas:333-343. New York: Humana Press.
Hallem, E.A., Dillman, A.R., Hong, A.V., Zhang, Y.J., Yano, J.M., Demarco, S.F. and
Sternberg, P.W., (2011). A sensory code for host seeking in parasitic nematodes. Current
Biology 21:377-383.
Hamelin, F.M., Allen, L.J.S., Prendeville, H.R., Hajimorad, M.R. and Jeger, M.J., (2016).
The evolution of plant virus transmission pathways. Journal of Theoretical Biology 396:75-
89.
Hammack, L., (2001). Single and blended maize volatiles as attractants for diabroticite
corn rootworm beetles. Journal of Chemical Ecology 27:1373-1390.
Hammerbacher, A., Coutinho, T.A. and Gershenzon, J., (2019). Roles of plant volatiles
in defence against microbial pathogens and microbial exploitation of volatiles. Plant, Cell
& Environment 42:2827-2843.
Harrison, B.D., (1968). Reactions of some old and new British potato cultivars to
Tobacco rattle virus. European Potato Journal 11:165-176.
138
Harrison, B.D. and Robinson, D.J., (1978). ‘The tobraviruses’ in Bang, F.B., Lauffer,
M.A., Maramorosch, K. and Smith, K.M., (eds.) Advances in Virus Research 23:25-77. San
Diego: Academic Press.
Heil, M. and Bueno, J.C.S., (2007). Within-plant signaling by volatiles leads to induction
and priming of an indirect plant defense in nature. Proceedings of the National Academy of
Sciences 104:5467-5472.
Hernández, C., Carette, J.E., Brown, D.J. and Bol, J.F., (1996). Serial passage of
Tobacco rattle virus under different selection conditions results in deletion of structural
and nonstructural genes in RNA 2. Journal of Virology 70:4933-4940.
Hernández, C., Mathis, A., Brown, D.J. and Bol, J.F., (1995). Sequence of RNA 2 of a
nematode-transmissible isolate of Tobacco rattle virus. Journal of General Virology
76:2847-2851.
Hernández, C., Visser, P.B., Brown, D.J. and Bol, J.F., (1997). Transmission of Tobacco
rattle virus isolate PpK20 by its nematode vector requires one of the two non-structural
genes in the viral RNA 2. Journal of General Virology 78:465-467.
Hetrick, B.A.D., (1991). Mycorrhizas and root architecture. Experientia 47:355-362.
Hewitt, W.B., Raski, D.J. and Goheen, A.C., (1958). Nematode vector of soil-borne
virus of grapevines. Phytopathology 48:586-595.
Hilliard, M.A., Bargmann, C.I. and Bazzicalupo, P., (2002). C. elegans responds to
chemical repellents by integrating sensory inputs from the head and the tail. Current
Biology 12:730-734.
Hillocks, R.J., (2012). Farming with fewer pesticides: EU pesticide review and resulting
challenges for UK agriculture. Crop Protection 31:85-93.
Hiltpold, I., Erb, M., Robert, C.A. and Turlings, T.C., (2011). Systemic root signalling in
a belowground, volatile‐mediated tritrophic interaction. Plant, Cell & Environment
3:1267-1275.
Himmelbauer, M.L., (2004). Estimating length, average diameter and surface area of
roots using two different image analyses systems. Plant and Soil 260:111-120.
Hiscox, J.A., (2007). RNA viruses: hijacking the dynamic nucleolus. Nature Reviews
Microbiology 5:119-127.
Hishi, T., Tateno, R., Fukushima, K., Fujimaki, R., Itoh, M., Tokuchi, N. and Näsholm,
T., (2017). Changes in the anatomy, morphology and mycorrhizal infection of fine root
systems of Cryptomeria japonica in relation to stand ageing. Tree Physiology 37:61-70.
Hodge, A., (2004). The plastic plant: root responses to heterogeneous supplies of
nutrients. The New Phytologist 162:9-24.
139
Hodge, S. and Powell, G., (2008). Do plant viruses facilitate their aphid vectors by
inducing symptoms that alter behaviour and performance? Environmental Entomology
37:1573-1581.
Hogenhout, S.A., Ammar el, D., Whitfield, A.E. and Redinbaugh, M.G., (2008). Insect
vector interactions with persistently transmitted viruses. Annual Review of Phytopathology
46:327-359
Hogenhout, S.A., Van der Hoorn, R.A., Terauchi, R. and Kamoun, S., (2009). Emerging
concepts in effector biology of plant-associated organisms. Molecular Plant-Microbe
Interactions 22:115-122.
Hokkanen, H.T., (1991). Trap cropping in pest management. Annual Review of
Entomology 36:119-138.
Holeva, R.C. and MacFarlane, S.A., (2006). Yeast two-hybrid study of Tobacco rattle
virus coat protein and 2b protein interactions. Archives of Virology 151:2123-2132.
Holeva, R., Phillips, M.S., Neilson, R., Brown, D.J.F., Young, V., Boutsika, K. and Blok,
V.C., (2006). Real-time PCR detection and quantification of vector trichodorid
nematodes and Tobacco rattle virus. Molecular and Cellular Probes 20:203-211.
Holopainen, J.K. and Gershenzon, J., (2010). Multiple stress factors and the emission of
plant VOCs. Trends in Plant Science 15:176-184.
Holsters, M., Silva, B., Van Vliet, F., Genetello, C., de Block, M., Dhaese, P., Depicker,
A., Inze, D., Engler, J., Villarroel, R., Van Montagu, M. and Schell, J., (1980). The
functional organization of the nopaline A. tumefaciens plasmid pTiC58. Plasmid 3:212-
230.
Holterman, M., van der Wurff, A., van der Elsen, S., van Megen, H., Bongers, T.,
Holovachov, O., Bakker, J. and Helder, J., (2006). Phylum wide analysis of SSU rDNA
reveals deep phylogenetic relationships among nematodes and accelerated evolution
toward crown clades. Molecular Biology and Evolution 23:1792-1800.
Hu, L., Mateo, P., Ye, M., Zhang, X., Berset, J.D., Handrick, V., Radisch, D., Grabe, V.,
Köllner, T.G., Gershenzon, J. and Robert, C.A.M., (2018). Plant iron acquisition strategy
exploited by an insect herbivore. Science 361:694-697.
Huang, W., Gfeller, V. and Erb, M., (2019). Root volatiles in plant–plant interactions II:
root volatiles alter root chemistry and plant–herbivore interactions of neighbouring
plants. Plant, Cell & Environment 42:1964-1973.
Ibrahim, A., Yang, X., Liu, C., Cooper, K.D., Bishop, B.A., Zhu, M., Kwon, S., Schoelz,
J.E. and Nelson, R.S., (2020). Plant SNAREs SYP22 and SYP23 interact with Tobacco
mosaic virus 126 kDa protein and SYP2s are required for normal local virus
accumulation and spread. Virology 547:57-71.
140
Ingham, R.E., Hamm, P.B., Baune, M. and Merrifield, K.J., (2007). Control of
Paratrichodorus allius and Corky ringspot disease in potato with shank-injected metam
sodium. Journal of Nematology 39:258-262.
Ingham, R.E., Hamm, P.B., Willams, R.E. and Swanson, W.H., (2000). Control of
Paratrichodorus allius and Corky ringspot disease of potato in the Columbia Basin of
Oregon. Journal of Nematology 32:566.
Ingwell, L.L., Eigenbrode, S.D. and Bosque-Pérez, N.A., (2012). Plant viruses alter
insect behavior to enhance their spread. Scientific Reports 2:1-6.
Jassbi, A.R., Zamanizadehnajari, S. and Baldwin, I.T., (2010). Phytotoxic volatiles in the
roots and shoots of Artemisia tridentataas detected by headspace solid-phase
microextraction and gas chromatographic-mass spectrometry analysis. Journal of
Chemical Ecology 36:1398-1407.
Johkan, M., Shoji, K., Goto, F., Hashida, S. and Yoshihara, T., (2010). Blue light-emitting
diode light irradiation of seedlings improves seedling quality and growth after
transplanting in red leaf lettuce. HortScience 45(12):1809-1814.
Johnson, M.G., Rygiewicz, P.T., Tingey, D.T. and Phillips, D.L., (2006). Elevated CO2
and elevated temperature have no effect on Douglas‐fir fine‐root dynamics in nitrogen‐
poor soil. New Phytologist 170:345-356.
Johnson, S.N. and Nielsen, U.N., (2012). Foraging in the dark – chemically mediated
host plant location by belowground insect herbivores. Journal of Chemical Ecology 38:604-
614.
Jones, F.G.W., Larbey, D.W. and Parrott, D.M., (1969). The influence of soil structure
and moisture on nematodes, especially Xiphinema, Longidorus, Trichodorus and Heterodera
spp. Soil Biology & Biochemistry 1:153-165.
Jones, G.M., (1979). The development of amphids and amphidial glands in
adult Syngamus trachea (Nematoda: Syngamidae). Journal of Morphology 160:299-321.
Jones, J., (2002). ‘Nematode sense organs’ in Lee, D.L., (ed.) The Biology of
Nematodes:369-387. New York: Taylor & Francis.
Joo, Y., Schuman, M.C., Goldberg, J.K., Wissgott, A., Kim, S.-G. and Baldwin, I.T.
(2019). Herbivory elicits changes in green leaf volatile production via jasmonate
signaling and the circadian clock. Plant, Cell & Environment 42:972-982.
Kalinina, N.O., Makarova, S., Makhotenko, A., Love, A.J. and Taliansky, M., (2018).
The multiple functions of the nucleolus in plant development, disease and stress
responses. Frontiers in Plant Science 9:132.
Karanastasi, E., Wyss, U. and Brown, D.J.F., (2003). An in vitro examination of the
feeding behaviour of Paratrichodorus anemones (Nematoda: Trichodoridae), with
comments on the ability of the nematode to acquire and transmit tobravirus particles.
Nematology 5:421-434.
141
Karban, R., Shiojiri, K., Huntzinger, M. and McCall, A.C., (2006). Damage‐induced
resistance in sagebrush: volatiles are key to intra‐and interplant
communication. Ecology 87:922-930.
Karmakar, A., Mitra, S. and Barik, A., (2018). Systemically released volatiles from Solena
amplexicaulis plant leaves with color cues influencing attraction of a generalist insect
herbivore. International Journal of Pest Management 64:210-220.
Kergunteuil, A., Descombes, P., Glauser, G., Pellissier, L. and Rasmann, S., (2018). Plant
physical and chemical defence variation along elevation gradients: a functional trait-
based approach. Oecologia 187:561-571.
Kergunteuil, A., Humair, L., Maire, A.L., Moreno-Aguilar, M.F., Godschalx, A., Catalán,
P. and Rasmann, S., (2020). Tritrophic interactions follow phylogenetic escalation and
climatic adaptation. Scientific Reports 10:1-10.
Kergunteuil, A., Röder, G. and Rasmann, S., (2019). Environmental gradients and the
evolution of tri‐trophic interactions. Ecology Letters 22:292-301.
Kerry, B., Barker, A. and Evans, K., (2003). Investigation of potato cyst nematode control
(Review commissioned by Defra under contract no. HH311TPO). UK: Department for
Environment, Food & Rural Affairs (DEFRA).
Kersch-Becker, M.F. and Thaler, J.S., (2014). Virus strains differentially induce plant
susceptibility to aphid vectors and chewing herbivores. Oecolegeia 174:883-892.
Khaki, A., Raza, S.H.A., Khan, R., Hao, L., Hosseini, S.M., Abdelgayed, S.S. and Kakar,
M.U., (2017). Epidemiological and pathological studies on the helminthic parasites in
native chickens of Tabriz city, Iran. Genetics and Molecular Research 16:art. no. 16039824.
Khedive, E., Shirvany, A., Assareh, M.H. and Sharkey, T.D., (2017). In situ emission of
BVOCs by three urban woody species. Urban Forestry & Urban Greening 21:153-157.
Kim, Y.H. and Kim, K.H., (2012). Effect of standard phase differences between gas
and liquid and the resulting experimental bias in the analysis of gaseous volatile organic
compounds. Analytica Chimica Acta 714:98-103.
King, A.M.Q., Lefkowitz, E., Adams, M.J. and Carstens, E.B., (eds.) (2011). Virus
Taxonomy: Ninth Report of the International Committee on Taxonomy of Viruses. USA:Elsevier
Academic Press.
Kleiber, C. and Zeileis, A., (2008). Applied Econometrics with R. New York: Springer-
Verlag. Available at: https://CRAN.R-project.org/package=AER/.
Koenig, R., Hilbrich, I. and Lindner, K.., (2016). Molecular characterization of a new
Tobacco rattle virus (TRV) RNA2 and identification of different TRV RNA1/RNA2
pairings in various potato-growing areas in Germany. Archives of Virology 161:693-697.
Kollmann, J., Bañuelos, M.J. and Nielsen, S.L., (2007). Effects of virus infection on
growth of the invasive alien Impatiens glandulifera. Preslia 79:33-44.
142
Kratsch, H.A., Graves, W.R. and Gladon, R.J., (2006). Aeroponic system for control of
root-zone atmosphere. Environmental and Experimental Botany 55:70-76.
Krips, O.E., Willems, P.E.L., Gols, R., Posthumus, M.A., Gort, G. and Dicke, M.,
(2001). Comparison of cultivars of ornamental crop Gerbera jamesonii on production of
spider mite-induced volatiles, and their attractiveness to the predator, Phytoseiulus
persimilis. Journal of Chemical Ecology 27:1355-1372.
Kruskal, W.H. and Wallis, W.A., (1952). Use of ranks in one-criterion variance
analysis. Journal of the American Statistical Association 47:583-621.
Kuhns, E.H., Tribuiani, Y., Martini, X., Meyer, W.L., Peña, J., Hulcr, J. and Stelinski,
L.L., (2014). Volatiles from the symbiotic fungus Raffaelea lauricola are synergistic with
manuka lures for increased capture of the redbay ambrosia beetle Xyleborus
glabratus. Agricultural and Forest Entomology 16:87-94.
Lan, H., Lai, B., Zhao, P., Dong, X., Wei, W., Ye, Y. and Wu, Z., (2020). Cucumber
mosaic virus infection modulated the phytochemical contents of Passiflora edulis.
Microbial Pathogenesis 138:art. no. 103828.
Landoni, M., Puglisi, D., Cassani, E., Borlini, G., Brunoldi, G., Comaschi, C. and Pilu,
R., (2020). Phlobaphenes modify pericarp thickness in maize and accumulation of the
fumonisin mycotoxins. Scientific Reports 10:art. no. 1417.
Lawo, N.C., Weingart, G.J., Schuhmacher, R. and Forneck, A., (2011). The volatile
metabolome of grapevine roots: first insights into the metabolic response upon
phylloxera attack. Plant Physiology and Biochemistry 49:1059-1063.
Laznik, Ž. and Trdan, S., (2016). ‘The role of volatile substances emitted by cultivated
plant's roots in indirect defense against soil herbivores’ in Trdan, S., (ed.) Insecticides
Resistance. IntechOpen.
Lefeuvre, P., Martin, D.P., Elena, S.F., Shepherd, D.N., Roumagnac, P. and Varsani A.,
(2019). Evolution and ecology of plant viruses. Nature Reviews Microbiology 17:632–644.
Legarrea, S., Barman, A., Marchant, W., Diffie, S. and Srinivasan, R., (2015). Temporal
effects of a begomovirus infection and host plant resistance on the preference and
development of an insect vector, Bemisia tabaci, and implications for epidemics. PLoS
One 10:e0142114.
Lenth, R.V., (2021). emmeans: Estimated Marginal Means, aka Least-Squares Means. R
package version 1.7.0. Available at: https://CRAN.R-project.org/package=emmeans/.
Li, L., Li, S.M., Sun, J.H., Zhou, L.L., Bao, X.G., Zhang, H.G. and Zhang, F.S., (2007).
Diversity enhances agricultural productivity via rhizosphere phosphorus facilitation on
phosphorus-deficient soils. Proceedings of the National Academy of Sciences 104:11192-11196.
Li, Y., Cui, H., Cui, X. and Wang, A., (2016). The altered photosynthetic machinery
during compatible virus infection. Current Opinion in Virology 17:19-24.
143
Liang, P. and Pardee, A.B., (1992). Differential display of eukaryotic messenger RNA by
means of the polymerase chain reaction. Science 257:967‐971.
Lindner, K., Hilbrich, I. and Koenig, R., (2018). Molecular characterization of variants
of a new ‘rule-breaking’ Tobacco rattle virus RNA2 in potatoes. Virus Research 244:270-
275.
Lister, R.M., (1964). Strawberry latent ringspot: a nematode borne virus. Annals of
Applied Biology 59:49-62.
Liu, D., Shi, L., Han, C., Yu, J., Li, A. and Zhang, Y., (2012). Validation of reference
genes for gene expression studies in virus infected Nicotiana benthamiana using
quantitative real time PCR. PLoS One 7:e0046451.
Liu, H., Shi, Z., Li, J., Zhao, P., Qin, S. and Nie, Z., (2018). The impact of phosphorus
supply on selenium uptake during hydroponics experiment of winter wheat (Triticum
aestivum) in China. Frontiers in Plant Science 9:373.
Liu, W., Jones, A.L., Gosse, H.N., Lawrence, K.S. and Park, S.W., (2019). Validation of
the chemotaxis of plant parasitic nematodes toward host root exudates. Journal of
Nematology 51:1-10.
Loreto, F. and Schnitzler, J.P., (2010). Abiotic stresses and induced BVOCs. Trends in
Plant Science 15:154-166.
Love, A.J., Yu, C., Petukhova, N.V., Kalinina, N.O., Chen, J. and Taliansky, M.E.,
(2017). Cajal bodies and their role in plant stress and disease responses. RNA
Biology 14:779-790.
Low, J.C., Wang, N.Y., Williams, J. and Cicerone, R.J., (2003). Measurements of
ambient atmospheric C2H5Cl and other ethyl and methyl halides at coastal California
sites and over the Pacific Ocean. Journal of Geophysical Research: Atmospheres 108:4608.
Lu, W., Wang, X. and Wang, F., (2019). Adaptive minirhizotron for pepper roots
observation and its installation based on root system architecture traits. Plant Methods,
15:art. no. 29.
Lu, W., Wang, X., Wang, F. and Liu, J., (2020). Fine root capture and phenotypic
analysis for tomato infected with Meloidogyne incognita. Computers and Electronics in
Agriculture 173:art. no. 105455.
Ma, J., Chen, S., Moens, M., Han, R. and De Clercq, P., (2013). Efficacy of
entomopathogenic nematodes (Rhabditida: Steinernematidae and Heterorhabditidae)
against the chive gnat, Bradysia odoriphaga. Journal of Pest Science 86:551-561.
Ma, L., Lukasik, E., Gawehns, F. and Takken, F.L., (2012). The use of agroinfiltration
for transient expression of plant resistance and fungal effector proteins in Nicotiana
benthamiana leaves. Methods in Molecular Biology 835:61‐74.
144
Ma, X., Nicole, M.C., Meteignier, L.V., Hong, N., Wang, G. and Moffett, P., (2015).
Different roles for RNA silencing and RNA processing components in virus recovery
and virus-induced gene silencing in plants. Journal of Experimental Botany 66:919-932.
Macey, M.C., Pratscher, J., Crombie, A.T. and Murrell, J.C., (2020). Impact of plants on
the diversity and activity of methylotrophs in soil. Microbiome 8:art. no. 31.
MacFarlane, S.A., (1999). Molecular biology of the tobraviruses. Journal of General
Virology 80:2799-2807.
MacFarlane, S.A., (2003). Molecular determinants of the transmission of plant viruses
by nematodes. Molecular Plant Pathology 4:211-215.
MacFarlane, S.A., (2008). ‘Tobravirus’ in Mahy, B.W.J. and Van Regenmortel, M.H.V.,
(eds.) Encyclopedia of Virology. 3rd ed:72-76. New York: Academic Press.
MacFarlane, S.A., (2010). Tobraviruses – plant pathogens and tools for biotechnology.
Molecular Plant Pathology 11:577-583.
MacFarlane, S.A. and Brown, D.J.F., (1995). Sequence comparison of RNA2 of
nematode-transmissible and nematode-non-transmissible isolates of pea early browning
virus suggests that the gene encoding the 29 kDa protein may be involved in nematode
transmission. Journal of General Virology 76:1299-1304.
MacFarlane, S.A., Brown, D.J. and Bol, J.F., (1995). The transmission by nematodes of
tobraviruses is not determined exclusively by the virus coat protein. European Journal of
Plant Pathology 101:535-539.
MacFarlane, S.A., Vassilakos, N. and Brown, D.J.F., (1999). Similarities in the genome
organization of Tobacco rattle virus and Pea early browning virus isolates that are
transmitted by the same vector nematode. Journal of General Virology 80:273-276.
MacFarlane, S.A., Wallis, C.V. and Brown D.J.F., (1996). Multiple virus genes involved in
the nematode transmission of pea early browning virus. Virology 219:417-422.
Mahattanatawee, K., Perez-Cacho, P.R., Davenport, T. and Rouseff, R., (2007).
Comparison of three lychee cultivar odor profiles using gas chromatography –
olfactometry and gas chromatography – sulfur detection. Journal of Agricultural and Food
Chemistry 55:1939-1944.
Maleita, C., Esteves, I., Chim, R., Fonseca, L., Braga, M.E., Abrantes, I. and de Sousa,
H.C., (2017). Naphthoquinones from walnut husk residues show strong nematicidal
activities against the root-knot nematode Meloidogyne hispanica. ACS Sustainable Chemistry
& Engineering 5:3390-3398.
Malmstrom, C.M. and Alexander, H.M., (2016). Effects of crop viruses on wild plants.
Current Opinion in Virology 19:30-36.
Mangiafico, S., (2021). rcompanion: Functions to Support Extension Education Program
Evaluation. R package version 2.4.1. Available at: https://CRAN.R-
project.org/package=rcompanion/.

145
Markheiser, A., Rid, M., Biancu, S., Gross, J. and Hoffmann, C., (2020). Tracking short-
range attraction and oviposition of European grapevine moths affected by volatile
organic compounds in a four-chamber olfactometer. Insects 11:45.
Martelli, G.P., (2014). Directory of virus and virus-like diseases of the grapevine and
their agents. Journal of Plant Pathology 96:1-136.
Massalha, H., Korenblum, E., Tholl, D. and Aharoni, A., (2017). Small molecules
below‐ground: the role of specialized metabolites in the rhizosphere. The Plant Journal
90:788-807.
Mauck, K.E., (2016). Variation in virus effects on host plant phenotypes and insect
vector behavior: what can it teach us about virus evolution? Current Opinion in Virology
21:114-123.
Mauck, K., Bosque‐Pérez, N.A., Eigenbrode, S.D., De Moraes, C.M. and Mescher,
M.C., (2012). Transmission mechanisms shape pathogen effects on host–vector
interactions: evidence from plant viruses. Functional Ecology 26:1162-1175.
Mauck, K.E., Chesnais, Q. and Shapiro, L.R., (2018). ‘Evolutionary determinants of
host and vector manipulation by plant viruses’ in Malmstrom, C.M., (ed.) Advances in
Virus Research 101:189-250. San Diego: Academic Press.
Mauck, K.E., De Moraes, C.M. and Mescher, M.C., (2010) Deceptive chemical signals
induced by a plant virus attract insect vectors to inferior hosts. Proceedings of the National
Academy of Sciences of the United States of America 107:3600-3605.
Mauck, K.E., De Moraes, C.M. and Mescher, M.C., (2014). Evidence of local adaptation
in plant virus effects on host–vector interactions. American Zoologist 54:193-209.
McArthur, C., Finnerty, P.B., Schmitt, M.H., Shuttleworth, A. and Shrader, A.M.,
(2019). Plant volatiles are a salient cue for foraging mammals: elephants target preferred
plants despite background plant odour. Animal Behaviour 155:199-216.
McCallum, E.J., Anjanappa, R.B. and Gruissem, W., (2017). Tackling agriculturally
relevant diseases in the staple crop cassava (Manihot esculenta). Current Opinion in Plant
Biology 38:50-58.
McCallum, M.E. and Dusenbery, D.B., (1992). Computer tracking as a behavioral GC
detector: nematode responses to vapor of host roots. Journal of Chemical Ecology 18:585-
592.
McMenemy, L.S., Hartley, S.E., MacFarlane, S.A., Karley, A.J., Shepherd, T. and
Johnson, S.N., (2012). Raspberry viruses manipulate the behaviour of their insect
vectors. Entomologia Experimentalis et Applicata 144:56-68.
Medina-Ortega, K.J., Bosque-Perez, N.A., Ngumbi, E., Jiménez-Martínez, E.S. and
Eigenbrode, S.D., (2009). Rhopalosiphum padi (Hemiptera: Aphididae) responses to
volatile cues from Barley yellow dwarf virus-infected wheat. Environmental Entomology
38:836-845.

146
Met, A. and Yeşilçubuk, N.Ş., (2017). Comparison of two volatile sampling techniques
based on different loading factors in determination of volatile organic compounds
released from spoiled raw beef. Food Analytical Methods 10:2311-2324.
Metlen, K.L., Aschehoug, E.T. and Callaway, R.M., (2009). Plant behavioural ecology:
dynamic plasticity in secondary metabolites. Plant, Cell & Environment 32:641-653.
Michereff, M.F., Magalhães, D.M., Hassemer, M.J., Laumann, R.A., Zhou, J.J., Paulo,
E.D.A., Viana, P.A., Paulo, E.D.O., Schimmelpfeng, P.H., Borges, M. and Pickett, J.A.,
(2019). Variability in herbivore-induced defence signalling across different maize
genotypes impacts significantly on natural enemy foraging behaviour. Journal of Pest
Science 92:723-736.
Midgley, J.J., White, J.D., Johnson, S.D. and Bronner, G.N., (2015). Faecal mimicry by
seeds ensures dispersal by dung beetles. Nature Plants 1:1-3.
Miller, W.A. and Rasochová, L., (1997). Barley yellow dwarf viruses. Annual Review of
Phytopathology 35:167-190.
Mitra, S., Karmakar, A., Das, S. and Barik, A., (2020). Attraction of the potential
biocontrol agent Altica cyanea by volatile compounds of three species of Ludwigia weeds
from rice fields. Entomologia Experimentalis et Applicata 168:91-104.
Mojtahedi, H., Boydston, R.A., Thomas, P.E., Crosslin, J.M., Santo, G.S., Riga, E. and
Anderson, T.L., (2003). Weed hosts of Paratrichodorus allius and Tobacco rattle virus in
the Pacific Northwest. American Journal of Potato Research 80:379-385.
Mok, D.W.S. and Mok, M.C., (2001). Cytokinin metabolism and action. Annual Review of
Plant Physiology and Plant Molecular Biology 52:89-118.
Mondal, S., Sarkar, P., Singh, A., Khan, M.R. and Mukherjee, A., (2019). Distribution
and community structure of plant-parasitic nematodes and their relationship with some
soil properties in betel vine-growing regions of West Bengal, India. Nematology 21:581-
595.
Moreno, A.B. and López-Moya, J.J., (2020). When viruses play team sports: Mixed
infections in plants. Phytopathology 110:29-48.
Moritz, G., Kumm, S. and Mound, LA., (2004). Tospovirus transmission depends on
thrips ontogeny. Virus Research 100:143-149.
Movafeghi, A., Djozan, D.J. and Torbati, S., (2010). Solid-phase microextraction of
volatile organic compounds released from leaves and flowers of Artemisia fragrans,
followed by GC and GC/MS analysis. Natural Product Research 24:1235-1242.
Mozūraitis, R., Hall, D., Trandem, N., Ralle, B., Tunström, K., Sigsgaard, L., Baroffio,
C., Fountain, M., Cross, J., Wibe, A. and Borg-Karslson, A.-K., (2020). Composition of
strawberry floral volatiles and their effects on behavior of strawberry blossom weevil,
Anthonomus rubi. Journal of Chemical Ecology 46:1069–1081.

147
Mwando, N.L., Tamiru, A., Nyasani, J.O., Obonyo, M.A.O., Caulfield, J.C., Bruce,
T.J.A. and Subramanian, S., (2018). Maize chlorotic mottle virus induces changes in host
plant volatiles that attract vector thrips species. Journal of Chemical Ecology 44:681-689.
Nakamura, S. and Hatanaka, A., (2002). Green-leaf-derived C6-aroma compounds with
potent antibacterial action that act on both gram-negative and gram-positive
bacteria. Journal of Agricultural and Food Chemistry 50:7639-7644.
Nalli, S., Horn, O.J., Grochowalski, A.R., Cooper, D.G. and Nicell, J.A., (2006). Origin
of 2-ethylhexanol as a VOC. Environmental Pollution 140:181-185.
Nath, V.S., Shrestha, A., Awasthi, P., Mishra, A.K., Kocábek, T., Matoušek, J., Sečnik,
A., Jakše, J., Radišek, S. and Hallan, V., (2020). Mapping the gene expression spectrum
of mediator subunits in response to viroid infection in plants. International Journal of
Molecular Sciences 21:art. no. 2498.
Naznin, H.A., Kiyohara, D., Kimura, M., Miyazawa, M., Shimizu, M. and Hyakumachi,
M., (2014). Systemic resistance induced by volatile organic compounds emitted by plant
growth-promoting fungi in Arabidopsis thaliana. PLoS One 9:e86882.
Neilson, R., (2016). Carrots & Parsnips - Developing a strategy to control free living nematodes.
AHDB Knowledge Exchange Report. Available at:
https://projectblue.blob.core.windows.net/media/Default/Research%20Papers/Hortic
ulture/FV%20447_Report_Final_2016.pdf.
Neupane, S., Mathew, F.M., Varenhorst, A.J. and Nepal, M.P., (2019). Transcriptome
profiling of interaction effects of soybean cyst nematodes and soybean aphids on
soybean. Scientific Data 6:1-8.
Ng, J.C. and Falk, B.W., (2006). Virus–vector interactions mediating nonpersistent and
semipersistent transmission of plant viruses. Annual Review of Phytopathology 44:183-212.
Ngumbi, E., Eigenbrode, S.D., Bosque-Pérez, N.A., Ding, H. and Rodriguez, A.,
(2007). Myzus persicae is arrested more by blends than by individual compounds elevated
in headspace of PLRV-infected potato. Journal of Chemical Ecology 33:1733-1747.
O’Halloran, D.M. and Burnell, A.M., (2003). An investigation of chemotaxis in the
insect parasitic nematode Heterorhabditis bacteriophora. Parasitology 127:375-385.
Oliveira-Hofman, C., Kaplan, F., Stevens, G., Lewis, E.E., Wu, S., Alborn, H.T., Perret-
Gentil, A. and Shapiro-Ilan, D., (2019). ‘Pheromone-mediated behavioural manipulation
of entomopathogenic nematodes to improve biocontrol efficacy’, Entomology 2019. St
Louis, 17-20 November. Entomological Society of America.
Oota, M., Tsai, A.Y.L., Aoki, D., Matsushita, Y., Toyoda, S., Fukushima, K., Saeki, K.,
Toda, K., Perfus-Barbeoch, L., Favery, B. and Ishikawa, H., (2019). Identification of
naturally-occurring polyamines as nematode Meloidogyne incognita attractants. Molecular
Plant 13:658-665.
148
Otulak, K., Chouda, M., Chrzanowska, M. and Garbaczewska, G., (2012).
Ultrastructural effects of infection caused by Tobacco rattle virus transmitted by
Trichodorus primitivus in potato and tobacco tissues. Canadian Journal of Plant
Pathology 34:126-138.
Owino, P.O., (1992). Effect of marigold leaf extract and captafol on fungal parasitism
of root knot nematode eggs—Kenyan isolates. Nematologia Mediterranea 20:211-213.
Palma, R., Mutis, A., Manosalva, L., Ceballos, R. and Quiroz, A., (2012). Behavioral and
electrophysiological responses of Hylastinus obscurus to volatiles released from the roots
of Trifolium pratense L. Journal of Soil Science and Plant Nutrition 12:183-193.
Pearson, K., (1985). Notes on regression and inheritance in the case of two parents.
Proceedings of the Royal Society of London 58:240-242.
Penaflor, M.F.G.V., Erb, M., Robert, C.A.M., Miranda, L.A., Werneburg, A.G., Dossi,
F.C.A., Turlings, T.C. and Bento, J.M.S., (2011). Oviposition by a moth suppresses
constitutive and herbivore-induced plant volatiles in maize. Planta 234:207-215.
Peñuelas, J., Asensio, D., Tholl, D., Wenke, K., Rosenkranz, M., Piechulla, B. and
Schnitzler, J.P., (2014). Biogenic volatile emissions from the soil. Plant, Cell &
Environment 37:1866-1891.
Pereira, A.L., Figueiredo, A.C., Barroso, J.G., Pedro, L.G. and Carrapiço, F., (2009).
Volatile compounds from the symbiotic system Azolla filiculoides–Anabaena azollae
bacteria. Plant Biosystems 143:268-274.
Perry, K.L., Kolb, F.L., Sammons, B., Lawson, C., Cisar, G. and Ohm, H., (2000). Yield
effects of Barley yellow dwarf virus in soft red winter wheat. Phytopathology 90:1043-
1048.
Phillips, M., (1997). Method for the collection and assay of volatile organic compounds
in breath. Analytical Biochemistry 247:272-278.
Pickett, J.A., Aradottir, G.I., Birkett, M.A., Bruce, T.J.A., Chamberlain, K., Khan, Z.R.,
Midega, C.A.O., Smart, L.E. and Woodcock, C.M., (2012). Aspects of insect chemical
ecology: exploitation of reception and detection as tools for deception of pests and
beneficial insects. Physiological Entomology 37:2-9.
Pickett, J.A. and Khan, Z.R., (2016). Plant volatile‐mediated signalling and its
application in agriculture: successes and challenges. New Phytologist 212:856-870
Pierret, A., Gonkhamdee, S., Jourdan, C. and Maeght, J.L., (2013). IJ Rhizo: an open-
source software to measure scanned images of root samples. Plant and Soil 373:531-539.
Pinheiro, P.V., Wilson, J.R., Xu, Y., Zheng, Y., Rebelo, A.R., Fattah-Hosseini, S., Kruse,
A., Dos Silva, R.S., Xu, Y., Kramer, M. and Giovannoni, J., (2019). Plant viruses
transmitted in two different modes produce differing effects on small RNA-mediated
processes in their aphid vector. Phytobiomes Journal 3:71-81.

149
Pitcher, R.S., (1967). The host–parasite relations and ecology of Trichodorus viruliferus on
apple roots, as observed from an underground laboratory. Nematologica, 13:547-557.
Pline, M. and Dusenbery, D.B., (1987). Responses of plant-parasitic nematode
Meloidogyne incognita to carbon dioxide determined by video camera-computer
tracking. Journal of Chemical Ecology 13:873-888.
Ploeg, A.T. and Brown, D.J.F., (1997). ‘Trichodorid nematodes and their associated
viruses’ in Santos, M.S.N.de A., Abrantes, I.M.de O., Brown, D.J.F. and Lemos, R.M.,
(eds.) An introduction to virus-vector nematodes and their associated viruses:41-68. Coimbra:
Universidade de Coimbra.
Ploeg, A.T., Brown, D.J.F. and Robinson, D.J., (1989). Transmission of tobraviruses by
trichodorid nematodes 1. European Plant Protection Organization Bulletin 19:605-610.
Ploeg, A.T., Brown, D.J.F. and Robinson, D.J., (1992). Acquisition and subsequent
transmission of Tobacco rattle virus isolates by Paratrichodorus and Trichodorus nematode
species. Netherlands Journal of Plant Pathology 98:291-300.
Ploeg, A.T. and Decraemer, W., (1997). The occurrence and distribution of trichodorid
nematodes and their associated tobraviruses in Europe and the former Soviet Union.
Nematologica 43:228-251.
Ploeg, A. T. and Maris, P.C., (1999). Effect of temperature on suppression of
Meloidogyne incognita by Tagetes cultivars. Journal of Nematology 31:709-714.
Ploeg, A.T., Mathis, A., Brown, D.J.F. and Robinson, D.J., (1993a). Susceptibility of
transgenic tobacco plants expressing Tobacco rattle virus coat protein to nematode-
transmitted and mechanically inoculated Tobacco rattle virus. Journal of General Virology
74:2709-2715.
Ploeg, A.T., Robinson, D.J. and Brown, D.J.F., (1993b). RNA-2 of Tobacco rattle virus
encodes the determinants of transmissibility by trichodorid vector nematodes. Journal of
General Virology 74:1463-1466.
Pokalsky, A.R., Hiatt, W.R., Ridge, N., Rasmussen, R., Houck, C.M. and Shewmaker,
C.K., (1989). Structure and expression of elongation factor 1 alpha in tomato. Nucleic
Acids Research 17:4661-4673.
Poli, D., Carbognani, P., Corradi, M., Goldoni, M., Acampa, O., Balbi, B., Bianchi, L.,
Rusca, M. and Mutti, A., (2005). Exhaled volatile organic compounds in patients with
non-small cell lung cancer: cross sectional and nested short-term follow-up
study. Respiratory Research 6:71.
Pontes, M., Pereira, J. and Câmara, J.S., (2012) Dynamic headspace solid-phase
microextraction combined with one-dimensional gas chromatography–mass
spectrometry as a powerful tool to differentiate banana cultivars based on their volatile
metabolite profile. Food Chemistry 134:2509–2520.
150
Powers, L.E., McSorley, R. and Dunn, R.A., (1993). Effects of mixed cropping on a soil
nematode community in Honduras. Journal of Nematology 25:666-673.
Prator, C.A., Chooi, K.M., Jones, D., Davy, M.W., MacDiarmid, R.M. and Almeida,
R.P.P., (2020). Comparison of two different host plant genera responding to Grapevine
leafroll-associated virus 3 infection. Scientific Reports 10:e8505.
Pudasaini, M.P., Viaene, N. and Moens, M., (2006). Effect of marigold (Tagetes patula) on
population dynamics of Pratylenchus penetrans in a field. Nematology 8:477-484.
Qi, Y., Meng, L., Cao, S., Li, M., Chen, S. and Ye, D., (2015). Chemotaxis of Meloidogyne
incognita in response to different salts. Agricultural Sciences 6:900.
Quist, C.W., Smant, G. and Helder, J., (2015). Evolution of plant parasitism in the
phylum Nematoda. Annual Review of Phytopathology 53:289-310.
R Core Team (2020). The R Project for Statistical Computing. Available at: http://www.R-
project.org/.
Raguso, R.A. and Roy, B.A., (1998). “Floral” scent produced by Puccinia fungi that mimic
flowers. Molecular Ecology 7:1127-1136.
Rajabaskar, D., Bosque-Pérez, N.A. and Eigenbrode, S.D., (2014). Preference by a virus
vector for infected plants is reversed after virus acquisition. Virus Research 186:32-37.
Ras, M.R., Borrull, F. and Marcé, R.M., (2009). Sampling and preconcentration
techniques for determination of volatile organic compounds in air samples. TrAC Trends
in Analytical Chemistry 28:347-361.
Rasmann, S., Ali, J.G., Helder, J. and van der Putten, W.H., (2012). Ecology and
evolution of soil nematode chemotaxis. Journal of Chemical Ecology 38:615-628.
Rasmann, S., Erwin, A.C., Halitschke, R. and Agrawal, A.A., (2011). Direct and indirect
root defences of milkweed (Asclepias syriaca): trophic cascades, trade‐offs and novel
methods for studying subterranean herbivory. Journal of Ecology 99:16-25.
Rasmann, S., Kollner, T.G., Degenhardt, J., Hiltpold, I., Toepfer, S., Kuhlmann, U.,
Gershenzon, J. and Turlings, T.C.J., (2005). Recruitment of entomopathogenic
nematodes by insect-damaged maize roots. Nature 434:732-737.
Rasmann, S. and Turlings, T.C., (2008). First insights into specificity of belowground
tritrophic interactions. Oikos 117:362-369.
Ratcliff, F.G., Harrison, B.D. and Baulcombe, D.C., (1997). A similarity between viral
defense and gene silencing in plants. Science 276:1558-1560.
Ratcliff, F.G., MacFarlane, S.A. and Baulcombe, D.C., (1999). Gene silencing without
DNA: RNA-mediated cross-protection between viruses. The Plant Cell 11:1207-1215.

151
Ratcliff, F.G, Martin‐Hernandez, A.M. and Baulcombe, D.C., (2001). Technical advance:
Tobacco rattle virus as a vector for analysis of gene function by silencing. The Plant
Journal 25:237-245.
Razavi, B.S., Hoang, D.T., Blagodatskaya, E. and Kuzyakov, Y., (2017). Mapping the
footprint of nematodes in the rhizosphere: cluster root formation and spatial
distribution of enzyme activities. Soil Biology & Biochemistry 115:213-220.
Redeker, K.R., Cai, L.L., Dumbrell, A.J., Bardill, A., Chong, J.P. and Helgason, T.,
(2018). Noninvasive analysis of the soil microbiome: biomonitoring strategies using the
volatilome, community analysis, and environmental data. Advances in Ecological Research
59:93-132.
Redeker, K.R., Davis, S. and Kalin, R.M., (2007). Isotope values of atmospheric
halocarbons and hydrocarbons from Irish urban, rural, and marine locations. Journal of
Geophysical Research: Atmospheres 112:307.
Reinecke, A., Müller, F. and Hilker, M., (2008). Attractiveness of CO2 released by root
respiration fades on the background of root exudates. Basic and Applied Ecology 9:568-
576.
Rering, C.C., Beck, J.J., Hall, G.W., McCartney, M.M. and Vannette, R.L., (2018).
Nectar‐inhabiting microorganisms influence nectar volatile composition and
attractiveness to a generalist pollinator. New Phytologist 220:750-759.
Rering, C.C., Gaffke, A.M., Rudolph, A.B., Beck, J.J. and Alborn, H.T, (2020) A
comparison of collection methods for microbial volatiles. Frontiers in Sustainable Food
Systems 4:261.
Ribeiro, L.H., Freitas, A.M.C. and da Silva, M.D.G., (2008). The use of headspace solid
phase microextraction for the characterization of volatile compounds in olive oil
matrices. Talanta 77:110-117.
Rid, M., Mesca, C., Ayasse, M. and Gross, J., (2016). Apple proliferation phytoplasma
influences the pattern of plant volatiles emitted depending on pathogen
virulence. Frontiers in Ecology and Evolution 3:152.
Rimbaud, L., Dallot, S., Delaunay, A., Borron, S., Soubeyrand, S., Thébaud, G. and
Jacquot, E., (2015). Assessing the mismatch between incubation and latent periods for
vector-borne diseases: the case of sharka. Phytopathology 105:1408-1416.
Rivera, M.J., Martini, X., Khrimian, A. and Stelinski, L., (2017). A weevil sex
pheromone serves as an attractant for its entomopathogenic nematode
predators. Chemoecology 27:199-206.
Robert, C.A., Erb, M., Duployer, M., Zwahlen, C., Doyen, G.R. and Turlings, T.C.,
(2012). Herbivore‐induced plant volatiles mediate host selection by a root
herbivore. New Phytologist 194:1061-1069.

152
Robinson, A.F., (1995). Optimal release rates for attracting Meloidogyne incognita,
Rotylenchulus reniformis, and other nematodes to carbon dioxide in sand. Journal of
Nematology 27:42.
Robinson, D.J., (1992). Detection of Tobacco rattle virus by reverse transcription and
polymerase chain reaction. Journal of Virological Methods 40:57-66.
Robinson, D.J. (2004), Identification and nucleotide sequence of a Tobacco rattle
virus RNA‐1 variant that causes spraing disease in potato cv. Bintje. Journal of
Phytopathology 152:286-290.
Robinson, D.J. and Dale, M.F.B., (1994). Susceptibility, resistance and tolerance of
potato cultivars to Tobacco rattle virus infection and spraing disease. Aspects of Applied
Biology 39:61-66.
Rodrigues, J.C.V. and Childers, C.C., (2013). Brevipalpus mites (Acari: Tenuipalpidae):
vectors of invasive, non-systemic cytoplasmic and nuclear viruses in plants. Experimental
and Applied Acarology 59:165-175.
Roossinck, M.J., (2015). Plants, viruses and the environment: ecology and mutualism.
Virology 479:271-277.
Roossinck, M.J. and García-Arenal, F., (2015). Ecosystem simplification, biodiversity
loss and plant virus emergence. Current Opinion in Virology 10:56-62.
Royal Botanic Gardens, Kew, (2016). State of the World’s Plants 2016. UK: Royal Botanic
Gardens.
Rudel, M., (1985). Grapevine damage induced by particular virus–vector combinations.
Phytopathologia Mediterranea 24:184-185.
Ruehle, J.L., (1969). Influence of stubby-root nematode on growth of southern pine
seedlings. Forest Science 15:130-134.
Rybicki, E.P., (2015). A top ten list for economically important plant viruses. Archives of
Virology 160:17-20.
Rybicki, E.P. and Pietersen, G., (1999). ‘Plant virus disease problems in the developing
world’ in Margniorosch, K., Murphy, F.A. and Shatkin, A.J., (eds.) Advances in Virus
Research 53:127-175. San Diego: Academic Press.
Sadeh, D., Nitzan, N., Shachter, A., Chaimovitsh, D., Dudai, N. and Ghanim, M.,
(2017). Whitefly attraction to rosemary (Rosmarinus officinialis L.) is associated with
volatile composition and quantity. PloS One 12:e0177483.
Safari, M., Ferrari, M.J. and Roossinck, M.J., (2019). Manipulation of aphid behaviour
by a persistent plant virus. Journal of Virology 93:e01781–18.
Sahi, G., Hedley, P.E., Morris, J., Loake, G.J. and MacFarlane, S.A., (2016). Molecular
and biochemical examination of spraing disease in potato tuber in response to Tobacco
Rattle Virus infection. Molecular Plant-Microbe Interactions 29:822-828.

153
Salerno, G., Frati, F., Marino, G., Ederli, L., Pasqualini, S., Loreto, F., Colazza, S. and
Centritto, M., (2017). Effects of water stress on emission of volatile organic
compounds by Vicia faba, and consequences for attraction of the egg parasitoid
Trissolcus basalis. Journal of Pest Science 90:635-647.
Sang, M.K., Kim, J.D., Kim, B.S. and Kim, K.D., (2011). Root treatment with
rhizobacteria antagonistic to Phytophthora blight affects anthracnose occurrence,
ripening, and yield of pepper fruit in the plastic house and field. Phytopathology 101:666-
678.
Sankhalkar, S., Komarpant, R., Dessai, T.R., Simoes, J. and Sharma, S., (2019). Effects
of soil and soil-less culture on morphology, physiology and biochemical studies of
vegetable plants. Current Agriculture Research Journal 7:181-188.
Sarkar, S.C., Wang, E., Wu, S. and Lei, Z., (2018). Application of trap cropping as
companion plants for the management of agricultural pests: a review. Insects 9:art. no.
128.
Sasse, J., Martinoia, E. and Northen, T., (2018). Feed your friends: do plant exudates
shape the root microbiome? Trends in Plant Science 23:25-41.
Schaeffer, R.N., Rering, C.C., Maalouf, I., Beck, J.J. and Vannette, R.L., (2019). Microbial
metabolites mediate bumble bee attraction and feeding. bioRxiv:e549279.
Schmelzer, K., (1957). Untersuchungen iiber den Wirtspflanzenkreis des
TabakmaucheVirus. Phytopathology 2:281.
Schiestl, F.P. and Roubik, D.W., (2003). Odor compound detection in male euglossine
bees. Journal of Chemical Ecology 29:253-257.
Schmitt, C., Mueller, A.-M., Mooney, A., Brown, D. and MacFarlane, S., (1998).
Immunological detection and mutational analysis of the RNA2- encoded nematode
transmission proteins of Pea early browning virus. Journal of General Virology 79:1281-
1288.
Scholthof, K.B.G., Adkins, S., Czosnek, H., Palukaitis, P., Jacquot, E., Hohn, T., Hohn,
B., Saunders, K., Candresse, T., Ahlquist, P. and Hemenway, C., (2011). Top 10 plant
viruses in molecular plant pathology. Molecular Plant Pathology 12:938-954.
Schratzberger, M., Holterman, M., van Oevelen, D. and Helder, J., (2019). A worm's
world: ecological flexibility pays off for free-living nematodes in sediments and
soils. BioScience 69:867-876.
Schulz-Bohm, K., Gerards, S., Hundscheid, M., Melenhorst, J., de Boer, W. and
Garbeva, P., (2018). Calling from distance: attraction of soil bacteria by plant root
volatiles. The ISME Journal 12:1252-1262.
Senthil-Kumar, M. and Mysore, K.S., (2014). Tobacco rattle virus-based virus-induced
gene silencing in Nicotiana benthamiana. Nature Protocols 9:1549-1562.

154
Sghaier, L., Vial, J., Sassiat, P., Thiebaut, D., Watiez, M., Breton, S., Rutledge, D.N. and
Cordella, C.B., (2016). An overview of recent developments in volatile compounds
analysis from edible oils: technique‐oriented perspectives. European Journal of Lipid
Science and Technology 118:1853-1879.
Shapiro, L., De Moraes, C.M., Stephenson, A.G. and Mescher, M.C., (2012). Pathogen
effects on vegetative and floral odours mediate vector attraction and host exposure in a
complex pathosystem. Ecology Letters 15:1430-1438.
Sharkey, T.D., Wiberley, A.E. and Donohue, A.R., (2008). Isoprene emission from
plants: why and how. Annals of Botany 101(1):5-18.
Shates, T.M., Sun, P., Malmstrom, C.M., Dominguez, C. and Mauck, K.E., (2019).
Addressing research needs in the field of plant virus ecology by defining knowledge
gaps and developing wild dicot study systems. Frontiers in Microbiology 9:3305.
Shaw, J., Love, A.J., Makarova, S.S., Kalinina, N.O., Harrison, B.D. and Taliansky,
M.E., (2014). Coilin, the signature protein of Cajal bodies, differentially modulates the
interactions of plants with viruses in widely different taxa. Nucleus 5:85-94.
Shaw, J., Yu, C., Makhotenko, A.V., Makarova, S.S., Love, A.J., Kalinina, N.O.,
MacFarlane, S., Chen, J. and Taliansky, M.E., (2019). Interaction of a plant virus protein
with the signature Cajal body protein coilin facilitates salicylic acid-mediated plant
defence responses. New Phytologist 224:439-453.
Shelef, O., Hahn, P.G., Getman-Pickering, Z. and Medina, A.M., (2019). Coming to
common ground: The challenges of applying ecological theory developed aboveground
to rhizosphere interactions. Frontiers in Ecology and Evolution 7:art. no. 58.
Shelton, A.M. and Badenes-Perez, F.R., (2006). Concepts and applications of trap
cropping in pest management. Annual Review of Entomology 51:285-308.
Sikder, M.M. and Vestergård, M., (2019). Impacts of root metabolites on soil
nematodes. Frontiers in Plant Science 10:art. no. 1792.
Singh, S., Awasthi, L.P., Jangre, A. and Nirmalkar V.K., (2020). ‘Transmission of plant
viruses through soil-inhabiting nematode vectors’ in Awasthi, L.P., (ed.) Applied Plant
Virology: Advances, Detection, and Antiviral Strategies:291-298. San Diego: Academic Press.
Smith, K.M., (1946). Tomato black ring: a new virus disease. Parasitology 37:126.
Sobhy, I.S., Baets, D., Goelen, T., Herrera-Malaver, B., Bosmans, L., Van den Ende, W.,
Verstrepen, K.J., Wäckers, F., Jacquemyn, H. and Lievens, B., (2018). Sweet scents:
nectar specialist yeasts enhance nectar attraction of a generalist aphid parasitoid without
affecting survival. Frontiers in Plant Science 9:1009.
Solé, J., Sans, A., Riba, M. and Guerrero, Á., (2010). Behavioural and
electrophysiological responses of the European corn borer Ostrinia nubilalis to host‐
plant volatiles and related chemicals. Physiological Entomology 35:354-363.

155
Song, M.S., Kim, D.G. and Lee, S.H., (2005). Isolation and characterization of a
jasmonic acid carboxyl methyltransferase gene from hot pepper (Capsicum annuum
L.). Journal of Plant Biology 48:292-297.
Songsri, P., Jogloy, S., Vorasoot, N., Akkasaeng, C., Patanothai, A. and Holbrook, C.C.,
(2008). Root distribution of drought‐resistant peanut genotypes in response to
drought. Journal of Agronomy and Crop Science 194:92-103.
Soria, A.C., García-Sarrió, M.J. and Sanz, M.L., (2015). Volatile sampling by headspace
techniques. TrAC Trends in Analytical Chemistry 71:85-99.
Souza-Silva, É.A., Gionfriddo, E., Alam, M.N. and Pawliszyn, J., (2017). Insights into
the effect of the PDMS-layer on the kinetics and thermodynamics of analyte sorption
onto the matrix-compatible solid phase microextraction coating. Analytical
Chemistry 89:2978-2985.
Srinivasa, N., Sriram, S., Singh, C. and Shivashankar, K.S., (2017). Secondary
metabolites approach to study the bio-efficacy of Trichoderma asperellum isolates in
india. International Journal of Current Microbiology and Applied Science 6:1105-1123.
Standifer, M.S. and Perry, V.G., (1960). Some effects of sting and stubby root
nematodes on grapefruit roots. Phytopathology 50:152-6.
Steen, R., Norli, H.R. and Thöming, G., (2019) Volatiles composition and timing of
emissions in a moth-pollinated orchid in relation to hawkmoth (Lepidoptera:
Sphingidae) activity. Arthropod-Plant Interactions 13:581–592.
Subbotin, S.A., Vera, I.C.D.P., Inserra, R.N., Chizhov, V.N. and Decraemer, W., (2020).
Molecular characterisation of some stubby root nematodes (Nematoda: Trichodoridae)
from the USA and other countries. Nematology 22:39-52.
Suinyuy, T.N. and Johnson, S.D., (2018). Geographic variation in cone volatiles and
pollinators in the thermogenic African cycad Encephalartos ghellinckii Lem. Plant Biology,
20:579-590.
Sun, X., Siemann, E., Liu, Z., Wang, Q., Wang, D., Huang, W., Zhang, C. and Ding, J.,
(2019). Root‐feeding larvae increase their performance by inducing leaf volatiles that
attract above‐ground conspecific adults. Journal of Ecology 107:2713-2723.
Suryadi, Y., Susilowati, D.N. and Fauziah, F., (2019). ‘Management of plant diseases by
PGPR-mediated induced resistance with special reference to tea and rice crops’ in
Sayyed, R., (ed.) Plant Growth Promoting Rhizobacteria for Sustainable Stress Management.
Microorganisms for Sustainability 2(13):65-110. Singapore: Springer.
Svane, S.F., Jensen, C.S. and Thorup-Kristensen, K., (2019). Construction of a large-
scale semi-field facility to study genotypic differences in deep root growth and resources
acquisition. Plant Methods 15:26.
Taliansky, M.E., Brown, J.W.S., Rajamäki, M.L., Valkonen, J.P.T. and Kalinina, N.O.,
(2010). ‘Involvement of the plant nucleolus in virus and viroid infections: parallels with

156
animal pathosystems’ in Maramorosch, K., Murphy, F.A. and Shatkin, A.J., (eds.)
Advances in Virus Research 77:119-158. San Diego: Academic Press.
Tamada, T. and Kondo, H., (2013). Biological and genetic diversity of
plasmodiophorid-transmitted viruses and their vectors. Journal of General Plant Pathology
79:307-320.
Tavares-Esashika, M.L., Campos, R.N.S., Blawid, R., da Luz, L.L., Inoue-Nagata, A.K.
and Nagata, T., (2020). Characterization of an infectious clone of Pepper ringspot virus
and its use as a viral vector. Archives of Virology 165:367-375.
Taylor, C.E. and Brown D.J.F., (1997). Nematode Vectors of Plant Viruses. Wallingford:
CAB International.
Taylor, C.E. and Robertson, W.M., (1970). Location of Tobacco rattle virus in the
nematode vector, Trichodorus pachydermus Seinhorst. Journal of General Virology 6:179-182.
Taylor, C.E. and Robertson, W.M., (1977). Virus vector relationships and mechanics of
transmission. Proceedings of the American Phytopathological Society 4:20-29.
Tholl, D., Boland, W., Hansel, A., Loreto, F., Röse, U.S. and Schnitzler, J.P., (2006).
Practical approaches to plant volatile analysis. The Plant Journal 45:540-560.
Thöming, G., Norli, H.R., Saucke, H., Knudsen, G.K., (2014) Pea plant volatiles guide
host location behaviour in pea moth. Arthropod Plant Interactions 8:109–122.
Timmusk, S., El-Daim, I.A.A., Copolovici, L., Tanilas, T., Kännaste, A., Behers, L.,
Nevo, E., Seisenbaeva, G., Stenström, E. and Niinemets, Ü., (2014). Drought-tolerance
of wheat improved by rhizosphere bacteria from harsh environments: enhanced
biomass production and reduced emissions of stress volatiles. PloS One 9:e96086.
Topalović, O., Hussain, M. and Heuer, H., (2020). Plants and associated aoil microbiota
cooperatively suppress plant-parasitic nematodes. Frontiers in Microbiology 11:e313.
Tourtois, J., Ali, J.G. and Grieshop, M.J., (2017). Susceptibility of wounded and intact
black soldier fly Hermetia illucens (L.) (Diptera: Stratiomyidae) to entomopathogenic
nematodes. Journal of Invertebrate Pathology 150:121-129.
Treonis, A.M., Cook, R., Dawson, L., Grayston, S.J. and Mizen, T., (2007). Effects of a
plant parasitic nematode (Heterodera trifolii) on clover roots and soil microbial
communities. Biology and Fertility of Soils 43:541-548.
Trujillo-Rodríguez, M.J., Pino, V., Psillakis, E., Anderson, J.L., Ayala, J.H., Yiantzi, E.
and Afonso, A.M., (2017). Vacuum-assisted headspace-solid phase microextraction for
determining volatile free fatty acids and phenols. Investigations on the effect of pressure
on competitive adsorption phenomena in a multicomponent system. Analytica Chimica
Acta 962:41-51.
Tungadi, T., Groen, S.C., Murphy, A.M., Pate, A.E., Iqbal, J., Bruce, T.J.A., Cunniffe, N.J.
and Carr, J.P., (2017). Cucumber mosaic virus and its 2b protein alter emission of host
157
volatile organic compounds but not aphid vector settling in tobacco. Virology Journal
14:art. no. 91.
Turlings, T.C., Davison, A.C. and Tamò, C., (2004). A six‐arm olfactometer permitting
simultaneous observation of insect attraction and odour trapping. Physiological
Entomology 29:45-55.
Turlings, T.C.J., Hiltpoid, I. and Rasmann, S., (2012). The importance of root-produced
volatiles as foraging cues for entomopathogenic nematodes. Plant and Soil 358:51-60.
Ullah, M.A., Kim, K.H., Szulejko, J.E. and Cho, J., (2014). The gas chromatographic
determination of volatile fatty acids in wastewater samples: evaluation of experimental
biases in direct injection method against thermal desorption method. Analytica Chimica
Acta, 820:159-167.
Uteau, D., Hafner, S., Pagenkemper, S.K., Peth, S., Wiesenberg, G.L.B., Kuzyakov, Y.
and Horn, R., (2015). Oxygen and redox potential gradients in the rhizosphere of alfalfa
grown on a loamy soil. Journal of Plant Nutrition and Soil Science 178:278-287.
Valentine, T., Shaw, J., Block, V.C., Philips, M.S., Oparka, K.J. and Lacomme, C., (2004).
Efficient virus-induced gene silencing in roots using a modified Tobacco rattle virus
vector. Plant Physiology 136:3999-4009.
Valkonen, J.P.T., Rokka, V.M. and Watanabe, K.N., (1998). Examination of the leaf-drop
symptom of virus-infected potato using anther culture-derived haploids.
Phytopathology 88:1073-1077.
Vamerali, T., Bandiera, M. and Mosca, G., (2012). ‘Minirhizotrons in modern root
studies’ in Measuring Roots:341-361. Berlin: Springer.
Van den Eynde, R., Van Leeuwen, T. and Haesaert, G., (2020). Identifying drivers of
spatio-temporal dynamics in barley yellow dwarf virus epidemiology as a critical factor
in disease control. Pest Management Science 76(8):2548-2556.
van Hoof, H.A., (1964). Het tijdsstip van infectie en veranderingen in de concentratie
van ratel virus (Kringerigheid) in de aardappelknol (Summary: The time of infection
and change in concentration of rattle virus (spraing) in potato tubers. Mededelingen van de
Lanbouhogeschool in de Opzoekingsstations van de Staat te Gent 29:944-955.
Vassilakos, N., Vellios, E.K., Brown, D.J., Brown, E.C. and MacFarlane, S.A., (2001).
Tobravirus 2b protein acts in trans to facilitate transmission by nematodes. Virology
279:478-487
Vellios, E., Duncan, G., Brown, D. and MacFarlane, S., (2002). Immunogold localization
of tobravirus 2b nematode transmission helper protein associated with virus particles.
Virology 300:118-124.
Venables, W.N. and Ripley, B.D., (2002). Modern Applied Statistics with S. 4th ed. New
York: Springer. Available at: http://www.stats.ox.ac.uk/pub/MASS4/.

158
Venturi, V. and Keel, C., (2016). Signaling in the rhizosphere. Trends in Plant
Science 21:187-198.
Villordon, A.Q. and Clark, C.A., (2014). Variation in virus symptom development and
root architecture attributes at the onset of storage root initiation in ‘Beauregard’ sweet
potato plants grown with or without nitrogen. PloS One 9:e107384.
Visser, P.B. and Bol, J.F., (1999). Nonstructural proteins of Tobacco rattle virus which
have a role in nematode-transmission: expression pattern and interaction with viral coat
protein. Journal of General Virology 80:3273-3280.
Vives-Peris, V., Gómez-Cadenas, A. and Pérez-Clemente, R.M., (2017). Citrus plants
exude proline and phytohormones under abiotic stress conditions. Plant Cell Reports
36:1971-1984.
Voglar, G.E., Mrak, T., Križman, M., Jagodič, A., Trdan, S. and Laznik, Ž., (2019).
Effect of contaminated soil on multitrophic interactions in a terrestrial system. Plant and
Soil 435:337-351.
Vuorinen, T., Nerg, A.M., Ibrahim, M.A., Reddy, G.V.P. and Holopainen, J.K., (2004).
Emission of Plutella xylostella-induced compounds from cabbages grown at elevated
CO2 and orientation behavior of the natural enemies. Plant Physiology 135:1984-1992.
Walls, J., Rajotte, E. and Rosa, C., (2019). The past, present, and future of barley yellow
dwarf management. Agriculture 9:23.
Walter, A., Silk, W.K. and Schurr, U., (2009). Environmental effects on spatial and
temporal patterns of leaf and root growth. Annual Review of Plant Biology 60:279-304.
Wang, C., Bruening, G. and Williamson, V., (2009). Determination of preferred pH for
root-knot nematode aggregation using pluronic F-127 gel. Journal of Chemical Ecology
35:1242.
Wang, Y.Y., Sikandar, A., Zhao, Y.S., Zhao, J., Liu, D., Zhu, X.F., Liu, X.Y., Fan, H.Y.,
Chen, L.J. and Duan, Y.X., (2020). Effect of culture filtrate of Sinorhizobium fredii
SNEB183 on the activity and behaviour of soybean cyst nematode (Heterodera glycines
Ichinohe 1952)). Applied Ecology and Environmental Research 18:1129-1140.
Wardle, D.A., Bardgett, R.D., Klironomos, J.N., Setälä, H., Van Der Putten, W.H. and
Wall, D.H., (2004). Ecological linkages between aboveground and belowground biota.
Science 304:1629–1633.
Webster, B., Bruce, T., Dufour, S., Birkemeyer, C., Birkett, M., Hardie, J. and Pickett, J.,
(2008). Identification of volatile compounds used in host location by the black bean
aphid, Aphis fabae. Journal of Chemical Ecology 34:1153-1161.
Webster, C.G., Pichon, E., Van Munster, M., Monsion, B., Deshoux, M., Gargani, D.,
Calevro, F., Jimenez, J., Moreno, A., Krenz, B. and Thompson, J.R., (2018).
Identification of plant virus receptor candidates in the stylets of their aphid vectors.
Journal of Virology 92:e00432-18.

159
Wei, S., Marton, I., Dekel, M., Shalitin, D., Lewinsohn, E., Bravdo, B.A. and Shoseyov,
O., (2004). Manipulating volatile emission in tobacco leaves by expressing Aspergillus
niger β‐glucosidase in different subcellular compartments. Plant Biotechnology Journal 2:341-
350.
Weissteiner, S., (2010). The effect of root volatiles on the orientation behavior of cockchafer larvae
in the soil. Dr. forest. thesis, Georg-August-University Göttingen. Available at:
https://ediss.uni-goettingen.de/bitstream/handle/11858/00-1735-0000-0006-B147-
2/weissteiner.pdf;jsessionid=94C5F075B5127D0637ED2E520D598711?sequence=1/.
Weissteiner, S. and Schütz, S., (2006). Are different volatile pattern influencing host
plant choice of belowground living insects. Mitteilungen der Deutschen Gesellschaft für
Allgemeine und Angewandte Entomologie 15:51-55.
Whitehead, A.G., Fraser, J.E. and Greet, D.N., (1970). The effect of D–D, chloropicrin
and previous crops on numbers of migratory root‐parasitic nematodes and on the
growth of sugar beet and barley. Annals of Applied Biology 65:351-359.
Whitehead, A.G. and Hooper, D.J., (1970). Needle nematodes (Longidorus spp.) and
stubby‐root nematodes (Trichodorus spp.) harmful to sugar beet and other field crops in
England. Annals of Applied Biology 65:339-350.
Whitfield, A.E., Falk, B.W. and Rotenberg, D., (2015). Insect vector-mediated
transmission of plant viruses. Virology 479-480:278-289
Willett, D.S., Alborn, H.T. and Stelinski, L.L., (2017). Multitrophic effects of
belowground parasitoid learning. Scientific Reports 7:1-10.
Winfield, A.L. and Cooke, D.A., (1975). ‘The ecology of Trichodorus’ in Lamberti, F.,
(ed.) Nematode Vectors of Plant Viruses:309-341. Boston: Springer.
Wood, S.V., Maczey, N., Currie, A.F., Lowry, A.J., Rabiey, M., Ellison, C.A., Jackson,
R.W. and Gange, A.C., (2020). Rapid impact of Impatiens glandulifera control on above-
and belowground invertebrate communities. Weed Research 61: 35-44
Wu, Y., Pan, Q., Qu, W. and Duan, C., (2009). Comparison of volatile profiles of nine
litchi (Litchi chinensis Sonn.) cultivars from Southern China. Journal of Agricultural and Food
Chemistry 57:9676-9681.
Wyss, U., (1977). Feeding processes of virus-transmitting nematodes. Proceedings of the
American Phytopathological Society 4:30-41.
Wyss, U., (1982). Virus-transmitting nematodes: feeding behavior and effect on root
cells. Plant Disease 66:639-644.
Xenophontos, S., Robinson, D.J., Dale, M.F.B. and Brown, D.J.F., (1998). Evidence for
persistent, symptomless infection of some potato cultivars with Tobacco rattle
virus. Potato Research 41:255-265.

160
Xiu, C., Zhang, W., Xu, B., Wyckhuys, K.A., Cai, X., Su, H. and Lu, Y., (2019). Volatiles
from aphid-infested plants attract adults of the multicolored Asian lady beetle Harmonia
axyridis. Biological Control 129:1-11.
Xu, P., Blancaflor, E.B. and Roossinck, M.J., (2003). In spite of induced multiple
defense responses, tomato plants infected with Cucumber mosaic virus and D satellite
RNA succumb to systemic necrosis. Molecular Plant-Microbe Interactions 16:467-476.
Yang, C., Wang, J. and Li, D., (2013). Microextraction techniques for the determination
of volatile and semivolatile organic compounds from plants: A review. Analytica Chimica
Acta 799:8-22.
Yang, S., Carter, S.A., Cole, A.B., Cheng, N. and Nelson, R., (2004). A natural variant of
a host RNA-dependent RNA polymerase is associated with increased susceptibility to
viruses by Nicotiana benthamiana. Proceedings of the National Academy of Sciences of the United
States of America 101:6297-6302.
Yi, H.S., Heil, M., Adame-Alvarez, R.M., Ballhorn, D.J. and Ryu, C.M., (2009). Airborne
induction and priming of plant defenses against a bacterial pathogen. Plant
Physiology 151:2152-2161.
Yokoo, T., (1964). On the stubby root nematodes from the Western Japan. Agricultural
Bulletin of the Saga University 23:1-6.
Yousuf, F., Carnegie, A.J., Bashford, R., Nicol, H.I. and Gurr, G.M., (2018). The fungal
matrices of Ophiostoma ips hinder movement of the biocontrol nematode agent, Deladenus
siricidicola, disrupting management of the woodwasp, Sirex noctilio. BioControl 63:739-749.
Zaitlin, M. and Hull, R., (1987). Plant virus-host interactions. Annual Review of Plant
Physiology 38:291-315.
Zaka, S.M., Zeng, X. and Wang, H., (2015). Chemotaxis of adults of the Asiatic citrus
psyllid, Diaphorina citri Kuwayama, to volatile terpenes detected from guava
leaves. Pakistan Journal of Zoology 47:153-159.
Zhao, L.L., Wei, W., Kang, L. and Sun, J.H., (2007). Chemotaxis of the pinewood
nematode, Bursaphelenchus xylophilus, to volatiles associated with host pine, Pinus
massoniana, and its vector Monochamus alternatus. Journal of Chemical Ecology 33:1207-1216.
Zhou, J.S., Drucker, M. and Ng, J.C., (2018). Direct and indirect influences of virus–
insect vector–plant interactions on non-circulative, semi-persistent virus transmission.
Current Opinion in Virology 33:129-136.
Ziebell, H., Murphy, A.M., Groen, S.C., Tungadi, T., Westwood, J.H., Lewsey, M.G.,
Moulin, M., Kleczkowski, A., Smith, A.G., Stevens, M. and Powell, G., (2011).
Cucumber mosaic virus and its 2b RNA silencing suppressor modify plant-aphid
interactions in tobacco. Scientific Reports 1:187.
Ziegler-Graff, V., (2020). Molecular insights into host and vector manipulation by plant
viruses. Viruses 12:263.