mercury in the environment: a volatile problem
TRANSCRIPT
J O I N T C E N T E R AEI-BROOKINGS JOINT CENTER FOR REGULATORY STUDIES
Mercury in the Environment: A Volatile Problem
Randall Lutter and Elisabeth Irwin
Related Publication 02-14
December 2002
Randall Lutter is a fellow with the AEI-Brookings Joint Center and a resident scholar at the American Enterprise Institute. Elisabeth Irwin was a research assistant with the Joint Center. This article was originally published in the November 2002 issue of Environment. The authors welcome comments through Dr. Lutter at (202) 862-5885 or by e-mail at [email protected].

© LIONEL ATWILL—PETER ARNOLD, INC.
This article was published in the November 2002 issue of Environment.Volume 44, Number 9, pages 24-40. Posted with permission.© Heldref Publications, 2002. www.heldref.org/html/env.html
Mercury
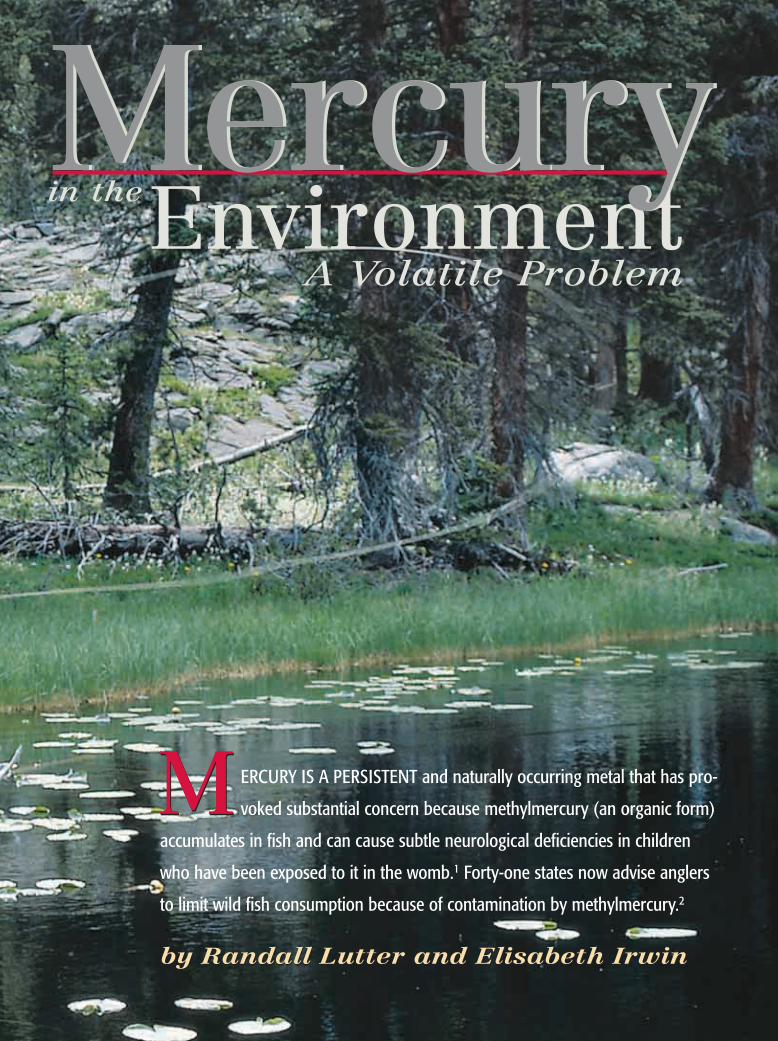
ERCURY IS A PERSISTENT and naturally occurring metal that has pro-
voked substantial concern because methylmercury (an organic form)
accumulates in fish and can cause subtle neurological deficiencies in children
who have been exposed to it in the womb.1 Forty-one states now advise anglers
to limit wild fish consumption because of contamination by methylmercury.2
by Randall Lutter and Elisabeth Irwin
A Volatile ProblemEnvironment
Mercuryin the
MM
by Randall Lutter and Elisabeth Irwin
26 ENVIRONMENT NOVEMBER 2002
Accordingly, the U.S. Food and DrugAdministration is under pressure toreduce its permissible level of mercury infish sold in the United States.3 To addressconcern about mercury, several senatorsand President George W. Bush have pro-posed new legislation to cut emissions ofpollutants from power plants, which arethe biggest anthropogenic source of mer-cury in the United States.4
However, these different parties dis-agree about how mercury should be reg-ulated. The controversy is likely to growthrough December 2004, which is thedeadline for the U.S. EnvironmentalProtection Agency (EPA) to regulateemissions following the maximumachievable control technology (MACT)provisions of the Clean Air Act.5 Thisproposed regulation has faced someopposition because it is relatively costly.
In general, established U.S. regulatorypolicy suggests that regulatory decisionsto manage risks should carefully assessthe costs of controls and the resultingimprovements to human health and theenvironment.6 However, attempts toimplement this policy in the case of mer-cury are complicated by significant sci-entific uncertainty about the role of nat-
ural and anthropogenic sources of envi-ronmental mercury, how mercury istransported through the environment andwhere it eventually rests, the processesthat produce methylmercury, the effectsof methylmercury on ecosystems, andthe nature and scope of mercury-relatedrisks to human health.
The neurotoxic effects of methylmer-cury on children’s health evoke dreadand prompt reform proposals based onemotion rather than on science. Howev-er, the magnitude of risk depends on thedegree of exposure to mercury, and for-tunately, exposure generally appearssmall in the United States. Because ofthe uncertainty about these factors, iden-tifying emissions limits that balancecosts and benefits will be challenging topolicy makers. Nonetheless, the avail-able evidence suggests that even deepcuts in mercury emissions are unlikelyto bring large benefits to public health orecosystems. A stringent and costly capon emissions may not be the best policy.
In examining the problem of mercury,it is necessary to review the current stateof scientific understanding. Weaknessesand strengths should be identified—asshould areas in which additional infor-
mation would be of high value to policymakers. This article discusses mercuryin the environment, human health ef-fects, and ecological effects, and itexamines the merit of past and prospec-tive regulatory programs.
Mercury in the Environment
Mercury is present in the environmentdue to human activity as well as naturalsources such as volcanoes and forestfires. The scope of mercury releases rel-evant to determining the causes of con-tamination in U.S. waters may beregional or even global rather than local,because mercury travels long distancesin the air.7 Table 1 on page 27 summa-rizes key properties and the transportand fate of different forms of mercury.Forty percent (32 metric tons (t)) of themercury deposited from the air ontoU.S. water and soil in 1995 came fromthe global mercury reservoir (the amountof mercury circulating worldwide at anyone time); the other 60 percent camefrom anthropogenic sources in the Unit-ed States.8 Both natural and anthro-pogenic emissions contribute to theglobal mercury reservoir, and althoughsignificant uncertainty exists as to thelength of time that some forms of mer-cury persist in the atmosphere, anauthoritative estimate of annual globalinput to the reservoir is about 4,900 t.9
There is also substantial uncertaintyabout the share of worldwide emissionsthat originates from human activity. Onestudy concluded that natural sources,industrial sources, and the “recycling” ofanthropogenic mercury each accountfor about one-third of the mercury bur-den in the global atmosphere at a givenmoment.10 Recycling occurs when mer-cury in water volatilizes and contributesto the buildup of atmospheric mercuryconcentrations.11
Mercury releases from ongoinghuman activity in the United States canbe divided into four broad categories.These include “area sources” such aslandfills, dental preparations, and labo-ratory use; combustion processes, in-cluding coal-fired power generation,
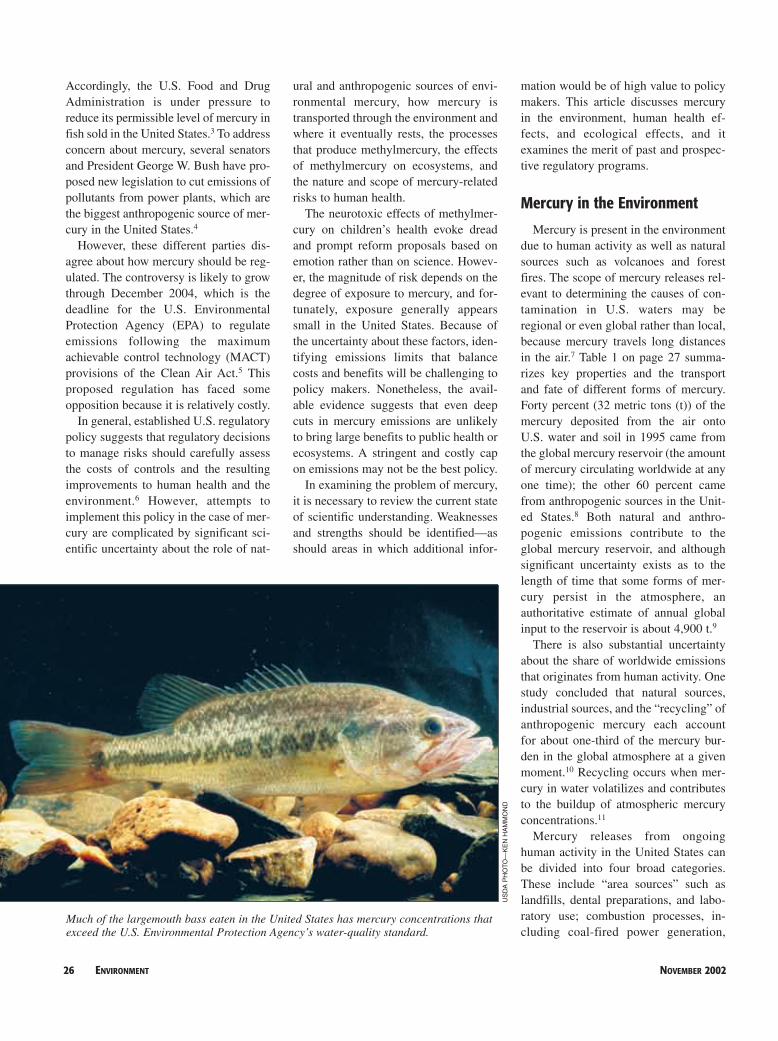
Much of the largemouth bass eaten in the United States has mercury concentrations thatexceed the U.S. Environmental Protection Agency’s water-quality standard.
US
DA
PH
OTO
—K
EN
HA
MM
ON
D
VOLUME 44 NUMBER 9 ENVIRONMENT 27
medical waste incinerators, and munici-pal waste combustors; some manu-facture of metals, alkali, and cement;and other various industrial processes,from pigment manufacture to geother-mal power generation. EPA estimatedthat emissions from these source cate-gories generated 2.76 t, 112.3 t, 12.67 t,and 1.16 t of environmental mercury peryear, respectively, in 1994–95.12 Thus,combustion sources accounted for near-ly 90 percent of total U.S. anthropogenicemissions. In recent years, EPA has reg-
ulated medical waste incinerators,municipal waste combustors, and haz-ardous waste combustors (see Table 2below).13 When these regulations arefully implemented in the fall of 2002,EPA estimates annual mercury emis-sions of about 54 t lower than theywould be without these regulations.14
Mining in the past has raised mercuryconcentrations in some areas. Releasesof quicksilver mercury in the hydraulicplacer-gold mines of the Sierra Nevadasadded 1,360 t to 3,630 t of mercury to
the environment from the 1860s throughthe early 1900s.15 According to the U.S.Geological Survey (USGS), “High mer-cury levels in fish, amphibians, andinvertebrates downstream of the hy-draulic mines are a consequence of his-toric mercury use.”16
Methylation
Bacteria in water bodies transformwater-borne elemental, divalent, or inor-ganic mercury into methylmercury(CH3Hg+), the organic form that accu-
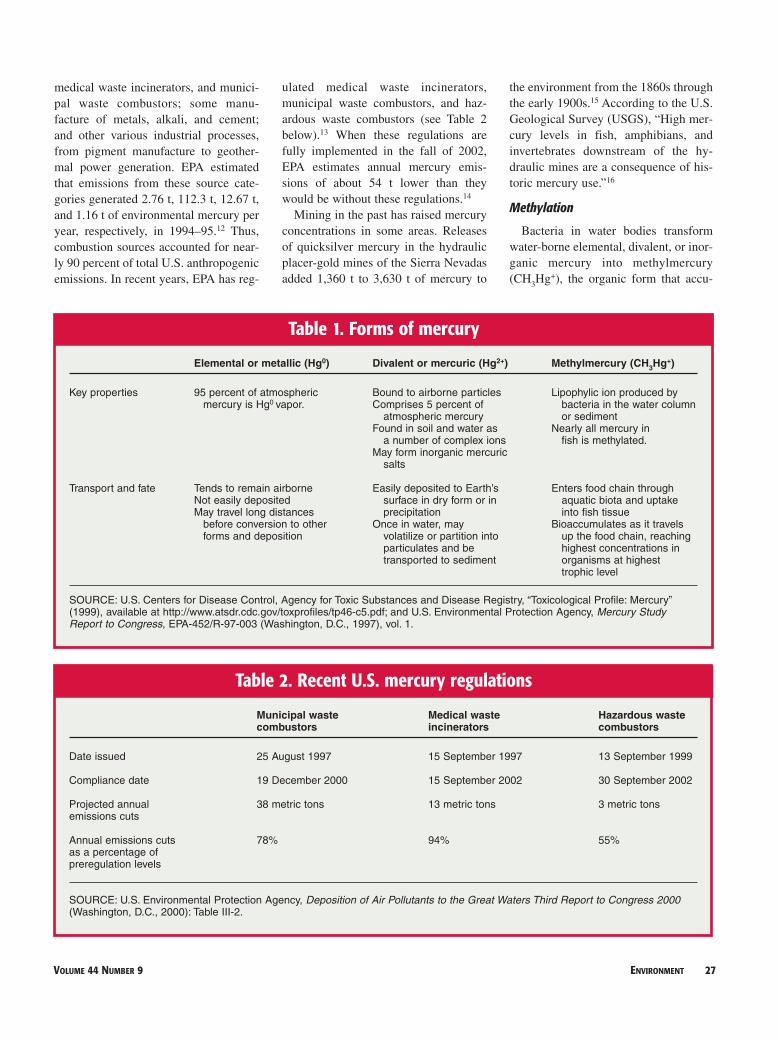
Elemental or metallic (Hg0) Divalent or mercuric (Hg2+) Methylmercury (CH3Hg+)
Key properties 95 percent of atmospheric Bound to airborne particles Lipophylic ion produced bymercury is Hg0 vapor. Comprises 5 percent of bacteria in the water column
atmospheric mercury or sediment Found in soil and water as Nearly all mercury in
a number of complex ions fish is methylated.May form inorganic mercuric
salts
Transport and fate Tends to remain airborne Easily deposited to Earth’s Enters food chain throughNot easily deposited surface in dry form or in aquatic biota and uptakeMay travel long distances precipitation into fish tissue
before conversion to other Once in water, may Bioaccumulates as it travelsforms and deposition volatilize or partition into up the food chain, reaching
particulates and be highest concentrations intransported to sediment organisms at highest
trophic level
SOURCE: U.S. Centers for Disease Control, Agency for Toxic Substances and Disease Registry, “Toxicological Profile: Mercury”(1999), available at http://www.atsdr.cdc.gov/toxprofiles/tp46-c5.pdf; and U.S. Environmental Protection Agency, Mercury StudyReport to Congress, EPA-452/R-97-003 (Washington, D.C., 1997), vol. 1.
Table 1. Forms of mercury
Municipal waste Medical waste Hazardous waste combustors incinerators combustors
Date issued 25 August 1997 15 September 1997 13 September 1999
Compliance date 19 December 2000 15 September 2002 30 September 2002
Projected annual 38 metric tons 13 metric tons 3 metric tons emissions cuts
Annual emissions cuts 78% 94% 55% as a percentage ofpreregulation levels
SOURCE: U.S. Environmental Protection Agency, Deposition of Air Pollutants to the Great Waters Third Report to Congress 2000(Washington, D.C., 2000): Table III-2.
Table 2. Recent U.S. mercury regulations
28 ENVIRONMENT NOVEMBER 2002
mulates as it moves into higher levels ofthe food chain. Methylation occurs bothin sediment and in the water columnafter mercury has entered the aquaticenvironment through methods such asatmospheric deposition, runoff, andgroundwater flow from the upper levelsof soil.17 However, not all mercury thatenters a water body undergoes methyla-tion. Rates of methylation vary with theaquatic environment and—due to limit-ed understanding of the factors thatinfluence methylation—are subject tosignificant scientific uncertainty.18
Although there is a large degree ofdoubt about the processes that methylatemercury, various studies suggest that themost important factors influencingmethylation may be chloride, sulfate,dissolved organic carbon, calcium, andpH.19 A study published in Environmen-tal Science & Technology concludes thatmethylmercury principally accumulatesin phytoplankton as it takes up un-charged chloride complexes.20 Phyto-plankton is subsequently ingested bynoncarnivorous fish, beginning the jour-ney of methylmercury up the food chainand its process of bioaccumulation.
This study also cites pH as a primarydeterminant of methylmercury. Low pHmay increase bacterial methylation rates,therefore increasing methylmercury lev-els.21 Typically, higher methylmercurylevels in fish tissue are found in moreacidic waters.22 Sulfate appears to be acritical factor in the methylation processbecause sulfate-reducing bacteria stimu-late methylmercury production. RecentUSGS studies in the Florida Evergladesregion have found a correlation betweensulfate levels and methylmercury con-centrations.23 While various processescan methylate mercury, USGS reportsthat “scientists generally agree thatmethylation by sulfate-reducing bacteriais most important.”24 EPA has listed dis-solved organic carbon as a characteristicof water bodies that affects both methyl-ation and demethylation (the processthat reverses methylation) in the watercolumn.25 However, USGS reports,“Depending on local conditions, theamount of dissolved organic carbon-mercury binding can either increase orreduce mercury uptake by organisms.”26
Finally, high calcium levels may reducethe bioavailability of methylmercury
because calcium cations may competewith metals such as mercury for cellularbinding sites.27
Land use also affects the mercury con-centrations that are available for methyl-ation. Land under cultivation may be aproxy measure of erosion, which trans-ports mercury from the soil to localwater bodies. EPA notes that “[b]othwatershed erosion and direct atmospher-ic deposition can be important sourcesof mercury to the water body, dependingon the relative sizes of the water bodyand the watershed.”28 In addition, theamount of land under cultivation mayserve as an indicator of the degree towhich fungicides containing mercuryare used for agriculture.29 In EPA’s sum-mary of studies in Lake Champlain, itreported that “urban and agriculturalsystems may retain less atmosphericmercury than forested systems,” thustransporting more mercury to water,where it can be methylated.30
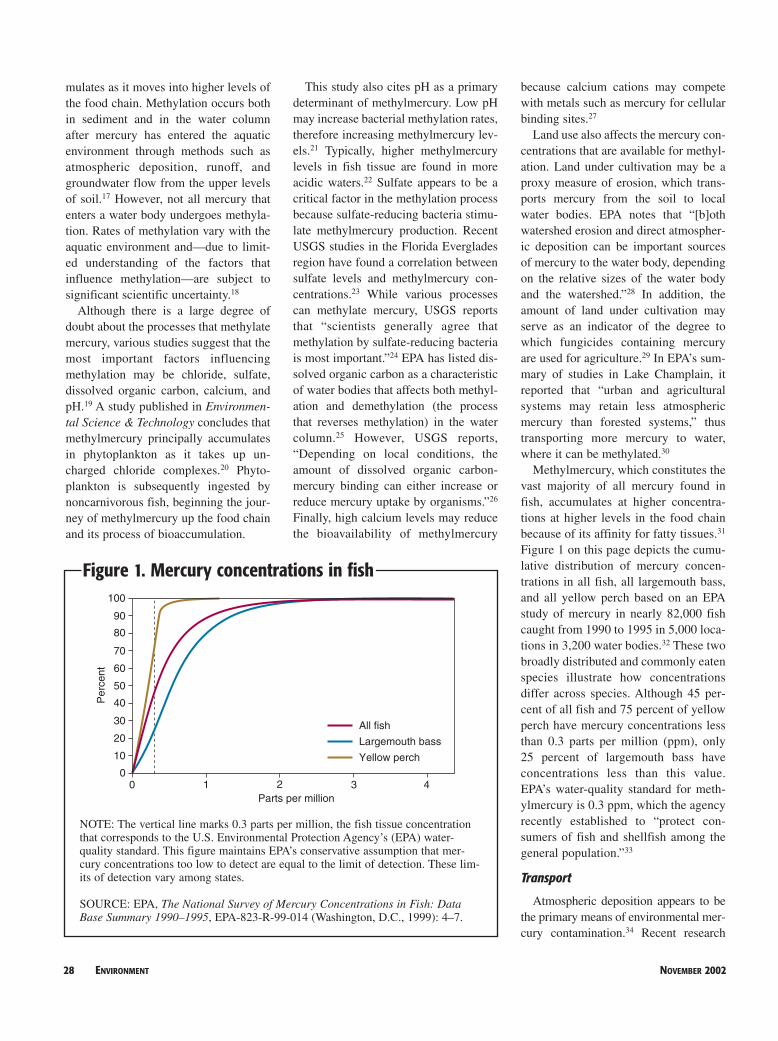
Methylmercury, which constitutes thevast majority of all mercury found infish, accumulates at higher concentra-tions at higher levels in the food chainbecause of its affinity for fatty tissues.31
Figure 1 on this page depicts the cumu-lative distribution of mercury concen-trations in all fish, all largemouth bass,and all yellow perch based on an EPAstudy of mercury in nearly 82,000 fishcaught from 1990 to 1995 in 5,000 loca-tions in 3,200 water bodies.32 These twobroadly distributed and commonly eatenspecies illustrate how concentrationsdiffer across species. Although 45 per-cent of all fish and 75 percent of yellowperch have mercury concentrations lessthan 0.3 parts per million (ppm), only25 percent of largemouth bass haveconcentrations less than this value.EPA’s water-quality standard for meth-ylmercury is 0.3 ppm, which the agencyrecently established to “protect con-sumers of fish and shellfish among thegeneral population.”33
Transport
Atmospheric deposition appears to bethe primary means of environmental mer-cury contamination.34 Recent research
0
10
20
30
40
50
60
70
80
90
100
0 1 2 3 4Parts per million
Per
cent
Yellow perch
Largemouth bass
All fish
Figure 1. Mercury concentrations in fish
NOTE: The vertical line marks 0.3 parts per million, the fish tissue concentrationthat corresponds to the U.S. Environmental Protection Agency’s (EPA) water-quality standard. This figure maintains EPA’s conservative assumption that mer-cury concentrations too low to detect are equal to the limit of detection. These lim-its of detection vary among states.
SOURCE: EPA, The National Survey of Mercury Concentrations in Fish: DataBase Summary 1990–1995, EPA-823-R-99-014 (Washington, D.C., 1999): 4–7.
VOLUME 44 NUMBER 9 ENVIRONMENT 29
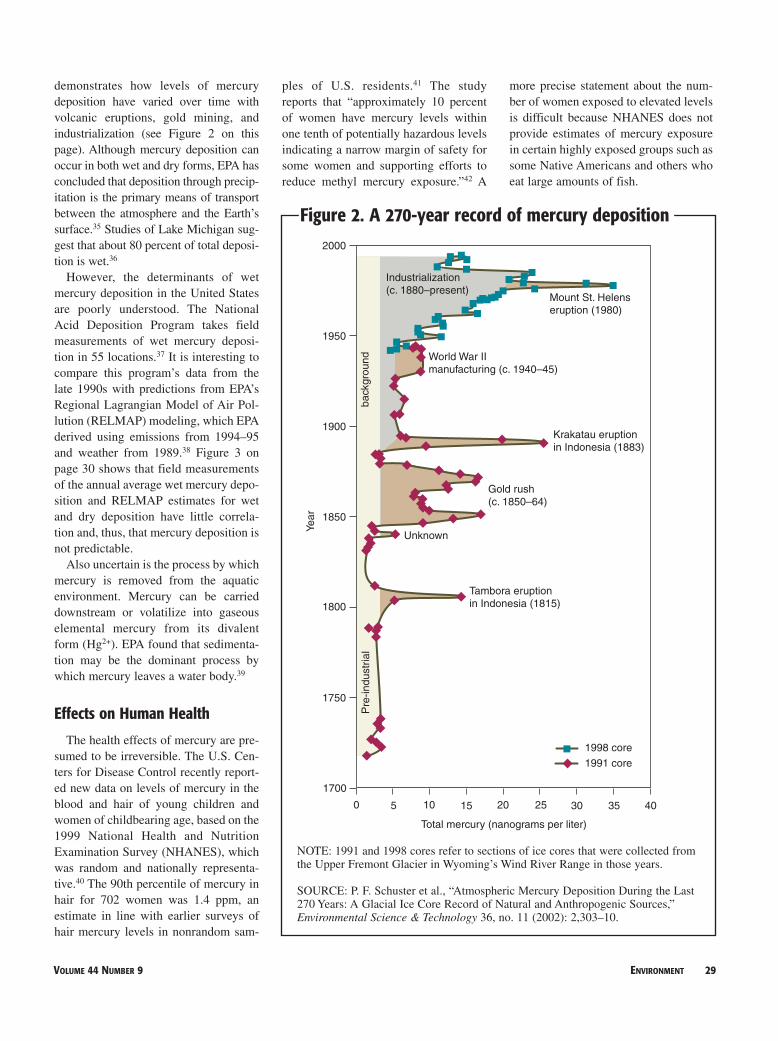
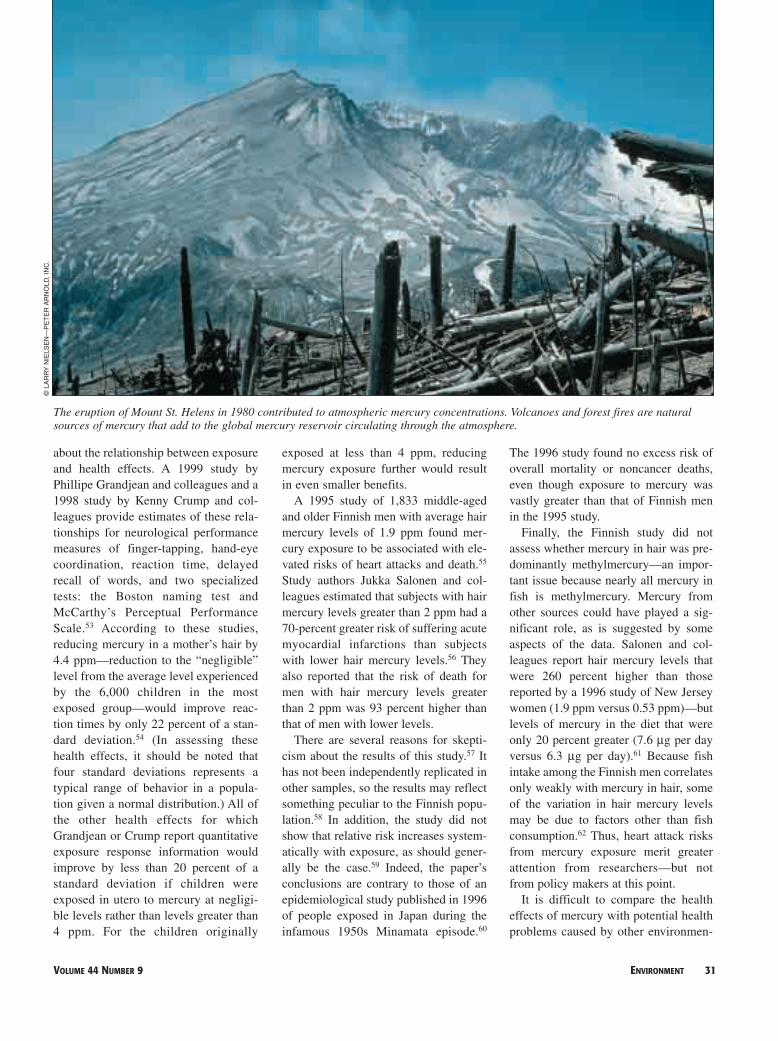
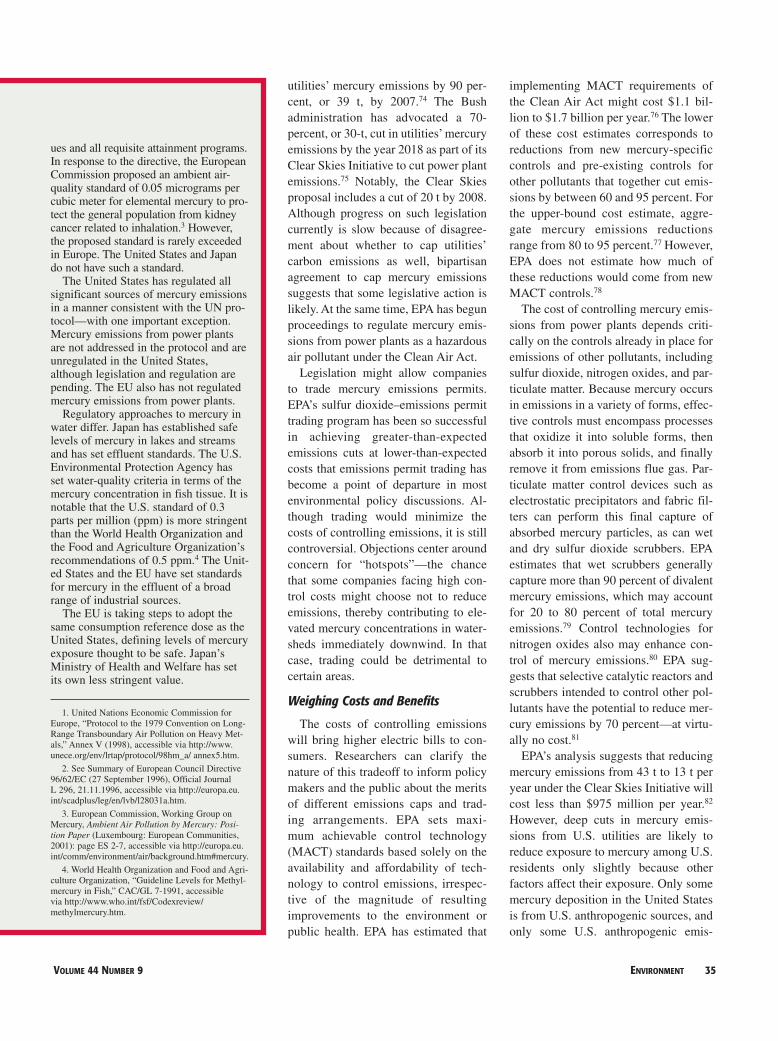
demonstrates how levels of mercurydeposition have varied over time withvolcanic eruptions, gold mining, andindustrialization (see Figure 2 on thispage). Although mercury deposition canoccur in both wet and dry forms, EPA hasconcluded that deposition through precip-itation is the primary means of transportbetween the atmosphere and the Earth’ssurface.35 Studies of Lake Michigan sug-gest that about 80 percent of total deposi-tion is wet.36
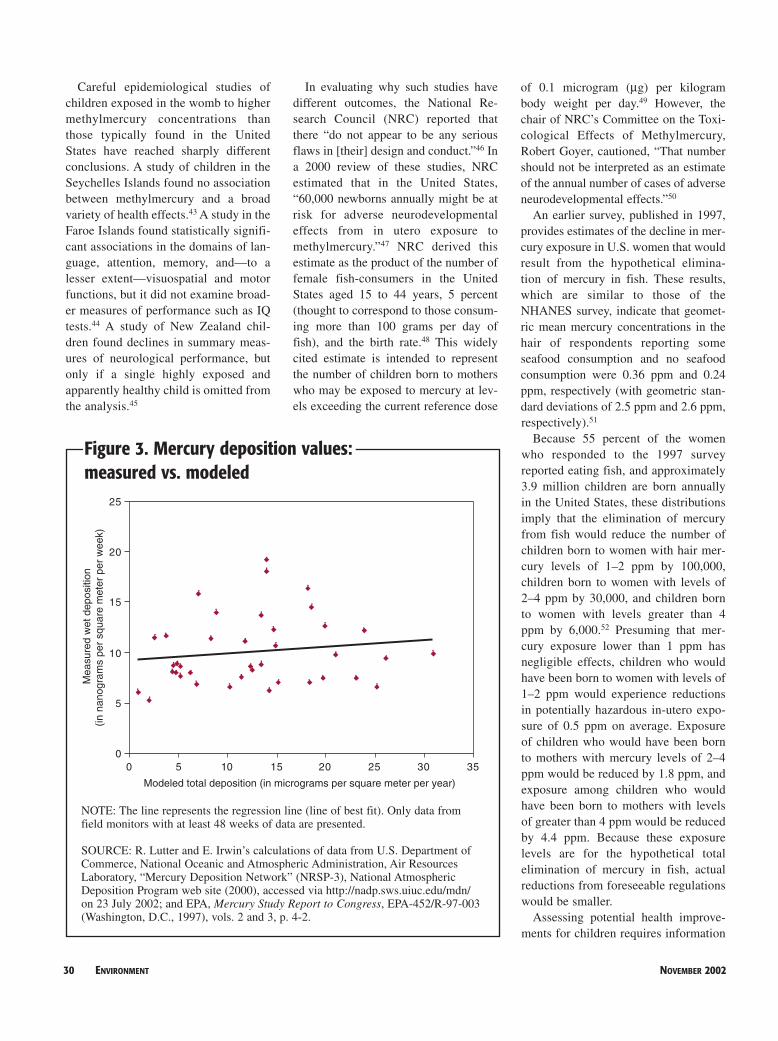
However, the determinants of wetmercury deposition in the United Statesare poorly understood. The NationalAcid Deposition Program takes fieldmeasurements of wet mercury deposi-tion in 55 locations.37 It is interesting tocompare this program’s data from thelate 1990s with predictions from EPA’sRegional Lagrangian Model of Air Pol-lution (RELMAP) modeling, which EPAderived using emissions from 1994–95and weather from 1989.38 Figure 3 onpage 30 shows that field measurementsof the annual average wet mercury depo-sition and RELMAP estimates for wetand dry deposition have little correla-tion and, thus, that mercury deposition isnot predictable.
Also uncertain is the process by whichmercury is removed from the aquaticenvironment. Mercury can be carrieddownstream or volatilize into gaseouselemental mercury from its divalentform (Hg2+). EPA found that sedimenta-tion may be the dominant process bywhich mercury leaves a water body.39
Effects on Human Health
The health effects of mercury are pre-sumed to be irreversible. The U.S. Cen-ters for Disease Control recently report-ed new data on levels of mercury in theblood and hair of young children andwomen of childbearing age, based on the1999 National Health and NutritionExamination Survey (NHANES), whichwas random and nationally representa-tive.40 The 90th percentile of mercury inhair for 702 women was 1.4 ppm, anestimate in line with earlier surveys ofhair mercury levels in nonrandom sam-
ples of U.S. residents.41 The studyreports that “approximately 10 percentof women have mercury levels withinone tenth of potentially hazardous levelsindicating a narrow margin of safety forsome women and supporting efforts toreduce methyl mercury exposure.”42 A
more precise statement about the num-ber of women exposed to elevated levelsis difficult because NHANES does notprovide estimates of mercury exposurein certain highly exposed groups such assome Native Americans and others whoeat large amounts of fish.
0 5 10 15 20 25 30 35 40
1700
1750
1800
1850
1900
1950
2000
Total mercury (nanograms per liter)
Year
back
grou
ndP
re-in
dust
rial
Industrialization(c. 1880–present)
Mount St. Helens eruption (1980)
World War II manufacturing (c. 1940–45)
Krakatau eruption in Indonesia (1883)
Gold rush (c. 1850–64)
Unknown
Tambora eruption in Indonesia (1815)
1998 core
1991 core
Figure 2. A 270-year record of mercury deposition
NOTE: 1991 and 1998 cores refer to sections of ice cores that were collected fromthe Upper Fremont Glacier in Wyoming’s Wind River Range in those years.
SOURCE: P. F. Schuster et al., “Atmospheric Mercury Deposition During the Last270 Years: A Glacial Ice Core Record of Natural and Anthropogenic Sources,”Environmental Science & Technology 36, no. 11 (2002): 2,303–10.
30 ENVIRONMENT NOVEMBER 2002
Careful epidemiological studies ofchildren exposed in the womb to highermethylmercury concentrations thanthose typically found in the UnitedStates have reached sharply differentconclusions. A study of children in theSeychelles Islands found no associationbetween methylmercury and a broadvariety of health effects.43 A study in theFaroe Islands found statistically signifi-cant associations in the domains of lan-guage, attention, memory, and—to alesser extent—visuospatial and motorfunctions, but it did not examine broad-er measures of performance such as IQtests.44 A study of New Zealand chil-dren found declines in summary meas-ures of neurological performance, butonly if a single highly exposed andapparently healthy child is omitted fromthe analysis.45
In evaluating why such studies havedifferent outcomes, the National Re-search Council (NRC) reported thatthere “do not appear to be any seriousflaws in [their] design and conduct.”46 Ina 2000 review of these studies, NRCestimated that in the United States,“60,000 newborns annually might be atrisk for adverse neurodevelopmentaleffects from in utero exposure tomethylmercury.”47 NRC derived thisestimate as the product of the number offemale fish-consumers in the UnitedStates aged 15 to 44 years, 5 percent(thought to correspond to those consum-ing more than 100 grams per day offish), and the birth rate.48 This widelycited estimate is intended to representthe number of children born to motherswho may be exposed to mercury at lev-els exceeding the current reference dose
of 0.1 microgram (µg) per kilogrambody weight per day.49 However, thechair of NRC’s Committee on the Toxi-cological Effects of Methylmercury,Robert Goyer, cautioned, “That numbershould not be interpreted as an estimateof the annual number of cases of adverseneurodevelopmental effects.”50
An earlier survey, published in 1997,provides estimates of the decline in mer-cury exposure in U.S. women that wouldresult from the hypothetical elimina-tion of mercury in fish. These results,which are similar to those of theNHANES survey, indicate that geomet-ric mean mercury concentrations in thehair of respondents reporting someseafood consumption and no seafoodconsumption were 0.36 ppm and 0.24ppm, respectively (with geometric stan-dard deviations of 2.5 ppm and 2.6 ppm,respectively).51
Because 55 percent of the womenwho responded to the 1997 surveyreported eating fish, and approximately3.9 million children are born annuallyin the United States, these distributionsimply that the elimination of mercuryfrom fish would reduce the number ofchildren born to women with hair mer-cury levels of 1–2 ppm by 100,000,children born to women with levels of2–4 ppm by 30,000, and children bornto women with levels greater than 4ppm by 6,000.52 Presuming that mer-cury exposure lower than 1 ppm hasnegligible effects, children who wouldhave been born to women with levels of1–2 ppm would experience reductionsin potentially hazardous in-utero expo-sure of 0.5 ppm on average. Exposureof children who would have been bornto mothers with mercury levels of 2–4ppm would be reduced by 1.8 ppm, andexposure among children who wouldhave been born to mothers with levelsof greater than 4 ppm would be reducedby 4.4 ppm. Because these exposurelevels are for the hypothetical totalelimination of mercury in fish, actualreductions from foreseeable regulationswould be smaller.
Assessing potential health improve-ments for children requires information
Modeled total deposition (in micrograms per square meter per year)
Mea
sure
d w
et d
epos
ition
(in
nan
ogra
ms
per
squa
re m
eter
per
wee
k)
0
5
10
15
20
25
0 5 10 15 20 25 30 35
Figure 3. Mercury deposition values:measured vs. modeled
NOTE: The line represents the regression line (line of best fit). Only data fromfield monitors with at least 48 weeks of data are presented.
SOURCE: R. Lutter and E. Irwin’s calculations of data from U.S. Department ofCommerce, National Oceanic and Atmospheric Administration, Air ResourcesLaboratory, “Mercury Deposition Network” (NRSP-3), National AtmosphericDeposition Program web site (2000), accessed via http://nadp.sws.uiuc.edu/mdn/on 23 July 2002; and EPA, Mercury Study Report to Congress, EPA-452/R-97-003(Washington, D.C., 1997), vols. 2 and 3, p. 4-2.
VOLUME 44 NUMBER 9 ENVIRONMENT 31
about the relationship between exposureand health effects. A 1999 study byPhillipe Grandjean and colleagues and a1998 study by Kenny Crump and col-leagues provide estimates of these rela-tionships for neurological performancemeasures of finger-tapping, hand-eyecoordination, reaction time, delayedrecall of words, and two specializedtests: the Boston naming test andMcCarthy’s Perceptual PerformanceScale.53 According to these studies,reducing mercury in a mother’s hair by4.4 ppm—reduction to the “negligible”level from the average level experiencedby the 6,000 children in the mostexposed group—would improve reac-tion times by only 22 percent of a stan-dard deviation.54 (In assessing thesehealth effects, it should be noted thatfour standard deviations represents atypical range of behavior in a popula-tion given a normal distribution.) All ofthe other health effects for whichGrandjean or Crump report quantitativeexposure response information wouldimprove by less than 20 percent of astandard deviation if children wereexposed in utero to mercury at negligi-ble levels rather than levels greater than4 ppm. For the children originally
exposed at less than 4 ppm, reducingmercury exposure further would resultin even smaller benefits.
A 1995 study of 1,833 middle-agedand older Finnish men with average hairmercury levels of 1.9 ppm found mer-cury exposure to be associated with ele-vated risks of heart attacks and death.55
Study authors Jukka Salonen and col-leagues estimated that subjects with hairmercury levels greater than 2 ppm had a70-percent greater risk of suffering acutemyocardial infarctions than subjectswith lower hair mercury levels.56 Theyalso reported that the risk of death formen with hair mercury levels greaterthan 2 ppm was 93 percent higher thanthat of men with lower levels.
There are several reasons for skepti-cism about the results of this study.57 Ithas not been independently replicated inother samples, so the results may reflectsomething peculiar to the Finnish popu-lation.58 In addition, the study did notshow that relative risk increases system-atically with exposure, as should gener-ally be the case.59 Indeed, the paper’sconclusions are contrary to those of anepidemiological study published in 1996of people exposed in Japan during theinfamous 1950s Minamata episode.60
The 1996 study found no excess risk ofoverall mortality or noncancer deaths,even though exposure to mercury wasvastly greater than that of Finnish menin the 1995 study.
Finally, the Finnish study did notassess whether mercury in hair was pre-dominantly methylmercury—an impor-tant issue because nearly all mercury infish is methylmercury. Mercury fromother sources could have played a sig-nificant role, as is suggested by someaspects of the data. Salonen and col-leagues report hair mercury levels thatwere 260 percent higher than thosereported by a 1996 study of New Jerseywomen (1.9 ppm versus 0.53 ppm)—butlevels of mercury in the diet that wereonly 20 percent greater (7.6 µg per dayversus 6.3 µg per day).61 Because fishintake among the Finnish men correlatesonly weakly with mercury in hair, someof the variation in hair mercury levelsmay be due to factors other than fishconsumption.62 Thus, heart attack risksfrom mercury exposure merit greaterattention from researchers—but notfrom policy makers at this point.
It is difficult to compare the healtheffects of mercury with potential healthproblems caused by other environmen-
The eruption of Mount St. Helens in 1980 contributed to atmospheric mercury concentrations. Volcanoes and forest fires are naturalsources of mercury that add to the global mercury reservoir circulating through the atmosphere.
©LA
RR
Y N
IELS
EN
—P
ET
ER
AR
NO
LD,
INC
.
32 ENVIRONMENT NOVEMBER 2002
tal factors, but the effects describedabove seem less severe than some otherssuch as cancers, fatalities from respira-tory ailments, or IQ deficits related tolead poisoning. Efforts to reduce therisk for health effects such as these arecurrently being pursued through envi-ronmental policies.
Effects on the Environment
Assessing the environmental effectsof mercury is intrinsically difficultbecause of the complexity of ecosys-tems, the existence of multiple sourcesof stress, and the many endpoints wheremercury might have adverse effects. Inits 1997 Mercury Study Report to Con-
gress, EPA described environmentaleffects by noting that environmentalmercury may adversely affect repro-duction of loons—fish-eating birds inwhich effects should be most easilydetectable because of the bioaccumula-tive properties of methylmercury. How-ever, common loon populations grew atan annual rate of 2.6 percent between1966 and 1999.63 Populations of otherfish-eating birds grew at even fasterrates.64 Such high growth rates and theunderstanding that there appears to beno correlation between areas of low pop-ulation growth and areas of high mer-cury deposition suggest that the eco-logical benefits of reducing mercuryemissions may not be great.65
Florida panthers also may be at risk ofmethylmercury poisoning, because highmercury concentrations in their habitathave caused high mercury concentrationsin their prey. According to EPA, “Mer-cury levels found in tissues obtainedfrom dead panthers are similar to levelsthat have been associated with franktoxic effects in other feline species.”66
Over the last decade, however, the Flori-da panther population apparently has in-creased to 80 from between 30 and 50 asa result of introducing new panthers intothe area to reduce inbreeding.67
Although a recent screening-levelassessment of mercury in southernFlorida food webs suggested that 100percent of alligators are exposed tomethylmercury at concentrations thatexceed toxic reference values for sensi-tive bird and mammal species, no dataon its toxicity to alligators are avail-able.68 No studies that quantitativelyestimate the effect of methylmercury onthe population of alligators or otherindicator species are apparent.
Mercury Controls
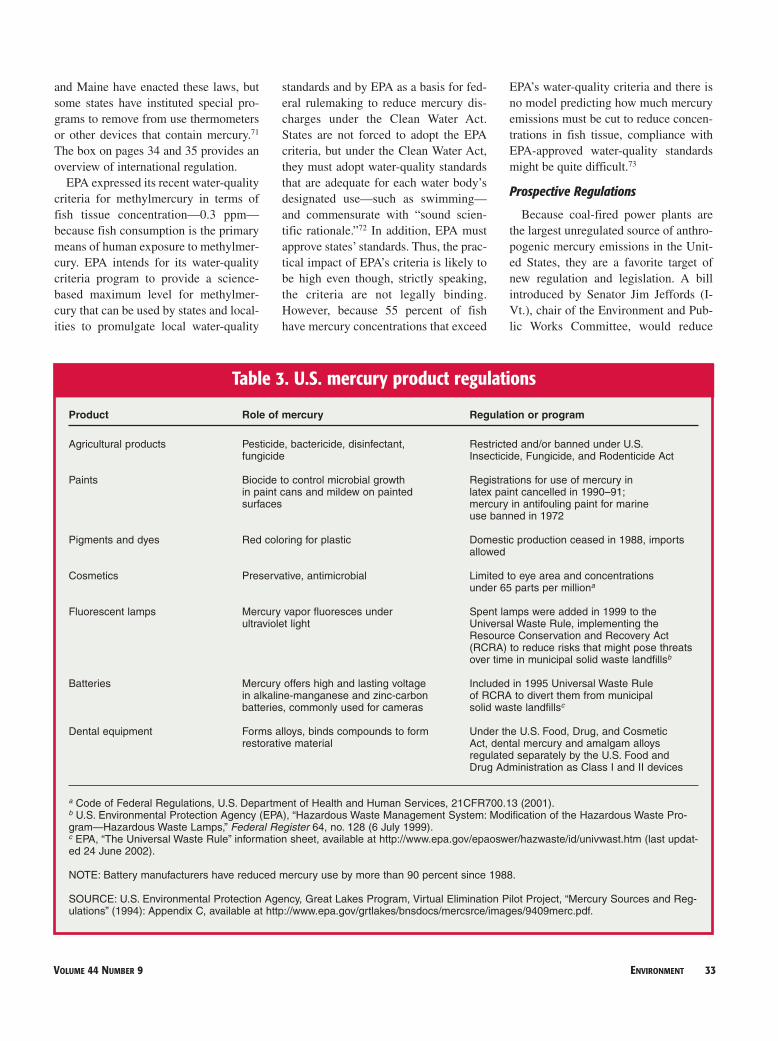
Policy makers should take into ac-count the environmental and healtheffects of mercury when they design newregulations to limit mercury releases. Inthe past several years, EPA has issuedthree regulations to limit mercury emis-sions (as shown in Table 2). The U.S.government has regulated a diverse set ofpossible uses of mercury under otherlaws, as listed in Table 3 on page 33.Concern about the environmental effectsof mercury has prompted a variety ofindustry and state efforts to restrict thesale of certain products and implementdisposal programs; these measures re-duced industrial demand for mercury by75 percent between 1988 and 1997.69 Todate, 18 states have proposed 49 bills thatwould restrict or prohibit products thatcontain mercury; limit mercury emis-sions from power plants; or establishproduct-labeling requirements, health-warning standards for water bodies, orwaste-management programs.70 Current-ly, only Indiana, Maryland, Minnesota,
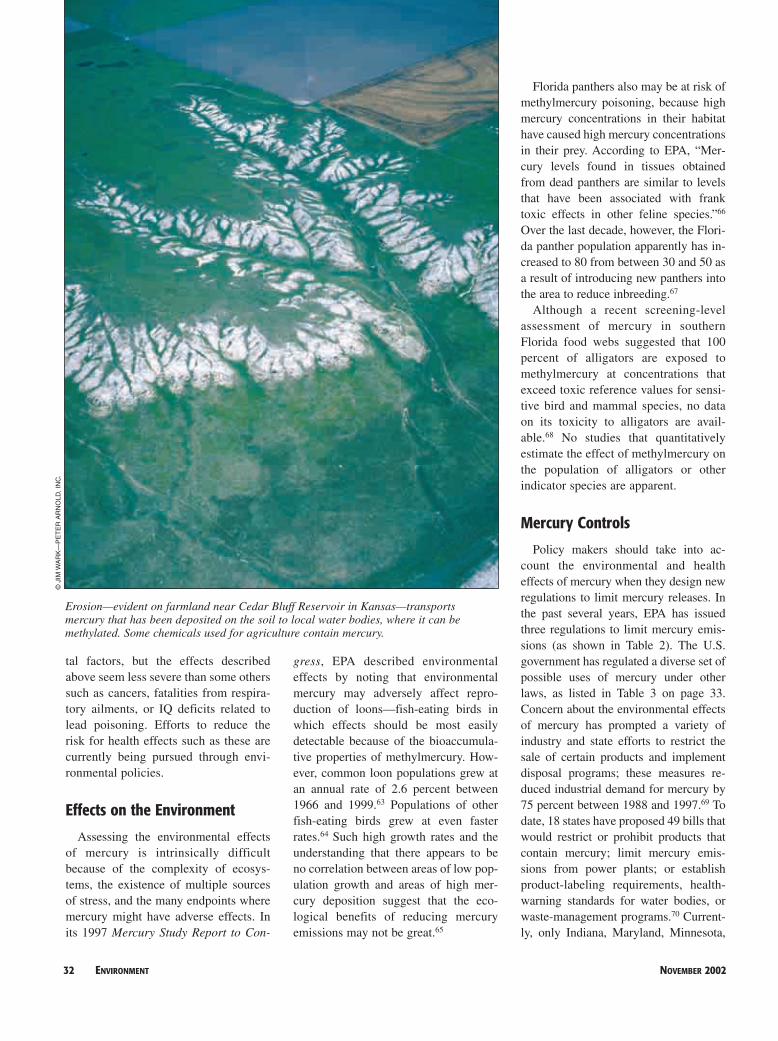
Erosion—evident on farmland near Cedar Bluff Reservoir in Kansas—transportsmercury that has been deposited on the soil to local water bodies, where it can bemethylated. Some chemicals used for agriculture contain mercury.
©JI
M W
AR
K—
PE
TE
R A
RN
OLD
, IN
C.
VOLUME 44 NUMBER 9 ENVIRONMENT 33
and Maine have enacted these laws, butsome states have instituted special pro-grams to remove from use thermometersor other devices that contain mercury.71
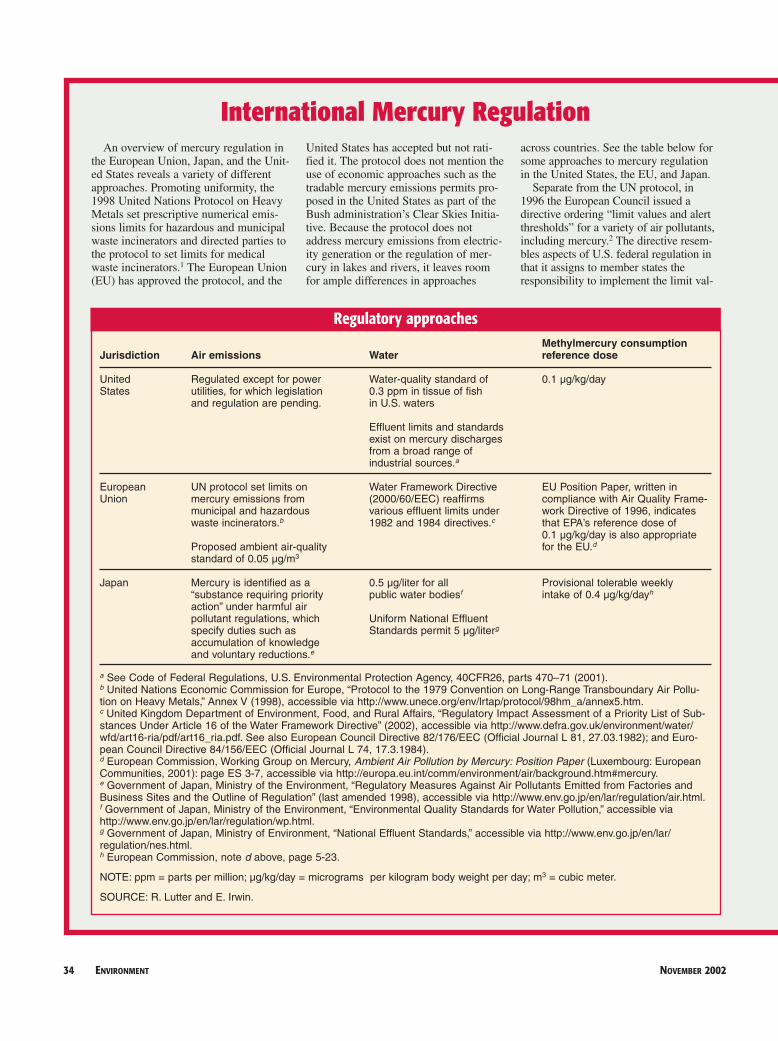
The box on pages 34 and 35 provides anoverview of international regulation.
EPA expressed its recent water-qualitycriteria for methylmercury in terms offish tissue concentration—0.3 ppm—because fish consumption is the primarymeans of human exposure to methylmer-cury. EPA intends for its water-qualitycriteria program to provide a science-based maximum level for methylmer-cury that can be used by states and local-ities to promulgate local water-quality
standards and by EPA as a basis for fed-eral rulemaking to reduce mercury dis-charges under the Clean Water Act.States are not forced to adopt the EPAcriteria, but under the Clean Water Act,they must adopt water-quality standardsthat are adequate for each water body’sdesignated use—such as swimming—and commensurate with “sound scien-tific rationale.”72 In addition, EPA mustapprove states’ standards. Thus, the prac-tical impact of EPA’s criteria is likely tobe high even though, strictly speaking,the criteria are not legally binding.However, because 55 percent of fishhave mercury concentrations that exceed
EPA’s water-quality criteria and there isno model predicting how much mercuryemissions must be cut to reduce concen-trations in fish tissue, compliance withEPA-approved water-quality standardsmight be quite difficult.73
Prospective Regulations
Because coal-fired power plants arethe largest unregulated source of anthro-pogenic mercury emissions in the Unit-ed States, they are a favorite target ofnew regulation and legislation. A billintroduced by Senator Jim Jeffords (I-Vt.), chair of the Environment and Pub-lic Works Committee, would reduce
Product Role of mercury Regulation or program
Agricultural products Pesticide, bactericide, disinfectant, Restricted and/or banned under U.S.fungicide Insecticide, Fungicide, and Rodenticide Act
Paints Biocide to control microbial growth Registrations for use of mercury inin paint cans and mildew on painted latex paint cancelled in 1990–91;surfaces mercury in antifouling paint for marine
use banned in 1972
Pigments and dyes Red coloring for plastic Domestic production ceased in 1988, importsallowed
Cosmetics Preservative, antimicrobial Limited to eye area and concentrations under 65 parts per milliona
Fluorescent lamps Mercury vapor fluoresces under Spent lamps were added in 1999 to theultraviolet light Universal Waste Rule, implementing the
Resource Conservation and Recovery Act (RCRA) to reduce risks that might pose threats over time in municipal solid waste landfillsb
Batteries Mercury offers high and lasting voltage Included in 1995 Universal Waste Rulein alkaline-manganese and zinc-carbon of RCRA to divert them from municipalbatteries, commonly used for cameras solid waste landfillsc
Dental equipment Forms alloys, binds compounds to form Under the U.S. Food, Drug, and Cosmeticrestorative material Act, dental mercury and amalgam alloys
regulated separately by the U.S. Food and Drug Administration as Class I and II devices
a Code of Federal Regulations, U.S. Department of Health and Human Services, 21CFR700.13 (2001).b U.S. Environmental Protection Agency (EPA), “Hazardous Waste Management System: Modification of the Hazardous Waste Pro-gram—Hazardous Waste Lamps,” Federal Register 64, no. 128 (6 July 1999).c EPA, “The Universal Waste Rule” information sheet, available at http://www.epa.gov/epaoswer/hazwaste/id/univwast.htm (last updat-ed 24 June 2002).
NOTE: Battery manufacturers have reduced mercury use by more than 90 percent since 1988.
SOURCE: U.S. Environmental Protection Agency, Great Lakes Program, Virtual Elimination Pilot Project, “Mercury Sources and Reg-ulations” (1994): Appendix C, available at http://www.epa.gov/grtlakes/bnsdocs/mercsrce/images/9409merc.pdf.
Table 3. U.S. mercury product regulations
34 ENVIRONMENT NOVEMBER 2002
International Mercury Regulation
Methylmercury consumption Jurisdiction Air emissions Water reference dose
United Regulated except for power Water-quality standard of 0.1 µg/kg/dayStates utilities, for which legislation 0.3 ppm in tissue of fish
and regulation are pending. in U.S. waters
Effluent limits and standards exist on mercury discharges from a broad range of industrial sources.a
European UN protocol set limits on Water Framework Directive EU Position Paper, written inUnion mercury emissions from (2000/60/EEC) reaffirms compliance with Air Quality Frame-
municipal and hazardous various effluent limits under work Directive of 1996, indicateswaste incinerators.b 1982 and 1984 directives.c that EPA’s reference dose of
0.1 µg/kg/day is also appropriateProposed ambient air-quality for the EU.d
standard of 0.05 µg/m3
Japan Mercury is identified as a 0.5 µg/liter for all Provisional tolerable weekly“substance requiring priority public water bodiesf intake of 0.4 µg/kg/dayh
action” under harmful air pollutant regulations, which Uniform National Effluentspecify duties such as Standards permit 5 µg/literg
accumulation of knowledgeand voluntary reductions.e
a See Code of Federal Regulations, U.S. Environmental Protection Agency, 40CFR26, parts 470–71 (2001).b United Nations Economic Commission for Europe, “Protocol to the 1979 Convention on Long-Range Transboundary Air Pollu-tion on Heavy Metals,” Annex V (1998), accessible via http://www.unece.org/env/lrtap/protocol/98hm_a/annex5.htm.c United Kingdom Department of Environment, Food, and Rural Affairs, “Regulatory Impact Assessment of a Priority List of Sub-stances Under Article 16 of the Water Framework Directive” (2002), accessible via http://www.defra.gov.uk/environment/water/wfd/art16-ria/pdf/art16_ria.pdf. See also European Council Directive 82/176/EEC (Official Journal L 81, 27.03.1982); and Euro-pean Council Directive 84/156/EEC (Official Journal L 74, 17.3.1984).d European Commission, Working Group on Mercury, Ambient Air Pollution by Mercury: Position Paper (Luxembourg: EuropeanCommunities, 2001): page ES 3-7, accessible via http://europa.eu.int/comm/environment/air/background.htm#mercury.e Government of Japan, Ministry of the Environment, “Regulatory Measures Against Air Pollutants Emitted from Factories andBusiness Sites and the Outline of Regulation” (last amended 1998), accessible via http://www.env.go.jp/en/lar/regulation/air.html.f Government of Japan, Ministry of the Environment, “Environmental Quality Standards for Water Pollution,” accessible viahttp://www.env.go.jp/en/lar/regulation/wp.html.g Government of Japan, Ministry of Environment, “National Effluent Standards,” accessible via http://www.env.go.jp/en/lar/regulation/nes.html.h European Commission, note d above, page 5-23.
NOTE: ppm = parts per million; µg/kg/day = micrograms per kilogram body weight per day; m3 = cubic meter.
SOURCE: R. Lutter and E. Irwin.
Regulatory approaches
An overview of mercury regulation inthe European Union, Japan, and the Unit-ed States reveals a variety of differentapproaches. Promoting uniformity, the1998 United Nations Protocol on HeavyMetals set prescriptive numerical emis-sions limits for hazardous and municipalwaste incinerators and directed parties tothe protocol to set limits for medicalwaste incinerators.1 The European Union(EU) has approved the protocol, and the
United States has accepted but not rati-fied it. The protocol does not mention theuse of economic approaches such as thetradable mercury emissions permits pro-posed in the United States as part of theBush administration’s Clear Skies Initia-tive. Because the protocol does notaddress mercury emissions from electric-ity generation or the regulation of mer-cury in lakes and rivers, it leaves roomfor ample differences in approaches
across countries. See the table below forsome approaches to mercury regulationin the United States, the EU, and Japan.
Separate from the UN protocol, in1996 the European Council issued adirective ordering “limit values and alertthresholds” for a variety of air pollutants,including mercury.2 The directive resem-bles aspects of U.S. federal regulation inthat it assigns to member states theresponsibility to implement the limit val-
VOLUME 44 NUMBER 9 ENVIRONMENT 35
utilities’ mercury emissions by 90 per-cent, or 39 t, by 2007.74 The Bushadministration has advocated a 70-percent, or 30-t, cut in utilities’ mercuryemissions by the year 2018 as part of itsClear Skies Initiative to cut power plantemissions.75 Notably, the Clear Skiesproposal includes a cut of 20 t by 2008.Although progress on such legislationcurrently is slow because of disagree-ment about whether to cap utilities’carbon emissions as well, bipartisanagreement to cap mercury emissionssuggests that some legislative action islikely. At the same time, EPA has begunproceedings to regulate mercury emis-sions from power plants as a hazardousair pollutant under the Clean Air Act.
Legislation might allow companiesto trade mercury emissions permits.EPA’s sulfur dioxide–emissions permittrading program has been so successfulin achieving greater-than-expectedemissions cuts at lower-than-expectedcosts that emissions permit trading hasbecome a point of departure in mostenvironmental policy discussions. Al-though trading would minimize thecosts of controlling emissions, it is stillcontroversial. Objections center aroundconcern for “hotspots”—the chancethat some companies facing high con-trol costs might choose not to reduceemissions, thereby contributing to ele-vated mercury concentrations in water-sheds immediately downwind. In thatcase, trading could be detrimental tocertain areas.
Weighing Costs and Benefits
The costs of controlling emissionswill bring higher electric bills to con-sumers. Researchers can clarify thenature of this tradeoff to inform policymakers and the public about the meritsof different emissions caps and trad-ing arrangements. EPA sets maxi-mum achievable control technology(MACT) standards based solely on theavailability and affordability of tech-nology to control emissions, irrespec-tive of the magnitude of resultingimprovements to the environment orpublic health. EPA has estimated that
implementing MACT requirements ofthe Clean Air Act might cost $1.1 bil-lion to $1.7 billion per year.76 The lowerof these cost estimates corresponds toreductions from new mercury-specificcontrols and pre-existing controls forother pollutants that together cut emis-sions by between 60 and 95 percent. Forthe upper-bound cost estimate, aggre-gate mercury emissions reductionsrange from 80 to 95 percent.77 However,EPA does not estimate how much ofthese reductions would come from newMACT controls.78
The cost of controlling mercury emis-sions from power plants depends criti-cally on the controls already in place foremissions of other pollutants, includingsulfur dioxide, nitrogen oxides, and par-ticulate matter. Because mercury occursin emissions in a variety of forms, effec-tive controls must encompass processesthat oxidize it into soluble forms, thenabsorb it into porous solids, and finallyremove it from emissions flue gas. Par-ticulate matter control devices such aselectrostatic precipitators and fabric fil-ters can perform this final capture ofabsorbed mercury particles, as can wetand dry sulfur dioxide scrubbers. EPAestimates that wet scrubbers generallycapture more than 90 percent of divalentmercury emissions, which may accountfor 20 to 80 percent of total mercuryemissions.79 Control technologies fornitrogen oxides also may enhance con-trol of mercury emissions.80 EPA sug-gests that selective catalytic reactors andscrubbers intended to control other pol-lutants have the potential to reduce mer-cury emissions by 70 percent—at virtu-ally no cost.81
EPA’s analysis suggests that reducingmercury emissions from 43 t to 13 t peryear under the Clear Skies Initiative willcost less than $975 million per year.82
However, deep cuts in mercury emis-sions from U.S. utilities are likely toreduce exposure to mercury among U.S.residents only slightly because otherfactors affect their exposure. Only somemercury deposition in the United Statesis from U.S. anthropogenic sources, andonly some U.S. anthropogenic emis-
ues and all requisite attainment programs.In response to the directive, the EuropeanCommission proposed an ambient air-quality standard of 0.05 micrograms percubic meter for elemental mercury to pro-tect the general population from kidneycancer related to inhalation.3 However,the proposed standard is rarely exceededin Europe. The United States and Japando not have such a standard.
The United States has regulated allsignificant sources of mercury emissionsin a manner consistent with the UN pro-tocol—with one important exception.Mercury emissions from power plantsare not addressed in the protocol and areunregulated in the United States,although legislation and regulation arepending. The EU also has not regulatedmercury emissions from power plants.
Regulatory approaches to mercury inwater differ. Japan has established safelevels of mercury in lakes and streamsand has set effluent standards. The U.S.Environmental Protection Agency hasset water-quality criteria in terms of themercury concentration in fish tissue. It isnotable that the U.S. standard of 0.3parts per million (ppm) is more stringentthan the World Health Organization andthe Food and Agriculture Organization’srecommendations of 0.5 ppm.4 The Unit-ed States and the EU have set standardsfor mercury in the effluent of a broadrange of industrial sources.
The EU is taking steps to adopt thesame consumption reference dose as theUnited States, defining levels of mercuryexposure thought to be safe. Japan’sMinistry of Health and Welfare has setits own less stringent value.
1. United Nations Economic Commission forEurope, “Protocol to the 1979 Convention on Long-Range Transboundary Air Pollution on Heavy Met-als,” Annex V (1998), accessible via http://www.unece.org/env/lrtap/protocol/98hm_a/ annex5.htm.
2. See Summary of European Council Directive96/62/EC (27 September 1996), Official Journal L 296, 21.11.1996, accessible via http://europa.eu.int/scadplus/leg/en/lvb/l28031a.htm.
3. European Commission, Working Group onMercury, Ambient Air Pollution by Mercury: Posi-tion Paper (Luxembourg: European Communities,2001): page ES 2-7, accessible via http://europa.eu.int/comm/environment/air/background.htm#mercury.
4. World Health Organization and Food and Agri-culture Organization, “Guideline Levels for Methyl-mercury in Fish,” CAC/GL 7-1991, accessible via http://www.who.int/fsf/Codexreview/methylmercury.htm.
36 ENVIRONMENT NOVEMBER 2002
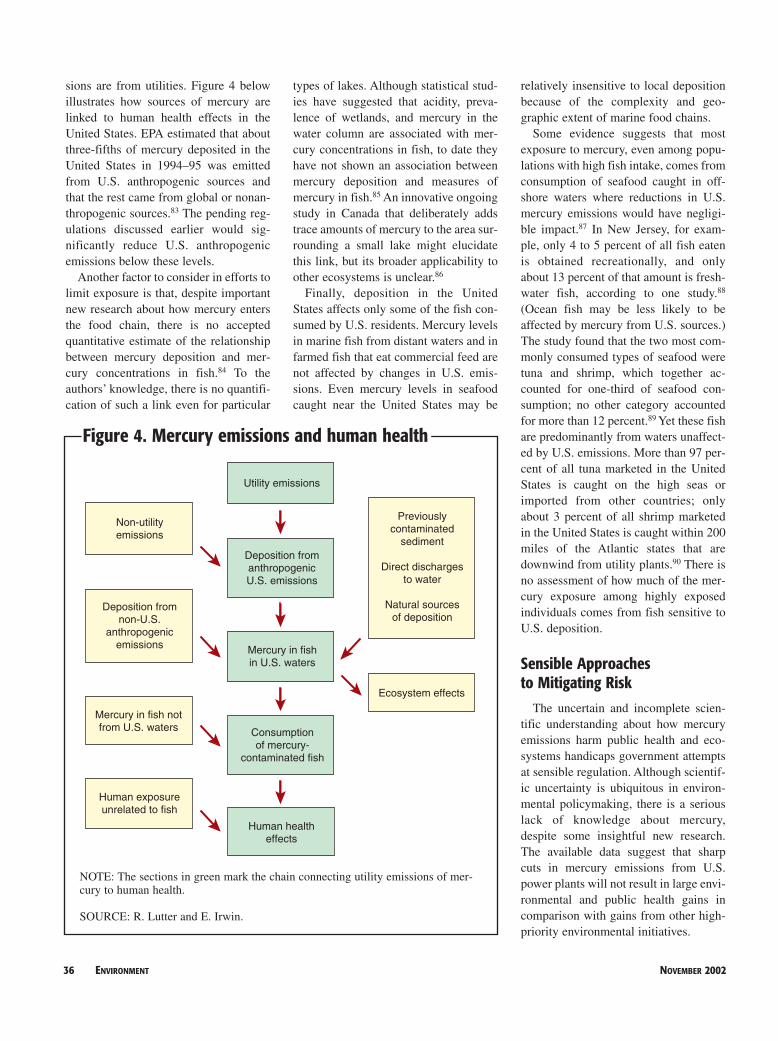
sions are from utilities. Figure 4 belowillustrates how sources of mercury arelinked to human health effects in theUnited States. EPA estimated that aboutthree-fifths of mercury deposited in theUnited States in 1994–95 was emittedfrom U.S. anthropogenic sources andthat the rest came from global or nonan-thropogenic sources.83 The pending reg-ulations discussed earlier would sig-nificantly reduce U.S. anthropogenicemissions below these levels.
Another factor to consider in efforts tolimit exposure is that, despite importantnew research about how mercury entersthe food chain, there is no acceptedquantitative estimate of the relationshipbetween mercury deposition and mer-cury concentrations in fish.84 To theauthors’ knowledge, there is no quantifi-cation of such a link even for particular
types of lakes. Although statistical stud-ies have suggested that acidity, preva-lence of wetlands, and mercury in thewater column are associated with mer-cury concentrations in fish, to date theyhave not shown an association betweenmercury deposition and measures ofmercury in fish.85 An innovative ongoingstudy in Canada that deliberately addstrace amounts of mercury to the area sur-rounding a small lake might elucidatethis link, but its broader applicability toother ecosystems is unclear.86
Finally, deposition in the UnitedStates affects only some of the fish con-sumed by U.S. residents. Mercury levelsin marine fish from distant waters and infarmed fish that eat commercial feed arenot affected by changes in U.S. emis-sions. Even mercury levels in seafoodcaught near the United States may be
relatively insensitive to local depositionbecause of the complexity and geo-graphic extent of marine food chains.
Some evidence suggests that mostexposure to mercury, even among popu-lations with high fish intake, comes fromconsumption of seafood caught in off-shore waters where reductions in U.S.mercury emissions would have negligi-ble impact.87 In New Jersey, for exam-ple, only 4 to 5 percent of all fish eatenis obtained recreationally, and onlyabout 13 percent of that amount is fresh-water fish, according to one study.88
(Ocean fish may be less likely to beaffected by mercury from U.S. sources.)The study found that the two most com-monly consumed types of seafood weretuna and shrimp, which together ac-counted for one-third of seafood con-sumption; no other category accountedfor more than 12 percent.89 Yet these fishare predominantly from waters unaffect-ed by U.S. emissions. More than 97 per-cent of all tuna marketed in the UnitedStates is caught on the high seas orimported from other countries; onlyabout 3 percent of all shrimp marketedin the United States is caught within 200miles of the Atlantic states that aredownwind from utility plants.90 There isno assessment of how much of the mer-cury exposure among highly exposedindividuals comes from fish sensitive toU.S. deposition.
Sensible Approaches to Mitigating Risk
The uncertain and incomplete scien-tific understanding about how mercuryemissions harm public health and eco-systems handicaps government attemptsat sensible regulation. Although scientif-ic uncertainty is ubiquitous in environ-mental policymaking, there is a seriouslack of knowledge about mercury,despite some insightful new research.The available data suggest that sharpcuts in mercury emissions from U.S.power plants will not result in large envi-ronmental and public health gains incomparison with gains from other high-priority environmental initiatives.
Previously contaminated
sediment
Direct discharges to water
Natural sources of deposition
Consumption of mercury-
contaminated fish
Ecosystem effects
Deposition from anthropogenic U.S. emissions
Deposition from non-U.S.
anthropogenic emissions Mercury in fish
in U.S. waters
Human exposure unrelated to fish
Mercury in fish not from U.S. waters
Human health effects
Utility emissions
Non-utility emissions
Figure 4. Mercury emissions and human health
NOTE: The sections in green mark the chain connecting utility emissions of mer-cury to human health.
SOURCE: R. Lutter and E. Irwin.
VOLUME 44 NUMBER 9 ENVIRONMENT 37
Based on survey evidence linkingmercury in women’s hair to their fishconsumption and the exposure-responserelationships from epidemiological stud-ies, the hypothetical complete elimina-tion of mercury from fish would benefitonly a relatively small number of chil-dren. Approximately 6,000 childrenwould experience improvements in spe-cific, narrow measures of neurologicalperformance (between 13 percent and 22percent of a standard deviation)—asmall change.91 Larger numbers of chil-dren would experience even smaller im-provements, assuming that the exposure-response relationships are valid at lowerlevels of exposure. Even very sharp cutsin U.S. power plants’ mercury emissionswould provide much more modest bene-fits because they would affect only oneof many sources of mercury to whichU.S. women are exposed.
Measuring these health gains againstthose from other environmental initia-tives requires a difficult apples-to-oranges comparison, because the valueof such changes in neurological perform-ance has not been quantified. Nonethe-less, the scope of health benefits due toreduced mercury emissions appearssmaller than that of benefits from pro-posed cuts in sulfur dioxide and nitrogenoxides, which EPA estimates would pre-vent more than 10,000 deaths annuallyfrom respiratory and other ailments.92
These potential benefits also appearsmall when considering the costs ofEPA’s pending technology-based mer-cury regulations—from $1.1 billion to$1.7 billion annually. On a per-childbasis, the costs of MACT standardswould be on the order of $10,000, con-servatively including all affected chil-dren and completely ignoring the limitedeffectiveness of cuts in U.S. utility emis-sions in reducing exposure to mercury infish. While such comparisons sometimessuggest unsettling tradeoffs betweencorporate profits and children’s health,such suggestions are dubious here. Thehealth effects are not changes in thehealth of identifiable children but aresmall differences in the risk that all chil-dren face. Moreover, utilities pass on to
consumers the costs associated withemissions controls. Thus the tradeoff isreally between the cost of reductions forcollective U.S. consumers and the poten-tial for subtle health improvements.
Multipollutant approaches such as theClear Skies Initiative and Senator Jef-fords’s proposal could reduce mercurymore cost-effectively than mercury regu-lations alone because new controls onnitrogen oxides and sulfur dioxide pro-vide “free” reductions in mercury emis-sions. However, the authors are unawareof estimates of the incremental cost ofcaps on mercury emissions, assumingcuts in nitrogen oxides and sulfur diox-ide consistent with Clear Skies, Jef-fords’s proposal, or other legislative ini-tiatives. Thus it is premature to assessthe economic merit of the mercury cutsin these proposals.
Economics and risk assessment canand should play a prominent role in pub-
lic debate about the merit of environ-mental initiatives, although Congressand EPA consider many other factors indeveloping new legislation. The chal-lenge to the research community is toimprove understanding of the merit ofmercury controls quickly enough to helpCongress and EPA develop sensible lim-its for mercury emissions.
Randall Lutter is a resident scholar with the AmericanEnterprise Institute (AEI) and a fellow with the AEI-Brookings Joint Center for Regulatory Studies inWashington, D.C. Elisabeth Irwin is a research assis-tant with AEI. The authors’ work focuses on air pollu-tion, residential lead hazards, food safety, and otherregulatory policies to protect health, safety, and theenvironment. Selected other publications are availableat http://aei.brookings.org. The authors welcome com-ments through Lutter at (202) 862-5885 or by e-mail [email protected].
NOTES
1. National Research Council (NRC), Committeeon the Toxicological Effects of Methylmercury, Boardon Environmental Studies and Toxicology, Commis-
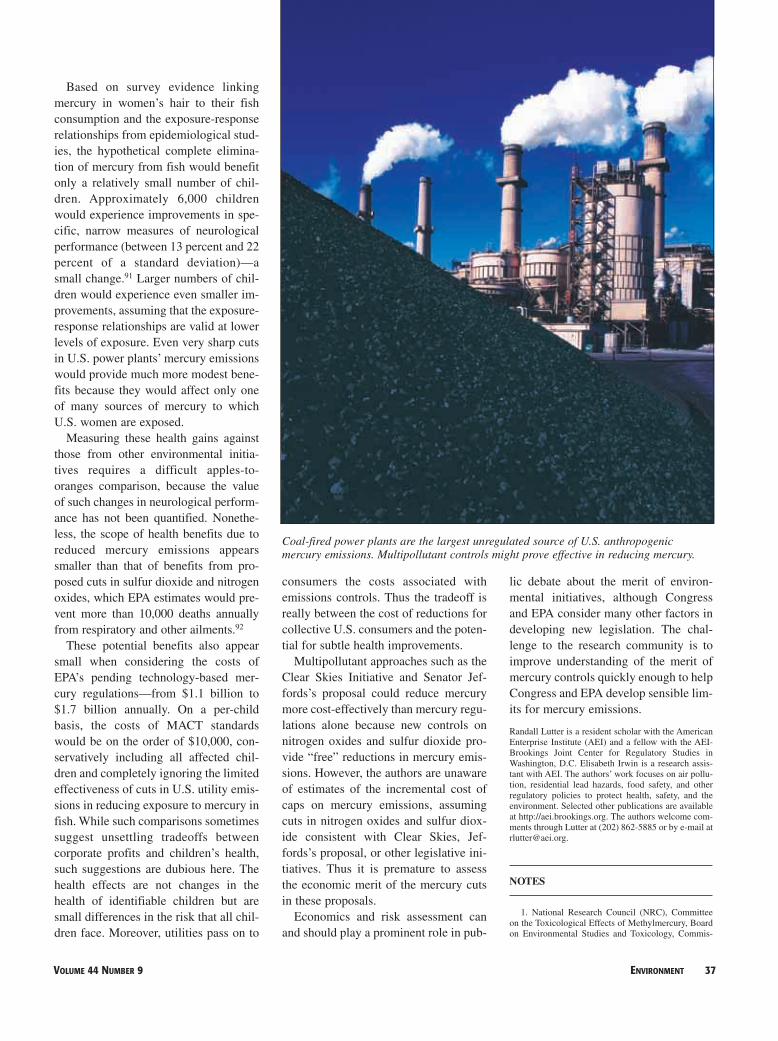
Coal-fired power plants are the largest unregulated source of U.S. anthropogenicmercury emissions. Multipollutant controls might prove effective in reducing mercury.
sion on Life Sciences, Toxicological Effects of MeHg(Washington, D.C.: National Academy Press, 2000).
2. U.S. Environmental Protection Agency (EPA),“Mercury Update: Impact on Fish Advisories,” EPA-823-F-01-011 (Washington, D.C.: EPA Office ofWater, 2001), available at http://www.epa.gov/ost/fishadvice/mercupd.pdf.
3. NRC, note 1 above, page 11. This report con-cluded that EPA’s reference dose for methylmercury(0.1 microgram per kilogram body weight per day),which is more stringent than the U.S. Food and DrugAdministration’s (FDA) action level of 1 part per million (ppm), is “a scientifically justifiable level forthe protection of public health.” Publication of thereport generated scrutiny of the FDA standard. See L.Neergaard, “FDA Says Mercury in Some Fish CouldHarm Babies’ Brains,” Detroit News, 13 January 2001,available at http://detnews.com/2001/health/0101/13/health-175462.htm.
4. See EPA, “Regulatory Finding on the Emissionsof Hazardous Air Pollutants from Electric UtilitySteam Generating Units,” Federal Register 65, no. 245(20 December 2000): 79,825–31.
5. EPA must issue a final rule by December 2004(EPA, note 2 above). See also EPA, “Fact Sheet: Clear
Skies Initiative,” at http://www.epa.gov/clearskies/clearskiesfactsheet_3_26.pdf, accessed 19 August 2002.
6. See The White House, Executive Order 12866,Regulatory Planning and Review, 30 September 1993,which is still used by the Bush administration.
7. EPA, Mercury Study Report to Congress, EPA-452/R-97-003 (Washington, D.C., 1997), vol. 1, p. 2-1.This report (volumes 1–8) is accessible via http://www.epa.gov/oar/mercury.html.
8. EPA and Environment Canada, “Draft Report:Mercury Sources and Regulations” (Washington, D.C.:EPA, 1999), available at http://www.epa.gov/grtlakes/bns/mercury/stephg.html.
9. EPA, note 7 above, vol. 1, page 0-1.
10. Ibid.
11. Ibid., vol. 2, page ES-2; and L. Poissant, M.Amyot, M. Pilote, and D. Lean, “Mercury Water-AirExchange over the Upper St. Lawrence River and LakeOntario,” Environmental Science & Technology 34(2000): 3,069–78.
12. EPA, note 7 above, vol. 2, Table ES-3.
13. EPA, “Standards of Performance for New Sta-tionary Sources and Emission Guidelines for ExistingSources: Hospital/Medical/Infectious Waste Incinera-
tors: Final Rule,” Federal Register 62, no. 178 (15 Sep-tember 1997); and EPA, “Large Municipal Waste Com-bustion Units: Emission Guidelines: Final Rule,” Fed-eral Register 62, no. 164 (25 August 1997).
14. Potential mercury reductions from these regula-tions are taken from EPA, Deposition of Air Pollutantsto the Great Waters Third Report to Congress 2000(Washington, D.C., 2000): Table III-2.
15. C. N. Alpers and M. P. Hunerlach, “Mercury Con-tamination from Historic Gold Mining in California,”U.S. Geological Survey (USGS) Fact Sheet FS-061-00,accessed via http://water.wr.usgs.gov/mercury/fs06100.html on 23 July 2002. See also M. P. Huner-lach, J. J. Rytuba, and C. N. Alpers, “Mercury Contam-ination from Hydraulic Placer-Gold Mining in theDutch Flat Mining District,” USGS Water-ResourcesInvestigations Report 99-4018B (1999): 179–89.
16. Ibid.17. EPA, note 7 above, vol. 1, page 2-13.18. Ibid., page 2-5. 19. Ibid.20. R. P. Mason, J. R. Reinfelder, and F. M. Morel,
“Uptake, Toxicity, and Trophic Transfer of Mercury ina Coastal Diatom,” Environmental Science & Technol-ogy 30, no. 6 (1996): 1,835.
21. EPA, note 7 above, vol. 1, page 3-18.
22. S. Qian, W. Warren-Hicks, J. Keating, D. R. J.Moore, and R. S. Teed, “A Predictive Model of Mer-cury Fish Tissue Concentrations for the SoutheasternUnited States,” Environmental Science & Technology35, no. 5 (2001): 941–47.
23. C. T. Zaneski, “Toxin Taking Toll on Wildlife inthe Everglades,” Miami Herald, 22 August 1999, 1A.
24. USGS, “Mercury in the Geochemical Cycle andFood Chain of the Everglades,” Mercury Studies in theFlorida Everglades (1999): 1, accessed via http://sofia.usgs.gov/publications/fs/166-96/printfood.htmlon 23 July 2002. See also S. Ullrich, T. W. Tanton, andS. A. Abdrashitova, “Mercury in the Aquatic Environ-ment: A Review of Factors Affecting Methylation,”Critical Reviews in Environmental Science and Tech-nology 31, no. 3 (2001): 241–93.
25. EPA, note 7 above, vol. 1, page 3-18.
26. USGS, note 24 above.
27. EPA, The National Survey of Mercury Concentra-tions in Fish: Data Base Summary 1990–1995, EPA-823-R-99-014 (Washington, D.C., 1999): page 4-7.
28. EPA, note 7 above, vol. 3, page ES-6.
29. See, for example, ibid., page 2-6.
30. EPA, note 14 above, page 2-15.
31. EPA, note 27 above, page 1-1.
32. EPA, note 27 above.
33. EPA, “Water Quality Criteria: Notice of Avail-ability of Water Quality Criterion for the Protection ofHuman Health: Methylmercury,” Federal Register 66,no. 5 (8 January 2001): 1,344.
34. EPA, note 7 above.
35. Ibid., vol. 1, page 2-4.
36. M. S. Landis, “Assessing the Atmospheric Depo-sition of Mercury to Lake Michigan: The Importance ofthe Chicago/Gary Urban Area on Wet and Dry Deposi-tion” (Ph.D. diss., University of Michigan, 1998).
37. U.S. Department of Commerce, National Ocean-ic and Atmospheric Administration (NOAA), AirResources Laboratory, “Mercury Deposition Network”(NRSP-3), National Atmospheric Deposition Programweb site (2000), accessed via http://nadp.sws.uiuc.edu/mdn/ on 23 July 2002.
38. EPA, note 7 above, vols. 2 and 3, page 4-2.
39. Ibid., vol. 3, page 2-13.
40. Center for Food Safety and Applied Nutrition,FDA; EPA; National Energy Technology Laboratory,Department of Energy (DOE); National Marine Fish-
eries Laboratory, NOAA; and National Center forHealth Statistics, National Center for EnvironmentalHealth, Centers for Disease Control (CDC), “Bloodand Hair Mercury Levels in Young Children andWomen of Childbearing Age—United States, 1999,”Mortality and Morbidity Weekly Report 50, no. 8(2001): 140–43.
41. NRC, note 1 above, page 324. 42. FDA, EPA, DOE, NOAA, and CDC, note 40
above, page 140.43. K. Crump et al., “Benchmark Concentrations for
MeHg Obtained from the Seychelles Child Develop-ment Study,” Environmental Health Perspectives 108,no. 3 (2000): 257–63; G. Myers et al., “SecondaryAnalysis from the Seychelles Child DevelopmentStudy: The Child Behavior Checklist,” EnvironmentalResearch 84, no. 1 (2000): 12–19; and C. Axtell et al.,“Association between MeHg Exposure from Fish Con-sumption and Child Development at Five and a HalfYears of Age in the Seychelles Child DevelopmentStudy: An Evaluation of Nonlinear Relationships,”Environmental Research 84, no. 2 (2000): 71–80.
44. P. Grandjean et al., “Cognitive Deficit in Seven-Year-Old Children with Prenatal Exposure to MeHg,”Neurotoxicology and Teratology 19, no. 6 (1997):417–28.
40 ENVIRONMENT NOVEMBER 2002
45. K. Crump, T. Kjellstrom, A. Shipp, A. Silvers,and A. Stewart, “Influence of Prenatal Mercury Expo-sure upon Scholastic and Psychological Test Perform-ance: Benchmark Analysis of a New Zealand Cohort,”Risk Analysis 18, no. 6 (1998): 701–13.
46. NRC, note 1 above, page 6.47. Ibid., page 325. A letter from Professor Robert A.
Goyer, who chaired the NRC Committee on the Toxi-cological Effects of Methylmercury, to Joseph A.Levitt, director of the Center for Food Safety andApplied Nutrition of FDA, more fully explains themeaning of the NRC statement (R. A. Goyer, letter to J.A. Levitt, Washington D.C., 2000).
48. Goyer, ibid. 49. Ibid. The reference dose is defined as “an esti-
mate of a daily exposure to the human population(including sensitive subpopulations) that is likely to bewithout a risk of adverse effects when experienced overa lifetime” (NRC, note 1 above, page 2).
50. Goyer, note 47 above. 51. J. Smith, R. Von Burg, and P. Allen, “Hair MeHg
Levels in U.S. Women,” Archives of EnvironmentalHealth 52, no. 6 (1997): 476–80. See Table 1.
52. U.S. Department of Commerce and NOAA, note37 above, Table 91.
53. Crump, Kjellstrom, Shipp, Silvers, and Stewart,note 45 above.
54. P. Grandjean et al., “MeHg Exposure Biomarkersas Indicators of Neurotoxicity in Children Aged SevenYears,” American Journal of Epidemiology 150, no. 3(1999): 301–05. This study reports the estimateddeclines in various performance tests such as finger-tapping speed for a doubling of mercury concentra-tions. This information is used here to calculateimprovements in health for the specified reduction inmercury exposure.
55. J. Salonen et al., “Intake of Mercury from Fish,Lipid Peroxidation, and the Risk of Myocardial Infarc-tion and Coronary, Cardiovascular, and Any Death inEastern Finnish Men,” Circulation 91, no. 3 (1995):Table 4.
56. Salonen et al. derive this estimate in a model thatcontrols for age, ischemic exercise electrocardiogram,family history of coronary heart disease, cigarette-years, mean systolic blood pressure, socioeconomicstatus, and place of residence (urban vs. rural), amongother factors (ibid.).
57. Some of these concerns first appeared in a reviewcommissioned by NRC. See W. Rosamond and C.Poole, “A Critique of Salonen et al. ‘Intake of Mercuryfrom Fish, Lipid Peroxidation, and the Risk of Myocar-dial Infarction and Coronary, Cardiovascular, and AnyDeath in Eastern Finnish Men,’” prepared for NRCCommittee on the Toxicological Effects of Methylmer-cury, Washington, D.C. (undated).
58. E. Guallar et al., “Mercury Levels in Toenails andRisk of Myocardial Infarction: Interim Results of anInternational Case-Control Study” (paper presented atthe Seventh Nordic Symposium on Trace Elements inHuman Health and Disease, Espoo, Finland, June1999). This study published interim results from aninternational case-control study that appears to supportthe findings of Salonen et al. See also N. Sorensen, K.Murata, E. Budtz-Jørgensen, P. Weihe, and P. Grand-jean, “Prenatal MeHg Exposure as a CardiovascularRisk Factor at Seven Years of Age,” Epidemiology 10,no. 4 (1999): 370–75; and J. Salonen, K. Seppanen, R.Salonen, and G. A. Kaplan, “Mercury Accumulationand Accelerated Progression of Carotid Atherosclero-sis: A Population-Based Prospective Four-Year Follow-Up Study in Men in Eastern Finland,” Atherosclerosis148, no. 2 (2000): 265–73. The Sorensen study reportsan association between mercury in maternal hair andblood pressure in seven-year-old children but do notaddress the clinical significance and permanence ofthis effect—or the nature of the relationship at relative-ly low doses (for example, 1 ppm to 5 ppm). The Salo-nen study reports an association between mercury
accumulation and accelerated progression of carotidatherosclerosis among Finnish men. Although theyreport statistically significant associations betweenmercury hair content and atherosclerosis, they fail toassess the proportion of mercury that is methylmercuryand therefore attributable to fish consumption.
59. This condition was one of Sir Bradford Hill’s (ofthe London School of Hygiene and Tropical Medicine)criteria for inferring that epidemiological associationsare causal (Rosamond and Poole, note 57 above).
60. See Y. Kinjo et al., “Cancer Mortality in Mina-mata Disease Patients Exposed to Methylmercurythrough Fish Diet,” Journal of Epidemiology 6, no. 3(1996): 134–38.
61. A. H. Stern, L. Korn, and B. Ruppel, “Estimationof Fish Consumption and MeHg Intake in the New Jer-sey Population,” Journal of Exposure Analysis andEnvironmental Epidemiology 6, no. 4 (1996): 503–27;and A. H. Stern, M. Golchfeld, C. Weisel, and J. Burg-er, “Mercury and MeHg Exposure in the New JerseyPregnant Population,” Archives of EnvironmentalHealth 56, no. 1 (2001): 4–10. Note that these articlesdiscuss two different surveys of New Jersey women.
62. Salonen et al., note 55 above, Table 2.
63. J. R. Sauer, J. E. Hines, I. Thomas, J. Fallon, andG. Gough, The North American Breeding Bird Survey,Results and Analysis 1966–1999, Version 98.1 (Laurel,Md.: USGS Patuxent Wildlife Research Center, 2000),accessed via http://www.mbr-pwrc.usgs.gov/bbs/bbs99.html.
64. For osprey populations, the survey-wide trend is6.7 percent, and for double-crested cormorants, thesurvey-wide trend is 7 percent (ibid.).
65. Sauer, Hines, Thomas, Fallon, and Gough, note63 above; see trend maps.
66. EPA, note 7 above, vol. 5, page 3-3.
67. “Panthers: 80, Rising,” National GeographicMagazine, August 2002.
68. S. Duvall and M. Barron, “A Screening LevelProbabilistic Risk Assessment of Mercury in FloridaEverglades Food Webs,” Ecotoxicology and Environ-mental Safety 47 (2000): 298–305.
69. EPA, Mercury White Paper (1997). See http://www.epa.gov/oar/merwhite.html.
70. National Conference of State Legislatures, Envi-ronmental Health Legislation Database, accessed viahttp://www.ncsl.org/programs/ESNR/cehdb.htm on 23July 2002.
71. Washington State Department of Ecology,“Draft—Washington State Mercury Chemical ActionPlan Background Information,” Publication No. 02-03-016 (2002), accessed via http://www.ecy.wa.gov/pubs/0203016.pdf on 15 May 2002; and Minnesota Pollu-tion Control Agency, Progress Report to the MinnesotaLegislature (2002), accessed via http://www.pca.state.mn.us/hot/legislature/reports/2002/mercury-02.pdf on15 May 2002.
72. EPA, note 33 above, page 1,346.
73. EPA, note 27 above, Figure 4-2.
74. S. 556, 107th Cong., 1st sess., CongressionalRecord 147 (15 March 2001).
75. The White House, “President Bush AnnouncesClear Skies and Global Change Initiatives,” 14 Febru-ary 2002, accessible via http://www.epa.gov/clearskies/clear_skies_factsheet.pdf.
76. ICF Consulting, “Mercury Control Cost Calcula-tions: Assumptions, Approach, and Results, EPA Con-tract No. 68-D7-0081, Task 011, Subtask 02” (30 Sep-tember 2000). These are 1999 dollars.
77. Ibid, pages 8–9.
78. An EPA memo suggests that current controls mayeliminate 43 percent of generated mercury emissions (F.Princiotta, “Control of Mercury Emissions from Coal-Fired Utility Boilers,” memo from the director of the Air
Pollution Prevention and Control Division to JohnSeitz, director of the Office of Air Quality Planning andStandards (MD-10), EPA, 25 October 2000, 6).
79. EPA, note 4 above, page 79,828.
80. Ibid.
81. See the comments of Peter Tsirigotis of EPA on19 February 2002 at the AEI-Brookings Joint Centerconference “Regulating Air Pollutants from PowerPlants: What is Sensible?”
82. This upper-bound estimate of compliance costs ofthe mercury cap for the Clear Skies proposal is derivedby conservatively assuming that EPA’s estimate of themarginal cost is also the average cost, which the agencydid not report. Multiplying the 30-metric ton (t) reduc-tion in mercury emissions (from 43 t to 13 t) by the per-mit price estimate for the 13-t cap in 2018 ($14,460 perpound) gives $972 million. See EPA, “Clear Skies Ini-tiative,” Regional Summary Report (2002), accessedvia the Clean Air Markets—Programs and Regulationspage at http://www.epa.gov/airmarkets/epa-ipm/results.html#downloadresults on 23 July 2002 (downloadipm2000s153d_c).
83. EPA, note 7 above, vol. 1, page 3-14.
84. J. A. Sorensen, G. E. Glass, K. W. Schmidt, J. K.Huber, and G. R. Rapp Jr., “Airborne Mercury Deposi-tion and Watershed Characteristics in Relation to Mer-cury Concentrations in Water, Sediments, Plankton,and Fish of Eighty Northern Minnesota Lakes,” Envi-ronmental Science & Technology 24, no. 11 (1990):1,716–27; R. P. Mason, J. R. Reinfelder, and F. M.Morel, “Uptake, Toxicity, and Trophic Transfer of Mer-cury in a Coastal Diatom,” Environmental Science &Technology 30 (1996): 6; and EPA, note 7 above.Sorenson provides an early and interesting article;Mason and EPA provide summaries. See also R. Ren-ner, “Newly Deposited Mercury May Be MoreBioavailable,” Environmental Science & Technology36, no. 11 (2002): 226A–27A. EPA has found only a“plausible link” between mercury deposition and con-centrations in fish. See EPA, note 7 above, vol. 1, page0-2; and W. Fitzgerald, D. Engstrom, R. Mason, and E.Nater, “The Case for Atmospheric Mercury Contami-nation in Remote Areas,” Environmental Science &Technology 32, no. 1 (1997): 1–7.
85. W. Brumbaugh, D. Krabbenhoft, D. Helsel, J.Wiener, and K. Echols, “A National Pilot Study of Mer-cury Contamination of Aquatic Ecosytems along Mul-tiple Gradients: Bioaccumulation in Fish,” BiologicalScience Report, USGS/BRD/BSR-2001-0009 (USGS,September 2001). See also Qian, Warren-Hicks, Keat-ing, Moore, and Teed, note 22 above.
86. See the Electric Power Research Institute’s Mer-cury Experiment to Assess Atmospheric Loading inCanada and the United States (METAALICUS) projectsummary at http://www.epri.com/corporate/products_services/project_opps/environment/1006515.pdf,accessed on 16 August 2002.
87. EPA, note 7 above, vol. 4, page 4-37.
88. Stern, Korn, and Ruppel, note 61 above, page505.
89. Ibid., page 510. The study indicates that averagemercury concentrations were 0.17 ppm for tuna and0.11 ppm for shrimp.
90. U.S. National Marine Fisheries Service, Fish-eries of the United States, 1999 (Silver Spring, Md.:NOAA and U.S. Department of Commerce, 2000).See the NOAA Fisheries and National Marine Fish-eries Service web site at http://www.nmfs.noaa.gov.This percentage is calculated as the total catch within200 miles of New England and the southern Atlanticstates divided by the sum of all landed shrimp and netimports.
91. The authors’ calculations used data from theGrandjean and Crump studies.
92. EPA, “Human Health and Environmental Effectsof the Clear Skies Initiative,” report prepared for theEPA Clear Skies Workshop, 19 June 2002.