tio2 -decorated graphite nanoplatelet nanocomposites for high-temperature sensor applications
TRANSCRIPT

1© 2014 Wiley-VCH Verlag GmbH & Co. KGaA, Weinheim wileyonlinelibrary.com
TiO 2 -Decorated Graphite Nanoplatelet Nanocomposites for High-Temperature Sensor Applications
Ashish Kumar Mishra and Liping Huang *
1. Introduction
Anatase TiO 2 nanoparticles (NPs) have been used as photo-
catalyst, [ 1,2 ] as high temperature thermal sensors (400–700 °C)
based on phonon confi nement [ 3–5 ] and as gas sensors to
detect NO 2 , CO and CH 4 at high temperatures (300–600 °C)
based on change in chemiresistance. [ 6–9 ] However, long-term
exposure of anatase NPs to high temperatures may result in
grain growth, agglomeration and transformation into rutile
phase, leading to the reduced surface activity and thermal
stability of TiO 2 . Graphene-like substrates with good thermal
and electrical conductivity may provide a solution to above
problems, [ 10–14 ] but survival of graphene at such high tem-
peratures for long durations is a big challenge. [ 15 ] Exfoliated
graphite or graphite nanoplatelets (GNPs), due to similar
properties of graphite, can be a good candidate for such high
DOI: 10.1002/smll.201401418
Temperature and/or composition mapping inside high temperature energy conversion and storage devices are challenging, yet of critical importance to improve the material design for optimum performance. Here, the great potential of TiO 2 nanoparticle (NP)-decorated graphite nanoplatelet (GNP) nanocomposites as high temperature thermal senors or gas sensors is reported. Effects of the GNP substrate on phonon confi nement in Raman spectrum, grain growth, and phase stability of anatase TiO 2 NPs at high temperatures are systematically studied. Thermally sensitive Raman signatures, indicating the ultrafast grain growth of TiO 2 NPs in response to short thermal shock treatments (0.1–25 s) at high temperatures, are exploited for high temperature thermal sensing applications. A very high accuracy of nearly 98% in temperature measurements is demonstrated for a given short-time thermal exposure. Thermal stability of anatase TiO 2 NPs against transformation into the rutile phase in TiO 2 -GNP nancomposites is substantially increased by controlling the surface area of the substrate, which would signifi cantly improve the performance of TiO 2 -based high temperature gas sensors.
Sensors
A. K. Mishra, L. Huang Department of Material Science and Engineering Rensselaer Polytechnic Institute Troy , NY , USA E-mail: [email protected]
temperature applications. [ 16,17 ] As substrates, the surface
area of GNPs can be tuned to control the growth and phase
stability of anatase TiO 2 NPs to improve their performance
for high temperature gas sensing applications. TiO 2 -GNPs
nanocomposites can also be used for temperature mapping
by distributing them in a system, then either remotely moni-
toring their Raman spectra or recovering them afterwards. In
some cases, high temperature gas sensing and thermal sensing
capabilities of TiO 2 -GNPs nanocomposites may be even
combined, for instance, to monitor CO concentration in high
temperature solid oxide fuel cells (SOFCs) (500–1000 °C) to
determine the effi ciency of the reforming and the total com-
bustion processes, [ 9 ] as well as to map the temperature distri-
bution inside the cell during operation.
Here, we report the high temperature thermal sensing
application of TiO 2 -GNPs nanocomposites. GNPs with three
different surface areas (12, 28 and 62 m 2 g −1 , called GNP12,
GNP28 and GNP62, respectively) were synthesized and
decorated with TiO 2 NPs of different sizes. We examined the
effect of GNPs substrate on phonon confi nement in Raman
spectrum, grain growth and phase stability of anatase TiO 2
NPs in response to thermal shock in the temperature range
of 600–750 °C. Short durations (0.1–25 s) of thermal shock
small 2014, DOI: 10.1002/smll.201401418
A. K. Mishra and L. Huang
2 www.small-journal.com © 2014 Wiley-VCH Verlag GmbH & Co. KGaA, Weinheim
full paperstreatments show the ultrafast grain growth in TiO 2 NPs,
which can be used to map temperature distribution in harsh
environments such as the interior of SOFCs and batteries
operating at high temperatures. In addition, longer durations
of thermal treatments at high temperatures help identify the
appropriate TiO 2 -GNPs nanocomposite to imporve the per-
formance of TiO 2 -based high temperature gas sensors.
2. Results and Discussion
2.1. Morphology Study
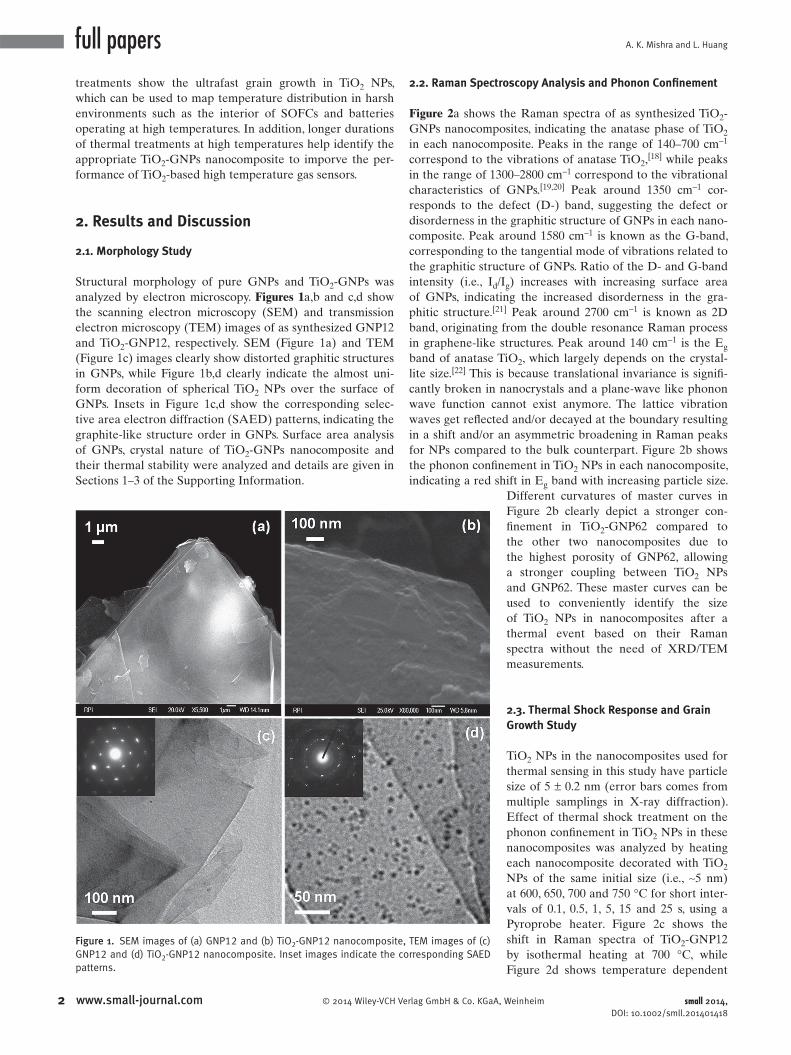
Structural morphology of pure GNPs and TiO 2 -GNPs was
analyzed by electron microscopy. Figures 1 a,b and c,d show
the scanning electron microscopy (SEM) and transmission
electron microscopy (TEM) images of as synthesized GNP12
and TiO 2 -GNP12, respectively. SEM (Figure 1 a) and TEM
(Figure 1 c) images clearly show distorted graphitic structures
in GNPs, while Figure 1 b,d clearly indicate the almost uni-
form decoration of spherical TiO 2 NPs over the surface of
GNPs. Insets in Figure 1 c,d show the corresponding selec-
tive area electron diffraction (SAED) patterns, indicating the
graphite-like structure order in GNPs. Surface area analysis
of GNPs, crystal nature of TiO 2 -GNPs nanocomposite and
their thermal stability were analyzed and details are given in
Sections 1–3 of the Supporting Information.
2.2. Raman Spectroscopy Analysis and Phonon Confi nement
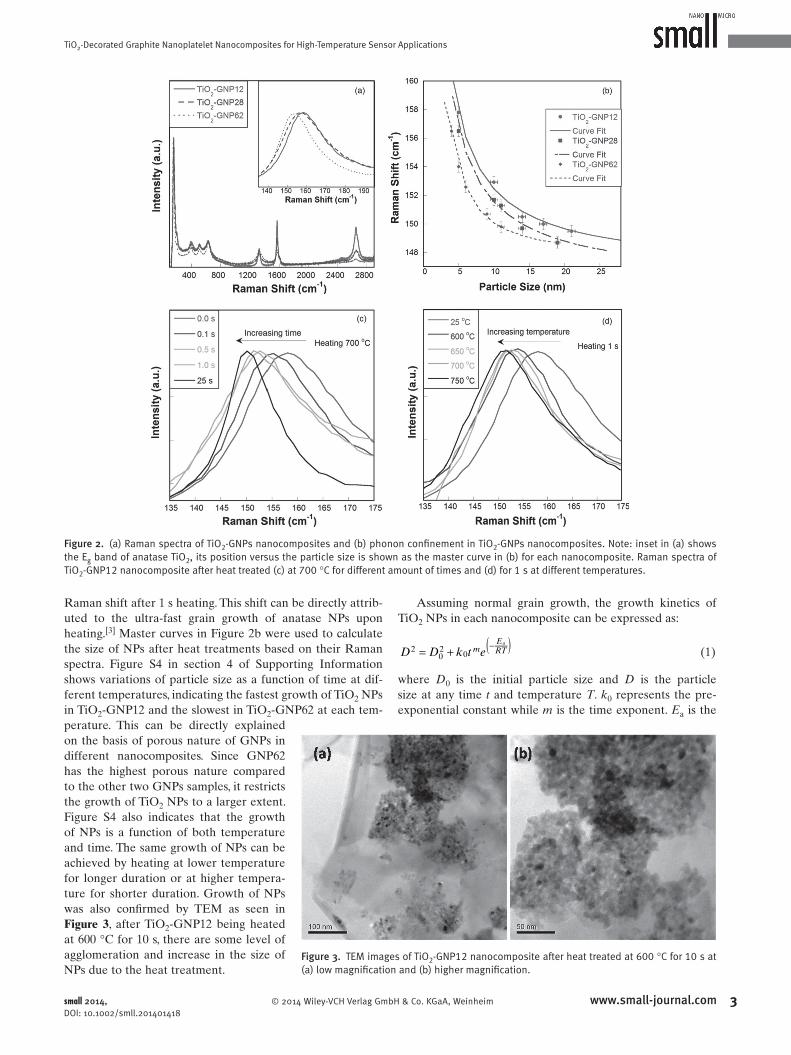
Figure 2 a shows the Raman spectra of as synthesized TiO 2 -
GNPs nanocomposites, indicating the anatase phase of TiO 2
in each nanocomposite. Peaks in the range of 140–700 cm −1
correspond to the vibrations of anatase TiO 2 , [ 18 ] while peaks
in the range of 1300–2800 cm −1 correspond to the vibrational
characteristics of GNPs. [ 19,20 ] Peak around 1350 cm −1 cor-
responds to the defect (D-) band, suggesting the defect or
disorderness in the graphitic structure of GNPs in each nano-
composite. Peak around 1580 cm −1 is known as the G-band,
corresponding to the tangential mode of vibrations related to
the graphitic structure of GNPs. Ratio of the D- and G-band
intensity (i.e., I d /I g ) increases with increasing surface area
of GNPs, indicating the increased disorderness in the gra-
phitic structure. [ 21 ] Peak around 2700 cm −1 is known as 2D
band, originating from the double resonance Raman process
in graphene-like structures. Peak around 140 cm −1 is the E g
band of anatase TiO 2 , which largely depends on the crystal-
lite size. [ 22 ] This is because translational invariance is signifi -
cantly broken in nanocrystals and a plane-wave like phonon
wave function cannot exist anymore. The lattice vibration
waves get refl ected and/or decayed at the boundary resulting
in a shift and/or an asymmetric broadening in Raman peaks
for NPs compared to the bulk counterpart. Figure 2 b shows
the phonon confi nement in TiO 2 NPs in each nanocomposite,
indicating a red shift in E g band with increasing particle size.
Different curvatures of master curves in
Figure 2 b clearly depict a stronger con-
fi nement in TiO 2 -GNP62 compared to
the other two nanocomposites due to
the highest porosity of GNP62, allowing
a stronger coupling between TiO 2 NPs
and GNP62. These master curves can be
used to conveniently identify the size
of TiO 2 NPs in nanocomposites after a
thermal event based on their Raman
spectra without the need of XRD/TEM
measurements.
2.3. Thermal Shock Response and Grain Growth Study
TiO 2 NPs in the nanocomposites used for
thermal sensing in this study have particle
size of 5 ± 0.2 nm (error bars comes from
multiple samplings in X-ray diffraction).
Effect of thermal shock treatment on the
phonon confi nement in TiO 2 NPs in these
nanocomposites was analyzed by heating
each nanocomposite decorated with TiO 2
NPs of the same initial size (i.e., ∼5 nm)
at 600, 650, 700 and 750 °C for short inter-
vals of 0.1, 0.5, 1, 5, 15 and 25 s, using a
Pyroprobe heater. Figure 2 c shows the
shift in Raman spectra of TiO 2 -GNP12
by isothermal heating at 700 °C, while
Figure 2 d shows temperature dependent
small 2014, DOI: 10.1002/smll.201401418
Figure 1. SEM images of (a) GNP12 and (b) TiO 2 -GNP12 nanocomposite, TEM images of (c) GNP12 and (d) TiO 2 -GNP12 nanocomposite. Inset images indicate the corresponding SAED patterns.
TiO 2 -Decorated Graphite Nanoplatelet Nanocomposites for High-Temperature Sensor Applications
3www.small-journal.com© 2014 Wiley-VCH Verlag GmbH & Co. KGaA, Weinheim
Raman shift after 1 s heating. This shift can be directly attrib-
uted to the ultra-fast grain growth of anatase NPs upon
heating. [ 3 ] Master curves in Figure 2 b were used to calculate
the size of NPs after heat treatments based on their Raman
spectra. Figure S4 in section 4 of Supporting Information
shows variations of particle size as a function of time at dif-
ferent temperatures, indicating the fastest growth of TiO 2 NPs
in TiO 2 -GNP12 and the slowest in TiO 2 -GNP62 at each tem-
perature. This can be directly explained
on the basis of porous nature of GNPs in
different nanocomposites. Since GNP62
has the highest porous nature compared
to the other two GNPs samples, it restricts
the growth of TiO 2 NPs to a larger extent.
Figure S4 also indicates that the growth
of NPs is a function of both temperature
and time. The same growth of NPs can be
achieved by heating at lower temperature
for longer duration or at higher tempera-
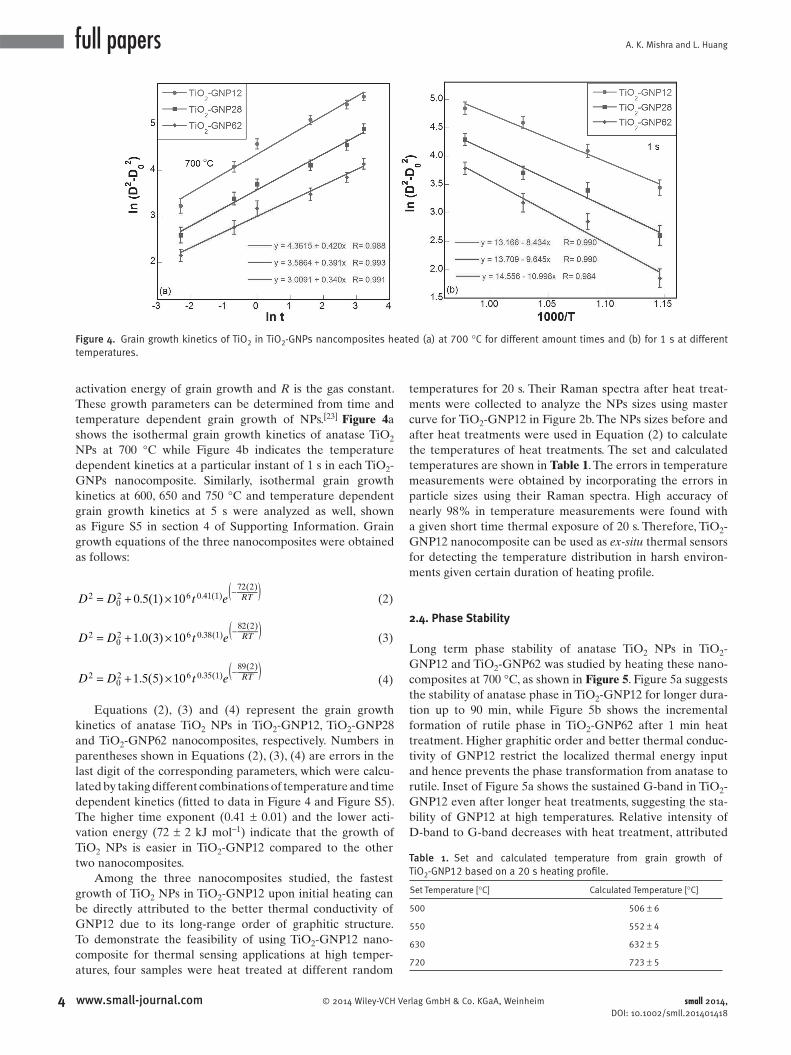
ture for shorter duration. Growth of NPs
was also confi rmed by TEM as seen in
Figure 3 , after TiO 2 -GNP12 being heated
at 600 °C for 10 s, there are some level of
agglomeration and increase in the size of
NPs due to the heat treatment.
Assuming normal grain growth, the growth kinetics of
TiO 2 NPs in each nanocomposite can be expressed as:
= + ( )−2
02
0D D k t emERT
a
(1)
where D 0 is the initial particle size and D is the particle
size at any time t and temperature T . k 0 represents the pre-
exponential constant while m is the time exponent. E a is the
small 2014, DOI: 10.1002/smll.201401418
Figure 2. (a) Raman spectra of TiO 2 -GNPs nanocomposites and (b) phonon confi nement in TiO 2 -GNPs nanocomposites. Note: inset in (a) shows the E g band of anatase TiO 2 , its position versus the particle size is shown as the master curve in (b) for each nanocomposite. Raman spectra of TiO 2 -GNP12 nanocomposite after heat treated (c) at 700 °C for different amount of times and (d) for 1 s at different temperatures.
Figure 3. TEM images of TiO 2 -GNP12 nanocomposite after heat treated at 600 °C for 10 s at (a) low magnifi cation and (b) higher magnifi cation.
A. K. Mishra and L. Huang
4 www.small-journal.com © 2014 Wiley-VCH Verlag GmbH & Co. KGaA, Weinheim
full papers
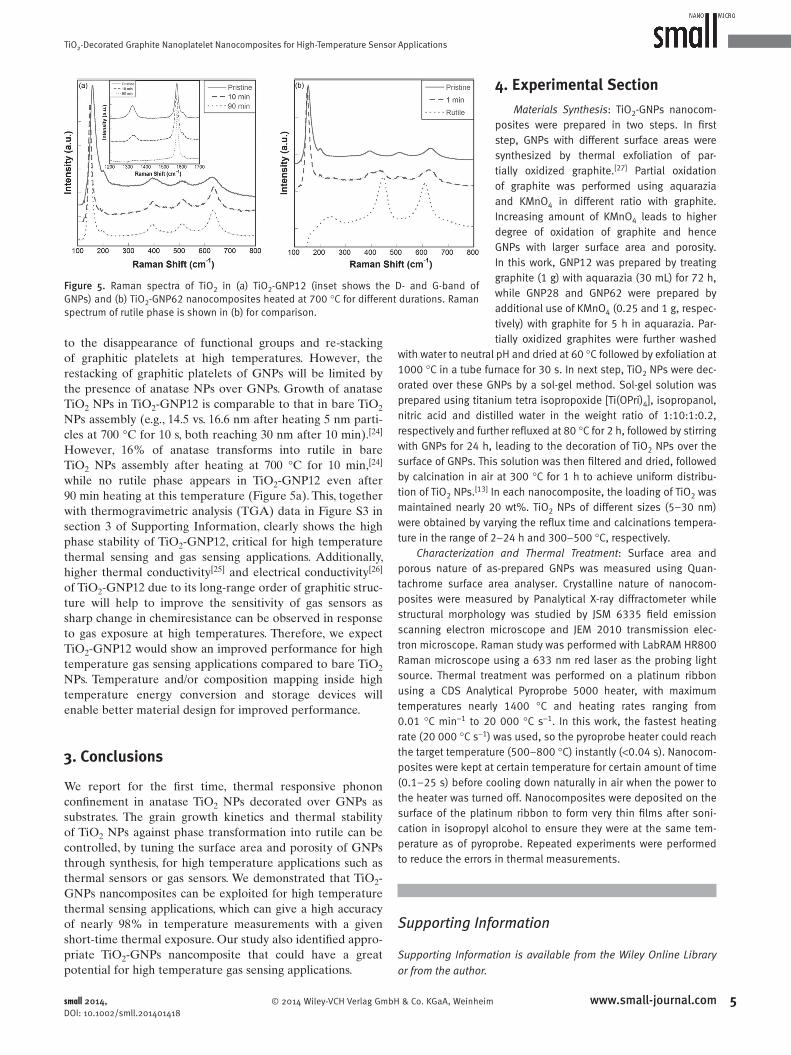
activation energy of grain growth and R is the gas constant.
These growth parameters can be determined from time and
temperature dependent grain growth of NPs. [ 23 ] Figure 4 a
shows the isothermal grain growth kinetics of anatase TiO 2
NPs at 700 °C while Figure 4 b indicates the temperature
dependent kinetics at a particular instant of 1 s in each TiO 2 -
GNPs nanocomposite. Similarly, isothermal grain growth
kinetics at 600, 650 and 750 °C and temperature dependent
grain growth kinetics at 5 s were analyzed as well, shown
as Figure S5 in section 4 of Supporting Information. Grain
growth equations of the three nanocomposites were obtained
as follows:
= + × ( )−0.5(1) 102
02 6 0.41(1)
72(2)
D D t e RT (2)
= + × ( )−1.0(3) 102
02 6 0.38(1)
82(2)
D D t e RT (3)
= + × ( )−
1.5(5) 10202 6 0.35(1)
89(2)
D D t e RT (4)
Equations ( 2) , ( 3) and ( 4) represent the grain growth
kinetics of anatase TiO 2 NPs in TiO 2 -GNP12, TiO 2 -GNP28
and TiO 2 -GNP62 nanocomposites, respectively. Numbers in
parentheses shown in Equations ( 2), (3), (4) are errors in the
last digit of the corresponding parameters, which were calcu-
lated by taking different combinations of temperature and time
dependent kinetics (fi tted to data in Figure 4 and Figure S5).
The higher time exponent (0.41 ± 0.01) and the lower acti-
vation energy (72 ± 2 kJ mol −1 ) indicate that the growth of
TiO 2 NPs is easier in TiO 2 -GNP12 compared to the other
two nanocomposites.
Among the three nanocomposites studied, the fastest
growth of TiO 2 NPs in TiO 2 -GNP12 upon initial heating can
be directly attributed to the better thermal conductivity of
GNP12 due to its long-range order of graphitic structure.
To demonstrate the feasibility of using TiO 2 -GNP12 nano-
composite for thermal sensing applications at high temper-
atures, four samples were heat treated at different random
temperatures for 20 s. Their Raman spectra after heat treat-
ments were collected to analyze the NPs sizes using master
curve for TiO 2 -GNP12 in Figure 2 b. The NPs sizes before and
after heat treatments were used in Equation ( 2) to calculate
the temperatures of heat treatments. The set and calculated
temperatures are shown in Table 1 . The errors in temperature
measurements were obtained by incorporating the errors in
particle sizes using their Raman spectra. High accuracy of
nearly 98% in temperature measurements were found with
a given short time thermal exposure of 20 s. Therefore, TiO 2 -
GNP12 nanocomposite can be used as ex-situ thermal sensors
for detecting the temperature distribution in harsh environ-
ments given certain duration of heating profi le.
2.4. Phase Stability
Long term phase stability of anatase TiO 2 NPs in TiO 2 -
GNP12 and TiO 2 -GNP62 was studied by heating these nano-
composites at 700 °C, as shown in Figure 5 . Figure 5 a suggests
the stability of anatase phase in TiO 2 -GNP12 for longer dura-
tion up to 90 min, while Figure 5 b shows the incremental
formation of rutile phase in TiO 2 -GNP62 after 1 min heat
treatment. Higher graphitic order and better thermal conduc-
tivity of GNP12 restrict the localized thermal energy input
and hence prevents the phase transformation from anatase to
rutile. Inset of Figure 5 a shows the sustained G-band in TiO 2 -
GNP12 even after longer heat treatments, suggesting the sta-
bility of GNP12 at high temperatures. Relative intensity of
D-band to G-band decreases with heat treatment, attributed
small 2014, DOI: 10.1002/smll.201401418
Figure 4. Grain growth kinetics of TiO 2 in TiO 2 -GNPs nancomposites heated (a) at 700 °C for different amount times and (b) for 1 s at different temperatures.
Table 1. Set and calculated temperature from grain growth of TiO 2 -GNP12 based on a 20 s heating profi le.
Set Temperature [°C] Calculated Temperature [°C]
500 506 ± 6
550 552 ± 4
630 632 ± 5
720 723 ± 5
TiO 2 -Decorated Graphite Nanoplatelet Nanocomposites for High-Temperature Sensor Applications
5www.small-journal.com© 2014 Wiley-VCH Verlag GmbH & Co. KGaA, Weinheim
to the disappearance of functional groups and re-stacking
of graphitic platelets at high temperatures. However, the
restacking of graphitic platelets of GNPs will be limited by
the presence of anatase NPs over GNPs. Growth of anatase
TiO 2 NPs in TiO 2 -GNP12 is comparable to that in bare TiO 2
NPs assembly (e.g., 14.5 vs. 16.6 nm after heating 5 nm parti-
cles at 700 °C for 10 s, both reaching 30 nm after 10 min). [ 24 ]
However, 16% of anatase transforms into rutile in bare
TiO 2 NPs assembly after heating at 700 °C for 10 min, [ 24 ]
while no rutile phase appears in TiO 2 -GNP12 even after
90 min heating at this temperature (Figure 5 a). This, together
with thermogravimetric analysis (TGA) data in Figure S3 in
section 3 of Supporting Information, clearly shows the high
phase stability of TiO 2 -GNP12, critical for high temperature
thermal sensing and gas sensing applications. Additionally,
higher thermal conductivity [ 25 ] and electrical conductivity [ 26 ]
of TiO 2 -GNP12 due to its long-range order of graphitic struc-
ture will help to improve the sensitivity of gas sensors as
sharp change in chemiresistance can be observed in response
to gas exposure at high temperatures. Therefore, we expect
TiO 2 -GNP12 would show an improved performance for high
temperature gas sensing applications compared to bare TiO 2
NPs. Temperature and/or composition mapping inside high
temperature energy conversion and storage devices will
enable better material design for improved performance.
3. Conclusions
We report for the fi rst time, thermal responsive phonon
confi nement in anatase TiO 2 NPs decorated over GNPs as
substrates. The grain growth kinetics and thermal stability
of TiO 2 NPs against phase transformation into rutile can be
controlled, by tuning the surface area and porosity of GNPs
through synthesis, for high temperature applications such as
thermal sensors or gas sensors. We demonstrated that TiO 2 -
GNPs nancomposites can be exploited for high temperature
thermal sensing applications, which can give a high accuracy
of nearly 98% in temperature measurements with a given
short-time thermal exposure. Our study also identifi ed appro-
priate TiO 2 -GNPs nancomposite that could have a great
potential for high temperature gas sensing applications.
4. Experimental Section
Materials Synthesis : TiO 2 -GNPs nanocom-posites were prepared in two steps. In fi rst step, GNPs with different surface areas were synthesized by thermal exfoliation of par-tially oxidized graphite. [ 27 ] Partial oxidation of graphite was performed using aquarazia and KMnO 4 in different ratio with graphite. Increasing amount of KMnO 4 leads to higher degree of oxidation of graphite and hence GNPs with larger surface area and porosity. In this work, GNP12 was prepared by treating graphite (1 g) with aquarazia (30 mL) for 72 h, while GNP28 and GNP62 were prepared by additional use of KMnO 4 (0.25 and 1 g, respec-tively) with graphite for 5 h in aquarazia. Par-tially oxidized graphites were further washed
with water to neutral pH and dried at 60 °C followed by exfoliation at 1000 °C in a tube furnace for 30 s. In next step, TiO 2 NPs were dec-orated over these GNPs by a sol-gel method. Sol-gel solution was prepared using titanium tetra isopropoxide [Ti(OPri) 4 ], isopropanol, nitric acid and distilled water in the weight ratio of 1:10:1:0.2, respectively and further refl uxed at 80 °C for 2 h, followed by stirring with GNPs for 24 h, leading to the decoration of TiO 2 NPs over the surface of GNPs. This solution was then fi ltered and dried, followed by calcination in air at 300 °C for 1 h to achieve uniform distribu-tion of TiO 2 NPs. [ 13 ] In each nanocomposite, the loading of TiO 2 was maintained nearly 20 wt%. TiO 2 NPs of different sizes (5–30 nm) were obtained by varying the refl ux time and calcinations tempera-ture in the range of 2–24 h and 300–500 °C, respectively.
Characterization and Thermal Treatment : Surface area and porous nature of as-prepared GNPs was measured using Quan-tachrome surface area analyser. Crystalline nature of nanocom-posites were measured by Panalytical X-ray diffractometer while structural morphology was studied by JSM 6335 fi eld emission scanning electron microscope and JEM 2010 transmission elec-tron microscope. Raman study was performed with LabRAM HR800 Raman microscope using a 633 nm red laser as the probing light source. Thermal treatment was performed on a platinum ribbon using a CDS Analytical Pyroprobe 5000 heater, with maximum temperatures nearly 1400 °C and heating rates ranging from 0.01 °C min −1 to 20 000 °C s −1 . In this work, the fastest heating rate (20 000 °C s −1 ) was used, so the pyroprobe heater could reach the target temperature (500–800 °C) instantly (<0.04 s). Nanocom-posites were kept at certain temperature for certain amount of time (0.1–25 s) before cooling down naturally in air when the power to the heater was turned off. Nanocomposites were deposited on the surface of the platinum ribbon to form very thin fi lms after soni-cation in isopropyl alcohol to ensure they were at the same tem-perature as of pyroprobe. Repeated experiments were performed to reduce the errors in thermal measurements.
Supporting Information
Supporting Information is available from the Wiley Online Library or from the author.
small 2014, DOI: 10.1002/smll.201401418
Figure 5. Raman spectra of TiO 2 in (a) TiO 2 -GNP12 (inset shows the D- and G-band of GNPs) and (b) TiO 2 -GNP62 nanocomposites heated at 700 °C for different durations. Raman spectrum of rutile phase is shown in (b) for comparison.
A. K. Mishra and L. Huang
6 www.small-journal.com © 2014 Wiley-VCH Verlag GmbH & Co. KGaA, Weinheim
full papers
Acknowledgements
This work was supported by the Defense Threat Reduction Agency (DTRA Grant Number HDTRA1–09–1–0046).
[1] D. Chen , R. A. Caruso , Adv. Funct. Mater. 2013 , 23 , 1356 . [2] V. K. Etacheri , M. K. Seery , S. J. Hinder , S. C. Pillai , Adv. Funct.
Mater. 2011 , 21 , 3744 . [3] J. Wang , L. Huang , Appl. Phys. Lett. 2011 , 98 , 113102 . [4] V. Swamy , A. Kuznetsov , L. S. Dubrovinsky , R. A. Caruso ,
D. G. Shchukin , B. C. Muddle , Phys. Rev. B 2005 , 71 , 184302 . [5] V. Swamy , Phys. Rev. B 2008 , 77 , 195414 . [6] I. D. Kim , A. Rothschild , B. H. Lee , D. Y. Kim , S. M. Jo , H. L. Tuller ,
Nano Lett. 2006 , 6 , 2009 . [7] P. K. Dutta , A. Ginwalla , B. Hogg , B. R. Patton , B. Chwieroth ,
Z. Liang , P. Gouma , M. Mills , S. Akbar , J. Phys. Chem. B 1999 , 103 , 4412 .
[8] N. O. Savage , S. A. Akbar , P. K. Dutta , Sens. Actuators B 2001 , 72 , 239 .
[9] S. Akbar , P. K. Dutta , C. Lee , Int. J. Appl. Ceram. Technol. 2006 , 3 , 302 .
[10] Y. Zhang , Z. R. Tang , X. Fu , Y. J. Xu , ACS Nano 2010 , 4 , 7303 . [11] B. Jiang , C. Tian , W. Zhou , J. Wang , Y. Xie , Q. Pan , Z. Ren , Y. Dong ,
D. Fu , J. Han , H. Fu , Chem. Eur. J. 2011 , 17 , 8379 . [12] J. S. Lee , K. H. You , C. B. Park , Adv. Mater. 2012 , 24 , 1084 . [13] A. K. Mishra , S. Ramaprabhu , J. Phys. Chem. C 2011 , 115 ,
14006 .
[14] N. Li , G. Liu , C. Zhen , F. Li , L. Zhang , H. M. Cheng , Adv. Funct. Mater. 2011 , 21 , 1717 .
[15] Z. S. Wu , W. Ren , L. Gao , J. Zhao , Z. Chen , B. Liu , D. Tang , B. Yu , C. Jiang , H. M. Cheng , ACS Nano 2009 , 3 , 411 .
[16] A. Yoshida , Y. Hishiyama , M. Inagaki , Carbon 1991 , 29 , 1227 . [17] R S. Ganguli , A. K. Roy , D. P. Anderson , Carbon 2008 , 46 , 806 . [18] W. F. Zhang , Y. L. He , M. S. Zhang , Z. Yin , Q. Chen , J. Phys. D: Appl.
Phys. 2000 , 33 , 912 . [19] U. J. Kim , C. A. Furtado , X. Liu , G. Chen , P. C. Eklund , J. Am. Chem.
Soc. 2005 , 127 , 15437 . [20] F. Tuinstra , J. L. Koenig , J. Chem. Phys. 1970 , 53 , 1126 . [21] G. A. Zickler , B. Smarsly , N. Gierlinger , H. Peterlik , O. Paris ,
Carbon 2006 , 44 , 3239 . [22] K. R. Zhu , M. S. Zhang , Q. Chen , Z. Yin , Phys. Lett. A 2005 , 340 ,
220 . [23] G. Li , L. Li , J. Boerio-Goates , B. F. Woodfi eld , J. Am. Chem. Soc.
2005 , 127 , 8659 . [24] J. Wang , A. K. Mishra , Q. Zhao , L. Huang , J. Phys. D: Appl. Phys.
2013 , 46 , 255303 . [25] W. Jang , Z. Chen , W. Bao , C. N. Lau , C. Dames , Nano Lett. 2010 ,
10 , 3009 . [26] S. Stankovich , D. A. Dikin , R. D. Piner , K. A. Kohlhaas ,
A. Kleinhammes , Y. Jia , Y. Wu , S. T. Nguyen , R. S. Ruoff , Carbon 2007 , 45 , 1558 .
[27] A. K. Mishra , S. Ramaprabhu , Int. J. Chem. Eng. Appl. 2010 , 1 , 266 .
Received: May 21, 2014 Revised: July 5, 2014Published online:
small 2014, DOI: 10.1002/smll.201401418