microwave assisted synthesis and characterizations of decorated activated carbon
TRANSCRIPT
Int. J. Electrochem. Sci., 7 (2012) 5484 – 5494
International Journal of
ELECTROCHEMICAL SCIENCE
www.electrochemsci.org
Microwave Assisted Synthesis and Characterizations of
Decorated Activated Carbon
K. Sathish- Kumar1, G. Vázquez-Huerta
2, Andrés Rodríguez-Castellanos
2, H. M. Poggi-Varaldo
1,3,
O. Solorza-Feria1,2,*
1 Programa de Nanociencia y Nanotecnología, Centro de Investigación y de Estudios Avanzados del
I.P.N., P.O. Box 14-740, México D.F. 07000, México. 2
Depto. Química, Centro de Investigación y de Estudios Avanzados del I.P.N. Mexico. 3
Depto Biotecnología y Bioingeniería, Centro de Investigación y de Estudios Avanzados del I.P.N.,
Mexico. *E-mail: [email protected]
Received: 1 March 2012 / Accepted: 24 April 2012 / Published: 1 June 2012
A novel intermittent microwave assisted method was developed for surface impregnation and electrical
properties improvement of decorated activated carbon (DAC), from commercially available activated
carbon (AC) and Vulcan carbon (VC). These materials were characterized by UV-visible
spectroscopy, Raman spectroscopy, X-ray diffraction (XRD), Brunauer–Emmett–Teller (BET),
scanning electron microscopy (SEM) and electrical conductivity. The UV absorption peak in carbon
materials is related to electronic transitions between the bonding and antibonding π orbital. Raman
spectroscopy and XRD results showed that the higher disorder of amorphous carbon phase arose in
DAC, when compared to typical AC. Results from BET analysis had relatively high surface area of
1141m2/g and total pore size volume of 0.524 m
3/g for DAC. SEM analysis revealed that undefined
structure of activated carbon material (~1-3 µm in size) breakage into ~ 100 nm in size over this
Vulcan carbon material (~60nm in size) was decorated. From the electrical conductivity (σ) study, the
value of σ followed the tendency DAC < VC < AC and increased almost with pressure. High surface
area and high conductivity decorated carbon nano structures could be used as candidate hosts for metal
electrocatalysts for fuel cell applications.
Keywords: Activated carbon; carbon support; microwave assisted synthesis; Nanoparticles;
1. INTRODUCTION
Carbon materials have been widely investigated as functional materials for various applications
including electrodes for batteries and fuel cells, adsorbents for water purification, and catalyst supports
Int. J. Electrochem. Sci., Vol. 7, 2012
5485
[1-5]. It is well known that the size, structure, density and shape of the materials influence their
electrical properties and their potential applications [6,7]. Hence, the fabrication of carbon materials of
a particular morphology is very important for their various applications. Recently, there has been
increasing interest in the preparation and processing of various nanostructured carbon materials
proposed for potential applications in supercapacitors [4], field emission [8], catalyst support [9], and
solar energy conversion [10].
Graphitic carbon materials with a high surface area have attracted attention due to their
potential applications. Traditional methods for the synthesis of graphitic carbon materials commonly
need additional high thermal treatment [11, 12]. However, a large reduction of the surface area and
pore volume of the carbon materials usually results after treatment at high temperatures. Microwave
assisted heating offers the apparent advantage of reducing treatment time, which may represent a
reduction in the energy consumption. It has been reported that microwave energy was derived from
electrical energy with a conversion efficiency of approximately 50% for 2450 MHz and 85% for 915
MHz [13]. Microwave assisted heating caused a reduction in micropore volume and micropore sizes.
Also, the microwave treatment is a very effective method for modifying the surface chemistry of the
activated carbon fibers [14,15].
In the present work, we have designed a simple and efficient microwave assisted method for
surface impregnation of Vulcan XC72R carbon on activated carbon materials leading to high surface
area. Also achieved the morphological, electrical and structural properties of the decorated carbon
material were characterized. To the best of our knowledge this is the first time that microwave was
exploited for surface impregnation of carbon materials. These modified materials could be used as a
supporting material for metal electrocatalysts, adsorbents, and electrodes in microbial fuel cells.
2. EXPERIMENTAL PROCEDURE
2.1 Microwave assisted decoration of activated carbon
The activated carbon (AC) (Sigma Aldrich) and Vulcan XC 72R carbon (VC) were dispersed
in water in the ratio of 1:1 and allowed ultra sonication for 60 min. Then the carbon mixture was
centrifuged at 8 000 rpm for 10 min and the precipitated powder was collected. Afterward, ethylene
glycol was added to the carbon mixture for further microwave irradiation. A microwave irradiation
programme was used for 20 seconds ON and 20 seconds OFF, repeating the programme 8 times.
Finally the modified carbon materials (AVC) were collected and washed with water several times to
eliminates impurities. The resulting powder was dried overnight, kept in desiccators and further used
for physical characterization.
2.2 Physical characterization of carbon materials
The absorption spectra were obtained using a UV-vis spectrophotometer (Varian Inc. Cary
100/300, model 100/300). The Raman spectroscopy was performed with a Horiba HR800 model
Int. J. Electrochem. Sci., Vol. 7, 2012
5486
operating at 514.5nm excitation. X-ray patterns of the decorated carbon powder were obtained in a
Diffract Brucker AXS, D8 Advanced Plus difractometer operated at 30 mA and 35 kV using a
monochromatic CuKα radiation (λ = 0.15443 nm). A 2θ scanning range from 10° to 90° was explored
at a step scan rate of 0.02° min-1
. Topography analyses were carried out using field emission scanning
electron microscopy (GEMINI-Carl Zeiss). An Autochem II 2920 (Micrometrics) instrument was used
to measure the nitrogen adsorption isotherms at -196 oC for determining the total pore volume and the
specific surface area through the Brunauer–Emmett–Teller (BET) equation [16].
2.3 Electrical conductivity
The electrical conductivity (σ) of carbon samples was measured by impedance spectroscopy
within the frequency range 10 kHz– 100 mHz, at room temperature. The carbon black samples were
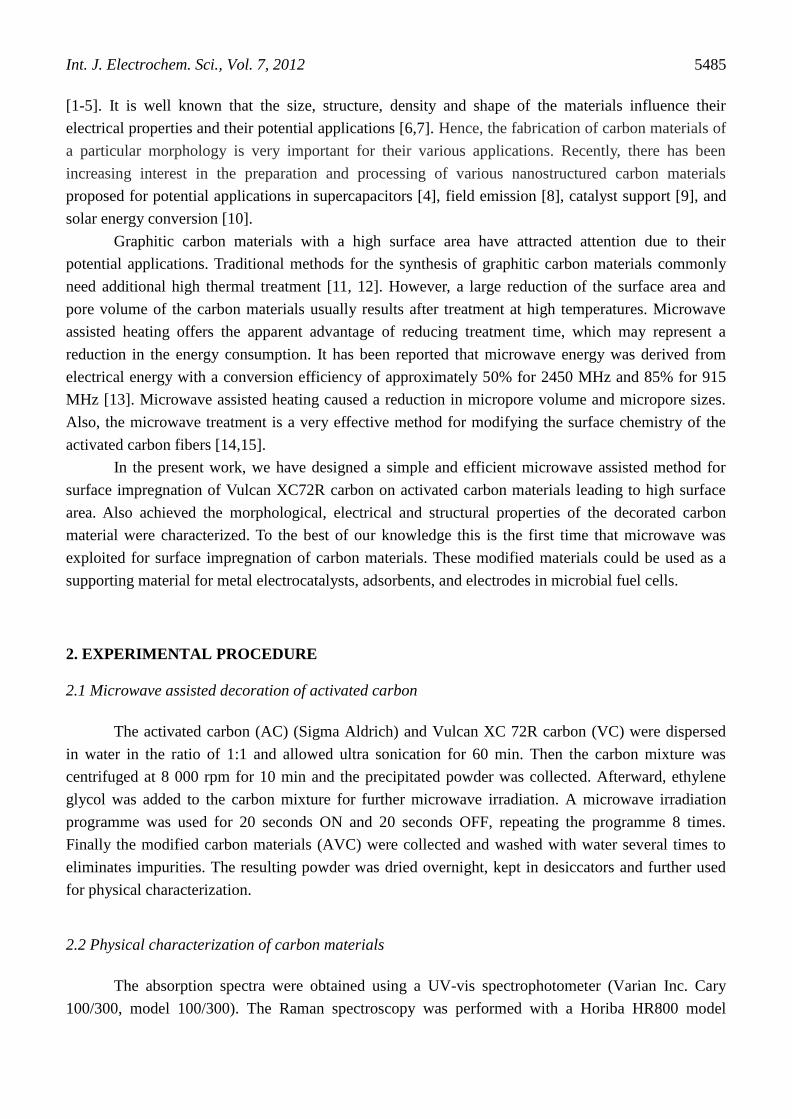
placed in a glass tube (inner diameter = 0.5 cm) between two metal pistons, the upper one movable and
the lower one fixed. The electrical conductivity was measured at different pressures varied between 10
and 1013 kPa by employing different loadings on the upper piston. Changes in the height caused by
loadings were measured with an accuracy of +0.02 mm. A view of the experimental arrangement is
shown in Figure 1.
Figure 1. Experimental arrangement for electrical conductivity measurements.
The carbon samples used were dried at 100ºC overnight. 10 mg of each sample were employed
for the measurements. A potentiostat/galvanostat, PARSTAT 2273, was used to measure the
conductivity of the different samples. 3 min were allowed before any conductivity measurement to
Int. J. Electrochem. Sci., Vol. 7, 2012
5487
avoid any transient effect of sample relaxation due to compression. The conductivity was calculated
using equation 1.
AR
l (1)
Where: l is the distance between the two pistons (cm), R is the electrical resistance (Ω), A the
area of the piston surface (cm2). The volume and density of the samples were determined after the
measurement of l.
3. RESULTS AND DISCUSSIONS
3.1 Physical characterization of Carbon materials
3.1.1. SEM and BET Surface area analysis
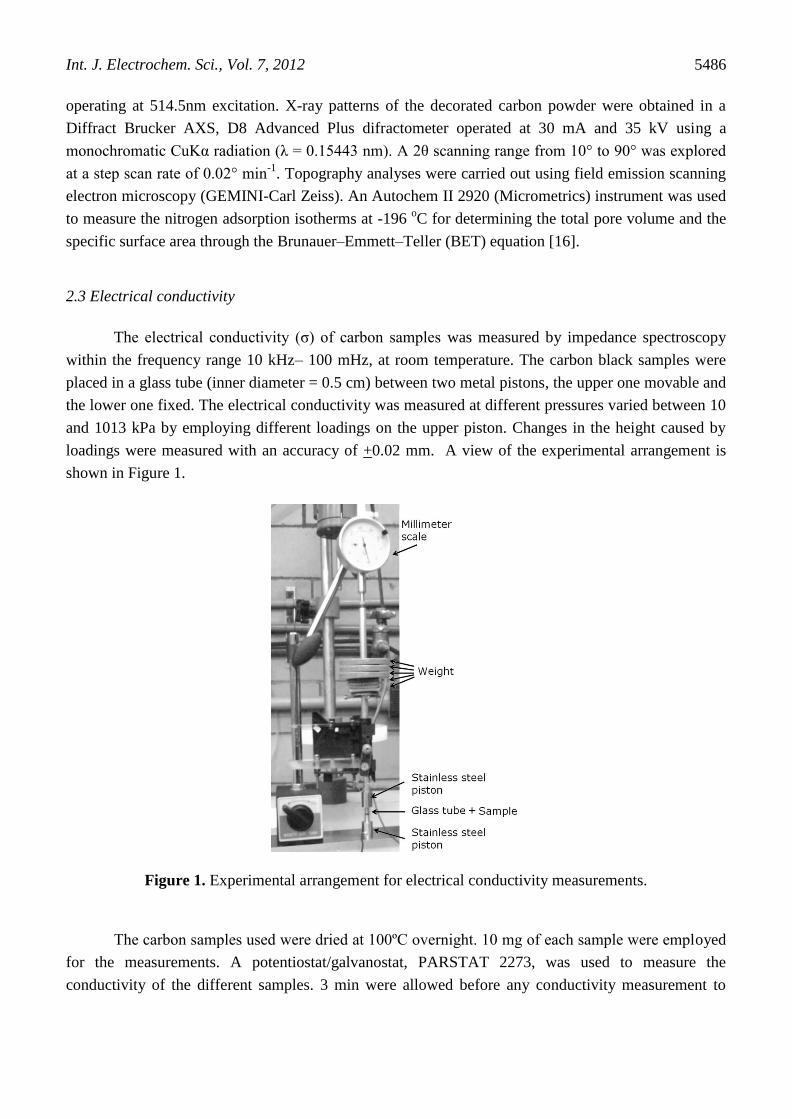
The schematic representation of our synthesis method of DAC is depicted in Figure 2.
Figure 2. Schematic representation of the synthesis method for decorated DAC
Int. J. Electrochem. Sci., Vol. 7, 2012
5488
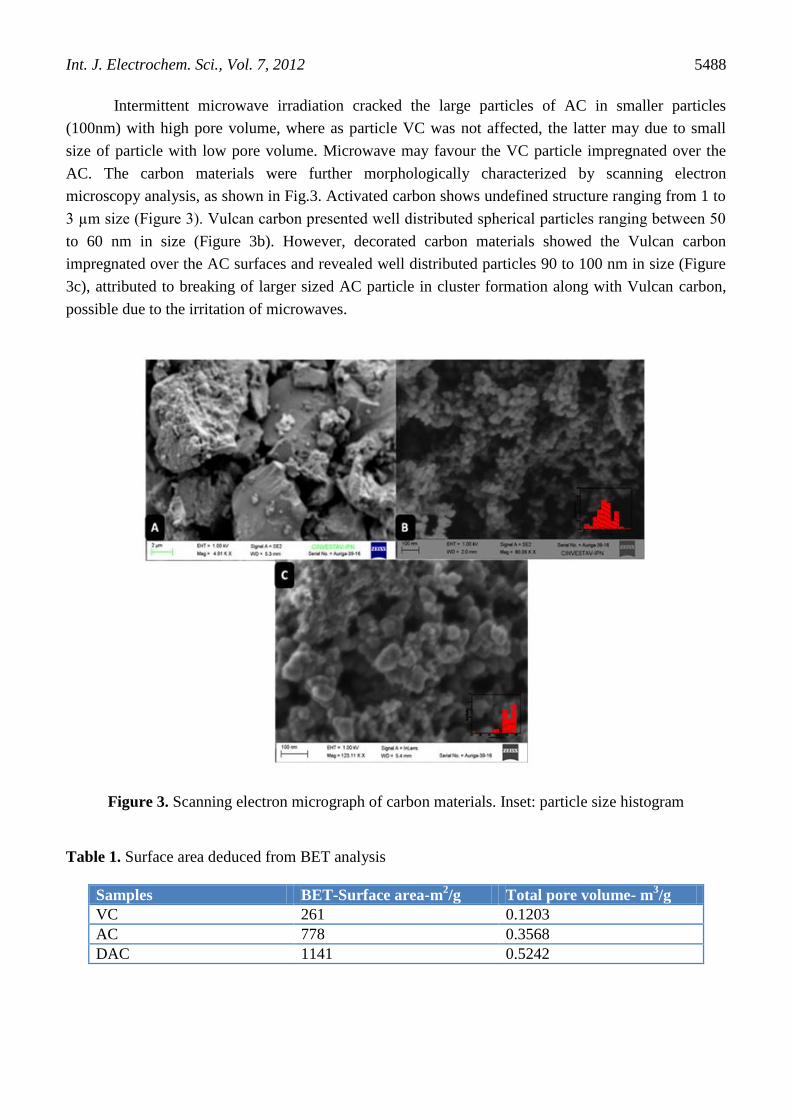
Intermittent microwave irradiation cracked the large particles of AC in smaller particles
(100nm) with high pore volume, where as particle VC was not affected, the latter may due to small
size of particle with low pore volume. Microwave may favour the VC particle impregnated over the
AC. The carbon materials were further morphologically characterized by scanning electron
microscopy analysis, as shown in Fig.3. Activated carbon shows undefined structure ranging from 1 to
3 µm size (Figure 3). Vulcan carbon presented well distributed spherical particles ranging between 50
to 60 nm in size (Figure 3b). However, decorated carbon materials showed the Vulcan carbon
impregnated over the AC surfaces and revealed well distributed particles 90 to 100 nm in size (Figure
3c), attributed to breaking of larger sized AC particle in cluster formation along with Vulcan carbon,
possible due to the irritation of microwaves.
Figure 3. Scanning electron micrograph of carbon materials. Inset: particle size histogram
Table 1. Surface area deduced from BET analysis
Samples BET-Surface area-m2/g Total pore volume- m
3/g
VC 261 0.1203
AC 778 0.3568
DAC 1141 0.5242
Int. J. Electrochem. Sci., Vol. 7, 2012
5489
The adsorption rates and capacities of typical carbon materials (AC and VC) increased after
several adsorption-microwave regeneration cycles, which were reflected by the BET surface area
analysis depicted in Table 1. The values for BET surface area and total pore volume followed the
tendency DAC>AC>VC. BET surface area and total pore volume values obtained in the present work
were in agreement with those reported previously in literature [14, 17].
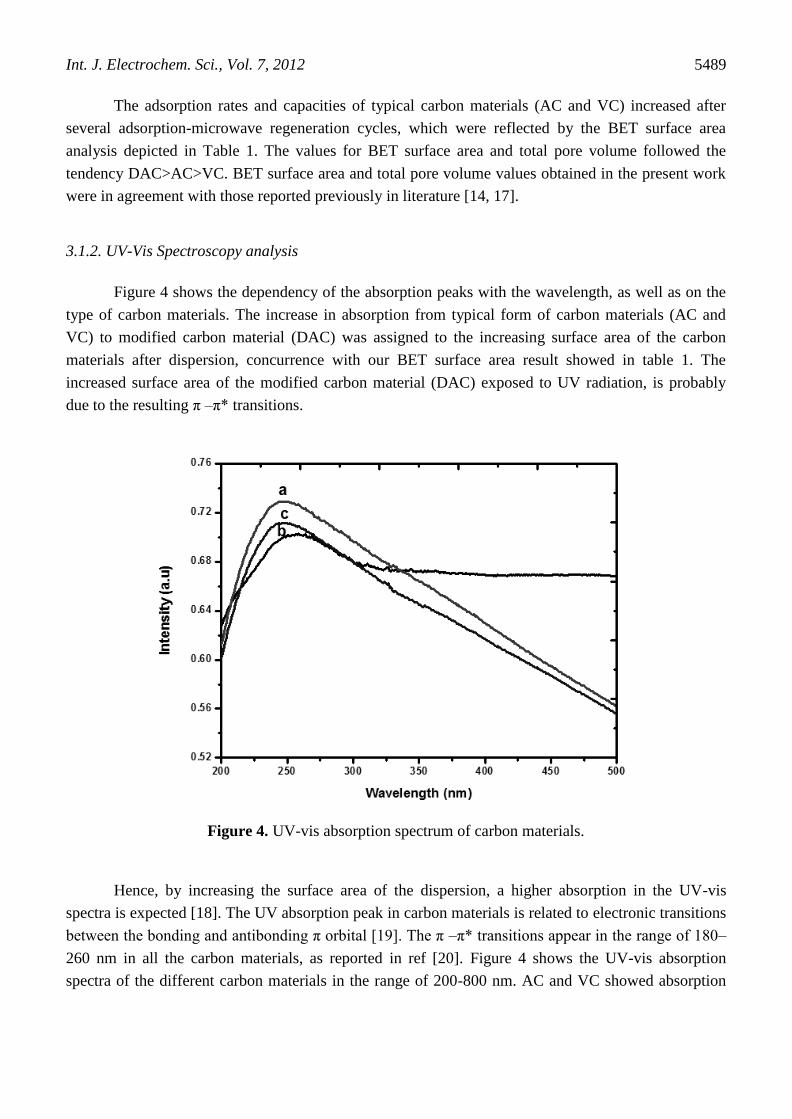
3.1.2. UV-Vis Spectroscopy analysis
Figure 4 shows the dependency of the absorption peaks with the wavelength, as well as on the
type of carbon materials. The increase in absorption from typical form of carbon materials (AC and
VC) to modified carbon material (DAC) was assigned to the increasing surface area of the carbon
materials after dispersion, concurrence with our BET surface area result showed in table 1. The
increased surface area of the modified carbon material (DAC) exposed to UV radiation, is probably
due to the resulting π –π* transitions.
Figure 4. UV-vis absorption spectrum of carbon materials.
Hence, by increasing the surface area of the dispersion, a higher absorption in the UV-vis
spectra is expected [18]. The UV absorption peak in carbon materials is related to electronic transitions
between the bonding and antibonding π orbital [19]. The π –π* transitions appear in the range of 180–
260 nm in all the carbon materials, as reported in ref [20]. Figure 4 shows the UV-vis absorption
spectra of the different carbon materials in the range of 200-800 nm. AC and VC showed absorption
Int. J. Electrochem. Sci., Vol. 7, 2012
5490
maximum peaks (λ max) at 258 and 249nm, respectively (Figure 4 curve b and c). The λ max of the DAC
materials showed an absorption maximum peak at 247nm (Figure 4 curve a).
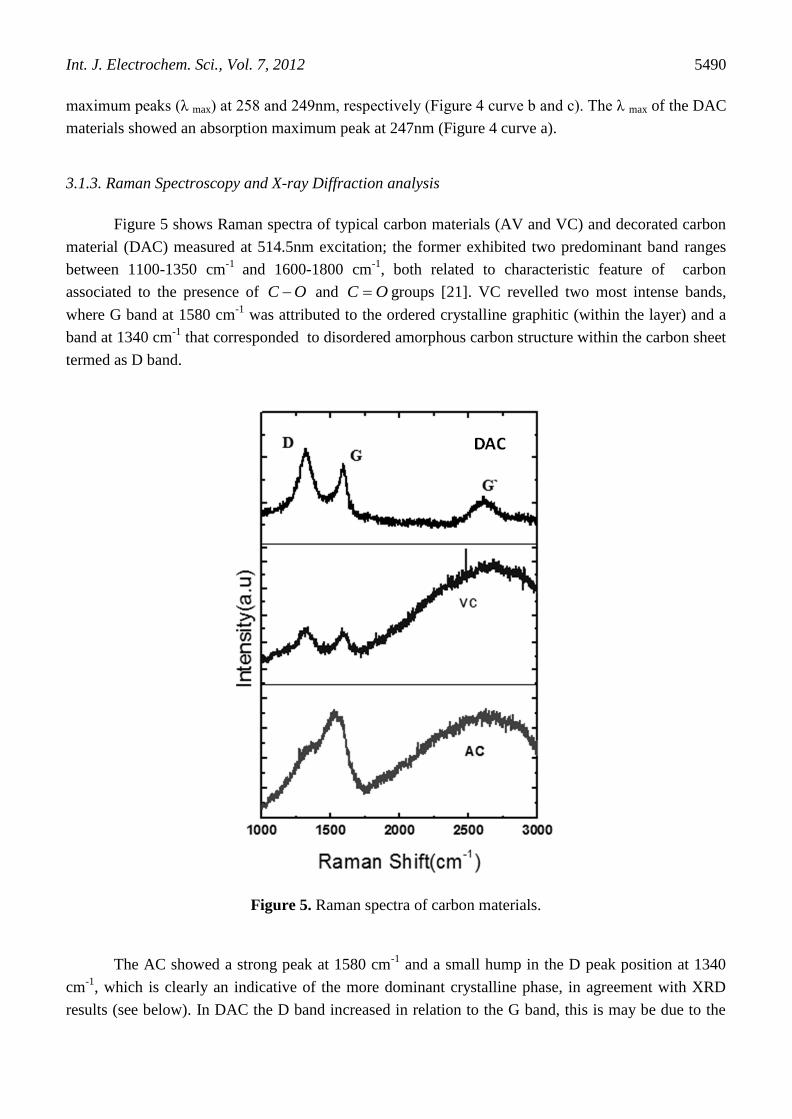
3.1.3. Raman Spectroscopy and X-ray Diffraction analysis
Figure 5 shows Raman spectra of typical carbon materials (AV and VC) and decorated carbon
material (DAC) measured at 514.5nm excitation; the former exhibited two predominant band ranges
between 1100-1350 cm-1
and 1600-1800 cm-1
, both related to characteristic feature of carbon
associated to the presence of OC and OC groups [21]. VC revelled two most intense bands,
where G band at 1580 cm-1
was attributed to the ordered crystalline graphitic (within the layer) and a
band at 1340 cm-1
that corresponded to disordered amorphous carbon structure within the carbon sheet
termed as D band.
Figure 5. Raman spectra of carbon materials.
The AC showed a strong peak at 1580 cm-1
and a small hump in the D peak position at 1340
cm-1
, which is clearly an indicative of the more dominant crystalline phase, in agreement with XRD
results (see below). In DAC the D band increased in relation to the G band, this is may be due to the
Int. J. Electrochem. Sci., Vol. 7, 2012
5491
increase of disorder in carbon phase on the modified surfaces and the most prominent band, always
observed in graphite G´ sample, appears at 2600 cm-1
in decorated carbon samples [22]. This outcome
concurs with the surface modification of crystalline activated carbon materials over amorphous Vulcan
carbon and conform the XRD results. This result is important because the amorphousness/ crystalline
ratio of graphite directly impacts on the contact properties between the support and metal catalyst (i.e.,
Pd), which affected the mass-transport properties of the gas diffusion electrode [23, 24].
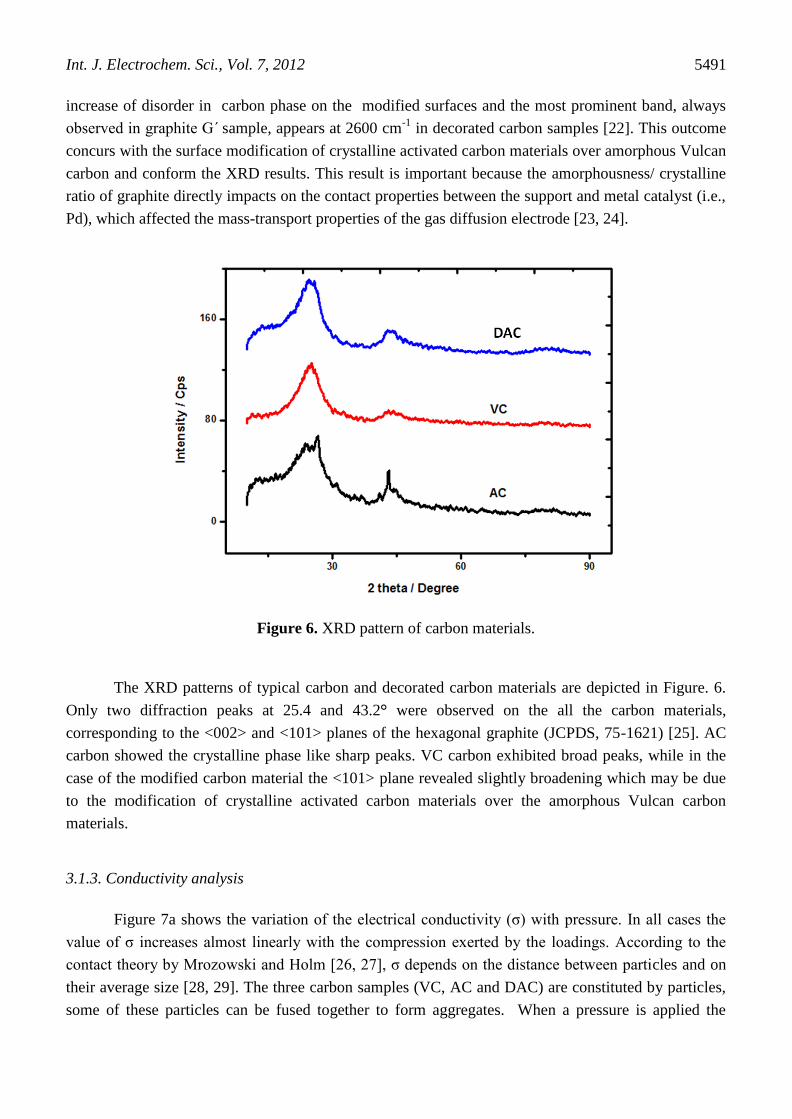
Figure 6. XRD pattern of carbon materials.
The XRD patterns of typical carbon and decorated carbon materials are depicted in Figure. 6.
Only two diffraction peaks at 25.4 and 43.2° were observed on the all the carbon materials,
corresponding to the <002> and <101> planes of the hexagonal graphite (JCPDS, 75-1621) [25]. AC
carbon showed the crystalline phase like sharp peaks. VC carbon exhibited broad peaks, while in the
case of the modified carbon material the <101> plane revealed slightly broadening which may be due
to the modification of crystalline activated carbon materials over the amorphous Vulcan carbon
materials.
3.1.3. Conductivity analysis
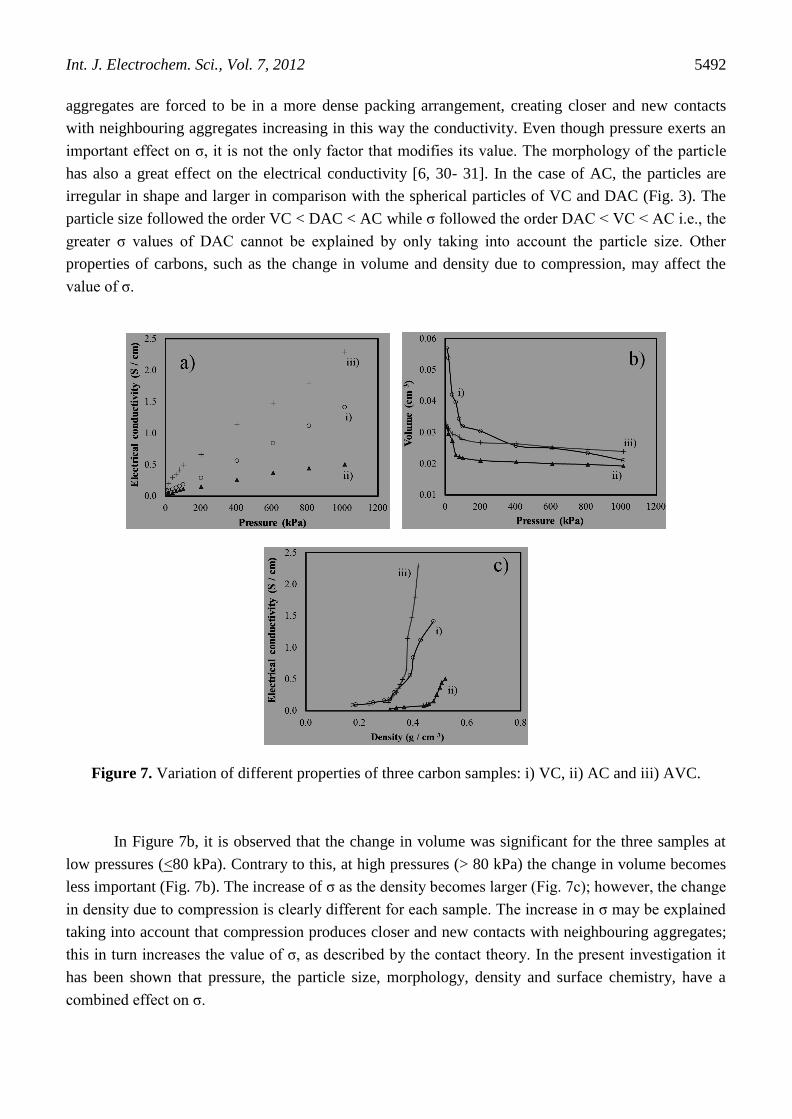
Figure 7a shows the variation of the electrical conductivity (σ) with pressure. In all cases the
value of σ increases almost linearly with the compression exerted by the loadings. According to the
contact theory by Mrozowski and Holm [26, 27], σ depends on the distance between particles and on
their average size [28, 29]. The three carbon samples (VC, AC and DAC) are constituted by particles,
some of these particles can be fused together to form aggregates. When a pressure is applied the
Int. J. Electrochem. Sci., Vol. 7, 2012
5492
aggregates are forced to be in a more dense packing arrangement, creating closer and new contacts
with neighbouring aggregates increasing in this way the conductivity. Even though pressure exerts an
important effect on σ, it is not the only factor that modifies its value. The morphology of the particle
has also a great effect on the electrical conductivity [6, 30- 31]. In the case of AC, the particles are
irregular in shape and larger in comparison with the spherical particles of VC and DAC (Fig. 3). The
particle size followed the order VC < DAC < AC while σ followed the order DAC < VC < AC i.e., the
greater σ values of DAC cannot be explained by only taking into account the particle size. Other
properties of carbons, such as the change in volume and density due to compression, may affect the
value of σ.
Figure 7. Variation of different properties of three carbon samples: i) VC, ii) AC and iii) AVC.
In Figure 7b, it is observed that the change in volume was significant for the three samples at
low pressures (<80 kPa). Contrary to this, at high pressures (> 80 kPa) the change in volume becomes
less important (Fig. 7b). The increase of σ as the density becomes larger (Fig. 7c); however, the change
in density due to compression is clearly different for each sample. The increase in σ may be explained
taking into account that compression produces closer and new contacts with neighbouring aggregates;
this in turn increases the value of σ, as described by the contact theory. In the present investigation it
has been shown that pressure, the particle size, morphology, density and surface chemistry, have a
combined effect on σ.
Int. J. Electrochem. Sci., Vol. 7, 2012
5493
4. CONCLUSIONS
A novel method of surface impregnation of decorated AVC materials was developed through
intermittent microwave irradiation. Decorated AVC morphologies and textural features exhibited a
high surface area and increased pore volume after the microwave irradiation. The AVC revealed a well
distributed particle size (~90 to 100 nm), caused by the breakage of larger sized AC particles due to
microwave irradiation during synthesis. The XRD patterns shows two diffraction peaks corresponding
to the <002> and <101> planes of the hexagonal graphite. Raman analysis showed a predominant peak
in G position for AVC sample; this may be due to an increase of disorder in AVC. For all the samples,
the value of σ increases almost linearly with experimental pressure, σ values follows the order AVC <
VC < AC. These modified materials could be used as a supporting material for metal electrocatalysts,
adsorbents, and electrodes in microbial fuel cells.
ACKNOWLEDGEMENTS
KSK thanks to SEP and CINVESTAV for providing a Ph.D. fellowship and technical assistance of Sebastian Citalan Cigarroa, and personnel from the Fuel Cell and Hydrogen Group of CINVESTAV.
GVH thanks to ICYTDF for the financial support through a Postdoctoral grant. Part of this work was
supported by a Grant from Mexico National Council of Science and Technology, CONACYT (Ref.
101537).
References
1. C-T. Hsieh, W-Y. Chen, I.L. Chen, A.K. Roy, J. Power Sources. 199 (2012) 94-102.
2. D. Kalpana, S.H. Cho, S.B. Lee, Y.S Lee, R. Misra, J. Power Sources. 190 (2009) 587-591.
3. J. Wang, M. Chen, C. Wang, J. Wang, J. Zheng, J. Power Sources. 196 (2011) 550-558.
4. Y. Cheol-Min, K. Yong-Jung, E. Morinobu, K. Hirofumi, Y. Masako, I. Sumio, K. Katsumi , J
Am Chem Soc. 129 (2007) 20-21.
5. Y. Yuan, J.A. Smith, G. Goenaga, D-J. Liu, Z. Luo, J. Liu, J. Power Sources. 196 (2011) 6160-7.
6. D. Pantea, H. Darmstadt, S. Kaliaguine, L. Su¨mmchen, C. Roy, Carbon. 39 (2001) 1147-1158.
7. D. Pantea, H. Darmstadt, S. Kaliaguine, C. Roy, Appl Surf Science. 217 (2003) 181–193.
8. Y. Saito, Y. Tsujimoto, A. Koshio, F. Kokai, Appl Phys Lett. 90 (2007) 213108.
9. G. Ramos-Sánchez, M.M. Bruno, Y.R.J. Thomas, H.R. Corti, O. Solorza-Feria, Int. J. Hydrog.
Energy. 37 (2012) 31-40.
10. G. Pagona, N. Tagmatarchis, J. Fan, M. Yudasaka, S. Iijima, Chem Mater. 18 (2006) 3918-3920.
11. Y. Hanzawa, H. Hatori, N. Yoshizawa, Y. Yamada, Carbon. 40 (2002) 575-581.
12. X.W. Chen, D.S. Su, R. Schlögl, Phys Stat Sol B. 243 (2006) 533-3536.
13. K.E. Haque, Int J Miner Process. 57 (1999) 1-24.
14. S. Wenzhong, L. Zhijie, L. Yihong, Rec Pat Chem Eng. 1 (2008) 27-40.
15. V.L. Budarin, J.H. Clark, S.J. Tavener, K. Wilson, Chem Commun (Camb). 23 (2004) 2736-2737.
16. F. Rouquerol, J. Rouquerol, K. Sing, in Adsorption by powders and porous solids, Academic
Press, San Diego, 1999.
17. X. Quan, X.T. Liu, L.L. Bo, S. Chen, Y.Z. Zhao, X.Y. Cui, Water Res. 38 (2004) 4484-4490.
18. S.H. Sharif, F. Golestani-Fard, E. Khatibi, H. Sarpoolaky, M. J. Taiwan Inst Chem Engineers. 40
(2009) 524–527.
19. D.C. Green, D.R. McKenzie, P.B. Lukins, Mater Science Forum, Trans. Tech. (1990) 52.
20. C. Jager, T.H. Henning, R. Schlogl, O. Spillecke, Non-Crystalline Solids. 258 (1999)161.
Int. J. Electrochem. Sci., Vol. 7, 2012
5494
21. R.G. Gonzalez-Huerta, M.L. Luna-Martinez, O. Solorza-Feria, ECS Trans. 20 (2009) 267.
22. R.P. Vidano, D.B. Fishbach, L.J. Willis, T.M. Loehr, Solid State Commun. 39 (1981) 341-344.
23. J. Oiao, B. Li, J. Ma, J. Electrochem. Soc. 156 (2009) B436-B440.
24. C. Castiglioni, M. Tommasini, Opt. Pura Apl. 40 (2007)169.
25. Y. Dingsheng, Z. Jianghua, C.H. Jingxing, T. Sanxiang, L. Yingliang, K. Noel, W. Xin, J
Electrochem Soc. 156 (2009) B377-B380.
26. S. Mrozowski, Studies of carbon powders under compression. In: Proceedings 3rd Carbon
Conference, Buffalo, USA, (1957) 495.
27. R. Holm, Electrical contacts. Stockholm: H Geben, (1946).
28. R. Holm. In: Electric contacts: theory and applications, Springer Verlag, Berlin (1967) 135-152.
29. K. Kinoshita. Carbon: Electrochemical and physical properties. New York: Wiley; (1988) Chapter
2.5.
30. J.B. Donnet, A. Voet, Carbon black: physics, chemistry, and elastomer reinforcement, Marcel
Dekker, New York, (1976). 31. A.I. Medalia, Rubber Chem Technol. 59 (1986) 432.
© 2012 by ESG (www.electrochemsci.org)