advanced characterizations of nanoparticles for drug delivery
TRANSCRIPT
Nanotechnol Rev 2017; 6(4): 355–372
Review
Syed Mahmood, Uttam Kumar Mandal*, Bappaditya Chatterjee and Muhammad Taher
Advanced characterizations of nanoparticles for drug delivery: investigating their properties through the techniques used in their evaluationsDOI 10.1515/ntrev-2016-0050Received June 23, 2016; accepted October 5, 2016; previously published online December 20, 2016
Abstract: Nanomedicine has achieved a huge success in delivering a wide variety of drug molecules into the tar-get site of the body. In this respect, the characterization of nanoformulation is very important to investigate the drug molecule together with its carrier as a nanoform during for-mulation, storage, and in vivo transport through the body. This review article summarizes important advanced char-acterization techniques of nanoformulation with respect to their theories, use of required instrumental parameters, sample preparation techniques, data interpretation, etc., to exploit them for the best possible results. This review article also sheds a glimpse to the shortcomings of these techniques together with further advancements required in future.
Keywords: atomic force microscopy; confocal laser scan-ning microscopy; DLS; scanning electron microscopy; transmission electron microscopy.
Abbreviations: NPs, nanoparticles; DLS, dynamic light scattering; SEM, scanning electron microscopy; ESEM, environmental scanning electron microscopy; STM, scanning tunneling microscope; FESEM, field emission scanning electron microscopy; TEM, transmission elec-tron microscopy; STEM, scanning transmission electron microscopy; CLSM, confocal laser scanning microscopy; AFM, atomic force microscopy; PDI, polydispersity index;
BBB, blood-brain barrier; LaB6, lanthanum hexaboride; MDMs, monocyte-derived macrophages; CNTs, carbon nanotubes; FEG, field emission gun; PLGA, polylactic-co-glycolic acid; ZnSe, zinc selenide; HVEM, high-voltage electron microscope; HRTEM, high-resolution transmis-sion electron microscope; FITC, fluorescein 5-isothiocy-anate; DMPC1, 2-dimyristoyl-sn-glycero-3-phosphocholine; TRPS, tunable resistive pulse sensing; ICP-MS, inductively coupled plasma-mass spectrometry.
1 IntroductionThe nanoparticular drug delivery approach has opened up a vast scope to deliver a wide range of synthetic and biomolecular therapeutic entities into a target site of the body [1, 2]. The characterization of those formulations, especially the investigation of nanostructure during for-mulation, stability assessment, and biological transport through the body, remains an important aspect for the success of this drug delivery approach [3]. Here comes the requirement of advanced modern characterization techniques. Successful utilization and exploitation of these techniques need a good amount of understanding of the theory or working principles of those instruments together with sample preparation techniques and many more related things that could affect or misinterpret the obtained results. The objective of this review article is to focus this aspect of nano-drug delivery as it has not been discussed together in a place, although a huge volume of works on individual technique can be found elsewhere [4–7]. This review will focus on the advanced characterization techniques for a nanoparticle (NP) formulation such as dynamic light scattering (DLS) technique (for particle size, polydispersity index [PDI], and zeta potential), scanning electron microscopy (SEM), environmental scanning elec-tron microscopy (ESEM), field emission scanning electron microscopy (FESEM), transmission electron microscopy (TEM), confocal laser scanning microscopy (CLSM), and atomic force microscopy (AFM) from the drug delivery
*Corresponding author: Uttam Kumar Mandal, Department of Pharmaceutical Technology, Kulliyyah of Pharmacy, International Islamic University Malaysia (IIUM), Jalan Sultan Ahmad Shah, Bandar Indera Mahkota, 25200, Kuantan, Pahang Darul Makmur, Malaysia, e-mail: [email protected]. http://orcid.org/0000-0002-4489-1138Syed Mahmood, Bappaditya Chatterjee and Muhammad Taher: Department of Pharmaceutical Technology, Kulliyyah of Pharmacy, International Islamic University Malaysia (IIUM), Jalan Sultan Ahmad Shah, Bandar Indera Mahkota, 25200, Kuantan, Pahang Darul Makmur, Malaysia
356 S. Mahmood et al.: Advanced characterizations of nanoparticles for drug delivery
point of view together with their shortcomings and future advancement required.
2 Techniques used in characterizing/investigating physical properties of NPs
2.1 Particle size determination
The physical characters of NPs are important for assess-ing the mechanical behaviors they possess. The size of the NPs can be determined by many trending methods, but the selection of the best one depends on the information required for a particular application. The selected methods lead to the assessment of related parameters such as particle shape, size, or width of the distribution; PDI (homogeneous or heterogeneous population); and the typical symmetry they follow. Experimental observations vary according to the shape of the particles; for example, rectangular parti-cles will show different instrumental responses compared with spherical particles, and eventually it will also affect the coordinate values of size distribution, such as projected area, hydrodynamic diameter, Feret’s diameter, or caliper diameter [8]. Contemporary techniques used in the evalua-tion of the size of NPs are dark field optical microscopy [9], DLS [10], static light scattering [11], ultrasonic spectroscopy [12], single-particle optical sensing [13], field flow fractiona-tion [14], turbidimetry [15], nuclear magnetic resonance [16], etc. Of all these techniques, DLS, also known as photon cor-relation spectroscopy, or quasi-elastic light scattering, is the most common technique used nowadays for the evaluation of particle size and its distribution pattern.
2.1.1 DLS technique
DLS is said to be a hydrodynamic technique as it directly measures hydrodynamic quantitative values of rotational and translational diffusion coefficients, which corre-spond to the shapes and sizes of particles via theoretical relations [10]. The measurement of particle size is based on the random changes in the intensity of their light scat-tering from a suspension or solution. Colloidal particles in the sample are under Brownian motion within the dis-persing solvent, resulting in bombardment among one another or the surrounding solvent molecules. This gives fluctuating response with respect to the light intensity as the particles change their positions continuously. The Brownian motions of the particles in the solvent behave in
an uncontrolled manner that is defined by a translational diffusion coefficient (D). This coefficient again depends on the size of the particles; the smaller the particles, the faster their motions. High temperature also increases the Brown-ian motion. Thus, DLS analyses velocity distribution of the particle movement caused by their Brownian motion in the form of dynamic fluctuations of light scattering intensity. The signals are computed electronically by an autocorrela-tion function [17]. The sizes of the particles are then calcu-lated or described by Stokes-Einstein equations, where the spherical particles’ translational self-diffusion coefficient is related to their particle radius, R [18]. The radius of non-spherical particles is called hydrodynamic radius, R, and it is measured by the following equation:
B
6K T
DRπη′
=′
(1)
where T is the absolute temperature, ή is the viscosity of the suspending medium, KB is Boltzmann’s constant, and D is the translational diffusion coefficient.
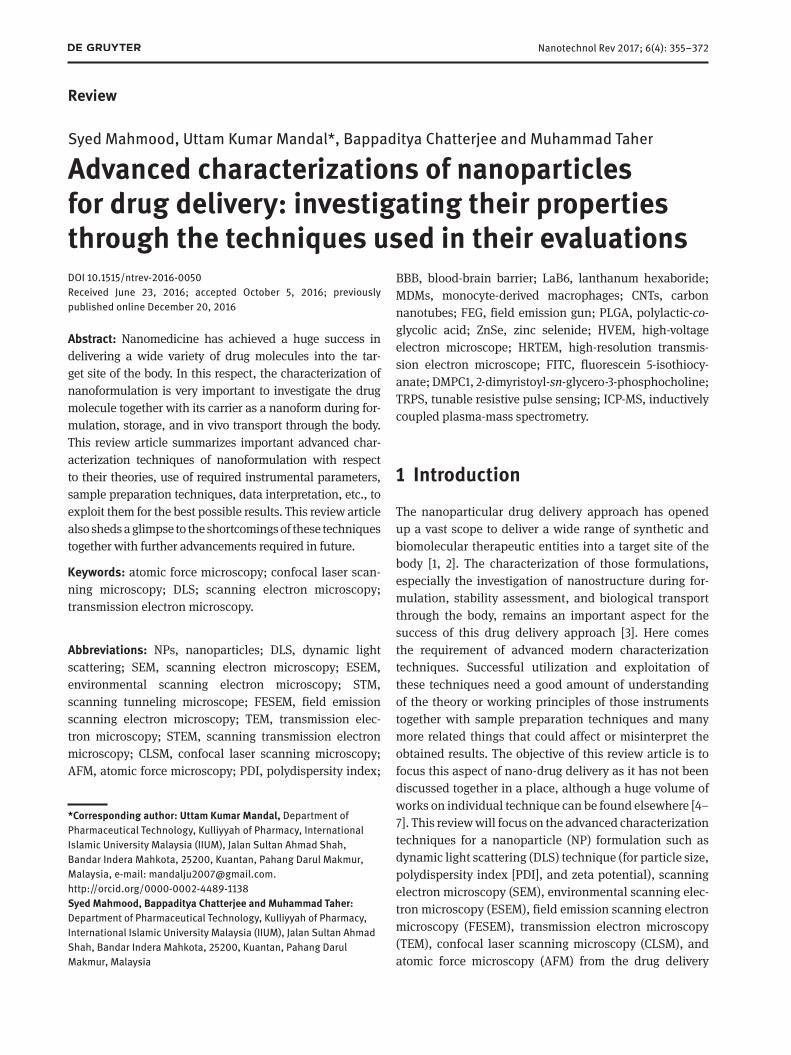
A simple flow diagram of a DLS instrumental setup is shown in Figure 1. The instrument contains a laser pro-viding monochromatic light source to a cuvette containing sample through a polarizer. The scattered light falls to the detector, a photomultiplier, or a photon counting device, through a second polarizer. Digital signal processor col-lects the signal, and the resulting image is projected onto a screen in the form of a speckle pattern.
2.1.2 Polydispersity index (PDI)
The population of NPs in a formulation is always polydis-persed in nature, and the results by DLS are reported in the form of homogeneity and heterogeneity of the particle size distribution. PDI obtained from DLS is a dimensionless quantity that measures the broadness of the size distribu-tion calculated from a cumulant analysis. A small value of PDI (<0.1) represents a homogeneous population of the
Laser Mirror
Attenuator
Detector
Auto-correlator/
dataDetector
SampleScattering of
light
90°
173°
Size distributiondata/plot
Figure 1: Representative flow diagram of a DLS instrument.
S. Mahmood et al.: Advanced characterizations of nanoparticles for drug delivery 357
particles, whereas a value of >0.3 is regarded as a higher heterogeneous population [19]. Different approaches are followed to get the desired size of NPs, as size affects the efficacy of a nanoparticular drug delivery system.
In case of multimodal particle size distribution, the DLS technique cannot classify the particles with a wide variation in their sizes. As an example, when a mixture contains particles of 40 and 120 nm, signals of the smaller particles are lost because of the intensity of the larger par-ticles [20]. In DLS measurement, the data obtained for the measurement of the particle size can also vary depend-ing on the way of sample preparation The dispersion of NPs is conducted generally by a vortex mixing or a probe/bath sonicator. An optimum range of energy must be used to disperse the NPs so that they do not get ruptured. The energy should not be too low to disperse the NPs prop-erly [21]. However, the NPs tend to agglomerate over the time because of the enhanced interaction of NPs with high surface energy created during the process of sonica-tion. The ionic strength of NPs is the reason behind this agglomeration [22]. Particle size measurement also varies with pH, if the pH is higher than the isoelectric point of the particles, the electrostatic repulsive force will mask the van der Waals force, and particles will be well dispersed [22]. An opposite pattern is observed when the pH is very close to the isoelectric point. NP size and size distribu-tion influence the drug loading, the stability, and the drug release of an NP formulation [23]. These properties also determine the biological fate, in vivo drug distribution, toxicity, and drug targeting [24]. In cell uptake studies, because of nanosize and mobility in the systemic circu-lation, NPs have shown higher drug uptake as compared with the microsize particles. NPs can cross the blood-brain barrier (BBB) after the opening of endothelium tight junc-tions, this provides a targeted and sustained release of the therapeutic agents for treating diseases such as brain tumors, as reviewed by Tajes et al. [25]. Surfactant-coated NPs have also been proven to cross the BBB [26]. Flexible NPs such as liposomes, transfersomes, ethosomes, etc., have been found with a large value of PDI as compared with the solid NPs of lipid, gold, and silver. This might be possible because of the formation of micelles at the time of preparation [27]. Particle size has a direct correlation with its surface area, which again influences the drug release rate. Small particle size leads to increase the surface area of the formulation, and drug release rate will be high as most of the drug particle will be located at or near the surface of the formulation. In case of larger particles, as the drug is surrounded by the large core, they encapsu-late more drug and are good for sustained and extended release of the drug [28].
2.1.3 Charge on NPs (zeta potential)
The zeta potential of NPs in a dispersed medium give an idea about their electropotential status in that liquid environment [29]. It evaluates the electrophoretic mobil-ity of suspended particles in a colloid. This technique works by using a laser that is passed through the sample in the medium to measure the velocity of the particles in an applied electric field. The electric charge at the double layer boundary is known as the zeta potential of the par-ticles [30]. The movement of particles results from the Brownian motion and repulsion/attraction forces of the particles under the influences of applied electric field [21]. If the repulsive force is stronger than the attractive force, then formulation becomes more stable. The zeta-potential in range of greater than + 25 mV or less than − 25 mV gives more degree of stability to the nanoparticular formulation, as this range will allow particles to stay in dispersed form for longer periods, and van der Waals interparticle attrac-tion force will not be able to agglomerate the particles for a longer time [30]. In association with zeta potential, NP size may play an important role in its stability, provided the size range is not under the submicron range. Gravity, in case of larger particles (over micron range), becomes important when there is a significant variation in density between continuous and dispersed phases and the parti-cle aggregation or sedimentation occurs depending on the prevalence of gravitational force over Brownian force [31].
The zeta potential is reduced by the high degree of valency ions and ionic strength as they will squeeze the electric double layer. Many authors reported that the pH level and the concentration of the hydrogen ions in the medium greatly influence the charges in the medium. If the power of hydrogen ions is less (acidic medium), parti-cles will acquire more positive charge and vice versa [32]. In recent times, long circulating NPs were introduced to sustain and drug release in the body. The concept behind this is to coat the particles with bilayer of different charges; hence, it can circulate in the blood stream for longer time. Agrawal et al. [33] applied this concept in insulin liposomes, where different layers of negative and positive charge were used to coat the particles that resulted longer circulation time in the bloodstream. The zeta potential also depends on the concentration of NPs as reported by Kerker [34].
2.1.4 Single-particle inductively coupled plasma-mass spectrometry (ICP-MS)
Single-particle inductively coupled plasma-mass spectro-metry (ICP-MS) is an advanced technique used for
358 S. Mahmood et al.: Advanced characterizations of nanoparticles for drug delivery
elemental determination of inorganic NPs at very low con-centrations (parts per trillion) [35, 36]. NP sample is intro-duced into a spray chamber by a nebulizer and ionized by inductively heating a gas with an electromagnetic coil, which contains ions and electron to make the gas conduc-tive. The ion cloud is then passed to quadrupole and ana-lyzed by its selective mass to charge ratio (m/z) [37]. The size of the NP is obtained from the peak height of the MS chromatogram, whereas the frequency of the transient signals (number of peaks per minute) gives particle con-centration in the sample. However, the accuracy of the results depends on the correct selection of a dwell time. Every recorded pulse represents a single NP, so the integra-tion should be long enough to collect the entire signal from one NP. It only allows the detection of a single element at a time [38]. However, with strong resolution power, this technique can result in the detection of NPs up to 10 nm. Single-particle ICP-MS covers a wide range of applications such as sizing and size distribution of NPs with different biomaterial composition, studies on stability of NPs, disso-lution and migration of NPs from solid matrixes, and quan-titation and detection of NPs at environmentally relevant concentration. Recently, many authors have reported the use of ICP-MS for inorganic NP characterization [39–41]. Single-particle ICP-MS is further coupled with modern ana-lytical instrument for better detection and quantification of the elements such as hydrodynamic chromatography and field flow fraction for better selectively and quantifica-tion [39, 42]. Walczak et al. [43] reported the coupling of single-particle ICP-MS with DLS and SEM to study the fate of sliver NPs during intestinal digestion.
2.1.5 Tunable resistive pulse sensing technology
Tunable resistive pulse sensing (TRPS) is one of the most outstanding technologies for NPs characterization. It is used for accurate measurement of particle size in the range of 40 nm to 10 μm, size distribution, and concentra-tion of a given NP sample [44, 45]. The technique is quite rapid and convenient with a high degree of accuracy and repeatability. TRPS does not need any laser such as the DLS technique; rather, it is an impedance-based system that measures the opposition to the flow of an alternating current in a circuit due to the resistance of the particles crossing a pore filled with electrolyte. As a particle crosses the pore with a fixed voltage, it briefly increases electri-cal resistance, creating a resistive pulse, which is precisely proportional to the particle volume [45]. Instrumental operation can control the velocity at which the particle crosses the pore, and accordingly, the depth (magnitude)
of the resistive pulse obtained gives the particle volume, whereas the duration (pulse width) is a function of the particle length and its velocity. Thus, before analysis of any test sample, the instrument should be calibrated with particles of accurate size. The concentration of the test sample is obtained simultaneously as the rate of flow of the particles is proportional to the concentration. Another additional advantage of this TRPS technique is its ability to measure electrophoretic mobility or individual particle’s surface charge by analyzing the durations of the resistive pulses under varying driving forces and by comparing the same with the calibrated particles [46]. This electropho-rectic mobility can be further converted into zeta potential by the integrated software of the instrument.
Pal et al. [47] reported higher resolution and sensitiv-ity of TRPS than the DLS technique in the characterization of engineered nanomaterial dispersions in cell culture media containing serum. Many authors successfully used this advanced technique of late to characterize various types of NP formulations [48–50].
2.2 UV-visible spectroscopy for the characterization of quantum dots and plasmonic NPs
Quantum dots, very small semiconductor particle in nanorange, and metallic NPs with plasmon resonance (also called plasmonic NPs) have drawn huge interest in targeted drug delivery, cancer therapy, and diagnostic and biomedical fields [51, 52]. This has been possible because of their easy bioconjugation with various molecular probes and unique optical properties [53]. This unique optical property is also the basis of their characterization, espe-cially size, shape, concentration, agglomeration state, etc. Generally, UV-visible spectrophotometer in the range of 200 to 1100 nm wavelength with a slit width of 1 to 2 nm is used for their characterization. Metallic NPs made of gold, silver, etc. strongly interact with specific wavelengths of light and shows plasmon resonance nature, which is used to characterize them. This occurs when the frequency of incident photons and the natural frequency of surface electrons oscillating against the restoring force of posi-tive nuclei match each other. Extinction spectra, which is the sum of absorption and scattering by the metallic NP, are plotted against wavelength for an NP with spe-cific size range. The effect of scattering dominates when the sample is in aggregation state. This may result in the delocalization of the conduction electrons near each par-ticle surface, which may be shared among neighboring particles. Consequently, the surface plasmon resonance
S. Mahmood et al.: Advanced characterizations of nanoparticles for drug delivery 359
will have a tendency to shift to lower energies, resulting in the absorption and scattering peaks to red-shift to longer wavelengths. This phenomenon can be used to assess the stability of an NP formulation. The destabilization of the particles will cause the original extinction peak to decrease in intensity with the peak broadening or appear-ance of a secondary peak at longer wavelengths because of aggregates formation. Many researchers have reported the use of UV-visible spectroscopy for the characterization of metallic NPs made of gold and silver [54–57].
2.3 Microscopic characterization of NPs
Optical microscopy has been used in the past to measure the particle size of pharmaceutical formulations. However, is a not an appropriate technique to measure the size of NPs as the range is limited to micron size only. It can be used to estimate the size range, but individual particles are hard to measure. This is now an obsolete technique because they are replaced by more sophisticated micro-scopy and particle characterizing machines. Electron microscopy with high-resolution and magnifying capacity is one contemporary technique that is being used now by researchers to investigate the NP size [58]. The morpho-logical viewing of NPs, even proof of their uptake in bio-logical membrane by electron microscopy, provides a vast knowledge in material, physical, and biological sciences. The applications of some of these advanced microscopic techniques used for NP characterization are given below:
2.3.1 Scanning electron microscopy (SEM)
SEM is one of the major discoveries in the field of micro-scopic analysis used for solid microstructured composi-tion and bulk materials. With a resolution up to 100,000× and working voltage from 10 to 40 kV, it can detect par-ticles up to 10–20 nm size. It combines high-resolution imaging power with a deep depth of sample view and uses both electrostatic and electromagnetic lenses to give a desired image of the NP [59]. SEM uses a 2- to 3-nm spot of electron that scan the surface of the specimen to generate secondary electrons, which are then detected by a sensor to produce an image with an impression of the three-dimensional (3-D) structure of the particle. SEM consists of an electron gun, lens system, collector visual, record-ing cathode ray tube, and other electronics as its basic elements [60]. The electric gun of SEM uses thermionic emitters, which use electrical current to heat up a fila-ment made of tungsten or lanthanum hexaboride (LaB6). When the filament is heated up, electrons escape from the
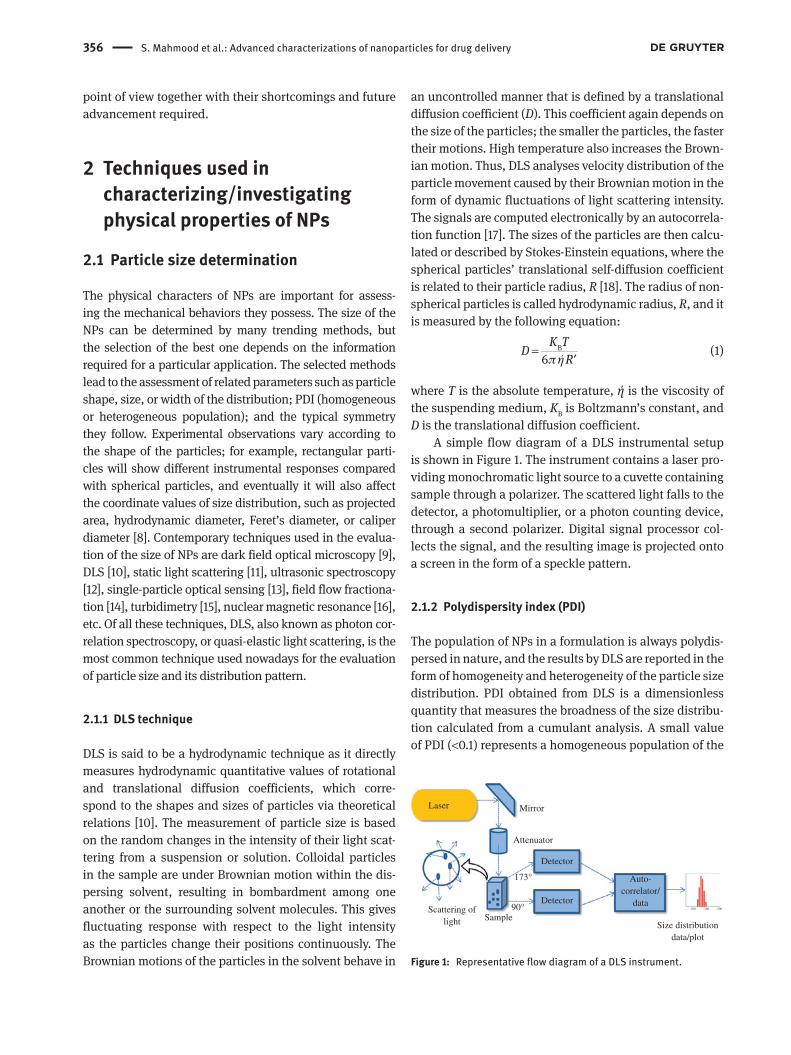
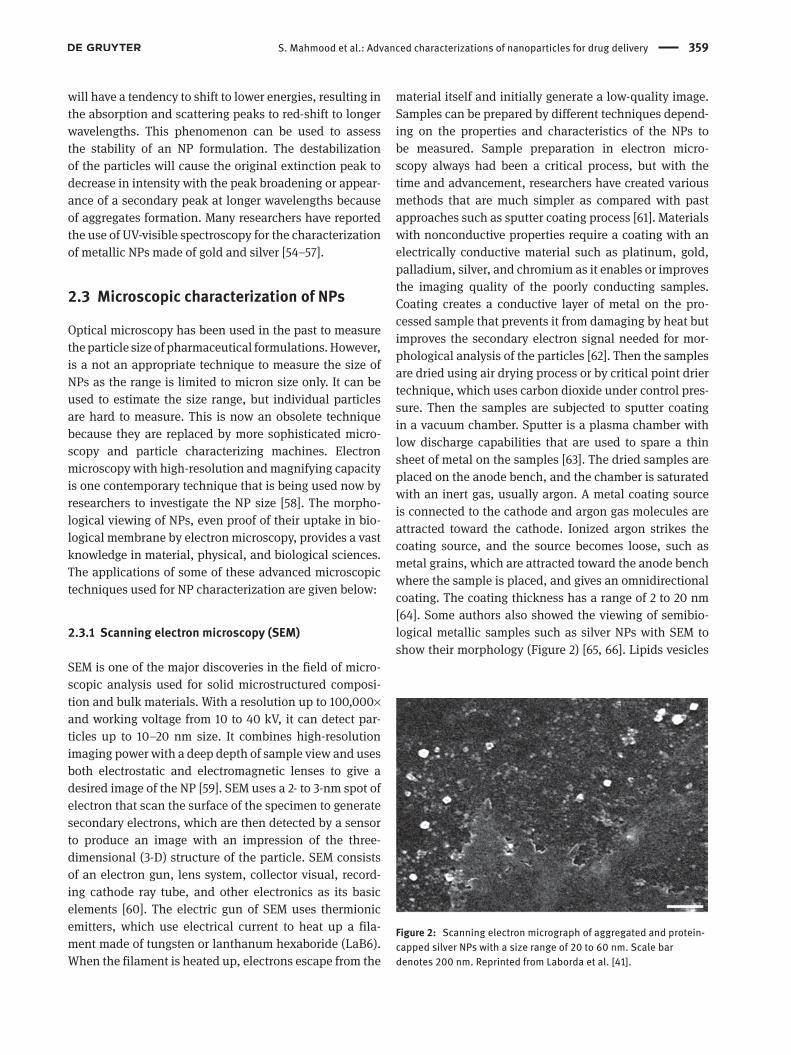
material itself and initially generate a low-quality image. Samples can be prepared by different techniques depend-ing on the properties and characteristics of the NPs to be measured. Sample preparation in electron micro-scopy always had been a critical process, but with the time and advancement, researchers have created various methods that are much simpler as compared with past approaches such as sputter coating process [61]. Materials with nonconductive properties require a coating with an electrically conductive material such as platinum, gold, palladium, silver, and chromium as it enables or improves the imaging quality of the poorly conducting samples. Coating creates a conductive layer of metal on the pro-cessed sample that prevents it from damaging by heat but improves the secondary electron signal needed for mor-phological analysis of the particles [62]. Then the samples are dried using air drying process or by critical point drier technique, which uses carbon dioxide under control pres-sure. Then the samples are subjected to sputter coating in a vacuum chamber. Sputter is a plasma chamber with low discharge capabilities that are used to spare a thin sheet of metal on the samples [63]. The dried samples are placed on the anode bench, and the chamber is saturated with an inert gas, usually argon. A metal coating source is connected to the cathode and argon gas molecules are attracted toward the cathode. Ionized argon strikes the coating source, and the source becomes loose, such as metal grains, which are attracted toward the anode bench where the sample is placed, and gives an omnidirectional coating. The coating thickness has a range of 2 to 20 nm [64]. Some authors also showed the viewing of semibio-logical metallic samples such as silver NPs with SEM to show their morphology (Figure 2) [65, 66]. Lipids vesicles
Figure 2: Scanning electron micrograph of aggregated and protein-capped silver NPs with a size range of 20 to 60 nm. Scale bar denotes 200 nm. Reprinted from Laborda et al. [41].
360 S. Mahmood et al.: Advanced characterizations of nanoparticles for drug delivery
have also achieved a great attention in the world of NPs, and many researchers have demonstrated the morpho-logical structure of nanolipid vesicles by using SEM [33, 67]. However, it is always a difficult task to visualize wet and damp samples (such as biological tissue and emul-sions) as it requires a long drying process. They also need long preparation time in fixation and removing the water or liquid from the samples. In addition, the destructive nature of the entire process does not suit to those kinds of samples [68].
2.3.2 Environmental scanning electron microscopy (ESEM)
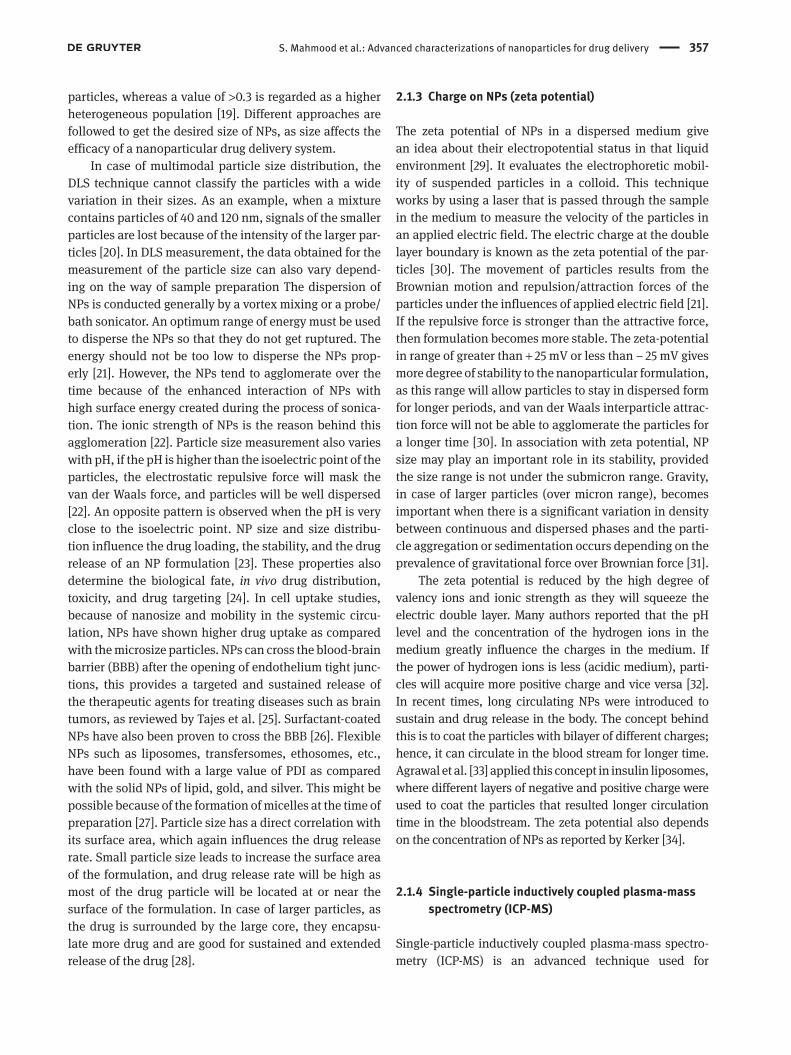
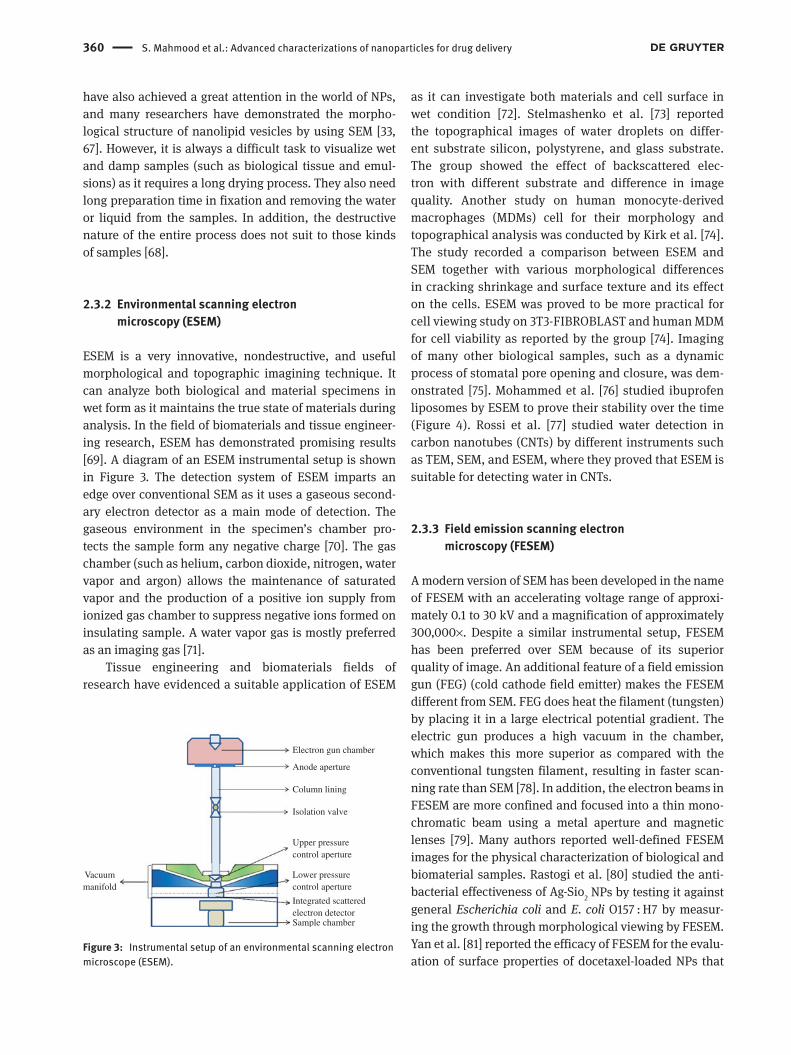
ESEM is a very innovative, nondestructive, and useful morphological and topographic imagining technique. It can analyze both biological and material specimens in wet form as it maintains the true state of materials during analysis. In the field of biomaterials and tissue engineer-ing research, ESEM has demonstrated promising results [69]. A diagram of an ESEM instrumental setup is shown in Figure 3. The detection system of ESEM imparts an edge over conventional SEM as it uses a gaseous second-ary electron detector as a main mode of detection. The gaseous environment in the specimen’s chamber pro-tects the sample form any negative charge [70]. The gas chamber (such as helium, carbon dioxide, nitrogen, water vapor and argon) allows the maintenance of saturated vapor and the production of a positive ion supply from ionized gas chamber to suppress negative ions formed on insulating sample. A water vapor gas is mostly preferred as an imaging gas [71].
Tissue engineering and biomaterials fields of research have evidenced a suitable application of ESEM
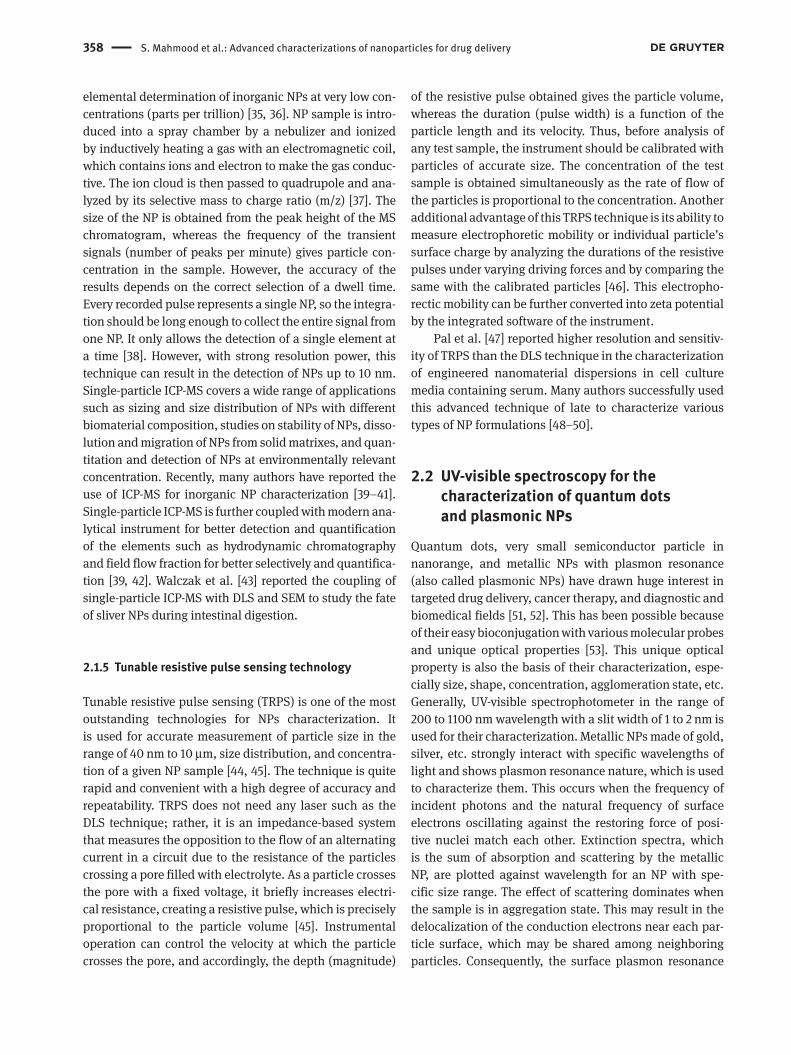
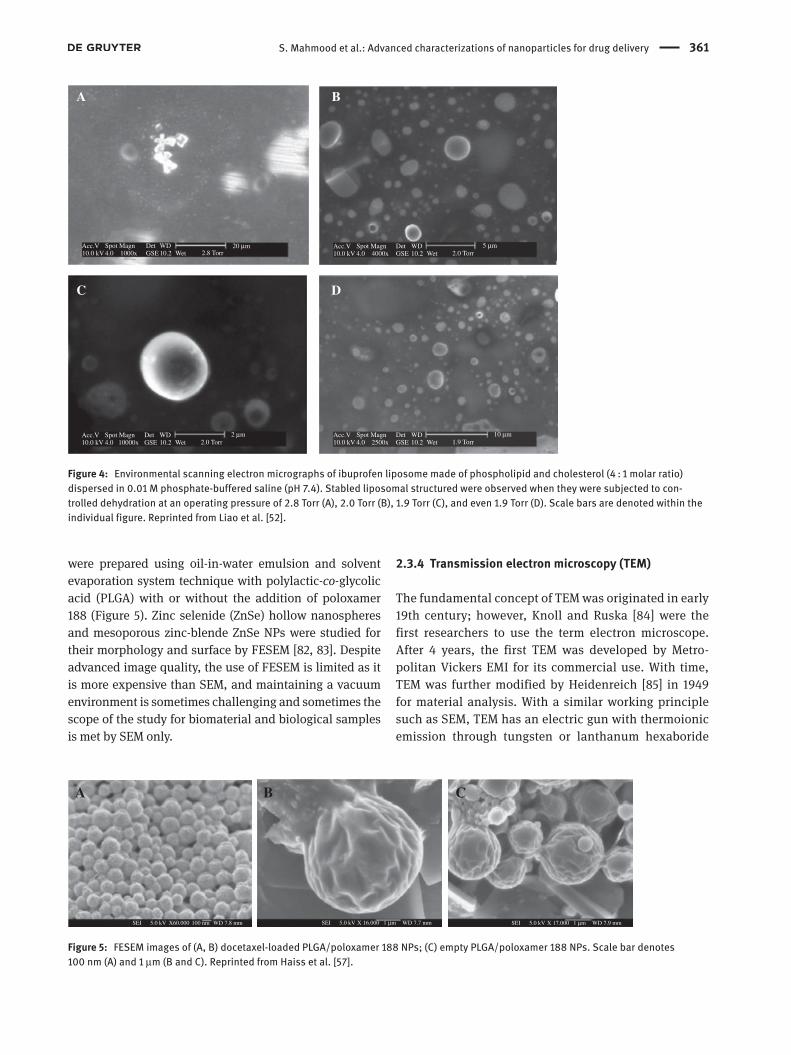
as it can investigate both materials and cell surface in wet condition [72]. Stelmashenko et al. [73] reported the topographical images of water droplets on differ-ent substrate silicon, polystyrene, and glass substrate. The group showed the effect of backscattered elec-tron with different substrate and difference in image quality. Another study on human monocyte-derived macrophages (MDMs) cell for their morphology and topographical analysis was conducted by Kirk et al. [74]. The study recorded a comparison between ESEM and SEM together with various morphological differences in cracking shrinkage and surface texture and its effect on the cells. ESEM was proved to be more practical for cell viewing study on 3T3-FIBROBLAST and human MDM for cell viability as reported by the group [74]. Imaging of many other biological samples, such as a dynamic process of stomatal pore opening and closure, was dem-onstrated [75]. Mohammed et al. [76] studied ibuprofen liposomes by ESEM to prove their stability over the time (Figure 4). Rossi et al. [77] studied water detection in carbon nanotubes (CNTs) by different instruments such as TEM, SEM, and ESEM, where they proved that ESEM is suitable for detecting water in CNTs.
2.3.3 Field emission scanning electron microscopy (FESEM)
A modern version of SEM has been developed in the name of FESEM with an accelerating voltage range of approxi-mately 0.1 to 30 kV and a magnification of approximately 300,000×. Despite a similar instrumental setup, FESEM has been preferred over SEM because of its superior quality of image. An additional feature of a field emission gun (FEG) (cold cathode field emitter) makes the FESEM different from SEM. FEG does heat the filament (tungsten) by placing it in a large electrical potential gradient. The electric gun produces a high vacuum in the chamber, which makes this more superior as compared with the conventional tungsten filament, resulting in faster scan-ning rate than SEM [78]. In addition, the electron beams in FESEM are more confined and focused into a thin mono-chromatic beam using a metal aperture and magnetic lenses [79]. Many authors reported well-defined FESEM images for the physical characterization of biological and biomaterial samples. Rastogi et al. [80] studied the anti-bacterial effectiveness of Ag-Sio2 NPs by testing it against general Escherichia coli and E. coli O157 : H7 by measur-ing the growth through morphological viewing by FESEM. Yan et al. [81] reported the efficacy of FESEM for the evalu-ation of surface properties of docetaxel-loaded NPs that
Electron gun chamber
Anode aperture
Column lining
Isolation valve
Upper pressurecontrol aperture
Lower pressurecontrol aperture
Integrated scatteredelectron detectorSample chamber
Vacuummanifold
Figure 3: Instrumental setup of an environmental scanning electron microscope (ESEM).
S. Mahmood et al.: Advanced characterizations of nanoparticles for drug delivery 361
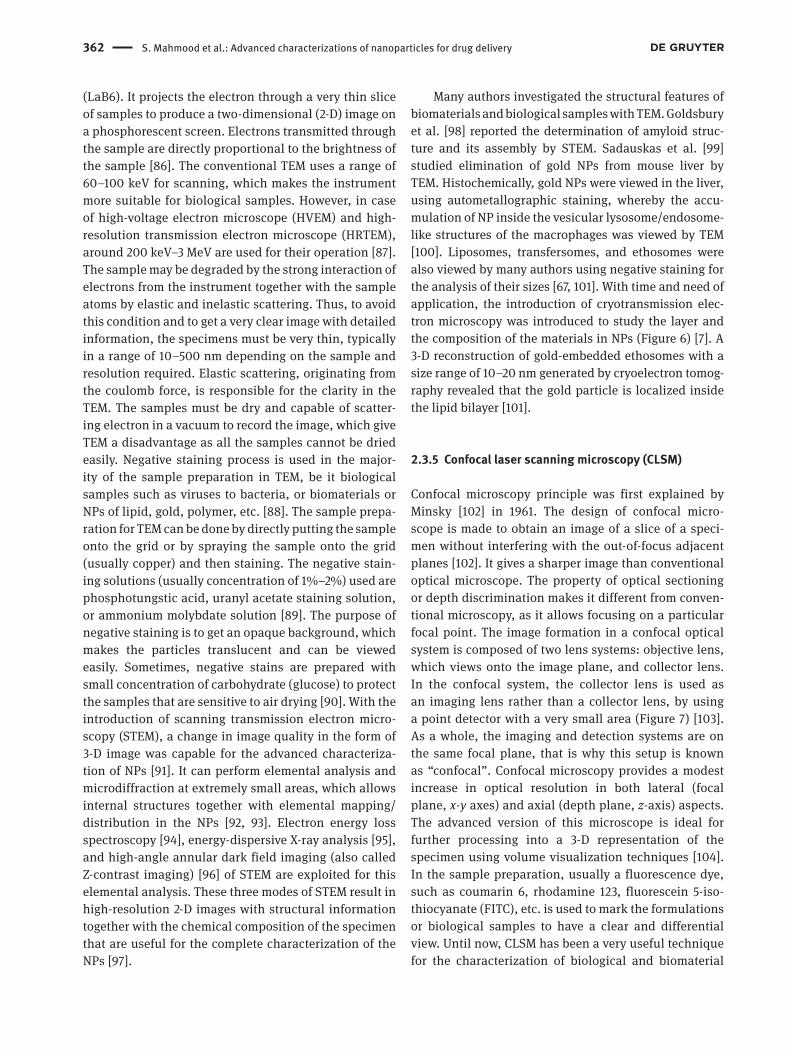
were prepared using oil-in-water emulsion and solvent evaporation system technique with polylactic-co-glycolic acid (PLGA) with or without the addition of poloxamer 188 (Figure 5). Zinc selenide (ZnSe) hollow nanospheres and mesoporous zinc-blende ZnSe NPs were studied for their morphology and surface by FESEM [82, 83]. Despite advanced image quality, the use of FESEM is limited as it is more expensive than SEM, and maintaining a vacuum environment is sometimes challenging and sometimes the scope of the study for biomaterial and biological samples is met by SEM only.
2.3.4 Transmission electron microscopy (TEM)
The fundamental concept of TEM was originated in early 19th century; however, Knoll and Ruska [84] were the first researchers to use the term electron microscope. After 4 years, the first TEM was developed by Metro-politan Vickers EMI for its commercial use. With time, TEM was further modified by Heidenreich [85] in 1949 for material analysis. With a similar working principle such as SEM, TEM has an electric gun with thermoionic emission through tungsten or lanthanum hexaboride
Acc.V10.0 kV 4.0 1000x
Spot Magn DetGSE 10.2 Wet 2.8 Torr
20 µmWD
Acc.V10.0 kV 4.0 10000x
Spot Magn DetGSE 10.2 Wet 2.0 Torr
2 µmWD
Acc.V10.0 kV 4.0 4000x
Spot Magn DetGSE 10.2 Wet 2.0 Torr
5 µmWD
Acc.V10.0 kV 4.0 2500x
Spot Magn DetGSE 10.2 Wet 1.9 Torr
10 µmWD
A B
C D
Figure 4: Environmental scanning electron micrographs of ibuprofen liposome made of phospholipid and cholesterol (4 : 1 molar ratio) dispersed in 0.01 M phosphate-buffered saline (pH 7.4). Stabled liposomal structured were observed when they were subjected to con-trolled dehydration at an operating pressure of 2.8 Torr (A), 2.0 Torr (B), 1.9 Torr (C), and even 1.9 Torr (D). Scale bars are denoted within the individual figure. Reprinted from Liao et al. [52].
SEI 5.0 kV X60.000 100 nm WD 7.8 mm SEI 5.0 kV X 16.000 1 µm WD 7.7 mm SEI 5.0 kV X 17.000 1 µm WD 7.9 mm
A B C
Figure 5: FESEM images of (A, B) docetaxel-loaded PLGA/poloxamer 188 NPs; (C) empty PLGA/poloxamer 188 NPs. Scale bar denotes 100 nm (A) and 1 μm (B and C). Reprinted from Haiss et al. [57].
362 S. Mahmood et al.: Advanced characterizations of nanoparticles for drug delivery
(LaB6). It projects the electron through a very thin slice of samples to produce a two-dimensional (2-D) image on a phosphorescent screen. Electrons transmitted through the sample are directly proportional to the brightness of the sample [86]. The conventional TEM uses a range of 60–100 keV for scanning, which makes the instrument more suitable for biological samples. However, in case of high-voltage electron microscope (HVEM) and high-resolution transmission electron microscope (HRTEM), around 200 keV–3 MeV are used for their operation [87]. The sample may be degraded by the strong interaction of electrons from the instrument together with the sample atoms by elastic and inelastic scattering. Thus, to avoid this condition and to get a very clear image with detailed information, the specimens must be very thin, typically in a range of 10–500 nm depending on the sample and resolution required. Elastic scattering, originating from the coulomb force, is responsible for the clarity in the TEM. The samples must be dry and capable of scatter-ing electron in a vacuum to record the image, which give TEM a disadvantage as all the samples cannot be dried easily. Negative staining process is used in the major-ity of the sample preparation in TEM, be it biological samples such as viruses to bacteria, or biomaterials or NPs of lipid, gold, polymer, etc. [88]. The sample prepa-ration for TEM can be done by directly putting the sample onto the grid or by spraying the sample onto the grid (usually copper) and then staining. The negative stain-ing solutions (usually concentration of 1%–2%) used are phosphotungstic acid, uranyl acetate staining solution, or ammonium molybdate solution [89]. The purpose of negative staining is to get an opaque background, which makes the particles translucent and can be viewed easily. Sometimes, negative stains are prepared with small concentration of carbohydrate (glucose) to protect the samples that are sensitive to air drying [90]. With the introduction of scanning transmission electron micro-scopy (STEM), a change in image quality in the form of 3-D image was capable for the advanced characteriza-tion of NPs [91]. It can perform elemental analysis and microdiffraction at extremely small areas, which allows internal structures together with elemental mapping/distribution in the NPs [92, 93]. Electron energy loss spectroscopy [94], energy-dispersive X-ray analysis [95], and high-angle annular dark field imaging (also called Z-contrast imaging) [96] of STEM are exploited for this elemental analysis. These three modes of STEM result in high-resolution 2-D images with structural information together with the chemical composition of the specimen that are useful for the complete characterization of the NPs [97].
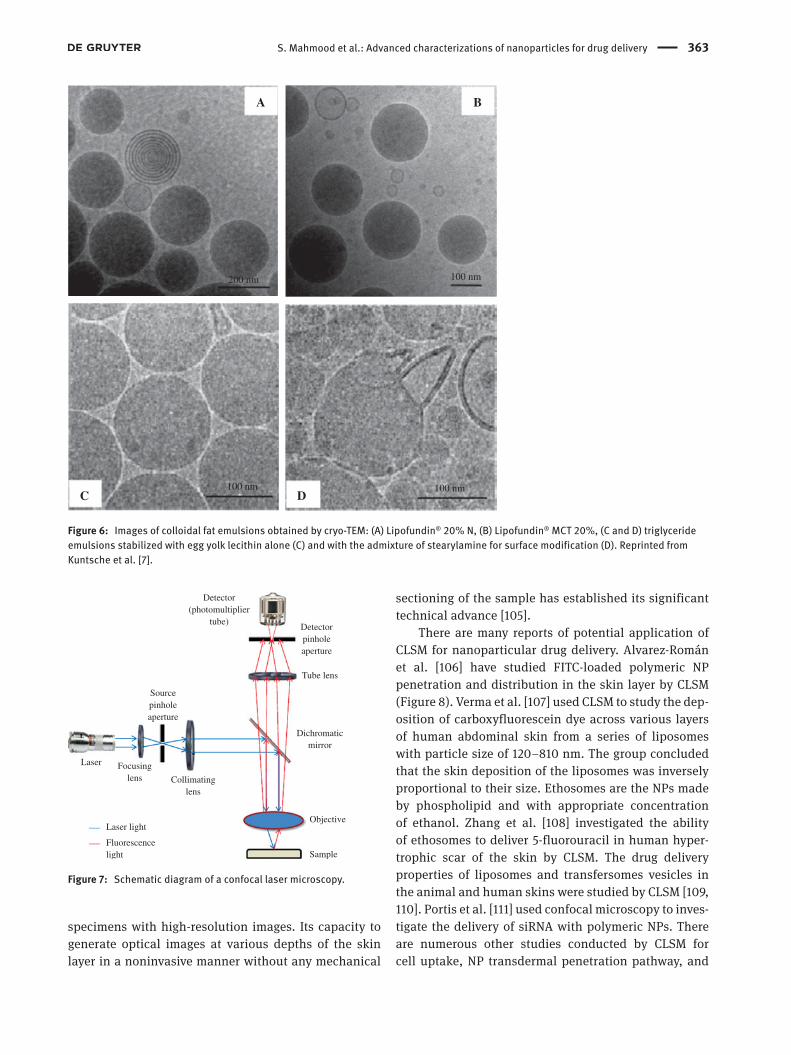
Many authors investigated the structural features of biomaterials and biological samples with TEM. Goldsbury et al. [98] reported the determination of amyloid struc-ture and its assembly by STEM. Sadauskas et al. [99] studied elimination of gold NPs from mouse liver by TEM. Histochemically, gold NPs were viewed in the liver, using autometallographic staining, whereby the accu-mulation of NP inside the vesicular lysosome/endosome-like structures of the macrophages was viewed by TEM [100]. Liposomes, transfersomes, and ethosomes were also viewed by many authors using negative staining for the analysis of their sizes [67, 101]. With time and need of application, the introduction of cryotransmission elec-tron microscopy was introduced to study the layer and the composition of the materials in NPs (Figure 6) [7]. A 3-D reconstruction of gold-embedded ethosomes with a size range of 10–20 nm generated by cryoelectron tomog-raphy revealed that the gold particle is localized inside the lipid bilayer [101].
2.3.5 Confocal laser scanning microscopy (CLSM)
Confocal microscopy principle was first explained by Minsky [102] in 1961. The design of confocal micro-scope is made to obtain an image of a slice of a speci-men without interfering with the out-of-focus adjacent planes [102]. It gives a sharper image than conventional optical microscope. The property of optical sectioning or depth discrimination makes it different from conven-tional microscopy, as it allows focusing on a particular focal point. The image formation in a confocal optical system is composed of two lens systems: objective lens, which views onto the image plane, and collector lens. In the confocal system, the collector lens is used as an imaging lens rather than a collector lens, by using a point detector with a very small area (Figure 7) [103]. As a whole, the imaging and detection systems are on the same focal plane, that is why this setup is known as “confocal”. Confocal microscopy provides a modest increase in optical resolution in both lateral (focal plane, x-y axes) and axial (depth plane, z-axis) aspects. The advanced version of this microscope is ideal for further processing into a 3-D representation of the specimen using volume visualization techniques [104]. In the sample preparation, usually a fluorescence dye, such as coumarin 6, rhodamine 123, fluorescein 5-iso-thiocyanate (FITC), etc. is used to mark the formulations or biological samples to have a clear and differential view. Until now, CLSM has been a very useful technique for the characterization of biological and biomaterial
S. Mahmood et al.: Advanced characterizations of nanoparticles for drug delivery 363
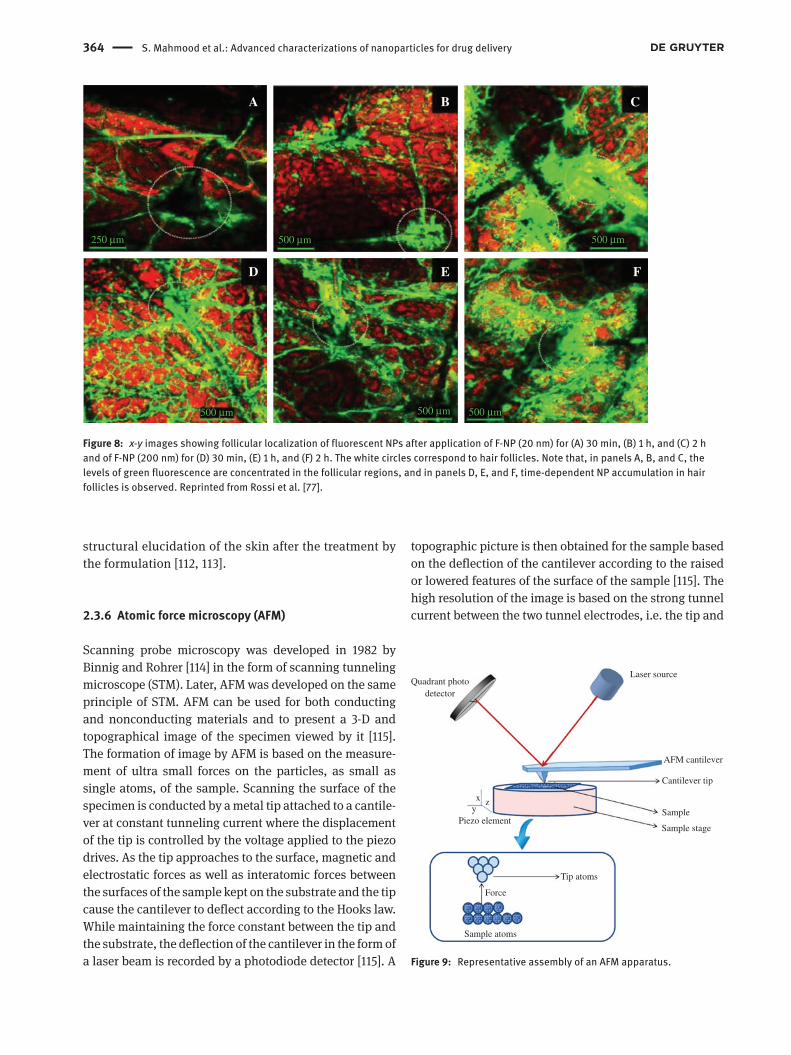
specimens with high-resolution images. Its capacity to generate optical images at various depths of the skin layer in a noninvasive manner without any mechanical
sectioning of the sample has established its significant technical advance [105].
There are many reports of potential application of CLSM for nanoparticular drug delivery. Alvarez-Román et al. [106] have studied FITC-loaded polymeric NP penetration and distribution in the skin layer by CLSM (Figure 8). Verma et al. [107] used CLSM to study the dep-osition of carboxyfluorescein dye across various layers of human abdominal skin from a series of liposomes with particle size of 120–810 nm. The group concluded that the skin deposition of the liposomes was inversely proportional to their size. Ethosomes are the NPs made by phospholipid and with appropriate concentration of ethanol. Zhang et al. [108] investigated the ability of ethosomes to deliver 5-fluorouracil in human hyper-trophic scar of the skin by CLSM. The drug delivery properties of liposomes and transfersomes vesicles in the animal and human skins were studied by CLSM [109, 110]. Portis et al. [111] used confocal microscopy to inves-tigate the delivery of siRNA with polymeric NPs. There are numerous other studies conducted by CLSM for cell uptake, NP transdermal penetration pathway, and
200 nm 100 nm
100 nm100 nm
A B
C D
Figure 6: Images of colloidal fat emulsions obtained by cryo-TEM: (A) Lipofundin® 20% N, (B) Lipofundin® MCT 20%, (C and D) triglyceride emulsions stabilized with egg yolk lecithin alone (C) and with the admixture of stearylamine for surface modification (D). Reprinted from Kuntsche et al. [7].
Laser light
Sourcepinholeaperture
Fluorescencelight
Laser Focusinglens Collimating
lens
Objective
Dichromaticmirror
Tube lens
Detectorpinholeaperture
Sample
Detector(photomultiplier
tube)
Figure 7: Schematic diagram of a confocal laser microscopy.
364 S. Mahmood et al.: Advanced characterizations of nanoparticles for drug delivery
structural elucidation of the skin after the treatment by the formulation [112, 113].
2.3.6 Atomic force microscopy (AFM)
Scanning probe microscopy was developed in 1982 by Binnig and Rohrer [114] in the form of scanning tunneling microscope (STM). Later, AFM was developed on the same principle of STM. AFM can be used for both conducting and nonconducting materials and to present a 3-D and topographical image of the specimen viewed by it [115]. The formation of image by AFM is based on the measure-ment of ultra small forces on the particles, as small as single atoms, of the sample. Scanning the surface of the specimen is conducted by a metal tip attached to a cantile-ver at constant tunneling current where the displacement of the tip is controlled by the voltage applied to the piezo drives. As the tip approaches to the surface, magnetic and electrostatic forces as well as interatomic forces between the surfaces of the sample kept on the substrate and the tip cause the cantilever to deflect according to the Hooks law. While maintaining the force constant between the tip and the substrate, the deflection of the cantilever in the form of a laser beam is recorded by a photodiode detector [115]. A
topographic picture is then obtained for the sample based on the deflection of the cantilever according to the raised or lowered features of the surface of the sample [115]. The high resolution of the image is based on the strong tunnel current between the two tunnel electrodes, i.e. the tip and
A B C
D E F
250 µm 500 µm
500 µm 500 µm500 µm
500 µm
Figure 8: x-y images showing follicular localization of fluorescent NPs after application of F-NP (20 nm) for (A) 30 min, (B) 1 h, and (C) 2 h and of F-NP (200 nm) for (D) 30 min, (E) 1 h, and (F) 2 h. The white circles correspond to hair follicles. Note that, in panels A, B, and C, the levels of green fluorescence are concentrated in the follicular regions, and in panels D, E, and F, time-dependent NP accumulation in hair follicles is observed. Reprinted from Rossi et al. [77].
Quadrant photodetector
Laser source
Piezo element
xy
z
Force
Sample atoms
Tip atoms
AFM cantilever
Cantilever tip
Sample
Sample stage
Figure 9: Representative assembly of an AFM apparatus.
S. Mahmood et al.: Advanced characterizations of nanoparticles for drug delivery 365
scanned surface. Figure 9 depicts a simple flow diagram of AFM apparatus.
With time, many other advanced techniques such as frictional force mapping, scanning voltage microscopy, surface force apparatus, photoconductive AFM, AFM-infrared spectroscopy, and AFM-Raman spectroscopy have come up [116, 117]. Extensive works such as physi-cal stability, particle size, and compatibility of nanocom-plexes with different compounds have been reported with this AFM study. Different kinds of substrates (e.g. mica, silicon wafer, gold, and platinum cover slides) and mode of operations depending on the nature of their particles have been reported in the literature [118, 119].
Theodoropoulos et al. [120] reported the use of the AFM to measure the shapes and sizes of different complexes of liposomes with carborane-free phosphatidylcholine (PC), carborane-free DMPC (1, 2-dimyristoyl-sn-glycero-3-phosphocholine), carborane-loaded PC, and carbo-rane-loaded DMPC. Müller and Dufrene [121] reviewed the versatile application of AFM in nanobiotechnology, including detection of bioanalytes in picomolar range and use in medical diagnosis and environmental monitoring. Sitterberg et al. [118] investigated different liposomes poly-plexes and other nanocomplexs with the AFM to evaluate their role in drug delivery, gene transfection, and stabil-ity. The visualization and the characterization of nucleic acids and its derivatives such as DNA, siRNA, ribozyme,
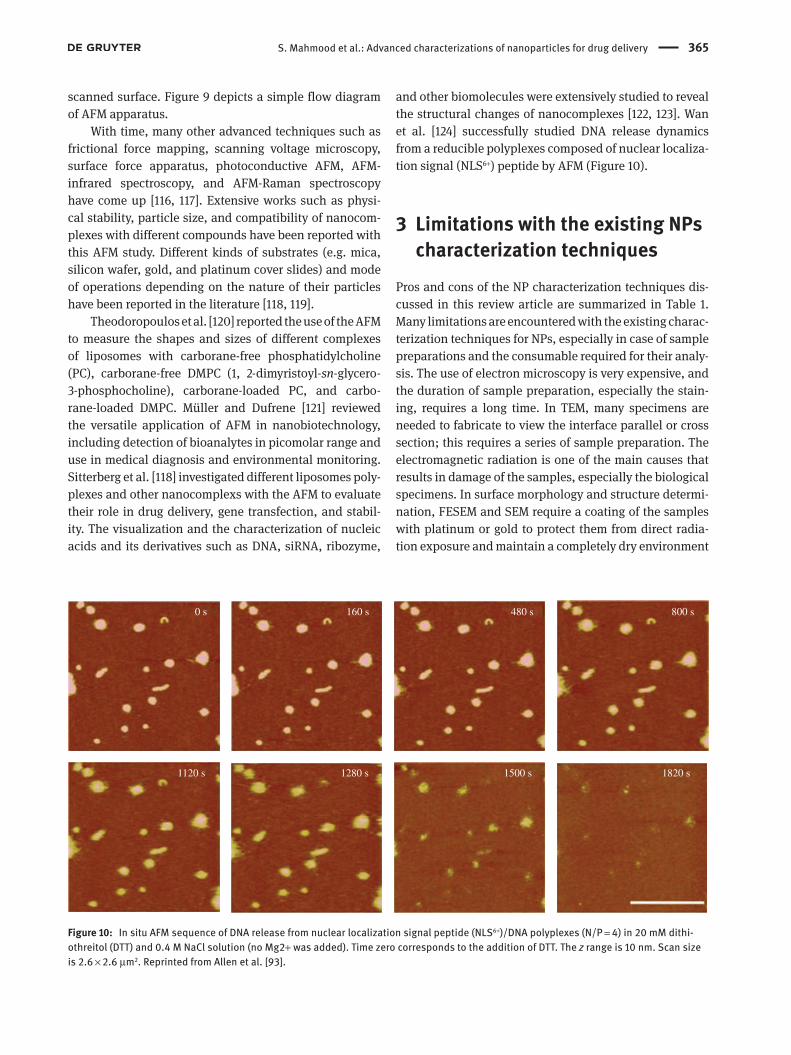
and other biomolecules were extensively studied to reveal the structural changes of nanocomplexes [122, 123]. Wan et al. [124] successfully studied DNA release dynamics from a reducible polyplexes composed of nuclear localiza-tion signal (NLS6+) peptide by AFM (Figure 10).
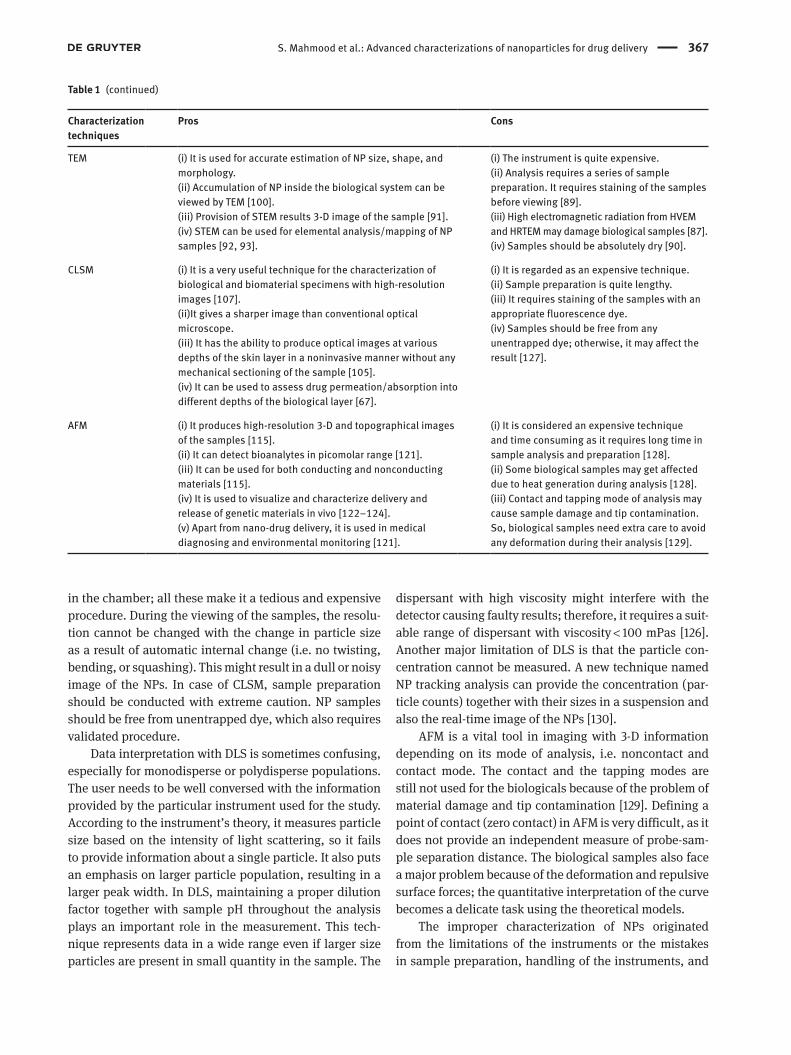
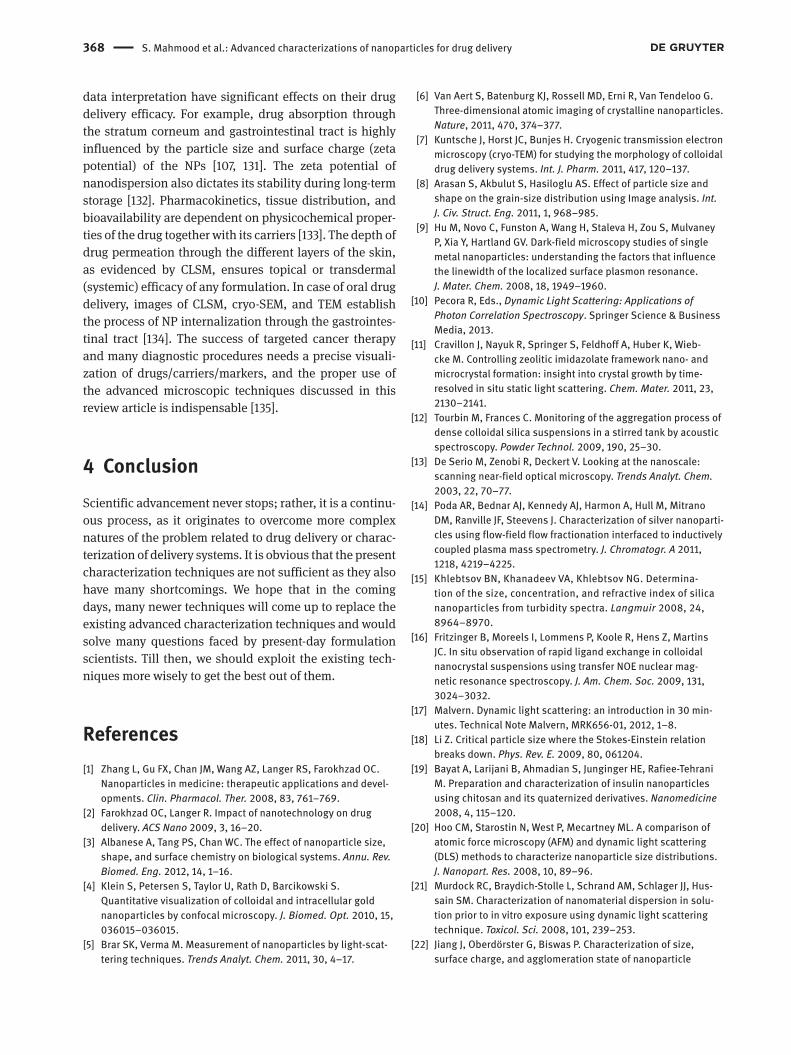
3 Limitations with the existing NPs characterization techniques
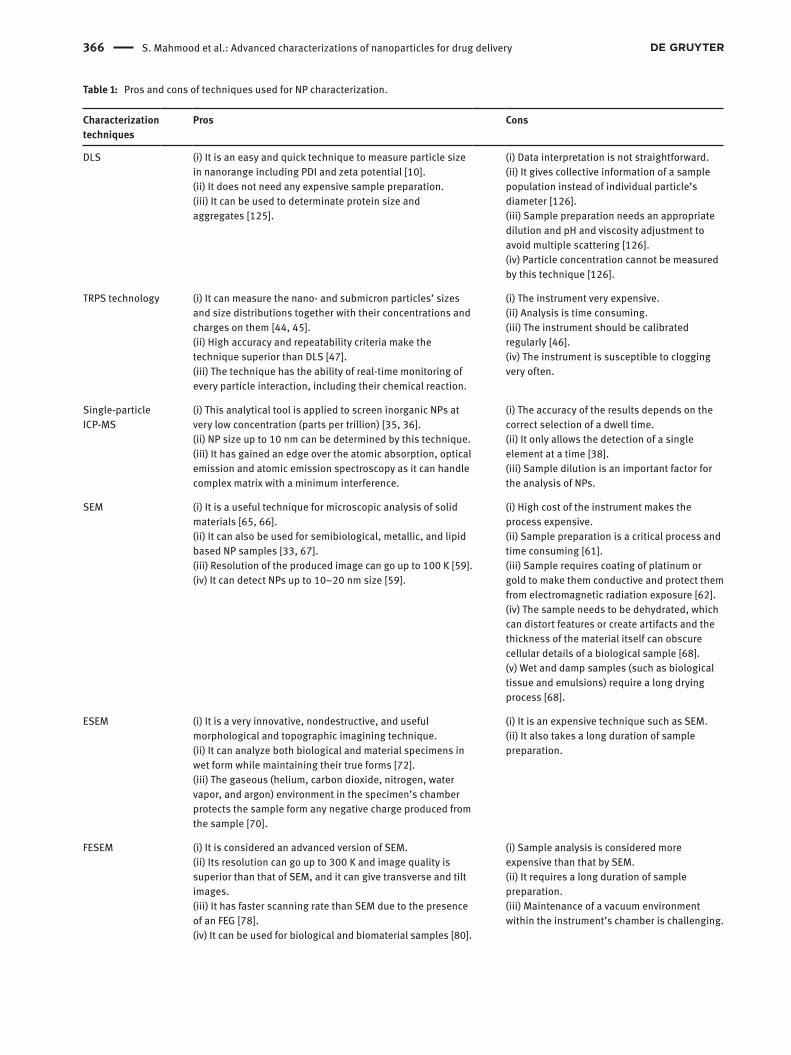
Pros and cons of the NP characterization techniques dis-cussed in this review article are summarized in Table 1. Many limitations are encountered with the existing charac-terization techniques for NPs, especially in case of sample preparations and the consumable required for their analy-sis. The use of electron microscopy is very expensive, and the duration of sample preparation, especially the stain-ing, requires a long time. In TEM, many specimens are needed to fabricate to view the interface parallel or cross section; this requires a series of sample preparation. The electromagnetic radiation is one of the main causes that results in damage of the samples, especially the biological specimens. In surface morphology and structure determi-nation, FESEM and SEM require a coating of the samples with platinum or gold to protect them from direct radia-tion exposure and maintain a completely dry environment
0 s 160 s 480 s 800 s
1120 s 1280 s 1500 s 1820 s
Figure 10: In situ AFM sequence of DNA release from nuclear localization signal peptide (NLS6+)/DNA polyplexes (N/P = 4) in 20 mM dithi-othreitol (DTT) and 0.4 M NaCl solution (no Mg2+ was added). Time zero corresponds to the addition of DTT. The z range is 10 nm. Scan size is 2.6 × 2.6 μm2. Reprinted from Allen et al. [93].
366 S. Mahmood et al.: Advanced characterizations of nanoparticles for drug delivery
Table 1: Pros and cons of techniques used for NP characterization.
Characterization techniques
Pros Cons
DLS (i) It is an easy and quick technique to measure particle size in nanorange including PDI and zeta potential [10].(ii) It does not need any expensive sample preparation.(iii) It can be used to determinate protein size and aggregates [125].
(i) Data interpretation is not straightforward.(ii) It gives collective information of a sample population instead of individual particle’s diameter [126].(iii) Sample preparation needs an appropriate dilution and pH and viscosity adjustment to avoid multiple scattering [126].(iv) Particle concentration cannot be measured by this technique [126].
TRPS technology (i) It can measure the nano- and submicron particles’ sizes and size distributions together with their concentrations and charges on them [44, 45].(ii) High accuracy and repeatability criteria make the technique superior than DLS [47].(iii) The technique has the ability of real-time monitoring of every particle interaction, including their chemical reaction.
(i) The instrument very expensive.(ii) Analysis is time consuming.(iii) The instrument should be calibrated regularly [46].(iv) The instrument is susceptible to clogging very often.
Single-particle ICP-MS
(i) This analytical tool is applied to screen inorganic NPs at very low concentration (parts per trillion) [35, 36].(ii) NP size up to 10 nm can be determined by this technique.(iii) It has gained an edge over the atomic absorption, optical emission and atomic emission spectroscopy as it can handle complex matrix with a minimum interference.
(i) The accuracy of the results depends on the correct selection of a dwell time.(ii) It only allows the detection of a single element at a time [38].(iii) Sample dilution is an important factor for the analysis of NPs.
SEM (i) It is a useful technique for microscopic analysis of solid materials [65, 66].(ii) It can also be used for semibiological, metallic, and lipid based NP samples [33, 67].(iii) Resolution of the produced image can go up to 100 K [59].(iv) It can detect NPs up to 10–20 nm size [59].
(i) High cost of the instrument makes the process expensive.(ii) Sample preparation is a critical process and time consuming [61].(iii) Sample requires coating of platinum or gold to make them conductive and protect them from electromagnetic radiation exposure [62].(iv) The sample needs to be dehydrated, which can distort features or create artifacts and the thickness of the material itself can obscure cellular details of a biological sample [68].(v) Wet and damp samples (such as biological tissue and emulsions) require a long drying process [68].
ESEM (i) It is a very innovative, nondestructive, and useful morphological and topographic imagining technique.(ii) It can analyze both biological and material specimens in wet form while maintaining their true forms [72].(iii) The gaseous (helium, carbon dioxide, nitrogen, water vapor, and argon) environment in the specimen’s chamber protects the sample form any negative charge produced from the sample [70].
(i) It is an expensive technique such as SEM.(ii) It also takes a long duration of sample preparation.
FESEM (i) It is considered an advanced version of SEM.(ii) Its resolution can go up to 300 K and image quality is superior than that of SEM, and it can give transverse and tilt images.(iii) It has faster scanning rate than SEM due to the presence of an FEG [78].(iv) It can be used for biological and biomaterial samples [80].
(i) Sample analysis is considered more expensive than that by SEM.(ii) It requires a long duration of sample preparation.(iii) Maintenance of a vacuum environment within the instrument’s chamber is challenging.
S. Mahmood et al.: Advanced characterizations of nanoparticles for drug delivery 367
in the chamber; all these make it a tedious and expensive procedure. During the viewing of the samples, the resolu-tion cannot be changed with the change in particle size as a result of automatic internal change (i.e. no twisting, bending, or squashing). This might result in a dull or noisy image of the NPs. In case of CLSM, sample preparation should be conducted with extreme caution. NP samples should be free from unentrapped dye, which also requires validated procedure.
Data interpretation with DLS is sometimes confusing, especially for monodisperse or polydisperse populations. The user needs to be well conversed with the information provided by the particular instrument used for the study. According to the instrument’s theory, it measures particle size based on the intensity of light scattering, so it fails to provide information about a single particle. It also puts an emphasis on larger particle population, resulting in a larger peak width. In DLS, maintaining a proper dilution factor together with sample pH throughout the analysis plays an important role in the measurement. This tech-nique represents data in a wide range even if larger size particles are present in small quantity in the sample. The
dispersant with high viscosity might interfere with the detector causing faulty results; therefore, it requires a suit-able range of dispersant with viscosity < 100 mPas [126]. Another major limitation of DLS is that the particle con-centration cannot be measured. A new technique named NP tracking analysis can provide the concentration (par-ticle counts) together with their sizes in a suspension and also the real-time image of the NPs [130].
AFM is a vital tool in imaging with 3-D information depending on its mode of analysis, i.e. noncontact and contact mode. The contact and the tapping modes are still not used for the biologicals because of the problem of material damage and tip contamination [129]. Defining a point of contact (zero contact) in AFM is very difficult, as it does not provide an independent measure of probe-sam-ple separation distance. The biological samples also face a major problem because of the deformation and repulsive surface forces; the quantitative interpretation of the curve becomes a delicate task using the theoretical models.
The improper characterization of NPs originated from the limitations of the instruments or the mistakes in sample preparation, handling of the instruments, and
Characterization techniques
Pros Cons
TEM (i) It is used for accurate estimation of NP size, shape, and morphology.(ii) Accumulation of NP inside the biological system can be viewed by TEM [100].(iii) Provision of STEM results 3-D image of the sample [91].(iv) STEM can be used for elemental analysis/mapping of NP samples [92, 93].
(i) The instrument is quite expensive.(ii) Analysis requires a series of sample preparation. It requires staining of the samples before viewing [89].(iii) High electromagnetic radiation from HVEM and HRTEM may damage biological samples [87].(iv) Samples should be absolutely dry [90].
CLSM (i) It is a very useful technique for the characterization of biological and biomaterial specimens with high-resolution images [107]. (ii)It gives a sharper image than conventional optical microscope.(iii) It has the ability to produce optical images at various depths of the skin layer in a noninvasive manner without any mechanical sectioning of the sample [105].(iv) It can be used to assess drug permeation/absorption into different depths of the biological layer [67].
(i) It is regarded as an expensive technique.(ii) Sample preparation is quite lengthy.(iii) It requires staining of the samples with an appropriate fluorescence dye.(iv) Samples should be free from any unentrapped dye; otherwise, it may affect the result [127].
AFM (i) It produces high-resolution 3-D and topographical images of the samples [115].(ii) It can detect bioanalytes in picomolar range [121].(iii) It can be used for both conducting and nonconducting materials [115].(iv) It is used to visualize and characterize delivery and release of genetic materials in vivo [122–124].(v) Apart from nano-drug delivery, it is used in medical diagnosing and environmental monitoring [121].
(i) It is considered an expensive technique and time consuming as it requires long time in sample analysis and preparation [128].(ii) Some biological samples may get affected due to heat generation during analysis [128].(iii) Contact and tapping mode of analysis may cause sample damage and tip contamination.So, biological samples need extra care to avoid any deformation during their analysis [129].
Table 1 (continued)
368 S. Mahmood et al.: Advanced characterizations of nanoparticles for drug delivery
data interpretation have significant effects on their drug delivery efficacy. For example, drug absorption through the stratum corneum and gastrointestinal tract is highly influenced by the particle size and surface charge (zeta potential) of the NPs [107, 131]. The zeta potential of nanodispersion also dictates its stability during long-term storage [132]. Pharmacokinetics, tissue distribution, and bioavailability are dependent on physicochemical proper-ties of the drug together with its carriers [133]. The depth of drug permeation through the different layers of the skin, as evidenced by CLSM, ensures topical or transdermal (systemic) efficacy of any formulation. In case of oral drug delivery, images of CLSM, cryo-SEM, and TEM establish the process of NP internalization through the gastrointes-tinal tract [134]. The success of targeted cancer therapy and many diagnostic procedures needs a precise visuali-zation of drugs/carriers/markers, and the proper use of the advanced microscopic techniques discussed in this review article is indispensable [135].
4 ConclusionScientific advancement never stops; rather, it is a continu-ous process, as it originates to overcome more complex natures of the problem related to drug delivery or charac-terization of delivery systems. It is obvious that the present characterization techniques are not sufficient as they also have many shortcomings. We hope that in the coming days, many newer techniques will come up to replace the existing advanced characterization techniques and would solve many questions faced by present-day formulation scientists. Till then, we should exploit the existing tech-niques more wisely to get the best out of them.
References[1] Zhang L, Gu FX, Chan JM, Wang AZ, Langer RS, Farokhzad OC.
Nanoparticles in medicine: therapeutic applications and devel-opments. Clin. Pharmacol. Ther. 2008, 83, 761–769.
[2] Farokhzad OC, Langer R. Impact of nanotechnology on drug delivery. ACS Nano 2009, 3, 16–20.
[3] Albanese A, Tang PS, Chan WC. The effect of nanoparticle size, shape, and surface chemistry on biological systems. Annu. Rev. Biomed. Eng. 2012, 14, 1–16.
[4] Klein S, Petersen S, Taylor U, Rath D, Barcikowski S. Quantitative visualization of colloidal and intracellular gold nanoparticles by confocal microscopy. J. Biomed. Opt. 2010, 15, 036015–036015.
[5] Brar SK, Verma M. Measurement of nanoparticles by light-scat-tering techniques. Trends Analyt. Chem. 2011, 30, 4–17.
[6] Van Aert S, Batenburg KJ, Rossell MD, Erni R, Van Tendeloo G. Three-dimensional atomic imaging of crystalline nanoparticles. Nature, 2011, 470, 374–377.
[7] Kuntsche J, Horst JC, Bunjes H. Cryogenic transmission electron microscopy (cryo-TEM) for studying the morphology of colloidal drug delivery systems. Int. J. Pharm. 2011, 417, 120–137.
[8] Arasan S, Akbulut S, Hasiloglu AS. Effect of particle size and shape on the grain-size distribution using Image analysis. Int. J. Civ. Struct. Eng. 2011, 1, 968–985.
[9] Hu M, Novo C, Funston A, Wang H, Staleva H, Zou S, Mulvaney P, Xia Y, Hartland GV. Dark-field microscopy studies of single metal nanoparticles: understanding the factors that influence the linewidth of the localized surface plasmon resonance. J. Mater. Chem. 2008, 18, 1949–1960.
[10] Pecora R, Eds., Dynamic Light Scattering: Applications of Photon Correlation Spectroscopy. Springer Science & Business Media, 2013.
[11] Cravillon J, Nayuk R, Springer S, Feldhoff A, Huber K, Wieb-cke M. Controlling zeolitic imidazolate framework nano- and microcrystal formation: insight into crystal growth by time-resolved in situ static light scattering. Chem. Mater. 2011, 23, 2130–2141.
[12] Tourbin M, Frances C. Monitoring of the aggregation process of dense colloidal silica suspensions in a stirred tank by acoustic spectroscopy. Powder Technol. 2009, 190, 25–30.
[13] De Serio M, Zenobi R, Deckert V. Looking at the nanoscale: scanning near-field optical microscopy. Trends Analyt. Chem. 2003, 22, 70–77.
[14] Poda AR, Bednar AJ, Kennedy AJ, Harmon A, Hull M, Mitrano DM, Ranville JF, Steevens J. Characterization of silver nanoparti-cles using flow-field flow fractionation interfaced to inductively coupled plasma mass spectrometry. J. Chromatogr. A 2011, 1218, 4219–4225.
[15] Khlebtsov BN, Khanadeev VA, Khlebtsov NG. Determina-tion of the size, concentration, and refractive index of silica nanoparticles from turbidity spectra. Langmuir 2008, 24, 8964–8970.
[16] Fritzinger B, Moreels I, Lommens P, Koole R, Hens Z, Martins JC. In situ observation of rapid ligand exchange in colloidal nanocrystal suspensions using transfer NOE nuclear mag-netic resonance spectroscopy. J. Am. Chem. Soc. 2009, 131, 3024–3032.
[17] Malvern. Dynamic light scattering: an introduction in 30 min-utes. Technical Note Malvern, MRK656-01, 2012, 1–8.
[18] Li Z. Critical particle size where the Stokes-Einstein relation breaks down. Phys. Rev. E. 2009, 80, 061204.
[19] Bayat A, Larijani B, Ahmadian S, Junginger HE, Rafiee-Tehrani M. Preparation and characterization of insulin nanoparticles using chitosan and its quaternized derivatives. Nanomedicine 2008, 4, 115–120.
[20] Hoo CM, Starostin N, West P, Mecartney ML. A comparison of atomic force microscopy (AFM) and dynamic light scattering (DLS) methods to characterize nanoparticle size distributions. J. Nanopart. Res. 2008, 10, 89–96.
[21] Murdock RC, Braydich-Stolle L, Schrand AM, Schlager JJ, Hus-sain SM. Characterization of nanomaterial dispersion in solu-tion prior to in vitro exposure using dynamic light scattering technique. Toxicol. Sci. 2008, 101, 239–253.
[22] Jiang J, Oberdörster G, Biswas P. Characterization of size, surface charge, and agglomeration state of nanoparticle
S. Mahmood et al.: Advanced characterizations of nanoparticles for drug delivery 369
dispersions for toxicological studies. J. Nanopar. Res. 2009, 11, 77–89.
[23] Palanikumar L, Ramasamy S, Hariharan G, Balachandran C. Influence of particle size of nano zinc oxide on the controlled delivery of Amoxicillin. Appl. Nanosci. 2013, 3, 441–451.
[24] He C, Hu Y, Yin L, Tang C, Yin C. Effects of particle size and sur-face charge on cellular uptake and biodistribution of polymeric nanoparticles. Biomaterials 2010, 31, 3657–3666.
[25] Tajes M, Ramos-Fernández E, Weng-Jiang X, Bosch-Morató M, Guivernau B, Eraso-Pichot A, Salvador B, Fernàndez-Busquets X, Roquer J, Muñoz FJ. The blood-brain barrier: structure, func-tion and therapeutic approaches to cross it. Mol. Membr. Biol. 2014, 31, 152–167.
[26] Voigt N, Henrich-Noack P, Kockentiedt S, Hintz W, Tomas J, Sabel BA. Surfactants, not size or zeta-potential influence blood-brain barrier passage of polymeric nanoparticles. Eur. J. Pharm. Biopharm. 2014, 87, 19–29.
[27] Asadujjaman MD, Mishuk AU. Novel approaches in lipid based drug delivery systems. J. Drug Deliv. Ther. 2013, 3, 124–130.
[28] Singhvi G, Singh M. Review: in-vitro drug release characteriza-tion models. Int. J. Pharm. Stud. Res. 2011, 2, 77–84.
[29] Lu XY, Wu DC, Li ZJ, Chen GQ. Polymer nanoparticles. Prog. Mol. Biol. Transl. Sci. 2011, 104, 299–323.
[30] Hunter RJ, Eds., Zeta Potential in Colloid Science: Principles and Applications (Vol. 2). Academic Press: London, 2013.
[31] Larsson M, Hill A, Duffy J. Suspension stability; why particle size, zeta potential and rheology are important. Annual Trans-actions of the Nordic Rheology Society 2012, 20, 209–214.
[32] Carneiro-da-Cunha MG, Cerqueira MA, Souza BW, Teixeira JA, Vicente AA. Influence of concentration, ionic strength and pH on zeta potential and mean hydrodynamic diameter of edible polysaccharide solutions envisaged for multinanolayered films production. Carbohydr. Polym. 2011, 85, 522–528.
[33] Agrawal AK, Harde H, Thanki K, Jain S. Improved stability and antidiabetic potential of insulin containing folic acid function-alized polymer stabilized multilayered liposomes following oral administration. Biomacromolecules 2013, 15, 350–360.
[34] Kerker M, Eds., The Scattering of Light and Other Electromag-netic Radiation: Physical Chemistry: A Series of Monographs (Vol. 16). Academic Press: New York, 2013.
[35] Pace HE, Rogers NJ, Jarolimek C, Coleman VA, Gray EP, Higgins CP, Ranville JF. Single particle inductively coupled plasma-mass spectrometry: a performance evaluation and method compari-son in the determination of nanoparticle size. Environ. Sci. Technol. 2012, 46, 12272–12280.
[36] Scheffer A, Engelhard C, Sperling M, Buscher W. ICP-MS as a new tool for the determination of gold nanoparticles in bioana-lytical applications. Anal. Bioanal. Chem. 2008, 390, 249–252.
[37] Franze B, Strenge I, Engelhard C. Single particle inductively coupled plasma mass spectrometry: evaluation of three differ-ent pneumatic and piezo-based sample introduction systems for the characterization of silver nanoparticles. J. Anal. At. Spectrom. 2012, 27, 1074–1083.
[38] Gschwind S, Flamigni L, Koch J, Borovinskaya O, Groh S, Nie-max K, Günther D. Capabilities of inductively coupled plasma mass spectrometry for the detection of nanoparticles carried by monodisperse microdroplets. J. Anal. At. Spectrom. 2011, 26, 1166–1174.
[39] Loeschner K, Navratilova J, Købler C, Mølhave K, Wagner S, von der Kammer F, Larsen EH. Detection and characterization of
silver nanoparticles in chicken meat by asymmetric flow field flow fractionation with detection by conventional or single particle ICP-MS. Anal. Bioanal. Chem. 2013, 405, 8185–8195.
[40] Mitrano DM, Barber A, Bednar A, Westerhoff P, Higgins CP, Ranville JF. Silver nanoparticle characterization using single particle ICP-MS (SP-ICP-MS) and asymmetrical flow field flow fractionation ICP-MS (AF4-ICP-MS). J. Anal. At. Spectrom. 2012, 27, 1131–1142.
[41] Laborda F, Jiménez-Lamana J, Bolea E, Castillo JR. Selective identification, characterization and determination of dissolved silver (I) and silver nanoparticles based on single particle detection by inductively coupled plasma mass spectrometry. J. Anal. At. Spectrom. 2011, 26, 1362–1371.
[42] von der Kammer F, Ferguson PL, Holden PA, Masion A, Rogers KR, Klaine SJ, Koelmans A, Horne N, Unrine JM. Analysis of engineered nanomaterials in complex matrices 509 (environ-ment and biota): general considerations and conceptual case studies. Environ. Toxicol. Chem. 2012, 31, 32–49.
[43] Walczak AP, Fokkink R, Peters R, Tromp P, Herrera Rivera ZE, Rietjens IMCM, Hendriksen PJM, Bouwmeester H. Behaviour of silver nanoparticles and silver ions in an in vitro human gastro-intestinal digestion model. Nanotoxicology 2013, 7, 1198−1210.
[44] Vogel R, Willmott G, Kozak D, Roberts GS, Anderson W, Groe-newegen L, Glossop B, Barnett A, Turner A, Trau M. Anal. Chem. 2011, 83, 3499–3506.
[45] Roberts GS, Kozak D, Anderson W, Broom MF, Vogel R, Trau M. Tunable nano/micropores for particle detection and discrimi-nation: scanning ion occlusion spectroscopy. Small 2010, 6, 2653–2658.
[46] Kozak D, Anderson W, Vogel R, Chen S, Antaw F, Trau M. Simultaneous size and ζ-potential measurements of individual nanoparticles in dispersion using size-tunable pore sensors. ACS Nano 2012, 6, 6990–6997.
[47] Pal AK, Aalaei I, Gadde S, Gaines P, Schmidt D, Demokritou P, Bello D. High resolution characterization of engineered nano-material dispersions in complex media using tunable resistive pulse sensing technology. ACS Nano 2014, 8, 9003–9015.
[48] Lane RE, Korbie D, Anderson W, Vaidyanathan R, Trau M. Analysis of exosome purification methods using a model liposome system and tunable-resistive pulse sensing. Sci. Rep. 2015, 5. DOI:10.1038/srep07639.
[49] Eldridge JA, Willmott GR, Anderson W, Vogel R. Nanoparticle ζ-potential measurements using tunable resistive pulse sens-ing with variable pressure. J. Colloid Interface Sci. 2014, 429, 45–52.
[50] Sikora A, Shard AG, Minelli C. Size and ζ-potential measure-ment of silica nanoparticles in serum using tunable resistive pulse sensing. Langmuir 2016, 32, 2216–2224.
[51] Gao J, Gu H, Xu B. Multifunctional magnetic nanoparticles: design, synthesis, and biomedical applications. Acc. Chem. Res. 2009, 42, 1097–1107.
[52] Liao H, Nehl CL, Hafner JH. (2006). Biomedical applications of plasmon resonant metal nanoparticles. Nanomedicine (Lond). 2006, 1, 201–208.
[53] Khlebtsov NG, Dykman LA. Optical properties and biomedical applications of plasmonic nanoparticles. J. Quant. Spectrosc. Radiat. Transfer 2010, 111, 1–35.
[54] Khlebtsov NG. Determination of size and concentration of gold nanoparticles from extinction spectra. Anal. Chem. 2008, 80, 6620–6625.
370 S. Mahmood et al.: Advanced characterizations of nanoparticles for drug delivery
[55] Philip D. Synthesis and spectroscopic characterization of gold nanoparticles. Spectrochim. Acta Mol. Biomol. Spectrosc. 2008, 71, 80–85.
[56] Rosemary MJ, Pradeep T. Solvothermal synthesis of silver nano-particles from thiolates. J. Colloid Interface Sci. 2003, 268, 81–84.
[57] Haiss W, Thanh NT, Aveyard J, Fernig DG. Determination of size and concentration of gold nanoparticles from UV-vis spectra. Anal. Chem. 2007, 79, 4215–4221.
[58] Evans JE, Jungjohann KL, Browning ND, Arslan I. Controlled growth of nanoparticles from solution with in situ liquid trans-mission electron microscopy. Nano Lett. 2011, 11, 2809–2813.
[59] Goldstein J, Joy DC, Romig Jr AD, Eds., Principles of Analytical Electron Microscopy. Springer Science & Business Media, 2013.
[60] Echlin P, Fiori CE, Goldstein J, Joy DC, Newbury E, Eds., Advanced Scanning Electron Microscopy and X-ray Microanaly-sis. Springer Science & Business Media, 2013.
[61] Echlin P, Eds., Handbook of Sample Preparation for Scanning Electron Microscopy and X-ray Microanalysis. Springer Science & Business Media, 2011.
[62] Brief Introduction to Coating Technology for Electron Micros-copy. http://www.leica-microsystems.com/science-lab/brief-introduction-to-coating-technology-for-electron-microscopy/, 2016 (accessed 21.06.16).
[63] SEM preparation and equipment. http://www.microscopy.ou.edu/sem-prep.shtml., 2016 (accessed 21.06.16).
[64] Scanning Electron Microscopy. http://cmrf.research.uiowa.edu/scanning-electron-microscopy, 2016 (accessed 21.06.16).
[65] Gajbhiye M, Kesharwani J, Ingle A, Gade A, Rai M. Fungus-mediated synthesis of silver nanoparticles and their activity against pathogenic fungi in combination with fluconazole. Nanomed. Nanotech. Biol. Med. 2009, 5, 382–386.
[66] Schrand AM, Braydich-Stolle LK, Schlager JJ, Dai L, Hussain SM. Can silver nanoparticles be useful as potential biological labels? Nanotechnology 2008, 19, 235104.
[67] Mahmood S, Taher M, Mandal UK. Experimental design and opti-mization of raloxifene hydrochloride loaded nanotransfersomes for transdermal application. Int. J. Nanomedicine 2014, 9, 4331.
[68] McKinlay KJ, Allison FJ, Scotchford CA, Grant DM, Oliver JM, King JR, Wood JV, Brown PD. Comparison of environmental scanning electron microscopy with high vacuum scanning elec-tron microscopy as applied to the assessment of cell morphol-ogy. J. Biomed. Mater. Res. A 2004, 69, 359–366.
[69] Manero J, Gil F, Padros E, Planell J. Applications of environmen-tal scanning electron microscopy (ESEM) in biomaterials field. Microsc. Res. Tech. 2003, 61, 469–480.
[70] Wang Y, Petrova V. Scanning electron microscope. In Nano-technology Research Methods for Foods and Bioproducts. Padua, GW, Wang Q, Ed. Wiley-Blackwell: Ames, IA, 2012, pp. 103–126.
[71] Jenkins LM, Donald AM. Use of the environmental scanning electron microscope for the observation of the swelling behav-iour of cellulosic fibres. Scanning 1997, 19, 92–97.
[72] Baguneid M, Murray D, Salacinski HJ, Fuller B, Hamilton G, Walker M, Seifalian AM. Shear‐stress preconditioning and tissue‐engineering‐based paradigms for generating arterial substitutes. Biotech. Appl. Biochem. 2004, 39, 151–157.
[73] Stelmashenko N, Craven J, Donald A, Terentjev E, Thiel B. Topographic contrast of partially wetting water droplets in environmental scanning electron microscopy. J. Microsc. 2001, 204, 172–183.
[74] Kirk S, Skepper J, Donald A. Application of environmental scanning electron microscopy to determine biological surface structure. J. Microsc. 2009, 233, 205–224.
[75] McGregor J, Donald A. ESEM imaging of dynamic biological processes: the closure of stomatal pores. J. Microsc. 2010, 239, 135–141.
[76] Mohammed A, Weston N, Coombes A, Fitzgerald M, Perrie Y. Liposome formulation of poorly water soluble drugs: optimi-sation of drug loading and ESEM analysis of stability. Int. J. Pharm. 2004, 285, 23–34.
[77] Rossi MP, Ye H, Gogotsi Y, Babu S, Ndungu P, Bradley JC. Environmental scanning electron microscopy study of water in carbon nanopipes. Nano Lett. 2004, 4, 989–993.
[78] Kim YJ, Park CR. Principle of field emission-scanning electron microscopy (FE-SEM) and its application to the analysis of carbon nanostructures. Carbon Lett. 2001, 2, 202–211.
[79] Alyamani A, Lemine O, Eds., FE-SEM Characterization of Some Nanomaterial: INTECH. Open Access Publisher, 2012.
[80] Rastogi SK, Rutledge VJ, Gibson C, Newcombe DA, Branen JR, Branen AL. Ag colloids and Ag clusters over EDAPTMS-coated silica nanoparticles: synthesis, characterization, and antibac-terial activity against Escherichia coli. Nanomed. Nanotech. Biol. Med. 2011, 7, 305–314.
[81] Yan F, Zhang C, Zheng Y, Mei L, Tang L, Song C, Sun H, Huang L. The effect of poloxamer 188 on nanoparticle morphology, size, cancer cell uptake, and cytotoxicity. Nanomed. Nanotech. Biol. Med. 2010, 6, 170–178.
[82] Jiang C, Zhang W, Zou G, Yu W, Qian Y. Synthesis and character-ization of ZnSe hollow nanospheres via a hydrothermal route. Nanotechnology 2005, 16, 551.
[83] Yang J, Peng J, Zou R, Peng F, Wang H, Yu H, Lee J. Mesoporous zinc-blende ZnS nanoparticles: synthesis, characterization and superior photocatalytic properties. Nanotechnology 2008, 19, 255603.
[84] Knoll M, Ruska E. The electron microscope. Z. Phys. 1932, 78, 318–339.
[85] Heidenreich RD, Eds., Fundamentals of Transmission Electron Microscopy. Wiley- Interscience: New York, 1964.
[86] Reimer L, Eds., Transmission Electron Microscopy: Physics of Image Formation and Microanalysis (Vol. 36). Springer: Berlin, Heidelberg, 2013.
[87] Spence JC, Eds., High-Resolution Electron Microscopy. OUP Oxford University Press: Oxford, 2013.
[88] Pol E, Coumans FAW, Grootemaat AE, Gardiner C, Sargent IL, Harrison P, Sturk A, van Leeuwen TG, Nieuwland R. Particle size distribution of exosomes and microvesicles determined by transmission electron microscopy, flow cytometry, nanoparti-cle tracking analysis, and resistive pulse sensing. J. Thromb. Haemost. 2014, 12, 1182–1192.
[89] Burghardt RC, Droleskey R. Transmission electron microscopy. Curr. Protoc. Microbiol. 2006, 2B. 1.1–2B. 1.39.
[90] Hayat M, Eds., Basic Techniques for Transmission Electron Microscopy. Elsevier: San Diego, California; London, 2012.
[91] De Jonge N, Sougrat R, Northan BM, Pennycook SJ. Three-dimensional scanning transmission electron micros-copy of biological specimens. Microsc. Microanal. 2010, 16, 54–63.
[92] LeBeau JM, Findlay SD, Allen LJ, Stemmer S. Quantitative atomic resolution scanning transmission electron microscopy. Phys. Rev. Lett. 2008, 100, 206101.
S. Mahmood et al.: Advanced characterizations of nanoparticles for drug delivery 371
[93] Allen LJ, D’Alfonso AJ, Findlay SD, LeBeau JM, Lugg NR, Stemmer S. Elemental mapping in scanning transmission electron microscopy. J. Phys. Conf. Ser. 2010, 241, 012061.
[94] Kimoto K, Asaka T, Nagai T, Saito M, Matsui, Y., & Ishizuka, K. Element-selective imaging of atomic columns in a crystal using STEM and EELS. Nature 2007, 450(7170), 702–704.
[95] Lu P, Zhou L, Kramer MJ, Smith DJ. Atomic-scale chemical imaging and quantification of metallic alloy structures by energy-dispersive X-ray spectroscopy. Sci. Rep. 2014, 4, 3945.
[96] Van Aert S, Verbeeck J, Erni R, Bals S, Luysberg M, Van Dyck D, Van Tendeloo G. Quantitative atomic resolution mapping using high-angle annular dark field scanning transmission electron microscopy. Ultramicroscopy 2009, 109, 1236–1244.
[97] Wirth, R. Focused Ion Beam (FIB) combined with SEM and TEM: advanced analytical tools for studies of chemical compo-sition, microstructure and crystal structure in geomaterials on a nanometre scale. Chem. Geol. 2009, 261, 217–229.
[98] Goldsbury C, Baxa U, Simon MN, Steven AC, Engel A, Wall JS, Aebi U, Müller SA. Amyloid structure and assembly: insights from scanning transmission electron microscopy. J. Struct. Biol. 2011, 173, 1–13.
[99] Sadauskas E, Danscher G, Stoltenberg M, Vogel U, Larsen A, Wallin H. Protracted elimination of gold nanoparticles from mouse liver. Nanomed. Nanotech. Biol. Med. 2009, 5, 162–169.
[100] Chithrani DB, Dunne M, Stewart J, Allen C, Jaffray DA. Cellular uptake and transport of gold nanoparticles incorporated in a liposomal carrier. Nanomed. Nanotech. Biol. Med. 2010, 6, 161–169.
[101] Zhong S, Pochan DJ. Cryogenic transmission electron micros-copy for direct observation of polymer and small-molecule materials and structures in solution. Polym. Rev. 2010, 50, 287–320.
[102] Minsky M. U.S. Patent No. 3,013,467. Washington, DC: U.S. Patent and Trademark Office. 1961.
[103] Murphy DB, Davidson MW. Confocal laser scanning micros-copy. In Fundamentals of light Microscopy and Electronic Imaging, 2nd ed., Murphy DB, Ed. John Wiley and Sons: New York, 2012, pp. 265–305.
[104] Longo C, Casari A, Beretti F, Cesinaro AM, Pellacani G. Skin aging: in vivo microscopic assessment of epidermal and der-mal changes by means of confocal microscopy. J. Am. Acad. Dermatol. 2013, 68, e73–e82.
[105] Sattler EC, Maier T, Hoffmann VS, Hegyi J, Ruzicka T, Berk-ing C. Noninvasive in vivo detection and quantification of Demodex mites by confocal laser scanning microscopy. Br. J. Dermatol. 2012, 167, 1042–1047.
[106] Alvarez-Román R, Naik A, Kalia Y, Guy RH, Fessi H. Skin pene-tration and distribution of polymeric nanoparticles. J. Control. Rel. 2004, 99, 53–62.
[107] Verma D, Verma S, Blume G, Fahr A. Particle size of liposomes influences dermal delivery of substances into skin. Int. J. Pharm. 2003, 258, 141–151.
[108] Zhang Z, Wo Y, Zhang Y, Wang D, He R, Chen H, Cui D. In vitro study of ethosome penetration in human skin and hyper-trophic scar tissue. Nanomed. Nanotech. Biol. Med. 2012, 8, 1026–1033.
[109] Rattanapak T, Young K, Rades T, Hook S. Comparative study of liposomes, transfersomes, ethosomes and cubosomes for
transcutaneous immunisation: characterisation and in vitro skin penetration. J. Pharm. Pharmacol. 2012, 64, 1560–1569.
[110] Subongkot T, Wonglertnirant N, Songprakhon P, Rojanarata T, Opanasopit P, Ngawhirunpat T. Visualization of ultradeforma-ble liposomes penetration pathways and their skin interaction by confocal laser scanning microscopy. Int. J. Pharm. 2013, 441, 151–161.
[111] Portis AM, Carballo G, Baker GL, Chan C, Walton SP. Confocal microscopy for the analysis of siRNA delivery by polymeric nanoparticles. Microsc. Res. Tech. 2010, 73, 878–885.
[112] Venuganti VV, Sahdev P, Hildreth M, Guan X, Perumal O. Structure-skin permeability relationship of dendrimers. Pharm. Res. 2011, 28, 2246–2260.
[113] Wang T, Bai J, Jiang X, Nienhaus GU. Cellular uptake of nanoparticles by membrane penetration: a study combining confocal microscopy with FTIR spectroelectrochemistry. ACS Nano 2012, 6, 1251–1259.
[114] Binnig G, Rohrer H, Gerber C, Weibel E. Surface studies by scanning tunneling microscopy. Phys. Rev. Lett. 1982, 49, 57.
[115] Allison DP, Mortensen NP, Sullivan CJ, Doktycz MJ. Atomic force microscopy of biological samples. Wiley Interdiscip. Rev. Nanomed. Nanobiotechnol. 2010, 2, 618–634.
[116] Mansour HM, Hickey AJ. Raman characterization and chemi-cal imaging of biocolloidal self-assemblies, drug delivery systems, and pulmonary inhalation aerosols: a review. AAPS PharmSciTech 2007, 8, 140–155.
[117] Boerio FJ, Starr MJ. AFM/FTIR: a new technique for materials characterization. J. Adhes. 2008, 84, 872–895.
[118] Sitterberg J, Özcetin A., Ehrhardt C, Bakowsky U. Utilising atomic force microscopy for the characterisation of nanoscale drug delivery systems. Eur. J. Pharm. Biopharm. 2010, 74, 2–13.
[119] Muraji Y, Fujita T, Itoh H, Fujita D. Preparation procedure of liposome-absorbed substrate and tip shape correction of diameters of liposome measured by AFM. Microsc. Res. 2013, 1, 24–28.
[120] Theodoropoulos D, Rova A, Smith JR, Barbu E, Calabrese G, Vizirianakis IS, Tsibouklis J, Fatouros DG. Towards boron neu-tron capture therapy: the formulation and preliminary in vitro evaluation of liposomal vehicles for the therapeutic delivery of the dequalinium salt of bis-nido-carborane. Bioorg. Med. Chem. Lett. 2013, 23, 6161–6166.
[121] Müller DJ, Dufrene YF. Atomic force microscopy as a multi-functional molecular toolbox in nanobiotechnology. Nat. Nanotechnol. 2008, 3, 261–269.
[122] Guo P. The emerging field of RNA nanotechnology. Nat. Nano-technol. 2010, 5, 833–842.
[123] Jayakumar R, Chennazhi KP, Muzzarelli RAA, Tamura H, Nair SV, Selvamurugan N. Chitosan conjugated DNA nanoparticles in gene therapy. Carbohydr. Polym. 2010, 79(1), 1–8.
[124] Wan L, Manickam D S, Oupicky D, Mao G Z. DNA release dynamics from reducible polyplexes by atomic force micros-copy. Langmuir 2008, 24, 12474–12482.
[125] Hawe A, Hulse WL, Jiskoot W, Forbes RT. Taylor dispersion analysis compared to dynamic light scattering for the size analysis of therapeutic peptides and proteins and their aggre-gates. Pharm. Res., 2011, 28, 2302–2310.
[126] Dynamic Light Scattering—Understanding the Basics. http://www.azonano.com/article.aspx?ArticleID=3662, 2016 (accessed 30.08.16).
372 S. Mahmood et al.: Advanced characterizations of nanoparticles for drug delivery
[127] Alvarez-Román R, Naik A, Kalia YN, Fessi H, Guy RH. Visualization of skin penetration using confocal laser scan-ning microscopy. Eur. J. Pharm. Biopharm. 2004, 58, 301–316.
[128] El Kirat K, Burton I, Dupres V, Dufrene YF. Sample preparation procedures for biological atomic force microscopy. J. Microsc. 2005, 218, 199–207.
[129] Moreno-Herrero F, Colchero J, Gomez-Herrero J, Baro AM. Atomic force microscopy contact, tapping, and jumping modes for imaging biological samples in liquids. Phys. Rev. E. 2004, 69, 031915.
[130] Zhou C, Krueger AB, Barnard JG, Qi W, Carpenter JF. Charac-terization of nanoparticle tracking analysis for quantification and sizing of submicron particles of therapeutic proteins. J. Pharm. Sci. 2015, 104, 2441–2450.
[131] Patil S, Sandberg A, Heckert E, Self W, Seal S. Protein adsorp-tion and cellular uptake of cerium oxide nanoparticles as a function of zeta potential. Biomaterials 2007, 28, 4600–4607.
[132] Zhang Y, Chen Y, Westerhoff P, Hristovski K, Crittenden JC. Stability of commercial metal oxide nanoparticles in water. Water Res. 2008, 42, 2204–2212.
[133] Manjunath K, Venkateswarlu V. Pharmacokinetics, tissue distribution and bioavailability of clozapine solid lipid nano-particles after intravenous and intraduodenal administration. J. Control. Release. 2005, 107, 215–228.
[134] Win KY, Feng SS. Effects of particle size and surface coating on cellular uptake of polymeric nanoparticles for oral delivery of anticancer drugs. Biomaterials 2005, 26, 2713–2722.
[135] Zhang Z, Jia J, Lai Y, Ma Y, Weng J, Sun L. Conjugating folic acid to gold nanoparticles through glutathione for targeting and detecting cancer cells. Bioorg. Med. Chem. 2010, 18, 5528–5534.
BionotesSyed Mahmood Department of Pharmaceutical Technology, Kulliyyah of Pharmacy, International Islamic University Malaysia (IIUM), Jalan Sultan Ahmad Shah, Bandar Indera Mahkota, 25200, Kuantan, Pahang Darul Makmur, Malaysia
Syed Mahmood received his BPharm degree at Jamia Hamdrad Uni-versity, India, in 2011, and his master’s degree in pharmaceutics at the Uttar Pradesh Technical University, India, in 2013. He completed his dissertation at the International Islamic University Malaysia (IIUM), Malaysia, in a student exchange program. Currently, he is enrolled in a PhD program at the Department of Pharmaceutical Technology, International Islamic University Malaysia (IIUM), Malay-sia, under the supervision of Dr. Uttam Kumar Mandal. His area of research focuses on transdermal drug delivery and nanotechnology in material sciences.
Uttam Kumar MandalDepartment of Pharmaceutical Technology, Kulliyyah of Pharmacy, International Islamic University Malaysia (IIUM), Jalan Sultan Ahmad Shah, Bandar Indera Mahkota, 25200, Kuantan, Pahang Darul Makmur, Malaysia, http://orcid.org/[email protected]
Uttam Kumar Mandal is an assistant professor at the Department of Pharmaceutical Technology, Kulliyyah of Pharmacy, International Islamic University Malaysia (IIUM), Malaysia. He received his PhD degree in pharmacy at Jadavpur University, India, in 2008. After PhD, he worked with Y. N. Kalia on transdermal drug delivery for 2 years as a postdoctoral fellow at the School of Pharmaceutical Sciences, University of Geneva, Switzerland. His research interest is mainly focused on bioavailability and bioequivalence study, bio-analytical method development, novel oral drug delivery systems, and transdermal nanoformulations. He has published more than 50 articles in several journals related to his research area.
Bappaditya ChatterjeeDepartment of Pharmaceutical Technology, Kulliyyah of Pharmacy, International Islamic University Malaysia (IIUM), Jalan Sultan Ahmad Shah, Bandar Indera Mahkota, 25200, Kuantan, Pahang Darul Makmur, Malaysia
Bappaditya Chatterjee, currently an assistant professor at the Department of Pharmaceutical Technology, International Islamic University Malaysia, received his PhD degree in pharmacy at Jadavpur University, India, on drug delivery system. After complet-ing his PhD, he started his carrier at the Department of Analytical Method Development, Fresenius Kabi Oncology Ltd, India. His area of research interest is drug delivery system. He is currently working on the development of solid dosage form for poorly water-soluble drugs.
Muhammad Taher Department of Pharmaceutical Technology, Kulliyyah of Pharmacy, International Islamic University Malaysia (IIUM), Jalan Sultan Ahmad Shah, Bandar Indera Mahkota, 25200, Kuantan, Pahang Darul Makmur, Malaysia