three-dimensional numerical simulation of blood flow in
TRANSCRIPT
HAL Id: hal-01785300https://hal.archives-ouvertes.fr/hal-01785300
Submitted on 4 May 2018
HAL is a multi-disciplinary open accessarchive for the deposit and dissemination of sci-entific research documents, whether they are pub-lished or not. The documents may come fromteaching and research institutions in France orabroad, or from public or private research centers.
L’archive ouverte pluridisciplinaire HAL, estdestinée au dépôt et à la diffusion de documentsscientifiques de niveau recherche, publiés ou non,émanant des établissements d’enseignement et derecherche français ou étrangers, des laboratoirespublics ou privés.
Three-dimensional numerical simulation of blood flow inmouse aortic arch around atherosclerotic plaques
Pauline Assemat, James A. Armitage, Karen K. Siu, Karla G. Contreras,Anthony M. Dart, Jaye P. Chin-Dusting, Kerry Hourigan
To cite this version:Pauline Assemat, James A. Armitage, Karen K. Siu, Karla G. Contreras, Anthony M. Dart, etal.. Three-dimensional numerical simulation of blood flow in mouse aortic arch around atheroscle-rotic plaques. Applied Mathematical Modelling, Elsevier, 2014, vol. 38 (n° 17-18), pp. 4175-4185.�10.1016/j.apm.2014.01.004�. �hal-01785300�
Open Archive TOULOUSE Archive Ouverte (OATAO)
This is an author-deposited version published in : http://oatao.univ-toulouse.fr/Eprints ID : 19856
To link to this article : DOI:10.1016/j.apm.2014.01.004 URL : http://dx.doi.org/10.1016/j.apm.2014.01.004
To cite this version : Assemat, Pauline and Armitage, James A. andSiu, Karen K. and Contreras, Karla G. and Dart, Anthony M. andChin-Dusting, Jaye P. and Hourigan, Kerry Three-dimensionalnumerical simulation of blood flow in mouse aortic arch aroundatherosclerotic plaques. (2014) Applied Mathematical Modelling, vol.38 (n° 17-18). pp. 4175-4185. ISSN 0307-904X
Any correspondence concerning this service should be sent to the repository
administrator: [email protected]
OATAO is an open access repository that collects the work of Toulouse researchers andmakes it freely available over the web where possible.
Three-dimensional numerical simulation of blood flowin mouse aortic arch around atherosclerotic plaques q
Pauline Assemat a,⇑, James A. Armitage b,c,d, Karen K. Siu e,f, Karla G. Contreras a,Anthony M. Dart d, Jaye P. Chin-Dusting d, Kerry Hourigan a
a Department of Mechanical and Aerospace Engineering & Division of Biological Engineering, Monash University, Victoria 3800, Australiab School of Medicine (Optometry), Deakin University, Waurn Ponds, Victoria 3228, Australiac Department of Anatomy and Developmental Biology, Monash University, Victoria 3800, Australiad Baker IDI Heart and Diabetes Institute, 75 Commercial Rd, Melbourne, Victoria 3004, Australiae Monash Biomedical Imaging, Monash University, Victoria 3800, Australiaf Australian Synchrotron, 800 Blackburn Rd, Clayton, Victoria 3168, Australia
Keywords:Atherosclerotic plaquesPlaque progressionOscillating flowMechanical effectsWall shear stressPressure gradient
a b s t r a c t
Atherosclerosis is a progressive disease, involving the build-up of lipid streaks in arterywalls, leading to plaques. Understanding the development of atherosclerosis and plaquevulnerability is critically important since plaque rupture can result in heart attack orstroke. Plaques can be divided into two distinct types: those likely to rupture (vulnerable)or less likely to rupture (stable). In the last decade, researchers have been interested instudying the influence of the mechanical effects (blood shear stress, pressure forces andstructural stress) on the plaque formation, progression and rupture processes but no gen-eral agreement has been found. The purpose of the present work is to include more realisticconditions for the numerical calculations of the blood flow by implementing real geome-tries with plaques in the numerical model. Hemodynamical parameters are studied in bothdiseased and healthy configurations. The healthy configuration is obtained by removingnumerically the plaques from three dimensional geometries obtained by micro-computedtomography. A new hemodynamical parameter is also introduced to relate the location ofplaques to the characteristics of the flow in the healthy configuration.
1. Introduction
Atherosclerosis is an inflammatory disease characterized by lipid and macrophages accumulation underneath the endo-thelium at the boundary of blood vessel walls. In addition to lipid deposition, atherosclerotic progression involves a complexprocess of monocyte infiltration, lipid oxidation, foam cell formation, smooth muscle cell migration and extracellular matrixproduction [1–3]. The lipid core is separated from the circulating blood by a fibrous cap composed of smooth muscle cellsand extracellular matrix [2]. As plaques develop, they can cause luminal narrowing (reduction of the volume of the fluid
Nomenclature
AbbreviationsBCA brachiocephalic arteryLCC left common carotid arteryLDL low density lipoproteinsLS left subclavian arteryl-CT micro-computed tomographyOSI oscillatory shear indexRRT relative residence timeTAGP time average gradient of pressureTAWSS time average wall shear stressWSSG wall shear stress gradientWSS wall shear stress
Greek symbolsl dynamic viscosityq densitysw instantaneous wall shear stress
part), or may undergo expansive remodeling to maintain lumen diameter [4,5]. Vulnerable plaques are prone to rupture,with disruption of the fibrous cap exposing the thrombogenic plaque core to the circulating blood [6]. Interactions betweenplatelets and the lipid core can induce thrombus formation on the plaque surface, with possible consequences including ves-sel occlusion, myocardial infarction or stroke. While it is accepted that plaque vulnerability is influenced by fibrous capthickness and the size of the lipid core [7], it also depends on biochemical factors, luminal remodeling and hemodynamicparameters for which no general agreement has been found [8,9].
Atherosclerotic plaques are found at particular sites in the arterial tree [10], with plaques commonly found on the innercurvatures of arteries and near bifurcations. This regional localization of atherosclerosis depends largely on hemodynamic fac-tors such as wall shear stress (WSS) [2]. The distribution of the hemodynamic field depends on the geometrical patterns of thearteries, with low time averaged wall shear stress (TAWSS) commonly observed on inner curvatures of arteries and oscillatoryTAWSS of low amplitude in regions of bifurcations [11]. This low WSS hypothesis for plaque formation and progression hasbeen proposed by numerous groups [4,12–14] and has been related to the alteration of cholesterol transport [15]. In the re-gions of disturbed flow, the shape and direction of endothelial cells change and consequently does the permeability of theendothelial layer to external molecules [16,17]. In Liu et al. [18], the authors suggest that the concentration polarization ofthe low density lipoproteins (LDLs) and some specific aortic arch geometrical features are involved in the localization of theatherogenesis. Other hemodynamic factors are also thought to play a role in plaque development including the oscillatoryshear index (OSI) [19–21], which quantifies the cyclic departure of the WSS vector from its predominant axial alignment,the wall shear stress gradient (WSSG) corresponding to spatial WSS variation [22,23], and the relative residence time (RRT)corresponding to a relative time spent by a particle at a specific site near the wall [24]. It is noticeable that the optimal hemo-dynamical parameter to relate subject specific physiological characteristics and plaque formation has not been agreed upon[25]. This uncertainty may be due to the fact that most of the studies that investigate the processes of early stage plaque for-mation consider healthy arteries and draw their conclusions assuming that plaques will grow in the most likely sites refer-enced in the literature. Thus, while it is largely agreed that atherosclerotic development occurs in regions of disturbed flow,the exact contributions of various hemodynamic parameters such as TAWSS, OSI, WSSG and RRT are still under debate.
In a similar way, the plaque growth process is poorly understood and the link with the mechanical effects not wellidentified. A limited number of recent studies [13,26–30] consider the details of processes of the growth of plaques after theirinitiation and, in particular, the influence of their presence on the blood flow. While researchers have attempted to correlatethe plaque growth to hemodynamical factors, general conclusions cannot be drawn yet from these studies. Wong et al. [31]have suggested the potential implication of the structural stresses in plaque progression for a model carotid geometry,whereas Olgac et al. [28] propose the study of the LDL transport to understand the plaque expansion in the coronary arteries.In Olgac et al. [28], the authors numerically remove the plaques in order to compare the dynamics of the LDL transport andblood flow in effectively the same artery for healthy and disease state. In the present paper, a similar approach is used. A dis-cussion is conducted on the validity and limitations of this approach. In addition, the present paper aims to develop a meth-odology to better understand the two questions of plaque formation and progression by investigating the hemodynamics ofblood flow through the mouse aortic arch with and without plaques. Two mouse models are being studied: wild type C57/B6 mice (no plaque) and ApoE deficient mice (stable plaques). After the tissues have been fixed, the samples (mice aortic arch)
are imaged by micro-computed tomography (l-CT) using synchrotron X-ray beams; the resulting images are reconstructed toget the 3D geometries used for the numerical simulations. A high definition is clearly observed for each tissue (healthy wall,lipid core and fibrous cap) which can be reconstructed separately using segmentation tools. After the description of theexperimental and numerical approach, validation and results will be presented.
2. Model description
2.1. Animal preparation
Animal models provide a key insight to understand atherosclerosis formation. In this study, the Apolipoprotein E knock-out (ApoE -/-) mouse model, fed 12 weeks with a high fat diet (21% fat; 0.15% cholesterol), is used as a model for spontaneousatherosclerotic development [32]. While numerous physiological differences exist between mice and humans, ApoE -/- micedevelop lesions in similar locations as human, suggesting that the arterial wall is affected in a similar manner by hemody-namical stresses [32]. Wild C57/B6 mice do not develop atherosclerosis and are used as controls in this investigation. Themethodology presented in this paper use results obtained for two specific ApoE -/- and control mice. Mice were given a ter-minal dose of anesthetic and then transcardially perfused with heparinised saline to clear blood from the vasculature. Tissuewas then perfusion fixed with Karnovsky’s fluid (2% glutaraldehyde + 4% paraformaldehyde in 0.1 M phosphate buffer, pH7.4). This procedure preserves vessel morphology in the native orientation. Tissues were then dissected, dehydrated throughgraded butanol and embedded in paraffin.
2.2. Imaging
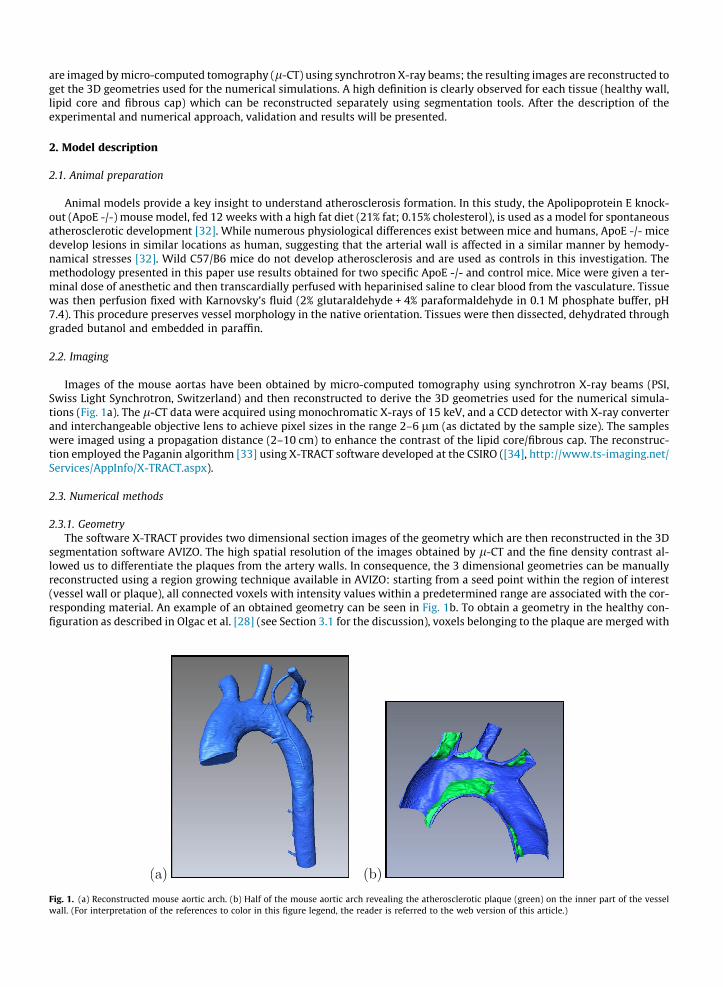
Images of the mouse aortas have been obtained by micro-computed tomography using synchrotron X-ray beams (PSI,Swiss Light Synchrotron, Switzerland) and then reconstructed to derive the 3D geometries used for the numerical simula-tions (Fig. 1a). The l-CT data were acquired using monochromatic X-rays of 15 keV, and a CCD detector with X-ray converterand interchangeable objective lens to achieve pixel sizes in the range 2–6 lm (as dictated by the sample size). The sampleswere imaged using a propagation distance (2–10 cm) to enhance the contrast of the lipid core/fibrous cap. The reconstruc-tion employed the Paganin algorithm [33] using X-TRACT software developed at the CSIRO ([34], http://www.ts-imaging.net/Services/AppInfo/X-TRACT.aspx).
2.3. Numerical methods
2.3.1. GeometryThe software X-TRACT provides two dimensional section images of the geometry which are then reconstructed in the 3D
segmentation software AVIZO. The high spatial resolution of the images obtained by l-CT and the fine density contrast al-lowed us to differentiate the plaques from the artery walls. In consequence, the 3 dimensional geometries can be manuallyreconstructed using a region growing technique available in AVIZO: starting from a seed point within the region of interest(vessel wall or plaque), all connected voxels with intensity values within a predetermined range are associated with the cor-responding material. An example of an obtained geometry can be seen in Fig. 1b. To obtain a geometry in the healthy con-figuration as described in Olgac et al. [28] (see Section 3.1 for the discussion), voxels belonging to the plaque are merged with
Fig. 1. (a) Reconstructed mouse aortic arch. (b) Half of the mouse aortic arch revealing the atherosclerotic plaque (green) on the inner part of the vesselwall. (For interpretation of the references to color in this figure legend, the reader is referred to the web version of this article.)
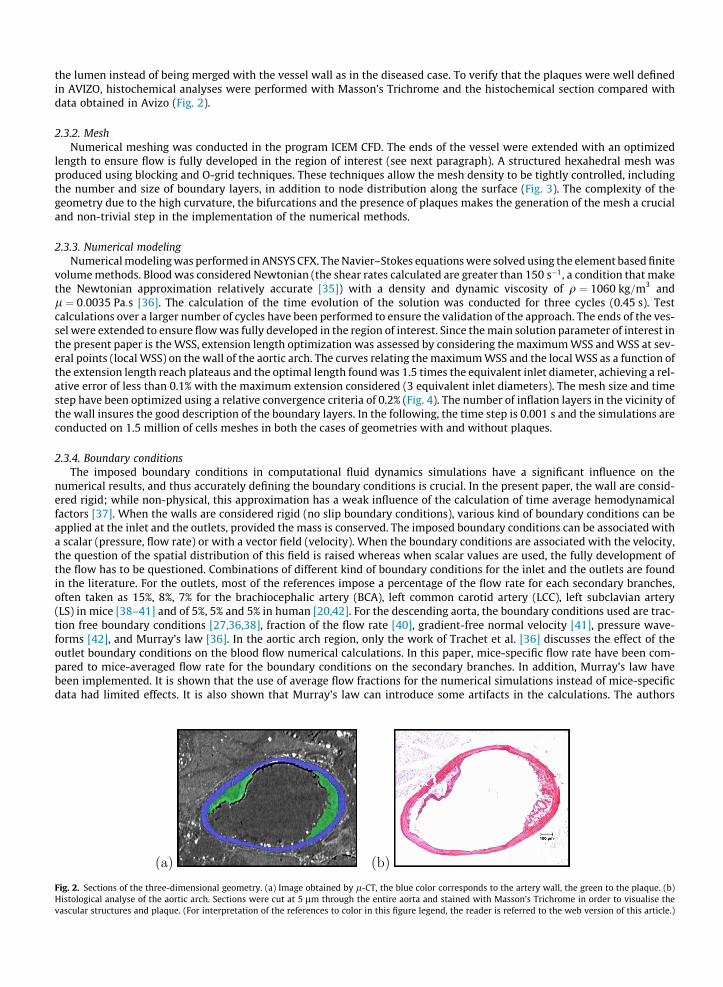
the lumen instead of being merged with the vessel wall as in the diseased case. To verify that the plaques were well definedin AVIZO, histochemical analyses were performed with Masson’s Trichrome and the histochemical section compared withdata obtained in Avizo (Fig. 2).
2.3.2. MeshNumerical meshing was conducted in the program ICEM CFD. The ends of the vessel were extended with an optimized
length to ensure flow is fully developed in the region of interest (see next paragraph). A structured hexahedral mesh wasproduced using blocking and O-grid techniques. These techniques allow the mesh density to be tightly controlled, includingthe number and size of boundary layers, in addition to node distribution along the surface (Fig. 3). The complexity of thegeometry due to the high curvature, the bifurcations and the presence of plaques makes the generation of the mesh a crucialand non-trivial step in the implementation of the numerical methods.
2.3.3. Numerical modelingNumerical modeling was performed in ANSYS CFX. The Navier–Stokes equations were solved using the element based finite
volume methods. Blood was considered Newtonian (the shear rates calculated are greater than 150 s�1, a condition that makethe Newtonian approximation relatively accurate [35]) with a density and dynamic viscosity of q ¼ 1060 kg=m3 andl ¼ 0:0035 Pa:s [36]. The calculation of the time evolution of the solution was conducted for three cycles (0.45 s). Testcalculations over a larger number of cycles have been performed to ensure the validation of the approach. The ends of the ves-sel were extended to ensure flow was fully developed in the region of interest. Since the main solution parameter of interest inthe present paper is the WSS, extension length optimization was assessed by considering the maximum WSS and WSS at sev-eral points (local WSS) on the wall of the aortic arch. The curves relating the maximum WSS and the local WSS as a function ofthe extension length reach plateaus and the optimal length found was 1.5 times the equivalent inlet diameter, achieving a rel-ative error of less than 0.1% with the maximum extension considered (3 equivalent inlet diameters). The mesh size and timestep have been optimized using a relative convergence criteria of 0.2% (Fig. 4). The number of inflation layers in the vicinity ofthe wall insures the good description of the boundary layers. In the following, the time step is 0.001 s and the simulations areconducted on 1.5 million of cells meshes in both the cases of geometries with and without plaques.
2.3.4. Boundary conditionsThe imposed boundary conditions in computational fluid dynamics simulations have a significant influence on the
numerical results, and thus accurately defining the boundary conditions is crucial. In the present paper, the wall are consid-ered rigid; while non-physical, this approximation has a weak influence of the calculation of time average hemodynamicalfactors [37]. When the walls are considered rigid (no slip boundary conditions), various kind of boundary conditions can beapplied at the inlet and the outlets, provided the mass is conserved. The imposed boundary conditions can be associated witha scalar (pressure, flow rate) or with a vector field (velocity). When the boundary conditions are associated with the velocity,the question of the spatial distribution of this field is raised whereas when scalar values are used, the fully development ofthe flow has to be questioned. Combinations of different kind of boundary conditions for the inlet and the outlets are foundin the literature. For the outlets, most of the references impose a percentage of the flow rate for each secondary branches,often taken as 15%, 8%, 7% for the brachiocephalic artery (BCA), left common carotid artery (LCC), left subclavian artery(LS) in mice [38–41] and of 5%, 5% and 5% in human [20,42]. For the descending aorta, the boundary conditions used are trac-tion free boundary conditions [27,36,38], fraction of the flow rate [40], gradient-free normal velocity [41], pressure wave-forms [42], and Murray’s law [36]. In the aortic arch region, only the work of Trachet et al. [36] discusses the effect of theoutlet boundary conditions on the blood flow numerical calculations. In this paper, mice-specific flow rate have been com-pared to mice-averaged flow rate for the boundary conditions on the secondary branches. In addition, Murray’s law havebeen implemented. It is shown that the use of average flow fractions for the numerical simulations instead of mice-specificdata had limited effects. It is also shown that Murray’s law can introduce some artifacts in the calculations. The authors
Fig. 2. Sections of the three-dimensional geometry. (a) Image obtained by l-CT, the blue color corresponds to the artery wall, the green to the plaque. (b)Histological analyse of the aortic arch. Sections were cut at 5 lm through the entire aorta and stained with Masson’s Trichrome in order to visualise thevascular structures and plaque. (For interpretation of the references to color in this figure legend, the reader is referred to the web version of this article.)
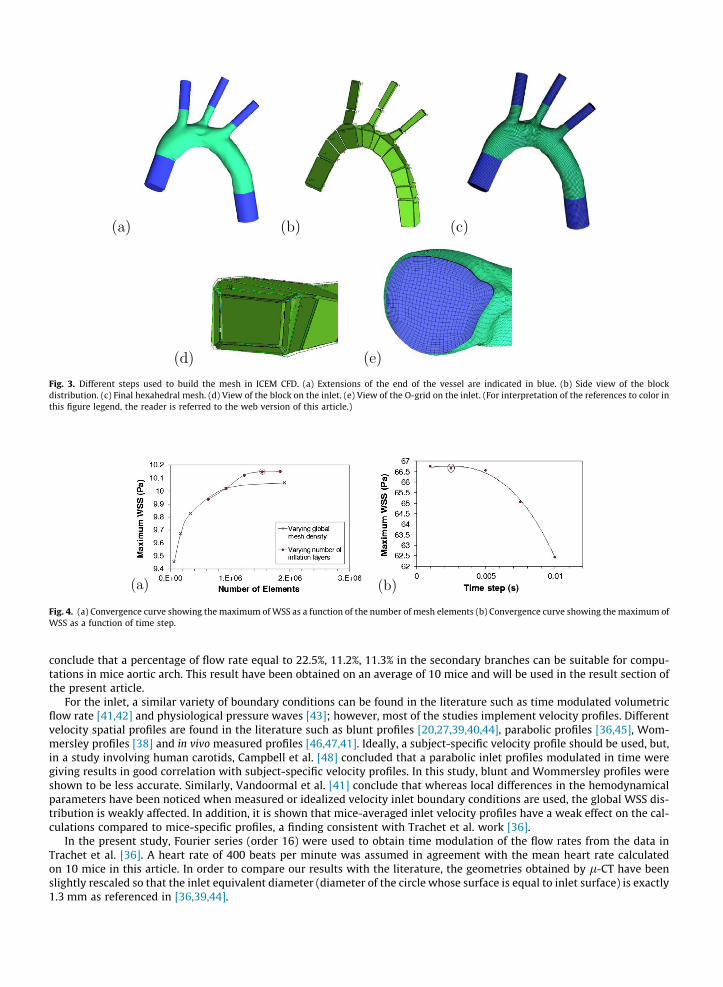
Fig. 3. Different steps used to build the mesh in ICEM CFD. (a) Extensions of the end of the vessel are indicated in blue. (b) Side view of the blockdistribution. (c) Final hexahedral mesh. (d) View of the block on the inlet. (e) View of the O-grid on the inlet. (For interpretation of the references to color inthis figure legend, the reader is referred to the web version of this article.)
Fig. 4. (a) Convergence curve showing the maximum of WSS as a function of the number of mesh elements (b) Convergence curve showing the maximum ofWSS as a function of time step.
conclude that a percentage of flow rate equal to 22.5%, 11.2%, 11.3% in the secondary branches can be suitable for compu-tations in mice aortic arch. This result have been obtained on an average of 10 mice and will be used in the result section ofthe present article.
For the inlet, a similar variety of boundary conditions can be found in the literature such as time modulated volumetricflow rate [41,42] and physiological pressure waves [43]; however, most of the studies implement velocity profiles. Differentvelocity spatial profiles are found in the literature such as blunt profiles [20,27,39,40,44], parabolic profiles [36,45], Wom-mersley profiles [38] and in vivo measured profiles [46,47,41]. Ideally, a subject-specific velocity profile should be used, but,in a study involving human carotids, Campbell et al. [48] concluded that a parabolic inlet profiles modulated in time weregiving results in good correlation with subject-specific velocity profiles. In this study, blunt and Wommersley profiles wereshown to be less accurate. Similarly, Vandoormal et al. [41] conclude that whereas local differences in the hemodynamicalparameters have been noticed when measured or idealized velocity inlet boundary conditions are used, the global WSS dis-tribution is weakly affected. In addition, it is shown that mice-averaged inlet velocity profiles have a weak effect on the cal-culations compared to mice-specific profiles, a finding consistent with Trachet et al. work [36].
In the present study, Fourier series (order 16) were used to obtain time modulation of the flow rates from the data inTrachet et al. [36]. A heart rate of 400 beats per minute was assumed in agreement with the mean heart rate calculatedon 10 mice in this article. In order to compare our results with the literature, the geometries obtained by l-CT have beenslightly rescaled so that the inlet equivalent diameter (diameter of the circle whose surface is equal to inlet surface) is exactly1.3 mm as referenced in [36,39,44].
2.3.5. Hemodynamical parametersThe hemodynamical parameters characterized in the present paper are based on the calculation of the instantaneous wall
shear stress vector sw with sw ¼ l@U=@njwall where U is the velocity field, n the outwards normal to the wall, and l the dy-namic viscosity. The TAWSS, the OSI and the RRT are related to sw through the following equations:
Fig. 5.plaques
TAWSS ¼ 1T
Z T
0jswjdt;
where T is a cardiac cycle period and t is time. As defined in the literature the others parameters are:
OSI ¼ 0:5 1�
R T0 swdt
������R T
0 jswjdt
0@
1A;
RTT ¼ 1ð1� 2OSIÞTAWSS
:
While TAWSS is directly obtained in ANSYS CFX, the two other parameters are calculated with in-house Matlab codeusing results from ANSYS CFX. Another parameter has been also investigated, the time average gradient of pressure (TAGP),defined by:
TAGP ¼ 1T
Z T
0rpdt;
where rp is the gradient of pressure.
3. Results
3.1. Healthy versus diseased configuration: geometrical model
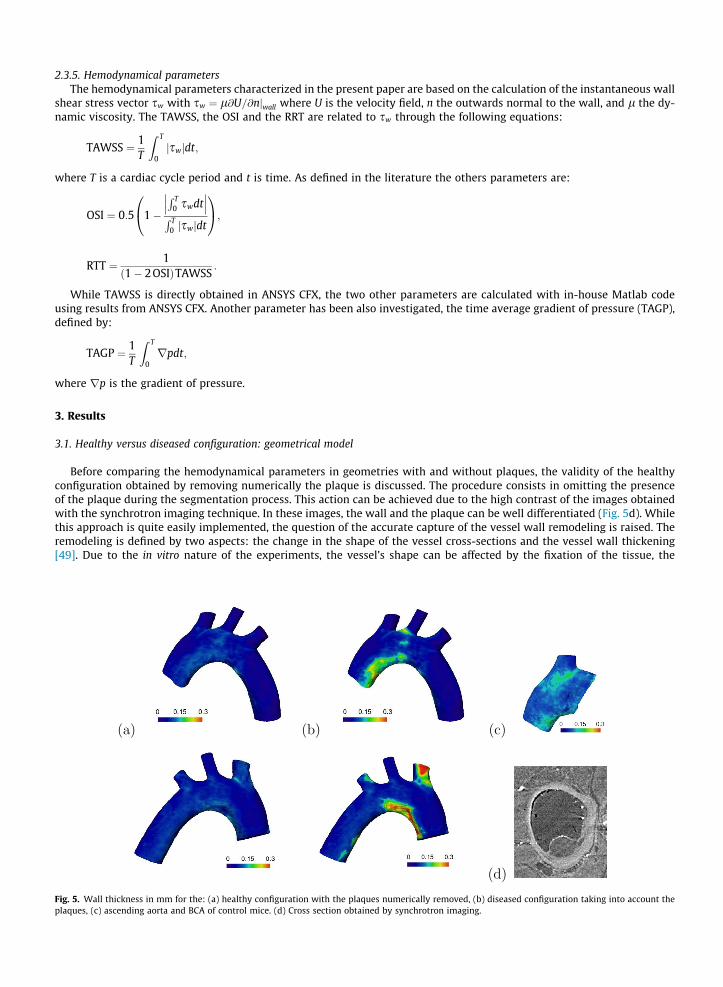
Before comparing the hemodynamical parameters in geometries with and without plaques, the validity of the healthyconfiguration obtained by removing numerically the plaque is discussed. The procedure consists in omitting the presenceof the plaque during the segmentation process. This action can be achieved due to the high contrast of the images obtainedwith the synchrotron imaging technique. In these images, the wall and the plaque can be well differentiated (Fig. 5d). Whilethis approach is quite easily implemented, the question of the accurate capture of the vessel wall remodeling is raised. Theremodeling is defined by two aspects: the change in the shape of the vessel cross-sections and the vessel wall thickening[49]. Due to the in vitro nature of the experiments, the vessel’s shape can be affected by the fixation of the tissue, the
Wall thickness in mm for the: (a) healthy configuration with the plaques numerically removed, (b) diseased configuration taking into account the, (c) ascending aorta and BCA of control mice. (d) Cross section obtained by synchrotron imaging.
dissection procedure or small variation of the pressure during the injection of the fixative solution, and it is quite challengingto draw conclusions about this question using fixed tissues. However, it is expected these cross section shape changes tohave a smaller effect on the flow than the plaques (smooth small amplitude obstacles versus sharp high amplitudeobstacles).
Concerning the thickening of the artery wall due to the presence of plaques, Fig. 5 represents the thickness of the wall inthe healthy (Fig. 5a) and diseased (Fig. 5b) configurations. Images have been obtained in the Avizo software. It can be seen onthe figures that, in the healthy configuration, while variations are observed, the thickness remains relatively homogeneouswhen compared to the geometry where plaques have been taken into account. These variations can have different originssuch as local shrinking due to the fixation of the tissue or errors in the segmentation process due to limited resolution ofthe edges of the vessel walls. Fig. 5c shows the wall thickness in a control mouse model (no plaque) and variations of similaramplitude can be observed. To conclude, even if some wall thickening could be present in the vicinity of plaques, its ampli-tude is of the order of the numerical error and so will be considered negligible in the following. This conclusion is limited tothe present geometry and validation of the approach should be done for each subject-specific geometry. All together, it isconsidered that the geometry without plaques corresponds effectively to the geometry of the aortic arch of the same miceunder an healthy condition.
3.2. Comparison with literature: implementation of two different boundary conditions
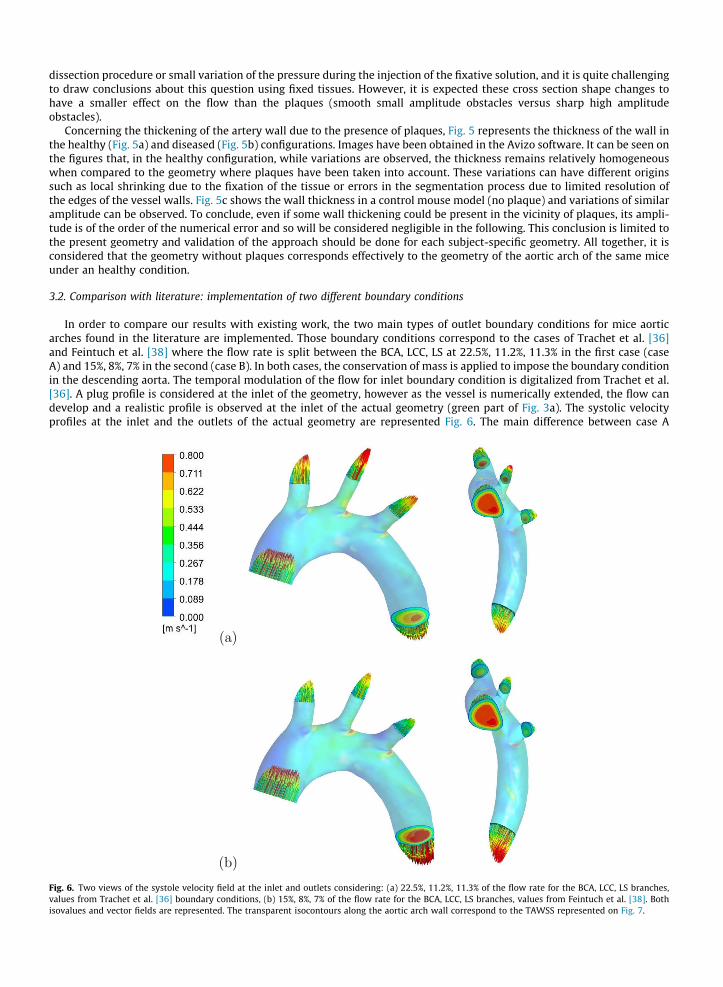
In order to compare our results with existing work, the two main types of outlet boundary conditions for mice aorticarches found in the literature are implemented. Those boundary conditions correspond to the cases of Trachet et al. [36]and Feintuch et al. [38] where the flow rate is split between the BCA, LCC, LS at 22.5%, 11.2%, 11.3% in the first case (caseA) and 15%, 8%, 7% in the second (case B). In both cases, the conservation of mass is applied to impose the boundary conditionin the descending aorta. The temporal modulation of the flow for inlet boundary condition is digitalized from Trachet et al.[36]. A plug profile is considered at the inlet of the geometry, however as the vessel is numerically extended, the flow candevelop and a realistic profile is observed at the inlet of the actual geometry (green part of Fig. 3a). The systolic velocityprofiles at the inlet and the outlets of the actual geometry are represented Fig. 6. The main difference between case A
Fig. 6. Two views of the systole velocity field at the inlet and outlets considering: (a) 22.5%, 11.2%, 11.3% of the flow rate for the BCA, LCC, LS branches,values from Trachet et al. [36] boundary conditions, (b) 15%, 8%, 7% of the flow rate for the BCA, LCC, LS branches, values from Feintuch et al. [38]. Bothisovalues and vector fields are represented. The transparent isocontours along the aortic arch wall correspond to the TAWSS represented on Fig. 7.
and case B is the amplitude of the maximum of velocity which, as expected, is found higher in case A due to a higher pro-portion flow rate going through the secondary branches (BCA, LCC, LS). It is noticeable that the spatial distribution of thevelocity in the ascending aorta is similar to the in vivo measurements of Markl et al. [26] in human, with a local maximumof velocity shift towards the inner curvature of the vessel.
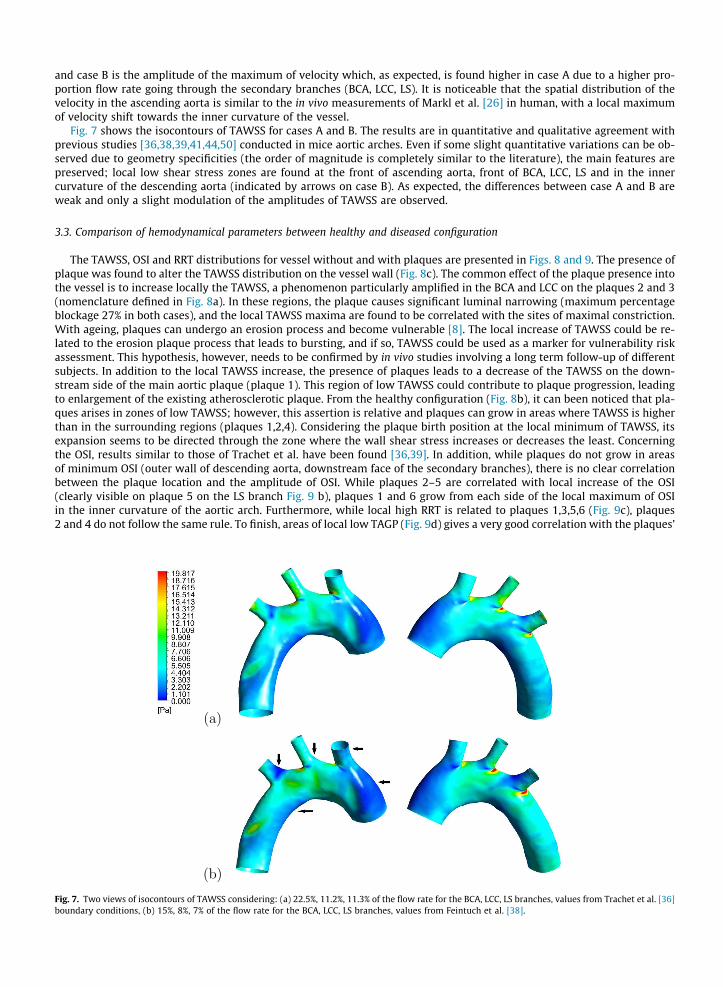
Fig. 7 shows the isocontours of TAWSS for cases A and B. The results are in quantitative and qualitative agreement withprevious studies [36,38,39,41,44,50] conducted in mice aortic arches. Even if some slight quantitative variations can be ob-served due to geometry specificities (the order of magnitude is completely similar to the literature), the main features arepreserved; local low shear stress zones are found at the front of ascending aorta, front of BCA, LCC, LS and in the innercurvature of the descending aorta (indicated by arrows on case B). As expected, the differences between case A and B areweak and only a slight modulation of the amplitudes of TAWSS are observed.
3.3. Comparison of hemodynamical parameters between healthy and diseased configuration
The TAWSS, OSI and RRT distributions for vessel without and with plaques are presented in Figs. 8 and 9. The presence ofplaque was found to alter the TAWSS distribution on the vessel wall (Fig. 8c). The common effect of the plaque presence intothe vessel is to increase locally the TAWSS, a phenomenon particularly amplified in the BCA and LCC on the plaques 2 and 3(nomenclature defined in Fig. 8a). In these regions, the plaque causes significant luminal narrowing (maximum percentageblockage 27% in both cases), and the local TAWSS maxima are found to be correlated with the sites of maximal constriction.With ageing, plaques can undergo an erosion process and become vulnerable [8]. The local increase of TAWSS could be re-lated to the erosion plaque process that leads to bursting, and if so, TAWSS could be used as a marker for vulnerability riskassessment. This hypothesis, however, needs to be confirmed by in vivo studies involving a long term follow-up of differentsubjects. In addition to the local TAWSS increase, the presence of plaques leads to a decrease of the TAWSS on the down-stream side of the main aortic plaque (plaque 1). This region of low TAWSS could contribute to plaque progression, leadingto enlargement of the existing atherosclerotic plaque. From the healthy configuration (Fig. 8b), it can been noticed that pla-ques arises in zones of low TAWSS; however, this assertion is relative and plaques can grow in areas where TAWSS is higherthan in the surrounding regions (plaques 1,2,4). Considering the plaque birth position at the local minimum of TAWSS, itsexpansion seems to be directed through the zone where the wall shear stress increases or decreases the least. Concerningthe OSI, results similar to those of Trachet et al. have been found [36,39]. In addition, while plaques do not grow in areasof minimum OSI (outer wall of descending aorta, downstream face of the secondary branches), there is no clear correlationbetween the plaque location and the amplitude of OSI. While plaques 2–5 are correlated with local increase of the OSI(clearly visible on plaque 5 on the LS branch Fig. 9 b), plaques 1 and 6 grow from each side of the local maximum of OSIin the inner curvature of the aortic arch. Furthermore, while local high RRT is related to plaques 1,3,5,6 (Fig. 9c), plaques2 and 4 do not follow the same rule. To finish, areas of local low TAGP (Fig. 9d) gives a very good correlation with the plaques’
Fig. 7. Two views of isocontours of TAWSS considering: (a) 22.5%, 11.2%, 11.3% of the flow rate for the BCA, LCC, LS branches, values from Trachet et al. [36]boundary conditions, (b) 15%, 8%, 7% of the flow rate for the BCA, LCC, LS branches, values from Feintuch et al. [38].
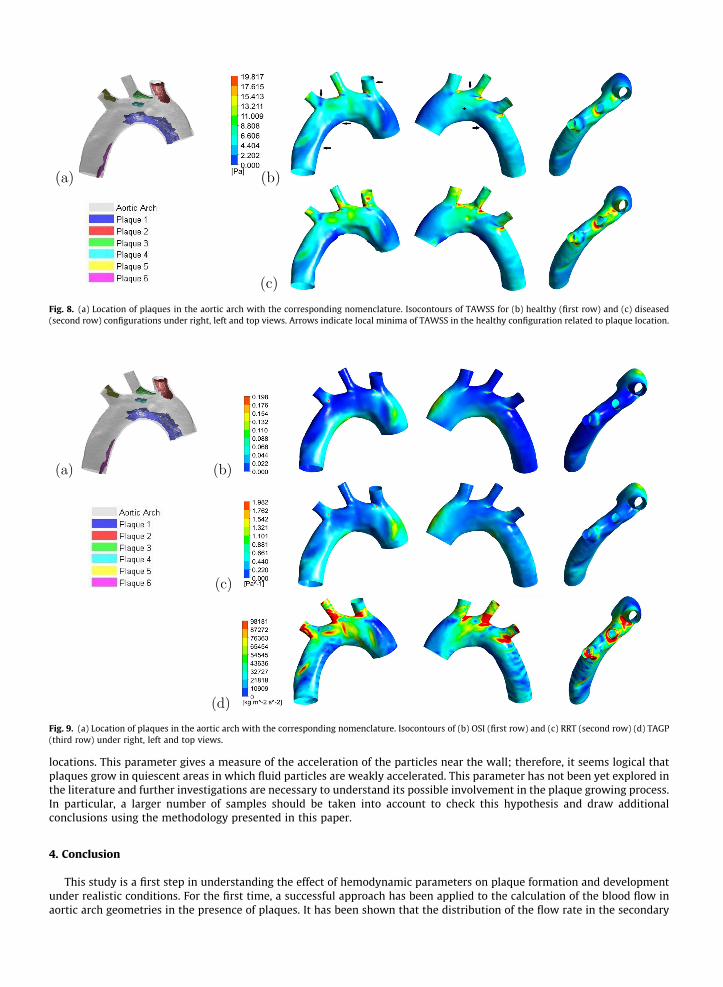
Fig. 8. (a) Location of plaques in the aortic arch with the corresponding nomenclature. Isocontours of TAWSS for (b) healthy (first row) and (c) diseased(second row) configurations under right, left and top views. Arrows indicate local minima of TAWSS in the healthy configuration related to plaque location.
Fig. 9. (a) Location of plaques in the aortic arch with the corresponding nomenclature. Isocontours of (b) OSI (first row) and (c) RRT (second row) (d) TAGP(third row) under right, left and top views.
locations. This parameter gives a measure of the acceleration of the particles near the wall; therefore, it seems logical thatplaques grow in quiescent areas in which fluid particles are weakly accelerated. This parameter has not been yet explored inthe literature and further investigations are necessary to understand its possible involvement in the plaque growing process.In particular, a larger number of samples should be taken into account to check this hypothesis and draw additionalconclusions using the methodology presented in this paper.
4. Conclusion
This study is a first step in understanding the effect of hemodynamic parameters on plaque formation and developmentunder realistic conditions. For the first time, a successful approach has been applied to the calculation of the blood flow inaortic arch geometries in the presence of plaques. It has been shown that the distribution of the flow rate in the secondary
branches have a weak impact on the hemodynamical parameters. The TAWSS results in the absence of plaque have beenfound quantitatively and qualitatively similar to those presented in the literature. The presence of plaque was found to in-crease TAWSS significantly, particularly in regions with large luminal narrowing, such as the brachiocephalic artery. Severalstudies suggest plaque rupture may be associated with high WSS [51,52], and hence the local maximum of WSS on the sur-face of the brachiocephalic plaque could contribute to plaque rupture; however, structural stresses are thought to play amore important role [53] in this process. Further investigations with the implementation of FSI is required to resolve thisquestion under debate. The method of removing the plaque numerically to study the formation and the development ofthe plaque in the same artery has been discussed and predicts correctly the formation sites around local minimum of TAWSS.A new parameter, the TAGP, has been introduced and plaques are found to be located in areas where this parameter has alocal minimum.
Acknowledgments
The authors report no conflicts of interest in this work. The authors acknowledge financial support from the AustralianResearch Council, under Grant No. DP110100434. They acknowledge their collaborators Andrea Aprico, Karen Andrews fromthe Baker IDI Heart and Diabetes Institute, Stacey Hokke from Monash University for the preparation of the samples for Syn-chrotron imaging. They acknowledge also Jillian Hough, Gwenael Hannema, Kalgren Lai, three students involved in theproject.
References
[1] P. Libby, Inflammation in atherosclerosis, Nature 420 (2002) 868–874.[2] Y.S. Chatzizisis, A.U. Coskun, M. Jonas, E.R. Edelman, C.L. Feldman, P.H. Stone, Role of endothelial shear stress in the natural history of coronary
atherosclerosis and vascular remodeling, J. Am. Coll. Cardiol. 49 (25) (2007) 2379–2393.[3] O.M. Pello, C. Silvestre, M. De Pizzol, V. Andrs, A glimpse on the phenomenon of macrophage polarization during atherosclerosis, Immunobiology 216
(11) (2011) 1172–1176.[4] P.H. Stone, A.U. Coskun, S. Kinlay, J.J. Popma, M. Sonka, A. Wahle, Y. Yeghiazarians, C. Maynard, R.E. Kuntz, C.L. Feldman, Regions of low endothelial
shear stress are the sites where coronary plaque progresses and vascular remodelling occurs in humans: an in vivo serial study, Eur. Heart J. 28 (6)(2007) 705–710.
[5] A. Phinikaridou, N. Hua, T. Pham, J.A. Hamilton, Regions of low endothelial shear stress colocalize with positive vascular remodeling and atheroscleroticplaque disruption: an in vivo magnetic resonance imaging study, Circ. Cardiovasc. Imaging 6 (2) (2013) 302–310.
[6] A.J. Reininger, I. Bernlochner, S.M. Penz, C. Ravanat, P. Smethurst, R.W. Farndale, C. Gachet, R. Brandl, W. Siess, A 2-step mechanism of arterial thrombusformation induced by human atherosclerotic plaques, J. Am. Coll. Cardiol. 55 (11) (2010) 1147–1158.
[7] T.G. Giannakopoulos, E.D. Avgerinos, K. Moulakakis, N.P. Kadoglou, O. Preza, A. Papapetrou, C. Papasideris, C.D. Liapis, Biomarkers for diagnosis of thevulnerable atherosclerotic plaque, Interv. Cardiol. 3 (2) (2011) 223–233.
[8] S. Yl-Herttuala, J.F. Bentzon, M. Daemen, E. Falk, H.M. Garcia-Garcia, J. Herrmann, I. Hoefer, J.W. Jukema, R. Krams, B.R. Kwak, N. Marx, M. Naruszewicz,A. Newby, G. Pasterkamp, P.W.J.C. Serruys, J. Waltenberger, C. Weber, L. Tokgzoglu, Stabilisation of atherosclerotic plaques, Thromb. Haemost. 106 (1)(2011) 1–19.
[9] P. Assemat, K. Hourigan, Evolution and rupture of vulnerable plaques: a review of mechanical effects, ChronoPhysiol. Ther. 3 (2013) 23–40.[10] M.S. Cocker, B. Mc Ardle, J.D. Spence, C. Lum, R.R. Hammond, D.C. Ongaro, M.A. McDonald, R.A. deKemp, J.-C. Tardif, R.S.B. Beanlands, Imaging
atherosclerosis with hybrid [18f]fluorodeoxyglucose positron emission tomography/computed tomography imaging: what leonardo da vinci could notsee, J. Nucl. Cardiol. 19 (6) (2012) 1211–1225.
[11] C. Cheng, D. Tempel, R. van Haperen, A. van der Baan, F. Grosveld, M.J.A.P. Daemen, R. Krams, R. de Crom, Atherosclerotic lesion size and vulnerabilityare determined by patterns of fluid shear stress, Circulation 113 (23) (2006) 2744–2753.
[12] C.M. Gibson, L. Diaz, K. Kandarpa, F.M. Sacks, R.C. Pasternak, T. Sandor, C. Feldman, P.H. Stone, Relation of vessel wall shear stress to atherosclerosisprogression in human coronary arteries, Arterioscler. Thromb. Vasc. Biol. 13 (2) (1993) 310–315.
[13] A. Harloff, A. Nubaumer, S. Bauer, A.F. Stalder, A. Frydrychowicz, C. Weiller, J. Hennig, M. Markl, In vivo assessment of wall shear stress in theatherosclerotic aorta using flow-sensitive 4d mri, Magn. Reson. Med. 63 (6) (2010) 1529–1536.
[14] Y.S. Chatzizisis, A.B. Baker, G.K. Sukhova, K.C. Koskinas, M.I. Papafaklis, R. Beigel, M. Jonas, A.U. Coskun, B.V. Stone, C. Maynard, G.P. Shi, P. Libby, C.L.Feldman, E.R. Edelman, P.H. Stone, Augmented expression and activity of extracellular matrix-degrading enzymes in regions of low endothelial shearstress colocalize with coronary atheromata with thin fibrous caps in pigs, Circulation 123 (6) (2011) 621–630.
[15] C.G. Caro, J.M. Fitz-Gerald, R.C. Schroter, Atheroma and arterial wall shear observation, correlation and proposal of a shear dependent mass transfermechanism for atherogenesis, Proc. R. Soc. London Ser. B Biol. Sci. 177 (1046) (1971) 109–159.
[16] D.K. Stangeby, C.R. Ethier, Computational analysis of coupled blood-wall arterial ldl transport, J. Biomech. Eng. 124 (1) (2002) 1.[17] R. Estrada, G.A. Giridharan, M.-D. Nguyen, S.D. Prabhu, P. Sethu, Microfluidic endothelial cell culture model to replicate disturbed flow conditions seen
in atherosclerosis susceptible regions, Biomicrofluidics 5 (3) (2011) 032006.[18] X. Liu, F. Pu, Y. Fan, X. Deng, D. Li, S. Li, A numerical study on the flow of blood and the transport of ldl in the human aorta: the physiological significance
of the helical flow in the aortic arch, Am. J. Physiol Heart Circ. Physiol. 297 (2009) H163–H170.[19] D.N. Ku, D.P. Giddens, C.K. Zarins, S. Glagov, Pulsatile flow and atherosclerosis in the human carotid bifurcation. positive correlation between plaque
location and low oscillating shear stress, Arterioscler. Thromb. Vasc. Biol. 5 (3) (1985) 293–302.[20] X. Liu, Y. Fan, X. Deng, F. Zhan, Effect of non-newtonian and pulsatile blood flow on mass transport in the human aorta, J. Biomech. 44 (6) (2011) 1123–
1131.[21] T. Thim, A. Hrlyck, A. Niemann, L. Drouet, H. B++tker, M. Hagensen, W. Kim, S. Thryse, W. Paaske, E. Falk, Wall shear stress and local plaque
development in stenosed carotid arteries of hypercholesterolemic minipigs, J. Cardiovasc. Dis. Res. 3 (2) (2012) 76–83.[22] m. Lei, C. Kleinstreuer, G.A. Truskey, Numerical investigation and prediction of atherogenic sites in branching arteries, Trans. ASME 117 (1995) 350–
357.[23] T.M. Farmakis, J.V. Soulis, G.D. Giannoglou, G.J. Zioupos, G.E. Louridas, Wall shear stress gradient topography in the normal left coronary arterial tree:
possible implications for atherogenesis, Curr. Med. Res. Opin. 20 (5) (2004) 587–596.[24] H.A. Himburg, D.M. Grzybowski, A.L. Hazel, J.A. LaMack, X. Li, M.H. Friedman, Spatial comparison between wall shear stress measures and porcine
arterial endothelial permeability, Am. J. Physiol. Heart Circ. Physiol. 286 (5) (2004) H1916–H1922.[25] J. Knight, U. Olgac, S.C. Saur, D. Poulikakos, W. Marshall, P.C. Cattin, H. Alkadhi, V. Kurtcuoglu, Choosing the optimal wall shear parameter for the
prediction of plaque location-a patient-specific computational study in human right coronary arteries, Atherosclerosis 211 (2) (2010) 445–450.
[26] M. Markl, F. Wegent, T. Zech, S. Bauer, C. Strecker, M. Schumacher, C. Weiller, J. Hennig, A. Harloff, In vivo wall shear stress distribution in the carotidartery: effect of bifurcation geometry, internal carotid artery stenosis, and recanalization therapy, Circ. Cardiovasc. Imaging 3 (6) (2010) 647–655.
[27] Y. Hoi, Y.-Q. Zhou, X. Zhang, R.M. Henkelman, D.A. Steinman, Correlation between local hemodynamics and lesion distribution in a novel aorticregurgitation murine model of atherosclerosis, Ann. Biomed. Eng. 39 (5) (2011) 1414–1422.
[28] U. Olgac, J. Knight, D. Poulikakos, S.C. Saur, H. Alkadhi, L.M. Desbiolles, P.C. Cattin, V. Kurtcuoglu, Computed high concentrations of low-densitylipoprotein correlate with plaque locations in human coronary arteries, J. Biomech. 44 (13) (2011) 2466–2471.
[29] H.S. Ryou, S. Kim, S.W. Kim, S.W. Cho, Construction of healthy arteries using computed tomography and virtual histology intravascular ultrasound, J.Biomech. 45 (9) (2012) 1612–1618.
[30] J. Dong, K.K.L. Wong, J. Tu, Hemodynamics analysis of patient-specific carotid bifurcation: a cfd model of downstream peripheral vascular impedance,Int. J. Numer. Methods Biomed. Eng. 29 (4) (2013) 476–491.
[31] K.K.L. Wong, P. Thavornpattanapong, S.C.P. Cheung, J.Y. Tu, Biomechanical investigation of pulsatile flow in a three-dimensional atherosclerotic carotidbifurcation model, J. Mech. Med. Biol. 13 (1) (2013) 1350001.
[32] A.R. Bond, C.L. Jackson, The fat-fed apolipoprotein e knockout mouse brachiocephalic artery in the study of atherosclerotic plaque rupture, J. Biomed.Biotechnol. 2011 (2011) 1–10.
[33] D. Paganin, S.C. Mayo, T.E. Gureyev, P.R. Miller, S.W. Wilkins, Simultaneous phase and amplitude extraction from a single defocused image of ahomogeneous object, J. Microsc. 206 (2002) 33–40.
[34] T.E. Gureyev, Y. Nesterets, D. Ternovski, D. Thompson, S. Wilkins, A.W. Stevensona, A. Sakellarioua, J.A. Taylor, Toolbox for advanced x-ray imageprocessing, Proceedings SPIE (2011). 81410B–14.
[35] R.E.J. Wells, Shear rate dependence of the viscosity of whole blood and plasma, Science 133 (1961) 763–764.[36] B. Trachet, J. Bols, G. De Santis, S. Vandenberghe, B. Loeys, P. Segers, The impact of simplified boundary conditions and aortic arch inclusion on cfd
simulations in the mouse aorta: a comparison with mouse-specific reference data, J. Biomech. Eng. 133 (12) (2011) 121006.[37] J. Lantz, J. Renner, M. Karlsson, Wall shear stress in a subject specific human aorta influence of fluid-structure interaction, Int. J. Appl. Mech. 03 (04)
(2011) 759–778.[38] A. Feintuch, P. Ruengsakulrach, A. Lin, J. Zhang, Y.Q. Zhou, J. Bishop, L. Davidson, D. Courtman, F.S. Foster, D. Steinman, R. Henkelman, C. Ethier,
Hemodynamics in the mouse aortic arch as assessed by mri, ultrasound, and numerical modeling, Am. J. Physiol. Heart Circ. Physiol. 292 (2007) H884–H892.
[39] B. Trachet, A. Swillens, D. Van Loo, C. Casteleyn, A. De Paepe, B. Loeys, P. Segers, The influence of aortic dimensions on calculated wall shear stress in themouse aortic arch, Comput. Methods Biomech. Biomed. Eng. 12 (5) (2009) 491–499.
[40] H. Zhu, J. Zhang, J. Shih, D.S. Long, F. Lopez-Bertoni, J.R. Hagaman, N. Maeda, M.H. Friedman, Differences in aortic arch geometry, hemodynamics, andplaque patterns between c57bl/6 and 129/svev mice, J. Biomech. Eng. 131 (12) (2009) 121005.
[41] M.A. Van Doormaal, A. Kazakidi, M. Wylezinska, A. Hunt, J.L. Tremoleda, A. Protti, Y. Bohraus, W. Gsell, P.D. Weinberg, C.R. Ethier, Haemodynamics inthe mouse aortic arch computed from mri-derived velocities at the aortic root, J. R. Soc. Interface 9 (76) (2012) 2834–2844.
[42] K.M. Tse, R. Chang, H.P. Lee, S.P. Lim, S.K. Venkatesh, P. Ho, A computational fluid dynamics study on geometrical influence of the aorta onhaemodynamics, Eur. J. Cardio Thorac. Surg. 43 (4) (2012) 829–838.
[43] P. Vasava, P. Jalali, M. Dabagh, P.J. Kolari, Finite element modelling of pulsatile blood flow in idealized model of human aortic arch: study ofhypotension and hypertension, Comput. Math. Methods Med. 2012 (2012) 1–14.
[44] Y. Huo, X. Guo, G.S. Kassab, The flow field along the entire length of mouse aorta and primary branches, Ann. Biomed. Eng. 36 (5) (2008) 685–699.[45] J. Renner, H. Nadali Najafabadi, D. Modin, T. Lnne, M. Karlsson, Subject-specific aortic wall shear stress estimations using semi-automatic
segmentation, Clin. Physiol. Funct. Imaging 32 (6) (2012) 481–491.[46] S. Jin, J. Oshinski, D.P. Giddens, Effects of wall motion and compliance on flow patterns in the ascending aorta, J. Biomech. Eng. 125 (3) (2003) 347–354.[47] C. Canstein, P. Cachot, A. Faust, A.F. Stalder, J. Bock, A. Frydrychowicz, J. Kffer, J. Hennig, M. Markl, 3d mr flow analysis in realistic rapid-prototyping
model systems of the thoracic aorta: comparison with in vivo data and computational fluid dynamics in identical vessel geometries, Magn. Reson. Med.59 (3) (2008) 535–546.
[48] I.C. Campbell, D. Weiss, J.D. Suever, R. Virmani, A. Veneziani, R.P. Vito, J.N. Oshinski, W.R. Taylor, Biomechanical modeling and morphology analysisindicates plaque rupture due to mechanical failure unlikely in atherosclerosis-prone mice, Am. J. Physiol. Heart Circ. Physiol. 304 (2013) H473–H486.
[49] M. Cilla, E. Pea, M.A. Martnez, D.J. Kelly, Comparison of the vulnerability risk for positive versus negative atheroma plaque morphology, J. Biomech. 46(7) (2013) 1248–1254.
[50] B. Vandeghinste, B. Trachet, M. Renard, C. Casteleyn, S. Staelens, B. Loeys, P. Segers, S. Vandenberghe, Replacing vascular corrosion casting by in vivomicro-ct imaging for building 3d cardiovascular models in mice, Mol. Imaging Biol. 13 (1) (2010) 78–86.
[51] H.C. Groen, F.J.H. Gijsen, A. van der Lugt, M.S. Ferguson, T.S. Hatsukami, A.F.W. van der Steen, C. Yuan, J.J. Wentzel, Plaque rupture in the carotid arteryis localized at the high shear stress region: a case report, Stroke 38 (8) (2007) 2379–2381.
[52] D. Tang, Z. Teng, G. Canton, C. Yang, M. Ferguson, X. Huang, J. Zheng, P.K. Woodard, C. Yuan, Sites of rupture in human atherosclerotic carotid plaquesare associated with high structural stresses: an in vivo mri-based 3d fluid-structure interaction study, Stroke 40 (10) (2009) 3258–3263.
[53] U. Sadat, Z. Teng, J.H. Gillard, Biomechanical structural stresses of atherosclerotic plaques, Expert Rev. Cardiovasc. Ther. 8 (10) (2010) 1469–1481.