three-dimensional mapping of seawater intrusion using geophysical methods
TRANSCRIPT

1
Three-Dimensional Mapping of Seawater Intrusion using Geophysical Methods
M. Sherif1, A. Kacimov2, A. Ebraheem3 and M. AlMulla3
1Civil and Environmental Engineering Dept., College of Engineering, UAE Univ., Al Ain, UAE 2Department of Soils, Water and Agricultural Engineering, College of Agricultural and Marine Sciences, Sultan Qaboos University, Muscat, Sultanate of Oman 3Department of Water Resources, Ministry of Environment and Water, Dubai, UAE Abstract Seawater intrusion is a common problem in almost all coastal aquifers. However, the degree of intrusion may differ from one aquifer to another depending on many factors including, among others, geometric and geological conditions of the coastal aquifer, hydrological parameters, climatic conditions, pumping rates and recharge events. Proper assessment and mapping of the groundwater quality and transition zone in coastal aquifers are needed for any groundwater management in coastal aquifers. Geophysical methods represent a feasible tool for the monitoring and assessment of seawater water intrusion problems in coastal aquifers. This paper presents earth resistivity surveys that have been conducted in the coastal aquifer of Wadi Ham in United Arab Emirates. Existing monitoring wells were used to measure the horizontal and vertical variations in water salinity and thus improve the interpretation of earth resistivity imaging data. Results of 2D earth resistivity imaging surveys and chemical analyses of collected water samples were used to obtain an empirical relationship between the inferred earth resistivity and the amount of total dissolved solids. A three-dimensional mapping of the seawater intrusion transition zone was developed through the integration of two-dimensional vertical resistivity profiles. The paper demonstrates the feasibility and accuracy of geophysical methods in three-dimensional mapping of seawater intrusion problems. Keywords: seawater intrusion, three-dimensional mapping, vertical electrical sounding,
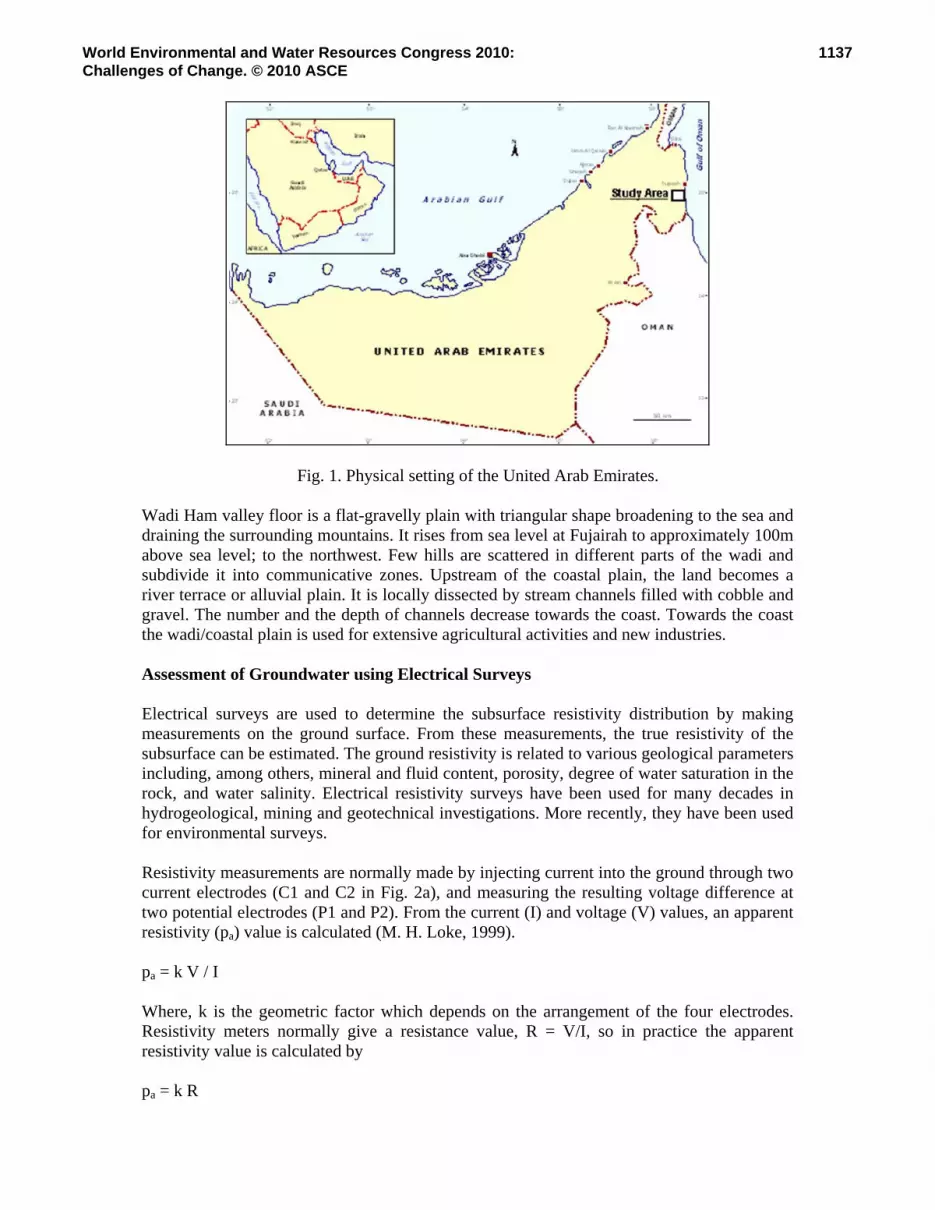
United Arab Emirates. Introduction and Physical Setting Wadi Ham The UAE lies in the southeastern part of the Arabian peninsula between latitudes 22o 40' and 26o 00' North and longitudes 51o 00' and 56o 00' East. It is bounded from the north by the Arabian Gulf, on the east by the Sultanate of Oman and the Gulf of Oman and on the south and west by the Kingdom of Saudi Arabia, Fig. 1. The area of the UAE is 83,600 km2. Its land is mostly desert and is characterized by the predominance of Aeolian Landform System. The geomorphologic features include mountains, gravel plains, sand dunes, coastal zones and drainage basins, Al Hammadi, 2003. The Wadi Ham rises in the mountains immediately south and south east of the Masafi draining south eastwards into the Gulf of Oman between Fujairah and Kalba. It is deeply incised in its upper portion and is characterized by narrow valleys and steep slopes leading down to the wadi floor of coarse alluvial gravels and boulders. The gradient of the flood plain is very low and it forms a broad flat area between the Dam and the sea.
1136World Environmental and Water Resources Congress 2010:Challenges of Change. © 2010 ASCE
2
Fig. 1. Physical setting of the United Arab Emirates. Wadi Ham valley floor is a flat-gravelly plain with triangular shape broadening to the sea and draining the surrounding mountains. It rises from sea level at Fujairah to approximately 100m above sea level; to the northwest. Few hills are scattered in different parts of the wadi and subdivide it into communicative zones. Upstream of the coastal plain, the land becomes a river terrace or alluvial plain. It is locally dissected by stream channels filled with cobble and gravel. The number and the depth of channels decrease towards the coast. Towards the coast the wadi/coastal plain is used for extensive agricultural activities and new industries. Assessment of Groundwater using Electrical Surveys Electrical surveys are used to determine the subsurface resistivity distribution by making measurements on the ground surface. From these measurements, the true resistivity of the subsurface can be estimated. The ground resistivity is related to various geological parameters including, among others, mineral and fluid content, porosity, degree of water saturation in the rock, and water salinity. Electrical resistivity surveys have been used for many decades in hydrogeological, mining and geotechnical investigations. More recently, they have been used for environmental surveys. Resistivity measurements are normally made by injecting current into the ground through two current electrodes (C1 and C2 in Fig. 2a), and measuring the resulting voltage difference at two potential electrodes (P1 and P2). From the current (I) and voltage (V) values, an apparent resistivity (pa) value is calculated (M. H. Loke, 1999). pa = k V / I Where, k is the geometric factor which depends on the arrangement of the four electrodes. Resistivity meters normally give a resistance value, R = V/I, so in practice the apparent resistivity value is calculated by pa = k R
1137World Environmental and Water Resources Congress 2010:Challenges of Change. © 2010 ASCE
3
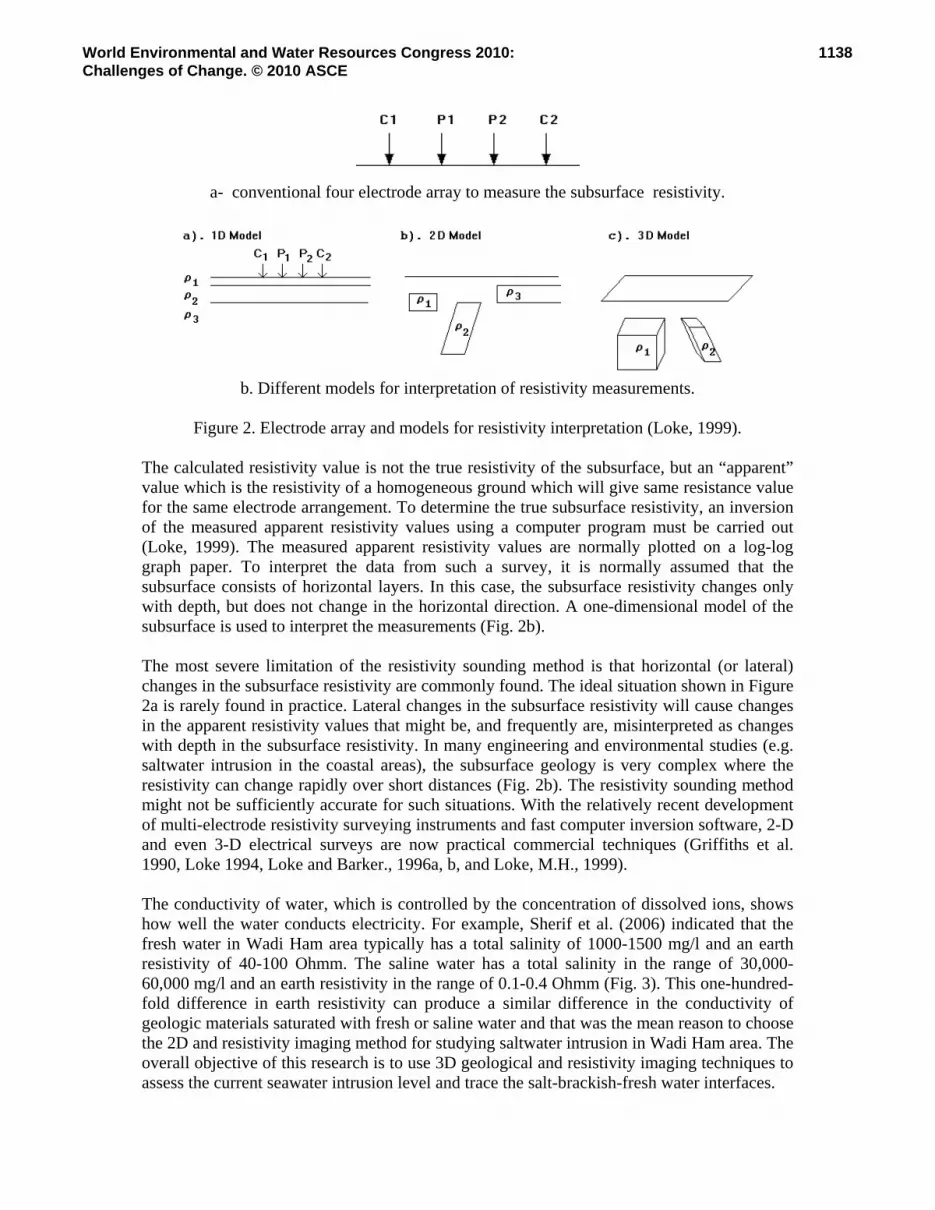
a- conventional four electrode array to measure the subsurface resistivity.
b. Different models for interpretation of resistivity measurements.
Figure 2. Electrode array and models for resistivity interpretation (Loke, 1999).
The calculated resistivity value is not the true resistivity of the subsurface, but an “apparent” value which is the resistivity of a homogeneous ground which will give same resistance value for the same electrode arrangement. To determine the true subsurface resistivity, an inversion of the measured apparent resistivity values using a computer program must be carried out (Loke, 1999). The measured apparent resistivity values are normally plotted on a log-log graph paper. To interpret the data from such a survey, it is normally assumed that the subsurface consists of horizontal layers. In this case, the subsurface resistivity changes only with depth, but does not change in the horizontal direction. A one-dimensional model of the subsurface is used to interpret the measurements (Fig. 2b). The most severe limitation of the resistivity sounding method is that horizontal (or lateral) changes in the subsurface resistivity are commonly found. The ideal situation shown in Figure 2a is rarely found in practice. Lateral changes in the subsurface resistivity will cause changes in the apparent resistivity values that might be, and frequently are, misinterpreted as changes with depth in the subsurface resistivity. In many engineering and environmental studies (e.g. saltwater intrusion in the coastal areas), the subsurface geology is very complex where the resistivity can change rapidly over short distances (Fig. 2b). The resistivity sounding method might not be sufficiently accurate for such situations. With the relatively recent development of multi-electrode resistivity surveying instruments and fast computer inversion software, 2-D and even 3-D electrical surveys are now practical commercial techniques (Griffiths et al. 1990, Loke 1994, Loke and Barker., 1996a, b, and Loke, M.H., 1999). The conductivity of water, which is controlled by the concentration of dissolved ions, shows how well the water conducts electricity. For example, Sherif et al. (2006) indicated that the fresh water in Wadi Ham area typically has a total salinity of 1000-1500 mg/l and an earth resistivity of 40-100 Ohmm. The saline water has a total salinity in the range of 30,000-60,000 mg/l and an earth resistivity in the range of 0.1-0.4 Ohmm (Fig. 3). This one-hundred-fold difference in earth resistivity can produce a similar difference in the conductivity of geologic materials saturated with fresh or saline water and that was the mean reason to choose the 2D and resistivity imaging method for studying saltwater intrusion in Wadi Ham area. The overall objective of this research is to use 3D geological and resistivity imaging techniques to assess the current seawater intrusion level and trace the salt-brackish-fresh water interfaces.
1138World Environmental and Water Resources Congress 2010:Challenges of Change. © 2010 ASCE

4
y = -0.6529x + 4.1319R2 = 0.8348
0
1
2
3
4
5
6
-2 -1 0 1 2 3
Logarithm (earth resistivity)
Loga
rrith
m (T
DS)
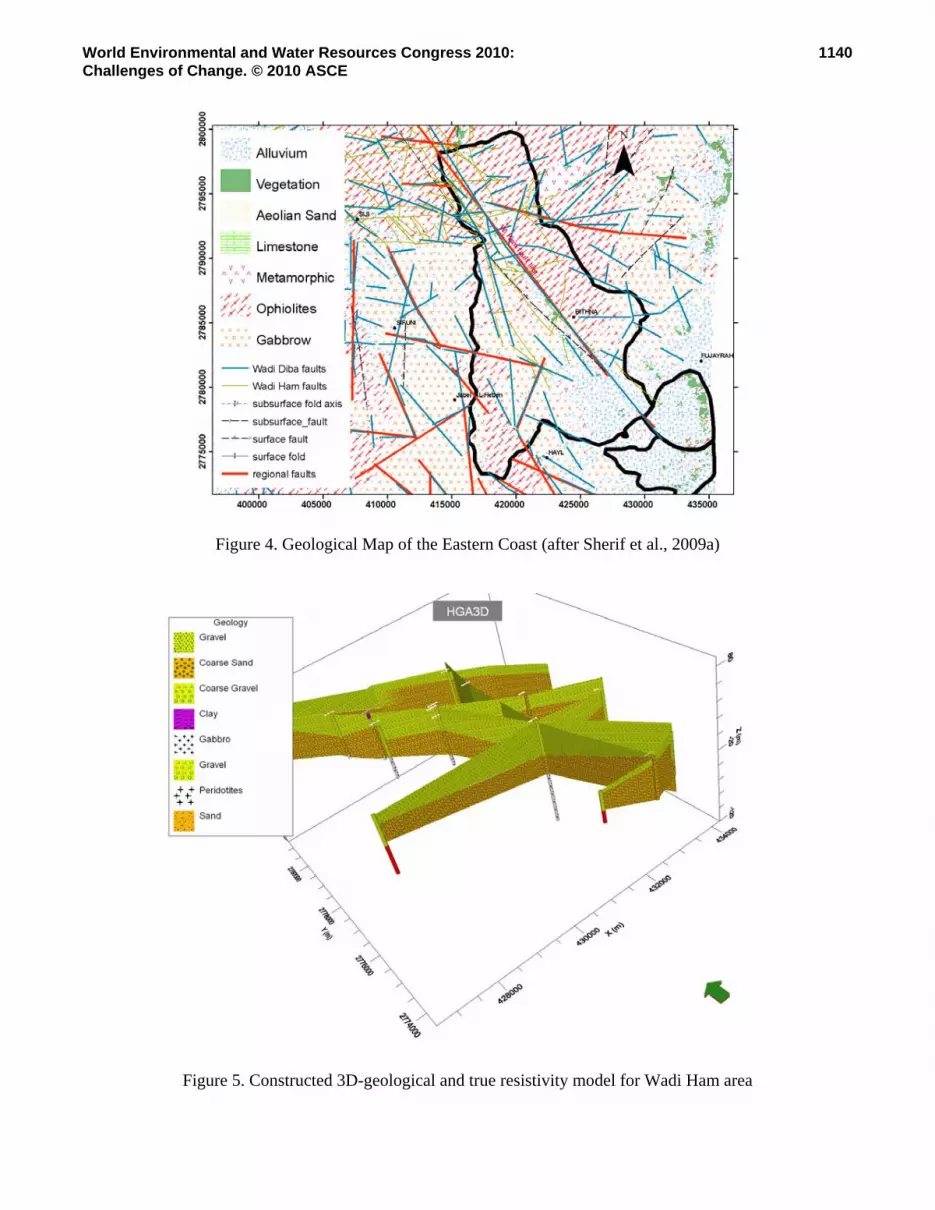
Figure 3. Empirical relationship between TDS (mg/l) and earth resistivity (Ohm m) in Wadi Ham (after Sherif et al., 2006). Geological and Hydrogeological Setting In general, Wadi Ham area is dominated in its upper part by the Masafi mountains and by alluvial plains in its lower part. The lower plains of wadi Ham composed of recent Pleistocene wadi gravels. This layer is underlain by the consolidated rocks of the Semail formation (Ophiolite sequence) with a mantle of fractured zones at some locations, Figure 4. The wadi gravels are poorly sorted subrounded to sub-angular. The degree of consolidation varies from recent uncemented sandy gravel to the older well cemented and consolidated gravels. Clastics size ranges from silt grade to boulder sized material with a very high sand content. The gravels are typically composed of basic igneous clasts with other clasts of very well cemented sandstone and conglomerates (Sir Williams Halcrow, 1969). The drilling information and data of the existing well and boreholes were used to construct several subsurface cross sections along different directions using Hydrogeoanalyist software, Figure 5. The thickness of wadi gravel varies from 15m to 100m (from the upstream side of the dam to the coast). The minimum thickness is found in the area of well number BHF-19, at the upstream of wadi Ham dam and close to the mountain series. The maximum thickness is observed in the area of well number BHF-14 which is very close to the coast of Oman Gulf. The cross-sectional depth of wadi gravels and sand along the wadi course varies from 45 m to 64m. Based on interpretation of the data and other available information (Fig. 5), two aquifers can be identified, namely the Quaternary aquifer which is composed of wadi gravels and constitutes the main aquifer and the fractured Ophiolite which is of low groundwater potentiality. The gravels are highly permeable, and variable in hydraulic properties the upstream part. They tend to be unconsolidated at the ground surface, becoming better cemented and consolidated with depth increase. Electrowatt (1980) subdivided them into recent gravels, being slightly silty sand gravel with some cobbles; young gravels, which are silty sandy gravels with many cobbles and boulders and finally old gravels, which are silty sandy gravels with many cobbles and boulders which are weathered and cemented. Values of the hydraulic conductivity of the unconsolidated gravels tend to be very high, typically being 6 to 17 m/day and in the range 0.086-0.86 m/day for the cemented lower layers (Electrowatt, 1981, ENTEC, 1996).
1139World Environmental and Water Resources Congress 2010:Challenges of Change. © 2010 ASCE
5
Figure 4. Geological Map of the Eastern Coast (after Sherif et al., 2009a)
Figure 5. Constructed 3D-geological and true resistivity model for Wadi Ham area
1140World Environmental and Water Resources Congress 2010:Challenges of Change. © 2010 ASCE

6
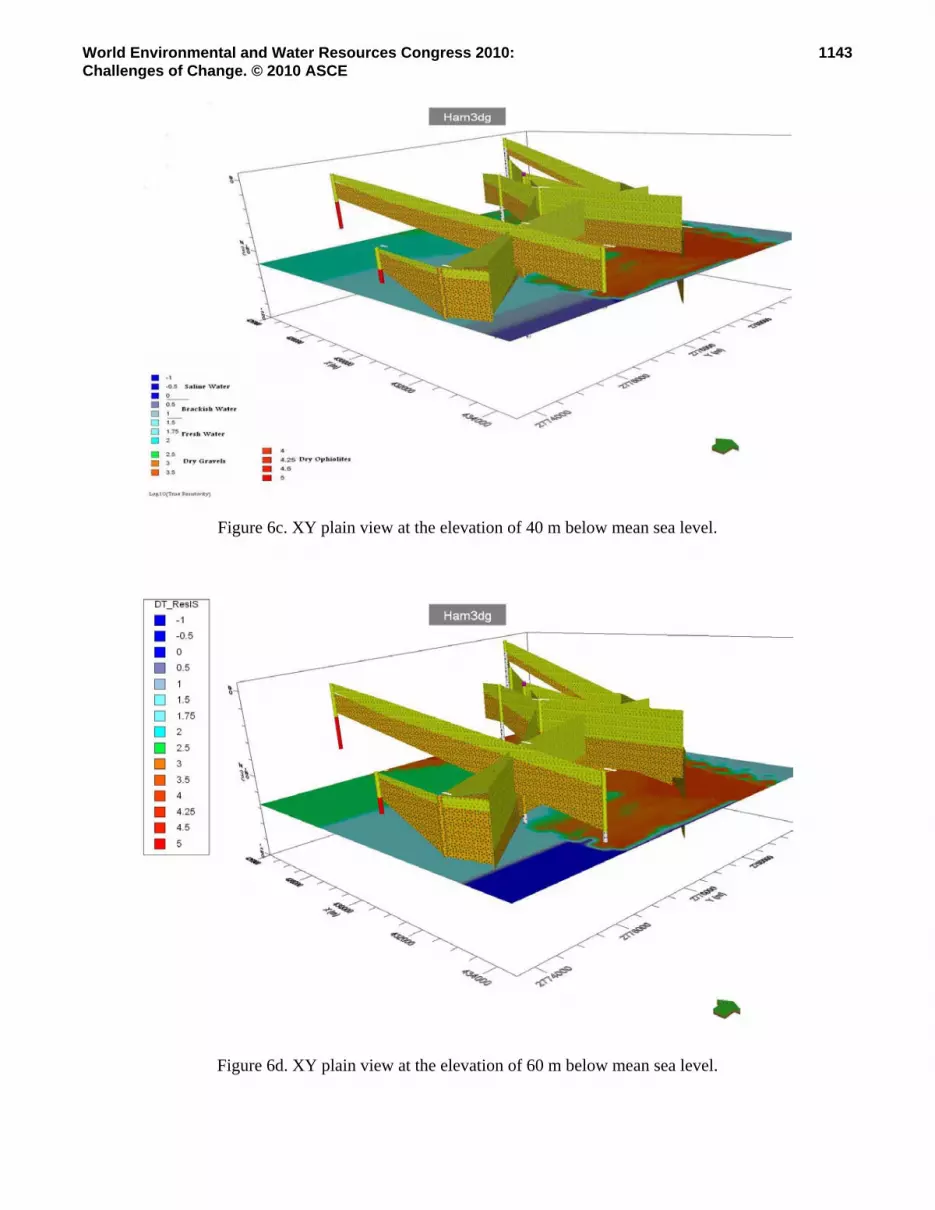
Digital 3D Geological and True Earth Resistivity Modeling The true 3D modeling of geological structures has not been used in regional and local assessment except in the field of economic geology. The required geological information (e.g. drilling information and geological and hydrogeological parameters) is not available at least to the desired and appropriate extent for regional statistically based interpolation. In most cases, geological 3D modeling is based on statistical or geostatistical interpolation between stratified scattered boreholes. Such methods might be inadequate in this specific areas because they will lead to a reduced heterogeneity and loss of the “real world” setting of the lithostratigraphic layers. The complex structural setting of the Quaternary sediments can not be represented correctly following the geostatistical approach only (Wycisk et al., 2005). In this study, a 3D geological and 3D true resistivity-depth model of the outlet area of Wadi Ham was built using Hydrogeoanalyist Software developed by Schlumberger Water Service (Sherif et al., 2009b). The software was used to develop several mapping of the geological system and the water quality in the area of Wadi Ham. The developed 3D geological (Fig. 5) and true resistivity model of this area allows different types of visualization as well as the tracing of the fresh, brackish, and saline water type zones calculations (Figs. 6a-c). The provided information by the digital subsurface 3D models is of specific interest in the fields of groundwater flow modeling and water resources management. Such results might also be important for environmental impact assessment of any future development plans related to groundwater resources. Discussion of Results The inverted earth resistivity in the area of Wadi Ham ranged between 0.1 Ohm m for gravels and/or coarse sand which is saturated with saline water (TDS approximately 70,000 mg/l) to 30,000 Ohm m for dry gravels and sand near the surface and/or dry Ophiolites in the basement. Figure 6a indicates the existence of intensive saltwater intrusion in the eastern and south eastern parts of the study area (dark blue). In this area the thickness of the fresh water zone near the seaside boundary is less than 5 m (from elevation of -40 to -45) overlays a zone of brackish water approximately 15 m thick. The brackish water zone in the southeastern part of Wadi Ham alluvial fan is overlying a relatively thick (not less than 50m) saline zone extending in the alluvium gravels and the underlying weathered Ophiolits. It should be noted that the saturated weathered Ophiolites in these areas gives the same range of resistivity as gravels saturated with brackish water. The Ophiolite layer with low permeability might not have good hydraulic connection with the overlaying gravel layer and possibly have a better quality water originated from infiltration of rain water in the upstream areas. This layer may also be saturated with saline water but still have the resistivity range of gravels saturated with brackish water due to its very low permeability if compared with gravels. The sediments lying above the elevation of mean sea levels are dry and give high earth resistivity (Fig. 6b). At an elevation of -40 m, the saline water zone is extending more than 2 km westward from the shoreline (Fig. 6c) and then followed by 2 km where at that elevation, the sediments are saturated with brackish water. The sediments lying at that elevation and at a distance of not less than 4 km westward from the shoreline are saturated with fresh water (if not dry). The dark brown color represents dry Ophiolite formation.
1141World Environmental and Water Resources Congress 2010:Challenges of Change. © 2010 ASCE

7
Figure 6a. 3D true earth resistivity model
Figure 6b. XY plain view at the mean sea level elevation.
1142World Environmental and Water Resources Congress 2010:Challenges of Change. © 2010 ASCE
8
Figure 6c. XY plain view at the elevation of 40 m below mean sea level.
Figure 6d. XY plain view at the elevation of 60 m below mean sea level.
1143World Environmental and Water Resources Congress 2010:Challenges of Change. © 2010 ASCE

9
At an elevation of -60 m, the saline water zone extends for more than 3 km westward from the shoreline (Fig. 6d) and then followed by 0.5 km where at that elevation, the sediments are saturated with brackish water. Conclusions Field investigations and measurements revealed the nature and extend of the seawater intrusion in the coastal aquifer of Wadi Ham, UAE. In this paper, 3D geological and true earth resistively modeling were presented for the coastal aquifer of Wadi Ham, UAE using the 3D interface of Hydrogeoanalyist Software. Different 2D and 3D sceneries were developed to represent the geological system and assess the extension of the seawater intrusion at the outlet area of Wadi Ham. The combination of earth resistivity survey results, existing geological information and hydro geochemistry aspects provided a quantitative figure about the seawater intrusion in Wadi Ham. However, detailed and intensive 2D and 3D resistivity imaging survey are still needed to cover the outlet area of Wadi Ham and give a better understanding about the extension and possible movement of the transition zone. References Al Hamadi, M.K., 2003. Assessment of Groundwater Resources Using Remote Sensing and GIS, M.Sc. Thesis, Water Resources Program, UAE University, UAE. Electrowatt Engineering Services Ltd.(1980). Wadi Ham Dam for Groundwater Recharge and Loss Prevention, Preliminary Report, Ministry of Agriculture and Fisheries, UAE Electrowatt Engineering Services Ltd. (1981). Wadi Ham Dam and Groundwater Recharge Facilities, Volume I Design, Ministry of Agriculture and Fisheries, UAE. Entec Europe Limited (ENTEC), 1996. Survey on Groundwater Recharge and Flow in Wadi Ham. Volum1 1, Ministry of Agriculture and Fisheries, UAE. Griffiths D.H., Turnbull J. and Olayinka A.I. 1990, Two-dimensional resistivity mapping with a computer- controlled array. First Break 8, 121-129. Loke, M.H., 1994. The inversion of two-dimensional resistivity data. Unpubl. PhD thesis, Univ. of Birmingham. Loke, M.H., 1999. Time-lapse resistivity imaging inversion. Proceedings of the 5th Meeting of the Environmental and Engineering Geophysical Society European Section, Em1. Loke M.H. and Barker R.D.,1996a. Rapid least-squares inversion of apparent resistivity pseudosections using a quasi-Newton method. Geophysical Prospecting, 44, 131-152. Loke M.H. and Barker R.D.,1996b. Practical techniques for 3D resistivity surveys and data inversion. Geophysical Prospecting, 44, 499-523. Sherif M.M, El Mahmoudi A., Garamoon H., Kacimov A., Akram S., Ebraheem A.and Shetty A.(2006). Geoelectrical and Hydrogeochemical Studies for Delineating Seawater Intrusion in the outlet of Wadi Ham, UAE, Environmental Geology, 49: 536 – 551.
1144World Environmental and Water Resources Congress 2010:Challenges of Change. © 2010 ASCE

10
Sherif and Kacimov (2009a). Simulation of Groundwater Recharge Possibilities in the Coastal Aquifers of UAE as a Precursor for Water Resources Management. Department of Civil and Environmental Engineering, UAE University, Al Ain. Personnel communications. Sherif. M.M., A.M. Ebraheem, M.M. Al Mulla (2009b). Water Resources Evaluation of UAE: Current Situation and future Demands. Internal Report. Ministry of Environment and Water, Dubai, UAE. Sir Williams Halcrow & Partners, 1969. Water Resources of Trucial States. Internal report. Ministry of Agriculture and Fisheries, Dubai, UAE.
1145World Environmental and Water Resources Congress 2010:Challenges of Change. © 2010 ASCE