thesis title - university of surrey
TRANSCRIPT
User aspects in synchronousvisualisation of multiple photo
streams
Sam Zargham
Submitted for the Degreeof Doctor of Philosophy
from theUniversity of Surrey
Centre for Vision, Speech and Signal ProcessingFaculty of Engineering and Physical Sciences
University of SurreyGuildford, Surrey GU2 7XH, U.K.
April 2015
c© Sam Zargham 2016
i
Abstract
Photo sharing is becoming a common way of maintaining closeness and relation-
ships with friends and family, and it can evoke pleasurable, enjoyable and exciting
experiences. People have fun when sharing photos containing pleasant scenes or
friends being caught doing something interesting. There has been a recent in-
crease in studies that focus on the visualisation and sharing of photos using online
services or sharing in the home environment using different digital technologies.
Although previous studies have focussed on the important issues of photo sharing
and visualisation, there is a dearth of research aimed at designing applications that
enable people to share and visualise multiple photo streams that originate from
multiple sources such as different people or capture devices. In addition, there is a
lack of research that links new applications for photo sharing with user experience
and the applications’ value to the user.
This thesis, firstly, offers a new design for synchronous sharing and visualisation of
multiple photo streams using temporal and social metadata. Moreover, different
features, called transition modes, were added to the system to give a better experi-
ence within the system. The experience of photo sharing, however, does not exist
without any connection to people or events; it is a social experience depending on
people, places and time. Hence, an experimental study was conducted with twenty
users, and the results demonstrate high user demand for concurrent presentation
of multiple media streams as well as recommended transitions for extending its po-
tential. In the second phase of this thesis, the temporal aspects of multiple photo
streams such as manual transition, continuity detection and user desired time were
designed and implemented. Following that, the results of the user study demon-
strate good comprehension of the users’ own and shared photo streams, and their
temporal structure, even when presented at relatively high speeds. Users were
easily able to contextualise events, recall specific photos and find them using the
proposed interface. The final interface is built from the lessons that were learned
from the first two phases of this study. In this version, the user was able to share
their photos in real time and see them in an ambient display. Our final system for
real-time photo sharing as an ambient display was tested in three different trials
with three different user groups consisting of extended family, close friends and
workplace colleagues. The results showed high user interest for extended family
members and in the workplace environment.
Acknowledgements
Completing a PhD has been a long-standing goal of mine and was only achieved
with the great support of some fabulous people that I have met.
My sincerest thanks are due to the many people in the Department of Electronics
and DWRC who have helped me get to the finish line. Specifically, I would like to
thank Professor David Frohlich who helped me to start my PhD and supervised
me throughout.
I would like to thank Dr Janko Calic who supervised me and supported me in the
hardest times during my PhD. He was not just a supervisor; he was a life teacher
who taught me lots of things all these years.
Thanks also go to Dr Abigail Sellen and Microsoft Research for providing me with
the research tools to conduct my user studies. Moreover, I am grateful to all the
participants who kindly agreed to take part in my studies and who shared their
photos via our systems.
I would like specially to thank Diana and Iraj who have supported me throughout
my life. I also would like to thank Mojdeh and all my friends for their loving
support and patience all these years.
This thesis is dedicated to Maman, Baba and Hatooyi from the bottom of my
heart.
Finally, I would like to add my favourite lines from Sohrab Sepehri, a Persian poet:
“One must wash eyes, look differently to things words must be washed. The word
must be wind itself, the word must be the rain itself. Life is nothing that might
from my mind and your mind in the tip of habit’s shelf. Life is a strange sense
experienced by a migrating bird. Life is finding a penny in the street gutter. Life
is the earth multiplied in our heartbeats.”
ii
Contents
Acknowledgements ii
Contents iii
List of Figures vii
List of Tables xi
1 Introduction 1
1.1 Introduction . . . . . . . . . . . . . . . . . . . . . . . . . . . . . . . 1
1.2 Motivation and research gaps . . . . . . . . . . . . . . . . . . . . . 3
1.3 Research questions . . . . . . . . . . . . . . . . . . . . . . . . . . . 4
1.4 Research objectives . . . . . . . . . . . . . . . . . . . . . . . . . . . 5
1.5 Contribution of the research . . . . . . . . . . . . . . . . . . . . . . 6
1.6 Structure of the thesis . . . . . . . . . . . . . . . . . . . . . . . . . 7
1.7 Published work . . . . . . . . . . . . . . . . . . . . . . . . . . . . . 8
2 Literature Review 10
2.1 Introduction . . . . . . . . . . . . . . . . . . . . . . . . . . . . . . . 10
2.2 Digital path of photography . . . . . . . . . . . . . . . . . . . . . . 10
2.3 Approach to study digital photography . . . . . . . . . . . . . . . . 11
2.4 Capture . . . . . . . . . . . . . . . . . . . . . . . . . . . . . . . . . 13
2.5 Visualisation . . . . . . . . . . . . . . . . . . . . . . . . . . . . . . . 16
2.5.1 Layouts for visualisation of photo collections . . . . . . . . . 16
2.5.2 Levels of interaction with the display . . . . . . . . . . . . . 23
2.5.3 Size of the display . . . . . . . . . . . . . . . . . . . . . . . . 25
2.6 Management of photo collections . . . . . . . . . . . . . . . . . . . 26
2.7 Summarisation of photo collections . . . . . . . . . . . . . . . . . . 32
2.8 Photo sharing . . . . . . . . . . . . . . . . . . . . . . . . . . . . . . 35
2.9 Summary . . . . . . . . . . . . . . . . . . . . . . . . . . . . . . . . 44
3 Methods 49
3.1 Introduction . . . . . . . . . . . . . . . . . . . . . . . . . . . . . . . 49
3.2 Iterative research and design . . . . . . . . . . . . . . . . . . . . . . 49
3.2.1 Interaction design . . . . . . . . . . . . . . . . . . . . . . . . 49
iii
3.2.2 Systems development lifecycle model . . . . . . . . . . . . . 51
3.3 Design methods . . . . . . . . . . . . . . . . . . . . . . . . . . . . . 55
3.3.1 Design and prototyping . . . . . . . . . . . . . . . . . . . . . 55
3.3.2 Implementation . . . . . . . . . . . . . . . . . . . . . . . . . 56
3.4 Research methods . . . . . . . . . . . . . . . . . . . . . . . . . . . . 57
3.4.1 Qualitative research . . . . . . . . . . . . . . . . . . . . . . . 57
3.4.2 Data gathering techniques . . . . . . . . . . . . . . . . . . . 59
3.4.3 Data analysis . . . . . . . . . . . . . . . . . . . . . . . . . . 63
3.5 Ethics . . . . . . . . . . . . . . . . . . . . . . . . . . . . . . . . . . 66
4 Synchronous visualisation of multiple photo streams 67
4.1 Introduction . . . . . . . . . . . . . . . . . . . . . . . . . . . . . . . 67
4.2 System design . . . . . . . . . . . . . . . . . . . . . . . . . . . . . . 68
4.2.1 Single-window slideshow . . . . . . . . . . . . . . . . . . . . 70
4.2.2 Multiple-window slideshow . . . . . . . . . . . . . . . . . . . 73
4.2.3 Upload page . . . . . . . . . . . . . . . . . . . . . . . . . . . 76
4.2.4 Transitions . . . . . . . . . . . . . . . . . . . . . . . . . . . 76
4.3 Implementation . . . . . . . . . . . . . . . . . . . . . . . . . . . . . 77
4.3.1 System architecture . . . . . . . . . . . . . . . . . . . . . . 77
4.3.2 Structure of the database . . . . . . . . . . . . . . . . . . . 78
4.3.3 Transitions . . . . . . . . . . . . . . . . . . . . . . . . . . . 79
4.4 Summary . . . . . . . . . . . . . . . . . . . . . . . . . . . . . . . . 81
5 User experience study of multiple photo stream visualisation 82
5.1 Introduction . . . . . . . . . . . . . . . . . . . . . . . . . . . . . . . 82
5.2 Participants and tasks . . . . . . . . . . . . . . . . . . . . . . . . . 83
5.3 Procedure . . . . . . . . . . . . . . . . . . . . . . . . . . . . . . . . 86
5.4 Data analysis . . . . . . . . . . . . . . . . . . . . . . . . . . . . . . 87
5.5 Results . . . . . . . . . . . . . . . . . . . . . . . . . . . . . . . . . . 87
5.5.1 Current photography practice . . . . . . . . . . . . . . . . . 87
5.5.2 User experience . . . . . . . . . . . . . . . . . . . . . . . . . 92
5.6 Summary and discussion . . . . . . . . . . . . . . . . . . . . . . . . 113
6 Temporal aspects of photo stream visualisation 119
6.1 Introduction . . . . . . . . . . . . . . . . . . . . . . . . . . . . . . . 119
6.2 Design and implementation . . . . . . . . . . . . . . . . . . . . . . 120
6.2.1 Upload page . . . . . . . . . . . . . . . . . . . . . . . . . . . 122
6.2.2 Display . . . . . . . . . . . . . . . . . . . . . . . . . . . . . 122
6.2.3 Transition modes . . . . . . . . . . . . . . . . . . . . . . . . 124
6.3 System architecture . . . . . . . . . . . . . . . . . . . . . . . . . . . 132
6.4 Summary . . . . . . . . . . . . . . . . . . . . . . . . . . . . . . . . 134
7 Study of temporal aspects in photo stream visualisation 137
7.1 Introduction . . . . . . . . . . . . . . . . . . . . . . . . . . . . . . . 137
7.2 Manual transitions . . . . . . . . . . . . . . . . . . . . . . . . . . . 138
7.2.1 Method . . . . . . . . . . . . . . . . . . . . . . . . . . . . . 138
7.2.2 Results . . . . . . . . . . . . . . . . . . . . . . . . . . . . . . 141
7.3 Evaluation of continuity detection . . . . . . . . . . . . . . . . . . . 150
7.3.1 Method . . . . . . . . . . . . . . . . . . . . . . . . . . . . . 151
7.3.2 Accuracy of algorithms . . . . . . . . . . . . . . . . . . . . . 151
7.3.3 Continuity transition mode use . . . . . . . . . . . . . . . . 154
7.4 Evaluation of desired time transitions . . . . . . . . . . . . . . . . . 154
7.4.1 Comparison of logarithmic and summarisation desired time . 154
7.4.2 User experience of summarisation and logarithmic desiredtime . . . . . . . . . . . . . . . . . . . . . . . . . . . . . . . 157
7.5 Summary and discussion . . . . . . . . . . . . . . . . . . . . . . . . 158
8 4Streams: An ambient photo sharing application 161
8.1 Introduction . . . . . . . . . . . . . . . . . . . . . . . . . . . . . . . 161
8.2 Design . . . . . . . . . . . . . . . . . . . . . . . . . . . . . . . . . . 162
8.2.1 Upload . . . . . . . . . . . . . . . . . . . . . . . . . . . . . . 163
8.2.2 Display . . . . . . . . . . . . . . . . . . . . . . . . . . . . . 164
8.3 Implementation . . . . . . . . . . . . . . . . . . . . . . . . . . . . . 169
8.3.1 System architecture . . . . . . . . . . . . . . . . . . . . . . . 169
8.3.2 Facebook API and authentication with C# . . . . . . . . . . 170
8.3.3 Developing tool . . . . . . . . . . . . . . . . . . . . . . . . . 172
8.3.4 Interaction logs . . . . . . . . . . . . . . . . . . . . . . . . . 173
8.4 Pilot study . . . . . . . . . . . . . . . . . . . . . . . . . . . . . . . 174
8.4.1 Procedure . . . . . . . . . . . . . . . . . . . . . . . . . . . . 174
8.4.2 Results . . . . . . . . . . . . . . . . . . . . . . . . . . . . . . 174
8.5 Summary . . . . . . . . . . . . . . . . . . . . . . . . . . . . . . . . 177
9 Field study of 4Streams 179
9.1 Introduction . . . . . . . . . . . . . . . . . . . . . . . . . . . . . . . 179
9.2 Trial 1: Extended family group . . . . . . . . . . . . . . . . . . . . 180
9.2.1 Participants . . . . . . . . . . . . . . . . . . . . . . . . . . . 180
9.2.2 Initial setup . . . . . . . . . . . . . . . . . . . . . . . . . . . 181
9.3 Data collection and analysis . . . . . . . . . . . . . . . . . . . . . . 184
9.3.1 Results . . . . . . . . . . . . . . . . . . . . . . . . . . . . . . 184
9.4 Trial 2: Friends group . . . . . . . . . . . . . . . . . . . . . . . . . 212
9.4.1 Participants . . . . . . . . . . . . . . . . . . . . . . . . . . . 212
9.4.2 Initial setup . . . . . . . . . . . . . . . . . . . . . . . . . . . 213
9.4.3 Results . . . . . . . . . . . . . . . . . . . . . . . . . . . . . . 214
9.5 Trial 3: Workplace group . . . . . . . . . . . . . . . . . . . . . . . . 223
9.5.1 Participants . . . . . . . . . . . . . . . . . . . . . . . . . . . 223
9.5.2 Initial setup . . . . . . . . . . . . . . . . . . . . . . . . . . . 224
9.5.3 Results . . . . . . . . . . . . . . . . . . . . . . . . . . . . . . 226
9.6 Summary and discussion . . . . . . . . . . . . . . . . . . . . . . . . 243
10 Conclusion 249
10.1 Introduction . . . . . . . . . . . . . . . . . . . . . . . . . . . . . . . 249
10.2 Conclusions . . . . . . . . . . . . . . . . . . . . . . . . . . . . . . . 249
10.2.1 Values and requirements of sharing and visualisation of pastphoto streams by a small group of friends . . . . . . . . . . 250
10.2.2 Determination of optimal temporal parameters for the visu-alisation of multiple photo streams . . . . . . . . . . . . . . 252
10.2.3 User experience of ambient visualisation of multiple photostreams within small groups of people . . . . . . . . . . . . . 254
10.2.4 Design recommendations for photo sharing applications . . . 255
10.3 Limitations . . . . . . . . . . . . . . . . . . . . . . . . . . . . . . . 257
10.4 Future work . . . . . . . . . . . . . . . . . . . . . . . . . . . . . . . 258
10.4.1 Investigation of passive photography values using our system 258
10.4.2 Combining passive and active photography . . . . . . . . . . 258
10.4.3 Designing and studying our application for smaller screenssuch as mobile phones . . . . . . . . . . . . . . . . . . . . . 259
10.4.4 Adding implicit or subtle interaction for larger screens inhome or workplace environments . . . . . . . . . . . . . . . 259
10.4.5 Increasing the number of photo sharers on the display . . . . 260
10.4.6 Organisation of multiple photo streams . . . . . . . . . . . . 261
10.4.7 Adding other media such as video and audio to our system . 261
A Appendix 262
Bibliography 272
List of Figures
2.1 The stages of photowork from [? ] . . . . . . . . . . . . . . . . . . 12
2.2 Passive camera: SenseCam [1]. . . . . . . . . . . . . . . . . . . . . . 15
2.3 Audio camera [2]. . . . . . . . . . . . . . . . . . . . . . . . . . . . . 16
2.4 Tile layout examples for visualisation of photo collections. Left:Time Quilt [3], Bottom: FreeEye [4] and Right: Tree Browser [5]. . 18
2.5 Collage presentation layouts. Bottom is from Digital Tapestry [6]and top is from Wang et al. [7]. . . . . . . . . . . . . . . . . . . . . 19
2.6 Tiling slideshow [8]. . . . . . . . . . . . . . . . . . . . . . . . . . . . 20
2.7 Mobile phone photo visualisation [9]. . . . . . . . . . . . . . . . . . 21
2.8 The comic-like photo story of a video. Obtained from [10]. . . . . . 22
2.9 Four interaction phases facilitating transitions from implicit to ex-plicit and public to personal interactions [11]. . . . . . . . . . . . . 23
2.10 Time-base clustering technique used in the AutoAlbum system [12]. 28
2.11 SIFT matching between two similar images captured from differentangles. . . . . . . . . . . . . . . . . . . . . . . . . . . . . . . . . . . 30
2.12 Google Deep Learning technique examples [13]. . . . . . . . . . . . 32
2.13 Example of the relationship between near-duplicate photos for se-lection of the most representative photo. Obtained from [14]. . . . . 34
2.14 Main elements of photo sharing and their relationships [2]. . . . . . 36
2.15 Screenshot of the Mobiphos interface with the thumbnail timeline inmid-animation. The viewfinder is at the top-right and thumbnailsare along the left and bottom of the display. The coloured borderon the images indicates who captured the photo [15]. . . . . . . . . 38
2.16 4photos prototype [16]. . . . . . . . . . . . . . . . . . . . . . . . . . 39
2.17 Interface of the co-present photo sharing application [17]. . . . . . 40
2.18 Mobshare [18] interface (top) and MMM2 interface (bottom). . . . . 41
2.19 Display designed for sharing photos from small groups for use byelderly people [19]. . . . . . . . . . . . . . . . . . . . . . . . . . . . 42
2.20 An interface for sharing and adjusting photos from multiple cap-ture sources at the same event. Top: Unified cluster. Bottom:Rearranged cluster. Taken from [18]. . . . . . . . . . . . . . . . . . 43
2.21 Summary of the study approach for digital photography covered inthis literature review. . . . . . . . . . . . . . . . . . . . . . . . . . . 44
3.1 Simple lifecycle model for interaction design [20]. . . . . . . . . . . 51
3.2 Lifecycle model for systems development. . . . . . . . . . . . . . . . 52
vii
3.3 Low- vs. high-fidelity prototype example [21]. . . . . . . . . . . . . 56
3.4 Example of our implemented applications. Top-right: C# andHTML (Phase 1), top-left: C# and HTML (Phase 1), bottom-left:MATLAB (Phase 2), bottom-right: C# (Phase 3). . . . . . . . . . . 57
4.1 Slideshow process of single-window slideshow and multiple-windowslideshow. After uploading the photos by the client, contextualmetadata are stored in the database and the photos are orderedby time. The user, then, chooses the date/time, other users andtransition type to view the slideshow. To try, follow this link:http://www.samzargham.com. . . . . . . . . . . . . . . . . . . . . 71
4.2 Example of the single-window slideshow. . . . . . . . . . . . . . . . 72
4.3 Single-window slideshow interface. . . . . . . . . . . . . . . . . . . . 73
4.4 Multiple-window slideshow interface. . . . . . . . . . . . . . . . . . 74
4.5 Example of how the multiple-window slideshow works. . . . . . . . 74
4.6 Multiple-window slideshow positions with two, three and four users. 75
4.7 Upload page of the system as a conventional depiction of a photocollection. . . . . . . . . . . . . . . . . . . . . . . . . . . . . . . . . 76
4.8 Architecture of the system. . . . . . . . . . . . . . . . . . . . . . . . 79
4.9 Structure of the system database. . . . . . . . . . . . . . . . . . . . 80
5.1 Example of photos taken by Group 1 participants. . . . . . . . . . . 95
5.2 Example of Group 2 photos. . . . . . . . . . . . . . . . . . . . . . . 97
5.3 Example of family group photos. . . . . . . . . . . . . . . . . . . . 98
5.4 Sample of collocated experience in a multiple-window slideshow. . . 103
5.5 Example of remote experience in a multiple-window slideshow. . . . 104
5.6 User preferences of transition types. . . . . . . . . . . . . . . . . . . 112
6.1 Twin photo stream interface used in the study. . . . . . . . . . . . . 124
6.2 The proportional function with the difference of (ti) from 1 to 1000and the coefficient between 1 to 1000 . . . . . . . . . . . . . . . . . 126
6.3 The function of the logarithm with the difference of (ti) between 1to 1000 and the base of the logarithm between 1 to 1000 . . . . . . 127
6.4 Summarisation process of redundant photos, where the user selectedfive seconds as a total slideshow time for ten photos and the tran-sition between slides was set to one second. . . . . . . . . . . . . . . 130
6.5 Selection of the most representative photo in an event using ouralgorithm. . . . . . . . . . . . . . . . . . . . . . . . . . . . . . . . . 132
6.6 System architecture. . . . . . . . . . . . . . . . . . . . . . . . . . . 134
7.1 Summarised photo streams of two people and the visual clue. . . . . 141
7.2 Average total slideshow time. . . . . . . . . . . . . . . . . . . . . . 143
7.3 Participant preferences in the manual transition mode. . . . . . . . 145
7.4 Positive recollection score of what happened next in the user’s andthe researcher’s photo stream. . . . . . . . . . . . . . . . . . . . . . 146
7.5 Positive recollection score comparison of what happened next in theuser’s and the researcher’s photo stream between males and females. 148
7.6 Results of the positive recollection of the photo and what happenednext in different transitions. . . . . . . . . . . . . . . . . . . . . . . 148
7.7 The process of the estimation of the continuity between two photos. 152
7.8 Presentation preference for different desired times. . . . . . . . . . . 157
8.1 Sample screenshots of uploading photos using Facebook. . . . . . . 164
8.2 4Streams interface on a Microsoft Surface Pro tablet. . . . . . . . . 165
8.3 4Streams full screen mode. Each slideshow window is dedicated toa user and the users can follow their latest visual status. . . . . . . 166
8.4 4Streams setting mode. . . . . . . . . . . . . . . . . . . . . . . . . . 168
8.5 4Streams single-window slideshow mode. . . . . . . . . . . . . . . . 168
8.6 4Streams architecture. . . . . . . . . . . . . . . . . . . . . . . . . . 169
8.7 Pilot study photo samples. . . . . . . . . . . . . . . . . . . . . . . . 175
9.1 Microsoft Surface Pro tablet. . . . . . . . . . . . . . . . . . . . . . . 182
9.2 Total number of photos sent by each participant. . . . . . . . . . . 188
9.3 Average number of photos uploaded per day in each phase. . . . . . 190
9.4 The number of photos uploaded by each participant in each phase. . 190
9.5 The number of shared photos in each category. . . . . . . . . . . . . 191
9.6 Examples of shared photos in the messages category. . . . . . . . . 192
9.7 Examples of shared photos in the greetings category. . . . . . . . . 193
9.8 Examples of shared photos in the everyday life category. . . . . . . 194
9.9 Examples of shared photos in the special events category. . . . . . . 195
9.10 Examples of shared photos in the funny or aesthetic photos category.196
9.11 Privacy settings at the time of upload in the family group. . . . . . 197
9.12 The number of photos received by D1 and D2 in each phase. . . . . 198
9.13 The number of photos sent in each week by each participant. . . . . 217
9.14 The proportion of shared photos in the close friends group in eachcategory. . . . . . . . . . . . . . . . . . . . . . . . . . . . . . . . . . 217
9.15 The privacy settings for different participants in the close friendsgroup. . . . . . . . . . . . . . . . . . . . . . . . . . . . . . . . . . . 219
9.16 Photos received by our application. . . . . . . . . . . . . . . . . . . 220
9.17 The office environment in this study and the application runningon the LCD screen. . . . . . . . . . . . . . . . . . . . . . . . . . . . 225
9.18 Number of photos sent each week by each participant. . . . . . . . . 228
9.19 Number of shared photos in each category for the workplace group. 229
9.20 Examples of shared photos in the messages category. . . . . . . . . 229
9.21 Example shared photos from the workplace group in the greetingscategory. . . . . . . . . . . . . . . . . . . . . . . . . . . . . . . . . . 230
9.22 Example shared photos from the workplace group in the everydaylife category. . . . . . . . . . . . . . . . . . . . . . . . . . . . . . . . 231
9.23 Example shared photos from the workplace group in the everydaylife category. . . . . . . . . . . . . . . . . . . . . . . . . . . . . . . . 232
9.24 The shared photo in the aesthetic photos category. . . . . . . . . . 232
9.25 Privacy settings of photos uploaded by the workplace group. . . . . 233
9.26 Solitary interaction of a user with 4Streams. . . . . . . . . . . . . . 245
9.27 Social interaction of the user with 4Streams. . . . . . . . . . . . . . 246
10.1 Future interaction with our photo sharing application. Adoptedfrom [22]. . . . . . . . . . . . . . . . . . . . . . . . . . . . . . . . . 260
A.1 The interview guidance of phase 1 for user experience study of mul-tiple/single windows slideshow . . . . . . . . . . . . . . . . . . . . . 263
A.2 Experiment guidance of phase 2 for evaluation of temporal aspectsof multiple photo streams . . . . . . . . . . . . . . . . . . . . . . . 264
A.3 Experiment guidance of phase 2 for evaluation of temporal aspectsof multiple photo streams . . . . . . . . . . . . . . . . . . . . . . . 265
A.4 The form for evaluation of the comprehension in visualisation ofmultiple photo streams . . . . . . . . . . . . . . . . . . . . . . . . . 266
A.5 Interview guidance for phase 3 in the field study of family group . . 267
A.6 Interview guidance for phase 3 in the field study of family group . . 268
A.7 Interview guidance for phase 3 in the field study of family group . . 269
A.8 Ethics approval . . . . . . . . . . . . . . . . . . . . . . . . . . . . . 270
A.9 Ethics approval . . . . . . . . . . . . . . . . . . . . . . . . . . . . . 271

List of Tables
2.1 Clustering performance by [12] . . . . . . . . . . . . . . . . . . . . . 30
5.1 Group 1 participants . . . . . . . . . . . . . . . . . . . . . . . . . . 84
5.2 Group 2 participants . . . . . . . . . . . . . . . . . . . . . . . . . . 84
5.3 Group 3 participants . . . . . . . . . . . . . . . . . . . . . . . . . . 85
5.4 Summary of participants’ information . . . . . . . . . . . . . . . . . 85
7.1 Range of selected parameters for each transition. . . . . . . . . . . . 145
7.2 Average alternation between slideshow windows . . . . . . . . . . . 150
7.3 Accuracy of the proposed algorithms for different photo sizes com-pared to the ground truth . . . . . . . . . . . . . . . . . . . . . . . 153
9.1 Family group participants . . . . . . . . . . . . . . . . . . . . . . . 181
9.2 The structure of the family members and the devices used duringthe study . . . . . . . . . . . . . . . . . . . . . . . . . . . . . . . . 188
9.3 Close-friends group participants . . . . . . . . . . . . . . . . . . . . 213
9.4 Workplace group participants . . . . . . . . . . . . . . . . . . . . . 224
xi
Chapter 1
Introduction
1.1 Introduction
Due to the recent proliferation of multimedia technology, the interest in designing
systems that offer new experiences to the end user is growing. In recent years,
there has been a plethora of applications and services that aim to improve var-
ious aspects of user’s performance and/or experience. In order to achieve these
improvements, it is essential to gain deeper understanding of both human activ-
ities and the technologies that support them. This understanding has become
especially relevant due to the pervasive nature of the technology that surrounds
us; for example, highly complex mobile communication devices, interconnected
sensors all around our homes and the omnipresent displays in our pockets, hands
and streets. We need to learn how to live with emerging technologies and not
just how to use them. Furthermore, in order to design useful systems, we have to
understand people’s activities and the role of technology in those activities [23].
Photography is a long established technology that falls into the broad portfolio of
the ubiquitous technologies that surround us. Nowadays, it is difficult to find peo-
ple who do not capture memorable events from their lives in their personal photos.
Photos are found commonly in bookshelves and in photo frames in different areas
of a house, as well as shared over the Internet and displayed on mobile phones and
1
Chapter 1. Introduction 2
computer screens. Photos and photography have become an integral part of our
everyday life and social activities.
Photography has changed dramatically over the last two decades, making a tran-
sition from the ‘Kodak’ era of film-based capture and printed photos to mobile
cameras and online photo sharing. In line with the evolution of photographic
technology, the way people interact with photos has also changed significantly.
Personal computers, notebooks, tablets, mobile phones and server repositories
have become the new media hubs of digital photography.
Digital technologies have facilitated the expansion of traditional snap-and-print
photo practices to wider range photo-related activities, such as sharing, editing,
storing, displaying, commenting, managing and printing. Additionally, digital
photography has changed some cultural aspects of traditional print photography.
Motivated by seminal approaches to studying practice in digital photography, a
structure is proposed which is derived from [24] and includes key aspects of user
practices in digital photography such as capturing, organising, sharing and vi-
sualisation. With this in mind, there have been a lot of studies that focus on
digital photography and related fields such as capture [25–27], sharing [2, 28, 29],
organisation [30, 31] and visualisation [32–34] of digital photos.
Digital photos play an important role in our lives; digital photos are often used as
means of social interaction [35, 36]. People use photos to share their important as
well as their mundane moments, or to tell stories about their lives. Snapshots are
currently the most commonly used medium to tell the stories of our lives [37].
With this in mind, this thesis focuses on studying existing practices and explores
new ways of personal photo sharing and visualisation in different contexts, from
collocated to remote. In addition, this thesis identifies photo sharing needs, and
offers new means of photo sharing and visualisation platforms targeting small
groups of people, such as friends and family members. Furthermore, this thesis
offers recommendations for the design of future photo sharing systems.
Chapter 1. Introduction 3
1.2 Motivation and research gaps
The research focus on photo sharing and visualisation developed from the chal-
lenges of designing new user experiences of emerging multimedia technologies. In
many existing studies, research on user experience has been directed towards ex-
ploring the requirements related to negative experiences and the problems that
people had with the multimedia systems. The work presented in this thesis aims
at learning about both negative and positive user experiences of emerging mul-
timedia technologies focussing on social interaction, reminiscence, enjoyment and
fun.
Being one of the most prevalent multimedia technologies in people’s everyday lives,
digital photography has been at the centre of this research. People enjoy taking
photos, sharing them with others and also viewing their own or somebody else’s
photos. Thus, photography is one of the most popular contemporary multimedia
experiences, especially in terms of social interactions. Therefore, there is an ob-
vious need to explore people’s experiences of photography and to offer them new
applications and services to improve their private and social lives.
Historically, people used to store their photos in archives and view them occasion-
ally at some later date. After the digital photography revolution, the photographic
medium became so popular that there is virtually nobody who does not view or
take photos on a daily basis; nowadays, photography is ubiquitous [38]. This
growth has been driven by the uptake of point-and-shoot digital cameras and,
more recently, by pervasive camera phones. Due to the proliferation of social me-
dia platforms, digital photo sharing has emerged as a new way of establishing the
chronology of events and of reminiscing forgotten experiences. However, people
still find it difficult to share and visualise the large number of photos obtained
from a variety of sources.
The current literature in the area of digital photography shows that there is a
need for applications offering photo sharing with small groups of people [39], such
as family members and close friends. Moreover, we found that, although several
Chapter 1. Introduction 4
applications have been designed for collocated photo capture and sharing [15] or
photo sharing at the same place and time [16], there is a clear lack of designs that
enable users to view and share multiple photo streams in a single interface, from
different sources at either the same or different times and places.
In addition to sharing, visualisation of photo streams presents another challenge
in existing photographic practices. There have been different methods proposed in
the literature that address visualisation of photo collections [8, 40]; however, there
is virtually no reported research on sharing photos from multiple sources with a
small group of friends.
Having all these aspects of modern photography in mind, the topic of photo sharing
from multiple sources in small user groups has prompted us to explore further new
practices in personal photography, design new applications that support effective
photo sharing and visualisation and, finally, find the dominant factors to user
experience in this domain.
1.3 Research questions
Taking into consideration the aforementioned research context, this thesis ad-
dresses challenges in design and implementation of intuitive and effective user
interfaces for sharing and visualisation of multiple photo streams. These multiple
streams can be sourced from multiple users and/or multiple capturing devices.
This focus stems from an identified research gap in the design of dedicated inter-
active or ambient photo sharing applications aiming to improve user experience of
digital photography.
Due to the user-centric nature of the addressed challenge, aspects of photo capture,
sharing, organisation and visualisation will be investigated to validate the design
and development of photo sharing and visualisation applications, with users at the
centre of attention. Having in mind these issues, the following research questions
guide the research:
Chapter 1. Introduction 5
• What are the values and requirements of sharing and visualising multiple
photo streams?
• What are the optimal temporal parameters for visualisation of multiple photo
streams?
• How can the user experience of ambient multiple photo stream visualisation
within small groups of people be optimised?
• What are the design recommendations for future photo sharing applications?
1.4 Research objectives
The main aim of this research is to study the current practices of sharing and
visualisation of personal photos in the social context; this study will encompass
multiple sources and multiple users. In order to achieve optimal capture of these
practices, the research will adopt the user-centric methods of Human-Computer
Interaction (HCI), coupled with image processing algorithms. This approach en-
ables effective analysis and design innovation targeting user friendly presentation
of multiple photo streams, obtained from different individuals and cameras. In this
research, a wide range of aspects need to be considered in terms of user interface
design and the user experience. Having in mind the research questions outlined in
the previous section, in order to respond to these challenges, the main objectives
of the research presented in this thesis are as follows:
• Use of a phase-based approach to design and implement applications for
sharing and visualising historical photos and live photo updates.
• Design and conduct a user requirements study into visualisation of multiple
photo streams.
• Design and conduct an experimental study into temporal aspects of multiple
photo stream visualisation.
Chapter 1. Introduction 6
• Design and conduct a field study to study the values of ambient photo sharing
display.
1.5 Contribution of the research
Having implemented the research objectives outlined above, this research made
contributions to the HCI community in two ways. Three different designs of a
photo sharing interface were implemented, following the requirements of the tasks
addressed in the three phases of the project. In addition, the designed and imple-
mented system was evaluated through a series of user experience studies.
This focus has been derived from an identified gap in understanding multiple
photo stream visualisation and sharing for small groups of people such as friends
and family members.
The research makes four major contributions:
1. Design and implementation of three systems for visualisation and sharing of
multiple photo streams. The first system embodies the core design concept
of the thesis to visualise synchronously photos sourced from multiple users
in a small group. The second and third systems were redesigned, based on
lessons learned in user studies. All three versions of the applications were
implemented on different platforms.
2. A qualitative study to elicit the user requirements in multiple photo stream
sharing and visualisation.
3. A task-based user experience study to identify the values and usability pa-
rameters of the designed system for multiple photo stream visualisation.
4. A mixed-method study that evaluates user experience of an ambient display
for real-time photo sharing with small groups of people.
Chapter 1. Introduction 7
1.6 Structure of the thesis
As outlined above, the research reported here draws upon three different research
areas: (i) photo sharing and visualisation, (ii) user interface design and implemen-
tation and (iii) user experience studies. Due to the breadth of the methodologies
involved, two review chapters are presented.
Chapter 2 presents a critical review of the relevant literature regarding different
aspects of digital photography and the relevant influencing factors. In addition,
it provides an overview of relevant models and frameworks of digital photogra-
phy in HCI and other disciplines in order to highlight existing deficiencies in our
understanding of digital photography.
Chapter 3 presents a review of the research methods that were used during this
study. Specific characteristics of the research design, data acquisition and data
analysis procedures are discussed.
Chapter 4 provides a description of the first system for sharing and visualisation
of multiple photo streams, focussing on the design, implementation and structure
of a web-based photo sharing application. This application was shaped and built
from the lessons that were learned from the literature review presented in Chapter
2.
Chapter 5 describes the experimental design and results of the first user study,
which focussed on current user practices in personal photography. In addition,
this chapter summarises the derived design requirements for multiple photo stream
applications.
Chapter 6 introduces the challenges of temporal and synchronous visualisation
of multiple photo streams. The focus on temporal aspects was derived from the
user requirements study described in Chapter 5. Thus, this chapter presents the
architecture, design and implementation of a task-based photo sharing application
with different transition modes.
Chapter 1. Introduction 8
Chapter 7 brings the results of the second user study into temporal aspects of
photo stream visualisation. The first part of this chapter comprises an evaluation
of the user interface alongside the manual transitions by designing a multi-stage
task-based user experience study. The second section describes an experimental
study into visual continuity of photo visualisation and its implications for future
designs. Finally, the desired photo transitions are evaluated and compared.
Chapter 8 provides a description of the ‘4Streams’ system, an ambient photo shar-
ing and visualisation display. Based on the design suggestions and requirements
from Chapters 5 and 7, this chapter outlines the design, implementation and struc-
ture of the ‘4Streams’ system.
Chapter 9 presents a comprehensive field study on the use of ‘4Streams’ with small
groups of people. The field study is divided into three main sections. The first
section discusses use of ‘4Streams’ by an extended family group, the second section
focuses its use by a small group of close friends, while the last section reports on
its use by five colleagues in a workplace environment.
Chapter 10 provides the summary of the thesis in terms of the research questions,
contributions and limitations of this thesis, as well as future work.
1.7 Published work
Sam Zargham, Janko Calic, and David Frohlich.“User experience study of multiple
photo streams visualisation.” Proceedings of the 26th Annual BCS Interaction
Specialist Group Conference on People and Computers. British Computer Society,
2012.
Sam Zargham and Janko Calic. “Dynamic Presentation of Synchronised Photo
Streams.” Proceedings of the 28th International BCS Human Computer Interac-
tion Conference on HCI 2014-Sand, Sea and Sky-Holiday HCI. BCS, 2014.

Chapter 1. Introduction 9
Sam Zargham, Janko Calic and David Frohlich. “4Streams: An ambient display
for sharing photos between extended families”. Proceedings of the 29th Interna-
tional BCS Human Computer Interaction Conference on HCI 2015.
Sam Zargham, Janko Calic and David Frohlich. “Synchronous visualisation of
multiple photo streams”. Submitted to Human–Computer Interaction, Taylor
and Francis.
Chapter 2
Literature Review
2.1 Introduction
This chapter presents a literature review of the relevant state-of-the-art research.
Having in mind that the research theme of this thesis is synchronous visualisation
and sharing of multiple photo streams, a multidisciplinary approach to HCI has
been adopted. As stated in the research objectives, the work presented addresses
several aspects, such as the design of novel interfaces for visualisation and sharing
of photo streams and a number of user studies evaluating the designed interfaces.
Therefore, in this chapter we cover the current research that aims at better user
experience in digital photography alongside relevant existing enabling technologies.
2.2 Digital path of photography
Digital cameras were introduced into the marketplace in the early 1990s. This
new technology took over from the film based ‘Kodak’ era very quickly due to the
lower price of photo printing, no requirement to buy a film and the short lifecycle
from photo capture to print. It also made it easier to take many photos without
being concerned about the results and the process of editing became faster and
more flexible. Moreover, the quality of photos improved rapidly.
10
Chapter 2. Literature Review 11
In comparison to the ‘Kodak’ practices, new business models have been introduced
in domestic photography, predominantly exploiting information and communica-
tion technology [41]. Although there are people who still print their own photos,
the majority of captured photos are stored on home or cloud-based computer hard
drives. Therefore, organising, sharing and visualisation of large numbers of photos
as well as the need for user-friendly applications in digital photography have been
key issues. Currently, there are software and device manufacturers that offer photo
printing, management and editing software. Camera manufacturers, alongside mo-
bile phone manufactures, introduce new photo-related features to their devices. In
addition, internet connectivity with integration of photos into social networks has
made the digital path prevalent yet full of challenges. Hence, unlike the old ‘Ko-
dak’ practice, there is now no single dominant business model for making a profit
from domestic photography and, as a result, business stakeholders have diversi-
fied. To better understand the challenges and innovate potential solutions, the
next section presents a model for studying digital photography.
2.3 Approach to study digital photography
As photography has entered the digital era, the nature of domestic photography
has changed; it has shifted from paper prints to digital photos and, as a result, the
user interaction with their photo collections has changed. The most remarkable
change is the number of photo collections as they no longer need films for printing;
as a result, people take more photos of the same thing such as a scene, an object
or a view [42].
During the ‘Kodak’ era, people were not able to edit their photos at home. How-
ever, the digital path offers consumers the ability to edit their photos (using ac-
tions such as cropping, adding filter colors, removing red eyes and making many
similar copies). The term “photowork” was introduced by [24] to describe the
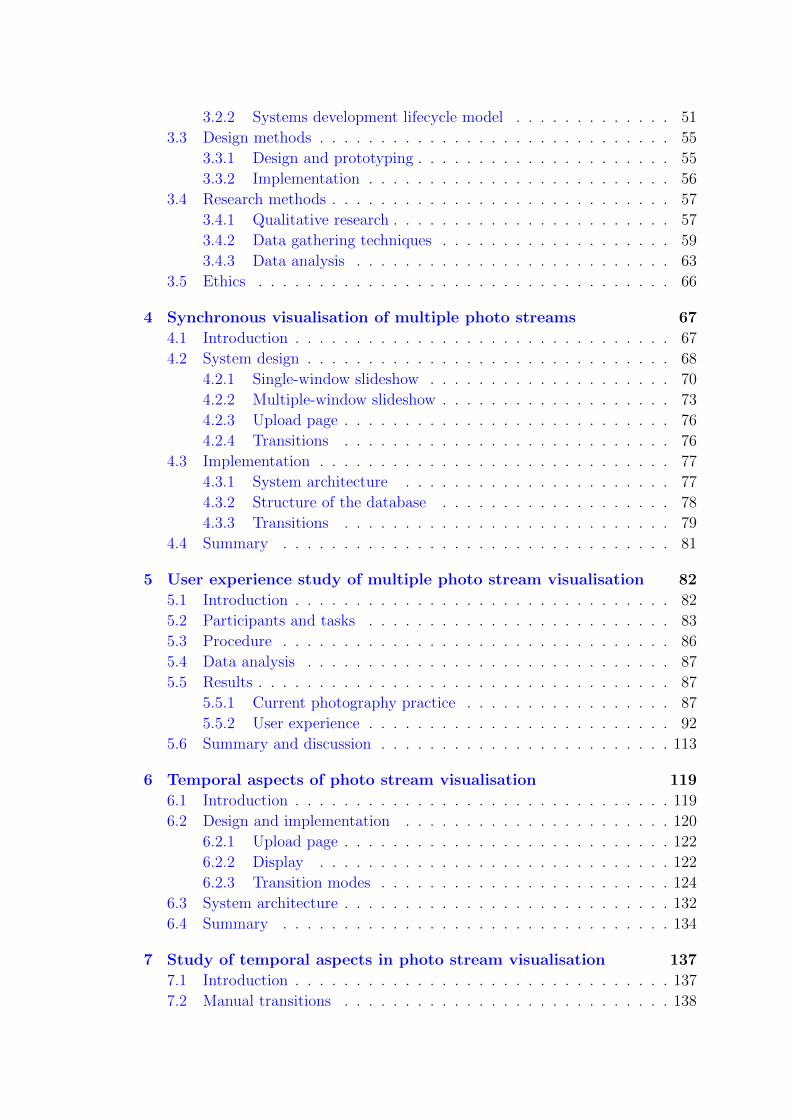
activities that people perform with their digital photos after capture until they
Chapter 2. Literature Review 12
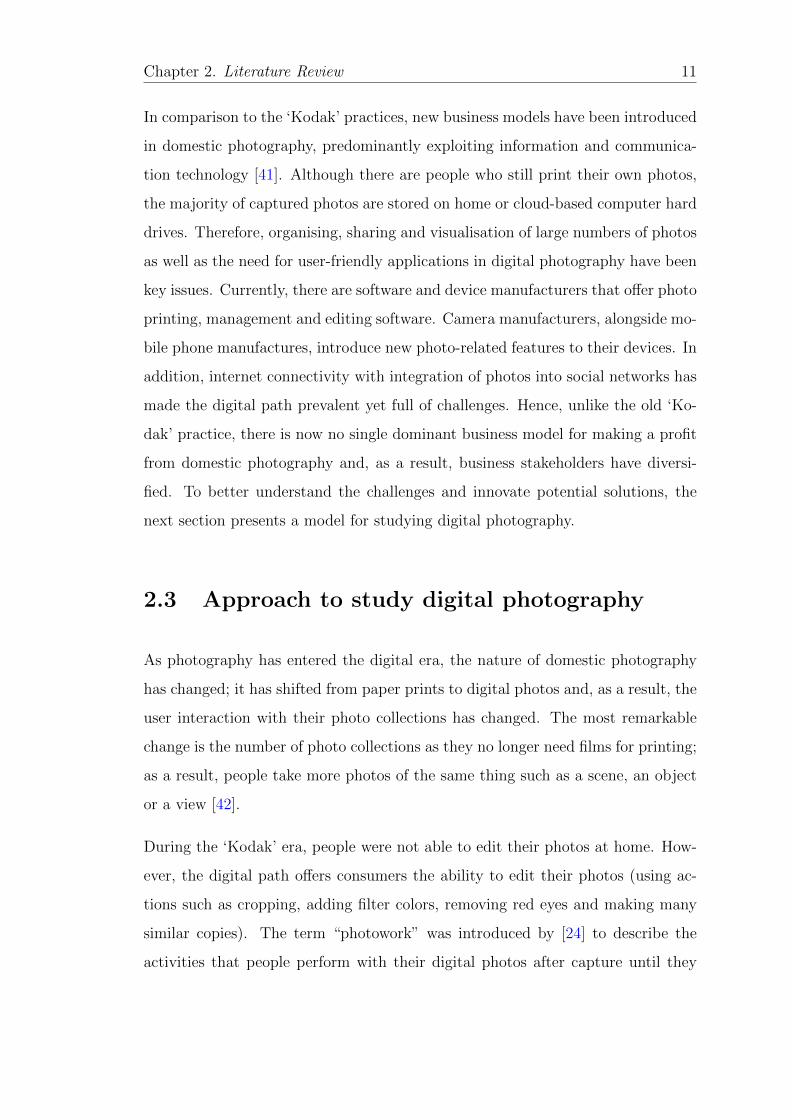
share them. In this work, twelve households were interviewed about their every-
day photographic practices. The findings highlighted the processes of reviewing,
downloading, organising, editing and storing, and they have been divided into
three stages of pre-download, at-download and pre-share, which can be seen in
Figure 2.1. In the first stage, the captured photo can be edited on the camera or
left as it is. In the second stage, the captured photo is downloaded to the physical
memory, edited and kept in the personal photo collection. In the third stage, the
downloaded photo can be accessed and printed or shared with other people. The
captured photos are reviewed and shared later.
Sharing Visualization
Organization
Capture
Capture
Download
Edit on camera
Edit on computer
Backup
File pictures
Edit before sharing
Share
Print or display
Pre-download stage
At-download stage
Pre-share stage
Pre-download
Figure 2.1: The stages of photowork from [? ]
In another study [43], ten participants were interviewed in a semi-structured fash-
ion, deriving the key themes of domestic photography as: photo taking, organising,
search, browsing, reviewing and sharing. Moreover, Frohlich [28] found that shar-
ing is the key novelty of digital photography once the users capture the photos
Chapter 2. Literature Review 13
into the digital realm. Thus, Frohlich proposed the requirements, which leverage
the future of photo sharing, and called it “photoware”.
Motivated by these seminal approaches to studying practice in digital photogra-
phy, this research introduces a structure, which can be seen as dotted frames in
Figure 2.1 and that includes the aspect of displaying photos. The proposed key
aspects of user practices in digital photography are as follows: capturing, organ-
ising, sharing and visualisation. The literature review is, therefore, classified into
these four aspects of digital photography.
2.4 Capture
As explained in the previous section, the first stage of digital photography is
capture. The capture stage generates the digital photo that will be organised,
visualised or shared in the next steps. Currently, there are different types of
capture devices with various capabilities. Nowadays, most people have at least
one capture device at home such as point-and-shoot camera or a camera phone,
and digital photo capturing has become their dominant means of photo taking.
In this section, different types of capture devices such as a camera phone [44], a
passive camera [45–47] and an audio camera [48] are introduced and described.
In recent times, most camera phones have enabled users to take snapshots and this
feature has made camera phones a supplementary device to the point-and-shoot
camera. Mobile phones are easily portable and are more often at hand than any
other device. A study by Kindberg et al. [25] indicated that the majority of photos
on camera phones are taken for sentimental or emotional reasons. Moreover, the
photos are mostly mutual experiences and, thus, often intended for communication
with absent friends or family, either in real-time or offline. They concluded that
camera phones, due to their ability of direct sending and sharing, let people use
photos as a means of bringing physically remote people into a shared experience.
Chapter 2. Literature Review 14
To support the sharing experiences and usage of camera phones, Van House et
al. claimed [26] that the camera phone for the networked generation is seen as a
memory tool as well as a communicative and expressive device, which can be used
for creating and maintaining relationships alongside constructing personal and
collective memories in various cases such as self representation and self expression.
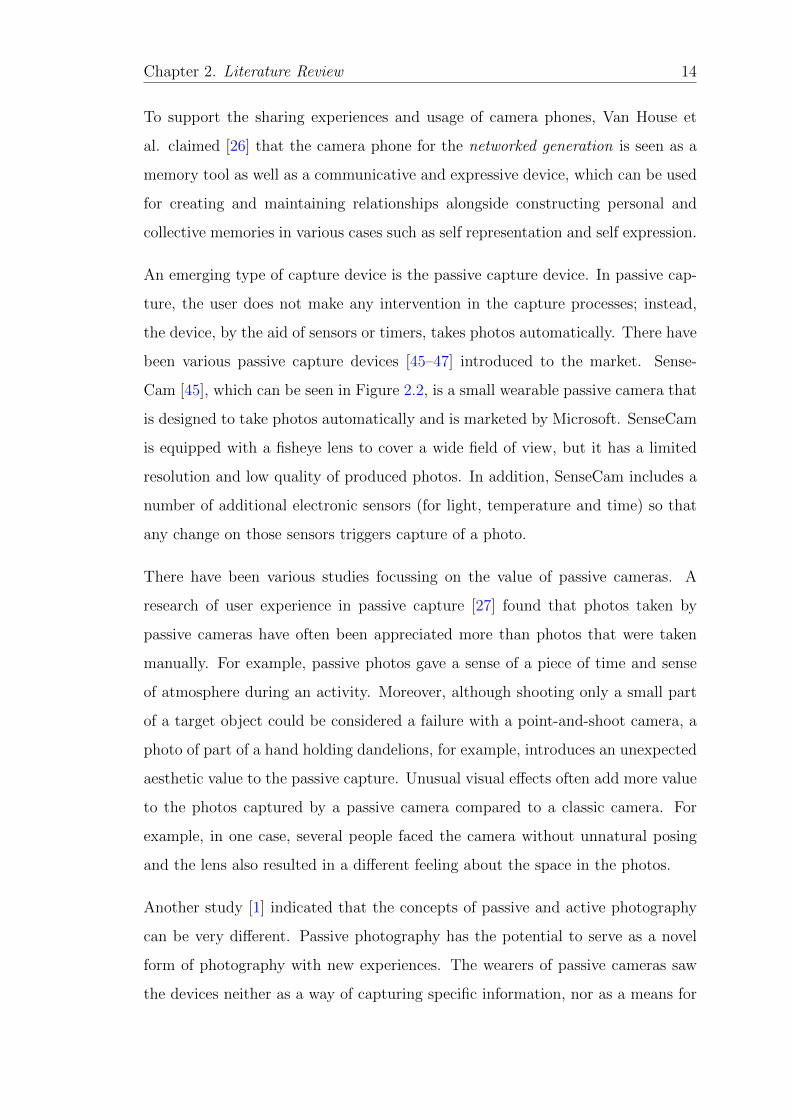
An emerging type of capture device is the passive capture device. In passive cap-
ture, the user does not make any intervention in the capture processes; instead,
the device, by the aid of sensors or timers, takes photos automatically. There have
been various passive capture devices [45–47] introduced to the market. Sense-
Cam [45], which can be seen in Figure 2.2, is a small wearable passive camera that
is designed to take photos automatically and is marketed by Microsoft. SenseCam
is equipped with a fisheye lens to cover a wide field of view, but it has a limited
resolution and low quality of produced photos. In addition, SenseCam includes a
number of additional electronic sensors (for light, temperature and time) so that
any change on those sensors triggers capture of a photo.
There have been various studies focussing on the value of passive cameras. A
research of user experience in passive capture [27] found that photos taken by
passive cameras have often been appreciated more than photos that were taken
manually. For example, passive photos gave a sense of a piece of time and sense
of atmosphere during an activity. Moreover, although shooting only a small part
of a target object could be considered a failure with a point-and-shoot camera, a
photo of part of a hand holding dandelions, for example, introduces an unexpected
aesthetic value to the passive capture. Unusual visual effects often add more value
to the photos captured by a passive camera compared to a classic camera. For
example, in one case, several people faced the camera without unnatural posing
and the lens also resulted in a different feeling about the space in the photos.
Another study [1] indicated that the concepts of passive and active photography
can be very different. Passive photography has the potential to serve as a novel
form of photography with new experiences. The wearers of passive cameras saw
the devices neither as a way of capturing specific information, nor as a means for
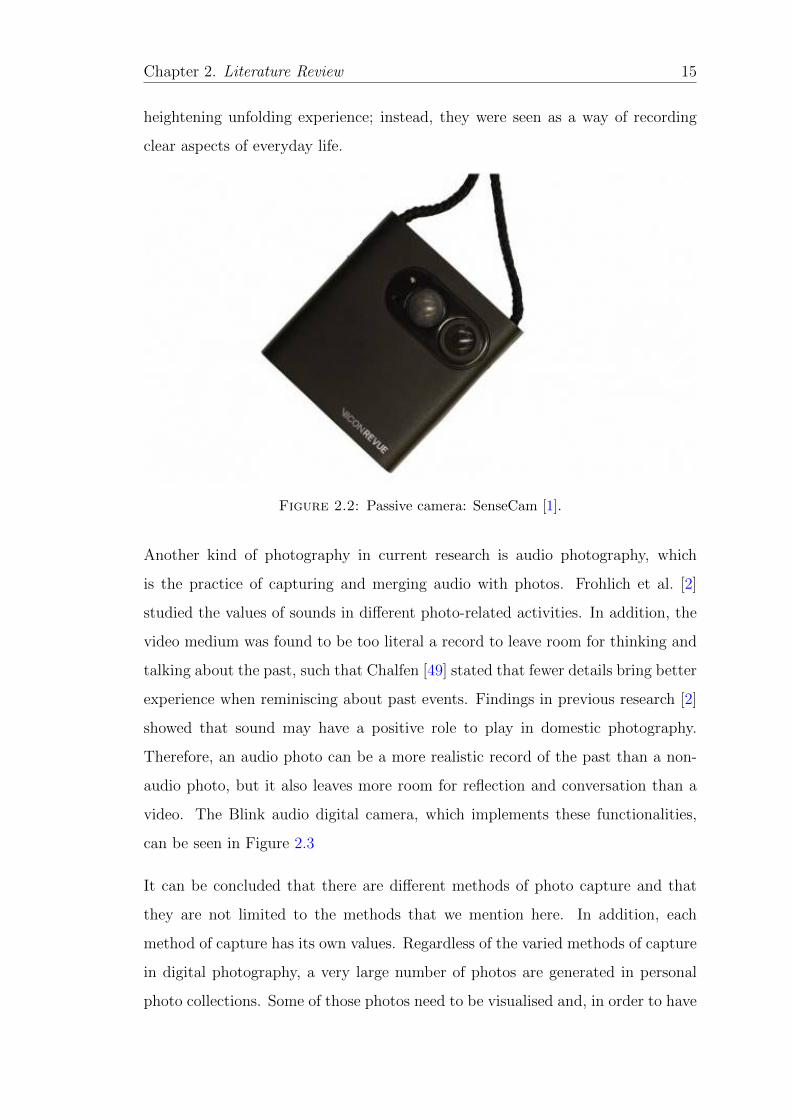
Chapter 2. Literature Review 15
heightening unfolding experience; instead, they were seen as a way of recording
clear aspects of everyday life.
Figure 2.2: Passive camera: SenseCam [1].
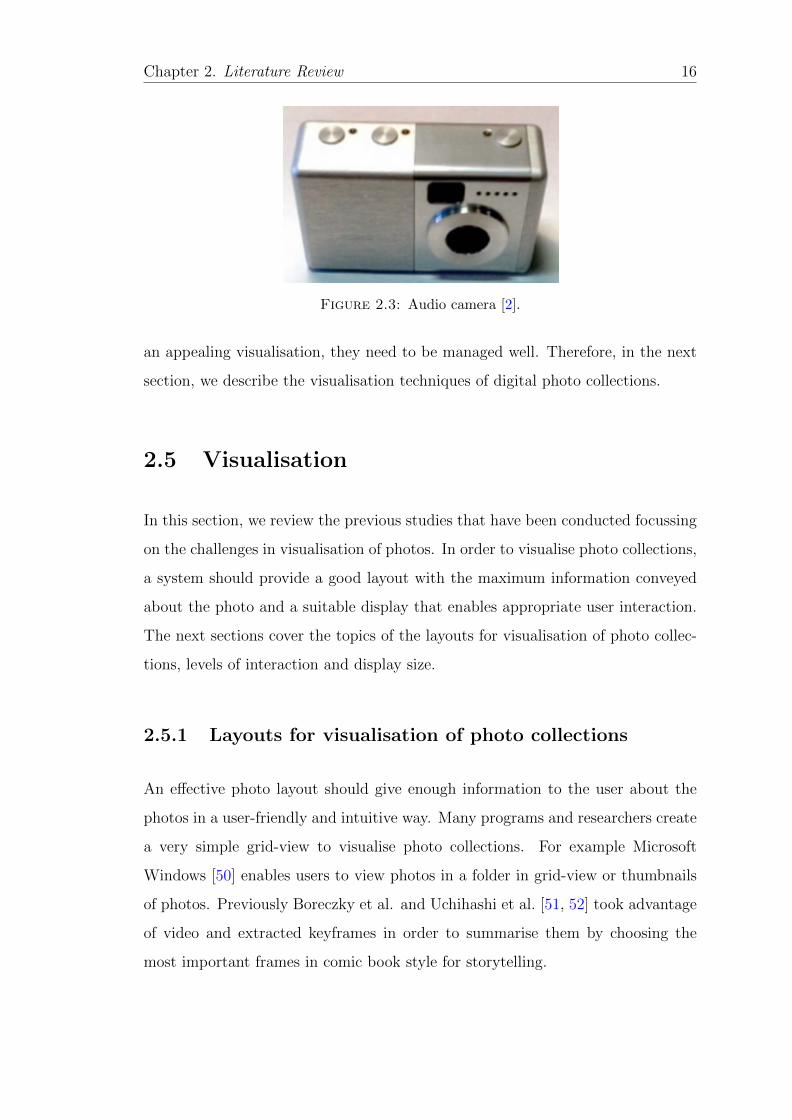
Another kind of photography in current research is audio photography, which
is the practice of capturing and merging audio with photos. Frohlich et al. [2]
studied the values of sounds in different photo-related activities. In addition, the
video medium was found to be too literal a record to leave room for thinking and
talking about the past, such that Chalfen [49] stated that fewer details bring better
experience when reminiscing about past events. Findings in previous research [2]
showed that sound may have a positive role to play in domestic photography.
Therefore, an audio photo can be a more realistic record of the past than a non-
audio photo, but it also leaves more room for reflection and conversation than a
video. The Blink audio digital camera, which implements these functionalities,
can be seen in Figure 2.3
It can be concluded that there are different methods of photo capture and that
they are not limited to the methods that we mention here. In addition, each
method of capture has its own values. Regardless of the varied methods of capture
in digital photography, a very large number of photos are generated in personal
photo collections. Some of those photos need to be visualised and, in order to have
Chapter 2. Literature Review 16
Figure 2.3: Audio camera [2].
an appealing visualisation, they need to be managed well. Therefore, in the next
section, we describe the visualisation techniques of digital photo collections.
2.5 Visualisation
In this section, we review the previous studies that have been conducted focussing
on the challenges in visualisation of photos. In order to visualise photo collections,
a system should provide a good layout with the maximum information conveyed
about the photo and a suitable display that enables appropriate user interaction.
The next sections cover the topics of the layouts for visualisation of photo collec-
tions, levels of interaction and display size.
2.5.1 Layouts for visualisation of photo collections
An effective photo layout should give enough information to the user about the
photos in a user-friendly and intuitive way. Many programs and researchers create
a very simple grid-view to visualise photo collections. For example Microsoft
Windows [50] enables users to view photos in a folder in grid-view or thumbnails
of photos. Previously Boreczky et al. and Uchihashi et al. [51, 52] took advantage
of video and extracted keyframes in order to summarise them by choosing the
most important frames in comic book style for storytelling.
Chapter 2. Literature Review 17
One layout technique that has been applied previously in order to visualise photos
is tiling, which is laying out thumbnails of different sizes. Photomesa [32] is a user
interface for displaying photo thumbnails by enabling the user to zoom into the
photo thumbnails. All thumbnails of photos in the application interface can be
seen in a page; this means that increasing the number of photos leads to smaller
thumbnail size. However, to tackle the problem of the growth of the number of
photos in a collection, users can click on a photo and then the sub-clusters related
to that photo appear on the screen in an action which they called ‘zoom in’.
Although the ‘zoom in’ action decreases the visual information from the photo
collection, it provides visually clearer photo collection representation.
A photo browser application by Graham et al. [30] was built to display a summary
of photos in a chronological-based hierarchical manner by taking advantage of clus-
tering in the same way as Photomesa [32]. Photomesa is a 2-D grid-based interface
which enables the user to navigate the hierarchy of clusters using a tree view. In
the same manner as these two applications, other photo browsing tools [53–56] use
tile view characteristics and different hierarchical clustering techniques to generate
a layout for visualisation of photo collections.
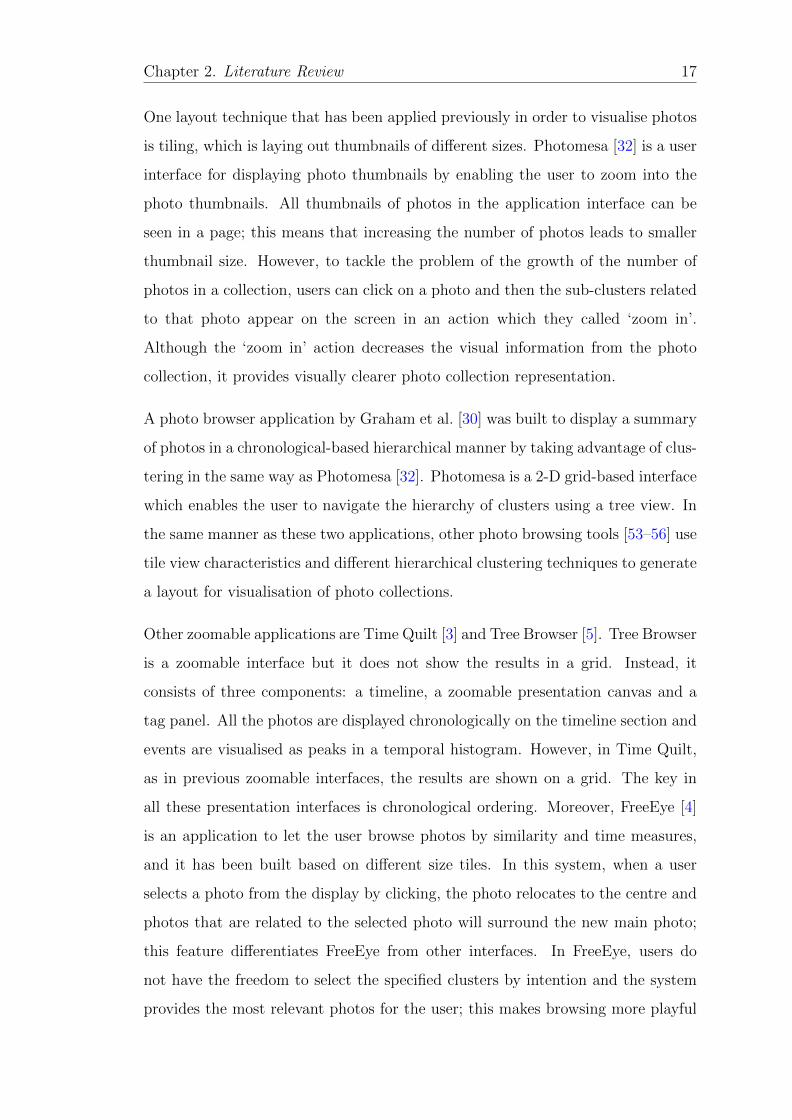
Other zoomable applications are Time Quilt [3] and Tree Browser [5]. Tree Browser
is a zoomable interface but it does not show the results in a grid. Instead, it
consists of three components: a timeline, a zoomable presentation canvas and a
tag panel. All the photos are displayed chronologically on the timeline section and
events are visualised as peaks in a temporal histogram. However, in Time Quilt,
as in previous zoomable interfaces, the results are shown on a grid. The key in
all these presentation interfaces is chronological ordering. Moreover, FreeEye [4]
is an application to let the user browse photos by similarity and time measures,
and it has been built based on different size tiles. In this system, when a user
selects a photo from the display by clicking, the photo relocates to the centre and
photos that are related to the selected photo will surround the new main photo;
this feature differentiates FreeEye from other interfaces. In FreeEye, users do
not have the freedom to select the specified clusters by intention and the system
provides the most relevant photos for the user; this makes browsing more playful
Chapter 2. Literature Review 18
and brings more room for users to discover unexpected photos in their collections.
Time Quilt, Tree Browse and FreeEyes interfaces can be seen in Figure 2.4.
Figure 2.4: Tile layout examples for visualisation of photo collections. Left:Time Quilt [3], Bottom: FreeEye [4] and Right: Tree Browser [5].
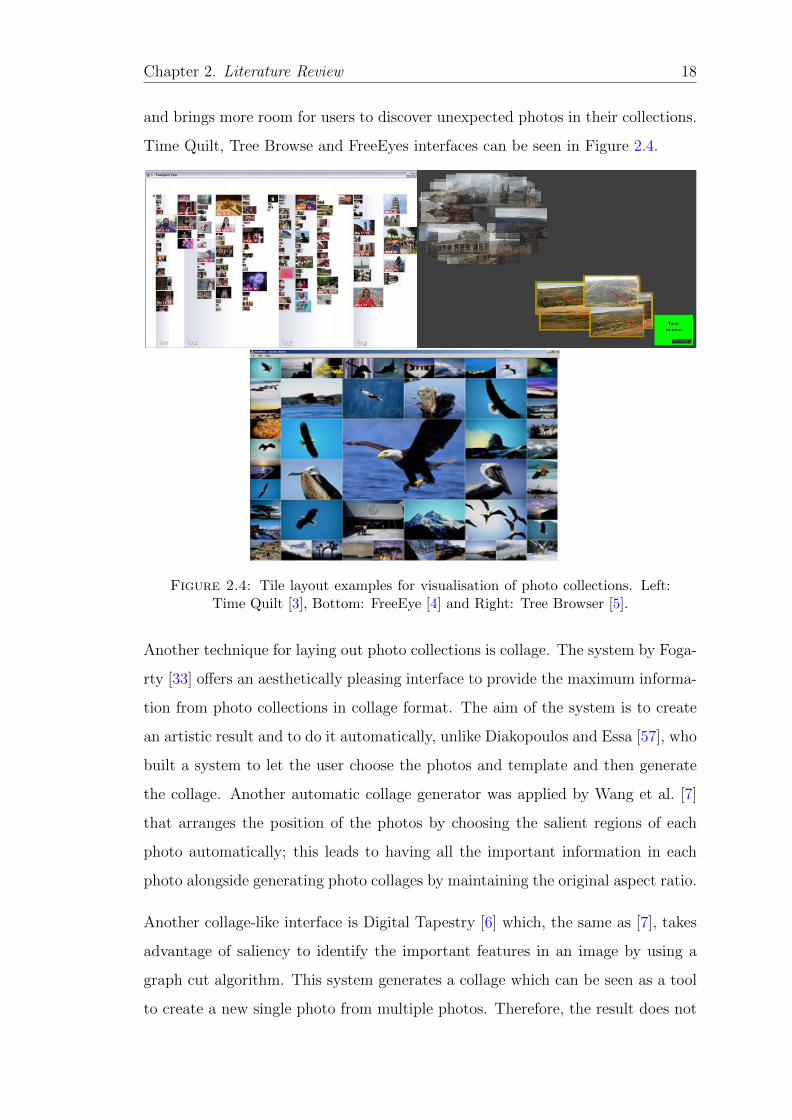
Another technique for laying out photo collections is collage. The system by Foga-
rty [33] offers an aesthetically pleasing interface to provide the maximum informa-
tion from photo collections in collage format. The aim of the system is to create
an artistic result and to do it automatically, unlike Diakopoulos and Essa [57], who
built a system to let the user choose the photos and template and then generate
the collage. Another automatic collage generator was applied by Wang et al. [7]
that arranges the position of the photos by choosing the salient regions of each
photo automatically; this leads to having all the important information in each
photo alongside generating photo collages by maintaining the original aspect ratio.
Another collage-like interface is Digital Tapestry [6] which, the same as [7], takes
advantage of saliency to identify the important features in an image by using a
graph cut algorithm. This system generates a collage which can be seen as a tool
to create a new single photo from multiple photos. Therefore, the result does not
Chapter 2. Literature Review 19
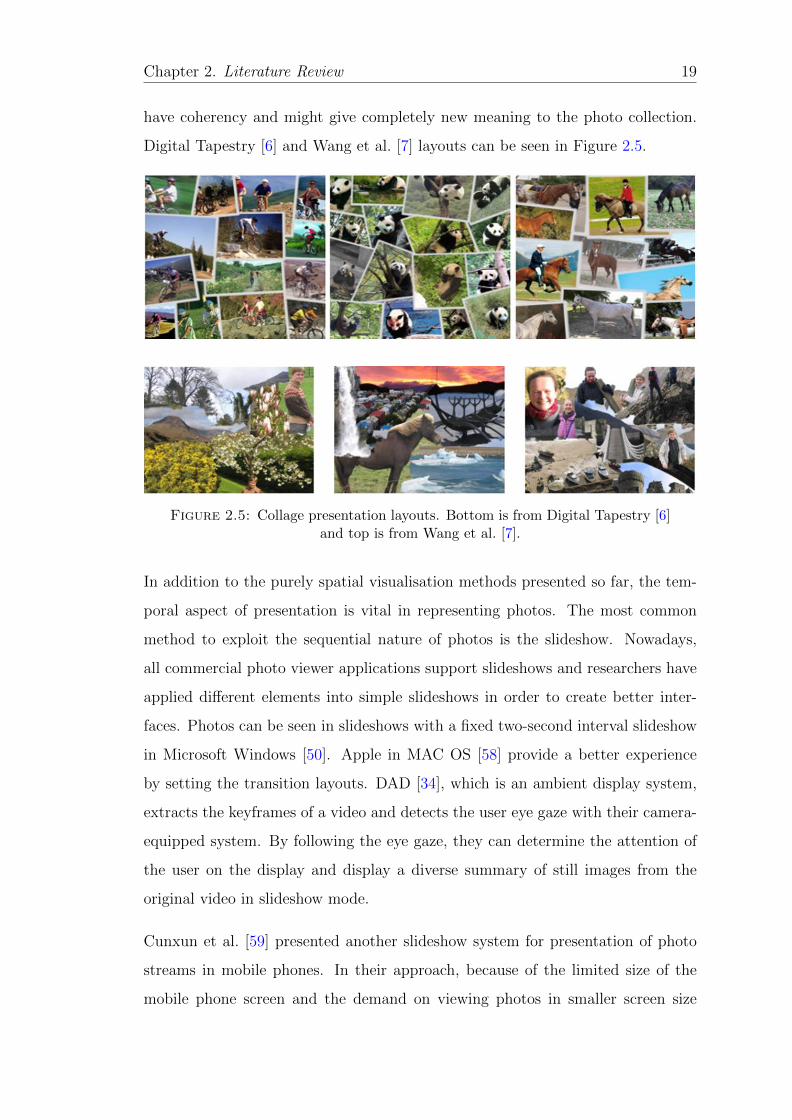
have coherency and might give completely new meaning to the photo collection.
Digital Tapestry [6] and Wang et al. [7] layouts can be seen in Figure 2.5.
Figure 2.5: Collage presentation layouts. Bottom is from Digital Tapestry [6]and top is from Wang et al. [7].
In addition to the purely spatial visualisation methods presented so far, the tem-
poral aspect of presentation is vital in representing photos. The most common
method to exploit the sequential nature of photos is the slideshow. Nowadays,
all commercial photo viewer applications support slideshows and researchers have
applied different elements into simple slideshows in order to create better inter-
faces. Photos can be seen in slideshows with a fixed two-second interval slideshow
in Microsoft Windows [50]. Apple in MAC OS [58] provide a better experience
by setting the transition layouts. DAD [34], which is an ambient display system,
extracts the keyframes of a video and detects the user eye gaze with their camera-
equipped system. By following the eye gaze, they can determine the attention of
the user on the display and display a diverse summary of still images from the
original video in slideshow mode.
Cunxun et al. [59] presented another slideshow system for presentation of photo
streams in mobile phones. In their approach, because of the limited size of the
mobile phone screen and the demand on viewing photos in smaller screen size
Chapter 2. Literature Review 20
devices, mobile users have the freedom to control the region of interest for each
photo and, then, the slideshow re-targets the image to a smaller size photo while
keeping the proper aspect ratio.
One difficulty with slideshows is that they are very time consuming for the user
when there are many photos in the presented collection. To solve this problem,
Liu et al. [60] proposed an approach to measure the attraction of each photo using
photo features and adjusting the duration of photo transition to be related to
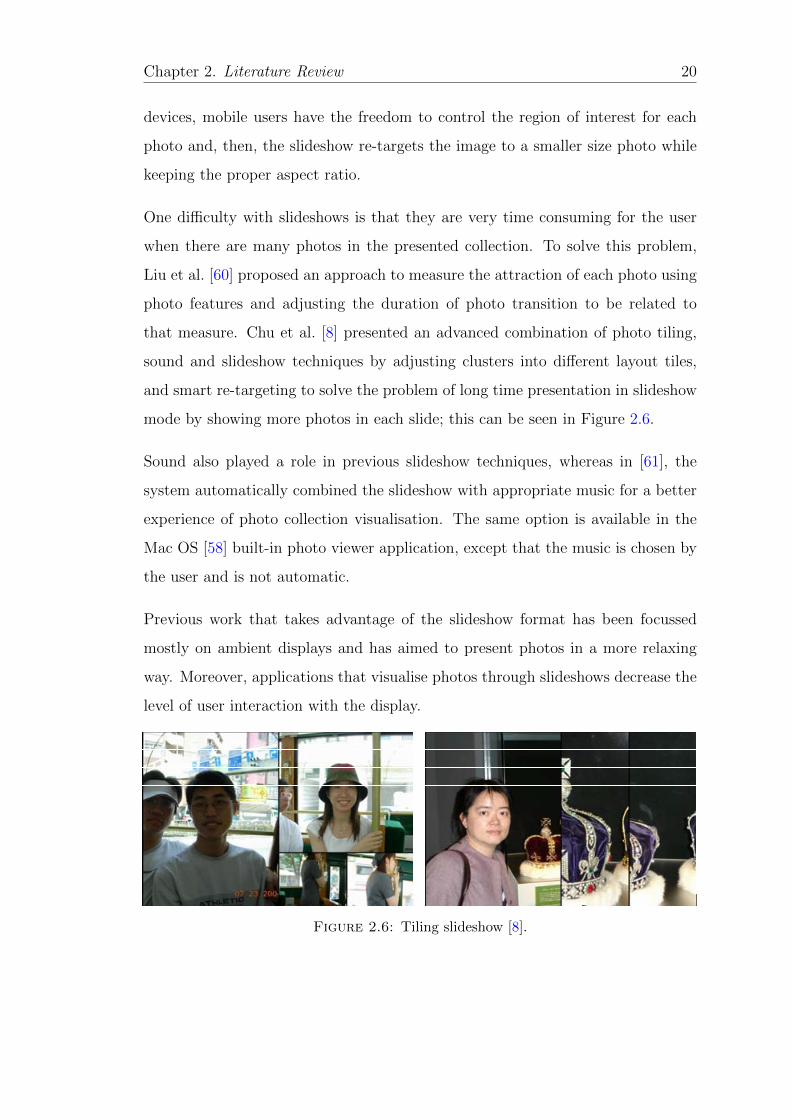
that measure. Chu et al. [8] presented an advanced combination of photo tiling,
sound and slideshow techniques by adjusting clusters into different layout tiles,
and smart re-targeting to solve the problem of long time presentation in slideshow
mode by showing more photos in each slide; this can be seen in Figure 2.6.
Sound also played a role in previous slideshow techniques, whereas in [61], the
system automatically combined the slideshow with appropriate music for a better
experience of photo collection visualisation. The same option is available in the
Mac OS [58] built-in photo viewer application, except that the music is chosen by
the user and is not automatic.
Previous work that takes advantage of the slideshow format has been focussed
mostly on ambient displays and has aimed to present photos in a more relaxing
way. Moreover, applications that visualise photos through slideshows decrease the
level of user interaction with the display.
4-cellTemplate
5-cellTemplate
Topic cell
Topic cell
Supportive cell
Topic cell
Supportive cell
3-cellTemplate
Topic cell4-cellTemplate
5-cellTemplate
Topic cell
Topic cell
Supportive cell
Topic cell
Supportive cell
3-cellTemplate
Topic cell
Figure 4. Examples of different kinds of templates.
ill-cropped photo ill-cropped photos(a) (b)
ill-cropped photo ill-cropped photos(a) (b) Figure 5. Examples of ill-cropped photos.
18
Figure 2.6: Tiling slideshow [8].
Chapter 2. Literature Review 21
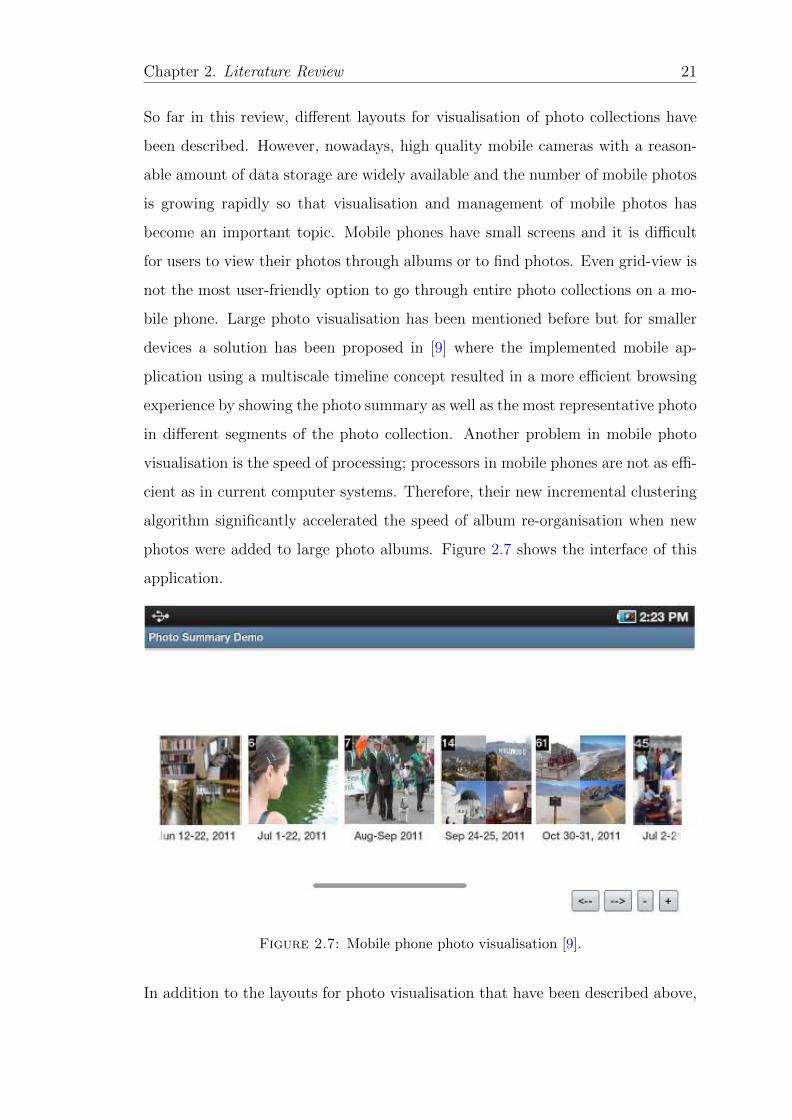
So far in this review, different layouts for visualisation of photo collections have
been described. However, nowadays, high quality mobile cameras with a reason-
able amount of data storage are widely available and the number of mobile photos
is growing rapidly so that visualisation and management of mobile photos has
become an important topic. Mobile phones have small screens and it is difficult
for users to view their photos through albums or to find photos. Even grid-view is
not the most user-friendly option to go through entire photo collections on a mo-
bile phone. Large photo visualisation has been mentioned before but for smaller
devices a solution has been proposed in [9] where the implemented mobile ap-
plication using a multiscale timeline concept resulted in a more efficient browsing
experience by showing the photo summary as well as the most representative photo
in different segments of the photo collection. Another problem in mobile photo
visualisation is the speed of processing; processors in mobile phones are not as effi-
cient as in current computer systems. Therefore, their new incremental clustering
algorithm significantly accelerated the speed of album re-organisation when new
photos were added to large photo albums. Figure 2.7 shows the interface of this
application.
Figure 2.7: Mobile phone photo visualisation [9].
In addition to the layouts for photo visualisation that have been described above,
Chapter 2. Literature Review 22
there exist storytelling tools that enable users to see their photo collections and
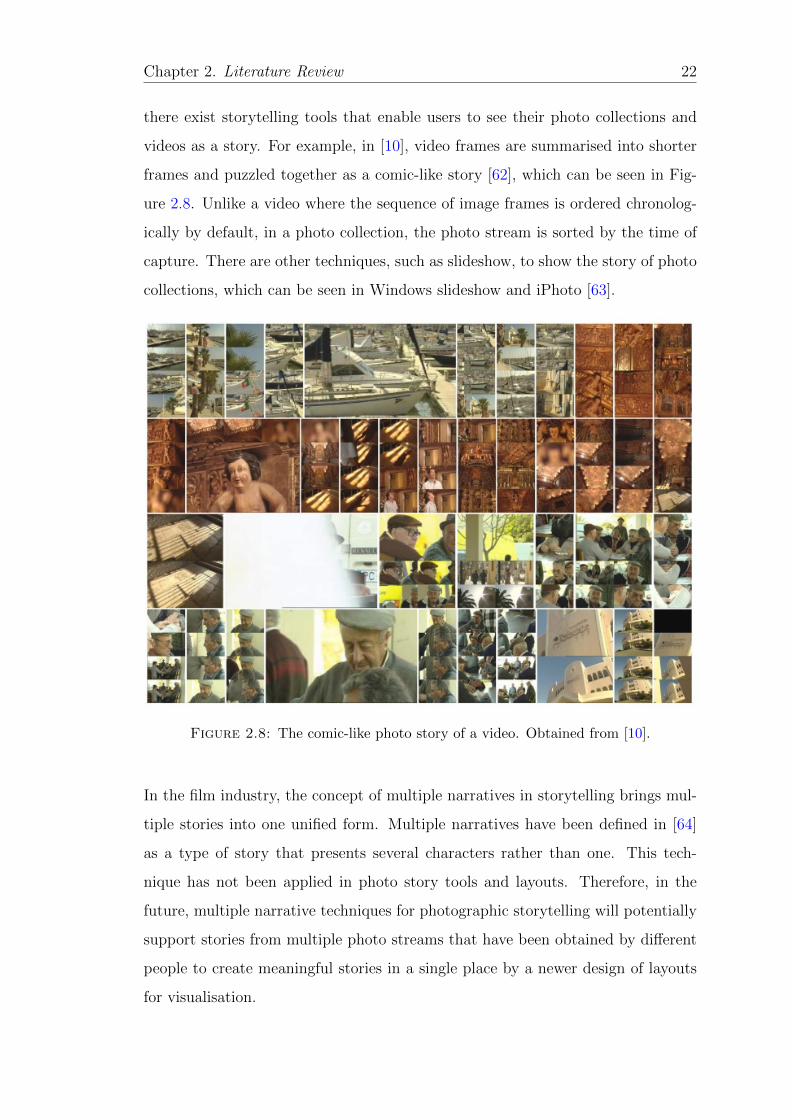
videos as a story. For example, in [10], video frames are summarised into shorter
frames and puzzled together as a comic-like story [62], which can be seen in Fig-
ure 2.8. Unlike a video where the sequence of image frames is ordered chronolog-
ically by default, in a photo collection, the photo stream is sorted by the time of
capture. There are other techniques, such as slideshow, to show the story of photo
collections, which can be seen in Windows slideshow and iPhoto [63].
Figure 2.8: The comic-like photo story of a video. Obtained from [10].
In the film industry, the concept of multiple narratives in storytelling brings mul-
tiple stories into one unified form. Multiple narratives have been defined in [64]
as a type of story that presents several characters rather than one. This tech-
nique has not been applied in photo story tools and layouts. Therefore, in the
future, multiple narrative techniques for photographic storytelling will potentially
support stories from multiple photo streams that have been obtained by different
people to create meaningful stories in a single place by a newer design of layouts
for visualisation.
Chapter 2. Literature Review 23
In this section, different layouts for visualisation of photo collections were de-
scribed. However, in order to be able to see the photos in different layouts, users
need to interact within the applications. Therefore, in the next section, the levels
of interaction within the display are explained.
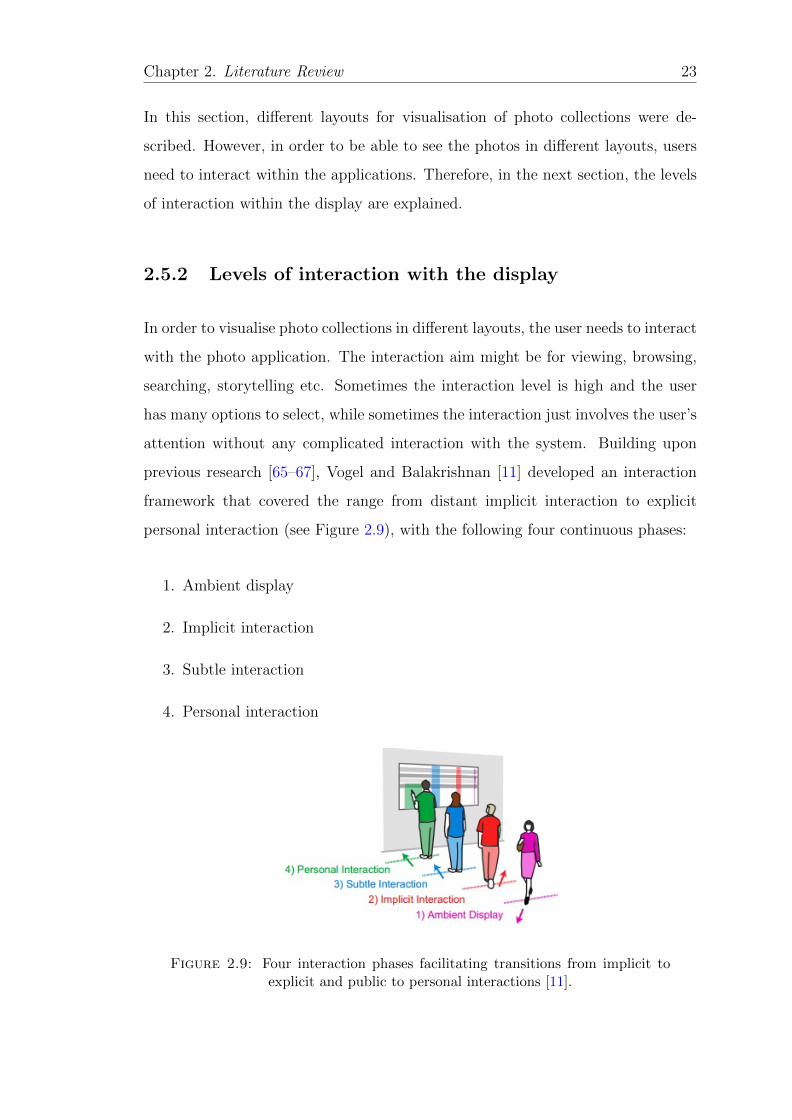
2.5.2 Levels of interaction with the display
In order to visualise photo collections in different layouts, the user needs to interact
with the photo application. The interaction aim might be for viewing, browsing,
searching, storytelling etc. Sometimes the interaction level is high and the user
has many options to select, while sometimes the interaction just involves the user’s
attention without any complicated interaction with the system. Building upon
previous research [65–67], Vogel and Balakrishnan [11] developed an interaction
framework that covered the range from distant implicit interaction to explicit
personal interaction (see Figure 2.9), with the following four continuous phases:
1. Ambient display
2. Implicit interaction
3. Subtle interaction
4. Personal interaction
Figure 2.9: Four interaction phases facilitating transitions from implicit toexplicit and public to personal interactions [11].
Chapter 2. Literature Review 24
The ambient display phase is when the display shows a range of information with
the capability of updating slowly and this state is neutral [68–70]. For photo visu-
alisation, Biemans et al. [71] took advantage of the ambient phase for visualisation
of digital photos. In this display, the digital photo frame was situated in a place
and the family members of elderly relatives were sending their photos via MMS
or Email so that the newest sent photos appeared on the screen.
The next phase is that of implicit interaction whereby a user passes by a display.
The system should recognise the user’s body position and orientation to provide
information. Implicit interaction was used for photo visualisation in [72]. The
display can identify the user and measure how far away they are; when the user is
a long distance from the display, the display acts as an ambient display and when
the user comes within an appropriate range for interaction, the display shows
photos that are related to the user.
When the user approaches the display and is attracted towards it, the system
should enter the subtle interaction phase. This phase is very short and hand
gestures, alongside the body movements and eye gazing, can be applied for the
interaction. An example of visualisation of photos using subtle interaction is pre-
sented in [34]. The display shows stylised photos with the aid of eye gazing. When
the user looks at the screen, the system presents photos to promote user interest in
the display, guided by the level of the user’s attention. This means that persistent
attention will guide the semantically similar content to that which attracted the
user’s gaze.
In the personal interaction phase, the user should be able to move close to the
screen and interact with the system in more detail such as through direct touch.
For example, in [73], an interactive display was built to visualise photos of different
people from different sides and the user was able to switch the photo on any four
screens that they designed for their system by the rotating head on top of the
device. Moreover, in [4], the device was interactive and the user could select a
photo on the screen and the most related photos based on time and photo contents
would appear on the screen.
Chapter 2. Literature Review 25
In this section, different kinds of interaction via the system were explained. How-
ever, the type of interaction also depends on the size of the display. In the next
section, the size of the display used for photo visualisation will be discussed.
2.5.3 Size of the display
Another important aspect for photo visualisation is the size of the display. The
layout and interaction levels of photo sharing applications depend on the size of the
display. Nowadays, people review their archive and social network photos on their
personal computer, tablets, mobile phones, digital photo frames and TVs. Display
size is important in presenting personal photos. Small devices, such as mobile
phones, have a smaller workspace to interact and show the photos. Currently,
smart phones use multi-touch interaction technology due to their small screen
size. For medium size screens such as iPads, digital photo frame size displays
were created for visualisation of photos [34, 74]. Therefore, prior studies have
focussed on interacting with small displays [75] and presenting photos in small
displays [59, 76, 77]. Simakov et al. [76] applied bi-directional similarity to support
the cropping of photos by showing the most important objects on the photo. They
changed the image scale by re-targeting in a way such that the resulting photo
was complete and coherent. However, the new photo contents and the distance
of the features might be different from the original one. Seam curving [78] is
another approach to re-target an image into a smaller size by maintaining the
aspect ratio. There are also simpler techniques such as showing the centre of the
photo or showing the region of interest of a photo [59].
In order to present photos on large screens such as televisions, most devices come
bundled with a memory card reader. In addition, Apple TV [79] provides different
presentations of photo streams from the Cloud on the home television. However,
the growth of different display types shows that providing applications to enhance
presenting photos on different display sizes is essential.
Chapter 2. Literature Review 26
The visualisation layouts, interaction and the size of the display was discussed
in this section. People need systems to organise their photos or to let users or-
ganise their photos more easily. Therefore, techniques that have been applied to
organising photo collections are presented in the next section.
2.6 Management of photo collections
As discussed in the previous sections, digital cameras, alongside other capture
devices such as camera phones and wearable cameras, are significantly affecting the
development of current practices surrounding personal photography. Therefore,
facilitating the process of personal photo management has become increasingly
important.
In order to define the issues in personal photo management, the behaviour of
different families in organising both their digital- and paper-based photos has been
studied [28]. The results showed that very few participants organise their digital
photo collections systematically on their PC’s. It has been shown that digital
photos are less organised than physical photos. Therefore, the call for automatic
photo management tools is strong.
After the advent of primitive organising tools such as Fotofile [53] and Shoe-
box [54], a subsequent user experience study [80] proposed sorting personal photos
in chronological order, similar to Graham et al. [30] who claimed time as an essence
for photo browsing. Their study highlighted that content-based image retrieval
has not been as valuable as browsing personal photos by event names including
date/time and name.
Companies such as Adobe Elements [81], iPhoto by Apple [63] and Picasa [82] by
Google have started introducing effective photo management tools to the market.
Online photo storage services such as Flickr [83], Facebook [84] and Shutterfly [85]
have prepared facilities for users to share and organise their photos online. Re-
cent versions of photo management applications such as iPhoto and Picasa have
Chapter 2. Literature Review 27
automated event management tools with time/date, tags, location and also face
recognition functionality for labelling.
Online commercial tools have allowed users to upload their photos to servers,
label them and then share them with others. Flickr and Facebook have allowed
labelling of photos, and Flickr also shows the original metadata information of
each photo [86]. There is no solid automatic organisation mechanism for photos
in commercial tools. Personal photo management tools have still not convinced
many users with few people using them as the primary photo tool for their photo
collections. The rest of this section describes technical solutions and approaches
to open up the techniques that have been used in photo management.
The expansion of photo collections in time has meant that revision and organi-
sation of personal photos have become discouraging tasks. Therefore, automatic
or semi-automatic grouping of images into meaningful sets has become a very
important research challenge. One of the core mechanisms behind automatic or-
ganisation of digital media such as photos is clustering [87].
Cluster analysis is the process of gathering a collection of patterns into clusters
based on their similarity with each other. Generally, patterns within a particular
cluster are more similar to each other than patterns from outside that cluster.
Typical data clustering processes extract relevant features, define data similarity
metrics between features and cluster elements into stable groups. There are many
taxonomies representing the clustering methodology but the two main clustering
approaches that have been applied in large-scale photo management are hierarchi-
cal and partitional clustering.
Time and space complexity in hierarchical clustering algorithms such as those
described in [30] are more complex than partitional algorithms; for example K-
means [31] has been applied for grouping photo collections into clusters. On the
other hand, hierarchical algorithms are better for non-isotropic clusters since they
have well-separated results. This means that hierarchical clustering provides sev-
eral layers for better representation and division of photos.
Chapter 2. Literature Review 28
To facilitate effective photo clustering, a set of relevant and robust features should
be identified. Most of the features that have been used previously were temporal,
location-based, optical, content-based and text-based labels. Some of the features
(i.e. temporal, location-based and optical) have been standardised as metadata
and included in the JPEG format as well as integrated into the Exif metadata
header [88].
Temporal information, such as the time and date of the main events in the lifecycle
of a digital photo (especially the moment the photo was taken), has been utilised
to organise photo collections into meaningful clusters [30, 89, 90]. Using the date
and time feature has worked efficiently, such as in [12], because the computation
complexity is low and there is a small difference in the results, as claimed by [80].
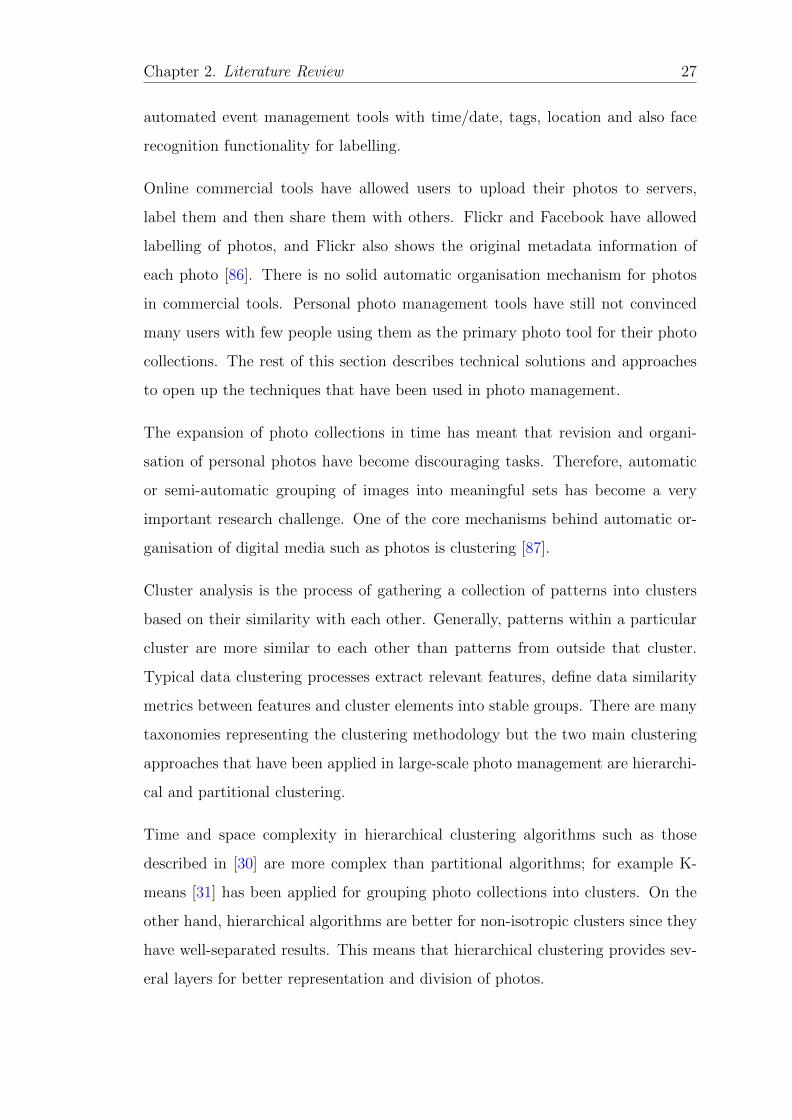
In AutoAlbum [12], one of the techniques to cluster photo collections is to use
photo time stamps; it takes the time stamp of each photo in order to generate
clusters by best-first model merging (see in Figure 2.10).
Figure 2.10: Time-base clustering technique used in the AutoAlbum sys-tem [12].
People tend to take photos in bursts during events such as parties or holidays,
rather than distributing them over time evenly. Therefore, temporal features can
be used in clustering the bursts of consecutive photos to improve the user ex-
perience of browsing and managing large photo collections. The clusters that
AutoAlbum generates are not representative of such bursts.
In the study by Graham et al. [30], two level-clustering algorithms were embedded.
Initially, images were clustered by a constant time difference. This means that
consecutive photos are compared and, if they differ in time by more than a specified
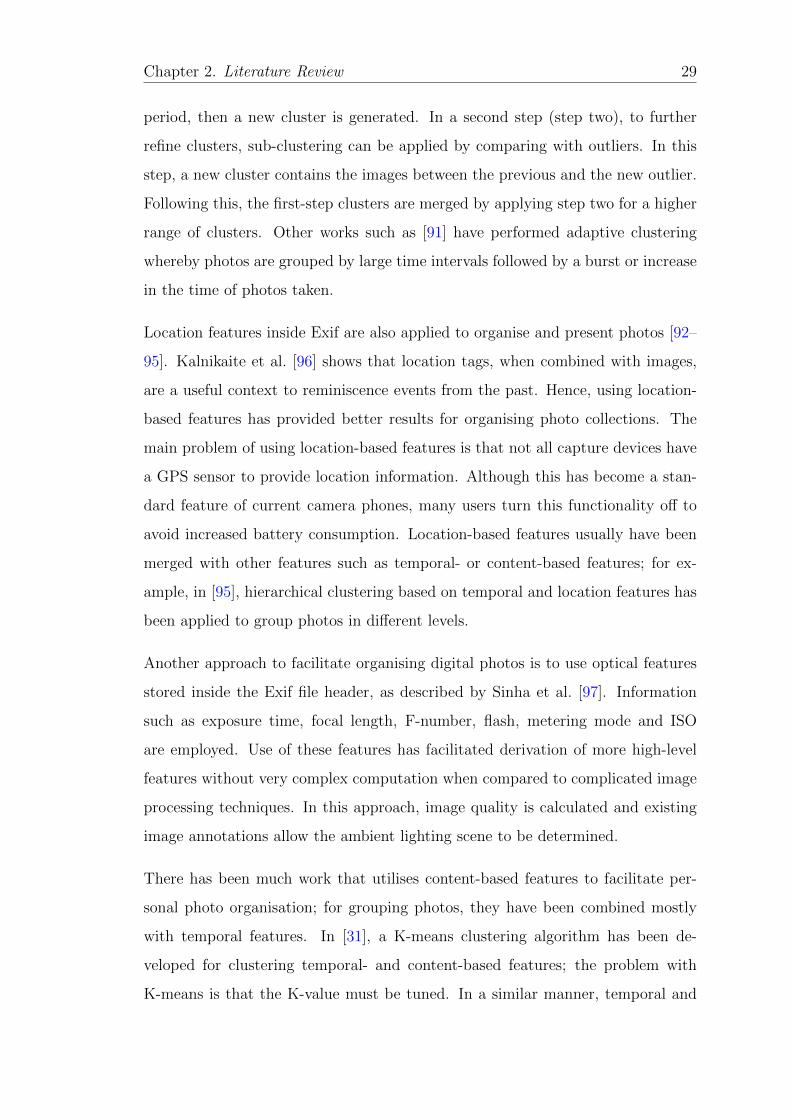
Chapter 2. Literature Review 29
period, then a new cluster is generated. In a second step (step two), to further
refine clusters, sub-clustering can be applied by comparing with outliers. In this
step, a new cluster contains the images between the previous and the new outlier.
Following this, the first-step clusters are merged by applying step two for a higher
range of clusters. Other works such as [91] have performed adaptive clustering
whereby photos are grouped by large time intervals followed by a burst or increase
in the time of photos taken.
Location features inside Exif are also applied to organise and present photos [92–
95]. Kalnikaite et al. [96] shows that location tags, when combined with images,
are a useful context to reminiscence events from the past. Hence, using location-
based features has provided better results for organising photo collections. The
main problem of using location-based features is that not all capture devices have
a GPS sensor to provide location information. Although this has become a stan-
dard feature of current camera phones, many users turn this functionality off to
avoid increased battery consumption. Location-based features usually have been
merged with other features such as temporal- or content-based features; for ex-
ample, in [95], hierarchical clustering based on temporal and location features has
been applied to group photos in different levels.
Another approach to facilitate organising digital photos is to use optical features
stored inside the Exif file header, as described by Sinha et al. [97]. Information
such as exposure time, focal length, F-number, flash, metering mode and ISO
are employed. Use of these features has facilitated derivation of more high-level
features without very complex computation when compared to complicated image
processing techniques. In this approach, image quality is calculated and existing
image annotations allow the ambient lighting scene to be determined.
There has been much work that utilises content-based features to facilitate per-
sonal photo organisation; for grouping photos, they have been combined mostly
with temporal features. In [31], a K-means clustering algorithm has been de-
veloped for clustering temporal- and content-based features; the problem with
K-means is that the K-value must be tuned. In a similar manner, temporal and
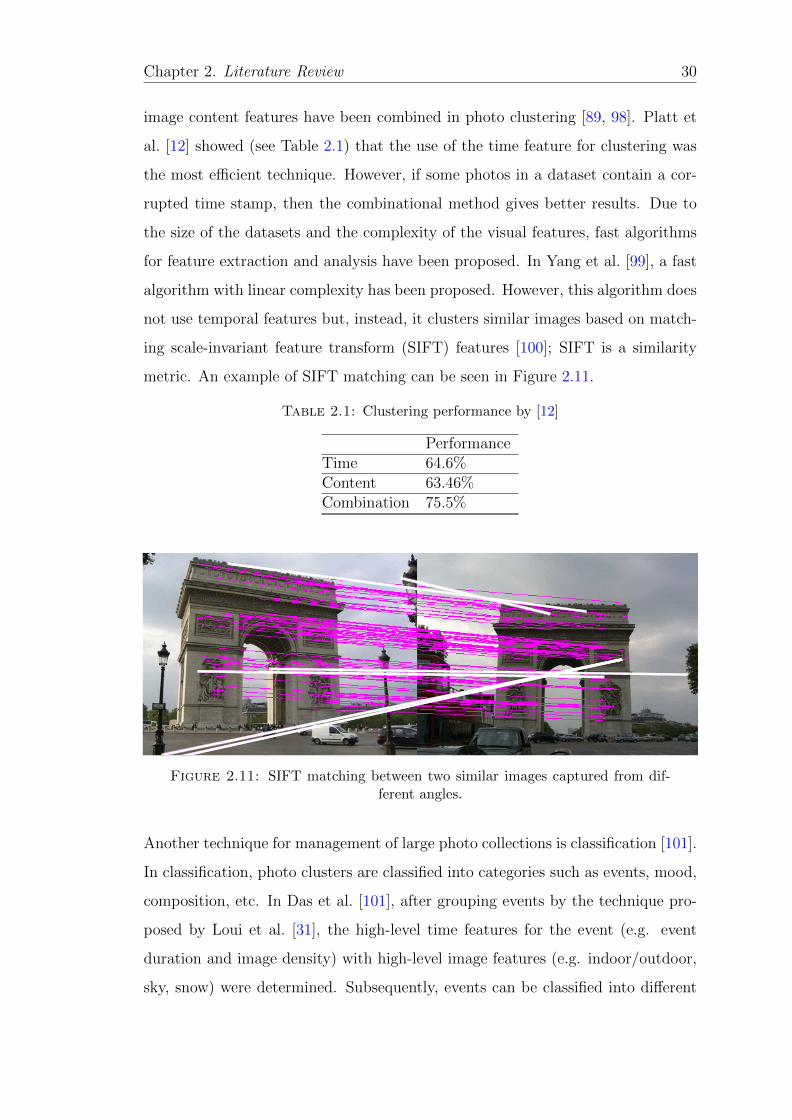
Chapter 2. Literature Review 30
image content features have been combined in photo clustering [89, 98]. Platt et
al. [12] showed (see Table 2.1) that the use of the time feature for clustering was
the most efficient technique. However, if some photos in a dataset contain a cor-
rupted time stamp, then the combinational method gives better results. Due to
the size of the datasets and the complexity of the visual features, fast algorithms
for feature extraction and analysis have been proposed. In Yang et al. [99], a fast
algorithm with linear complexity has been proposed. However, this algorithm does
not use temporal features but, instead, it clusters similar images based on match-
ing scale-invariant feature transform (SIFT) features [100]; SIFT is a similarity
metric. An example of SIFT matching can be seen in Figure 2.11.
Table 2.1: Clustering performance by [12]
PerformanceTime 64.6%Content 63.46%Combination 75.5%
around there, pedestrians, or something that is not directly related to this scenic spot.
Figure 1 shows the content variations in the photos taken in the famous Rokuonji temple in Kyoto. From this example and many other web-based albums, we found that most travelers incline to take the landmark or famous views several times. Moreover, tourists usually take photos at some specific locations such that they can capture the canonical view as that in the postal card. According to these observations, we propose that we can approach the selection of representative photo based on near-duplicate detection, which finds the near-duplicate pairs like the fifth to the eighth photos in Figure 1.
(1) (2) (3)
(4) (5) (6)
(7) (8) (9) Figure 1. Photos taken around the same scenic spot.
Applications of near-duplicate detection (NDD) have been proposed for many different purposes, such as sub-image retrieval [2] and automatic image annotation [4]. In various near-duplication detection approaches, local image descriptors that capture the salient characteristics over different image scales are widely used. Among different descriptors, Lowe’s SIFT (scale-invariant feature transform) feature [5] has been demonstrated to have the best performance and is used in this work.
We exploit the SIFT-based NDD method proposed by Zhao et al. [6]. This method largely reduces the false alarms caused by conventional nearest-neighbor matching approaches and increases the matching speed with a multidimensional index structure. Moreover, as the near-duplicate photos are often highly localized and spatially smooth, the correspondence of SIFT matched points have coherent patterns, which can be modeled by support vector machines (SVMs). This method obtains good balance between matching speed and matching accuracy.
2.2 Near-Duplication Detection Process Given a set of photos that are clustered together by using the time-based clustering method [1], we determine whether a pair of photos , is near-duplicate by the following steps, as illustrated in Figure 2.
SIFT-based matching: for any pair of photos in this cluster, the method in [6] that embeds a one-to-one symmetric criterion to filter out false matches is applied. Figure 3(b) shows the effectiveness of false alarms reduction, as compared to a conventional approach (Figure 3(a)).
Orientation feature extraction: due to the characteristics of local coherence and spatial smoothness, the orientation of the link connecting matched points in two photos are similar. We calculate the orientation of links and quantize it into 36 levels. A 36-bin orientation histogram is then constructed. In near-duplicate pairs, the values of the orientation histogram would apparently concentrate.
SVM-based determination model: a SVM is used to model the characteristics of the orientation histogram. We estimate the model parameters based on 40 near-duplicate pairs and non-near-duplicate pairs. At the test stage, we make a binary decision on each photo pair based on the SVM classifier.
SIFT-based matching
Orientation feature
extraction
SVM-based determination
model
Near-duplicate
pairs
Figure 2. The process of near-duplicate detection.
(a)
(b)
Figure 3. Sample results of (a) conventional SIFT-based matching and (b) one-to-one symmetric SIFT-based matching.
2.3 Sub-Clustering Before Matching One of the critical issues in NDD is that there are tremendous pairs of photos should be examined. For example, if there are N photos in a set, totally different pairs of photo are needed to be checked. To reduce the complexity, we further cluster the given set of photos based on content-based characteristics. We then perform NDD for each sub-cluster, i.e., any two photos that are in different sub-clusters would not be examined.
Because the representative landmark or view would have similar appearance, we can reasonably assume that they would be categorized in the same sub-cluster. For example, if the set of N photos are categorized into M sub-clusters , the total number of pairs for NDD is
, (1) where is the number of photos in the ith sub-cluster. In the case of N = 10, M=2, , and , we need originally need to check photo pairs. However, we only have to evaluate photo pairs if we perform sub-clustering first. In this work, the sub-clustering process is implemented based on RGB histograms of photos.
3. REPRESENTATIVE SELECTION With loss of generality, assume that the sub-cluster in the set
contains the near-duplicate photos, i.e., the
830
Figure 2.11: SIFT matching between two similar images captured from dif-ferent angles.
Another technique for management of large photo collections is classification [101].
In classification, photo clusters are classified into categories such as events, mood,
composition, etc. In Das et al. [101], after grouping events by the technique pro-
posed by Loui et al. [31], the high-level time features for the event (e.g. event
duration and image density) with high-level image features (e.g. indoor/outdoor,
sky, snow) were determined. Subsequently, events can be classified into different
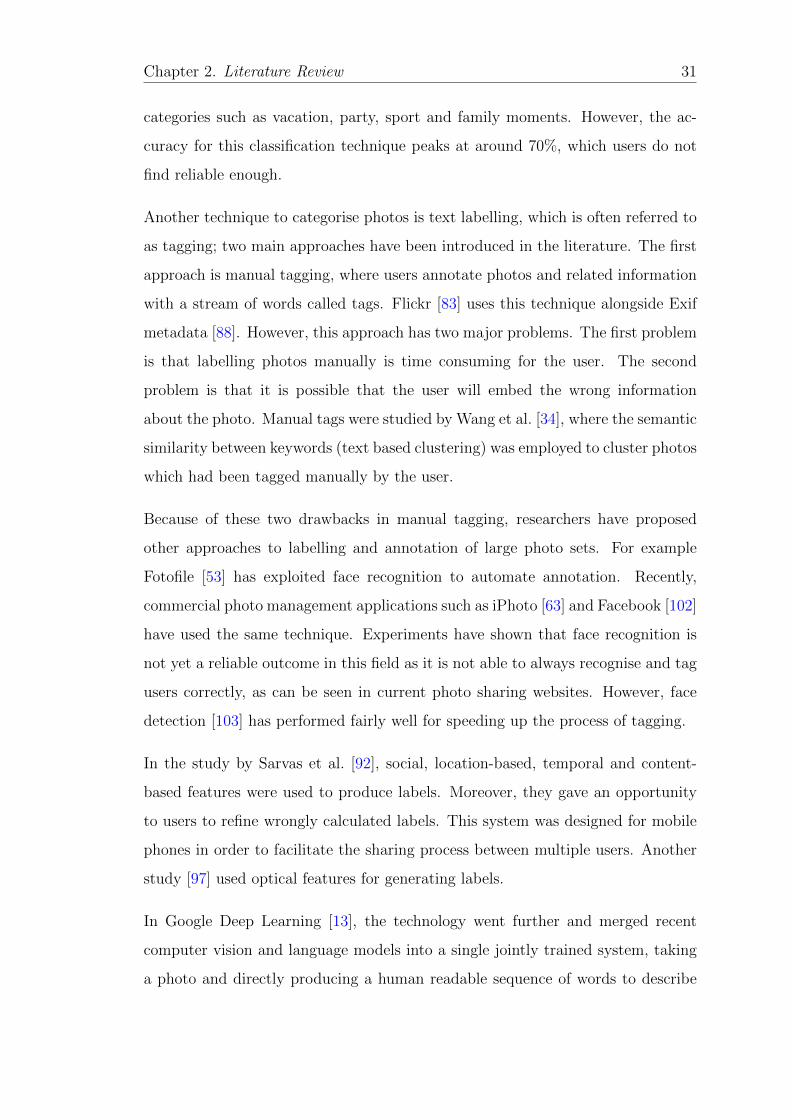
Chapter 2. Literature Review 31
categories such as vacation, party, sport and family moments. However, the ac-
curacy for this classification technique peaks at around 70%, which users do not
find reliable enough.
Another technique to categorise photos is text labelling, which is often referred to
as tagging; two main approaches have been introduced in the literature. The first
approach is manual tagging, where users annotate photos and related information
with a stream of words called tags. Flickr [83] uses this technique alongside Exif
metadata [88]. However, this approach has two major problems. The first problem
is that labelling photos manually is time consuming for the user. The second
problem is that it is possible that the user will embed the wrong information
about the photo. Manual tags were studied by Wang et al. [34], where the semantic
similarity between keywords (text based clustering) was employed to cluster photos
which had been tagged manually by the user.
Because of these two drawbacks in manual tagging, researchers have proposed
other approaches to labelling and annotation of large photo sets. For example
Fotofile [53] has exploited face recognition to automate annotation. Recently,
commercial photo management applications such as iPhoto [63] and Facebook [102]
have used the same technique. Experiments have shown that face recognition is
not yet a reliable outcome in this field as it is not able to always recognise and tag
users correctly, as can be seen in current photo sharing websites. However, face
detection [103] has performed fairly well for speeding up the process of tagging.
In the study by Sarvas et al. [92], social, location-based, temporal and content-
based features were used to produce labels. Moreover, they gave an opportunity
to users to refine wrongly calculated labels. This system was designed for mobile
phones in order to facilitate the sharing process between multiple users. Another
study [97] used optical features for generating labels.
In Google Deep Learning [13], the technology went further and merged recent
computer vision and language models into a single jointly trained system, taking
a photo and directly producing a human readable sequence of words to describe

Chapter 2. Literature Review 32
photos. Examples of Google Deep Learning with different error rates can be seen
in Figure 2.12.
Figure 2.12: Google Deep Learning technique examples [13].
In this section, we explained different methods for organising photo collections.
However, people still have many photos in their collection and even automatic
organisation of large numbers of photos might not satisfy users. Therefore, sum-
marisation of photo collections is used to increase user satisfaction of photo man-
agement. Summarisation of photo collections is described in the next section.
2.7 Summarisation of photo collections
Nowadays, there are many photos in our photo collections; however, we do not have
time to see all these photos and we do not want or do not have time to remove them
from our photo collections. Therefore, many of the photos in personal collections
are visually redundant. A good system can represent only a limited number of
photos from each photo collection in order to provide a better experience of viewing
photos. Therefore, providing a summary of photo streams plays an important role
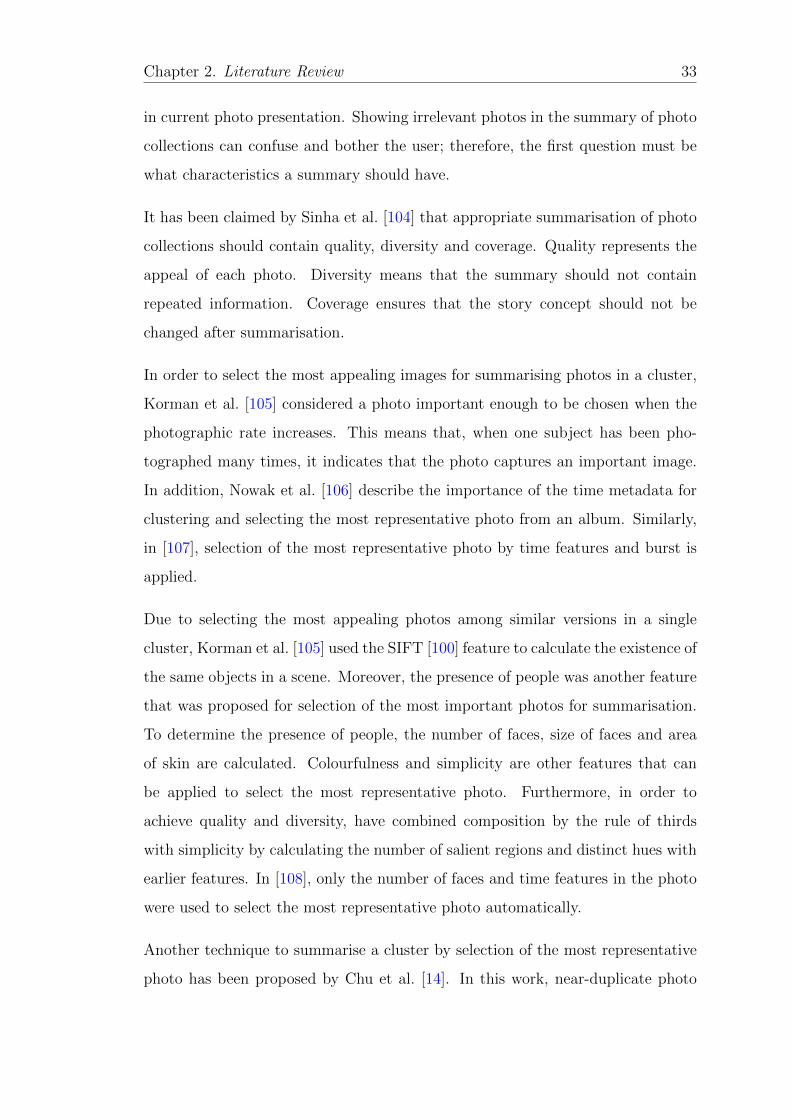
Chapter 2. Literature Review 33
in current photo presentation. Showing irrelevant photos in the summary of photo
collections can confuse and bother the user; therefore, the first question must be
what characteristics a summary should have.
It has been claimed by Sinha et al. [104] that appropriate summarisation of photo
collections should contain quality, diversity and coverage. Quality represents the
appeal of each photo. Diversity means that the summary should not contain
repeated information. Coverage ensures that the story concept should not be
changed after summarisation.
In order to select the most appealing images for summarising photos in a cluster,
Korman et al. [105] considered a photo important enough to be chosen when the
photographic rate increases. This means that, when one subject has been pho-
tographed many times, it indicates that the photo captures an important image.
In addition, Nowak et al. [106] describe the importance of the time metadata for
clustering and selecting the most representative photo from an album. Similarly,
in [107], selection of the most representative photo by time features and burst is
applied.
Due to selecting the most appealing photos among similar versions in a single
cluster, Korman et al. [105] used the SIFT [100] feature to calculate the existence of
the same objects in a scene. Moreover, the presence of people was another feature
that was proposed for selection of the most important photos for summarisation.
To determine the presence of people, the number of faces, size of faces and area
of skin are calculated. Colourfulness and simplicity are other features that can
be applied to select the most representative photo. Furthermore, in order to
achieve quality and diversity, have combined composition by the rule of thirds
with simplicity by calculating the number of salient regions and distinct hues with
earlier features. In [108], only the number of faces and time features in the photo
were used to select the most representative photo automatically.
Another technique to summarise a cluster by selection of the most representative
photo has been proposed by Chu et al. [14]. In this work, near-duplicate photo
Chapter 2. Literature Review 34
pairs are calculated. After that, SIFT is employed to capture the salient char-
acteristics over different image scales. Then, a support vector machine (SVM) is
used to model the characteristics of the orientation histogram. The criterion that
is utilised to choose the most representative photo between near duplicate pho-
tos is the photo which has the closest relation with other photos. This technique
provides a good approach for diversity; however, it has not been implemented to
support coverage of a story. An example of the relationship between near-duplicate
photos in this approach is shown in Figure 2.13.
photos with the landmark or specific views. Now the problem is to select one of the photos in to be the representative photo.
We can represent the relationship between near-duplicate photos as a non-directed, non-weighted graph , where
is a set in which any node (photo) is, at least one time, determined as a near-duplicate to someone else. The edge is in if and are detected as a near-duplicate pair. Figure 4 shows an illustrative example of graphical representation of the relationships.
(1)
(2)
(3)
(4) Figure 4. Relationship between near-duplicate photos.
Given this graph, we can determine the most important node by checking the “centrality value” of each node. From the idea of social network modeling, the person who is “closest” to all others plays the most important role. Similarly, we can say that the photo mostly near-duplicate to others is the most representative one. There are various measurements to evaluate the centrality value of each node. In this work, we evaluate the centrality value as the sum of in-degree of each node. Therefore, in Figure 4, the second photo would be selected as the representative photo.
4. SMART THUMBNAILING In order to ease users in browsing large amounts of albums at a glance, many photo sharing platforms facilitate users to manually select a representative photo and resize it to be the epitome of each album. A user often has many albums, in each the photos in the same scenic spot are stored. We address the selection issue before. However, the resized representative photos are often suffered from severe information loss, and we may only see the rough appearance of the landmark. This situation becomes even more critical as the rapid emergence of browsing photos on low-definition mobile devices.
In this section, we further determine the “representative region” in the selected representative photo. This task is similar to finding the region-of-interest in an image. After finding the ROI, we can just extract the region and generate a better thumbnail for the representative photo.
Currently, works on ROI determination are mostly based on the bottom-up approach proposed by Itti and Koch [7]. According to human vision system, the idea is to compute the contrast of color, intensity, and orientation, and then combines these factors to construct a saliency map that describes how a photo attracts humans. In this work, we develop the determination module from a different perspective. In photos of journeys, the ROIs in representative photos are landmarks or specific views. Therefore, we advocate that it’s more reasonable to find ROIs based on local
feature points that contribute to near-duplicate detection, rather than color or intensity contrast.
On the basis of this idea, we can take advantage of the byproducts produced in the process of NDD. As shown in Figure 5, we found that the matched points lie on or around the most important object in photos. These points provide the foundation of linking near-duplicate objects, and the near-duplicate objects are often the landmarks or specific views that should be in ROIs.
Figure 5. The matched SIFT points in representative photos.
Consider the most representative photo and its nearest duplicate . Let be the set of lines connecting a pair of SIFT matched points that are in and , respectively. As described in Sec. 2.2, the orientation of these lines
are gathered to construct a 36-bin orientation histogram . To determine the ROI in the most representative photo, we first find the SIFT points that confidently contributes to NDD. Based on the orientation histogram, the bin with the largest histogram value is:
(2) We select the lines which orientations fall into the -th bin or its two adjacent bins:
, (3) where denotes the bin where the orientation of the line is quantized into.
Let be the coordinates of the SIFT points that are in the representative photo and meet the eqn. (3). The left, right, top, and bottom boundaries ( ) of the desired ROI are determined by
where .
5. EXPERIMENTAL RESULTS We collected 509 photos from several different users, in which 26 clusters are included. The photo sets include famous buildings like the Notre Dame and the Brooklyn Bridge, famous landmarks like the Statue of Liberty and the Eiffel Tower, and famous scenes like the Niagara Fall.
5.1 Performance of Representative Selection To evaluate the performance of representative selection, which is involved with subjective judgment, we asked seven observers to give a score to each photo that is determined as a near-duplicate to others. The score ranges from one to five. Larger score is given
831
Figure 2.13: Example of the relationship between near-duplicate photos forselection of the most representative photo. Obtained from [14].
Another feature that has been employed for summarisation is the uniqueness of a
photo. In the work by Sinha [104], uniqueness means that there are not too many
photo shots from the same time in the photo collection. In contrast, in [105, 107]
it is claimed that a photo is attractive when many photo shots have been taken
at the same time. This contradiction shows the importance of both close and far
Chapter 2. Literature Review 35
photos in summarisation of different states and moments. Another feature that
can be used to select the most representative photo is suggested in [109], where
it is stated that the cluster with more than one photographer is more appealing,
alongside using location metadata for summarisation of photo collections.
In this section, the summarisation of photo collections was described. However,
photography is not just about organisation and visualisation of photo collections.
Photo sharing is becoming a common way of maintaining closeness and relation-
ships with friends and family, and it can evoke pleasurable, enjoyable and exciting
experiences. People have fun when sharing photos containing nice scenes or friends
being caught doing something interesting. Therefore, photo sharing concepts and
their applications are explained in the next section.
2.8 Photo sharing
Photos are shared daily between people. Frohlich [2] proposed a framework which
shows that the main elements of photo sharing are the photographer, the subject,
the audience and the photo. He also defined recognition, interpretation, reminisc-
ing and storytelling by the relationship between the mentioned main elements of
photo sharing. The main elements of photo sharing and their relationships can be
seen in Figure 2.14.
Photo sharing has been widely studied in HCI. Most social networking services [110]
allow users to share their photos. Kirk et al. [24] found and classified the activity
of people in photography in a process which they called “photowork” whereby pat-
terns are identified prior to photos being shared. Digital photography is studied
widely in [15, 29].
Frohlich et al. [28] introduced a taxonomy to analyse the different states of photo
sharing in the digital era. The two main elements of photo sharing based on
the Frohlich taxonomy are the time and place. Co-present sharing is when sharing
takes place at the same time but different place. Remote sharing is when photos are
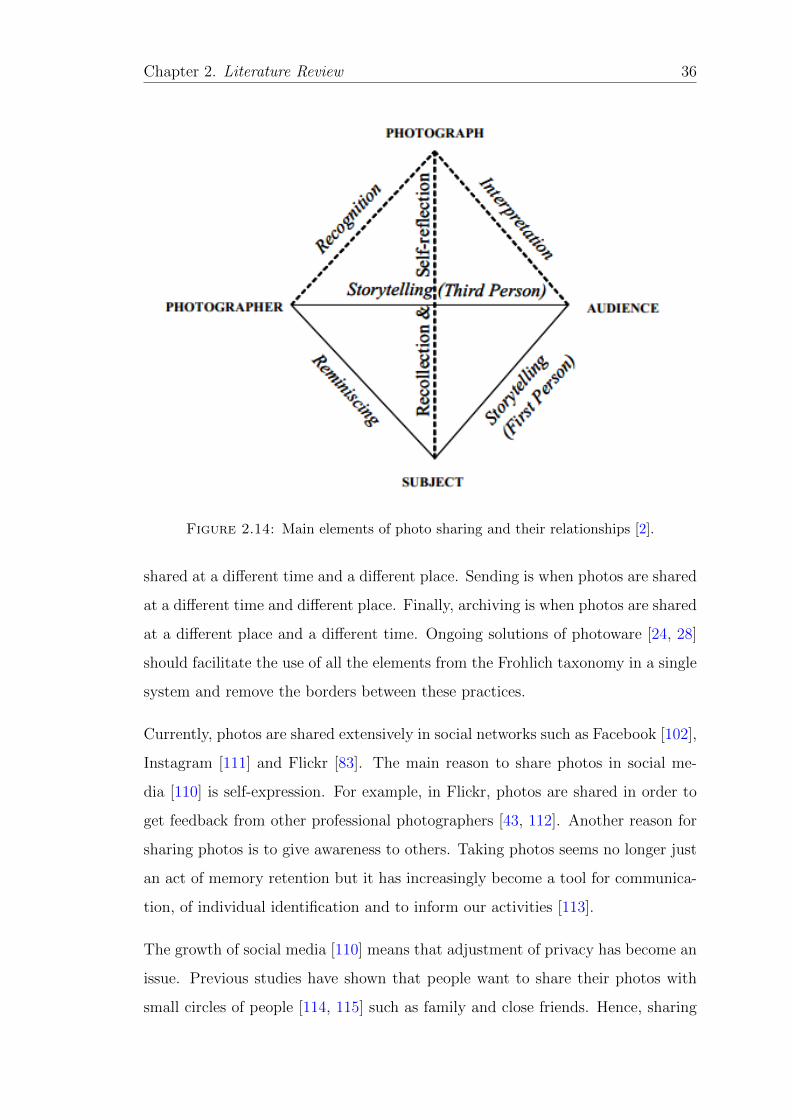
Chapter 2. Literature Review 36
Figure 2.14: Main elements of photo sharing and their relationships [2].
shared at a different time and a different place. Sending is when photos are shared
at a different time and different place. Finally, archiving is when photos are shared
at a different place and a different time. Ongoing solutions of photoware [24, 28]
should facilitate the use of all the elements from the Frohlich taxonomy in a single
system and remove the borders between these practices.
Currently, photos are shared extensively in social networks such as Facebook [102],
Instagram [111] and Flickr [83]. The main reason to share photos in social me-
dia [110] is self-expression. For example, in Flickr, photos are shared in order to
get feedback from other professional photographers [43, 112]. Another reason for
sharing photos is to give awareness to others. Taking photos seems no longer just
an act of memory retention but it has increasingly become a tool for communica-
tion, of individual identification and to inform our activities [113].
The growth of social media [110] means that adjustment of privacy has become an
issue. Previous studies have shown that people want to share their photos with
small circles of people [114, 115] such as family and close friends. Hence, sharing
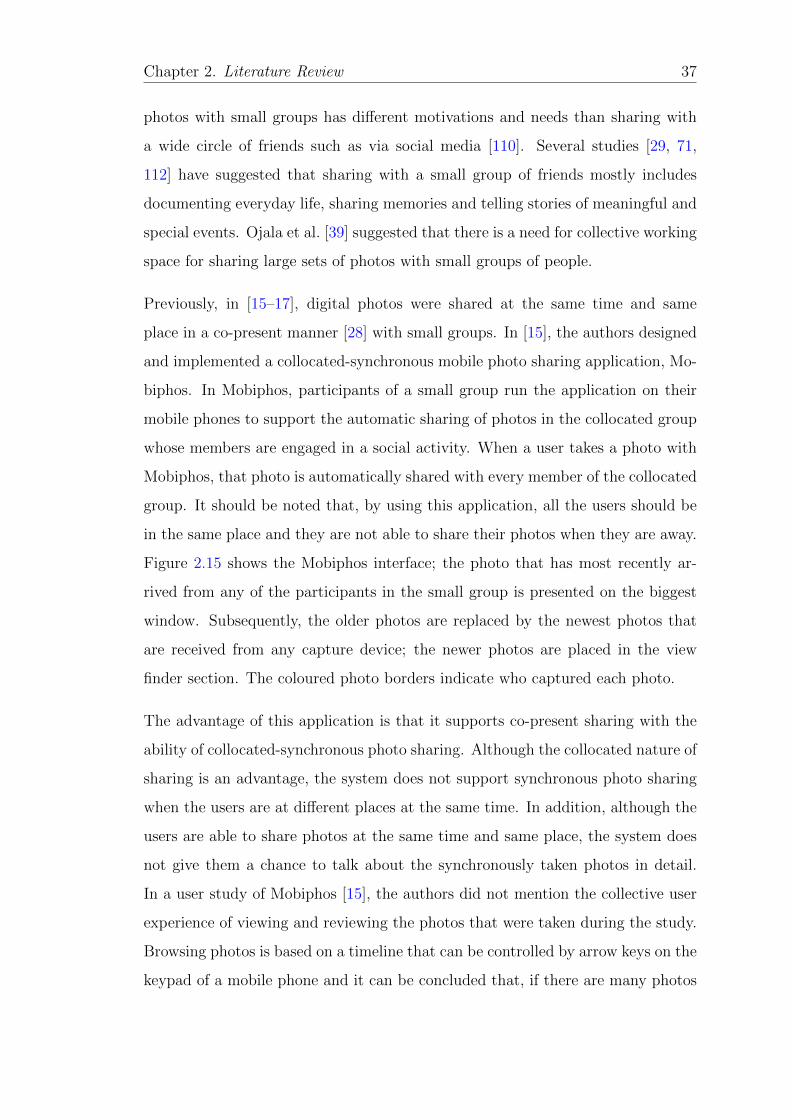
Chapter 2. Literature Review 37
photos with small groups has different motivations and needs than sharing with
a wide circle of friends such as via social media [110]. Several studies [29, 71,
112] have suggested that sharing with a small group of friends mostly includes
documenting everyday life, sharing memories and telling stories of meaningful and
special events. Ojala et al. [39] suggested that there is a need for collective working
space for sharing large sets of photos with small groups of people.
Previously, in [15–17], digital photos were shared at the same time and same
place in a co-present manner [28] with small groups. In [15], the authors designed
and implemented a collocated-synchronous mobile photo sharing application, Mo-
biphos. In Mobiphos, participants of a small group run the application on their
mobile phones to support the automatic sharing of photos in the collocated group
whose members are engaged in a social activity. When a user takes a photo with
Mobiphos, that photo is automatically shared with every member of the collocated
group. It should be noted that, by using this application, all the users should be
in the same place and they are not able to share their photos when they are away.
Figure 2.15 shows the Mobiphos interface; the photo that has most recently ar-
rived from any of the participants in the small group is presented on the biggest
window. Subsequently, the older photos are replaced by the newest photos that
are received from any capture device; the newer photos are placed in the view
finder section. The coloured photo borders indicate who captured each photo.
The advantage of this application is that it supports co-present sharing with the
ability of collocated-synchronous photo sharing. Although the collocated nature of
sharing is an advantage, the system does not support synchronous photo sharing
when the users are at different places at the same time. In addition, although the
users are able to share photos at the same time and same place, the system does
not give them a chance to talk about the synchronously taken photos in detail.
In a user study of Mobiphos [15], the authors did not mention the collective user
experience of viewing and reviewing the photos that were taken during the study.
Browsing photos is based on a timeline that can be controlled by arrow keys on the
keypad of a mobile phone and it can be concluded that, if there are many photos
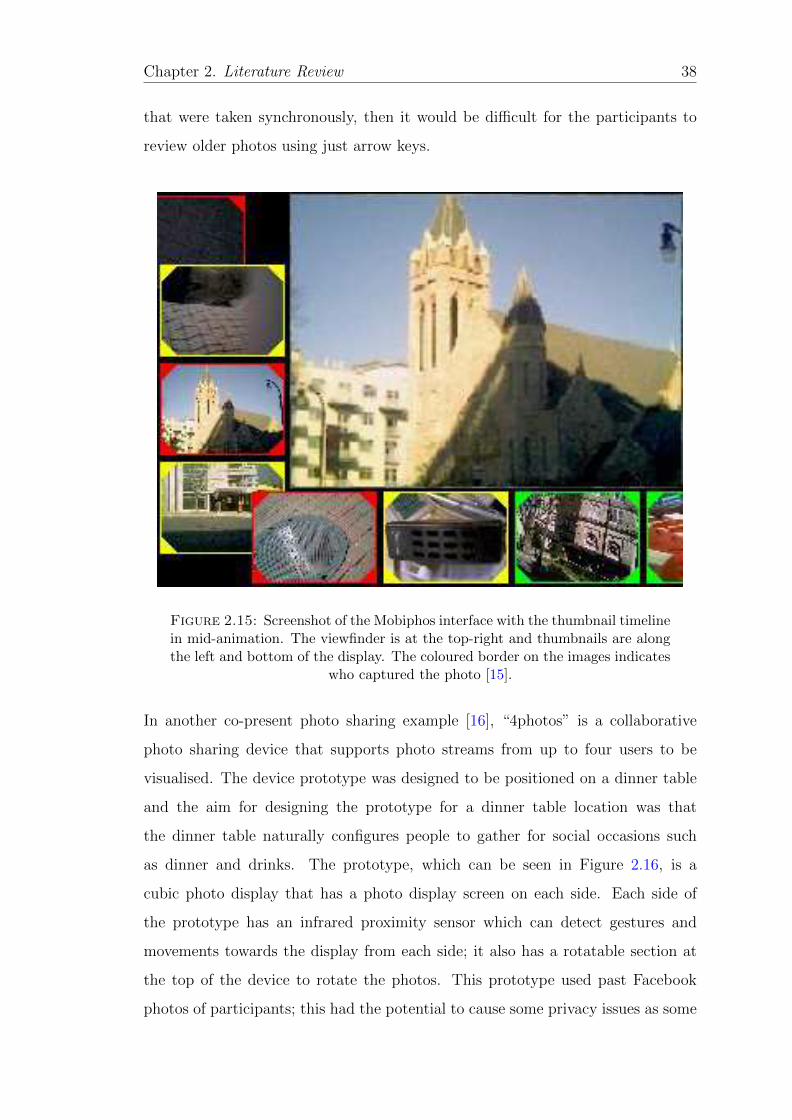
Chapter 2. Literature Review 38
that were taken synchronously, then it would be difficult for the participants to
review older photos using just arrow keys.
Figure 1: A screenshot of the Mobiphos interface with thethumbnail timeline in mid-animation. The viewfinder is inthe top–right and thumbnails are along the left and bottom ofthe display. The colored border on the images indicates whocaptured the photograph.
Due to the real–time sharing nature of Mobiphos, there areseveral interaction challenges that must be overcome. Traditionaldigital cameras use the LCD screen for multiple purposes. Duringimage capture it serves as a digital viewfinder showing the userthe image they are about to capture. The LCD can also be usedto browse images and thumbnails of photographs already captured.In Mobiphos, we need to combine these two modes into one toallow the user to simultaneously take new photos using the digitalviewfinder as well as review photos being shared.
Our design uses the top–right,34 of the screen as the viewfinder
while the remaining area of the display to the left and bottom ofthe viewfinder shows thumbnails in a timeline (Figures 1 and 2).The timeline positions the most recent picture in the top–left cornerwith the rest of the thumbnails oriented in an L–shape around theviewfinder from newest to oldest. This design allows the user bothto take new pictures and view older photographs at the same time.
When a new photograph is captured by the user, or a photo comesfrom another camera running Mobiphos, the thumbnails on the leftmove down as the thumbnails along the bottom move to the right(Figure 2). This process clears a space in the top–left corner ofthe display to hold the thumbnail of the newly captured photo.As new pictures enter the thumbnail timeline from the top-left,older thumbnails leave through the bottom-right. In both cases,animation is employed to help the user better understand the stateof the system. If the new thumbnail is coming from a picture takenby the user then the captured picture scales down from its originalplace in the viewfinder to the top–left thumbnail slot. Additionally,this thumbnail also receives an overlay, drawn like a picture frame,with a color specific to the user who captured the photo. If thenew picture comes from another user, a thumbnail slides in fromoff screen to the top–left position to signify that it was not a picturetaken by the user holding the camera.
Each thumbnail is 116 of the total screen size allowing us to
place seven thumbnails onto the display along with the viewfinder(Figure 2). Three thumbnails are positioned to the left of theviewfinder, one in the bottom–left corner and three below theviewfinder.
The user can navigate the thumbnail timeline by using thedirectional keypad on the device. Again we employ animation to
Figure 2: The viewfinder is represented in the top–right ofthe display. When the user takes an image, the picture fromthe viewfinder animates into the top–left corner (a). When animage comes from another user, it is also placed in the top–left (b). Either of these events cause the timeline to animatewrapping around the bottom–left corner (c) and the oldestimage is moved off screen (d).
help the user understand how she is navigating through the timeline.The user can scroll the timeline back to view older images. In thiscase, the timeline flows in the direction opposite to that shown inFigure 2 from (d) to (c) to (b). The user could also return to newerimages and following the animation from (b) to (c) to (d). Thisvisualization helps to indicate to the user the direction in whichshe is navigating. The longer a user holds down a direction on thekeypad, the faster the timeline will move in that direction. Whenthe user releases the button the speed diminishes and the timelinecomes to rest quickly.
A user can use the touch screen to select and view a largerversion of an image. Tapping on the desired thumbnail triggersthe animated movement of the image from its current location inthe timeline to the location of the viewfinder, gradually increasingthe size of the thumbnail until it fills the area designated for theviewfinder. The previous location of the thumbnail in the timelineis now shown as a white frame on a gray background allowing theuser to know where this picture resides in the timeline. When animage is dismissed, it shrinks back to the timeline in its appropriatelocation.
Whenever a user selects a photo to view at a larger size, all otherMobiphos devices are alerted of this focusing. The other deviceswill then see a colored dot appear in the top–right corner of theirscreen, where the color is used to indicate which user is performingthe focusing action. If another user wants to view the photo ofinterest, they can tap on the dot in the top–right corner. This willslide in a window which shows the focus of all users in the group.To view the same photo as another user they can tap on that photo.This will both dismiss the window and scale up the chosen photo.The user can also dismiss the window without choosing any photo.
3.1 ImplementationDue to the lack of programmable standalone digital cameras,
Mobiphos was implemented on a Motorola E680i Linux–basedcamera phone (Figure 3). The application was developed in Python.PyGame, a wrapper for SDL, was used to create the user interfaceelements and the standard Python socket library was used fornetworking the devices together over WiFi (802.11b). Additionally,we developed Python modules to allow for direct interaction withthe camera. The E680i is held in “landscape” mode to give it the
FP 189
Figure 2.15: Screenshot of the Mobiphos interface with the thumbnail timelinein mid-animation. The viewfinder is at the top-right and thumbnails are alongthe left and bottom of the display. The coloured border on the images indicates
who captured the photo [15].
In another co-present photo sharing example [16], “4photos” is a collaborative
photo sharing device that supports photo streams from up to four users to be
visualised. The device prototype was designed to be positioned on a dinner table
and the aim for designing the prototype for a dinner table location was that
the dinner table naturally configures people to gather for social occasions such
as dinner and drinks. The prototype, which can be seen in Figure 2.16, is a
cubic photo display that has a photo display screen on each side. Each side of
the prototype has an infrared proximity sensor which can detect gestures and
movements towards the display from each side; it also has a rotatable section at
the top of the device to rotate the photos. This prototype used past Facebook
photos of participants; this had the potential to cause some privacy issues as some
Chapter 2. Literature Review 39
participants were worried about the use of photos that they did not wish to show to
others. However, overall, this device was useful as a conversational resource among
users who intended to share their photos and talk about them during mealtimes
in a co-present sharing environment. This system does not support real-time
photo sharing in the way that Mobiphos [15] does, but, instead, it creates a good
environment for communication while viewing photos, which Mobiphos does not
do.
Figure 2.16: 4photos prototype [16].
Kun and Marsden [17] designed an application that allows users to share photos
with other co-present users by synchronising the display on multiple mobile de-
vices. In this system, each user can share a photo and then other users can see that
photo on their mobile phones when they are together. Kun and Marsden intro-
duced three techniques: host-token, three-second and ad-hoc. In host-token, the
person who has the permission can show their photos on the screen of all mobile
devices. However, in three-second, each user has three seconds to show his photo.
In ad-hoc, there is no permission and all users can show their photos whenever
they decide. Kun and Marsden found that, for applications of this nature which
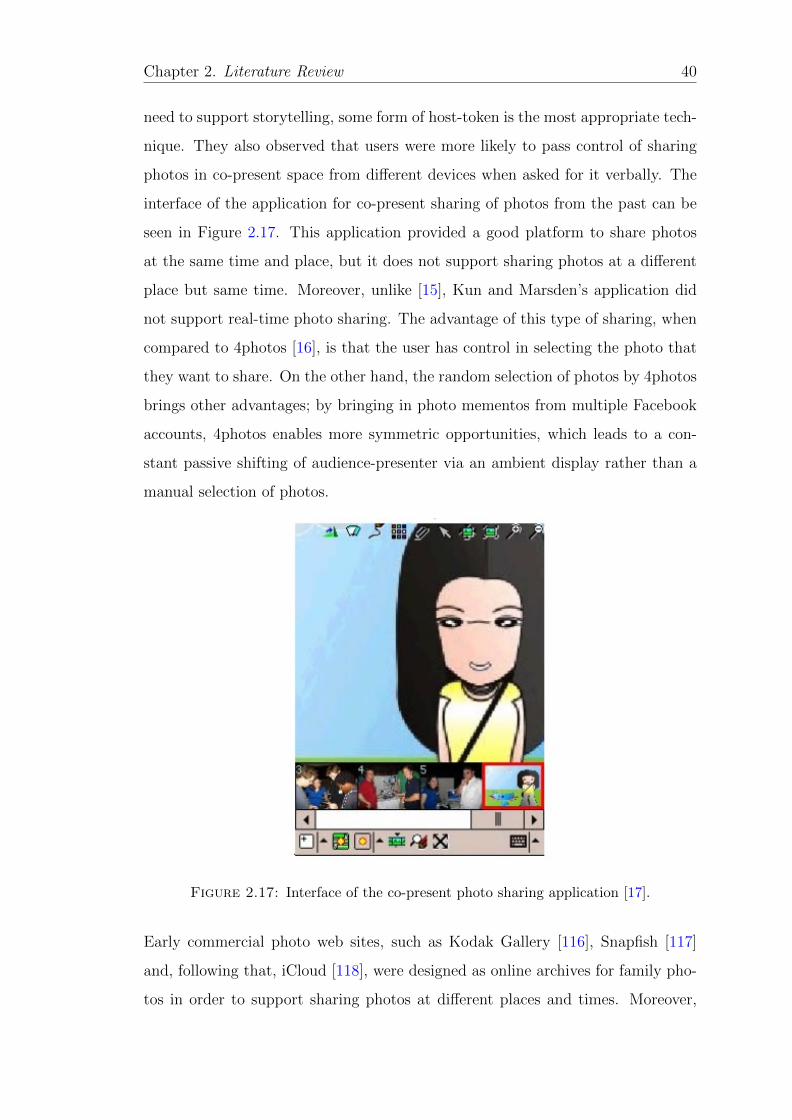
Chapter 2. Literature Review 40
need to support storytelling, some form of host-token is the most appropriate tech-
nique. They also observed that users were more likely to pass control of sharing
photos in co-present space from different devices when asked for it verbally. The
interface of the application for co-present sharing of photos from the past can be
seen in Figure 2.17. This application provided a good platform to share photos
at the same time and place, but it does not support sharing photos at a different
place but same time. Moreover, unlike [15], Kun and Marsden’s application did
not support real-time photo sharing. The advantage of this type of sharing, when
compared to 4photos [16], is that the user has control in selecting the photo that
they want to share. On the other hand, the random selection of photos by 4photos
brings other advantages; by bringing in photo mementos from multiple Facebook
accounts, 4photos enables more symmetric opportunities, which leads to a con-
stant passive shifting of audience-presenter via an ambient display rather than a
manual selection of photos.
Figure 2.17: Interface of the co-present photo sharing application [17].
Early commercial photo web sites, such as Kodak Gallery [116], Snapfish [117]
and, following that, iCloud [118], were designed as online archives for family pho-
tos in order to support sharing photos at different places and times. Moreover,
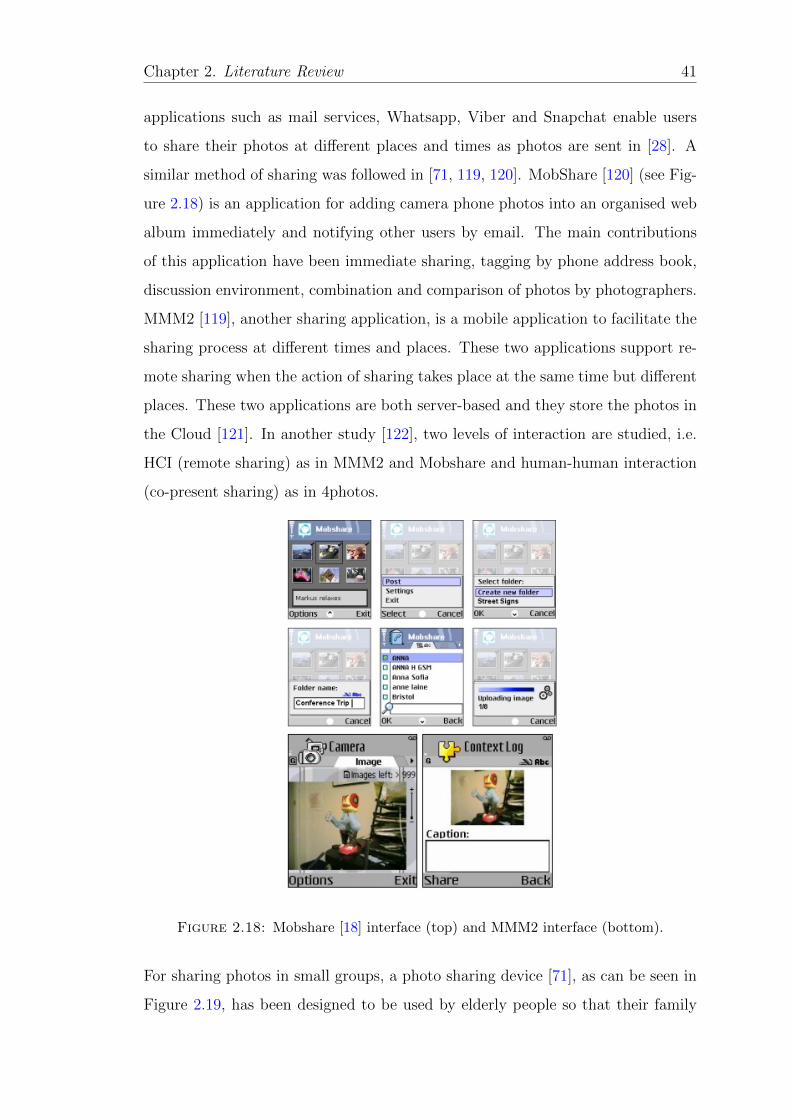
Chapter 2. Literature Review 41
applications such as mail services, Whatsapp, Viber and Snapchat enable users
to share their photos at different places and times as photos are sent in [28]. A
similar method of sharing was followed in [71, 119, 120]. MobShare [120] (see Fig-
ure 2.18) is an application for adding camera phone photos into an organised web
album immediately and notifying other users by email. The main contributions
of this application have been immediate sharing, tagging by phone address book,
discussion environment, combination and comparison of photos by photographers.
MMM2 [119], another sharing application, is a mobile application to facilitate the
sharing process at different times and places. These two applications support re-
mote sharing when the action of sharing takes place at the same time but different
places. These two applications are both server-based and they store the photos in
the Cloud [121]. In another study [122], two levels of interaction are studied, i.e.
HCI (remote sharing) as in MMM2 and Mobshare and human-human interaction
(co-present sharing) as in 4photos.
Figure 2.18: Mobshare [18] interface (top) and MMM2 interface (bottom).
For sharing photos in small groups, a photo sharing device [71], as can be seen in
Figure 2.19, has been designed to be used by elderly people so that their family
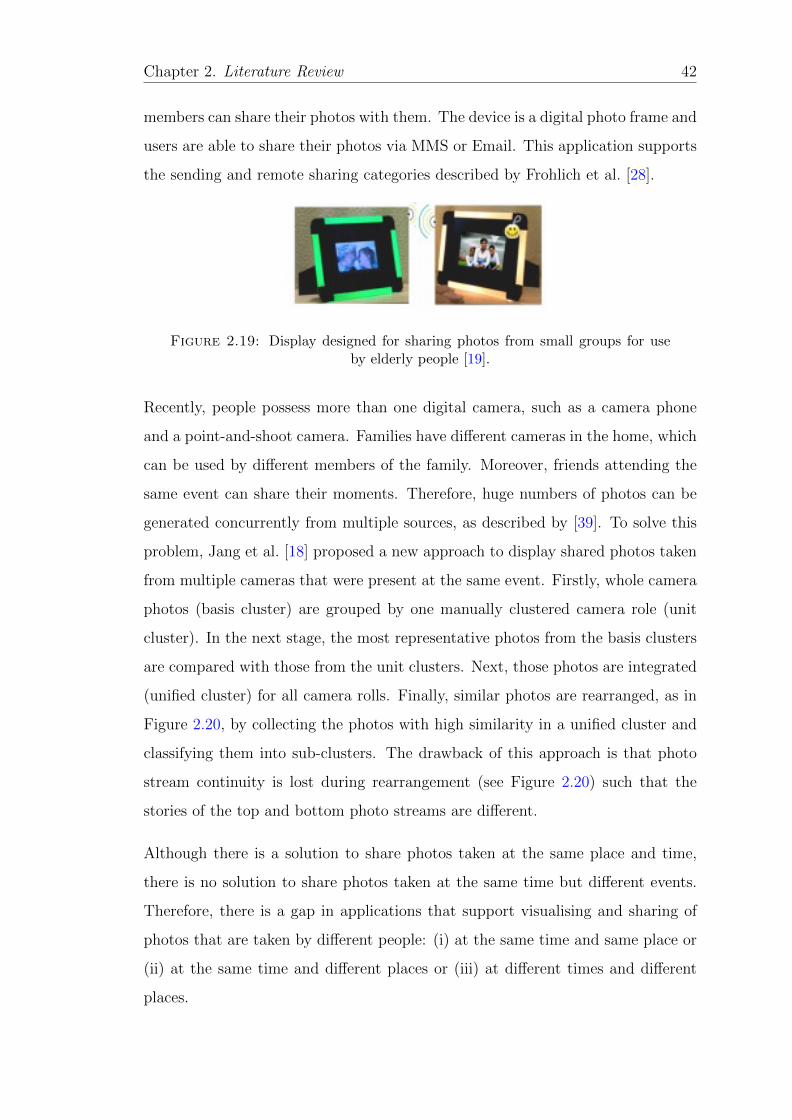
Chapter 2. Literature Review 42
members can share their photos with them. The device is a digital photo frame and
users are able to share their photos via MMS or Email. This application supports
the sending and remote sharing categories described by Frohlich et al. [28].
Figure 2.19: Display designed for sharing photos from small groups for useby elderly people [19].
Recently, people possess more than one digital camera, such as a camera phone
and a point-and-shoot camera. Families have different cameras in the home, which
can be used by different members of the family. Moreover, friends attending the
same event can share their moments. Therefore, huge numbers of photos can be
generated concurrently from multiple sources, as described by [39]. To solve this
problem, Jang et al. [18] proposed a new approach to display shared photos taken
from multiple cameras that were present at the same event. Firstly, whole camera
photos (basis cluster) are grouped by one manually clustered camera role (unit
cluster). In the next stage, the most representative photos from the basis clusters
are compared with those from the unit clusters. Next, those photos are integrated
(unified cluster) for all camera rolls. Finally, similar photos are rearranged, as in
Figure 2.20, by collecting the photos with high similarity in a unified cluster and
classifying them into sub-clusters. The drawback of this approach is that photo
stream continuity is lost during rearrangement (see Figure 2.20) such that the
stories of the top and bottom photo streams are different.
Although there is a solution to share photos taken at the same place and time,
there is no solution to share photos taken at the same time but different events.
Therefore, there is a gap in applications that support visualising and sharing of
photos that are taken by different people: (i) at the same time and same place or
(ii) at the same time and different places or (iii) at different times and different
places.
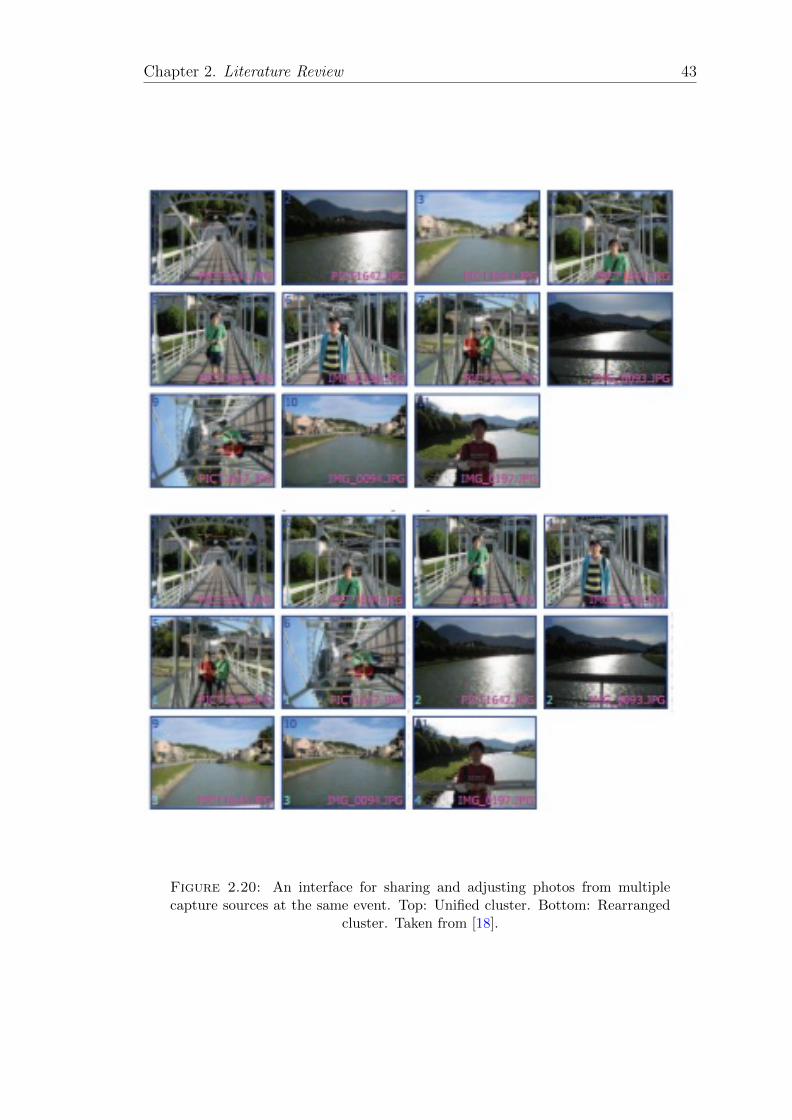
Chapter 2. Literature Review 43
Figure 2.20: An interface for sharing and adjusting photos from multiplecapture sources at the same event. Top: Unified cluster. Bottom: Rearranged
cluster. Taken from [18].
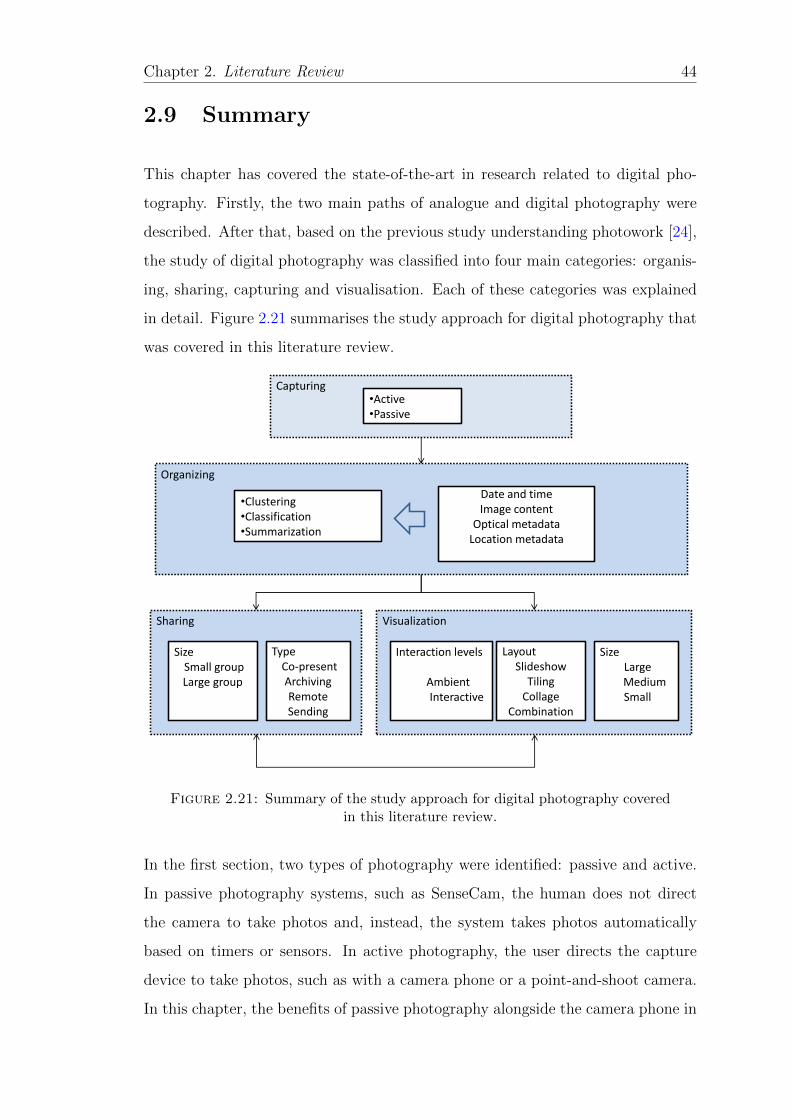
Chapter 2. Literature Review 44
2.9 Summary
This chapter has covered the state-of-the-art in research related to digital pho-
tography. Firstly, the two main paths of analogue and digital photography were
described. After that, based on the previous study understanding photowork [24],
the study of digital photography was classified into four main categories: organis-
ing, sharing, capturing and visualisation. Each of these categories was explained
in detail. Figure 2.21 summarises the study approach for digital photography that
was covered in this literature review.
Capturing
Organizing
Visualization Sharing
•Clustering •Classification •Summarization
Date and time Image content
Optical metadata Location metadata
•Active •Passive
Layout Slideshow
Tiling Collage
Combination
Size Large
Medium Small
Interaction levels
Ambient Interactive
Type Co-present
Archiving Remote Sending
Size Small group Large group
Figure 2.21: Summary of the study approach for digital photography coveredin this literature review.
In the first section, two types of photography were identified: passive and active.
In passive photography systems, such as SenseCam, the human does not direct
the camera to take photos and, instead, the system takes photos automatically
based on timers or sensors. In active photography, the user directs the capture
device to take photos, such as with a camera phone or a point-and-shoot camera.
In this chapter, the benefits of passive photography alongside the camera phone in
Chapter 2. Literature Review 45
active photography were explained. It can be concluded that the future of photog-
raphy will be based on these two types of photography and that, although passive
photography is not common, it might be very popular because of its particular
benefits.
In the second section of this chapter, visualisation in digital photography was
described. It has been found from the literature that there are four main techniques
to present digital photos: collage, slideshow, tiling and a combination of these
techniques such as a tiled slideshow. For collage, photos are placed and displayed in
similar or different sizes on one screen, while for tiling, the photos are shown mostly
in tile or thumbnail format to offer more space on the screen for the user to browse
photos. The previous studies also showed that slideshow is a good technique
for ambient displays, decoration photo display tools, reviewing old photos and
storytelling. The combination of these methods, such as tiled slideshow, can be
used to show more than one photo of the same event in each slide during the
slideshow.
Also in the second section of this chapter, two types of displays for visualisation of
photos were introduced: interactive and ambient displays. In interactive displays,
users interact with features that the designer provides for them on the display in
order to browse and view photos. In ambient displays, the user interaction with
the system is decreased and the system presents photos to the user automatically
without the user’s interaction.
In the third section of this chapter, it was explained that there are three main
important techniques to organise photos: classification, clustering and summari-
sation. In clustering, photos from the same categories are collected in one place to
allow the user to see more related photos of interest together. In summarisation,
as the number of photos grows in time, the collections become abstracted based
on user interest or automated algorithms that identify the most representative
collection. Moreover, in classification, photos from the same category are given a
meaningful name automatically from a trained data set. Examples of such mean-
ingful names and categories are: outdoor, indoor, party, happy etc. The difference
Chapter 2. Literature Review 46
between classification and clustering is that classification gives a meaningful cap-
tion to photo albums while clustering just collects the related photos into different
groups without any meaningful caption.
All of these techniques for organising photos take advantage of at least one of
the time, location, optical metadata and image content features. However, time
is the most important, prominent and basic feature by which to organise photo
collections.
In the last section, it was explained how sharing photos is very common and
how people share their photos on an everyday basis. Photos can be shared with
large or small groups of friends and sharing photos with small groups of friends
is common in the current photo sharing trend. Moreover, it is apparent from
the literature that there is a need to share photos within small groups of people
such as friends or family members. The main elements of photo sharing are the
subject, photographer, audience and the photo. Following that, we explained the
types of photo sharing based on time and place, and concluded that good photo
sharing platforms should support co-present sharing, remote sharing, archiving and
sending photos to one place. It was also found that there is no current application
that is able to display multiple photo streams from different people in one place.
Having all these observations in mind, it is concluded that people use multiple
capture devices, they have very large photo collections and they desire to share
their photos with a small group of friends such as family members or close friends.
There are applications that enable users to share their photos in collocated envi-
ronments in real time or to share and re-organise photos that were taken at the
same event. However, there is no application to support users to share and visu-
alise their photos in both remote and collocated environments. Moreover, current
applications do not support visualisation of multiple photo streams from different
people in one place. Therefore, we identify that there is a need for an application
that supports sharing and visualisation of multiple photo streams that have been
collected from multiple sources.
Chapter 2. Literature Review 47
From this literature review, the foundation of the research that is presented in this
thesis is described:
1. There is a need for photo sharing applications that display multiple photo
streams that have been collected from different people or from different cap-
ture devices.
2. Time is the main aspect of photo organisation.
3. Multiple photo streams have been shared previously when they were taken
in collocated environments. A valuable application will allow multiple photo
streams to be shared and compared in both collocated and remote environ-
ments based on the main characteristics of photo organisation; the primary
characteristic is time (same time, different place or same time, same place).
4. Multiple photo streams from different people can be presented in one place
to bring awareness from one’s own photo stream and other people’s photo
streams.
5. A good photo sharing application may use a combination of interactive and
ambient displays in different conditions.
6. Slideshow format is the most common technique for displaying photos on an
ambient display or when the user wishes to view the content of the photos
in more detail. Moreover, slideshow format is the basis of photographic
storytelling tools.
7. A good photo sharing and visualisation application should support both
passive and active photo collections.
8. A good photo sharing application should support co-present sharing, remote
sharing, sending and archiving in one place.
9. Creating applications to support photo sharing with a small group of people
because of privacy issues is essential.

Chapter 2. Literature Review 48
10. Using the multiple narrative technique in photo storytelling might be the
future of the photo visualisation applications.
Based on these findings, a study, design and analysis of a system for synchronised
sharing and visualisation of multiple photo streams is presented in the following
chapters. An overview of the adopted methodology is given in the next chapter.
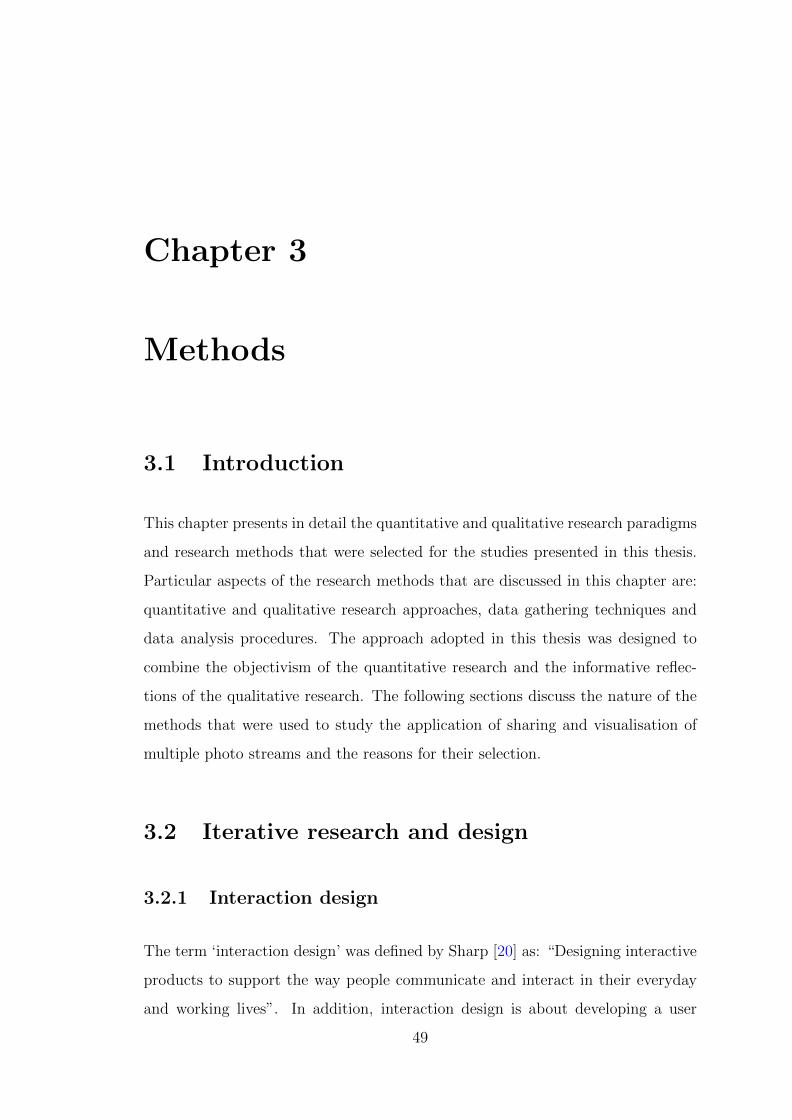
Chapter 3
Methods
3.1 Introduction
This chapter presents in detail the quantitative and qualitative research paradigms
and research methods that were selected for the studies presented in this thesis.
Particular aspects of the research methods that are discussed in this chapter are:
quantitative and qualitative research approaches, data gathering techniques and
data analysis procedures. The approach adopted in this thesis was designed to
combine the objectivism of the quantitative research and the informative reflec-
tions of the qualitative research. The following sections discuss the nature of the
methods that were used to study the application of sharing and visualisation of
multiple photo streams and the reasons for their selection.
3.2 Iterative research and design
3.2.1 Interaction design
The term ‘interaction design’ was defined by Sharp [20] as: “Designing interactive
products to support the way people communicate and interact in their everyday
and working lives”. In addition, interaction design is about developing a user
49
Chapter 3. Methods 50
experience that improves the way people communicate, interact and work. Wino-
grad [123] described the interaction design as designing spaces for human commu-
nication and interaction, and Thackara [124] sees interaction design as why and
how our daily interaction works using computers. The main goal of interaction
design is concerned with how to design a system and a user experience by using a
range of methods, techniques and frameworks.
Interaction design is vital for all disciplines, fields and approaches that are con-
cerned with researching and designing computer-based systems for humans [20].
A concept that comes with interaction design is user experience; this means how
a designed product or software is used by someone in the real world and, as Gar-
rete [125] said, every thing that is being used by a human has a user experience.
To be more precise, user experience concerns how people feel about a product and
their pleasure, interest and satisfaction when using it.
The process of interaction design involves four basic processes [20] :
1. Identifying the needs and establishing the requirements for the user experi-
ence.
2. Developing alternative designs that meet those requirements.
3. Building interactive versions of the designs so that they can be communicated
and assessed.
4. Evaluating what is being built throughout the process and the user experi-
ence it offers.
In addition, a simple interaction design lifecycle model includes four components,
starting with identifying needs and establishing requirements. This is performed
by reviewing and analysing current literature and designs and is, then, followed by
the remaining three components: design, building and evaluation. The relation-
ship between these components, which leads to the final product, can be seen in
Figure 3.1. In this thesis, we took advantage of the interaction design process in
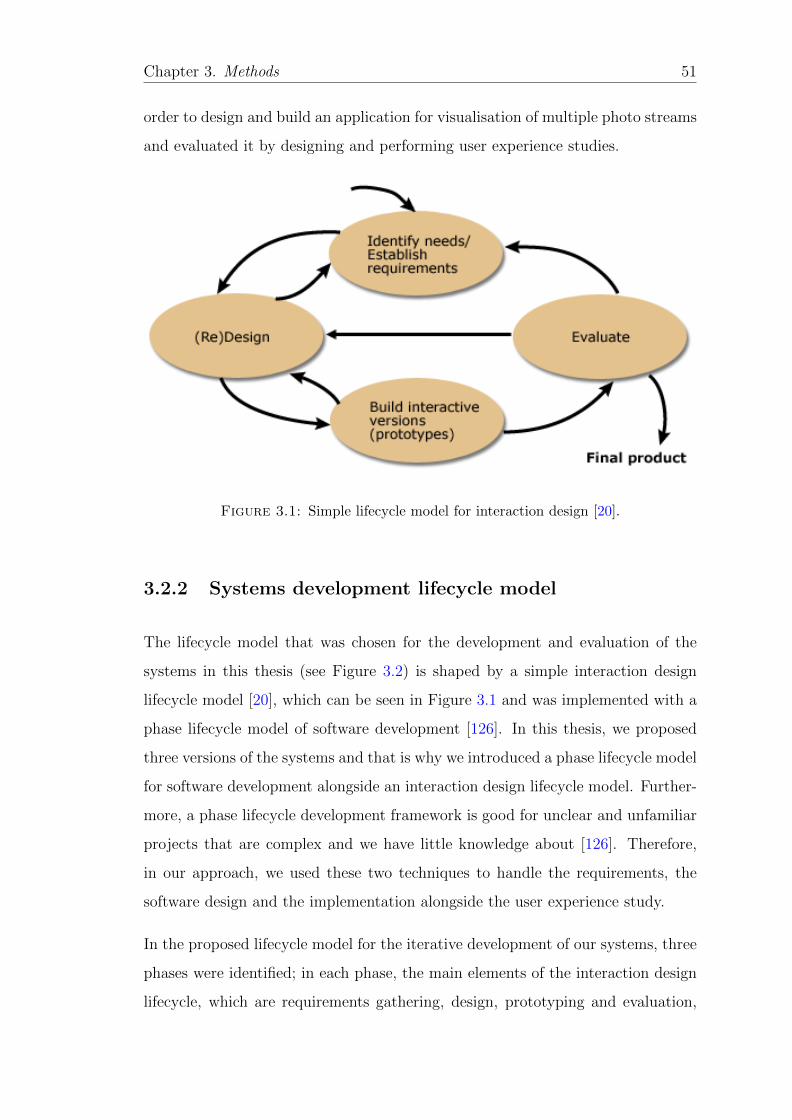
Chapter 3. Methods 51
order to design and build an application for visualisation of multiple photo streams
and evaluated it by designing and performing user experience studies.
Figure 3.1: Simple lifecycle model for interaction design [20].
3.2.2 Systems development lifecycle model
The lifecycle model that was chosen for the development and evaluation of the
systems in this thesis (see Figure 3.2) is shaped by a simple interaction design
lifecycle model [20], which can be seen in Figure 3.1 and was implemented with a
phase lifecycle model of software development [126]. In this thesis, we proposed
three versions of the systems and that is why we introduced a phase lifecycle model
for software development alongside an interaction design lifecycle model. Further-
more, a phase lifecycle development framework is good for unclear and unfamiliar
projects that are complex and we have little knowledge about [126]. Therefore,
in our approach, we used these two techniques to handle the requirements, the
software design and the implementation alongside the user experience study.
In the proposed lifecycle model for the iterative development of our systems, three
phases were identified; in each phase, the main elements of the interaction design
lifecycle, which are requirements gathering, design, prototyping and evaluation,
Chapter 3. Methods 52
EvaluationRequirements
Design Prototype
Literature2review
Design21Prototype21:Chapter24
User2study21:Chapter25
2Requirements2Chapter25
Design22
Prototype22Chapter26
User2study22:Chapter27
2Requirements:2Chapters252and27
Design23
Prototype23:Chapter28
User2study23:Chapter29
Conclusion: Chapter 10
Figure 3.2: Lifecycle model for systems development.
were applied. From the evaluation of each phase, the requirements for the next
phase were identified.
Phase 1 Phase 1 starts with identifying the requirements for visualisation and
sharing of digital photos. From the literature review (Chapter 2), we found that
there is a need to organise, share and visualise photo collections. Furthermore, we
identified that, in current photography practice, people tend to share their photos
more than view their own photo collections. Therefore, large numbers of photos
from different people are generated. In the literature, we found that people possess
Chapter 3. Methods 53
multiple capture devices and, alongside the social networks, they have photos that
they consider as part of their own photo collections. Moreover, people wish to
know what is happening to others and there is a need to share photos with small
groups of people such as family or friends.
Based on this information, we decided that there is a need to design and imple-
ment an application (Chapter 4) to visualise multiple photo streams from different
people in one place; this would create an environment to enable the user to see
their own photo collection alongside those from other people in one place and
compare their past photos in time. The connectivity between people was the main
characteristic of this design for photo sharing. Therefore, our first system was a
web-based photo sharing service that enabled people to upload their photos to
a website and then to view multiple photo streams obtained concurrently from
multiple users in slideshow mode.
After the implementation of the web-based application for sharing and visualisa-
tion of multiple photo streams, we recruited three groups of family, friends and
close friends to test our system. We conducted a semi-structured interview along-
side the observation method and analysed the data mostly qualitatively to evaluate
the current application and offer potential ideas for future work (Chapter 5). The
evaluation part of Phase 1 revealed many possible future studies and two of them
were performed for the implementation of new versions of the system in Phases 2
and 3. At the end of this phase, we derived the values and requirements for the
sharing and visualisation of past photo streams within a small group of friends
alongside the user requirements for the design of a future photo application.
Phase 2 In Phase 2, the requirements were shaped by the lessons learned from
the user study in Phase 1. Visualisation of photo streams in slideshow mode was
pleasing for the participants but several types of photo transitions were designed in
the first version of the system. From the user study, we identified the problems of
these transitions and decided to add logarithmic and optimise transition modes.
Moreover, the desired time transition was enhanced by summarisation desired
Chapter 3. Methods 54
time and logarithmic desired time transitions. There were other transition modes
arising from the study in Phase 1, e.g. the continuity transition mode, as described
in Chapter 6.
In the next stage of Phase 2 (Chapter 7), the transition types were evaluated in a
laboratory user study test using a usability test for user experience. In addition,
the analysis of interaction logs and semi-structured interviews is presented. The
user study comprised quantitative and qualitative approaches. The results showed
the effectiveness of the new transition types. Together with the requirements of
Phase 1, the most suitable transition was applied to the design and implementation
of the system in Phase 3. At the end of this phase, the question of how to
find optimal temporal parameters for visualisation of multiple photo streams was
addressed.
Phase 3 Chapter 8 of this thesis describes the system that was designed and
built from the requirements and information produced in Phase 1 and Phase 2.
Here, an interactive digital ambient display was designed and built as a decoration
tool for synchronous visualisation and live sharing of multiple photo streams.
This system was evaluated thoroughly in three field studies (Chapter 9), address-
ing the user experience of the system in three different user groups: close friends,
extended family and workplace colleagues. Group interview techniques and inter-
action logs were used to collect information and the data were analysed qualita-
tively and quantitatively. At the end of this phase, design recommendations for
optimal user experience of ambient visualisation of multiple photo streams within
small groups of people were derived and presented.
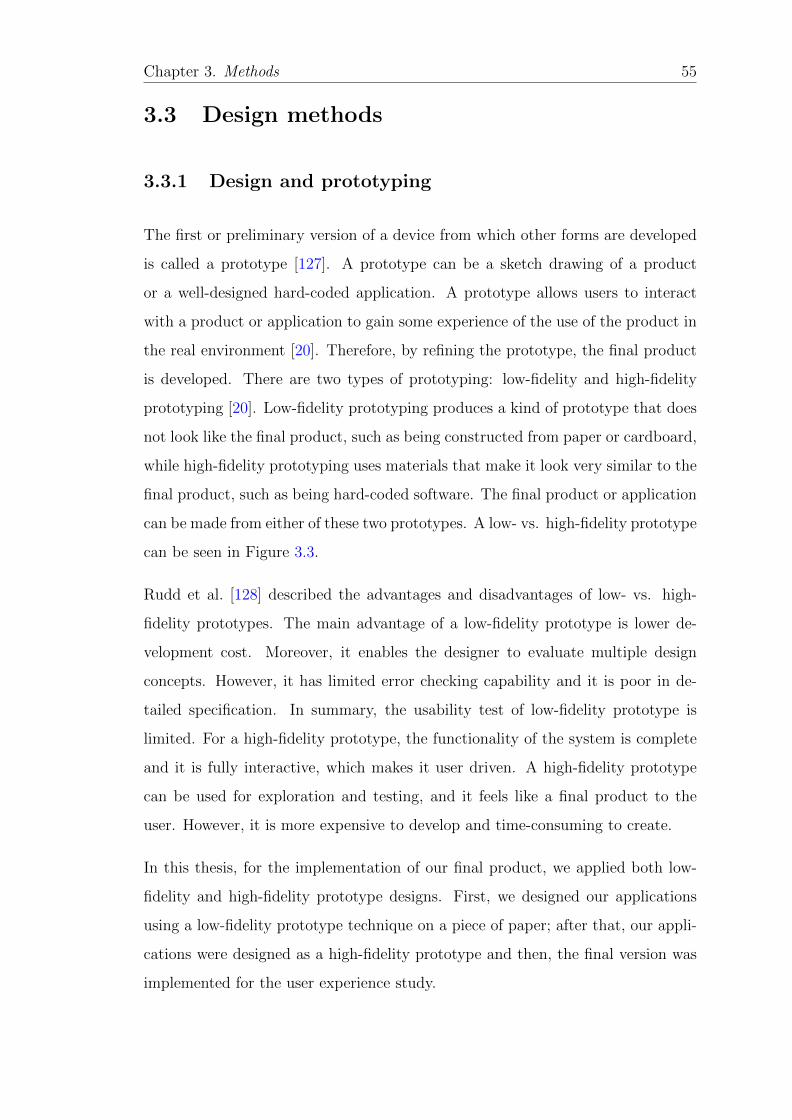
Chapter 3. Methods 55
3.3 Design methods
3.3.1 Design and prototyping
The first or preliminary version of a device from which other forms are developed
is called a prototype [127]. A prototype can be a sketch drawing of a product
or a well-designed hard-coded application. A prototype allows users to interact
with a product or application to gain some experience of the use of the product in
the real environment [20]. Therefore, by refining the prototype, the final product
is developed. There are two types of prototyping: low-fidelity and high-fidelity
prototyping [20]. Low-fidelity prototyping produces a kind of prototype that does
not look like the final product, such as being constructed from paper or cardboard,
while high-fidelity prototyping uses materials that make it look very similar to the
final product, such as being hard-coded software. The final product or application
can be made from either of these two prototypes. A low- vs. high-fidelity prototype
can be seen in Figure 3.3.
Rudd et al. [128] described the advantages and disadvantages of low- vs. high-
fidelity prototypes. The main advantage of a low-fidelity prototype is lower de-
velopment cost. Moreover, it enables the designer to evaluate multiple design
concepts. However, it has limited error checking capability and it is poor in de-
tailed specification. In summary, the usability test of low-fidelity prototype is
limited. For a high-fidelity prototype, the functionality of the system is complete
and it is fully interactive, which makes it user driven. A high-fidelity prototype
can be used for exploration and testing, and it feels like a final product to the
user. However, it is more expensive to develop and time-consuming to create.
In this thesis, for the implementation of our final product, we applied both low-
fidelity and high-fidelity prototype designs. First, we designed our applications
using a low-fidelity prototype technique on a piece of paper; after that, our appli-
cations were designed as a high-fidelity prototype and then, the final version was
implemented for the user experience study.
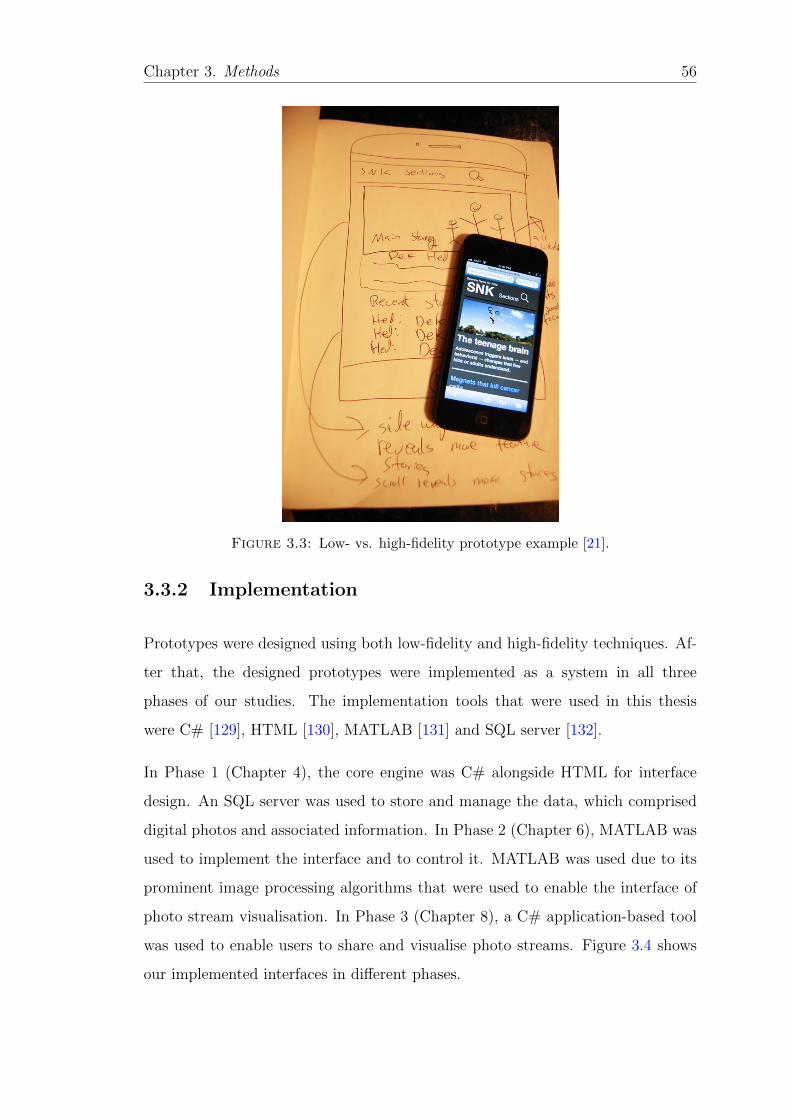
Chapter 3. Methods 56
Figure 3.3: Low- vs. high-fidelity prototype example [21].
3.3.2 Implementation
Prototypes were designed using both low-fidelity and high-fidelity techniques. Af-
ter that, the designed prototypes were implemented as a system in all three
phases of our studies. The implementation tools that were used in this thesis
were C# [129], HTML [130], MATLAB [131] and SQL server [132].
In Phase 1 (Chapter 4), the core engine was C# alongside HTML for interface
design. An SQL server was used to store and manage the data, which comprised
digital photos and associated information. In Phase 2 (Chapter 6), MATLAB was
used to implement the interface and to control it. MATLAB was used due to its
prominent image processing algorithms that were used to enable the interface of
photo stream visualisation. In Phase 3 (Chapter 8), a C# application-based tool
was used to enable users to share and visualise photo streams. Figure 3.4 shows
our implemented interfaces in different phases.
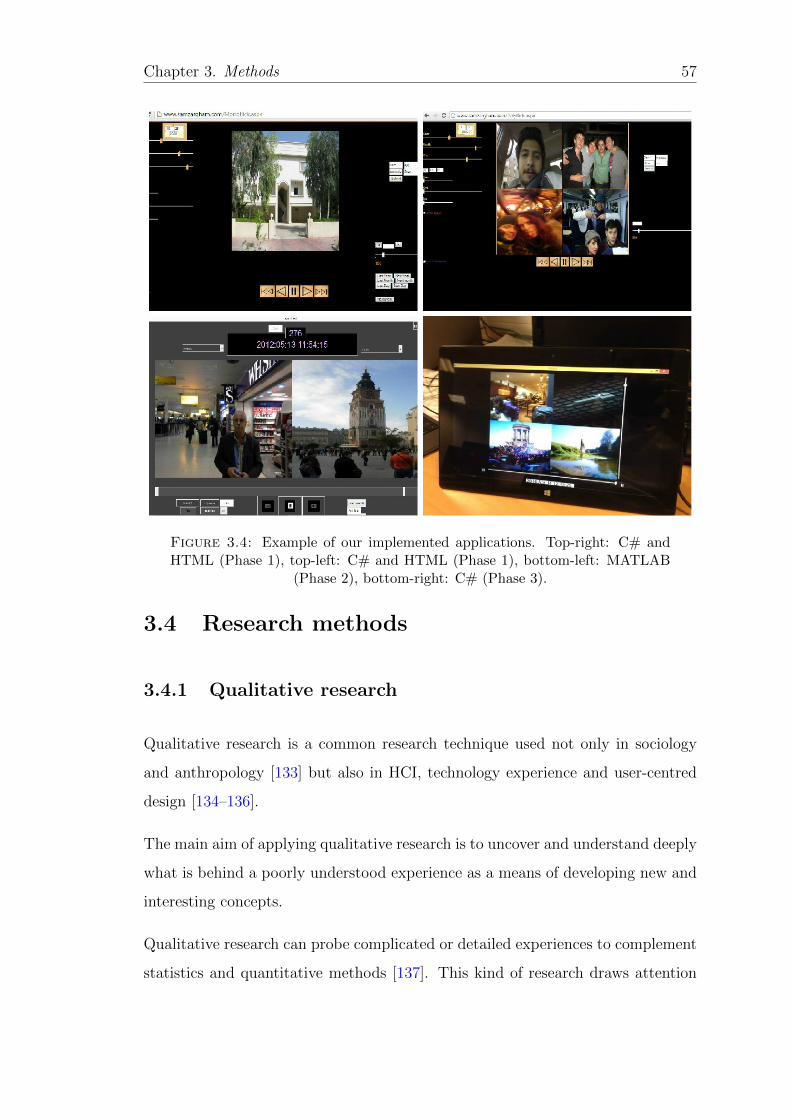
Chapter 3. Methods 57
Figure 3.4: Example of our implemented applications. Top-right: C# andHTML (Phase 1), top-left: C# and HTML (Phase 1), bottom-left: MATLAB
(Phase 2), bottom-right: C# (Phase 3).
3.4 Research methods
3.4.1 Qualitative research
Qualitative research is a common research technique used not only in sociology
and anthropology [133] but also in HCI, technology experience and user-centred
design [134–136].
The main aim of applying qualitative research is to uncover and understand deeply
what is behind a poorly understood experience as a means of developing new and
interesting concepts.
Qualitative research can probe complicated or detailed experiences to complement
statistics and quantitative methods [137]. This kind of research draws attention
Chapter 3. Methods 58
to phenomena, meaning and description from data such as audio or video record-
ings of speech (recorded interview) or observation of what people do (observation
techniques) [138].
Qualitative research [133, 139–142] can be summarised as below:
1. Qualitative research concentrates mainly on the process of a social experience
that is created specifically to provide outcomes.
2. In qualitative research, the main finding is what participants perceive and
interpret as the meaning of the experience that they were part of and, in this
case, interview and observations are the techniques used to list and identify
the participant’s perspective on the topic of research.
3. Researchers in qualitative research, as opposed to the interview questionnaire
and protocol, play the main role and provide the channel for data gathering
and analysis during an interview. Therefore, the researcher should be well
prepared and have a very deep understanding of the field to obtain good
results.
4. Field study and research is one of the main elements of qualitative research,
whereby participant behaviour during their experience of a natural phe-
nomenon is observed.
5. The reporting of qualitative research is subjective and descriptive, such that
rather than using numbers or statistics, the data are reported in more tan-
gible media such as words, speech, video and pictures.
6. The reasoning method that a researcher should use during qualitative re-
search is inductive rather than deductive. This means that in qualitative re-
search, instead of confirming a hypothesis and a theory, the research andthe
analysis of the experience of the participants will generate a pattern and a
theory.
Based on these explanations, the most fitting approach to investigate the visuali-
sation of multiple photo streams using our implemented systems is the qualitative
Chapter 3. Methods 59
research. In terms of photo capturing, themes were found by Okabe [143], who
investigated camera phone use, and by Lindley et al. [144], who investigated the
user experience using SenseCam. Mobiphos [145] is a collocated mobile sharing
and visualisation application and a user experience study was perfomed on it using
qualitative research methods. 4Photos, a photo sharing device, was investigated
qualitatively in [73].
3.4.2 Data gathering techniques
When there is a need to investigate the experience of people, data are required
for analysis. The most common techniques to gather data in order to understand
the experience of people include: interviews, focus groups, participant observation
and quantitative data such as system logs and diaries [20]. The data gathering for
this research comprised of semi-structured interviews, acquisition of system logs
and field observation.
Semi-structured interviews
The main goal of this study was to gain an insight into people’s perception, and
an understanding of their behaviour and experience, while using our photo sharing
and visualisation tool. In order to investigate current photographic practice and
how our system was used, semi-structured, interviews were used mostly for the
first and third versions of our system.
The semi-structured interview technique has various advantages: it is interactive,
communication is face to face, it allows greater depth of understanding of the
issues that are investigated and it offers the interviewer an opportunity to gather
more information [20, 133].
In semi-structured interviews it should be noted that not all of the participant’s
answers can be predicted; hence, the interviewer needs to be more creative and
Chapter 3. Methods 60
ready to ask challenging questions that were not in the planned interview paper,
as the interview evolves.
This notion of a semi-structured interview might change the structure of some
interview sections and can reveal fascinating subjects that might otherwise be
forgotten when using a full structured interview technique. Many HCI studies use
this technique; for example, in [73, 144, 146].
In [73], a semi-structured interview technique was used to investigate how the use
of a photo sharing tool during meal time affects people’s behaviour and eating
culture. Similarly, in [144] semi-structured interviews were applied to acquire
information about people’s activities and feelings when they used SenseCam as a
passive camera.
It can be claimed that semi-structured interviews are very powerful for gathering
informative and rich data, allowing the interviewer to follow the valuable and
interesting information acquired from the participants, so that relevant topics can
be investigated more thoroughly.
The semi-structured interview is dynamic and gives flexibility to investigate sub-
jects in a manner not driven by the interviewer but instead, in a manner created
and covered by the interviewee. As explained by Minichiello et al. [147], the inter-
view is an especially appropriate method for data acquisition to understand the
consequences of human experience.
Field observation study
The observation method for data gathering has been utilised by many researchers
to observe people during an experiment. Patel et al. [15] designed a collocated
sharing application and investigated through observation how their system was
used; they found new approaches that they applied to use the system. Taylor
et al. [148] applied observation methods to their research in order to find how
teenagers use mobile phones for digital gift giving.
Chapter 3. Methods 61
Observational methods offer a means of data acquisition that involves the re-
searcher observing the participants during the experience [149]. The advantages
of observation are flexibility and the potential to create a research topic rather
than starting with a hypothesis; the researcher can make observations in order to
create research questions due to the descriptive, rather than structured, emphasis
of the method.
The findings of observations are very strong in terms of validity due to the ability
of the researcher to collect information about very detailed behaviour during the
experience; as Trochim [150] stated, validity is the best characteristic of observa-
tional methods.
One disadvantage of observation is the replication of the object of study and
the potential to be time consuming. The results of observation might be true for
some, but not all, people; therefore, they cannot be generalised to others. Another
problem with observation is that the researcher might just observe what he wants
to observe and miss other important subjects during the observation; recording
the observation can solve this problem.
According to [150], there are various kinds of observation: direct, unobtrusive
and naturalistic. In direct observation, people know that they are being observed
and they might, therefore, change their behaviour rather than being themselves;
a long-term observational study might be able to solve this problem. This type
of observation might result in another disadvantage, namely that a short period
of observation might not give the same results for other people, so that results
cannot be generalised.
Unobtrusive observation is a method whereby the participants do not know that
they are being observed; therefore, there is no concern that people might change
their behaviour while they are being observed. The problem of generalisation is
solved but still only within a group of people with similar characteristics, such as
computer engineers in a particular company. Finally, the main problem with this
kind of observation is ethical issues.
Chapter 3. Methods 62
Naturalistic observation is a technique for observing people in their natural envi-
ronment. This method is used to avoid interfering with the behaviour that the
researcher wishes to observe. This method is used mostly in laboratory research.
One of the advantages of naturalistic observation is that it lets the researcher
observe the subject in a natural setting; disadvantages include the fact that it is
not easy to determine the exact cause of behaviour and that it is not possible to
control variables outside the observational environment.
In this thesis, the direct observation method was used in Chapter 5, where partic-
ipants create a photographic life-log to see how the use of our application changes
their photography practice.
Interaction logs
Interaction logging applies to studies of applications that have been developed to
record user activity in a log that is interpreted later [20]. There is a variety of
actions that can be recorded from computer mouse movements, button presses,
action time stamps, number of visitors and movements.
McLaughlin et al. [151] designed an interactive web-based art museum; the number
of website visitors, website browsers used and country from which the website was
accessed were recorded for seven months. In another study [71], photo sharing
application logs were stored. For example, this study recorded data on how many
photos were shared, the content of the stored photos, the type of media the photo
was shared with and the time of photo sharing.
A key advantage of logging activities rather than using direct observation is that
the former is unobtrusive and does not affect the behaviour of the participant
while they are interacting with the system; it is not, however, as detailed as
observation. Moreover, observing participants without their consent has ethical
issues. Another advantage of logging activities is that a large amount of data can
be stored automatically without human effort.
Chapter 3. Methods 63
Usability testing
It has been claimed by [20] that usability testing is an approach that emphasises
the property of being usable; therefore, in such a test, the product is tested rather
than the user. In a usability test, the product is tested in a controlled environment
such as a usability laboratory. The goal of this kind of test is to test if the product
under development is usable by the user through defining user tasks [152].
From this kind of study, quantitative performance can be measured and the fol-
lowing types of data, based on Wixon and Wilson [153], can be obtained:
• Time to complete a task.
• Time to complete a task after a specified time.
• Number of errors per task.
• Number of errors per unit of time.
• Number of users that make a particular mistake.
• Number of users completing a task successfully.
One example of usability testing is described in [154], where a usability test found
a significant difference between younger and older adults in time completion and
task completion relating to Facebook settings. In Chapter 7 of this thesis (Phase
2), usability testing is used to estimate user performance by setting tasks for
participants.
3.4.3 Data analysis
Thematic analysis
The qualitative analysis method used in this thesis is thematic analysis, which
is a technique for identifying, analysing and reporting themes (patterns) within
Chapter 3. Methods 64
data. This technique organises and describes qualitative data in detail [155]. How-
ever, there are various types of thematic analysis and there is no clear agreement
about what thematic analysis is and how it is performed [155–157]. Many other
qualitative analyses are basically thematic but they are named differently, such as
content analysis [158]. Thus, identifying recurring patterns or themes was applied
for analysing the data we gathered.
In a study by Ojala and Malinen [39], participants were interviewed about their
current practice of photography and how they shared their photos with small
groups; the results were shown as themes. The same technique for analysing and
presenting data was used in [15, 159, 160].
Sometimes patterns or themes form the primary set of findings for analysis and
sometimes they are just the starting point for more detailed investigation of the
data [20]. In order to identify themes in qualitative analysis, the researcher should
have knowledge of the data and have read them many times; this way themes
emerge and evolve over time.
One important aspect of conducting this kind of analysis is to keep clear and
consistent records of what has been found alongside a detailed description of the
themes. If the description is sufficiently specific, then there will be multiple well-
evidenced themes; however, a set of observations that do not address the goal may
result. The patterns arising from data analysis may be the behaviour of the user
group, place, situation of the experience and so on. In order to generate themes,
the data should be coded.
To generate prominent themes and results, the following six stages of thematic
analysis must be performed [161]:
1. Familiarisation with the data.
2. Generation of initial codes.
3. Searching for themes.
4. Reviewing themes.
Chapter 3. Methods 65
5. Defining and naming themes.
6. Report production.
According to Braun and Clarke [161], thematic analysis has many advantages.
Firstly, it is very easy to learn and it conveys flexibility during the data analysis.
The researcher can use it with little or no experience of qualitative research and
the results are generally accessible to educate the public. Finally, it is a good
method for summarising the key features of large datasets such as long transcribes
and it is able to generate unanticipated insights.
Quantitative analysis
Quantitative analysis is the analysis of a situation or event by means of mathemat-
ical and statistical modelling [162]; while this technique is used mostly in financial
market analysis, it is also widely used in HCI and user experience research [163].
In the current study, we undertook quantitative analysis of the gathered data. The
data are presented in Chapters 5, 7 and 9. In Chapter 7, the information from the
interviews is presented as quantitative data, while in Chapters 7 and 9, interaction
log data are presented quantitatively alongside the interview data. Moreover, in
Chapter 7, we designed a study that investigated participant recall of photos after
viewing multiple photo streams as a usability approach to user experience. In
this type of study, participant performance, answers and judgments regarding the
system were analysed quantitatively.
The statistics are not explained in detail in this section but here we note only that
statistical techniques that are used commonly in HCI research were used for the
quantitative analysis. Average, percentage, median, mode, t-test, ANOVA test
and diagrams for presentation of these results are well-known descriptive statistics
in HCI. A quantitative approach has been used previously to analyse raw data
in HCI research [19, 164, 165]. Anthony et al. [164] quantitatively analysed 187
non-commercial videos depicting a person with a physical disability interacting
with a mobile touchscreen device that were uploaded to YouTube.
Chapter 3. Methods 66
3.5 Ethics
Part of an interview procedure is to obtain agreement or consent from the partic-
ipants taking part in the study [166]. The consent form reminds the participants
that their participation in the study is voluntary and that their interview data will
be treated with confidentiality and anonymously.
Since the interview involved voluntary participation, the participants were in-
formed about the following:
• Researcher’s name and contact details.
• Name of the organisation (University of Surrey).
• Information sheet for sharing and visualisation of multiple photo streams.
• Consent form, which contained the confidentiality and anonymity require-
ment of the participant’s data.
• Permission to use shared photos for publications.
• Permission for withdrawal from the study at any time.
The ethics approval can be seen in A.7 and all the data from the study sessions were
type-recorded with the permission of participants and stored securely; anonymity
of the participants was protected in all reports, including this thesis.
Chapter 4
Synchronous visualisation of
multiple photo streams
4.1 Introduction
Due to the widespread proliferation of digital cameras and camera phones, the
large majority of people use only digital formats and platforms for their personal
photography. In addition, the emergence of wearable cameras; for example, Sense-
Cam [144] and Google Glass [46] have enabled users to capture events of everyday
life without any interaction, thus creating, passively, large numbers of digital pho-
tos. Finally, seamless connectivity over the Internet and social media platforms has
enabled sharing of digital photos publicly or with small groups of closely related
users, such as friends and family.
People share their photos on an everyday basis in order to represent themselves,
tell their story or look back at their old photos to reminisce about past events. In
addition, people are interested in other peoples’ photos in order to stay informed
and to communicate with them. This trend is best depicted by an ever-increasing
uptake of both sharing and observing photos over social media sharing platforms,
such as Facebook and Instagram. However, there is a gap in the design and
67
Chapter 4. Synchronous visualisation of multiple photo streams 68
implementation of photo sharing services supporting sharing in small close-knit
groups and visualisation from multiple sources.
Therefore, in order to create a photo sharing and visualisation application that
supports small-group sharing from multiple photo sources, a novel social media
sharing website was designed and built. The reason for designing an application
for sharing between small groups of people was that in the literature [39] we found
that there is a gap in designing new systems for the sharing and visualisation of
photo streams captured from close groups such as friends. It was designed as a web-
based interface with a photo sharing system aimed at small social networks, i.e.
close friends and families. The platform utilises social and temporal metadata of
photos to facilitate intuitive visualisation of multiple photo streams obtained from
different sources. The literature review identified a lack of applications capable of
concurrently showing multiple photo streams from different people. In addition,
there has not been, to date, any investigation of the user experience related to this
challenge. In order to fill this gap, we designed a photo sharing application so that
users were able to view each other’s photos simultaneously and synchronously. Our
system for synchronous visualisation of multiple photo streams is unique not only
because it shows multiple photo streams of the different people taken at the same
time, same place or same time and different place but it also lets users compare
their past photos as a visual story telling tool in a unique interface.
4.2 System design
The main aim of the initial system design was to respond to the research question
regarding the values and requirements of sharing and visualisation of past photo
streams with a small group of friends. Seamless sharing of photos between a small
group of users and their synchronous visualisation was at the focus of the design
process.
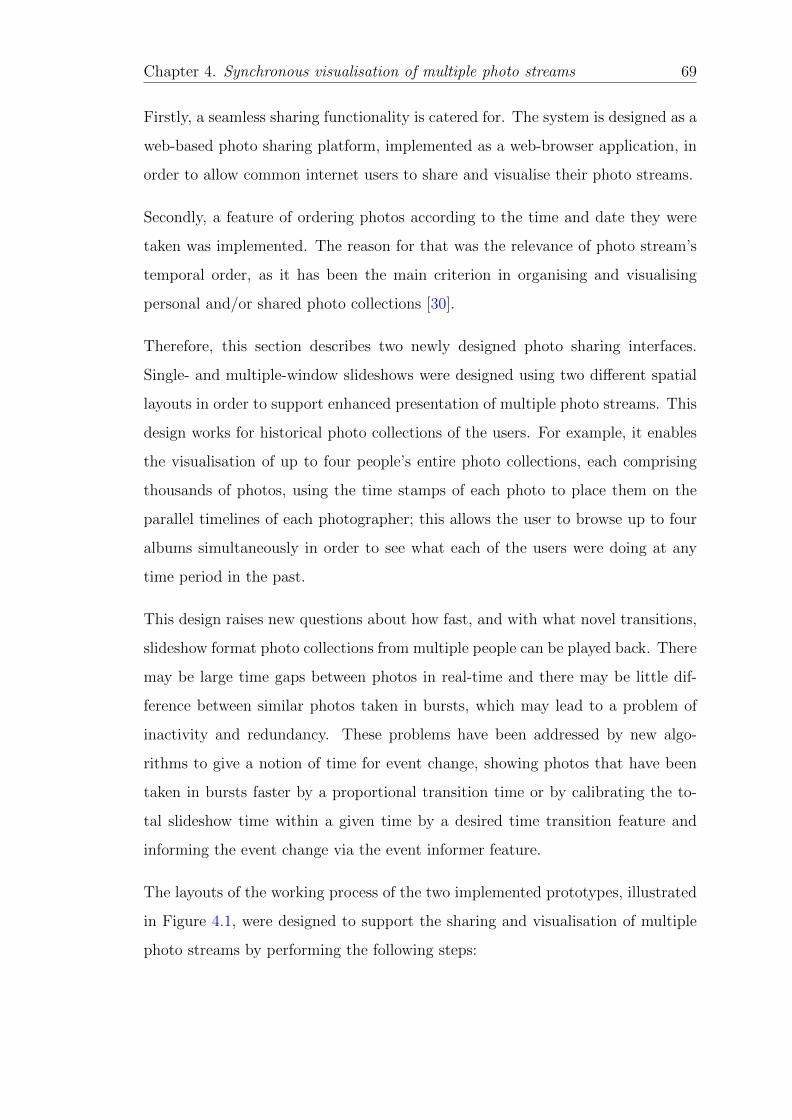
Chapter 4. Synchronous visualisation of multiple photo streams 69
Firstly, a seamless sharing functionality is catered for. The system is designed as a
web-based photo sharing platform, implemented as a web-browser application, in
order to allow common internet users to share and visualise their photo streams.
Secondly, a feature of ordering photos according to the time and date they were
taken was implemented. The reason for that was the relevance of photo stream’s
temporal order, as it has been the main criterion in organising and visualising
personal and/or shared photo collections [30].
Therefore, this section describes two newly designed photo sharing interfaces.
Single- and multiple-window slideshows were designed using two different spatial
layouts in order to support enhanced presentation of multiple photo streams. This
design works for historical photo collections of the users. For example, it enables
the visualisation of up to four people’s entire photo collections, each comprising
thousands of photos, using the time stamps of each photo to place them on the
parallel timelines of each photographer; this allows the user to browse up to four
albums simultaneously in order to see what each of the users were doing at any
time period in the past.
This design raises new questions about how fast, and with what novel transitions,
slideshow format photo collections from multiple people can be played back. There
may be large time gaps between photos in real-time and there may be little dif-
ference between similar photos taken in bursts, which may lead to a problem of
inactivity and redundancy. These problems have been addressed by new algo-
rithms to give a notion of time for event change, showing photos that have been
taken in bursts faster by a proportional transition time or by calibrating the to-
tal slideshow time within a given time by a desired time transition feature and
informing the event change via the event informer feature.
The layouts of the working process of the two implemented prototypes, illustrated
in Figure 4.1, were designed to support the sharing and visualisation of multiple
photo streams by performing the following steps:
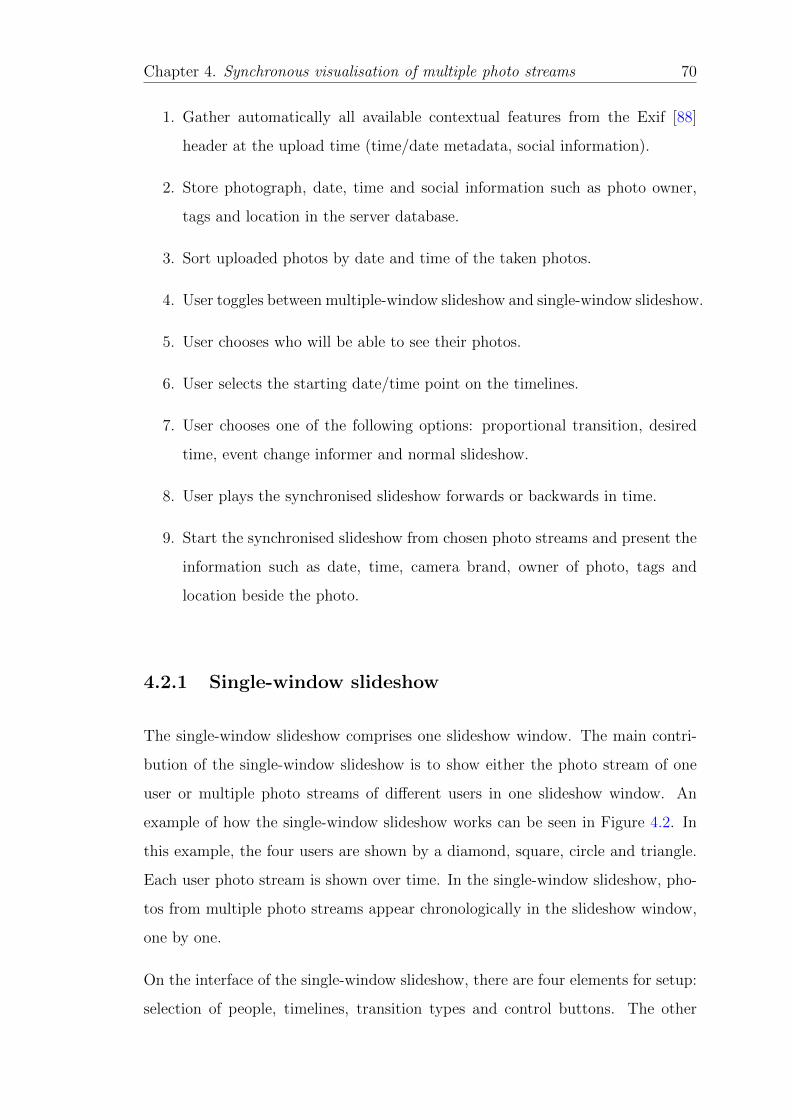
Chapter 4. Synchronous visualisation of multiple photo streams 70
1. Gather automatically all available contextual features from the Exif [88]
header at the upload time (time/date metadata, social information).
2. Store photograph, date, time and social information such as photo owner,
tags and location in the server database.
3. Sort uploaded photos by date and time of the taken photos.
4. User toggles between multiple-window slideshow and single-window slideshow.
5. User chooses who will be able to see their photos.
6. User selects the starting date/time point on the timelines.
7. User chooses one of the following options: proportional transition, desired
time, event change informer and normal slideshow.
8. User plays the synchronised slideshow forwards or backwards in time.
9. Start the synchronised slideshow from chosen photo streams and present the
information such as date, time, camera brand, owner of photo, tags and
location beside the photo.
4.2.1 Single-window slideshow
The single-window slideshow comprises one slideshow window. The main contri-
bution of the single-window slideshow is to show either the photo stream of one
user or multiple photo streams of different users in one slideshow window. An
example of how the single-window slideshow works can be seen in Figure 4.2. In
this example, the four users are shown by a diamond, square, circle and triangle.
Each user photo stream is shown over time. In the single-window slideshow, pho-
tos from multiple photo streams appear chronologically in the slideshow window,
one by one.
On the interface of the single-window slideshow, there are four elements for setup:
selection of people, timelines, transition types and control buttons. The other
Chapter 4. Synchronous visualisation of multiple photo streams 71
Concurrent slideshow
Upload Interaction of the user
Gather image and its contextual
metadata
Order all images by date and time
Choose date and time
Choose user/users
Choose transition type
Figure 4.1: Slideshow process of single-window slideshow and multiple-windowslideshow. After uploading the photos by the client, contextual metadata arestored in the database and the photos are ordered by time. The user, then,chooses the date/time, other users and transition type to view the slideshow.
To try, follow this link: http://www.samzargham.com.
element on the interface is the information box, which is located on the right side
of the interface and presents information such as date/time, location, name of the
photographer and photo tags.
There are four drop-down menus on the top right side of the interface that let the
user choose up to four people. There are six sliders as timelines of the interface,
which are situated at the top left of the interface. The timelines enable users to
set the starting point of the slideshow. Moreover, they can be used to narrow
down the search for finding events based on the time that photos were taken. The
timelines represent the year, month, day, hour, minute and second. Therefore, by
choosing the date and time using the six timelines, the closest photos that were
Chapter 4. Synchronous visualisation of multiple photo streams 72
Figure 4.2: Example of the single-window slideshow.
taken by multiple users on the chosen date appear on the screen. The text-based
date/time is shown on top of the slider to support the narrative.
There are radio buttons on the bottom left of the interface, which are designed
to let the user choose the transition type between proportional transition time,
desired time and event informer. The control buttons, which are situated below
the slideshow window, comprise the following: play, play backward, skip forward,
skip backward and pause.
After the user clicks on the play forward or backward button, photo streams of
several friends or family members are shown chronologically in slideshow mode in
one slideshow window. The user can pause the slideshow via the pause button to
view a photo in more detail. Also, the user can see photos one by one using the
skip-next button.
By clicking on the play button, the timelines disappear and, instead, the informa-
tion bar appears on the screen; the control buttons stay on the screen. By pressing
the pause button, the timeline comes back to the screen.
The size of the slideshow window depends on the size of the photo. Figure 4.3
illustrates the interface of the single-window slideshow.
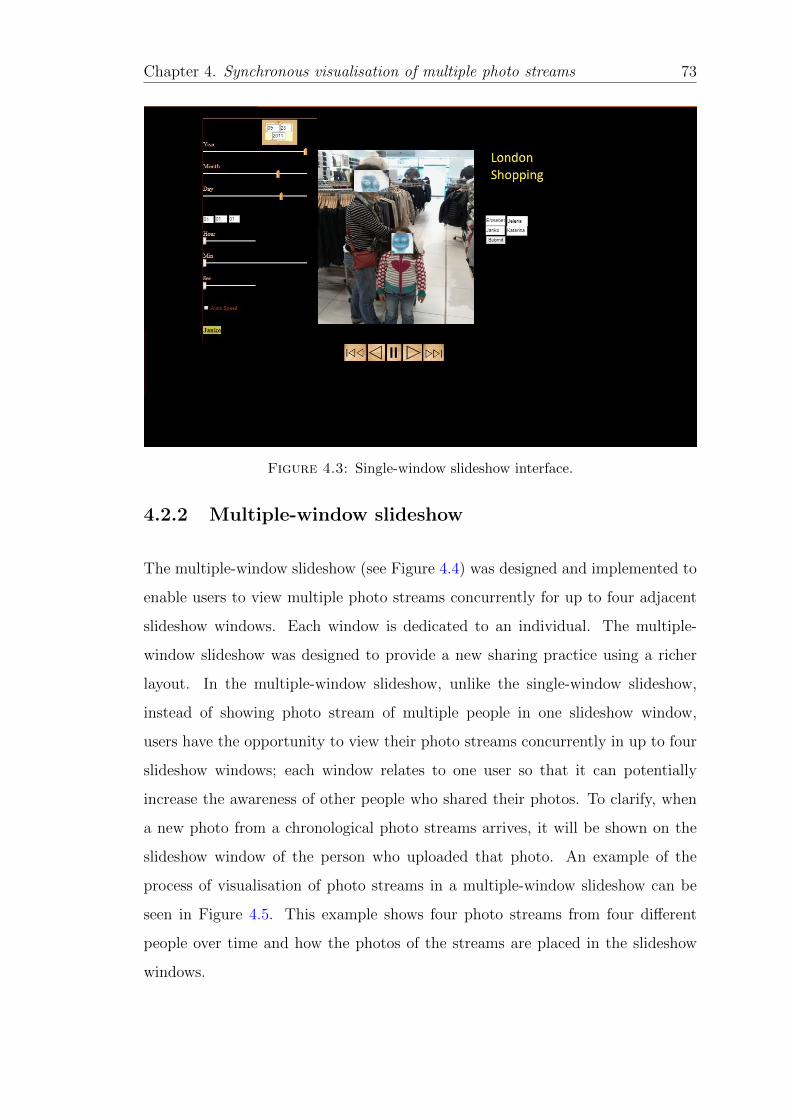
Chapter 4. Synchronous visualisation of multiple photo streams 73
Figure 4.3: Single-window slideshow interface.
4.2.2 Multiple-window slideshow
The multiple-window slideshow (see Figure 4.4) was designed and implemented to
enable users to view multiple photo streams concurrently for up to four adjacent
slideshow windows. Each window is dedicated to an individual. The multiple-
window slideshow was designed to provide a new sharing practice using a richer
layout. In the multiple-window slideshow, unlike the single-window slideshow,
instead of showing photo stream of multiple people in one slideshow window,
users have the opportunity to view their photo streams concurrently in up to four
slideshow windows; each window relates to one user so that it can potentially
increase the awareness of other people who shared their photos. To clarify, when
a new photo from a chronological photo streams arrives, it will be shown on the
slideshow window of the person who uploaded that photo. An example of the
process of visualisation of photo streams in a multiple-window slideshow can be
seen in Figure 4.5. This example shows four photo streams from four different
people over time and how the photos of the streams are placed in the slideshow
windows.
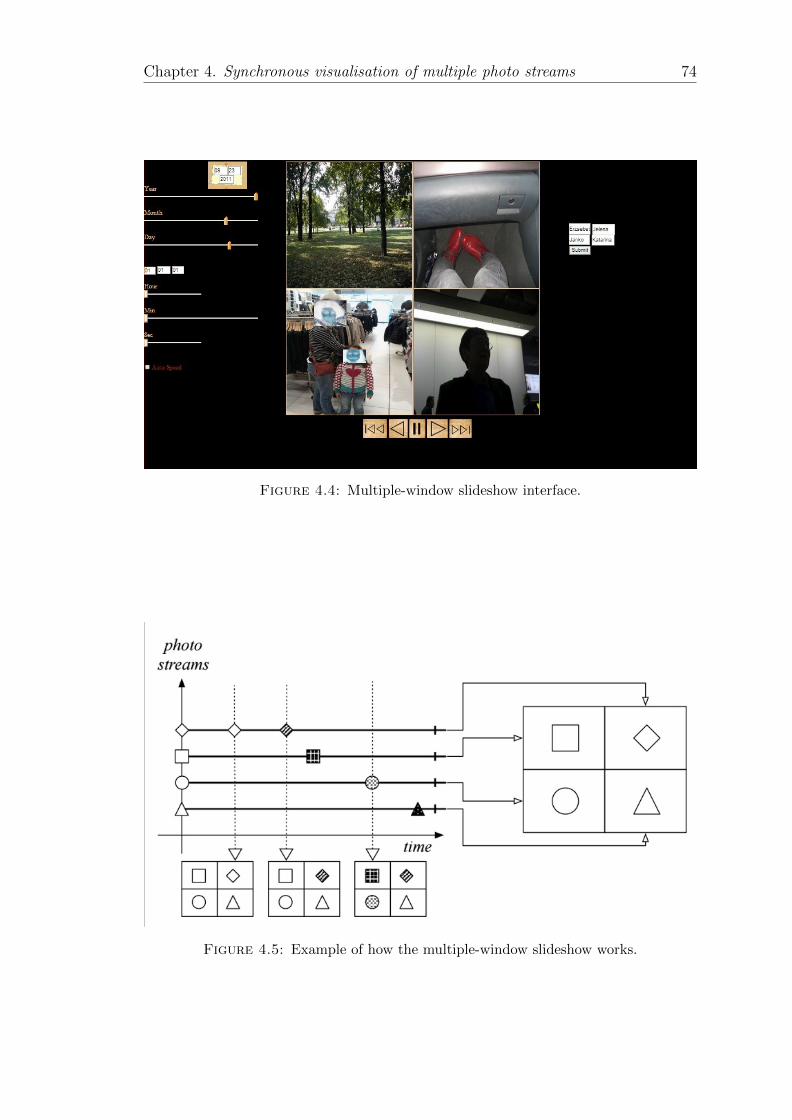
Chapter 4. Synchronous visualisation of multiple photo streams 74
Figure 4.4: Multiple-window slideshow interface.
Figure 4.5: Example of how the multiple-window slideshow works.
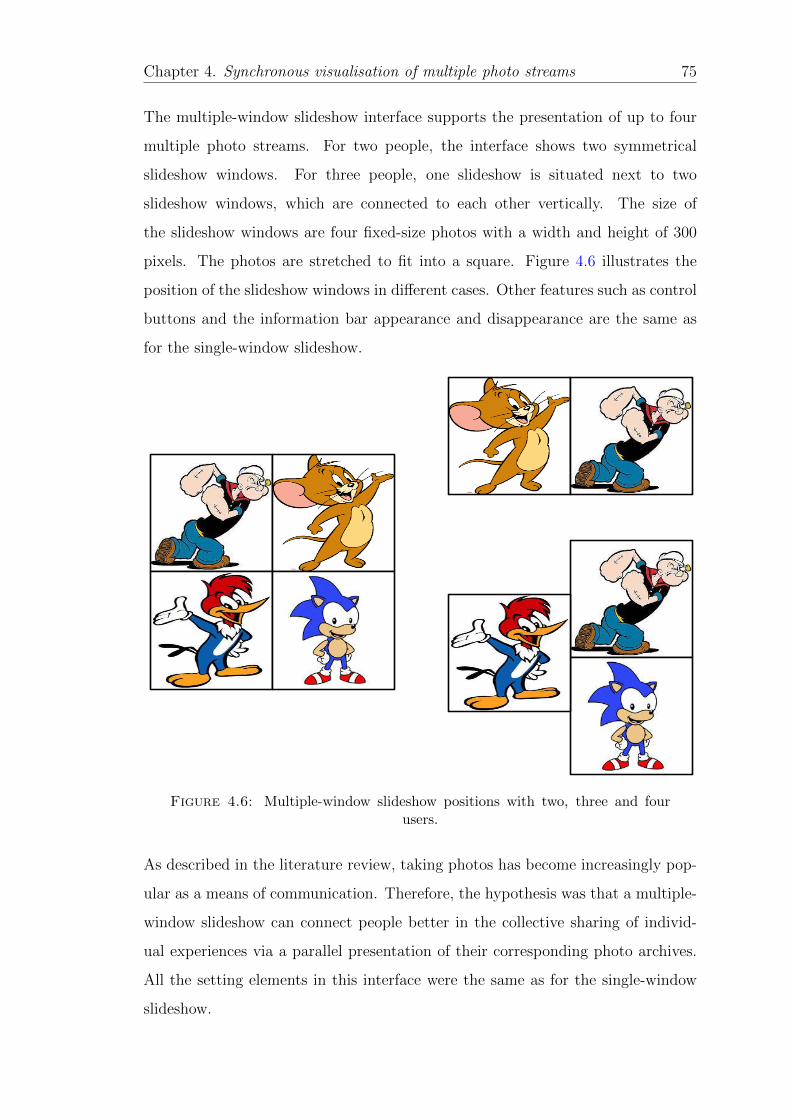
Chapter 4. Synchronous visualisation of multiple photo streams 75
The multiple-window slideshow interface supports the presentation of up to four
multiple photo streams. For two people, the interface shows two symmetrical
slideshow windows. For three people, one slideshow is situated next to two
slideshow windows, which are connected to each other vertically. The size of
the slideshow windows are four fixed-size photos with a width and height of 300
pixels. The photos are stretched to fit into a square. Figure 4.6 illustrates the
position of the slideshow windows in different cases. Other features such as control
buttons and the information bar appearance and disappearance are the same as
for the single-window slideshow.
Figure 4.6: Multiple-window slideshow positions with two, three and fourusers.
As described in the literature review, taking photos has become increasingly pop-
ular as a means of communication. Therefore, the hypothesis was that a multiple-
window slideshow can connect people better in the collective sharing of individ-
ual experiences via a parallel presentation of their corresponding photo archives.
All the setting elements in this interface were the same as for the single-window
slideshow.
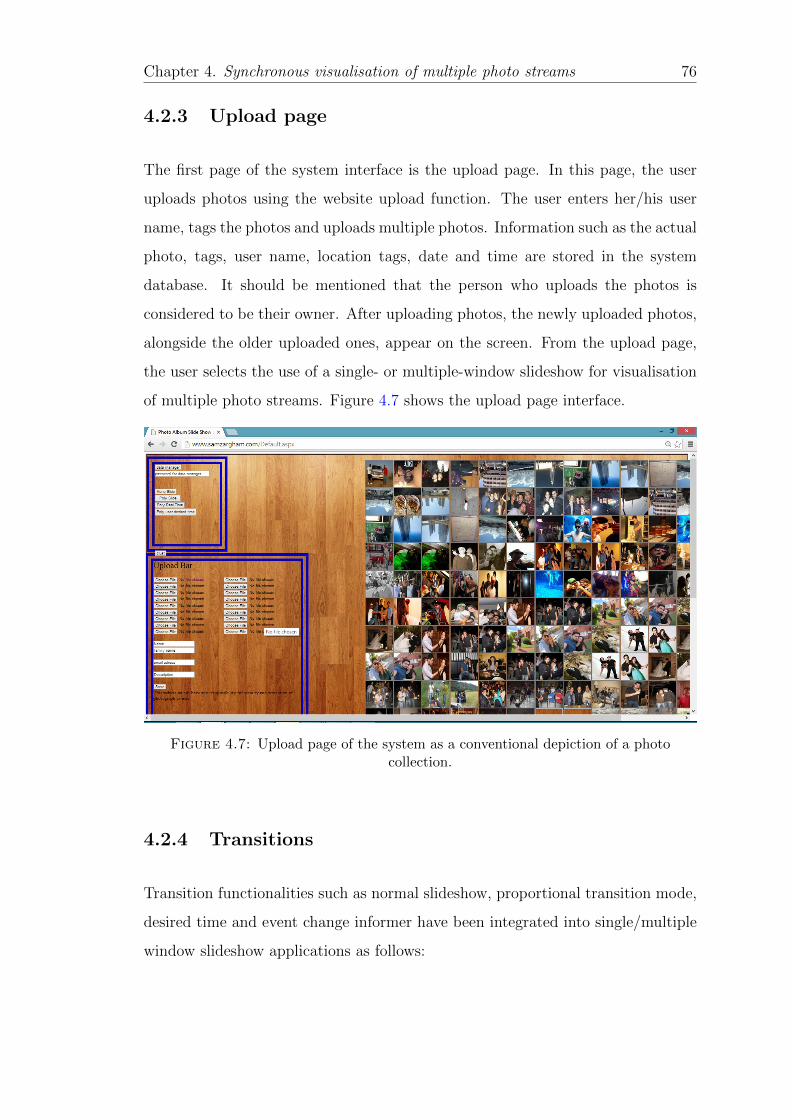
Chapter 4. Synchronous visualisation of multiple photo streams 76
4.2.3 Upload page
The first page of the system interface is the upload page. In this page, the user
uploads photos using the website upload function. The user enters her/his user
name, tags the photos and uploads multiple photos. Information such as the actual
photo, tags, user name, location tags, date and time are stored in the system
database. It should be mentioned that the person who uploads the photos is
considered to be their owner. After uploading photos, the newly uploaded photos,
alongside the older uploaded ones, appear on the screen. From the upload page,
the user selects the use of a single- or multiple-window slideshow for visualisation
of multiple photo streams. Figure 4.7 shows the upload page interface.
Figure 4.7: Upload page of the system as a conventional depiction of a photocollection.
4.2.4 Transitions
Transition functionalities such as normal slideshow, proportional transition mode,
desired time and event change informer have been integrated into single/multiple
window slideshow applications as follows:
Chapter 4. Synchronous visualisation of multiple photo streams 77
• The normal slideshow transition is based on the traditional slideshow used
on Windows machines, namely two seconds per slide.
• The proportional transition mode is designed to give the notion of time
difference between slideshow intervals. This implies that the greater the
time offset between photos, the greater the delay that is used to reflect
slideshow transitions. The scale of the delay can be controlled by a slider,
which is placed on the interface below the radio buttons for selecting the
transition type. The slider appears if proportional transition is chosen. If
the transition is too long, the user has the option to skip the slideshow by
clicking on the skip-next button.
• The desired time feature was introduced to let the user choose the overall
timespan of slideshow presentation. The speed of transition in this case is
adjusted by the desired time duration that the user chooses to review all
photo streams. By choosing the desired time from the radio buttons, a text
box appears under the radio buttons to let the user choose the total slideshow
time.
• The event change informer is intended to inform the user when an event
based on temporal clustering is changed, by displaying the message: “Event
Changed”. This is consistent with similar works in the literature based on
clustering [98].
4.3 Implementation
4.3.1 System architecture
The system is implemented as a client-server model. The architecture of this
application is sketched in Figure 4.8 and is a classical n-layer application. The
four layers are the data, application, presentation and client layer.
Chapter 4. Synchronous visualisation of multiple photo streams 78
A client accesses the system by a web browser, which is in the client layer. The
presentation layer contains the user interface of the system. The upload page
and single- and multiple-window slideshow interface are all in the presentation
layer (interface of the system). This layer has been coded with HTML in ASP.net
workspace.
Photos and information about them is stored in the data layer. In other words,
this layer contains the database of the system, which was created on a Microsoft
SQL server.
In the application layer, there is a set of components for mediating the presentation
layer. This means that the core and logic of the application is in this layer. Upload
management, search, metadata Exif extractor, different transitions and slideshow
logic, and database management were coded by C# in this layer.
4.3.2 Structure of the database
The structure of the database comprised four tables. The table names were User,
Photo, Group and Photo Exif. In the User table, information about the user, such
as first name, last name and the user name, is kept. The User table was connected
with the Group table, which kept the information about the group name and
the people who join that group. The Photo table included the photo name and
information such as tags, comments and description, and it was connected to the
User table. The Photo Exif table included some information about the Exif header
file such as the date and time the photo was captured, and the location tags. The
Photo table was connected to the Photo Exif table. Figure 4.9 illustrates the
database tables and their relations.
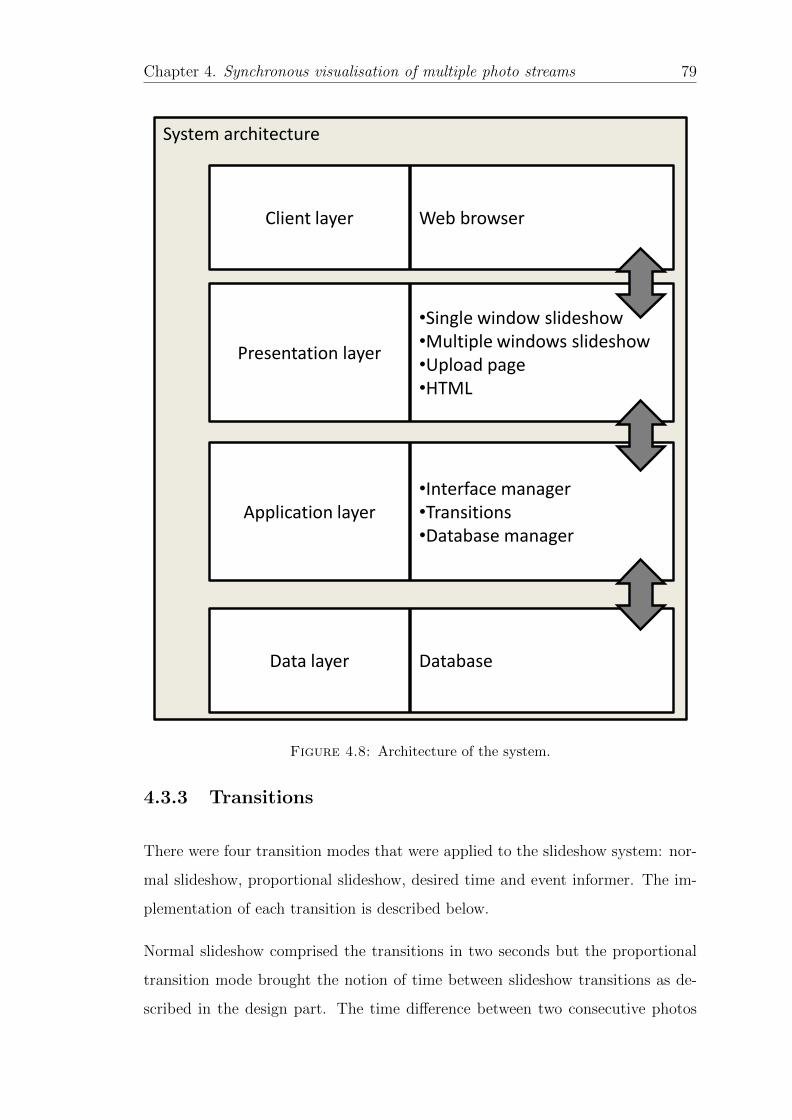
Chapter 4. Synchronous visualisation of multiple photo streams 79
System architecture
Web browser
•Single window slideshow •Multiple windows slideshow •Upload page •HTML
•Interface manager •Transitions •Database manager
Database
Client layer
Presentation layer
Application layer
Data layer
Figure 4.8: Architecture of the system.
4.3.3 Transitions
There were four transition modes that were applied to the slideshow system: nor-
mal slideshow, proportional slideshow, desired time and event informer. The im-
plementation of each transition is described below.
Normal slideshow comprised the transitions in two seconds but the proportional
transition mode brought the notion of time between slideshow transitions as de-
scribed in the design part. The time difference between two consecutive photos
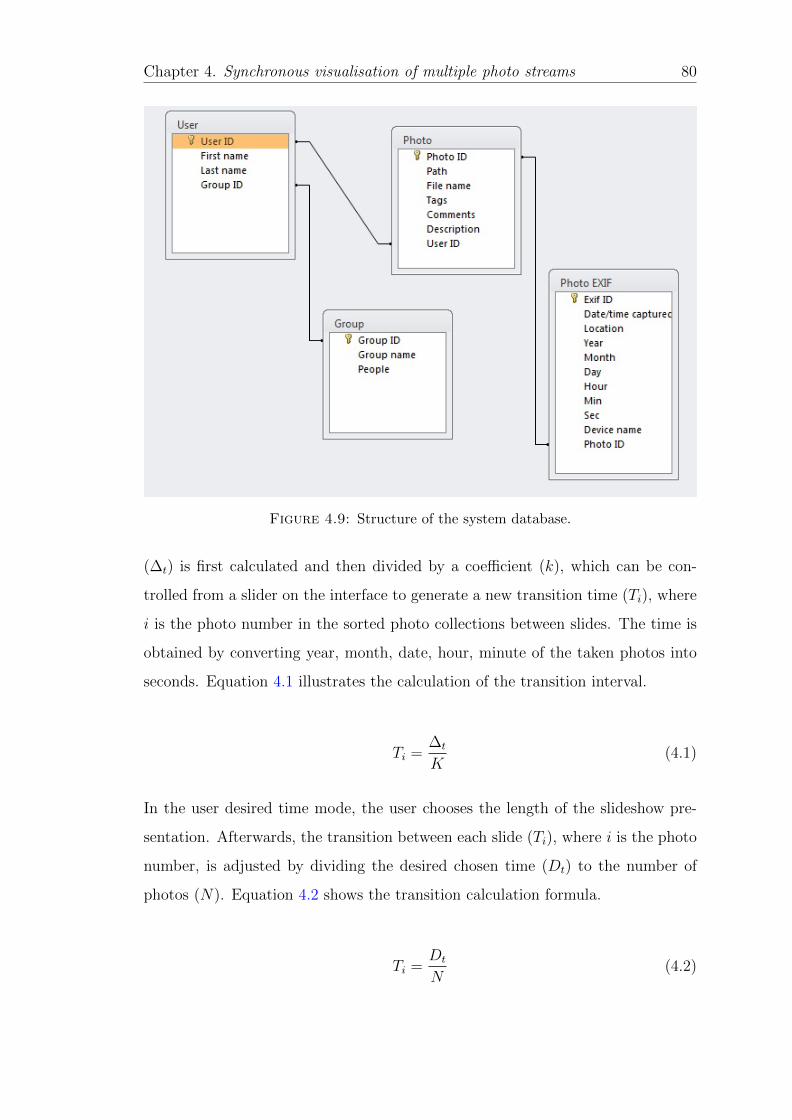
Chapter 4. Synchronous visualisation of multiple photo streams 80
Figure 4.9: Structure of the system database.
(∆t) is first calculated and then divided by a coefficient (k), which can be con-
trolled from a slider on the interface to generate a new transition time (Ti), where
i is the photo number in the sorted photo collections between slides. The time is
obtained by converting year, month, date, hour, minute of the taken photos into
seconds. Equation 4.1 illustrates the calculation of the transition interval.
Ti =∆t
K(4.1)
In the user desired time mode, the user chooses the length of the slideshow pre-
sentation. Afterwards, the transition between each slide (Ti), where i is the photo
number, is adjusted by dividing the desired chosen time (Dt) to the number of
photos (N). Equation 4.2 shows the transition calculation formula.
Ti =Dt
N(4.2)
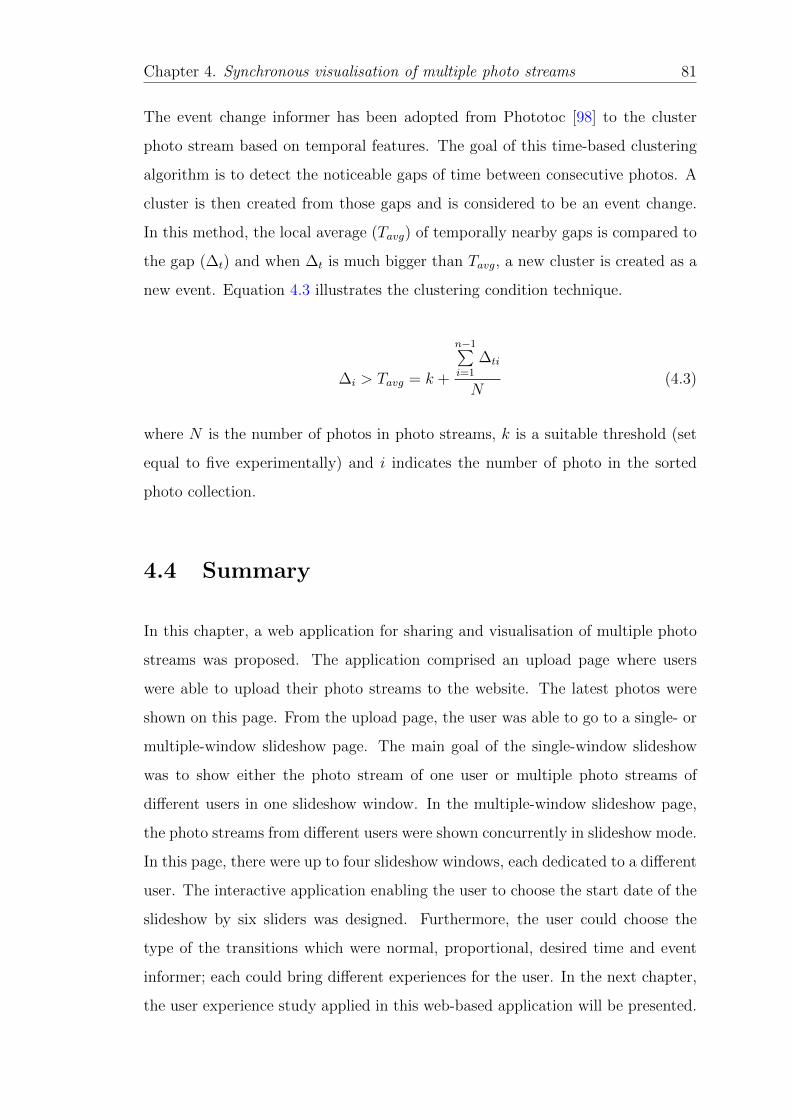
Chapter 4. Synchronous visualisation of multiple photo streams 81
The event change informer has been adopted from Phototoc [98] to the cluster
photo stream based on temporal features. The goal of this time-based clustering
algorithm is to detect the noticeable gaps of time between consecutive photos. A
cluster is then created from those gaps and is considered to be an event change.
In this method, the local average (Tavg) of temporally nearby gaps is compared to
the gap (∆t) and when ∆t is much bigger than Tavg, a new cluster is created as a
new event. Equation 4.3 illustrates the clustering condition technique.
∆i > Tavg = k +
n−1∑i=1
∆ti
N(4.3)
where N is the number of photos in photo streams, k is a suitable threshold (set
equal to five experimentally) and i indicates the number of photo in the sorted
photo collection.
4.4 Summary
In this chapter, a web application for sharing and visualisation of multiple photo
streams was proposed. The application comprised an upload page where users
were able to upload their photo streams to the website. The latest photos were
shown on this page. From the upload page, the user was able to go to a single- or
multiple-window slideshow page. The main goal of the single-window slideshow
was to show either the photo stream of one user or multiple photo streams of
different users in one slideshow window. In the multiple-window slideshow page,
the photo streams from different users were shown concurrently in slideshow mode.
In this page, there were up to four slideshow windows, each dedicated to a different
user. The interactive application enabling the user to choose the start date of the
slideshow by six sliders was designed. Furthermore, the user could choose the
type of the transitions which were normal, proportional, desired time and event
informer; each could bring different experiences for the user. In the next chapter,
the user experience study applied in this web-based application will be presented.
Chapter 5
User experience study of multiple
photo stream visualisation
5.1 Introduction
This chapter presents a photo streaming service designed for visualisation and
sharing of multiple photo streams. Moreover, it aims to identify the weak points
of the system in order to redesign and apply new features into future systems.
Therefore, this section covers a study of the current practice in digital photogra-
phy. It also includes findings about the use of the proposed interfaces, including
a single-window slideshow for showing multiple photo streams and a multiple-
window slideshow for showing multiple photo streams from up to four people si-
multaneously on one page. Furthermore, participant experiences of the transition
modes designed for the system were evaluated.
The study approach was a qualitative study. Semi-structured interviews were
conducted alongside observations in order to gain a holistic understanding of the
photographic practices of small groups and the user experience of the system.
82
Chapter 5. User experience study of multiple photo stream visualisation 83
5.2 Participants and tasks
To investigate the current practice of photography and the use of the system, three
groups were recruited to the study: close friends, friends and family.
The first group was five close friends who were asked to upload as many photos as
they wanted to share with their close friends onto the system. They were advised
to share all the digital photos they had, but they were also free to create a selection
if they wanted to. The reason to encourage this group to upload as many photos
as possible was to evaluate the system in normal behaviour of participants as in
reality people do not preset the amount of their uploaded photos in the system.
They were also asked to upload their new photos onto the system whenever they
took them.
It was planned to determine the impact of this system on sharing archived photos
that were taken a long time ago (personal archive) and those taken recently among
close friends. The user ages were in the range 23 to 30 years old with mean of 26.6
years and standard deviation of 2.7 years.
They were all graduates from different departments of the University of Surrey and
they all knew each other from their time at university. The group was comprised
of two females and three males. The participants in this group were recruited via
an email asking for volunteers who would like to share their photos with their close
friends. Once they agreed to take part in the study, the participants were asked to
read and sign a consent form. Participants were given a 4GB memory stick upon
completing the last interview. Information about Group 1 participants is given in
Table 5.1; names are not the real participants’ names.
The second group comprised ten friends who were asked to upload their personal
photo archives as much as they were able and to share them with their friends.
Participants in this group were not such close friends as the first group participants.

Chapter 5. User experience study of multiple photo stream visualisation 84
Table 5.1: Group 1 participants
No. Name Number of photos uploaded Gender
P1 Arminda 3436 FP2 Sinem 2735 FP3 Lee 591 MP4 Anthony 252 MP5 Glen 2116 M
Members of this group were also asked to create photo diaries using photos taken
over a 48-hour period. The purpose of this task was to create a dataset of photo
diaries to see whether this application can be applied as a storytelling tool.
All participants were research students or researchers from different departments
of the University of Surrey. The group was comprised of six males and four females.
The user ages were in the range 25 to 32 years old with mean of 28.1 years and
standard deviation of 1.9 years.
The participants in this group were recruited via an email to research students in
the Electronics Department who then invited their friends to join the study. They
were asked if they would like to share their photos with friends. Once they agreed,
they read and signed a consent form. Information about Group 2 participants is
given in Table 5.2; names are not the real participants’ names.
Table 5.2: Group 2 participants
No. Name Number of photos uploaded Gender
P6 Soh 150 MP7 Ala 236 FP8 Mehr 50 MP9 Martin 408 MP10 Ana 792 FP11 Amir 94 MP12 Far 571 FP13 Pour 89 MP14 Had 141 MP15 Lina 1002 F
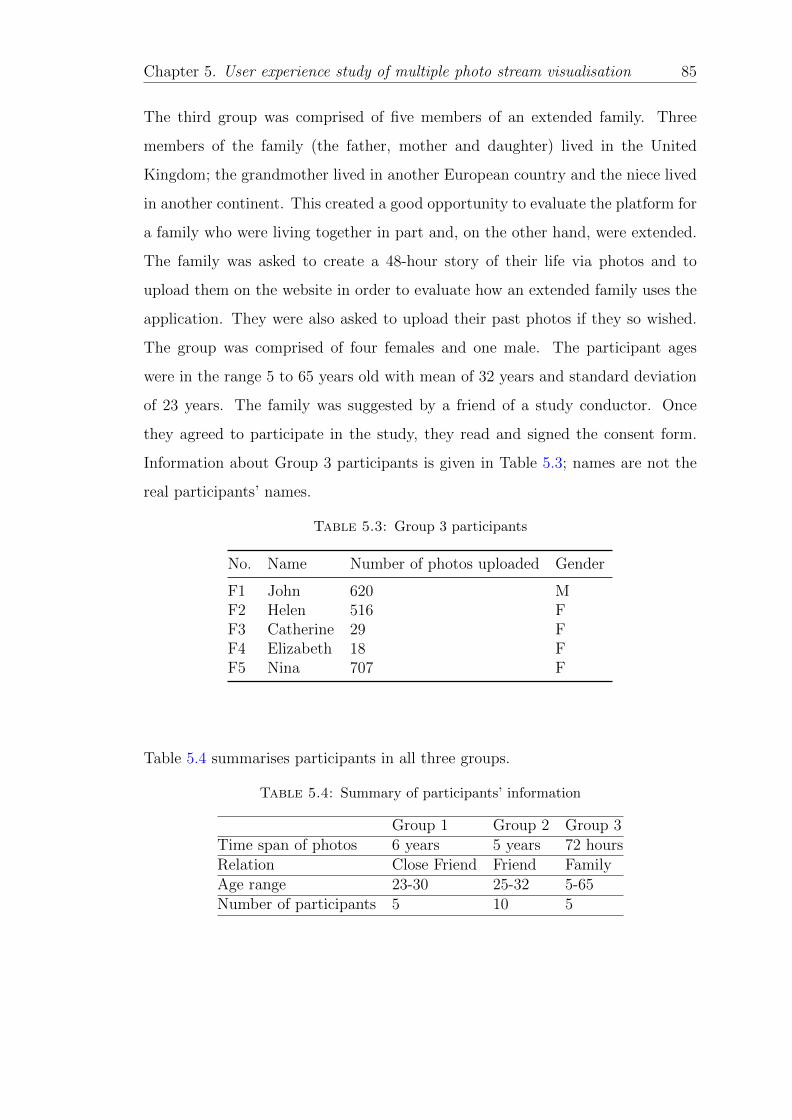
Chapter 5. User experience study of multiple photo stream visualisation 85
The third group was comprised of five members of an extended family. Three
members of the family (the father, mother and daughter) lived in the United
Kingdom; the grandmother lived in another European country and the niece lived
in another continent. This created a good opportunity to evaluate the platform for
a family who were living together in part and, on the other hand, were extended.
The family was asked to create a 48-hour story of their life via photos and to
upload them on the website in order to evaluate how an extended family uses the
application. They were also asked to upload their past photos if they so wished.
The group was comprised of four females and one male. The participant ages
were in the range 5 to 65 years old with mean of 32 years and standard deviation
of 23 years. The family was suggested by a friend of a study conductor. Once
they agreed to participate in the study, they read and signed the consent form.
Information about Group 3 participants is given in Table 5.3; names are not the
real participants’ names.
Table 5.3: Group 3 participants
No. Name Number of photos uploaded Gender
F1 John 620 MF2 Helen 516 FF3 Catherine 29 FF4 Elizabeth 18 FF5 Nina 707 F
Table 5.4 summarises participants in all three groups.
Table 5.4: Summary of participants’ information
Group 1 Group 2 Group 3Time span of photos 6 years 5 years 72 hoursRelation Close Friend Friend FamilyAge range 23-30 25-32 5-65Number of participants 5 10 5
Chapter 5. User experience study of multiple photo stream visualisation 86
5.3 Procedure
After participants uploaded their photos, they were asked to use the system for
two weeks. The interface was explained to them when they signed the consent
form. Meanwhile, they were able to upload new photos. Group 2 participants,
whose task was to create photo diaries, were asked to start the study when we
sent them a text message to start taking photos.
After using the system, participants were invited individually for interview, ex-
cept for participants in Group 3, who were interviewed together. The interviews
took place either in the participants’ houses or in a meeting room situated in the
Department of Electronics at the University of Surrey. The interview session had
three phases.
As can be seen in the interview guidance A.1, in Phase 1, participants were asked
questions about their current practice of photography; this phase was planned to
take about 20 minutes, on average. In Phase 2, phase participants were asked
to interact with the system for about 20 minutes and to talk about it. Their
interaction with the system was also observed. In Phase 3, participants were asked
questions and discussed their ideas about the system; this phase was planned to
take about 45 minutes, on average. All interview sessions were video recorded for
data analysis. The aim of deploying the system into 20 users was:
• To identify personal photography practice and tools.
• To describe sharing in photography practice and the tools in current use.
• To understand the management process of photo collections.
• To understand the use, usability, problems and interest in the single-window
slideshow interface.
• To understand the use, usability, problems and interest in the multiple-
window slideshow interface.
Chapter 5. User experience study of multiple photo stream visualisation 87
• To understand the use, usability, problems and interest in different transi-
tions.
5.4 Data analysis
Theme analysis [20] was used for analysing the qualitative data from the inter-
views, undertaken in several stages. The first stage of the analysis was to listen to
all the interviews. The next step was to transcribe the interviews. The transcribed
data were then reformatted in the order of all answers by all participants to each
question in the interview schedule. In other words, for question one, the answers
from participants P1 to P5 in Group 1 were listed and then the same procedure
was followed for question two from the interview schedule. Each group had its
own reformatted transcription. The transcriptions were read once and then reread
carefully. Once the reading was complete, several passes were made through the
data to code the data and define themes and categories.
5.5 Results
This section deals with the results of the qualitative and quantitative analysis.
Firstly, we started with the current practice of participant photography and, then,
the user experiences of the participants during photography (in Groups 2 and 3)
and within the system (all groups) were described.
5.5.1 Current photography practice
Organisation
Across all three groups, the main action taken for management of photos was to
create folders on their computers; indeed, all the participants were using folder-
based management. They were asked about how they label their folders. Their
Chapter 5. User experience study of multiple photo stream visualisation 88
primary technique for organising photos was time, as found in Miller et al. [43].
They also mentioned the following four methods for organising their photos:
• Time
• Event name
• Location
• Capture device name
Fourteen out of twenty (70%) participants did not create sub-folders in the main
folders and they said that they left their photo collection folders with their names
on the photo folder. Nevertheless, six out of twenty (30%) participants used sub-
folders for clearer organisation. P13, a participant from Group 2, said:
“I create a folder and give it a name. Then, copy/paste the pictures
from my camera and rarely look at them again.”
There were just three MacBook users (F1, P14, P3), who claimed that, alongside
creating folders on their external hard drive, they use a photo management tool,
iPhoto application in this case. They claimed that iPhoto displays their photos
chronologically and they do not need to manage their photos on their MacBook.
The Windows and Linux users did not use photo management applications.
One way of storing photo collections was to use internal/external hard drives.
However, two of the participants mentioned online Cloud services for storing their
photos. P5, a participant from Group 1, said that he kept most of his photos on
Facebook. He said that he set the ‘privacy’ parameter to ‘private’ for those photos
he did not want to show to the public. He also stated that Facebook shows albums
chronologically by the time of the upload, which made it easier for him to search
collections by name and upload time. The problem he mentioned about Facebook
was that the time of capture and the time of upload are different. For example,
he uploaded a folder from two years before he started his studies, but it appeared
Chapter 5. User experience study of multiple photo stream visualisation 89
on the current date. F1, the father in the family group, used a premium Flickr
account to store his personal and family valuable photos.
Sharing
All participants stated that they share their digital photos with friends and family.
There were two main reasons for sharing photos:
1. Sharing their personal photos with friends or family for visual communication
and awareness.
2. Sharing photos of events with the people who participated in that event.
The sharing platforms that participants mentioned were physical memory, email,
Messenger, MMS, Dropbox, Flickr and Facebook. Email and MMS were used to
share small numbers of photos while Messenger, Dropbox, Flickr, and Facebook
were used to share both small and large numbers of photos. Thirteen out of
twenty (65%) participants claimed that their main photo sharing platform was
Facebook. Therefore, the most common way to share photos between participants
was Facebook. They said that they upload photos on Facebook and tag their
friends. When they tag their friends, then their friends will have those photos in
their account. P3 said:
“Whenever we went out, P1 took most of the photos. She tagged me
on Facebook and this is the way I get my photos. The way that I share
my photos with my parents is Facebook. I share them on Facebook
and my sister shows my photos to them.”
Photo acquisition
All participants in this study had at least one digital capture device. The family
group members had a digital camera, which was shared between the mother and
Chapter 5. User experience study of multiple photo stream visualisation 90
father of the family. They each also had a camera phone; the daughter had
her own point-and-shoot camera, the grandmother had recently started using a
digital camera and the niece had an SLR as well as a point-and-shoot camera. All
members of this group said that the point-and-shoot camera is the main device
for taking photos.
In the family group, participants considered that all photos belong to the entire
family and that they find photos based on the device rather than the photographer.
F1 said:
“The pictures of all cameras belong to the family. It is not important
who took the pictures. Sometimes we are too lazy to manage the
pictures and we leave it as it is....Because all pictures belong to the
family, sometimes I want to filter our pictures based on the capture
devices.”
In Group 2, eight out of ten participants had a digital camera, while nine par-
ticipants had a camera phone. P7, a member of Group 2, like most of the other
participants in this group, had a camera phone alongside her digital camera. She
said:
“A camera phone is more accessible for emergency moments. I use my
camera phone when I do not have my camera with me but normally I
take photos with my digital camera to have better quality photos.”
In Group 1, all five participants had digital cameras and their digital cameras were
their main device for taking photos. In addition, three out of five members had a
camera phone. P3 said:
“I have an iPhone 3G and sometimes I take photos with my iPhone
but my main capture device is my Cannon camera.”
Chapter 5. User experience study of multiple photo stream visualisation 91
Sixteen out of twenty participants claimed that a digital camera is the main device
for taking photos, and four out of twenty participants said that a camera phone is
their main device for taking photos. Another source of personal photo acquisition
was sharing platforms such as social network websites. P5, a member of Group 1,
said:
“When we go out, I am not the person who takes photos; my friends
usually take the photos and share them with me via Facebook.”
There were many passive photographers among the participants. A passive pho-
tographer is a person who relies on other people to take photos and, after that,
collects the photos that were taken via social networks, email, remote sharing ap-
plications and physical drives. In the family group, the mother of the family (F2)
took fewer photos than the father (F1) and the father was the one who took the
most photos in the family. The father uploaded the photos onto Flickr and then
sent the link to other members of the family.
In Group 1, all participants except P1 said that most of their photos were taken by
friends and then shared on Facebook; however, they also had many photos from
their own cameras. P1 had her digital camera with her everywhere. P1 said:
“Normally I am the person who takes most of the photos, but I ask
other photographers to share their photos with me. I want to see more
photos.”
In Group 2, seven out of the ten participants were passive photographers; they
said that most of the time their friends take photos and then they collect them
from photo sharing platforms. P9 said:
“I bring my camera with me to special events but still most of the times
I am too busy to take enough photos. My friends share the photos with
me on Facebook or Dropbox.”
Chapter 5. User experience study of multiple photo stream visualisation 92
Therefore, multiple photo sources such as different capture devices and shared
photos on sharing platforms such as social networks exist. Thus, in the future,
multiple photo streams from different sources should be managed, otherwise or-
ganising photos from multiple sources will be a cumbersome task. 75% (five out of
twenty) of the participants claimed that photos from sharing platforms are their
primary photo source and just 15% said that their main source of photos is their
own camera.
5.5.2 User experience
Photo sources in the study
In this study, participants used different photo sources to upload their photos
into the system. In Group 1, participants uploaded their past photos from 2005
to 2011. The average uploaded photos by each participant was 1826 with the
standard deviation of 1369. The capture device most frequently used for taking
those photos was a normal digital camera. The photos uploaded by P1 and P5
were from their digital camera while those uploaded by P2, P3 and P4 were from
both a digital camera and a camera phone. However, they said that most of the
shared photos were taken by a normal camera as photos taken by their camera
phones were of low quality.
In Group 2, participants uploaded their photos from 2005 to 2011. The average
uploaded photos for each participant was 353 with the standard deviation of 332.
However, most of the photos were for the 48-hour photo diaries. For eight out of
the ten participants, the photos taken before the photo diaries were from digital
cameras whereas the remaining two participants said that they used both camera
phones and digital cameras.
For the photo diary photos, six out of the ten participants used just camera phones,
two participants used just digital cameras and two participants used a mixture of
digital cameras and camera phones.
Chapter 5. User experience study of multiple photo stream visualisation 93
In Group 3, the average uploaded photos by each participant was 378 with standard
deviation of 330. All participants used a digital camera for their photo diaries.
F1 used a camera phone alongside a point-and-shoot camera and F5 used an
SLR camera alongside a point-and-shoot camera. No-one in this group uploaded
any photos from their past and they mentioned that their historical photos were
managed based on the capture device rather than the photographer. Therefore,
at this stage, it was apparent that a weak point of our application is the absence
of a feature to show photos based on the capture device in addition to showing
photos based on the photographer.
Past photo experience
Participants in Group 1 shared most of the photos they had taken previously.
However, their perspective about this application was different from that of the
participants in Groups 2 and 3. The participants in Group 1 considered this
application as a tool that shows past photographic events from multiple friends
concurrently. They did not have any intention in creating photo diaries and the
photos presented in the application were captured by the current photography
practices of the participants.
Participant experience in this group was based on three elements: memory, aware-
ness and completeness. The participants said that this application created a flash-
back to see what happened to them individually in past. They viewed the photos
that had been unviewed for a long time and they remembered their past. P1 said:
“Wow, I almost forgot these photos.”
The main feature the participants mentioned was knowing what they were doing
in the past while their friends were doing something else at the same time. For
example, while viewing the photos, P2 and P3 noticed that, while P2 had been at
a family party, P3 had been at a basketball match. Another interesting example
was when P5 and P1 were viewing the photos; they both realised that there was
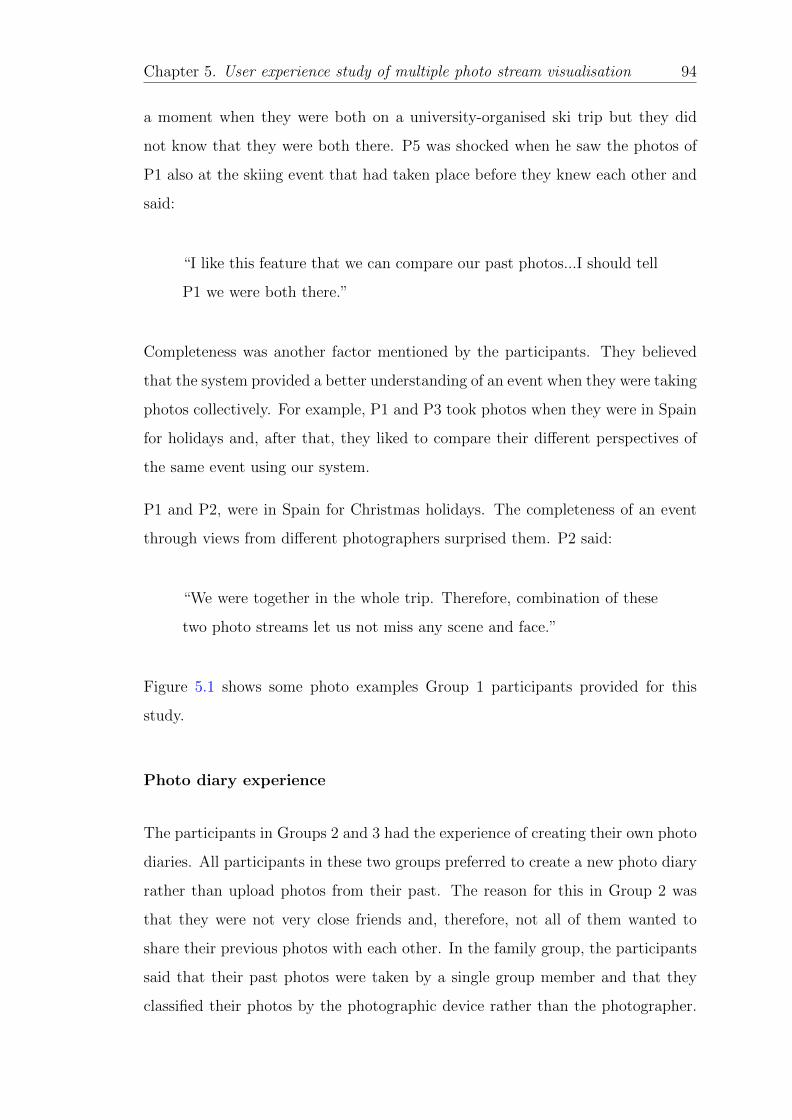
Chapter 5. User experience study of multiple photo stream visualisation 94
a moment when they were both on a university-organised ski trip but they did
not know that they were both there. P5 was shocked when he saw the photos of
P1 also at the skiing event that had taken place before they knew each other and
said:
“I like this feature that we can compare our past photos...I should tell
P1 we were both there.”
Completeness was another factor mentioned by the participants. They believed
that the system provided a better understanding of an event when they were taking
photos collectively. For example, P1 and P3 took photos when they were in Spain
for holidays and, after that, they liked to compare their different perspectives of
the same event using our system.
P1 and P2, were in Spain for Christmas holidays. The completeness of an event
through views from different photographers surprised them. P2 said:
“We were together in the whole trip. Therefore, combination of these
two photo streams let us not miss any scene and face.”
Figure 5.1 shows some photo examples Group 1 participants provided for this
study.
Photo diary experience
The participants in Groups 2 and 3 had the experience of creating their own photo
diaries. All participants in these two groups preferred to create a new photo diary
rather than upload photos from their past. The reason for this in Group 2 was
that they were not very close friends and, therefore, not all of them wanted to
share their previous photos with each other. In the family group, the participants
said that their past photos were taken by a single group member and that they
classified their photos by the photographic device rather than the photographer.
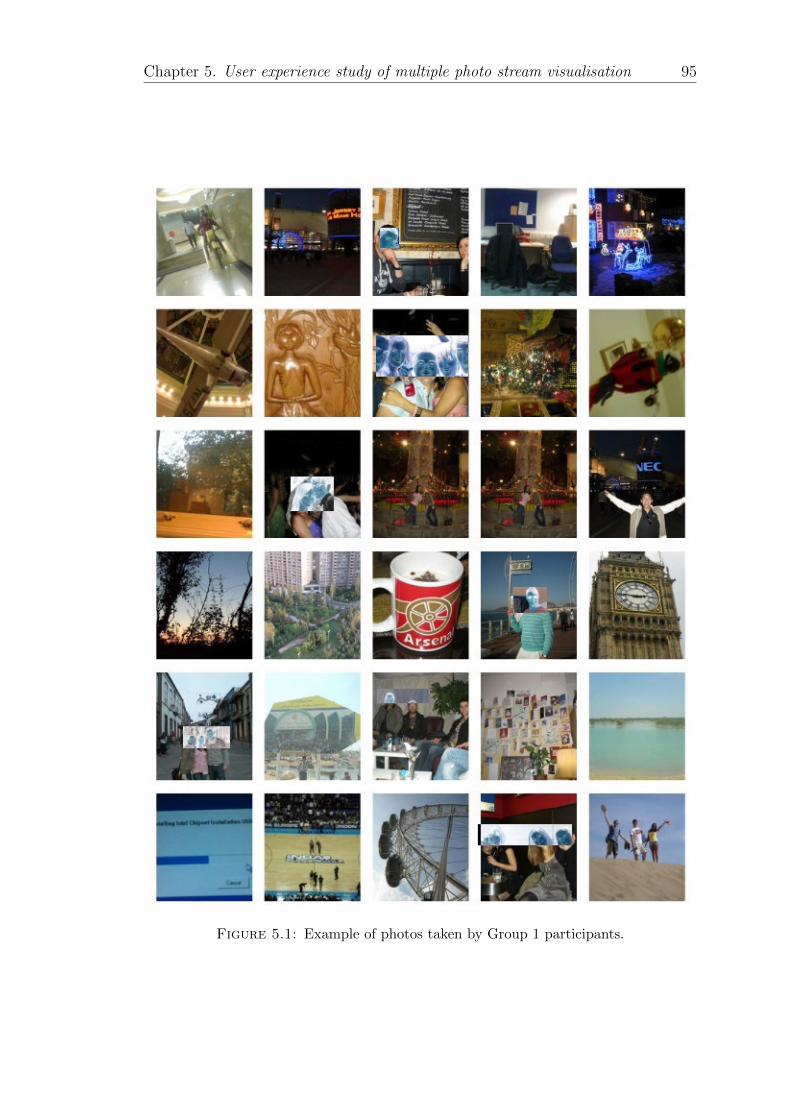
Chapter 5. User experience study of multiple photo stream visualisation 95
Figure 5.1: Example of photos taken by Group 1 participants.
Chapter 5. User experience study of multiple photo stream visualisation 96
By creating photo diaries, the participants in Groups 2 and 3 experienced nice
moments during dataset creation and subsequent viewing, as now described.
At the time of capture Most of the participants in our study seemed to develop
a sense that the photos taken were part of a shared collection that would be
presented later as a group-photo story package in our system. During the study,
they were sometimes alone and sometimes together as a group.
As an example of the times when they were alone, P9 started to take a photo from
our application interface with thumbs up and then from the Facebook webpage
with thumbs down to start his photo diaries story. After that, he captured all his
activities from waking up in the morning to going to the gym and then a birthday
party, where he joined other participants, at night.
Some participants sometimes took photos collectively. In some of the events,
participants were observed and their behaviours were noted. The collective nature
of photography sometimes led to a discussion and planning about who should
take what photo. In Group 2, six of the participants were at a birthday party
where they tried to assign tasks to each photographer such as to take photos from
different angles or distances from the birthday cake. In Group 1, while F1 was
driving his car with the family members, he set his camera timer to take photos
from the front window of the car. Meanwhile, F2 and F3 took photos of the inside
of the car and the outside corners. There were moments when participants were in
the same location but they did not discuss or plan photo taking and they just took
photos of their own favourite targets; sometimes the targets were similar without
any planning. In Group 2, some of the participants focussed on taking photos of
foods without any pre-planned action.
In Group 3, when the grandparent of the family was leaving the United Kingdom
from the airport, F1 and F2 took photos of that moment.
The collective nature of photography also created playful moments for the partici-
pants. They continuously took photos of each other’s faces in serious and awkward
Chapter 5. User experience study of multiple photo stream visualisation 97
moments. P6 acted as though the camera was a laser gun and he was trying to
find and shoot a target.
Figure 5.2 illustrates some example photos that Group 2 participants took during
the study; photos from the family group participants are shown in Figure 5.3.
Figure 5.2: Example of Group 2 photos.
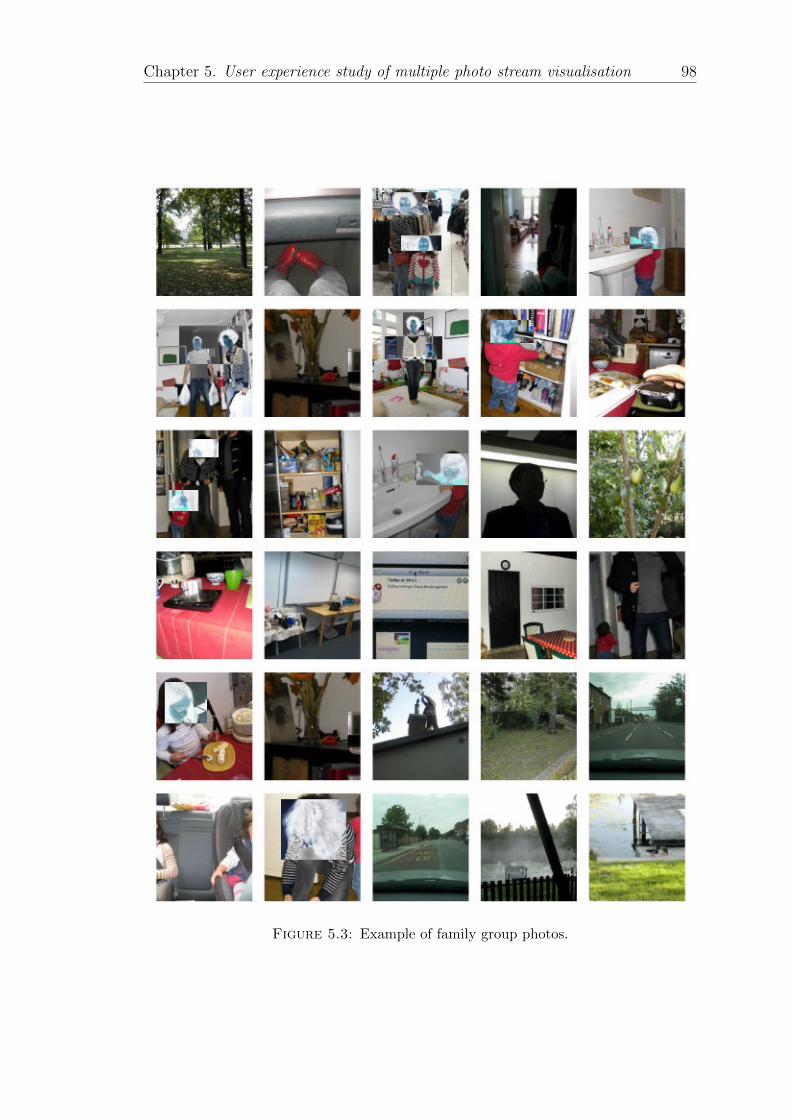
Chapter 5. User experience study of multiple photo stream visualisation 98
Figure 5.3: Example of family group photos.
Chapter 5. User experience study of multiple photo stream visualisation 99
During viewing Participants in Groups 2 and 3 all agreed that they had a good
experience while they were viewing the photos using a single- or a multiple- window
slideshow. They all mentioned that the chronological synchronous visualisation
characteristic of the system brought them a sense of awareness of what others
were doing while they were doing something else. P13 said:
“It was like a movie from different directors. I could see different movies
about two days of our lives with different story lines at the same time.”
P11, a member of Group 2, also said:
“I can follow the story of our lives. Other members were drinking
coffee in town centre of Guildford after lunchtime and then I could see
how each of them went home while I was sitting on my sofa and taking
photos of my washing machine.”
F1, a member of the family group, said:
“I like it when I see my mother’s photos before travelling here and
compare it with our photos.”
In addition, the participants were able to see the photos they took collectively.
Some of those photos showed different perspectives of the photographers and some
others had been discussed and planned before being taken. This means that
their photo collections, when they were together, became more complete. P10, a
member of Group 2, said:
“The website showed us all the photos of the birthday party event in
one place from different cameras. It is cool to see them all in one
place.”
F2, a member of Group 1, said:
Chapter 5. User experience study of multiple photo stream visualisation 100
“It is fantastic that all of our photos are here. It normally takes ages
to get photos of others after an event or normally they forget to share
them. Now, I have access to all of them.”
User experience of single-window slideshow
Collocated experience The main contribution of the single-window slideshow
was that it showed one or different users’ photos in one slideshow window. The
results showed that the single-window slideshow surprised people when the streams
were from the same time and place (collocated). After viewing the photos, 100% of
the participants believed that viewing photo streams taken at the same time and
place by a single-window slideshow was satisfying. The reasons were completeness
of event and discovering photographic perspectives of their friends. The value in
the ability to share a collocated experience in a single-window slideshow was the
completeness of events.
Remote experience Unlike the collocated experience, the results showed that
the single-window slideshow did not fully satisfy the participants when the streams
were from the same time but different events (remote experience) as much as for
collocated experiences. This study showed that although the participants liked to
know what happened to others while they were doing something else in a different
place and at the same time, the appearance of the unrelated photo in the single-
window slideshow changed the mood of the participants. 90% of the participants
believed that changing from the collocated state to the remote state was intrusive.
However, they never denied an interest in having awareness of the activities of
other members.
P4, a member of Group 1, was viewing the photo streams of two other participants
(P3 and P1) when they were in a sunny Canary island and suddenly a photo from
P5’s stream, which was a photo of a snowy road in London, appeared. He said:
Chapter 5. User experience study of multiple photo stream visualisation 101
“There is a problem with single-window slideshow. I like to know what
P5 was doing in London, for instance, when we were in the Canary
islands for the New Year but it is really weird when a photo from
another scene breaks this.”
In another case, P8, a member of Group 2, was in London while some other
members were at the birthday party of P7; P7 said that she was viewing her
birthday photos taken by different people but suddenly a photo of a TV taken
by P8 appeared and, therefore, she found this experience discouraging. F2 and
P5 were the only participants who found the single-window slideshow in remote
experience very pleasant and promising.
Asymmetric transition Asymmetric transition occurred in the single-window
slideshow when the numbers of photos from some participants were much larger
than those from other participants. In other words, the problem occurred when
one person took many photos of an event and other users did not take any photos
at a similar time. Therefore, photos from other participants appeared on the
screen with a delay.
The benefit of the single-window slideshow was that it provided a sense of aware-
ness and completeness between participants from their past photos in a collocated
and remote experience. However, the probability of a comparison between events
was low, creating Asymmetric transition so that the became boring by showing one
photo stream only; this happened mostly in Group 1 because these participants
uploaded their past photos only and did not create new photo diaries during the
fixed time of the study. Therefore, the number of photos taken at the same time
was lower for Group 1 than for Group 2 and 3 participants, with a correspondingly
lower collocated and remote experience.
P1, P3, P4 and P5, all members of Group 1, commented that for a year there were
only photos from P2. They believed that it was fine to know what others did in
their past. However, the stream was too long and discouraging. Moreover, they
stated that there were many photos from others that they did not have any feeling
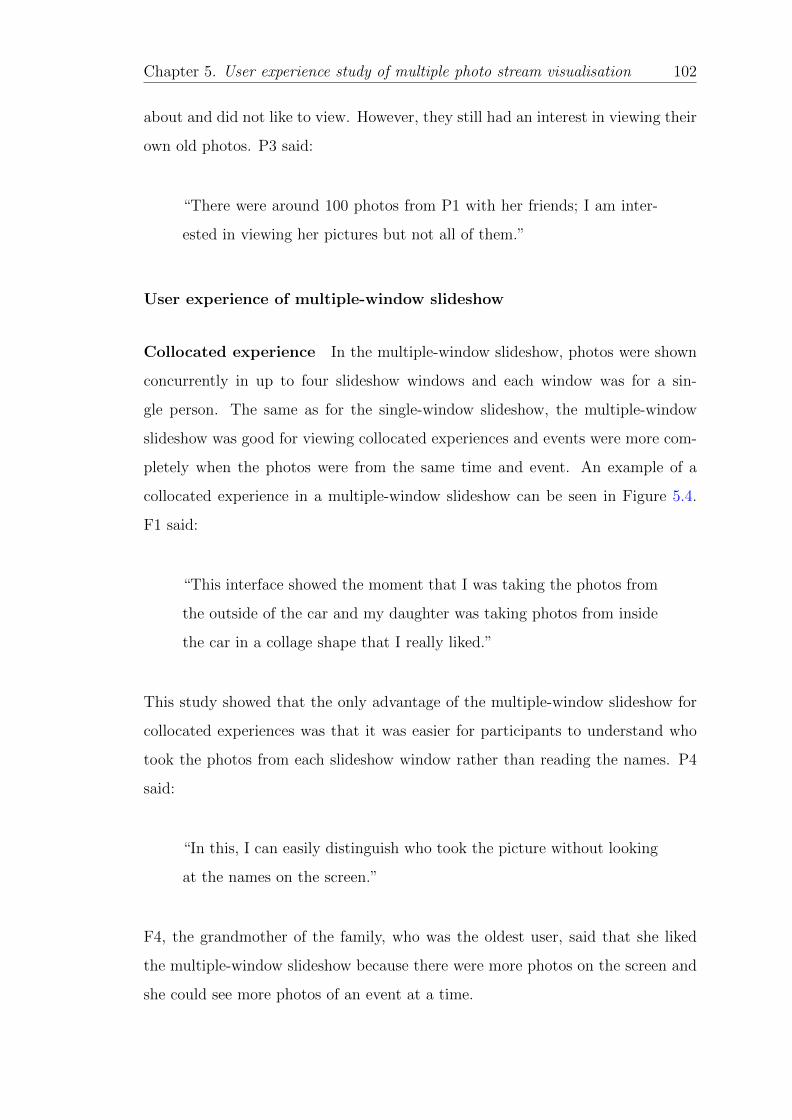
Chapter 5. User experience study of multiple photo stream visualisation 102
about and did not like to view. However, they still had an interest in viewing their
own old photos. P3 said:
“There were around 100 photos from P1 with her friends; I am inter-
ested in viewing her pictures but not all of them.”
User experience of multiple-window slideshow
Collocated experience In the multiple-window slideshow, photos were shown
concurrently in up to four slideshow windows and each window was for a sin-
gle person. The same as for the single-window slideshow, the multiple-window
slideshow was good for viewing collocated experiences and events were more com-
pletely when the photos were from the same time and event. An example of a
collocated experience in a multiple-window slideshow can be seen in Figure 5.4.
F1 said:
“This interface showed the moment that I was taking the photos from
the outside of the car and my daughter was taking photos from inside
the car in a collage shape that I really liked.”
This study showed that the only advantage of the multiple-window slideshow for
collocated experiences was that it was easier for participants to understand who
took the photos from each slideshow window rather than reading the names. P4
said:
“In this, I can easily distinguish who took the picture without looking
at the names on the screen.”
F4, the grandmother of the family, who was the oldest user, said that she liked
the multiple-window slideshow because there were more photos on the screen and
she could see more photos of an event at a time.
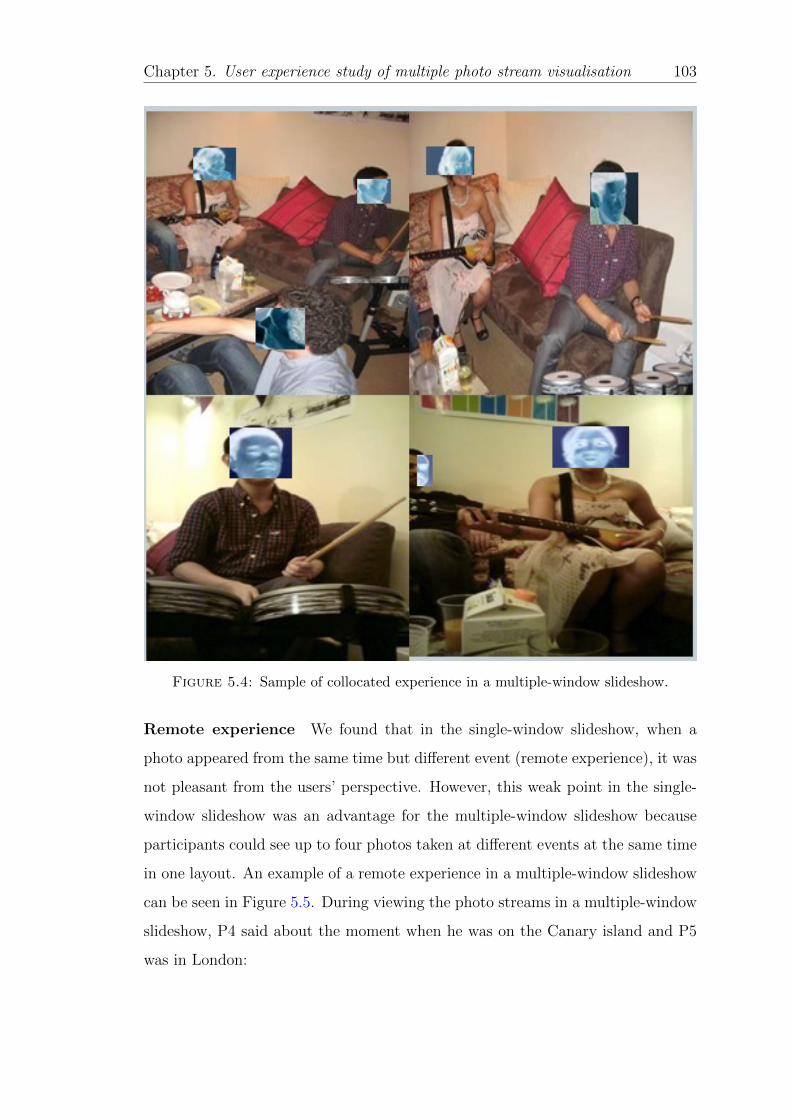
Chapter 5. User experience study of multiple photo stream visualisation 103
Figure 5.4: Sample of collocated experience in a multiple-window slideshow.
Remote experience We found that in the single-window slideshow, when a
photo appeared from the same time but different event (remote experience), it was
not pleasant from the users’ perspective. However, this weak point in the single-
window slideshow was an advantage for the multiple-window slideshow because
participants could see up to four photos taken at different events at the same time
in one layout. An example of a remote experience in a multiple-window slideshow
can be seen in Figure 5.5. During viewing the photo streams in a multiple-window
slideshow, P4 said about the moment when he was on the Canary island and P5
was in London:
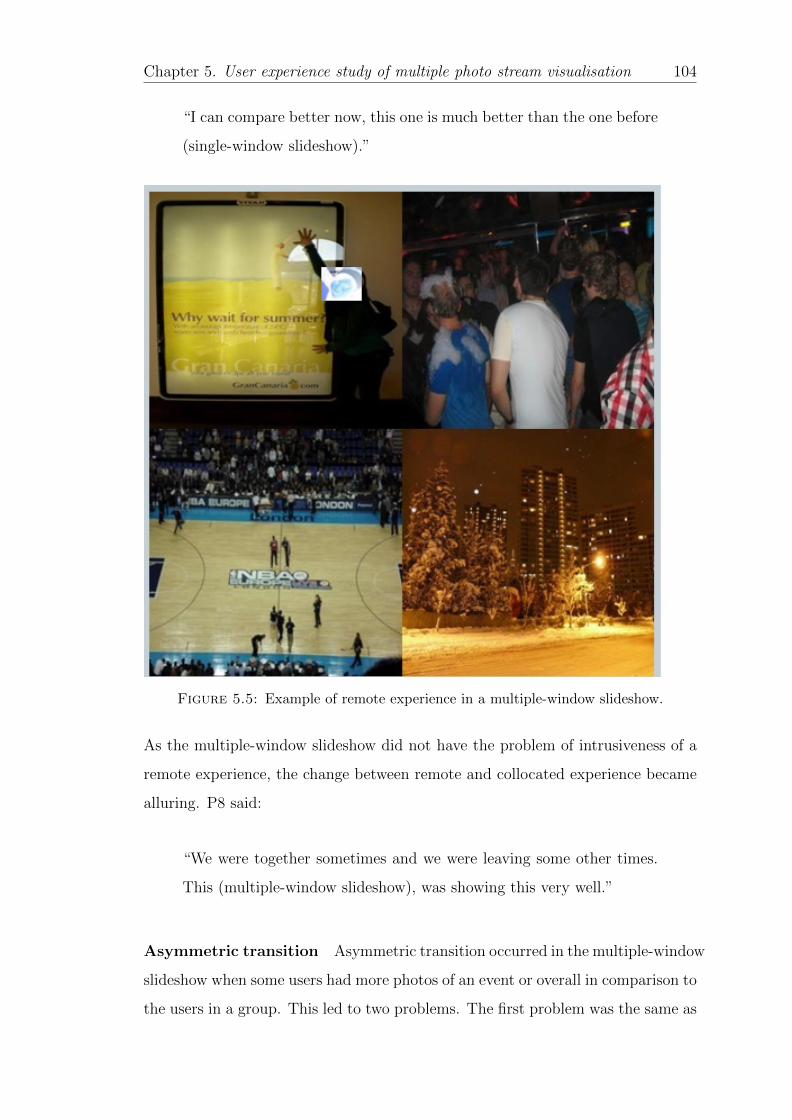
Chapter 5. User experience study of multiple photo stream visualisation 104
“I can compare better now, this one is much better than the one before
(single-window slideshow).”
Figure 5.5: Example of remote experience in a multiple-window slideshow.
As the multiple-window slideshow did not have the problem of intrusiveness of a
remote experience, the change between remote and collocated experience became
alluring. P8 said:
“We were together sometimes and we were leaving some other times.
This (multiple-window slideshow), was showing this very well.”
Asymmetric transition Asymmetric transition occurred in the multiple-window
slideshow when some users had more photos of an event or overall in comparison to
the users in a group. This led to two problems. The first problem was the same as
Chapter 5. User experience study of multiple photo stream visualisation 105
for the single-window slideshow, whereby the photos of just one person over a long
period of time were shown and the photos of other users were shown after a long
delay. This study showed that the participants wanted regular changes between
slideshow windows; the more changes between slideshow windows, the better the
experience.
The second problem was that some slideshow windows were frozen on the photo
that did not belong to the time of other slideshow windows. In other words, some
photos on slideshow windows might belong to a different time and different place,
which broke the feeling of time concurrency during viewing.
In Group 1, participants should not wait too long to see shared moments and
their own photo stream. During the study, two participants had many photos of
many events. Therefore, their slideshow windows were sliding more than those of
other participants. Common questions that participants in Group 1 asked during
viewing their photos using multiple slideshow windows were:
“Why is my slideshow window not sliding?... Why do other slideshow
windows not slide?”
To solve this problem, participants suggested decreasing the number of photos
that others had when there was no remote or collocated experience.
Another problem was when a photo in one slideshow window did not relate to
other photos in terms of timing. P5 said:
“There were some photos that stayed for a long time...they were no
more related to the newest photo.”
The showing of photos that were unrelated to photos from older events was not
always a disadvantage. During the presentation, there was a moment that P5’s
photo of a basketball match was on the screen. Then, a photo from P1 which
belonged to the time that she was in another country appeared. The time difference
Chapter 5. User experience study of multiple photo stream visualisation 106
between these photos was a month. Although P5 realised the one month time
difference between these two photos, he liked to consider that the moment was
from the same time and different place, and when we reminded him that it was
not exactly at the same time, he said:
“Wow, when I was here (home) she was still in Spain...I would like to
believe that they were at the same time...this makes it more interesting
as their capture times were not too far.”
This illustrates how people create a new story for themselves based on the concept
of collective memory [167]. Although this was just one participant’s statement,
investigating this in more detail may make for a good future study. From this
participant’s statement it can be concluded that there is a potential advantage in
keeping photos from slightly different times in the slideshow windows to allow the
user to create a new collective memory.
Transitions
Proportional transition By enabling the proportional transition in the single-
or multiple-window slideshow, the users had the opportunity to view the slideshow
with automated transition intervals. When the time difference of consecutive
photos was small, the transition was fast, and when the photos were distant in time,
the transition was slow. For example, it took ten milliseconds for the transition
between photos taken at very similar times and it was possible to take more than
20 minutes for a one-year gap between consecutive photos.
All of the participants seemed to feel that proportional transition provided a sense
of time between slides. From the point of view of the participants, proportional
transition offered them an easier connection between photo streams. Participants
believed that they could distinguish the different events by the intervals of the
slideshow. They were also able to judge how far ahead in time the next event would
be. During the interview, F1 mentioned the experience he had during viewing the
Chapter 5. User experience study of multiple photo stream visualisation 107
photos. He realised that there was a slight delay between the transition from the
last photo of the night and the first photo in the morning of the next day. He said:
“I felt that slideshow had a delay between the night and morning.”
P7, a member of Group 1, said:
“This (proportional transition) was a kind of smart system which gave
me the notion of time and feeling the change of event. In some events,
like P11’s sky diving photos, photos were taken in a row (in burst).
Therefore, the speed was fast and I felt it was a movie.”
P12, another member of Group 2, commented that she liked proportional tran-
sition in events for which photos were continuous, such as the photos P10 took
when she went back home from all of her moments. She added that she liked the
feeling of event change.
The proportional transition had one problem; namely, when the transition between
slideshows was too long. In some conditions, the transition was more than ten
minutes and the users pressed the skip-next button for another photo.
P9 said:
“Proportional transition is like autopilot mode in airplanes. The sys-
tem will do everything for you. However, waiting too much for the
next photo was annoying and I just skipped the photos on that mo-
ment manually.”
Regarding the issue of waiting too long for some transitions, P14 said:
“I like to feel the time in slideshow but you need to set a time limit
for when the slideshow is too long.”
Chapter 5. User experience study of multiple photo stream visualisation 108
We asked the participants to use our website as their screen saver using a third-
party application. We aimed to see if proportional transition could successfully
be used on longer timescales. None of the participants; when we asked them
for the reason, they stated that they usually turned off their computers while
they were not using them. Therefore, they proposed that it would be better if
the website was in a system with the decorative purpose, such as a digital photo
frame. In that case they would be likely to use it. When we asked them if they
use proportional transition time in a photo frame, they answered that it would be
a good idea. Although our main goal was using proportional transition time for
ambient display use, participants preferred to use it in order to watch photos faster
in time and skip the lengthy transitions. Overall, proportional transition time was
accepted by the participants but they all believed that long-time transitions with
the current use of reviewing photo streams from the past should be limited.
Event informer The event informer clustered photos into different temporal
events and then informed the user with a message that the event changed during
the slideshow. The transition in the event informer was two seconds per slide.
Generally, participants liked the idea of event informer. They were able to see the
change of events in photo streams so that they were visually ready for a new event
after seeing the message “Event Changed” P14 said:
“It is a good idea to inform me when the next event is, as there were
many photos that I could not understand if they belonged to the pre-
vious event or not. I can be ready for something new and not mixing
the photos from different events.”
Participants stated that the proportional transition time had an advantage in
terms of showing shorter or longer time differences between consecutive photos by
the transition interval. Therefore, they were able to know how far in time the next
photo will be from the current photo. On the other hand, the event informer did
not have the problem of a long transition interval. P7 said that the proportional
Chapter 5. User experience study of multiple photo stream visualisation 109
transition is more natural compared to the event informer because he could feel
the event change rather than see it. The main goal in designing this transition was
to obtain a comparison between the feeling of the event change via proportional
time and showing the event change by a visual clue via event informer. However,
the user preference between these two was not statistically different. In addition,
interview data presented that participants liked the idea of feeling the event change
using proportional transition because of the novelty of this idea and the new sense
that it gave to the user.
Desired time The system supports reviewing photos by relying on a specific
feature: the user desired time. In such a feature, the streams were shown over the
time that the user has chosen. The user desired time was useful when the users
needed fast revision of their lives in a specific period of time.
In the study, the participants’ selected desired time was between 1 and 10 minutes.
P7 selected 2, 5 and 8 minutes. She was satisfied with 8 and 5 minutes but 2
minutes was too fast for her. She said that she liked this new experience and it
was useful for her when she wanted to see her photos faster. However, she said,
when she set the desired time for 2 minutes: ”It was like a jet, no, not this fast”.
Most of the participants selected a short slideshow time and saw this feature as a
kind of fast revision of past events in their lives. P14 said:
“Fast change reminded me what happened in our lives very fast. This
is what I wanted from this feature. I do not need any detail. It is just
a good, fast way of remembering our past.”
The desired time in comparison to the proportional transition and the event in-
former had both advantages and disadvantages. An advantage was that partici-
pants could see their past faster and, also, that they had control over the overall
time span of the slideshow presentation. A disadvantage was that they could not
notice when an event changed, as with the event informer, and they did not have
Chapter 5. User experience study of multiple photo stream visualisation 110
a notion of time, as in the proportional transition time. Therefore, P9 suggested
combining this feature with the proportional transition to bring the feeling of event
change by choosing the desired time.
P5, a participant from Group 2, mentioned the problem of internet connection
when the desired time was set to less than 3 minutes. He said:
“My home broadband is not very fast. The photos were not loading
during the slideshow. I can enjoy this feature now in the lab. You can
add a feature to remove some photos rather than making the slideshow
faster.”
Group 1 had the most uploaded photos on the website. Therefore, they could see
what happened to them in fast mode, which they liked very much. However, P1
suggested an improvement to the system using the desired time: to slow down the
transition when it reaches same time experiences. P1 said:
“The moments that photos are from the same time, I prefer to see the
slideshow slower, the past photos can be passed fast.”
P8 wondered why, instead of the desired time, the normal slideshow could not be
used with the capability of changing slideshow intervals manually. Then, he could
manage the slideshow as he wanted and see photos that he liked more in detail.
One thing that we anticipated for the desired time was extending the duration of
the desired time and using it as a decoration tool such as a digital photo frame
at home. However, as was the case with the proportional transition delay, the
participants were not interested in a longer presentation time and they used this
transition to watch their photos as fast as possible with good recollection. They
stated that they would use this feature when they had a device such as a digital
photo frame at home but not on their personal computers. However, they liked
the idea of a digital photo frame and viewing past photos in a selected overall time
as a decoration.
Chapter 5. User experience study of multiple photo stream visualisation 111
In chapter 6, we introduced logarithmic and summarisation desired time transi-
tions to add the feeling of the event change during the presentation and to solve
the problem of the presentation being too fast due to the short presentation time
in current desired time transition.
User preference in transitions During the interviews, we asked the partici-
pants to score the transition types from 1 to 5. The results showed that the highest
score was for the proportional transition time, with average preference of 3.5 and
standard deviation of 0.6. The next transition was the desired time, with aver-
age preference of 3.4 and standard deviation of 0.59. The average preference for
the event informer was 3.15 with standard deviation of 0.67. Finally, the normal
slideshow had an average of 2.65 and standard deviation of 0.67.
After applying the t-test between the two least preferred transitions, the results
showed that the average preferences between the normal slideshow and the event
informer were significantly different (t(19) = 2.09, P <0.02). The t-test between
the event informer and the desired time showed that the average preference be-
tween them was not significantly different (t(19) = 2.09, P <0.2). Therefore, it
can be concluded that the preference means between the proportional transition,
the desired time and the event informer were not significantly different, while the
preference means between these transitions and the normal slideshow were sig-
nificantly different. This shows that people like these added features and they
also like to use each of them in the right place. For example, they preferred to
use the proportional transition time to feel the event change and notion of time
by just viewing the slideshow. On the other hand, they preferred to view large
numbers of multiple photo streams using the user desired time in short presenta-
tion times. In addition, the event change informer conveyed the understanding of
event change, making this transition a preferable choice for the users. Therefore,
all these proposed transitions can be applied to future photo visualisation tools
for slideshow, as each has its own values. Figure 5.6 shows the average of user
preference in different transitions. In the future, these transition types can be
studied in more detail using quantitative methods to understand which transition

Chapter 5. User experience study of multiple photo stream visualisation 112
is better in what situation adding a more accurate evaluation of user preference
in different conditions. For example different criteria such as acceptance, fun,
atmosphere, experience and aesthetics based on [168] have the potential to be
evaluated with different scores. In this study, however, only the overall experience
and user preference is evaluated while in future larger study by applying statistics
of age and gender can be applied.
0
0.5
1
1.5
2
2.5
3
3.5
4
4.5
Desired time Proportional transition Event informer Normal slideshow
Use
r p
refe
ren
ce
Figure 5.6: User preferences of transition types.
Adding visual status
The upload page comprises an upload bar that lets the user upload multiple photos.
The recently added photos of friends and the user are shown on the screen in grid
view. This is the way that the interface shows recently uploaded photos. However,
in both single- and multiple-window slideshows the date is set to the first photo
in chronologically sorted photo streams. The user should set the timelines to
the current day to see the latest photos from different participants. One design
recommendation from this user study was to show the latest uploaded photos of the
participants in the multiple-window slideshow mode and let the users update their
latest visual status using the multiple-window slideshow. It should be mentioned
that, to date (September 2011), Facebook and Twitter have not yet released adding
photos as a status in their interfaces and participants are just able to upload photos
into their Facebook albums. The reason that participants suggested this was that
Chapter 5. User experience study of multiple photo stream visualisation 113
they did not want to see the latest uploaded photos on the upload page and they
needed a simpler interface to see the latest visual statuses rather than switching
between different pages of the website. The user journey also supported that they
believe in the simplicity of the website rather than switching between different
pages. Moreover, they favoured the idea of using the system as an ambient display
and they suggested adding this feature in order to see others’ latest activities using
a dedicated screen in their home as a decoration tool.
Timeline design
One aspect that participants mentioned was timeline design. There were six time-
lines and the participants were able to choose the start date of the slideshow. At
first, participants were confused by using many timelines to choose the starting
date and they also did not know at what date exactly they took some photos.
In addition, the year and month timelines were the most useful compared to the
day, hour, minute and second timelines. F1 suggested designing a single timeline
slider for enabling the user to change the date of the photo streams. In addition,
user journey experiment showed that using six timelines was complicated and the
system needs a new design to be more intuitive and the solution that we took the
advantage in the next system design was single timeline.
5.6 Summary and discussion
This chapter described the web-based interface, implemented to share and visualise
multiple photo streams. This interface, which contained the upload page, a single-
window slideshow, a multiple-window slideshow, and transitions, was tested by
twenty users and their experience within the system was evaluated.
The single-window slideshow showed multiple photo streams in one slideshow win-
dow. The advantage of the single-window slideshow was in collocated experiences,
where the photos were from the same event at the same time. In this mode, all
Chapter 5. User experience study of multiple photo stream visualisation 114
photos of the same event from different people were shown on the screen and
without missing any scene from the same event at which they participated. How-
ever, there were two states that users did not like in the single-window slideshow.
The first was remote experience, which means when a photo from the same time
but different event appears in the middle of the main event. Although this state
brought awareness (knowing what happened to someone else at the same time
when the reviewer was doing something else), when an unrelated photo appeared,
the majority of the participants regarded it as a design problem that distracted
them. The other problem was Asymmetric transition, which occurred when some
participants had more photos than others and, therefore, their photos were shown
more than others on the screen.
The problem of remote experience in the single-window slideshow was solved in
the multiple-window slideshow interface. In this interface, photos were shown
concurrently in up to four slideshow windows. Therefore, participants could follow
what was happening from their photo streams whether they were collocated or
remote by the time of photo capture. The same as in the single-window slideshow,
Asymmetric transition occurred when one participant had more photos than other
participants; this was a problem of both single- and multiple-window slideshows
and we found that summarising multiple photo streams over the time of capture
solves this problem.
Another problem that participants mentioned was when a photo that was unre-
lated by date and time appeared in the interface of the multiple-window slideshow.
For example, when one participant did not have any photos taken during a partic-
ular time interval, other participants’ photos changed while the first participant’s
old photo remained on the screen; the photo that was unrelated in time should be
removed from the slideshow window. Moreover, participants suggested that the
most recently uploaded photos should be shown on the interface of multiple- and
single-window slideshows rather than on the upload page.
We also designed four transition modes: normal slideshow, proportional transition
time, event informer and desired time. The proportional transition time provided
Chapter 5. User experience study of multiple photo stream visualisation 115
a sense of natural event change for the participants during the slideshow. However,
the slideshow was, in some cases, either very fast or very slow. The event informer
showed a message of event change during the slideshow and, therefore, participants
could identify photos that did not belong to the same event. However, it was not as
intuitive and natural as the proportional transition. Normal slideshow was boring
and time consuming for the participants. In addition, the desired time introduced
viewing photos in a desired time the user selects for the presentation. However, it
did not give a notion of time for event change or show photos that taken in bursts
faster. Another problem of the desired time was when the total slideshow time
was short and the server was not able to load all photos during the slideshow.
The participants’ experience with transition modes showed that the proportional
transition was the favourite. However, the satisfaction of the proportional tran-
sition was not significantly different compared to the desired time and the event
informer, while these three modes gained significantly higher interest scores than
the normal slideshow. For example proportional transition was suitable for am-
bient display use while user desired time mostly used to watch many photos in
shorter total slideshow time. However, desired time had the potential to be used in
ambient mode as well. Event informer, also increased the experience of slideshow
by informing the changing the events during the slideshow for smoother presen-
tation of photos. Therefore, it can be concluded that, in the future, all these
transitions can be applied as potential features to slideshow applications to en-
hance user experience when viewing multiple photo streams, as each transition
has its own separate value.
The results of this study in terms of privacy showed that close friends did not
have any problem in sharing their old photos with each other, while the group
which were just friends did not wish to share all their old photos. However,
participants were interested in photo diaries and they enjoyed viewing them later
in our application. The family group did not have any problem with sharing their
old photos but they did not know who took the photos and they organised their
family collections by the capture device rather than by the person who took the
photos. The study showed that creating a photo story in a collocated environment
Chapter 5. User experience study of multiple photo stream visualisation 116
was enjoyable and reviewing photo streams via our application made it even more
interesting; the participants could follow the stories easily and explore what was
happening to others while they were doing something else.
Potential challenges and new requirements from this user study are listed below.
Interface
• Photo summarisation across multiple photo streams to solve the problem
of Asymmetric transition. Asymmetric transition occurs when one user has
more photos in their photo stream than other users. Therefore, participants
proposed that there is a need to summarise photo streams to create a bal-
anced slideshow between users.
• Image re-targeting (selection of the most representative part of an image)
for keeping the aspect ratio of a photo or loosing less important parts of a
photo when resizing. In multiple-window slideshow, the aspect ratios of the
photos were changed to fit the screen. Although not all the participants had
a problem with this, we received some recommendations to select the most
representative parts of the photo or to re-target the photos.
• Adding a visual status feature to the system for live communication via
photos. The system’s visual status was on the upload page. Moreover, the
intention of the design of this system was to enable users to view their past
photo streams. However, we found from the user study that showing the
latest photos on the slideshow window to notify other participants from the
latest visual status of different users is an interesting requirement for a future
design of the system.
• Making the display ambient by designing the application on a photo frame
size display. We aimed to let the participants use our photo sharing web-
site as an ambient display when they were using different transitions for
slideshow. However, they did not do this as they needed a dedicated dis-
play that they could use for this purpose. Therefore, creation of an ambient
Chapter 5. User experience study of multiple photo stream visualisation 117
display for photo sharing was another requirement that we found from this
study.
• Designing a single timeline rather than six timelines. Participants stated
that using six timelines for selecting the starting date point of the slideshow
is not practical and they recommended to change it to a single timeline.
• Solving the problem of when an unrelated photo from a different time and
event stays in the slideshow window. In the multiple-window slideshow, there
were times when one photo in one slideshow window did not belong to the
current photo set on the screen. Therefore, participants suggested removing
the photo that did not belong to the current time of the slideshow.
Transitions
• Solving the problem of proportional transition when the transition is too
slow or too fast.
• Solving the problem of not loading photos from the server because of internet
speed or server business when the transition speed is fast.
• Adding a feature to make the normal slideshow intervals manually control-
lable.
• Summarisation of multiple photo streams when the speed of the slideshow
is too fast in the desired time.
• Combining the desired time and the proportional transitions.
• Combining the desired time and the event informer transitions.
• Slowing down the transitions in collocated and remote experiences and com-
pensate by making the transition faster in the Asymmetric transition state.
In the next chapter, the temporal aspects of the design of multiple photo streams
will be described. These aspects comprise the different slideshow transitions from

Chapter 5. User experience study of multiple photo stream visualisation 118
manual to the desired time, summarisation of multiple photo streams and conti-
nuity detection.
Chapter 6
Temporal aspects of photo stream
visualisation
6.1 Introduction
Our previous system resulting from Phase 1 of the design supported the presenta-
tion of multiple photo streams obtained from different people. Its motivation was
to allow multiple users to keep in touch through a kind of visual comparison of
concurrent photos from their photo collections within small groups such as friends
or family members. The photos were displayed in a dynamic collage in the four
quadrants of a dedicated ambient display, with photos in each quadrant arriving
in real time as photos were taken.
This system could be used to review a historical collection of photos from each
member of the group, in lock step. Six sliders allowed users to change the photos
on the display to a particular point on the timelines and a replay button allowed
them to animate the display at different speeds.
Users enjoyed seeing their photos alongside those of their friends or family mem-
bers, particularly when they had attended the same events at which they all had
119
Chapter 6. Temporal aspects of photo stream visualisation 120
taken photos or when they took photos of different events that occurred at approx-
imately the same time. However, users had some problems controlling the rewind-
ing and re-display of synchronised photos at different speeds. Photo streams are
typically ‘bursty’ and non-linear [91], and, in the proportional transition mode,
users found it difficult to find a speed setting that was not too boring (with noth-
ing happening in certain quadrants) or too fast (with photos speeding past too
quickly to see them). Participants also suggested to utilise the combination of
transition modes in Phase 1. Hence, we recommended the development of algo-
rithms to warp the time of photo display in different ways in order to optimise the
user experience of photo review.
Another problem that users mentioned during the evaluation of our system in
Phase 1 was that in the concurrent visualisation of photo streams, some partici-
pants had more photos compared to others and, therefore, just the photos streams
of those who had more photos taken were sliding on the screen. To solve this
problem, the suggested solutions were summarisation of multiple photo streams
to squeeze the time of the presentation, to adjust the distribution of the photos
between slideshow windows, to emphasise the visualisation of the events happen-
ing at the same time (collocated and remote experience) and to show redundant
photos faster.
We have designed and implemented a system for visualisation of temporally syn-
chronised photo streams captured and shared by different users, and visualised in
an interactive interface. This section introduces the proposed interface design of
two side-by-side temporally synchronised photo streams.
6.2 Design and implementation
As initially presented in the work on requirement analysis for visualisation of mul-
tiple photo streams, there is a clear demand for visualisation of photo streams from
different sources due to the emergence of passive photo capture and life-logging
practices [169]. Based on these requirements, a novel interface is proposed that
Chapter 6. Temporal aspects of photo stream visualisation 121
lets users observe their photos chronologically and concurrently in a grid of adja-
cent windows. This design enables awareness of concurrent events and experiences
within small groups of users whether or not they are collocated, bringing a whole
new shared experience to the users.
The findings from Chapter 5 showed that users like to see multiple photo streams
using proportional transition time because they can recognise the changing of an
event naturally via the notion of time via the speed of the slideshow transition.
The proportional transition slideshow was a good transition to use for a digital
ambient display with a long time of presentation, but the speed of the slideshow
was often too fast or too slow. In addition, users suggested that photo streams
could be displayed by a manual selection of fixed intervals rather than by the
two-second interval. Moreover, they suggested to summarise photo streams or to
speed-up the transition when there is no collocated or remote experience.
In this study we applied six transition modes to the system. The concurrency
of the presented photo streams in three of the transitions is achieved by trans-
forming intervals between capture time stamps of two consecutive photos from the
presented streams into intervals between the appearance of the respective photos
in the interface. The fourth transition was based on the continuity between con-
secutive photos to show continuous photos faster in time as a short video. The
fifth and sixth transitions enabled users to choose the total slideshow time and
then the presentation of photo streams was adjusted based on the desired time
by eliminating the redundant photos or decreasing the transitions. The transi-
tions, termed transition modes, were: fixed, proportional, logarithmic, continuity,
logarithmic desired time and summarisation desired time.
From Study 1, participants mentioned the problem of the speed of the Internet
network or server for loading photographs. They said that when the transition
speed increases, sometimes they were not able to load the photos fully and some
of the participants could not view the photos when they were taken in bursts.
Therefore, in this version, the system was designed as an application-based system
Chapter 6. Temporal aspects of photo stream visualisation 122
rather than a website to support slideshow transitions with a faster processing
time.
6.2.1 Upload page
The upload page in System 2 enabled users to copy their photo collections onto the
system. The first element was the username and password section. The user was
registered with the system and was asked to enter their username and password
on this page. After that, the user was able to browse in order to upload a folder or
photos which were in their computer. After clicking the upload button, the photos
were copied to a folder, which was shared with a small group of users, and they
all were able to access that folder and update it while they were connected to the
Internet. The user was able to access the upload page by clicking on the upload
page button from the initial guide screen when the program was operating.
6.2.2 Display
The display page comprised a variety of elements. The user could access the
display page by pressing the display button from the initial guide screen. In this
page, there were two side-by-side slideshow windows, which presented the photo
streams concurrently. The only difference in the presentation compared to the
previous system in Phase 1 of the design was that in the current system, if a
photo in one slideshow window did not belong to the event of the current photo in
another slideshow window, then the photo that was unrelated to the current event
was replaced with a black screen, showing that there was no concurrency between
two photo streams.
This was adopted from Phototoc [98] to cluster a photo stream based on its tem-
poral features. The goal of this time-based clustering algorithm was to detect the
noticeable gaps of time between consecutive photos. A cluster was then created
from those gaps and assumed to be a change in event. With this method, the
local average (Tavg) of temporally nearby gaps is compared to the gap (∆t), and
Chapter 6. Temporal aspects of photo stream visualisation 123
when ∆t is much longer than Tavg, the new cluster is created as a new event.
Equation 6.1 illustrates the clustering condition technique.
∆i > Tavg = k +
n−1∑i=1
∆ti
N(6.1)
where N is the number of photos in photo streams, k is a suitable threshold (set
equal to five experimentally) and i indicates the number of photo in the photo
stream.
At the top of each slideshow window, there was a drop-down menu where the user
could choose the person who took the photo; after that, the user could narrow
down the selection by choosing the capture device the person used to take photos
with.
There was a single horizontal timeline designed for the current system, adopted
from the lessons learned from the previous study. In the initial system, there were
six timelines for selecting the start date of the presentation or searching through
photo streams; however, in the current system, one timeline was designed where
the user could go through all photo streams in chronological order.
There were five control buttons. Three of them (play, play backward and pause)
were under the timeline. The pause button was in the middle of the play-forward
and play-backward buttons. The other two buttons were skip forward and skip
backward and they were situated on the left and right side of the timeline.
There was an information bar at the middle top of the slideshow windows that
presented information such as date and time, number of photo and transition type.
There was a vertical slider on the right of the screen that let the user change
the speed of transitions. In order to choose the transition type, there were six
buttons: logarithmic, proportional, fixed, continuity, summarisation desired time
and logarithmic desired time. By clicking on any of these buttons, the name of
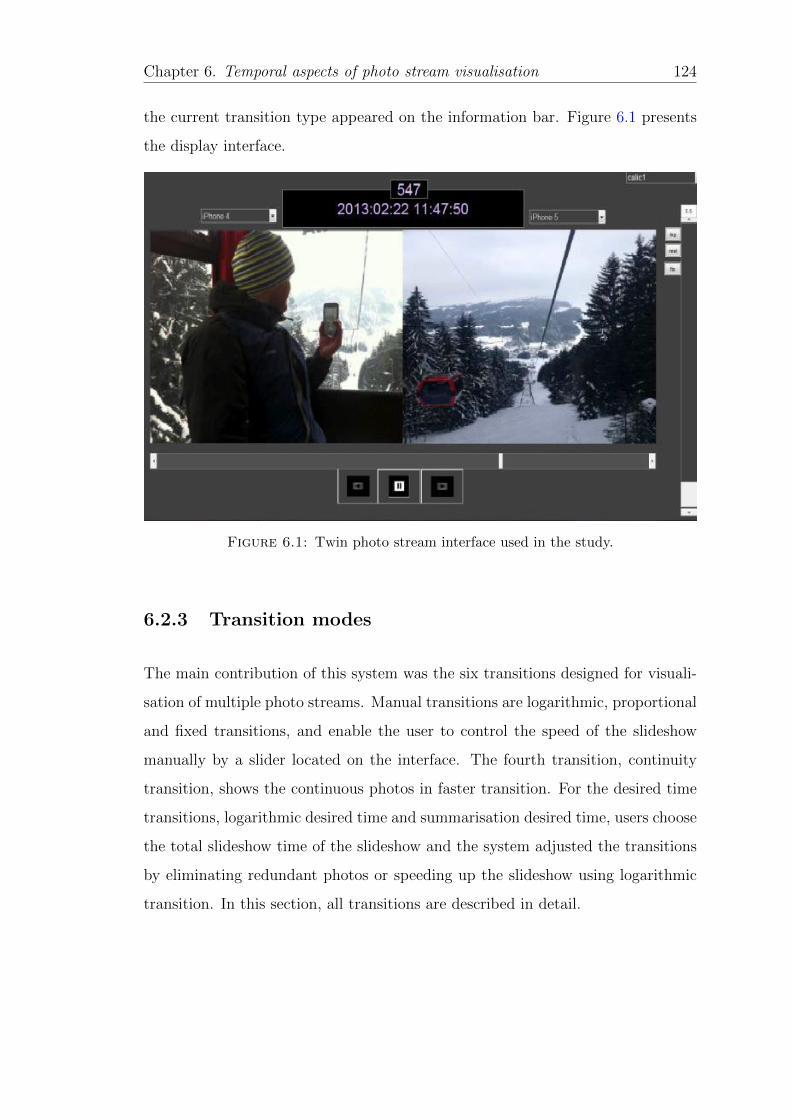
Chapter 6. Temporal aspects of photo stream visualisation 124
the current transition type appeared on the information bar. Figure 6.1 presents
the display interface.
Figure 6.1: Twin photo stream interface used in the study.
6.2.3 Transition modes
The main contribution of this system was the six transitions designed for visuali-
sation of multiple photo streams. Manual transitions are logarithmic, proportional
and fixed transitions, and enable the user to control the speed of the slideshow
manually by a slider located on the interface. The fourth transition, continuity
transition, shows the continuous photos in faster transition. For the desired time
transitions, logarithmic desired time and summarisation desired time, users choose
the total slideshow time of the slideshow and the system adjusted the transitions
by eliminating redundant photos or speeding up the slideshow using logarithmic
transition. In this section, all transitions are described in detail.
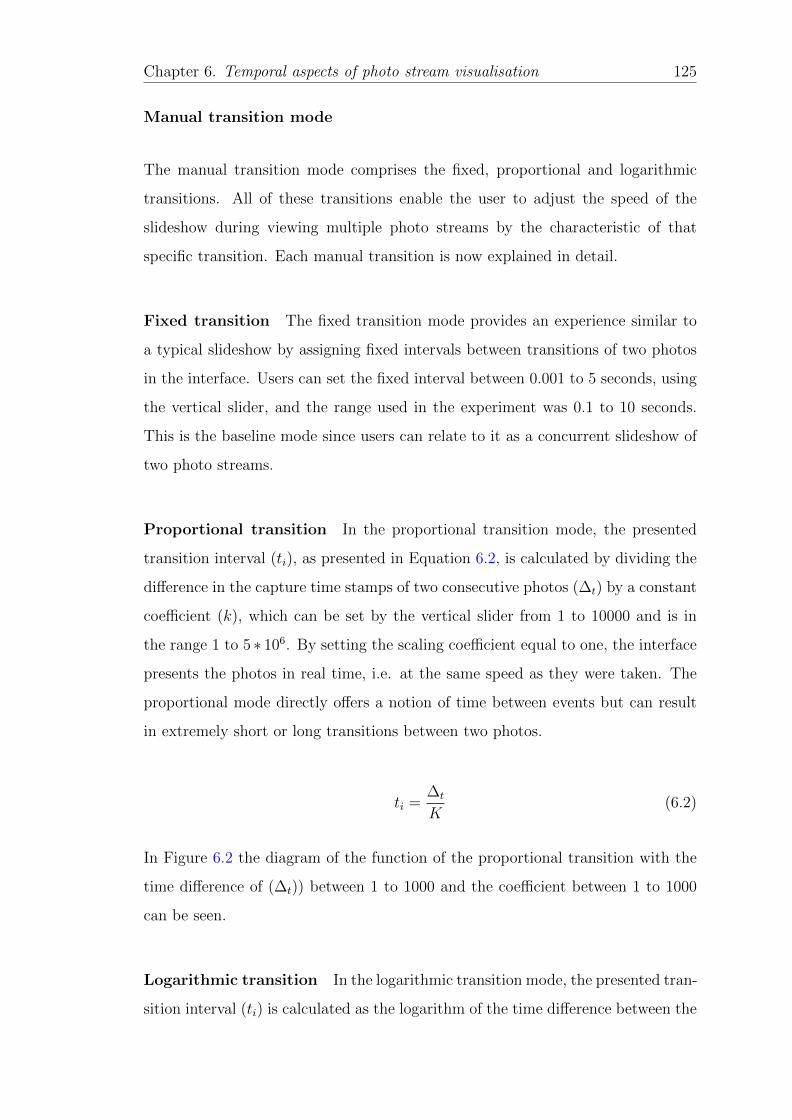
Chapter 6. Temporal aspects of photo stream visualisation 125
Manual transition mode
The manual transition mode comprises the fixed, proportional and logarithmic
transitions. All of these transitions enable the user to adjust the speed of the
slideshow during viewing multiple photo streams by the characteristic of that
specific transition. Each manual transition is now explained in detail.
Fixed transition The fixed transition mode provides an experience similar to
a typical slideshow by assigning fixed intervals between transitions of two photos
in the interface. Users can set the fixed interval between 0.001 to 5 seconds, using
the vertical slider, and the range used in the experiment was 0.1 to 10 seconds.
This is the baseline mode since users can relate to it as a concurrent slideshow of
two photo streams.
Proportional transition In the proportional transition mode, the presented
transition interval (ti), as presented in Equation 6.2, is calculated by dividing the
difference in the capture time stamps of two consecutive photos (∆t) by a constant
coefficient (k), which can be set by the vertical slider from 1 to 10000 and is in
the range 1 to 5 ∗ 106. By setting the scaling coefficient equal to one, the interface
presents the photos in real time, i.e. at the same speed as they were taken. The
proportional mode directly offers a notion of time between events but can result
in extremely short or long transitions between two photos.
ti =∆t
K(6.2)
In Figure 6.2 the diagram of the function of the proportional transition with the
time difference of (∆t)) between 1 to 1000 and the coefficient between 1 to 1000
can be seen.
Logarithmic transition In the logarithmic transition mode, the presented tran-
sition interval (ti) is calculated as the logarithm of the time difference between the
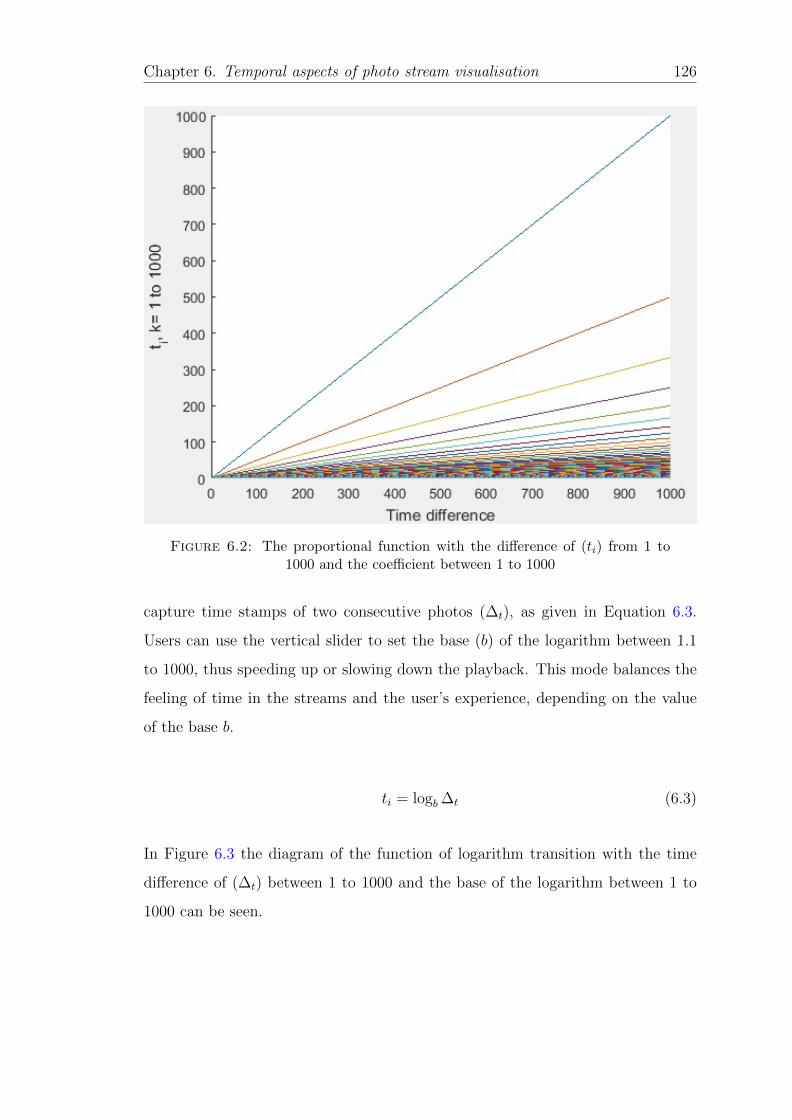
Chapter 6. Temporal aspects of photo stream visualisation 126
Figure 6.2: The proportional function with the difference of (ti) from 1 to1000 and the coefficient between 1 to 1000
capture time stamps of two consecutive photos (∆t), as given in Equation 6.3.
Users can use the vertical slider to set the base (b) of the logarithm between 1.1
to 1000, thus speeding up or slowing down the playback. This mode balances the
feeling of time in the streams and the user’s experience, depending on the value
of the base b.
ti = logb ∆t (6.3)
In Figure 6.3 the diagram of the function of logarithm transition with the time
difference of (∆t) between 1 to 1000 and the base of the logarithm between 1 to
1000 can be seen.
Chapter 6. Temporal aspects of photo stream visualisation 127
Figure 6.3: The function of the logarithm with the difference of (ti) between1 to 1000 and the base of the logarithm between 1 to 1000
Continuity transition
An important finding that emerged from observations of the fast proportional
transition mode in Study 1 was visualising events whose speed of content change
was slower than the rate of capture, i.e. the produced photo stream appeared
continuously. Triggered by this finding, a notion of “continuity” was introduced,
denoting a finite incremental change between two photos in a photo stream so as
to produce an effect of event continuity when presented at a rapid visualisation
rate, i.e. in a time-lapse video fashion.
In order to detect which photo pairs are “continuous”, three algorithms were
implemented and evaluated. All three algorithms produced a measure of continuity
between two photos. The first algorithm was based on the dense optical flow
estimation method [170], which tries to calculate the motion between two photo
frames taken at times t and t+ ∆t at every pixel position. The overall measure of
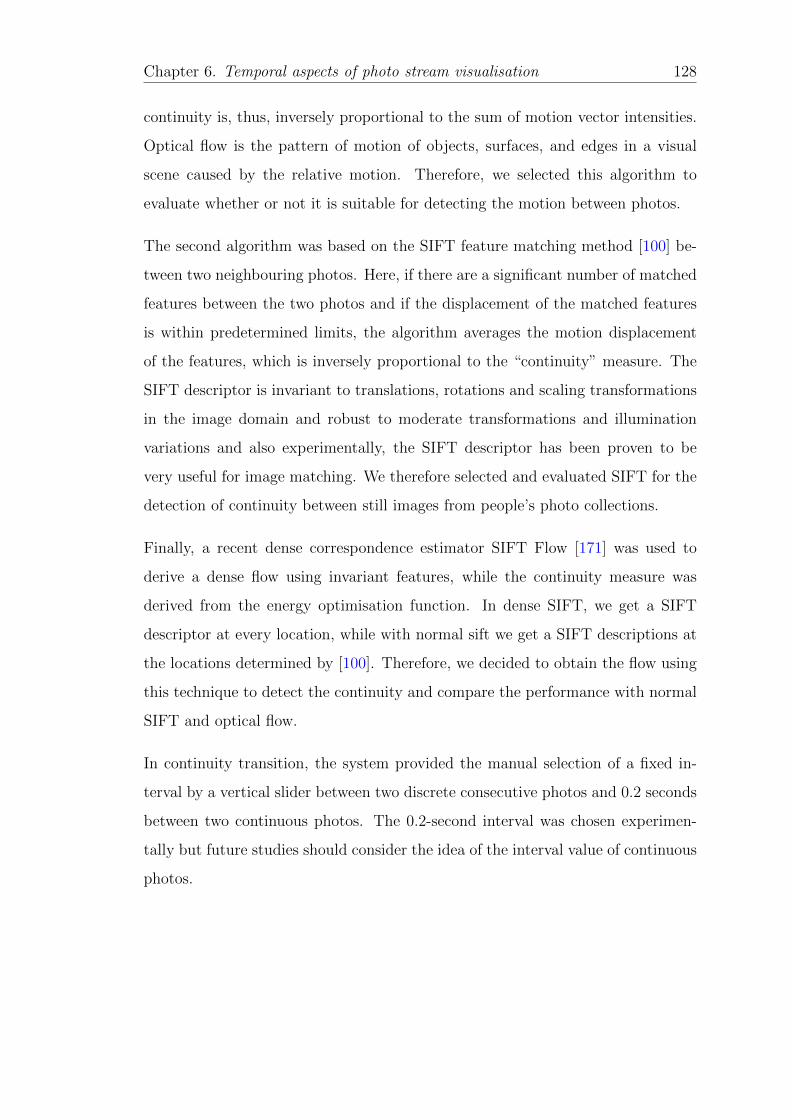
Chapter 6. Temporal aspects of photo stream visualisation 128
continuity is, thus, inversely proportional to the sum of motion vector intensities.
Optical flow is the pattern of motion of objects, surfaces, and edges in a visual
scene caused by the relative motion. Therefore, we selected this algorithm to
evaluate whether or not it is suitable for detecting the motion between photos.
The second algorithm was based on the SIFT feature matching method [100] be-
tween two neighbouring photos. Here, if there are a significant number of matched
features between the two photos and if the displacement of the matched features
is within predetermined limits, the algorithm averages the motion displacement
of the features, which is inversely proportional to the “continuity” measure. The
SIFT descriptor is invariant to translations, rotations and scaling transformations
in the image domain and robust to moderate transformations and illumination
variations and also experimentally, the SIFT descriptor has been proven to be
very useful for image matching. We therefore selected and evaluated SIFT for the
detection of continuity between still images from people’s photo collections.
Finally, a recent dense correspondence estimator SIFT Flow [171] was used to
derive a dense flow using invariant features, while the continuity measure was
derived from the energy optimisation function. In dense SIFT, we get a SIFT
descriptor at every location, while with normal sift we get a SIFT descriptions at
the locations determined by [100]. Therefore, we decided to obtain the flow using
this technique to detect the continuity and compare the performance with normal
SIFT and optical flow.
In continuity transition, the system provided the manual selection of a fixed in-
terval by a vertical slider between two discrete consecutive photos and 0.2 seconds
between two continuous photos. The 0.2-second interval was chosen experimen-
tally but future studies should consider the idea of the interval value of continuous
photos.
Chapter 6. Temporal aspects of photo stream visualisation 129
Desired time transitions
In order to speed up the total slideshow time and to give a notion of time to
the user, the logarithmic transition time was proposed and, from the logarithmic
transition time, the logarithmic desired time transition was built.
The logarithmic transition time means that the greater the time difference be-
tween two consecutive photos, the greater the delay of the slideshow transition.
Therefore, if two photos are taken in close time, the transition speed increases.
Moreover, the logarithmic transition time gives a notion of time during presen-
tation, which means that the user will understand when an event in the photo
stream is changing by the transition. As explained earlier, the major attribute
to speeding up and down the slideshow using the logarithmic transition time is
the base of the logarithm. A larger logarithm base leads to a faster slideshow
transition.
Having a technique to let us feel the event change between multiple photo streams
and viewing photos taken faster in bursts means that the transition time between
each slide should be calculated with respect to the desired total slideshow time
(T ) the user selects. From Equation 6.4 and, subsequently, Equation 6.5, the base
of the logarithm is calculated and, consequently, the speed of slideshow will be set
by the desired time during the presentation. The minimum total slideshow time
in logarithmic desired time based on our lab computer is calculated by dividing
the total photos to 10 experimentally. The user is free to select any amount for
the maximum slideshow length. The lab computer had 4GB of memory with Intel
i3 cpu.
n∑i=1
logb ∆ti = T (6.4)
b = T
√√√√ n∏i=1
∆ti (6.5)
Chapter 6. Temporal aspects of photo stream visualisation 130
In summarisation desired time, some redundant photos which belong to the Non-
concurrency state are eliminated (see Figure 6.4). The elimination degree depends
on the total slideshow time the user chooses. In this technique, multiple photo
streams from different people are merged into one stream. After that, they are
sorted by date and time. Having sorted photo streams in a single photo stream
in the first level of clustering, the photos are clustered by the device name or the
user name of the people who uploaded them. This will help not to eliminate the
collocated or remote experience states during the presentation of photos.
1 3 2 4 5 6 8 7 10 9 Chronological photo streams
1 3 2 4 5 6 8 7 10 9 Level 1 of clustering: By device or person’s name
1 2 3 4 5 6 7 8 10 9
Level 2 of clustering: By data and time
2 3 5 7 8 Most representative photo in each cluster of level 2
Figure 6.4: Summarisation process of redundant photos, where the user se-lected five seconds as a total slideshow time for ten photos and the transition
between slides was set to one second.
In the second level of clustering, photos of each cluster were sub-clustered by the
date and time difference between consecutive photos using K-means clustering [87].
In K-means clustering, K represents the number of clusters and should be set
before clustering the photo.
In order to obtain K, the rounded Ti is first calculated by dividing the desired total
slideshow time by the transition each slide user selects. Following that, by dividing
this calculated value Ti by the total number of clusters (N), the number of sub-
clusters (K) is calculated, as seen in Equation 6.6. In addition, if the number of
the recommended sub-clusters is larger than the number of photos in each cluster,
Chapter 6. Temporal aspects of photo stream visualisation 131
all photos in that cluster are sub-clustered and the remaining clusters are added
to the value of K of the cluster with the largest number of photos. Moreover,
if the result is a non-integer, the number of clusters is calculated by the ceiling
function and, following that, the sum of the remaining decimals from the non-
integer number are added to the value of K of the cluster with the largest number
of photos. Hence, the value of K for sub-clustering in each first level cluster might
be different.
For example, in Figure 6.4, 5 (five second presentation with one second transition)
was divided by 2 (number of first level clusters) giving the result of 2.5, which
should be the value of K in each sub-cluster. Therefore, the value of K for the
cluster with the largest number of photos (six photos) was 3 while the value of K
for the smaller cluster (four photos) was 2. The minimum total slideshow time in
summarisation desired time based on our lab’s computer is equal to the number
of clusters in first level of clustering. The user is free to select any amount for the
maximum slideshow length. The lab computer had 4GB of memory with Intel i3
cpu.
K =Ti
N(6.6)
In the next level, the most representative photo from each sub-cluster was selected
and shown in slideshow mode. The main criterion for the selection of the most
representative photo from a sub-cluster was completeness. However, completeness
is a subjective characteristic that can mean different things to different people.
Since there is not a definite way of calculating such a metric, an approximation
method was developed in order to select the most representative photo.
After clustering photos in two levels, each cluster contains photos of a similar
topic and event. The most representative photo among those photos is that which
describes the whole event most completely. Therefore, the selected photo contains
most of the objects that were presented in photos within the cluster and it should
be the most similar photo to the other photos. Therefore, the similarity metric
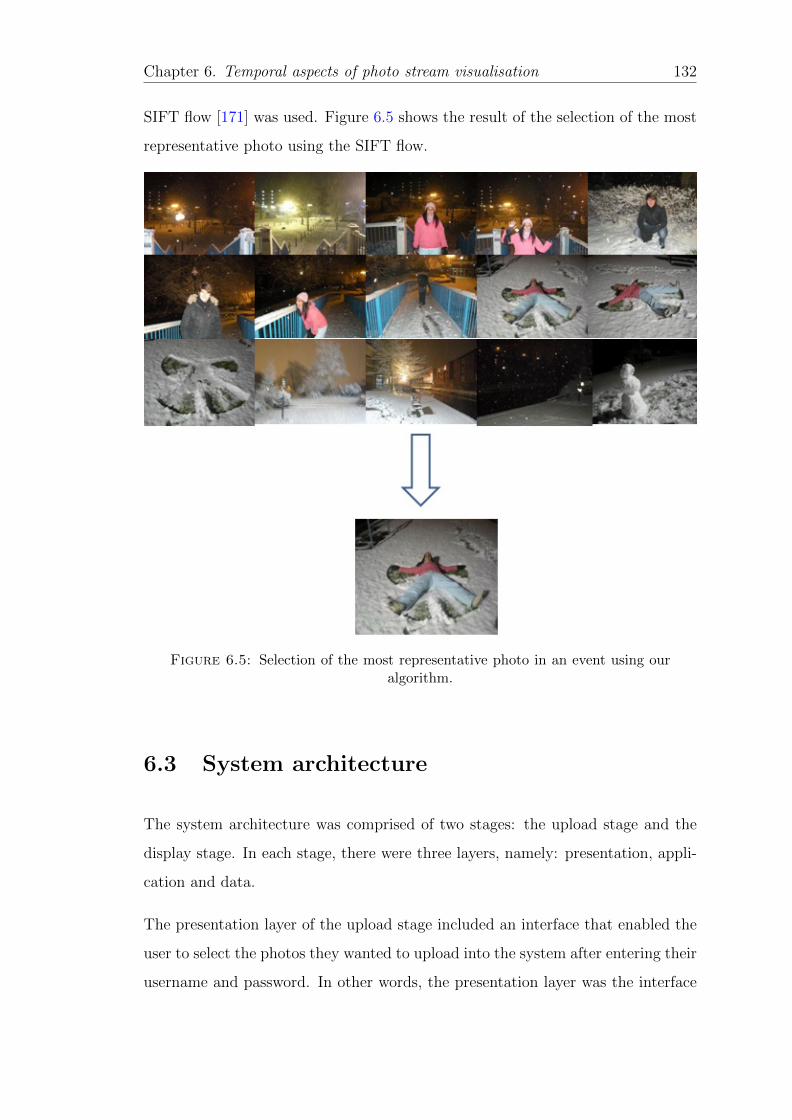
Chapter 6. Temporal aspects of photo stream visualisation 132
SIFT flow [171] was used. Figure 6.5 shows the result of the selection of the most
representative photo using the SIFT flow.
Figure 6.5: Selection of the most representative photo in an event using ouralgorithm.
6.3 System architecture
The system architecture was comprised of two stages: the upload stage and the
display stage. In each stage, there were three layers, namely: presentation, appli-
cation and data.
The presentation layer of the upload stage included an interface that enabled the
user to select the photos they wanted to upload into the system after entering their
username and password. In other words, the presentation layer was the interface
Chapter 6. Temporal aspects of photo stream visualisation 133
of the upload stage and was designed using the GUI designer from Matlab version
R2012a.
The application layer in the upload phase had the logic of the system. In this layer,
the system got the photos the user selected for upload and saved the username of
the person in the author section of the Exif header file of the photo. After that, the
system ordered the data layer to save the photo. The application layer downsized
the photos to 400*300 pixels in order to speed up the process of the presentation
layer and of the application layer in the display phase, while maintaining the
quality of the photo. In addition, the application layer removed the photos that
did not include the date and time of capture as metadata in their Exif header file.
This layer was coded by Matlab.
The data layer was a shared folder in the hard disk of each user. The photos
were saved in that shared folder and users were able to access the shared photos
with each other through that folder. Therefore, the system enabled the system to
use the capability of fast processing for the application and presentation layers by
using a folder in a physical memory; the remote connectivity between users was
maintained.
The presentation layer of the display stage included the main interface of the
system, which comprised visualisation of twin streams with the aid of control
buttons, viewing photo streams with transitions modes, adjusting the speed and
search via a timeline. This layer also provided the ability to select the name of the
people and their capture device for the presentation of their photos. This layer
was created using the Matlab GUI designer.
The application layer, which was the engine behind the interface, was concerned
with controlling the elements of the presentation tier. This layer gathered infor-
mation such as the date/time created, the name of the person who uploaded the
photo, the capture device name and photo features. For deduction, this layer
generated information such as time difference between photos, clustering photos
by date/time alongside the transition modes logic. Figure 6.6 shows the system
architecture.
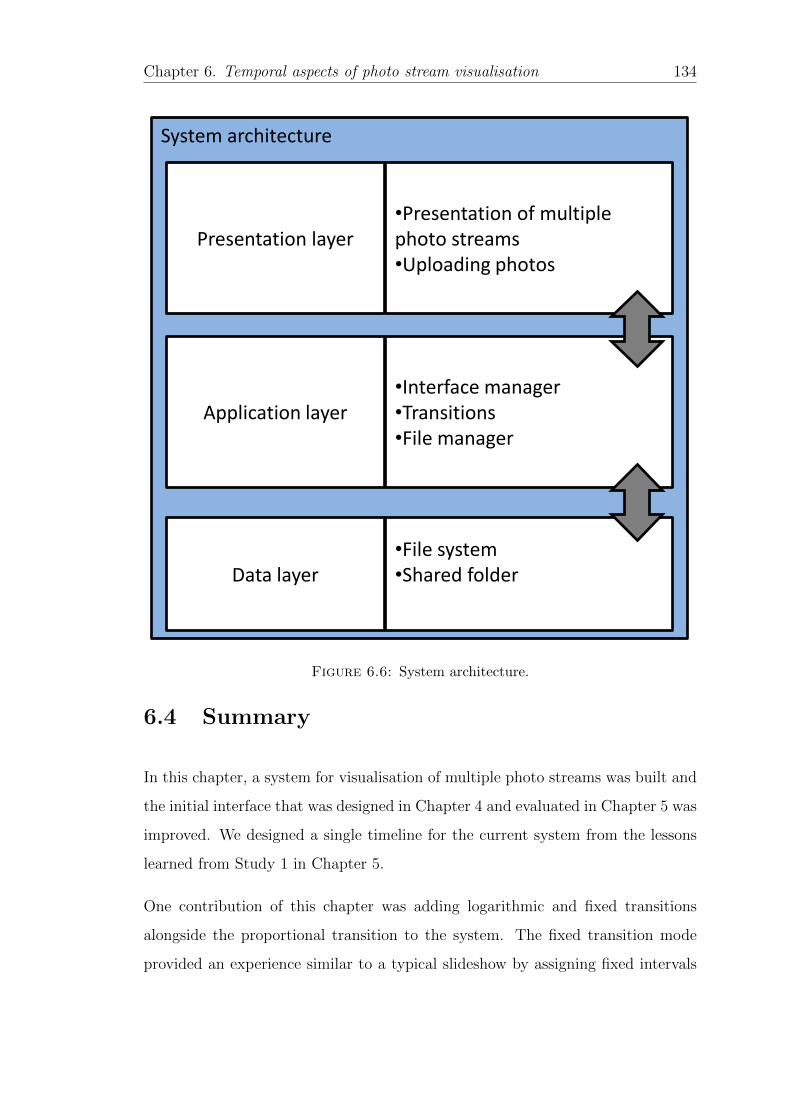
Chapter 6. Temporal aspects of photo stream visualisation 134
System architecture
•Presentation of multiple photo streams •Uploading photos
•Interface manager •Transitions •File manager
•File system •Shared folder
Presentation layer
Application layer
Data layer
Figure 6.6: System architecture.
6.4 Summary
In this chapter, a system for visualisation of multiple photo streams was built and
the initial interface that was designed in Chapter 4 and evaluated in Chapter 5 was
improved. We designed a single timeline for the current system from the lessons
learned from Study 1 in Chapter 5.
One contribution of this chapter was adding logarithmic and fixed transitions
alongside the proportional transition to the system. The fixed transition mode
provided an experience similar to a typical slideshow by assigning fixed intervals
Chapter 6. Temporal aspects of photo stream visualisation 135
between transitions of two photos in the interface. This enabled users to set fixed
intervals, using the vertical slider.
In the logarithmic transition mode, the transition interval in the slideshow was
calculated as the logarithm of the time difference between the capture time stamps
of two consecutive photos. Users could use the vertical slider to set the base of the
logarithm, thus speeding up or slowing down the playback. This mode balanced
the feeling of time in the streams and user experience, depending on the value of
the base. For example, the transition for photos taken in bursts would be faster
while the transitions for photos taken far apart in time would be slower. This was
implemented to solve the problem of the proportional transition time, when the
transitions were too slow or too fast, as mentioned in Chapter 5.
During the visualisation of multiple photo streams, one of the problems users
mentioned in Chapter 5 regarding the multiple window slideshow was when a
photo in one of the slideshow windows did not belong to the current time of the
slideshow. Therefore, we clustered the photo streams and if a photo did not belong
to the current cluster, it was eliminated from the slideshow window.
Another problem mentioned in the previous study in Chapter 5 was that during
the slideshow when the Internet connection was not fast, loading the photo took a
long time. Therefore, we created a shared folder between remote computers. Thus,
when a new photo arrived, it was placed in that shared folder in each computer,
thus enabling the application to access the photos from the local hard disk rather
than the server and, consequently, enhancing the slideshow experience.
Another improvement participants suggested in the previous chapter was to add
a feature to show continuous photos faster, like a movie, as all of them had photos
that were continuous; for example, a skydiving photo stream or photos taken in
bursts. Therefore, in this chapter we took advantage of three algorithms to show
photo streams like a time-lapse video as if they are continuous: SIFT, SIFT flow
and optical flow. All three algorithms produced a measure of continuity between
two photos.
Chapter 6. Temporal aspects of photo stream visualisation 136
Finally, from the lessons learned in Chapter 5 regarding the elimination of re-
dundant photos mostly in the Nonconcurrency state, combining the desired time
transition with the proportional algorithm and speeding up the presentation in
the Nonconcurrency state, we came up with two new transitions: summarisation
desired time and logarithmic desired time.
The logarithmic desired transition time used a logarithmic transition to show
multiple photo streams by the desired time chosen by the user. The transition
between each consecutive photo was adjusted depending on the time difference
between them and on the total slideshow time the user selected.
The summarisation desired time comprised elimination of the redundant photos
when the presentation of multiple streams was not in a collocated or remote ex-
perience. In this technique, photos were clustered in two levels using K-means
clustering according to the photographer or the capture device and time stamps.
The number of clusters was determined by the total slideshow time chosen by the
user. Ultimately, the most representative photo (most complete photo) from each
cluster was selected using the SIFT flow algorithm.
In the next chapter, the interface of our system and its affects alongside temporal
features, namely manual transitions, continuity detection and desired time, will
be evaluated.
Chapter 7
Study of temporal aspects in
photo stream visualisation
7.1 Introduction
In the previous chapter, we designed a system to show multiple photo streams
concurrently, between two users, according to the time the photos were captured.
The system had a single timeline to let the users review multiple photo streams
and to compare what happened between them earlier. Moreover, six different
transitions were utilised in the system. The first three transitions were fixed,
proportional and logarithmic transitions; these were named manual transitions
because users were able to control the speed of the slideshow manually using the
vertical slider we designed. The fourth transition was the continuity transition,
which showed continuous photos faster. The other two transitions were logarithmic
and summarisation transitions, which enabled users to decide the total length of
the slideshow and where the system eliminated redundant photos or speeded up
the slideshow using the logarithmic transition.
In the first section of this chapter, three manual transitions, alongside the benefits
of the system for visualisation of multiple photo streams, are evaluated. In the
second section, three algorithms that form the basis of the continuity transition are
137
Chapter 7. Study of temporal aspects in photo stream visualisation 138
evaluated and the best algorithm is selected for the continuity transition. Finally,
the logarithmic desired time transition is compared with the summarisation desired
time for different total slideshow times.
7.2 Manual transitions
Three manual transitions were designed and explained in the previous chapter,
namely: fixed, proportional and logarithmic. In this section, we evaluate our
application for the visualisation of multiple photo streams using the three proposed
manual transitions. Here, the user experience study comprises a combination of
a task-based study for the evaluation of the performance with user satisfaction to
gain quantitative and qualitative data regarding user use.
7.2.1 Method
Participants
Twenty participants volunteered to take part in this study; twelve females and
eight males, with a mean age of 29.55 years. The standard deviation of their age
was 6.2 years and their age range was 20 to 50 years. Participants were selected
from friends, family and colleagues of the researchers who conducted the study.
The participants chose samples of at least 500 photos from different events taken
over the course of a year. Moreover, those participants who had the intention to
share their photos with a researcher were chosen. All participants had at least one
kind of capture device. To this end, participants were from different countries but
were asked to confirm that they had lived in the United Kingdom in the previous
three years. All participants were either university graduates or undergraduates.
All participants were familiar with the Windows operating system.
Chapter 7. Study of temporal aspects in photo stream visualisation 139
Initial setup
Each participant was asked to provide at least 500 photos taken in the year preced-
ing the study. They also were asked to provide photos from at least three different
events; the number of photos from each event was not an issue. The reason for this
was to make the photo stream of each participant as diverse as possible over the
timeline. Each participant was asked to provide their photo collection by copying
them to a memory stick that was given to them. The sizes of the photos were
decreased to 400*300 pixels to speed up the presentation while ensuring that the
photo size did not affect the quality and looked pleasant on the slideshow win-
dows on the screen. In the next step, the photo streams were checked for diversity
over time and if they were not diverse enough, we removed them from the study.
In addition, photos without a time stamp were removed from the photo stream.
The participants’ photo streams were copied to the shared folder alongside the
researcher’s photo stream. The system tagged each photo stream by its owner
name at the time of copying onto the system.
Procedure
A user study was designed and conducted to investigate the effect of the first three
transition modes and the proposed interface on user photo viewing behaviour and
positive recollection. Each participant’s photo stream was paired with that of the
related researcher who conducted the study. Before pairing the participants, the
photos were checked for consistency throughout the period.
This study investigated the following three conditions:
1. Logarithmic
2. Proportional
3. Fixed
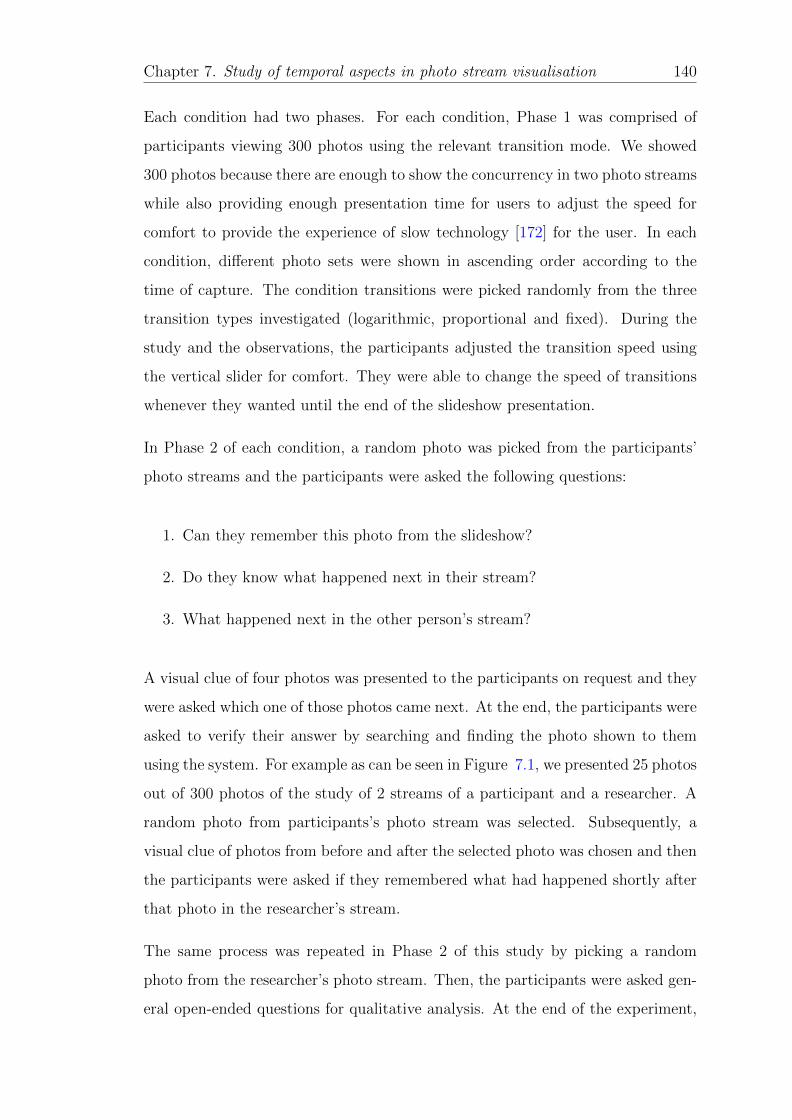
Chapter 7. Study of temporal aspects in photo stream visualisation 140
Each condition had two phases. For each condition, Phase 1 was comprised of
participants viewing 300 photos using the relevant transition mode. We showed
300 photos because there are enough to show the concurrency in two photo streams
while also providing enough presentation time for users to adjust the speed for
comfort to provide the experience of slow technology [172] for the user. In each
condition, different photo sets were shown in ascending order according to the
time of capture. The condition transitions were picked randomly from the three
transition types investigated (logarithmic, proportional and fixed). During the
study and the observations, the participants adjusted the transition speed using
the vertical slider for comfort. They were able to change the speed of transitions
whenever they wanted until the end of the slideshow presentation.
In Phase 2 of each condition, a random photo was picked from the participants’
photo streams and the participants were asked the following questions:
1. Can they remember this photo from the slideshow?
2. Do they know what happened next in their stream?
3. What happened next in the other person’s stream?
A visual clue of four photos was presented to the participants on request and they
were asked which one of those photos came next. At the end, the participants were
asked to verify their answer by searching and finding the photo shown to them
using the system. For example as can be seen in Figure 7.1, we presented 25 photos
out of 300 photos of the study of 2 streams of a participant and a researcher. A
random photo from participants’s photo stream was selected. Subsequently, a
visual clue of photos from before and after the selected photo was chosen and then
the participants were asked if they remembered what had happened shortly after
that photo in the researcher’s stream.
The same process was repeated in Phase 2 of this study by picking a random
photo from the researcher’s photo stream. Then, the participants were asked gen-
eral open-ended questions for qualitative analysis. At the end of the experiment,
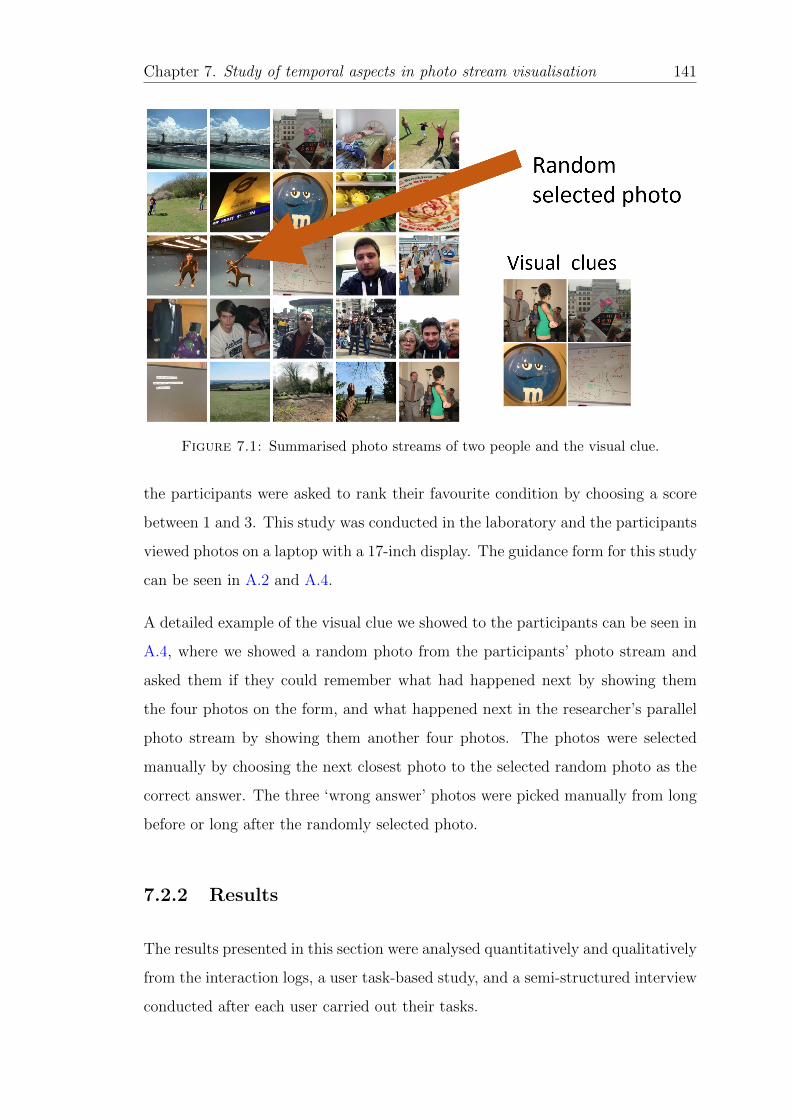
Chapter 7. Study of temporal aspects in photo stream visualisation 141
Figure 7.1: Summarised photo streams of two people and the visual clue.
the participants were asked to rank their favourite condition by choosing a score
between 1 and 3. This study was conducted in the laboratory and the participants
viewed photos on a laptop with a 17-inch display. The guidance form for this study
can be seen in A.2 and A.4.
A detailed example of the visual clue we showed to the participants can be seen in
A.4, where we showed a random photo from the participants’ photo stream and
asked them if they could remember what had happened next by showing them
the four photos on the form, and what happened next in the researcher’s parallel
photo stream by showing them another four photos. The photos were selected
manually by choosing the next closest photo to the selected random photo as the
correct answer. The three ‘wrong answer’ photos were picked manually from long
before or long after the randomly selected photo.
7.2.2 Results
The results presented in this section were analysed quantitatively and qualitatively
from the interaction logs, a user task-based study, and a semi-structured interview
conducted after each user carried out their tasks.
Chapter 7. Study of temporal aspects in photo stream visualisation 142
Total slideshow time
The average slideshow duration for viewing all 300 photos was: 181.19 seconds
(standard deviation=145.26 seconds) for the proportional transition mode, 399.21
seconds (standard deviation=225.8 seconds) for the fixed transition mode and
262.23 seconds (standard deviation=132 seconds) for the logarithmic transition
mode.
One-way ANOVA was conducted to assess if the use of logarithmic, proportional or
fixed transitions affects the slideshow time duration. The ANOVA test result was
F(2.57)=9.5, p=0.0002, which indicates that the results were statistically different.
Furthermore, a t-test was performed between each result set; it showed that there
is a significant difference between each pair of transition types (all p-values were
less than 0.001). Therefore, it can be concluded that each of the transition types
affected the length of the total slideshow time. Figure 7.2 shows the average total
slideshow times for different transitions.
From the qualitative analysis, it can be observed that the use of the logarithmic
transition mode was preferred for viewing multiple photo streams since this mode
was faster and provided better positive recollection. The fixed transition mode
was preferred by participants aiming to view the photos in more detail and for
longer. One participant said:
“I prefer to use fixed transition mode when I want to see photos in more
detail in longer time... I use logarithmic transition mode for viewing
photos faster with good comprehension.”
The total slideshow duration for viewing all 300 photos by females was: 190.4
seconds (standard deviation=159 seconds) for the proportional transition mode,
433.76 seconds (standard deviation=226.6 seconds) for the fixed transition mode
and 226.46 seconds (standard deviation=137.3 seconds) for the logarithmic tran-
sition mode.
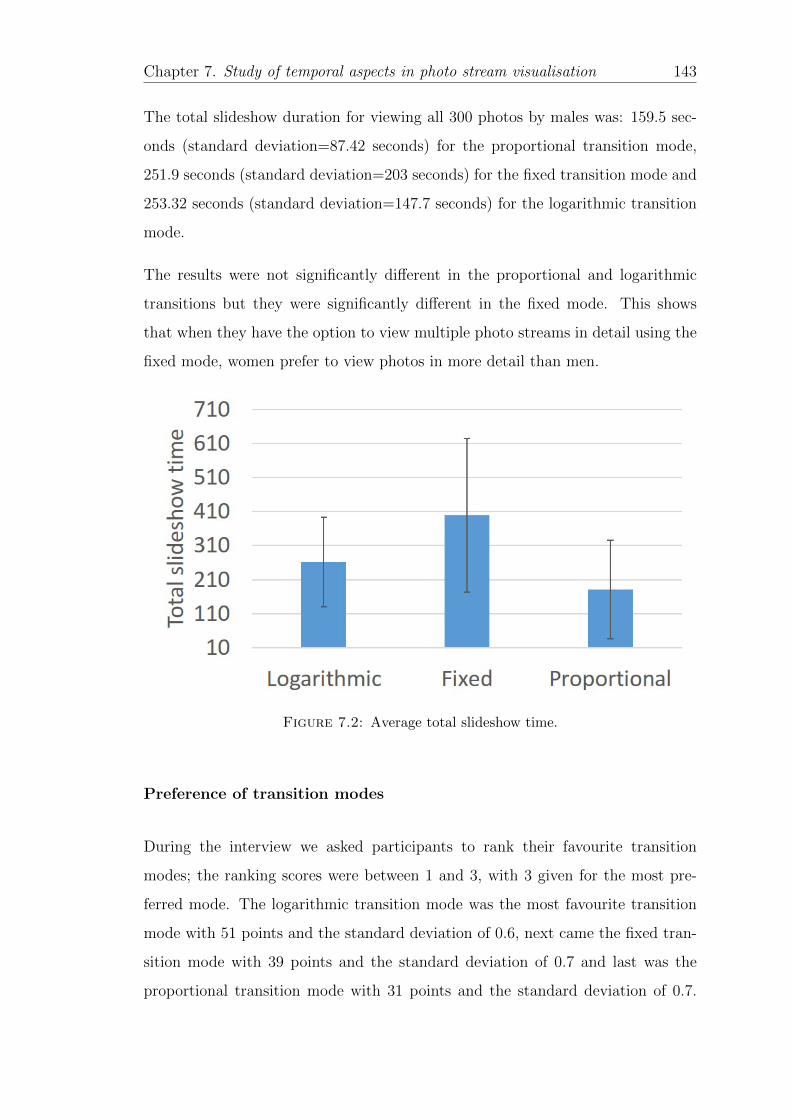
Chapter 7. Study of temporal aspects in photo stream visualisation 143
The total slideshow duration for viewing all 300 photos by males was: 159.5 sec-
onds (standard deviation=87.42 seconds) for the proportional transition mode,
251.9 seconds (standard deviation=203 seconds) for the fixed transition mode and
253.32 seconds (standard deviation=147.7 seconds) for the logarithmic transition
mode.
The results were not significantly different in the proportional and logarithmic
transitions but they were significantly different in the fixed mode. This shows
that when they have the option to view multiple photo streams in detail using the
fixed mode, women prefer to view photos in more detail than men.
Figure 7.2: Average total slideshow time.
Preference of transition modes
During the interview we asked participants to rank their favourite transition
modes; the ranking scores were between 1 and 3, with 3 given for the most pre-
ferred mode. The logarithmic transition mode was the most favourite transition
mode with 51 points and the standard deviation of 0.6, next came the fixed tran-
sition mode with 39 points and the standard deviation of 0.7 and last was the
proportional transition mode with 31 points and the standard deviation of 0.7.
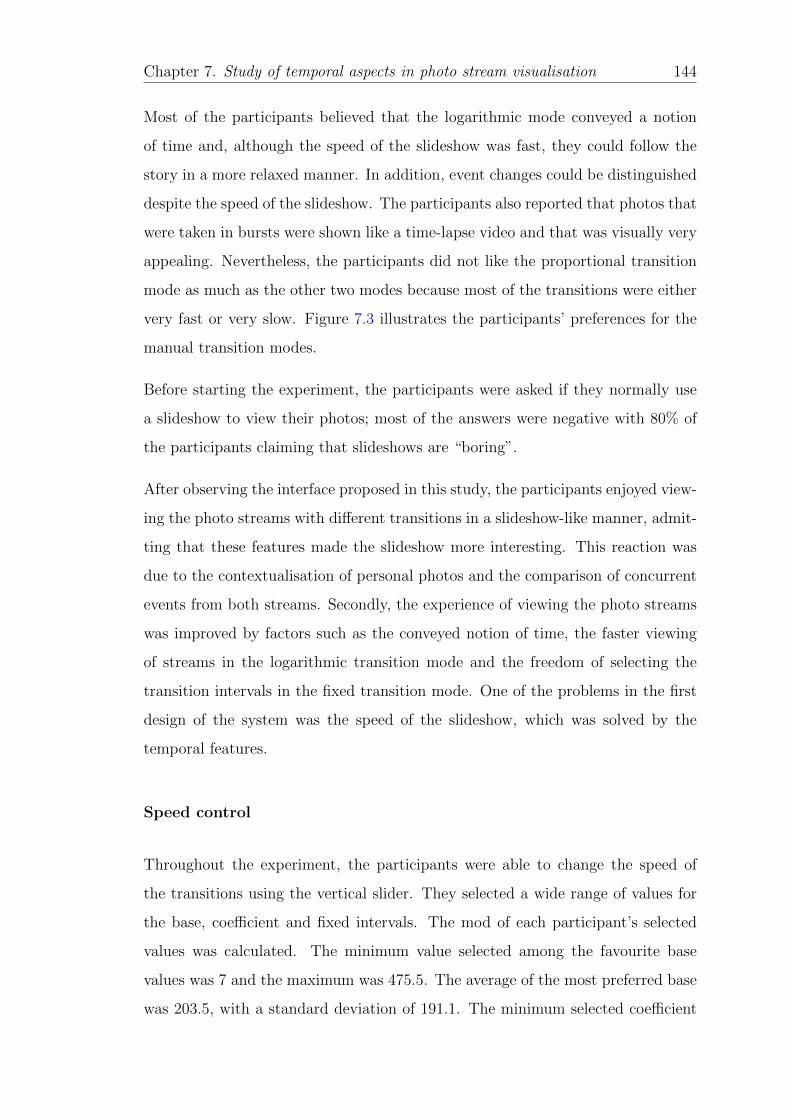
Chapter 7. Study of temporal aspects in photo stream visualisation 144
Most of the participants believed that the logarithmic mode conveyed a notion
of time and, although the speed of the slideshow was fast, they could follow the
story in a more relaxed manner. In addition, event changes could be distinguished
despite the speed of the slideshow. The participants also reported that photos that
were taken in bursts were shown like a time-lapse video and that was visually very
appealing. Nevertheless, the participants did not like the proportional transition
mode as much as the other two modes because most of the transitions were either
very fast or very slow. Figure 7.3 illustrates the participants’ preferences for the
manual transition modes.
Before starting the experiment, the participants were asked if they normally use
a slideshow to view their photos; most of the answers were negative with 80% of
the participants claiming that slideshows are “boring”.
After observing the interface proposed in this study, the participants enjoyed view-
ing the photo streams with different transitions in a slideshow-like manner, admit-
ting that these features made the slideshow more interesting. This reaction was
due to the contextualisation of personal photos and the comparison of concurrent
events from both streams. Secondly, the experience of viewing the photo streams
was improved by factors such as the conveyed notion of time, the faster viewing
of streams in the logarithmic transition mode and the freedom of selecting the
transition intervals in the fixed transition mode. One of the problems in the first
design of the system was the speed of the slideshow, which was solved by the
temporal features.
Speed control
Throughout the experiment, the participants were able to change the speed of
the transitions using the vertical slider. They selected a wide range of values for
the base, coefficient and fixed intervals. The mod of each participant’s selected
values was calculated. The minimum value selected among the favourite base
values was 7 and the maximum was 475.5. The average of the most preferred base
was 203.5, with a standard deviation of 191.1. The minimum selected coefficient
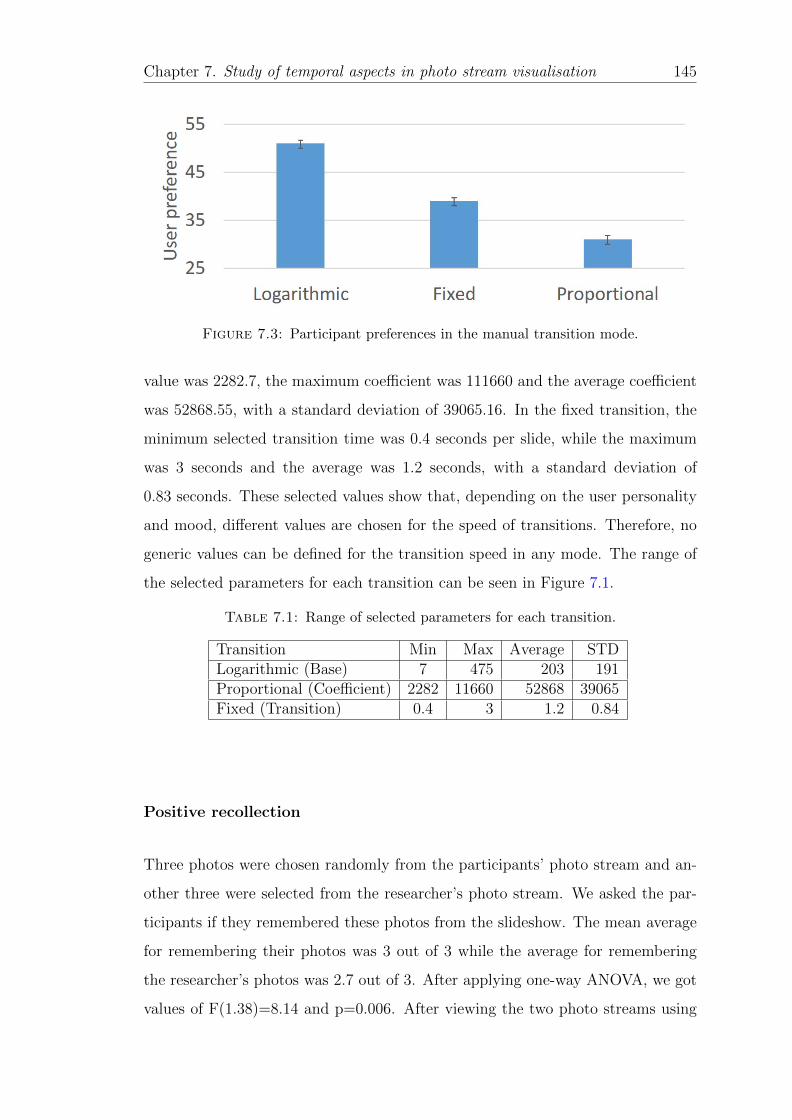
Chapter 7. Study of temporal aspects in photo stream visualisation 145
Figure 7.3: Participant preferences in the manual transition mode.
value was 2282.7, the maximum coefficient was 111660 and the average coefficient
was 52868.55, with a standard deviation of 39065.16. In the fixed transition, the
minimum selected transition time was 0.4 seconds per slide, while the maximum
was 3 seconds and the average was 1.2 seconds, with a standard deviation of
0.83 seconds. These selected values show that, depending on the user personality
and mood, different values are chosen for the speed of transitions. Therefore, no
generic values can be defined for the transition speed in any mode. The range of
the selected parameters for each transition can be seen in Figure 7.1.
Table 7.1: Range of selected parameters for each transition.
Transition Min Max Average STDLogarithmic (Base) 7 475 203 191Proportional (Coefficient) 2282 11660 52868 39065Fixed (Transition) 0.4 3 1.2 0.84
Positive recollection
Three photos were chosen randomly from the participants’ photo stream and an-
other three were selected from the researcher’s photo stream. We asked the par-
ticipants if they remembered these photos from the slideshow. The mean average
for remembering their photos was 3 out of 3 while the average for remembering
the researcher’s photos was 2.7 out of 3. After applying one-way ANOVA, we got
values of F(1.38)=8.14 and p=0.006. After viewing the two photo streams using
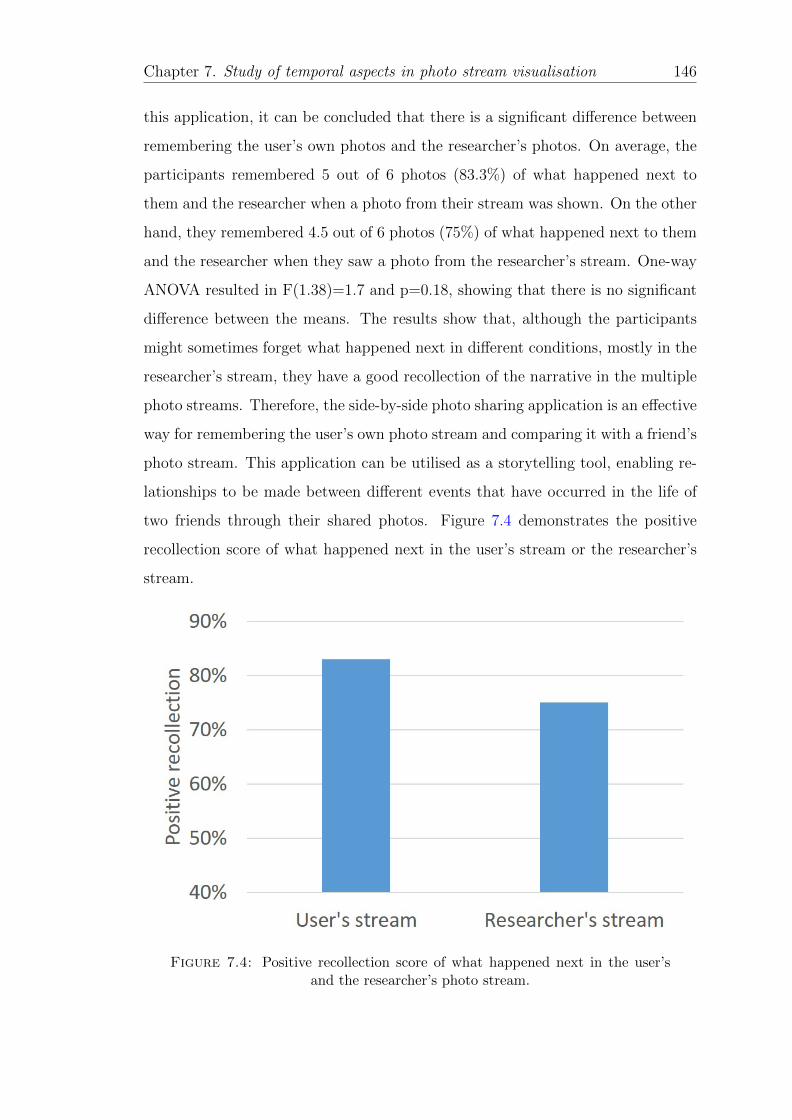
Chapter 7. Study of temporal aspects in photo stream visualisation 146
this application, it can be concluded that there is a significant difference between
remembering the user’s own photos and the researcher’s photos. On average, the
participants remembered 5 out of 6 photos (83.3%) of what happened next to
them and the researcher when a photo from their stream was shown. On the other
hand, they remembered 4.5 out of 6 photos (75%) of what happened next to them
and the researcher when they saw a photo from the researcher’s stream. One-way
ANOVA resulted in F(1.38)=1.7 and p=0.18, showing that there is no significant
difference between the means. The results show that, although the participants
might sometimes forget what happened next in different conditions, mostly in the
researcher’s stream, they have a good recollection of the narrative in the multiple
photo streams. Therefore, the side-by-side photo sharing application is an effective
way for remembering the user’s own photo stream and comparing it with a friend’s
photo stream. This application can be utilised as a storytelling tool, enabling re-
lationships to be made between different events that have occurred in the life of
two friends through their shared photos. Figure 7.4 demonstrates the positive
recollection score of what happened next in the user’s stream or the researcher’s
stream.
Figure 7.4: Positive recollection score of what happened next in the user’sand the researcher’s photo stream.
Chapter 7. Study of temporal aspects in photo stream visualisation 147
Positive recollection between females and males
Each participant was shown a photo first from their own stream and then the
study organiser’s streams, in three different conditions; the participants were then
asked if they could remember that photo and whether they could remember what
happened next. Therefore, there were 18 overall situations which means we asked
participants in each of the three phases (Each contains 6 situations) if they re-
member their photo and their friend’s photo (2 out of 18) and what happened
next in their stream and friends stream after showing their friends photo and their
own photo(4 out of 18).
When the participants saw a photo from their own stream, on average, females
remembered 8.37 out of 9 with (93%, standard deviation=0.6) situations regarding
the presented photo and what happened next, while, on average males remembered
7.21 out of 9 (80.1%, standard deviation=0.5) situations.
Moreover, when the participants saw a photo from the researcher’s stream, on aver-
age, females remembered 7.80 out of 9 situations (86.6%, standard deviation=2.1)
while males remembered 6.40 out of 9 situations (71.1%, standard deviation=2).
The results (Figure 7.5) showed that females are better at remembering photos
and the ANOVA test showed that females remember photos significantly better
than males for both self-streams and other’s streams.
Positive recollection in different transitions
In order to investigate whether the transition modes affect the memory of what
happened next in both photo streams, the average of remembering the partic-
ipant’s and researcher’s streams for each transition mode was calculated. The
participants remembered 5.1 out of 6 photos (85%) in the fixed transition mode,
while they remembered 4.9 out of 6 (81.6%) in the proportional transition mode.
Logarithmic was the best mode with 5.2 out of 6 photos (86.6%) remembered. One-
way ANOVA resulted in F(2.57)=0.3, p=0.6, showing that there is no significant
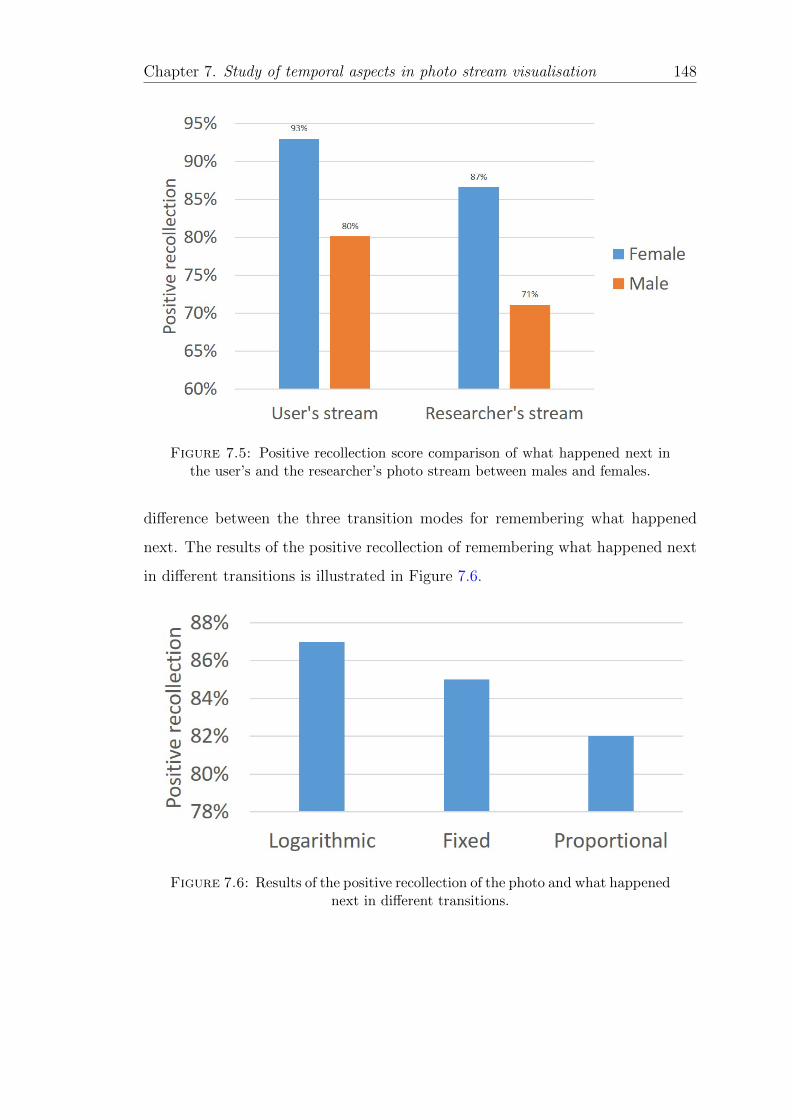
Chapter 7. Study of temporal aspects in photo stream visualisation 148
Figure 7.5: Positive recollection score comparison of what happened next inthe user’s and the researcher’s photo stream between males and females.
difference between the three transition modes for remembering what happened
next. The results of the positive recollection of remembering what happened next
in different transitions is illustrated in Figure 7.6.
Figure 7.6: Results of the positive recollection of the photo and what happenednext in different transitions.
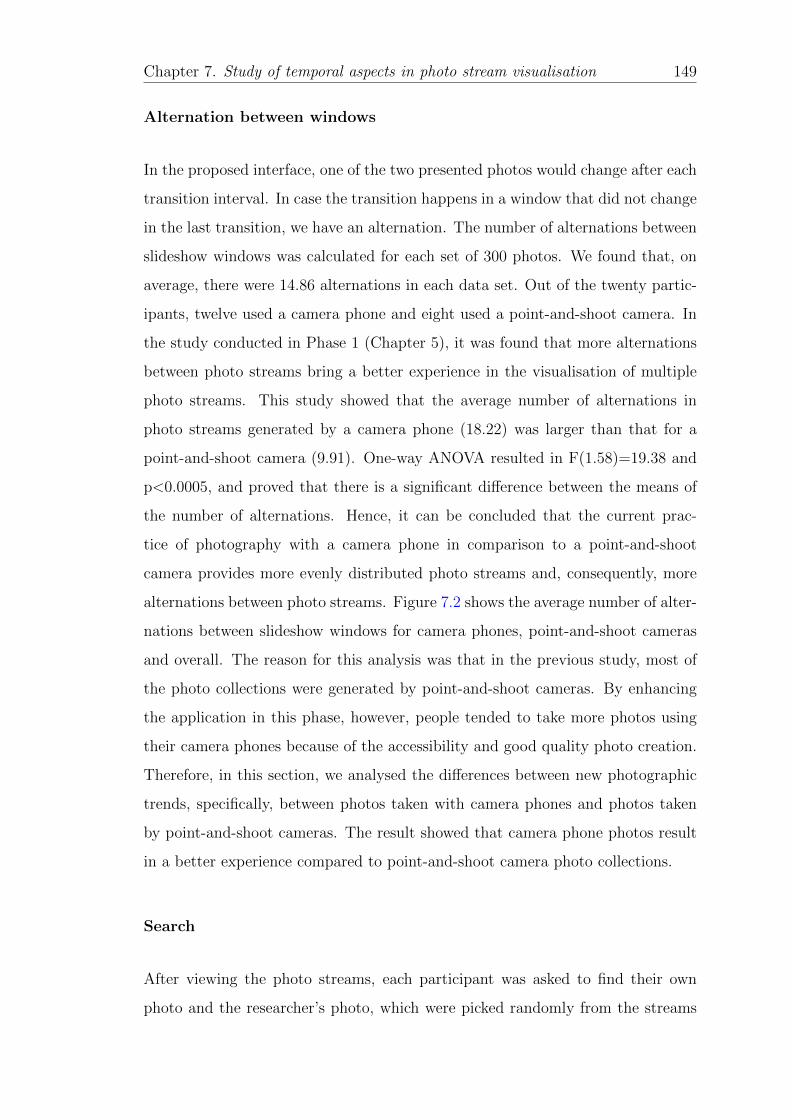
Chapter 7. Study of temporal aspects in photo stream visualisation 149
Alternation between windows
In the proposed interface, one of the two presented photos would change after each
transition interval. In case the transition happens in a window that did not change
in the last transition, we have an alternation. The number of alternations between
slideshow windows was calculated for each set of 300 photos. We found that, on
average, there were 14.86 alternations in each data set. Out of the twenty partic-
ipants, twelve used a camera phone and eight used a point-and-shoot camera. In
the study conducted in Phase 1 (Chapter 5), it was found that more alternations
between photo streams bring a better experience in the visualisation of multiple
photo streams. This study showed that the average number of alternations in
photo streams generated by a camera phone (18.22) was larger than that for a
point-and-shoot camera (9.91). One-way ANOVA resulted in F(1.58)=19.38 and
p<0.0005, and proved that there is a significant difference between the means of
the number of alternations. Hence, it can be concluded that the current prac-
tice of photography with a camera phone in comparison to a point-and-shoot
camera provides more evenly distributed photo streams and, consequently, more
alternations between photo streams. Figure 7.2 shows the average number of alter-
nations between slideshow windows for camera phones, point-and-shoot cameras
and overall. The reason for this analysis was that in the previous study, most of
the photo collections were generated by point-and-shoot cameras. By enhancing
the application in this phase, however, people tended to take more photos using
their camera phones because of the accessibility and good quality photo creation.
Therefore, in this section, we analysed the differences between new photographic
trends, specifically, between photos taken with camera phones and photos taken
by point-and-shoot cameras. The result showed that camera phone photos result
in a better experience compared to point-and-shoot camera photo collections.
Search
After viewing the photo streams, each participant was asked to find their own
photo and the researcher’s photo, which were picked randomly from the streams
Chapter 7. Study of temporal aspects in photo stream visualisation 150
Table 7.2: Average alternation between slideshow windows
Average alternation between slideshow windowsCamera phone 18.22Point-and-shoot camera 9.91Overall 14.86
within the timeline, via controller buttons such as the play and pause buttons.
On average, it took 49.66 seconds to find the photo from the user’s own stream
and 43.83 seconds to find the photo from the researcher’s stream. Users searched
both streams to find the chosen photos. No significant differences between the two
data sets were found using one-way ANOVA: F(1.118)=0.64, p=0.4. On average,
it took 46.75 seconds for each participant to find the photo after viewing both
streams. The participants used mainly two techniques to find a photo. In the first
technique, they used the timeline to find the event to which the photo belonged;
they then located the photo by going through that event’s photos using a one-by-
one search. In the second technique, in cases where the participants were not sure
which event the photo belonged to, they used a combination of timeline scanning
and playing the photo streams in fast mode, until the required event was found.
One of the participants said:
“This reminds me of the VHS style, it is nice to search like this and
see other photos until finding the one I want.”
7.3 Evaluation of continuity detection
The fourth transition mode for the synchronous visualisation interface, which was
introduced in the previous chapter, is continuity. In this mode, if two consecutive
photos are continuous, the transition is set to be significantly faster than the speed
set by the user. In this section, three different continuity algorithms applied for
continuity transition were evaluated to select the most appropriate algorithm for
continuity transition.
Chapter 7. Study of temporal aspects in photo stream visualisation 151
7.3.1 Method
The first step was to determine the decision thresholds for each of the three pro-
posed continuity algorithms. Thus, an interface was designed to let the user decide
if there is a continuity between two adjacent photos. In this interface, two con-
secutive photos are displayed forwards and backwards in time with a delay of 0.4
seconds in slideshow mode until the user decides if these two photos are continu-
ous or not. After the user makes a decision, another pair of new photos is shown
on the screen. In this experiment we presented 779 photos of a ski trip to the
participants. The dataset was comprised of photos often taken in bursts, result-
ing in a good proportion of continuous photos. The participants decided which
consecutive photos were continuous using the proposed interface. The manual de-
cisions were logged and used to determine the optimal threshold of continuity for
each of the proposed algorithms. Using the optimal thresholds, a comparison was
conducted to determine which algorithm was the best for detecting continuity in
photo streams.
7.3.2 Accuracy of algorithms
In order to detect which photo pairs were “continuous”, three algorithms were
applied, namely SIFT flow, SIFT and optical flow, which were described in the
previous chapter and will be evaluated in this chapter. The process of the com-
parison of these techniques is depicted in Figure 7.7.
As described in the previous section, to find the accuracy of continuity detection
for each algorithm, the users labelled continuous photo pairs using three different
resolutions: small (60*40), medium (400*300) and large (640*480). The accuracy
was calculated using Equation 7.1.
Accuracy =Tp + Tn
Tp + Tn + Fp + Fn
(7.1)
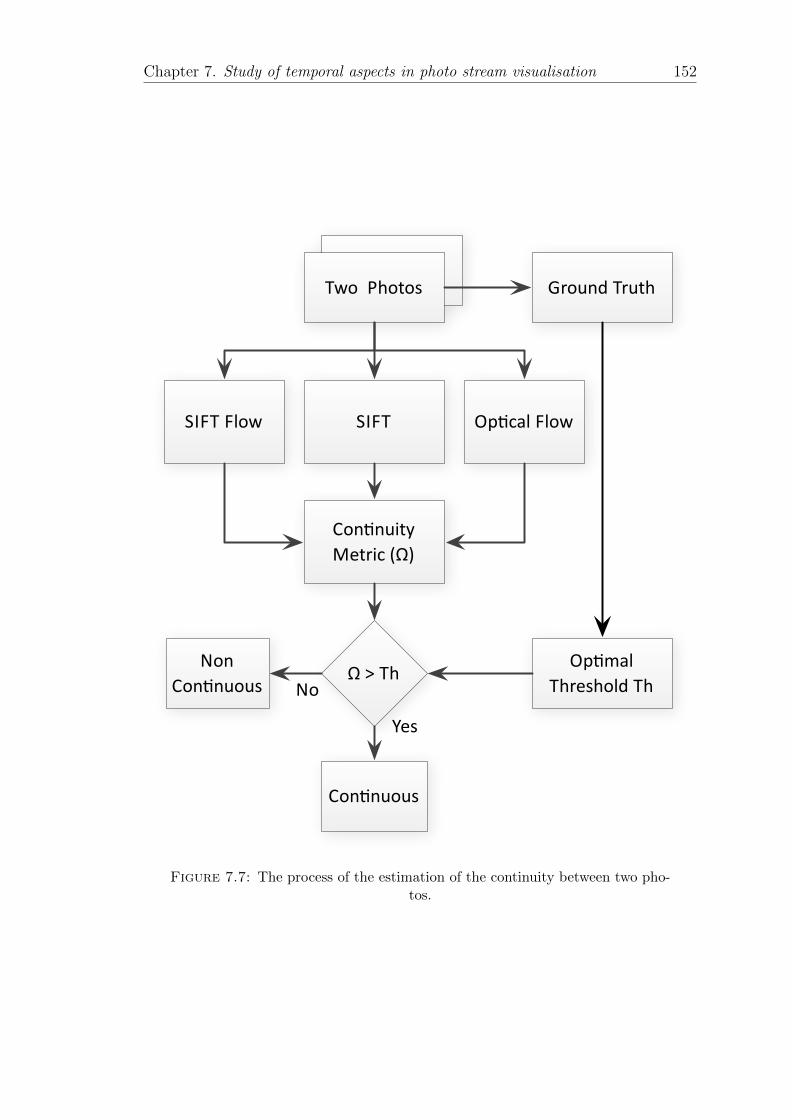
Chapter 7. Study of temporal aspects in photo stream visualisation 152
Two$$Photos
SIFTSIFT$Flow Op/cal$Flow
Con/nuity$Metric$(Ω)
Ω$>$ThNon$
Con/nuous No
Con/nuous
Yes
Ground$Truth
Op/mal$Threshold$Th
Two$$Photos
Figure 7.7: The process of the estimation of the continuity between two pho-tos.
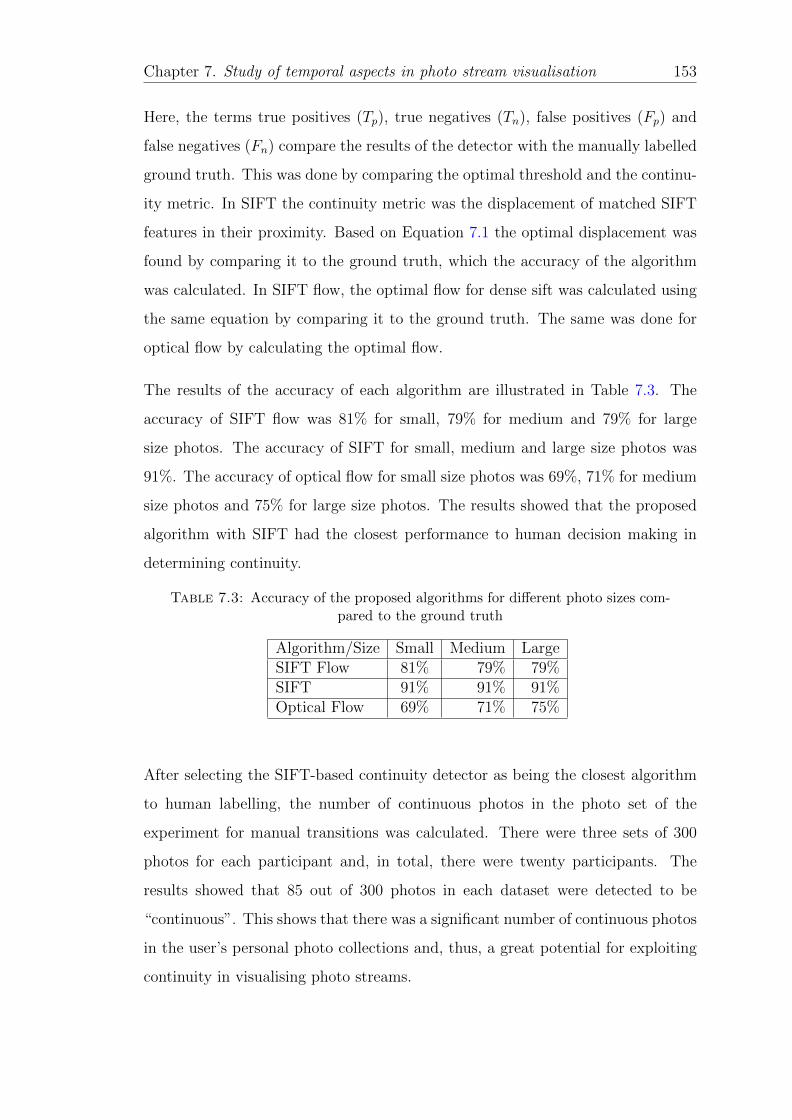
Chapter 7. Study of temporal aspects in photo stream visualisation 153
Here, the terms true positives (Tp), true negatives (Tn), false positives (Fp) and
false negatives (Fn) compare the results of the detector with the manually labelled
ground truth. This was done by comparing the optimal threshold and the continu-
ity metric. In SIFT the continuity metric was the displacement of matched SIFT
features in their proximity. Based on Equation 7.1 the optimal displacement was
found by comparing it to the ground truth, which the accuracy of the algorithm
was calculated. In SIFT flow, the optimal flow for dense sift was calculated using
the same equation by comparing it to the ground truth. The same was done for
optical flow by calculating the optimal flow.
The results of the accuracy of each algorithm are illustrated in Table 7.3. The
accuracy of SIFT flow was 81% for small, 79% for medium and 79% for large
size photos. The accuracy of SIFT for small, medium and large size photos was
91%. The accuracy of optical flow for small size photos was 69%, 71% for medium
size photos and 75% for large size photos. The results showed that the proposed
algorithm with SIFT had the closest performance to human decision making in
determining continuity.
Table 7.3: Accuracy of the proposed algorithms for different photo sizes com-pared to the ground truth
Algorithm/Size Small Medium LargeSIFT Flow 81% 79% 79%SIFT 91% 91% 91%Optical Flow 69% 71% 75%
After selecting the SIFT-based continuity detector as being the closest algorithm
to human labelling, the number of continuous photos in the photo set of the
experiment for manual transitions was calculated. There were three sets of 300
photos for each participant and, in total, there were twenty participants. The
results showed that 85 out of 300 photos in each dataset were detected to be
“continuous”. This shows that there was a significant number of continuous photos
in the user’s personal photo collections and, thus, a great potential for exploiting
continuity in visualising photo streams.
Chapter 7. Study of temporal aspects in photo stream visualisation 154
7.3.3 Continuity transition mode use
The users felt that the continuity transition mode appeared as a cross-over be-
tween the logarithmic transition mode and the fixed transition mode. By switch-
ing to the continuity transition mode, the participants were able to view discrete
(non-continuous) photos in detail, just linked by the fixed transition mode. Fur-
thermore, photos of continuous events were shown like a time-lapse video, just like
in the logarithmic transition mode for photos captured in bursts. The logarithmic
transition mode did not, however, present photos as continuous if they had been
taken over a longer period of time (i.e., a time-lapse of a flower blooming).
7.4 Evaluation of desired time transitions
In the previous chapter, we designed two desired time transitions from the lessons
learned in Phase 1 of our study: logarithmic and summarisation desired time tran-
sitions. In this section, the logarithmic desired time and summarisation desired
time are compared.
7.4.1 Comparison of logarithmic and summarisation de-
sired time
Method
In this section, the logarithmic and summarisation desired times are evaluated with
different desired times to determine which method is more suitable for different
total slideshow times. Twenty participants were recruited with an age range of
20 to 35 years; all participants were research students. We provided a photo set
which contained 300 photos taken at various events by two photographers. The
reason to provide 300 photos was that they were available from the previous study
which was evaluation of temporal aspects and supporting the experience of slow
technology [172] for users.
Chapter 7. Study of temporal aspects in photo stream visualisation 155
The desired time was set different in six iterations. In the first iteration, the
desired time was 30 seconds and then 50, 75, 150, 225 and 300 seconds in the
following iterations, respectively. In each iteration, we showed multiple photo
streams to participants using both the summarisation and logarithmic desired time
techniques. We selected up to 300 seconds since there was a time limit for the
duration of the study. Moreover, the results showed that the ratio of 300 seconds
for 300 photos was boring for participants which indicates that 300 seconds was
enough limit for the maximum presentation. The participants were then asked to
score how much they liked the presentation, giving a score from 1 to 10. The users
were able to select the summarisation transition time between slides manually; by
default it was set to 1.2 seconds, which was the average selected parameter for the
fixed transition in the previous study.
Results
We compared the user preference in different total slideshow times to conclude if
the length of the slideshow affects the selection of the desired time type by the
user. The result illustrates that the summary desired time was the most suitable
method for presenting all multiple photo streams in 30 seconds. The preference
average score for 30 seconds in the summary desired time was 5.55 (standard
deviation=1.8), while the logarithmic average score was 1 (standard deviation=0)
as the presentation was very fast. The t-test showed that there is a significant
difference between the means (p<0.05).
For a 50-second desired time, the logarithmic average score was low with 4.7
(standard deviation=1.4), while the summary desired time technique preference
score increased to 6.7 (standard deviation=1). The t-test showed that the averages
were significantly different (p<0.05).
When the desired time increased to 75 seconds, the average score for the sum-
marisation desired time was 7.7 (standard deviation=1.1), while the average score
for the logarithmic desired time was 7.05 (standard deviation=1.5). The t-test
showed that the averages were not significantly different (p>0.05).
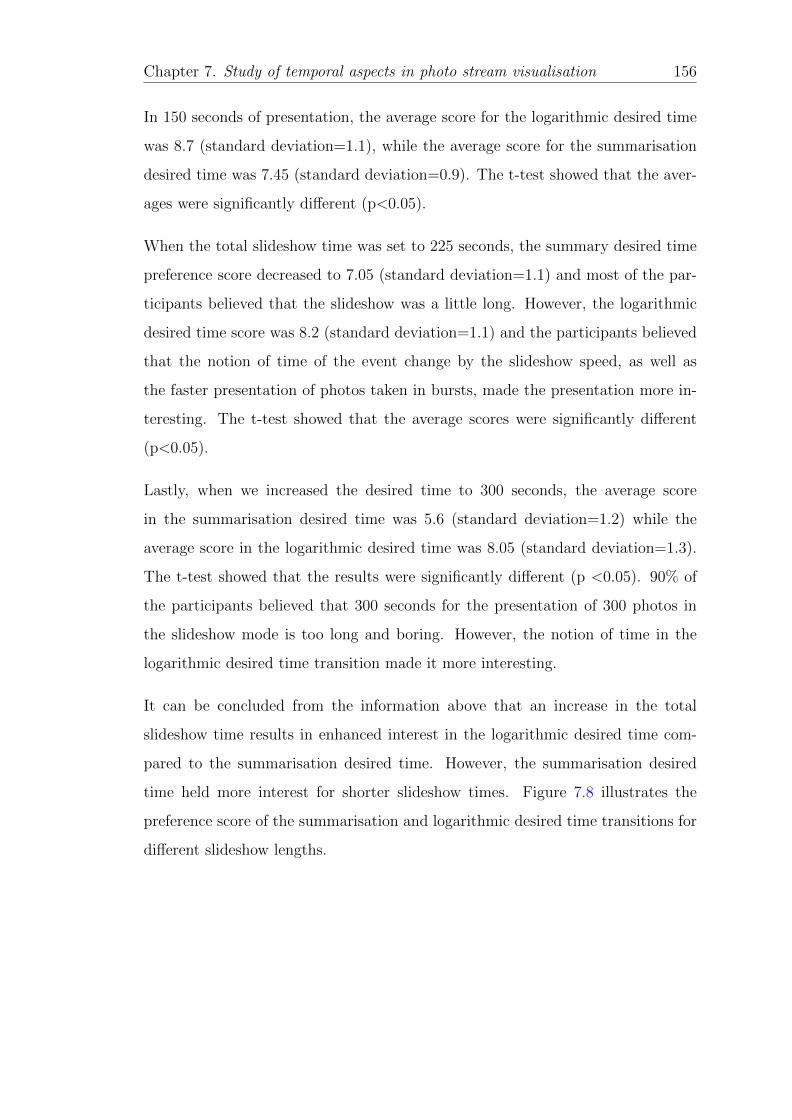
Chapter 7. Study of temporal aspects in photo stream visualisation 156
In 150 seconds of presentation, the average score for the logarithmic desired time
was 8.7 (standard deviation=1.1), while the average score for the summarisation
desired time was 7.45 (standard deviation=0.9). The t-test showed that the aver-
ages were significantly different (p<0.05).
When the total slideshow time was set to 225 seconds, the summary desired time
preference score decreased to 7.05 (standard deviation=1.1) and most of the par-
ticipants believed that the slideshow was a little long. However, the logarithmic
desired time score was 8.2 (standard deviation=1.1) and the participants believed
that the notion of time of the event change by the slideshow speed, as well as
the faster presentation of photos taken in bursts, made the presentation more in-
teresting. The t-test showed that the average scores were significantly different
(p<0.05).
Lastly, when we increased the desired time to 300 seconds, the average score
in the summarisation desired time was 5.6 (standard deviation=1.2) while the
average score in the logarithmic desired time was 8.05 (standard deviation=1.3).
The t-test showed that the results were significantly different (p <0.05). 90% of
the participants believed that 300 seconds for the presentation of 300 photos in
the slideshow mode is too long and boring. However, the notion of time in the
logarithmic desired time transition made it more interesting.
It can be concluded from the information above that an increase in the total
slideshow time results in enhanced interest in the logarithmic desired time com-
pared to the summarisation desired time. However, the summarisation desired
time held more interest for shorter slideshow times. Figure 7.8 illustrates the
preference score of the summarisation and logarithmic desired time transitions for
different slideshow lengths.
Chapter 7. Study of temporal aspects in photo stream visualisation 157
Figure 7.8: Presentation preference for different desired times.
7.4.2 User experience of summarisation and logarithmic
desired time
At the end of the laboratory-based user study, we asked the participants about
their feeling regarding these two transitions: when do they prefer to use either of
these two transitions and how do they compare them with a normal slideshow?
The most positive answer was that the summarisation desired time is suitable when
they want to view photos in more detail and they do not have time to view them all.
As a result, the summarisation desired time was suitable when the participants
wanted to review multiple photo streams with an emphasis on collocated and
remote experiences, and to see the detail of each photo. On the other hand,
the logarithmic desired time was suitable when the participants wanted to see
the multiple photo streams faster and to just follow the photo stream storyline;
although they could not see the photos in detail, they could follow the storylines
of the photos in more detail.
Chapter 7. Study of temporal aspects in photo stream visualisation 158
7.5 Summary and discussion
In this chapter, the temporal aspects of the visualisation of multiple streams were
evaluated in the laboratory environment. In the first section of this chapter, the
visualisation of multiple photo streams, alongside the manual transitions (loga-
rithmic, proportional and fixed), were evaluated. The results showed that the
logarithmic transition was the favorite transition among the participants, who
liked to use the logarithmic transition when they wanted to review multiple photo
streams rapidly. The reason for this is that the logarithmic transition affects the
total slideshow time and brings the notion of time to the user. The fixed transi-
tion was preferred when the participants wanted to view their photo streams in
more detail with a slower transition speed. The users did not like the proportional
transition compared to the other two transitions as they stated that it was some-
times too fast or too slow. Moreover, the values that participants selected for the
presentation speed in each transition were different. Therefore, no generic values
can be defined for the transition speed in any mode.
It was claimed in [173] that the gist of a single scene photo can be perceived in 100
msec. Moreover, Greene and Oliva [174] claimed that the gist of characteristics
such as a natural or urban scene can be perceived in as little as 30 msec. Pot-
ter [175] also claimed that people can identify the presence of a particular scene
in a photo stream presented at a rate of one scene every 125 msec. Therefore,
the time interval of the slideshow in this application was never less that 30 msec.
However, there is no previous research on remembering the order of multiple photo
streams and the visual stories told by those streams. Our findings show that, al-
though the participants might forget what happened next in different conditions
(mostly in the researcher’s stream) when we showed them a photo from the pre-
sentation of multiple photo streams, they have a good recollection of the narrative
from multiple photo streams by remembering both the photos and what happened
next in 79.15% of the cases. Hence, this application was a good platform for re-
membering photo collection stories of friends and comparing past events through
the photographic medium.
Chapter 7. Study of temporal aspects in photo stream visualisation 159
Overall, it can be concluded that our application is suitable for release as a story
telling tool between multiple photographers. In addition, the results showed that
the positive recollection of stories between friends did not affect the transition
types and the average rate of remembering what happened during the presentation
was not significantly different.
The results from this section also illustrate that camera phone photo streams have
more alternation between slideshow windows, which results in a better experience
of viewing multiple photo streams compared to point-and-shoot camera photo
streams. We found that searching through a timeline is pleasant for participants
since the average time for finding a photo in multiple photo streams is reasonable.
Moreover, using fast play alongside the timeline features enabled the participants
not only to find a specific photo they were looking for, but also to enjoy viewing
other photos.
The second section of this chapter described the evaluation of continuity transition
to show continuous photos faster like a time-lapse video. Three algorithms (SIFT,
SIFT flow and optical flow) were used to create the continuity transition; SIFT was
found to be the best of the algorithms upon evaluation. The logarithmic transition
enabled the participants to view photos taken in bursts faster. In addition to
showing continuous photos taken in bursts faster, the continuity transition also
showed photos taken over a longer period of time in time-lapse mode (such as the
time-lapse of a flower blooming).
The third section of this chapter described the evaluation of the summarisation and
the logarithmic desired time transitions, which enabled the user to choose the total
slideshow time and then, either to present photos using the logarithmic desired
time transition or to eliminate the redundant photos using the summarisation de-
sired time. Therefore, the summarisation desired time and the logarithmic desired
time techniques were compared. The results showed that, for short presentation
times, the summarisation desired time is better than the logarithmic desired time.
However, when the total slideshow length increased, the participants preferred the
logarithmic desired time. The summarisation desired time was preferred when the
Chapter 7. Study of temporal aspects in photo stream visualisation 160
participants wanted to review each photo in detail. The logarithmic desired time
was suitable when the participants wanted to view photo streams rapidly and just
follow the storylines of the photo streams.
A potential future work adding to this system can be designing and evaluating
the the system using face recognition, the tag label of the person who was on the
photo or the location that photos were taken rather than focusing on temporal
aspects and only the people who uploaded their photo streams.
The next chapter will describe the design and building of an extended version for
sharing and visualisation of multiple photo streams as an ambient display, using
the lessons learned in Phase 1; a user experience study is also carried out. In this
new design, the users will be able to see the latest shared photos (visual statuses)
via Facebook in their slideshow windows. Moreover, the logarithmic transition,
which was the favourite manual transition, will be applied to this system.
Chapter 8
4Streams: An ambient photo
sharing application
8.1 Introduction
In Phase 3 of the project, we designed a system from the lessons learned in the
initial user study from Phase 1, addressing the user requirements of sharing and
visualising multiple photo streams.
The initial system in Phase 1 was designed for users to upload their past photos and
share them with a small group of friends and/or family. The system enabled the
users to view multiple photo streams concurrently and compare their past photos.
We found that, most of the time, the users could remember their own photo
streams and other users’ photo streams while viewing them concurrently (Phase
2). However, in Phase 1 of the system design, the only place where the users could
see the latest uploaded photos was the upload page in a grid visualisation style.
In the user study we found that the participants wanted to see the latest visual
status of the small groups of friends in the multiple-window slideshow interface,
rather than on the upload page, they also wanted to be notified immediately about
everybody’s most recent activities. Our first design upload page did not show each
161
Chapter 8. 4Streams: An ambient photo sharing application 162
participant’s photo streams separately and the multiple-window slideshow page
had filter sliders to let the user choose the date. Therefore, in Phase 1 the system
was not showing the latest ‘status’ photos of each participant in the single/multiple
windows and it mostly emphasised showing the historical photos concurrently in
a slideshow mode.
The other finding from the initial user study was that the participants liked the idea
of viewing photo streams on a digital photo frame screen and leave it somewhere
as an ambient display. For example, there was a participant who used an iPad 2.
He really liked the idea of interacting with our system and viewing photos on a
screen that size. He also added that it could be a very good idea to leave the iPad
as a digital photo frame at home and see the photo streams on the digital ambient
display. In addition, in Phase 2, we found that the logarithmic transition was the
favourite transition in presenting multiple photo streams.
Therefore, from the initial user study that conveyed an observed lack of presenting
live visual statuses of multiple photo streams between multiple users, and empha-
sising the value of the digital ambient display, we designed ‘4Streams’ to allow the
user to upload photos from their smartphone using Facebook and to see the latest
statuses of members in a small group. Moreover, we kept the feature that allowed
the user to view their past photos so that they could go back over time and com-
pare past visual statuses in the slideshow mode using the logarithmic transition.
In this application the users can review their latest visual statuses alongside their
past visual statuses, rather than only historical photos. The system was imple-
mented and installed on a Microsoft Surface Pro tablet that was equipped with
a stand to be left as a decoration tool, rendering the application into a digital
ambient display.
8.2 Design
The design of this system comprised two elements. Element 1 was the upload
time when participants were able to share and send their photos to our application
Chapter 8. 4Streams: An ambient photo sharing application 163
(4Streams) using Facebook. Element 2 was the display, which included different
interaction options and live updates of the latest participant photos as an ambient
display. These two elements will now be described in detail.
8.2.1 Upload
Unlike the previous versions of the application, 4Streams claimed to be ‘integrated
with Facebook’ and did not have a separate upload page; the upload engine of this
version was Facebook. Therefore, the user was able to select the photos they had
taken and use Facebook to upload them into any album they wanted. Moreover,
the user was able to upload a photo straight after taking it using the Facebook
integrated application, as found on current smart phones. Regardless of where in
their Facebook photo collection the users saved the photo, the photo was saved
into our system if the system was turned on and connected to the Internet. Due
to privacy concerns and photo ownership, user-tagged photos in Facebook were
not used in 4Streams in the current design.
The requirement to visualise the shared photos via Facebook on 4Streams was to
add 4Streams to the user’s Facebook friends. Then, if the user shared a photo
with 4Streams or with a circle of friends with 4Streams, the photo was presented
on our application. Basically, privacy settings are one of the features Facebook
provides for sharing photos; this privacy setting lets the user choose the people
with whom they want to share a photo.
One advantage of changing the privacy settings before sharing a photo via Face-
book is that it gives the opportunity to the users to choose whether they want
to present their shared photos on 4Streams (or not) by including (or excluding) a
particular 4Streams user in their privacy settings. This means that when a user
shares a photo, if they only choose 4Streams, the shared photo will appear only
on the display of our application and only those users who use our application
will be able to see the photo on the 4Stream display. The other option is to share
the photo with 4Streams and other people whom the user intends to share their
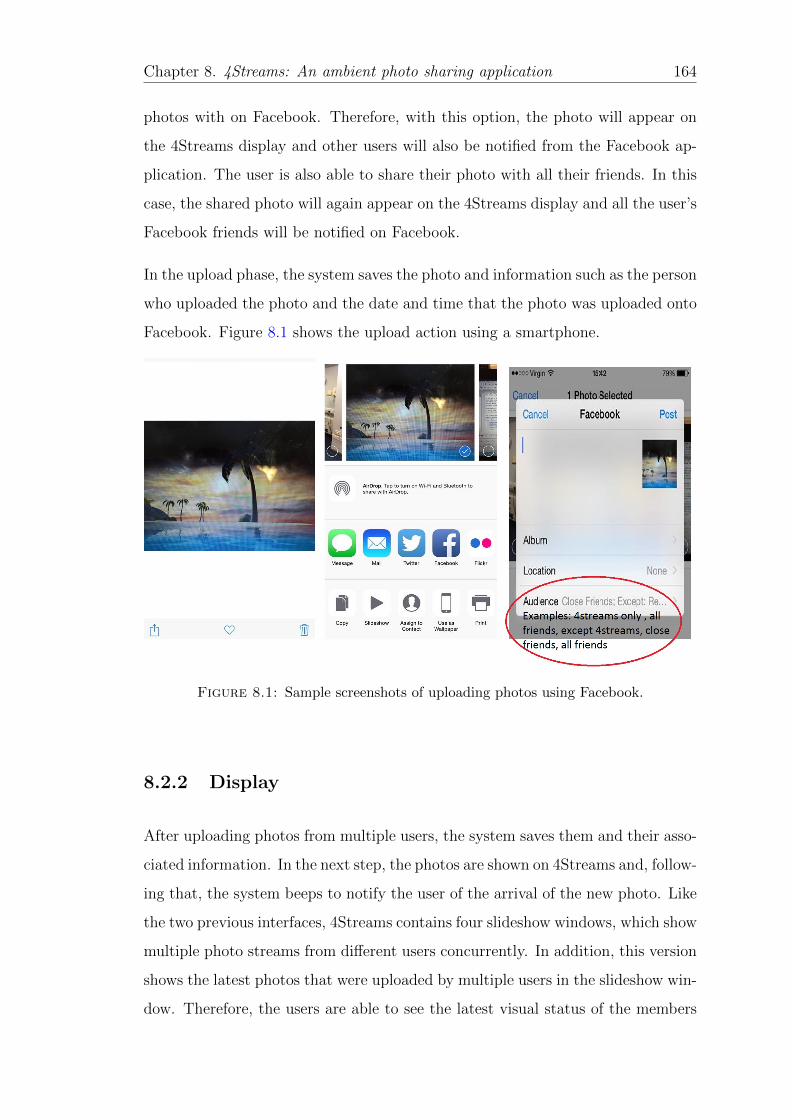
Chapter 8. 4Streams: An ambient photo sharing application 164
photos with on Facebook. Therefore, with this option, the photo will appear on
the 4Streams display and other users will also be notified from the Facebook ap-
plication. The user is also able to share their photo with all their friends. In this
case, the shared photo will again appear on the 4Streams display and all the user’s
Facebook friends will be notified on Facebook.
In the upload phase, the system saves the photo and information such as the person
who uploaded the photo and the date and time that the photo was uploaded onto
Facebook. Figure 8.1 shows the upload action using a smartphone.
Figure 8.1: Sample screenshots of uploading photos using Facebook.
8.2.2 Display
After uploading photos from multiple users, the system saves them and their asso-
ciated information. In the next step, the photos are shown on 4Streams and, follow-
ing that, the system beeps to notify the user of the arrival of the new photo. Like
the two previous interfaces, 4Streams contains four slideshow windows, which show
multiple photo streams from different users concurrently. In addition, this version
shows the latest photos that were uploaded by multiple users in the slideshow win-
dow. Therefore, the users are able to see the latest visual status of the members
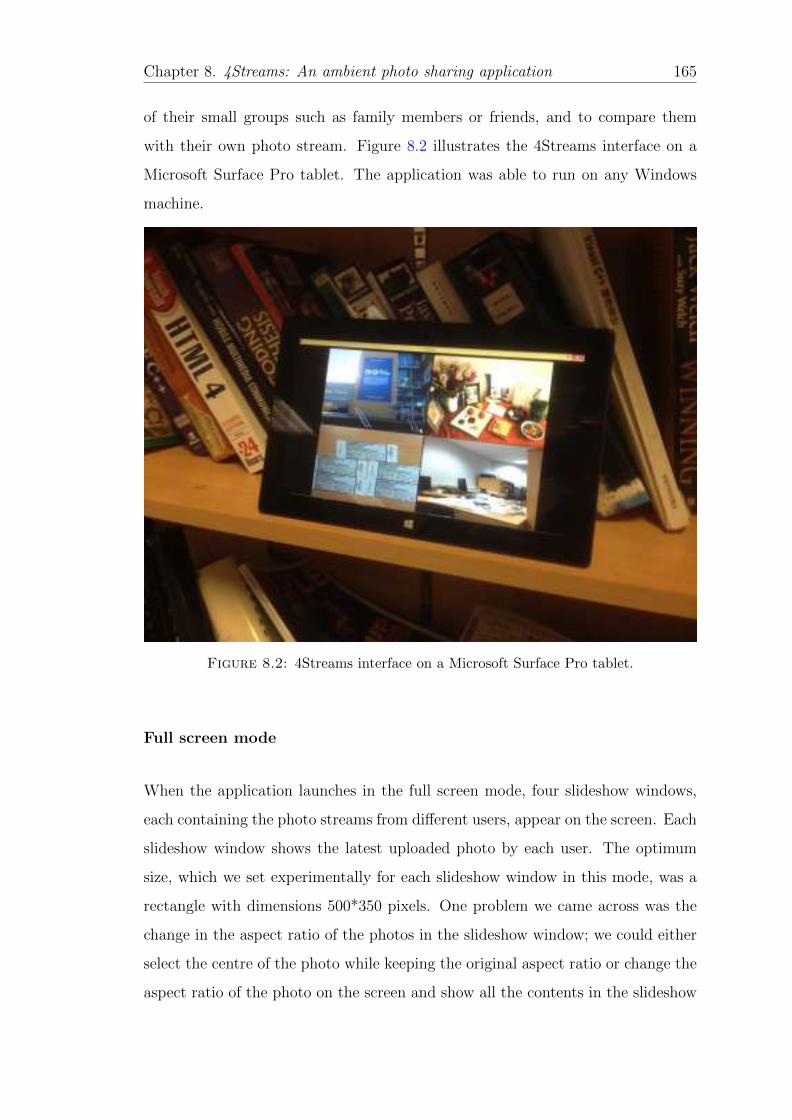
Chapter 8. 4Streams: An ambient photo sharing application 165
of their small groups such as family members or friends, and to compare them
with their own photo stream. Figure 8.2 illustrates the 4Streams interface on a
Microsoft Surface Pro tablet. The application was able to run on any Windows
machine.
Figure 8.2: 4Streams interface on a Microsoft Surface Pro tablet.
Full screen mode
When the application launches in the full screen mode, four slideshow windows,
each containing the photo streams from different users, appear on the screen. Each
slideshow window shows the latest uploaded photo by each user. The optimum
size, which we set experimentally for each slideshow window in this mode, was a
rectangle with dimensions 500*350 pixels. One problem we came across was the
change in the aspect ratio of the photos in the slideshow window; we could either
select the centre of the photo while keeping the original aspect ratio or change the
aspect ratio of the photo on the screen and show all the contents in the slideshow
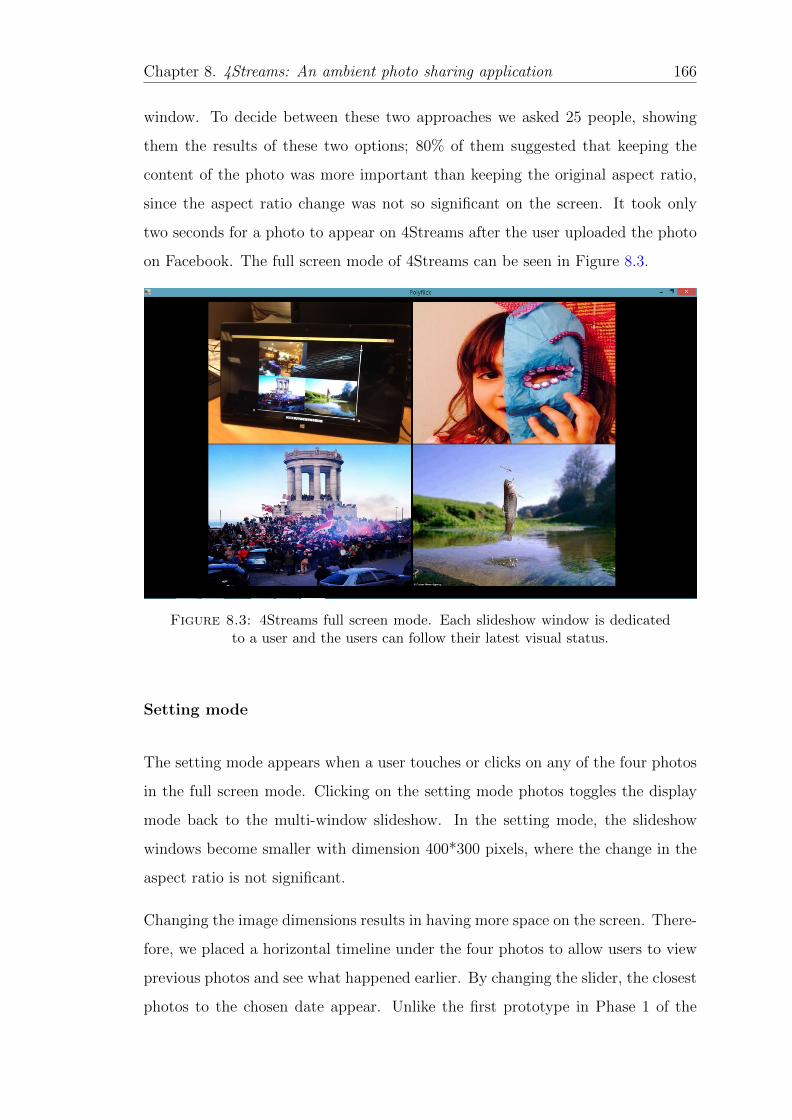
Chapter 8. 4Streams: An ambient photo sharing application 166
window. To decide between these two approaches we asked 25 people, showing
them the results of these two options; 80% of them suggested that keeping the
content of the photo was more important than keeping the original aspect ratio,
since the aspect ratio change was not so significant on the screen. It took only
two seconds for a photo to appear on 4Streams after the user uploaded the photo
on Facebook. The full screen mode of 4Streams can be seen in Figure 8.3.
Figure 8.3: 4Streams full screen mode. Each slideshow window is dedicatedto a user and the users can follow their latest visual status.
Setting mode
The setting mode appears when a user touches or clicks on any of the four photos
in the full screen mode. Clicking on the setting mode photos toggles the display
mode back to the multi-window slideshow. In the setting mode, the slideshow
windows become smaller with dimension 400*300 pixels, where the change in the
aspect ratio is not significant.
Changing the image dimensions results in having more space on the screen. There-
fore, we placed a horizontal timeline under the four photos to allow users to view
previous photos and see what happened earlier. By changing the slider, the closest
photos to the chosen date appear. Unlike the first prototype in Phase 1 of the
Chapter 8. 4Streams: An ambient photo sharing application 167
study, the default date for the slider is the date the most recent photo was taken;
the date and time of the photo appears under the slider to support the narrative
of the photo stream.
There is a vertical slider on the right side of the screen that enables the user to
control the speed of the slideshow. The transition type chosen for 4Streams was
the logarithmic transition because it was the preferred transition in the previous
study (Phase 2).
On the left side of the slider there is a play-backward button and on the right side
of the slider there is a play button. These buttons allow the user to start and
control the slideshow for multiple photo streams. After touching or clicking play
or play-backward, the buttons change to a pause button and vice versa. When the
slideshow reaches the end, the pause button changes to play and play-backward
buttons.
By clicking on any of the photos on the screen in the setting mode, the system
returns to the full screen mode. Therefore, the user is also able to view a slideshow
of multiple photo streams in the full screen mode. Moreover, by swiping any of
the photos on the screen, the system goes into the single-window slideshow mode.
Figure 8.4 shows the setting mode interface of the system.
Single-window slideshow mode
By swiping a photo in the setting mode, the system goes to the single-window
slideshow mode, which enables the user to see the photo stream that belongs to
the owner of the swapped photo. The controlling elements in the single-window
slideshow mode are the same as those in the setting mode; the only difference is
the stream of one user instead of multiple photo streams. The original size and
dimension of the image is kept during the presentation in this mode. There is a
back button on the top left side of the window to put the system goes to the setting
mode. The screenshot of the single-window slideshow can be seen in Figure 8.5.
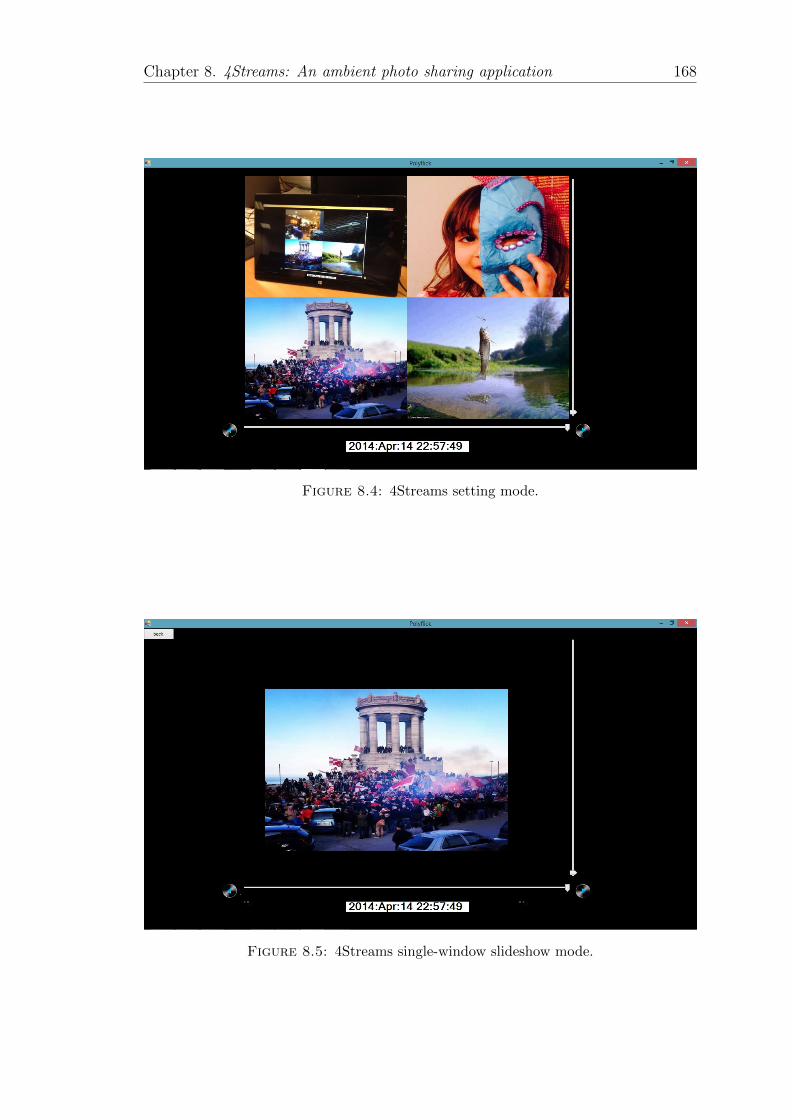
Chapter 8. 4Streams: An ambient photo sharing application 168
Figure 8.4: 4Streams setting mode.
Figure 8.5: 4Streams single-window slideshow mode.
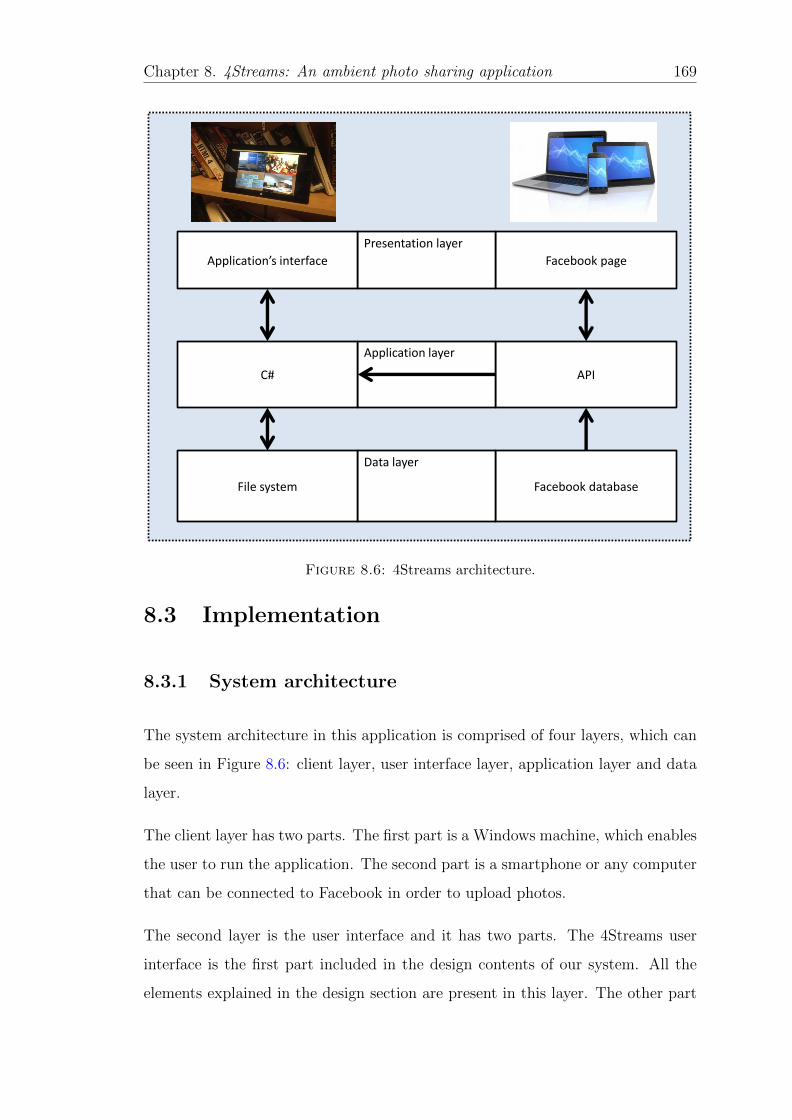
Chapter 8. 4Streams: An ambient photo sharing application 169
Facebook page
API
Facebook database
Presentation layer
Application layer
Data layer
Application’s interface
C#
File system
Figure 8.6: 4Streams architecture.
8.3 Implementation
8.3.1 System architecture
The system architecture in this application is comprised of four layers, which can
be seen in Figure 8.6: client layer, user interface layer, application layer and data
layer.
The client layer has two parts. The first part is a Windows machine, which enables
the user to run the application. The second part is a smartphone or any computer
that can be connected to Facebook in order to upload photos.
The second layer is the user interface and it has two parts. The 4Streams user
interface is the first part included in the design contents of our system. All the
elements explained in the design section are present in this layer. The other part
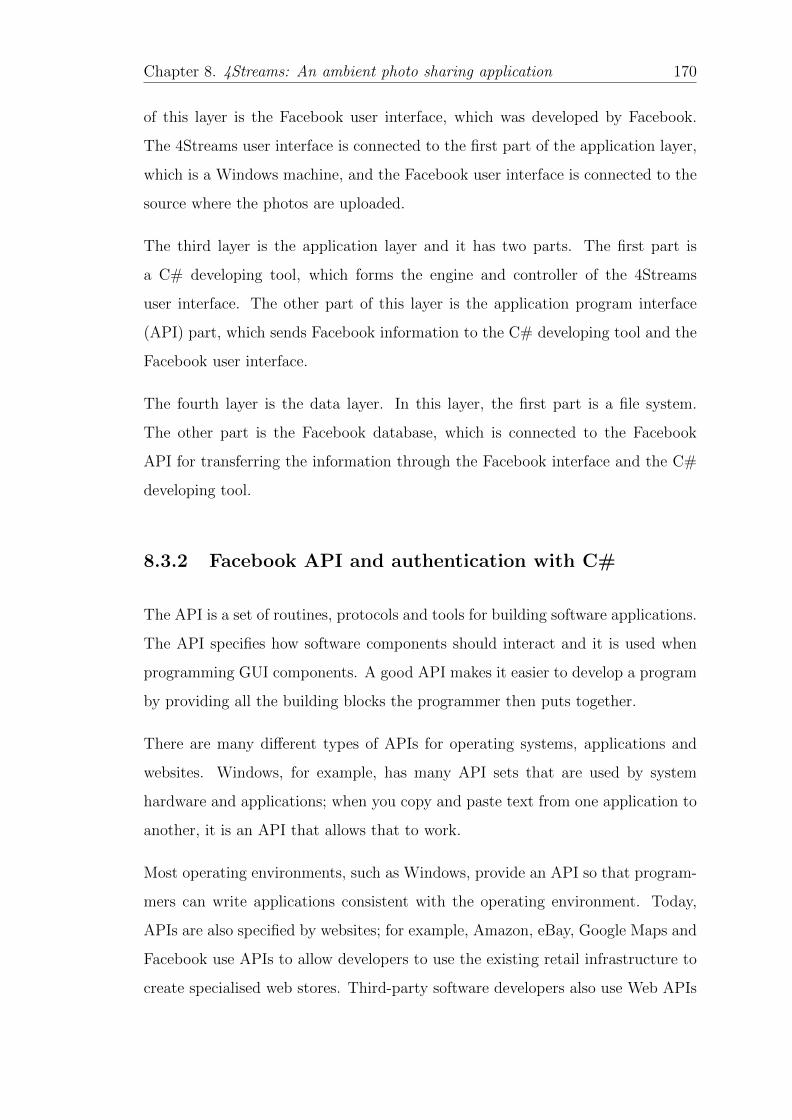
Chapter 8. 4Streams: An ambient photo sharing application 170
of this layer is the Facebook user interface, which was developed by Facebook.
The 4Streams user interface is connected to the first part of the application layer,
which is a Windows machine, and the Facebook user interface is connected to the
source where the photos are uploaded.
The third layer is the application layer and it has two parts. The first part is
a C# developing tool, which forms the engine and controller of the 4Streams
user interface. The other part of this layer is the application program interface
(API) part, which sends Facebook information to the C# developing tool and the
Facebook user interface.
The fourth layer is the data layer. In this layer, the first part is a file system.
The other part is the Facebook database, which is connected to the Facebook
API for transferring the information through the Facebook interface and the C#
developing tool.
8.3.2 Facebook API and authentication with C#
The API is a set of routines, protocols and tools for building software applications.
The API specifies how software components should interact and it is used when
programming GUI components. A good API makes it easier to develop a program
by providing all the building blocks the programmer then puts together.
There are many different types of APIs for operating systems, applications and
websites. Windows, for example, has many API sets that are used by system
hardware and applications; when you copy and paste text from one application to
another, it is an API that allows that to work.
Most operating environments, such as Windows, provide an API so that program-
mers can write applications consistent with the operating environment. Today,
APIs are also specified by websites; for example, Amazon, eBay, Google Maps and
Facebook use APIs to allow developers to use the existing retail infrastructure to
create specialised web stores. Third-party software developers also use Web APIs
Chapter 8. 4Streams: An ambient photo sharing application 171
to create software solutions for end users. We now describe the Facebook API in
detail.
Facebook is a rich and complex software platform, which exposes developers to
a sophisticated and multifaceted development framework [176]. The meaning of
Facebook programming might not be clear at first. There are essentially two types
of applications related to Facebook.
One type comprises applications that live and thrive within the Facebook envi-
ronment. These applications are essentially rich web pages loaded onto Facebook
canvas pages and hosted on the main site. To use the applications, the users need
to navigate to the Facebook site and log in to their own account. These applica-
tions can implement their own logic with whatever you can express from within a
web page using web programming technologies and can gain access to Facebook
friends, news feeds, media, photos and more.
Another approach to Facebook programming involves integrating some core Face-
book functionalities into existing applications, such as websites, mobile applica-
tions, iOS, Android, Windows and desktop applications. We used a Facebook
API through the second approach, which means we designed and implemented
4Streams to have access to the Facebook database.
In this approach, after registering as a developer, Facebook provides the developer
with three codes: a client ID, client secret and a token string. We used them for
authentication of the application by the Facebook API. The client ID and ‘secret’
enable a developer to reference the application during programming, while the
‘token’ provides the password key for the user of the application.
After the 4Streams application had been recognised, the Facebook API and C#
were connected. There are two methods to access the Facebook database; the first
method is Graph API [177] and the second method is Facebook Query Language
(FQL) [178].
The Graph API is the primary way to get data in and out of Facebook’s social
graph. It is a low-level HTTP-based API that can be used to query data, post
Chapter 8. 4Streams: An ambient photo sharing application 172
new stories, upload photos and perform a variety of other tasks an application
might need to perform. The Graph API is named after the idea of a social graph.
Representation of the Facebook information on Facebook is represented in Graph
by: nodes (things such as a user, a photo, a page or a comment), edges (the
connections between things, such as a page’s photos or a photo’s comments) and
fields (such as the birthday of a user or the name of a page).
FQL enables the programmer to use an SQL-style interface to query the data
exposed by the Graph API; it provides advanced features not available in the
Graph API. FQL can handle simple maths, basic Boolean operators, AND or
NOT logical operators, and ORDER BY and LIMIT clauses. It also provides
information conveniently about the photos such as the owner of the photo, caption,
date and time of the upload, name of the album and comments.
In the implementation of 4Streams, these two methods (Graph API and FQL)
were combined. For basic information such as user information and identification,
Graph API was used, while for deeper information such as downloading a photo,
FQL was used for accessing information specific to that photo.
The data gathered by both techniques were formatted in to a Json array [179],
which was accessed by a Json library [180] installed in C#. The result of the Json
array was interpreted and presented meaningfully on the user interface layer using
the C# engine.
8.3.3 Developing tool
The developing tool applied to code the core program of 4Streams was C#. C#
is a multi-paradigm programming language encompassing strong typing, impera-
tive, declarative, functional, generic, object-oriented (class-based) and component-
oriented programming disciplines. It was developed by Microsoft within its .NET
initiative and later approved as a standard by Ecma and ISO. C# is one of the
programming languages designed for the Common Language Infrastructure [129].
Chapter 8. 4Streams: An ambient photo sharing application 173
In C#, we were able to design the interface using a GUI tool designed for interface
programming. The items and the interaction elements could be placed on the ap-
plication’s interface using this feature of C#. The connectivity between the GUI
section and the API was made using the C# main programming engine. In this
part, the latest photos taken in Facebook by any of the participants were checked
every two seconds and, if a new photo arrived from Facebook, the Facebook API
passed that photo with its information from the Facebook database to the C#
engine. After that, the C# engine sent that photo to the GUI page and, subse-
quently, the photo appeared on the 4Streams interface. All received photos and
their information were saved to a file on the hard disk of the machine running
4Streams.
8.3.4 Interaction logs
4Streams was capable of saving the interaction logs of the system user on each
device separately. The elements saved onto the system for further data analysis
are now listed:
• Photo.
• Date and time the photo was uploaded.
• Date and time the photo was captured (if available).
• Photographer’s Facebook ID and name.
• Time the application ran.
• Time the application closed.
• Time the application went to full screen mode.
• Time the application went to setting mode.
• Time the application went to single-window slideshow mode.
Chapter 8. 4Streams: An ambient photo sharing application 174
• Speed of the slideshow.
• Time a photo was downloaded to the system and name of the user who did
it.
• Name of and time a control button was clicked.
• Duration of each slideshow’s play or play-backward command.
• Photo’s privacy setting.
8.4 Pilot study
8.4.1 Procedure
After designing and implementing 4Streams, a pilot study was conducted to eval-
uate the application’s performance before conducting a real user study to see
whether there is any interest in using 4Streams. It also allowed for finding and
fixing the initial bugs of the application. In order to start the pilot study we
operated 4Streams between four people. The participants were two lecturers and
two PhD students at the University of Surrey, and they all had a desk at work.
The application was installed on four Microsoft Surface Pro tablets. The tablets
had stands and could be placed in a fixed location as a digital ambient display; all
tablets were placed on the work desk. 4Streams was tested and used for a week.
We did not perform any interviews or obtain any quantitative information in this
phase and just analysed from the contents of the photos and the way participants
used 4Streams by asking them informally about their experience.
8.4.2 Results
Interestingly, 85 photos were shared over a week-long period. The numbers of
shared photos from each participant were: 25, 29, 17 and 14 (average of 21.25 and
standard deviation of 6.9). All photos conveyed a sense of visual communication
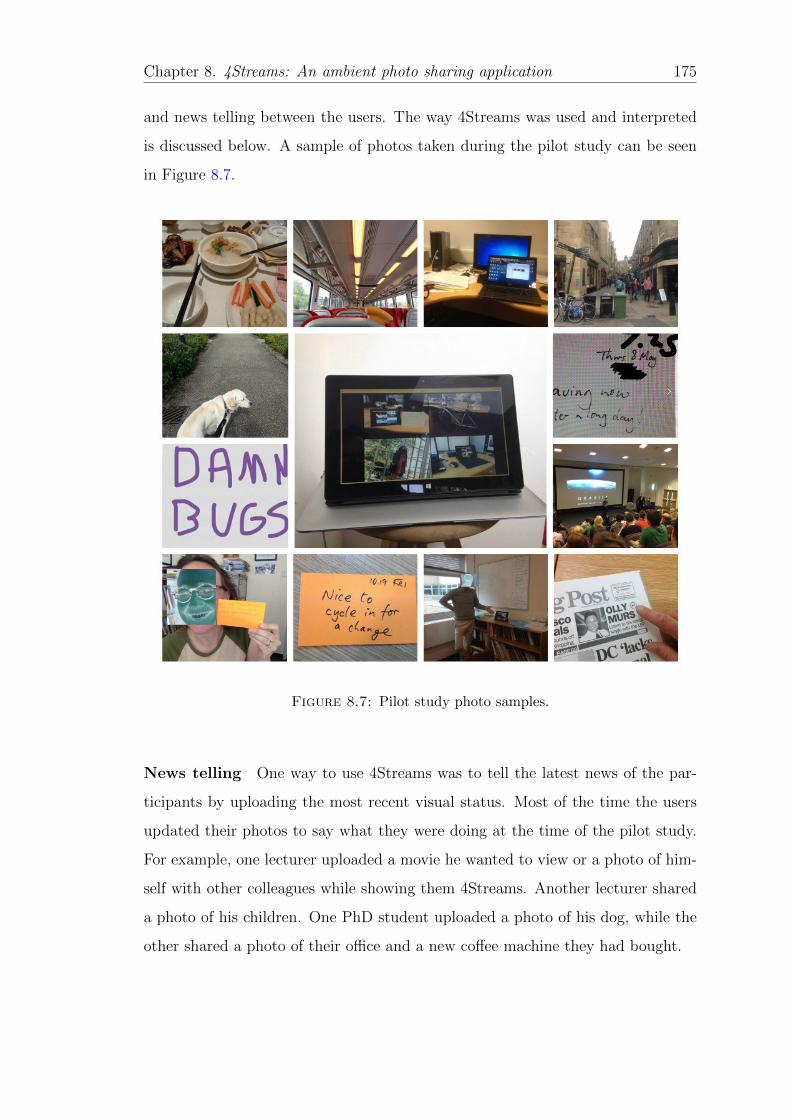
Chapter 8. 4Streams: An ambient photo sharing application 175
and news telling between the users. The way 4Streams was used and interpreted
is discussed below. A sample of photos taken during the pilot study can be seen
in Figure 8.7.
Figure 8.7: Pilot study photo samples.
News telling One way to use 4Streams was to tell the latest news of the par-
ticipants by uploading the most recent visual status. Most of the time the users
updated their photos to say what they were doing at the time of the pilot study.
For example, one lecturer uploaded a movie he wanted to view or a photo of him-
self with other colleagues while showing them 4Streams. Another lecturer shared
a photo of his children. One PhD student uploaded a photo of his dog, while the
other shared a photo of their office and a new coffee machine they had bought.
Chapter 8. 4Streams: An ambient photo sharing application 176
Response to the news The participants in this study did not just tell their
news; they also responded to the latest news of other participants by uploading
a new photo. Therefore, the visual statuses from users in this study sometimes
had a response. After uploading a photo which conveyed interest in opening a
discussion, other users tried to answer the initial visual message with another
one. For example, the first lecturer shared a photo, which was a message on a
whiteboard that said “It is 7:10, and leaving now after a hard work”. The other
lecturer responded by leaving another message on the whiteboard which said “It
is 7:15 and leaving after a long day too”. Another scenario for message sending
and responding was when one of the lecturers wrote a note on paper saying “It is
Friday and nice to cycle” and one of the students replied with a photo from his
office when he was working hard.
Wish messages During the pilot study some participants sent wish messages to
others, sometimes targeting a single person. For example, there were some photos
of a birthday cake to say happy birthday to one of the users. Moreover, there was
a moment when a user shared a note on paper with the message of good luck to
another user. Therefore, our pilot study shows 4Streams was a good platform to
send visual wish messages.
Competition on creating the lifelog The obvious behaviour in the practice
of sharing photos using 4Streams during the pilot study was that users were very
keen to create a meaningful three-dimensional lifelog of photos in order to review
them later. All shared photos contained a visual message and sometimes opened
a discussion and, therefore, the flow of the photo stories was meaningful but, of
course, the stories were discrete in time. After playing the 85 photos and viewing
what happened between the users, 4Streams visualised a concurrent photographic
lifelog of the four users in a very emotional way; it was a very good platform to
remind them of all the moments and joy during the pilot study. The joy of creating
the lifelog was one of the biggest impacts of 4Streams.
Chapter 8. 4Streams: An ambient photo sharing application 177
A platform to mention the system’s bugs 4Streams also helped us to get
information from the users regarding the system bugs. During the pilot study, the
users took a screenshot of the errors they found on the system and, interestingly,
4Streams became a communication tool to let the developers know about the
problems of the system. Sometimes during the bug discovery phase, some funny
moments were noted; for example, one of the users posted a photo saying “damn
bugs” when he found bugs. One of the lecturer’s students in a supervisory meeting
answered this in a funny way by writing a note saying “my mom used to call me
a bug”.
Colleagues and socialisation In this pilot study, it has been found that there
is value using a photo sharing ambient display between colleagues in a remote
environment. The results showed that all participants were keen on sharing their
photos with each other, from everyday life to work moments. For example, they
all shared photos from their travels or relaxation time as well as their current
workplace statuses.
From the findings of the pilot study, it can be concluded that 4Streams is suitable
as a photographic communication tool between colleagues in remote environments.
8.5 Summary
In this chapter, we described the design and implementation of a photo sharing
application called 4Streams. In 4Streams, up to four users are able to share their
photos using Facebook and see the latest visual status of each other on the screen.
Moreover, they are able to see the photos taken concurrently in slideshow mode.
In order to implement 4Streams, firstly, we firstly took advantage of the Facebook
API to connect the display to the user’s Facebook account. Therefore, when a
user took a photo, they were capable of sharing it with the 4Streams display by
sharing the photo with alltheir friends, or only the 4Streams display.
Chapter 8. 4Streams: An ambient photo sharing application 178
4Streams contained three modes: full screen, setup and single-window slideshow
mode. In the full screen mode, the system was ambient whereby the latest photo
uploaded by each user was shown on the screen. In the setting mode, the user
was able to play or play back the multiple photo streams they had taken as a
slideshow. Moreover, there was a timeline where the user could go forward and
backward over the multiple photo streams. In the single-window slideshow mode,
the user could chose just a user’s photo stream and review their photos.
In order to implement 4Streams, the design and the core logic of the system in
the presentation and application layers was implemented by a C# developing tool.
Following that, FQL and Graph API were applied to query the photos and their
information from Facebook.
The system was deployed on four users as a pilot study to find out the value of
using 4Streams. The pilot study showed that 4Streams was a good platform for
telling news via photographs, sending wish messages, creating photo diaries and
visual communication between the users. Moreover, this pilot study revealed the
value of photo sharing in the workplace between colleagues. The next chapter will
describe how 4Streams was applied to three different groups (close friends, family
and colleagues) to investigate the user experience of the system in three different
trials.
Chapter 9
Field study of 4Streams
9.1 Introduction
In the previous chapter, a novel photo sharing application, 4Streams, was designed
and built as an ambient photo display, following design guidelines from the Phase
1 and Phase 2 requirements studies. 4Streams enables users to share their photos
via the Facebook platform and display them synchronously in real time. There-
fore, users are able to share their photos immediately after taking them using
their smartphones. Moreover, 4Streams was designed to let the users review their
historical photos shared on the system concurrently. In the previous chapter, the
4Streams application was deployed on four users in a pilot study and the results
showed that the system needs to be evaluated by different types of small user
groups in situated user trials. Three different user groups were chosen: extended
family, close friends and work colleagues.
In the first study, we installed 4Streams on two Microsoft Surface Pro tablets
and gave the display to an extended family to observe utilisation of the system.
This group had four participants. The main reason to choose an extended family
context was the closeness of the group members and the frequent exchange of
photos between family members; there are often digital photo frames in family
houses, displaying close and extended family members. In addition, it has been
179
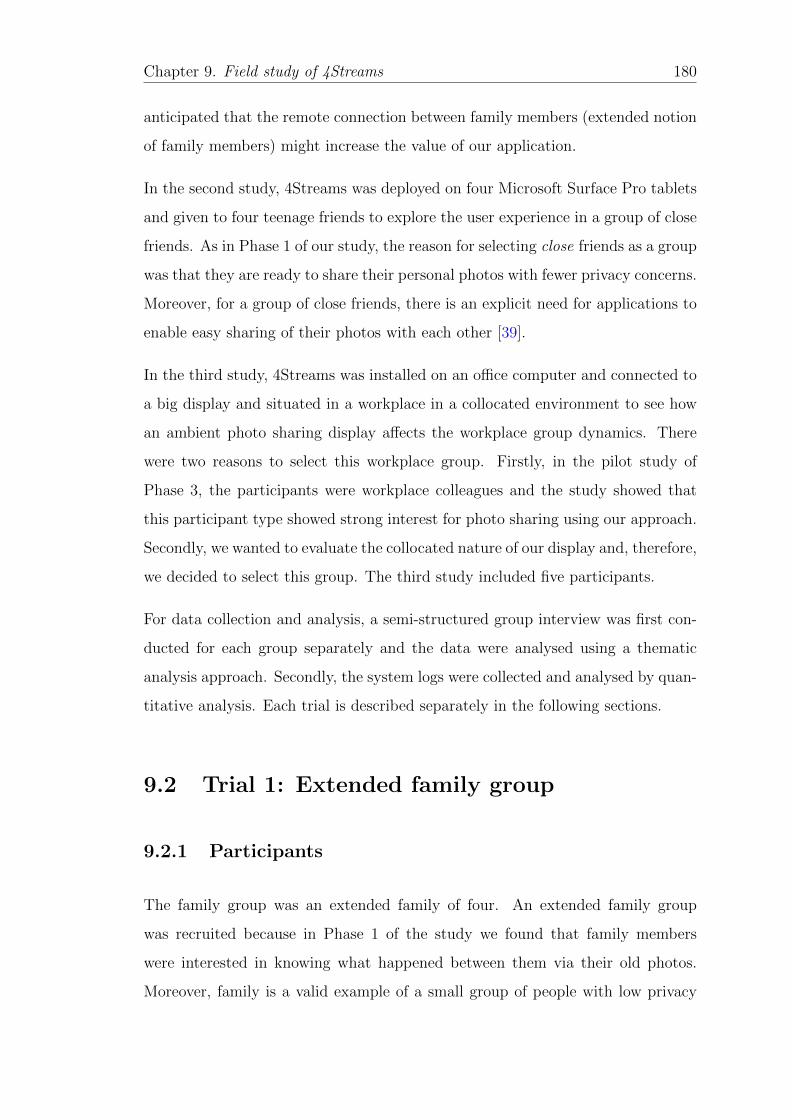
Chapter 9. Field study of 4Streams 180
anticipated that the remote connection between family members (extended notion
of family members) might increase the value of our application.
In the second study, 4Streams was deployed on four Microsoft Surface Pro tablets
and given to four teenage friends to explore the user experience in a group of close
friends. As in Phase 1 of our study, the reason for selecting close friends as a group
was that they are ready to share their personal photos with fewer privacy concerns.
Moreover, for a group of close friends, there is an explicit need for applications to
enable easy sharing of their photos with each other [39].
In the third study, 4Streams was installed on an office computer and connected to
a big display and situated in a workplace in a collocated environment to see how
an ambient photo sharing display affects the workplace group dynamics. There
were two reasons to select this workplace group. Firstly, in the pilot study of
Phase 3, the participants were workplace colleagues and the study showed that
this participant type showed strong interest for photo sharing using our approach.
Secondly, we wanted to evaluate the collocated nature of our display and, therefore,
we decided to select this group. The third study included five participants.
For data collection and analysis, a semi-structured group interview was first con-
ducted for each group separately and the data were analysed using a thematic
analysis approach. Secondly, the system logs were collected and analysed by quan-
titative analysis. Each trial is described separately in the following sections.
9.2 Trial 1: Extended family group
9.2.1 Participants
The family group was an extended family of four. An extended family group
was recruited because in Phase 1 of the study we found that family members
were interested in knowing what happened between them via their old photos.
Moreover, family is a valid example of a small group of people with low privacy
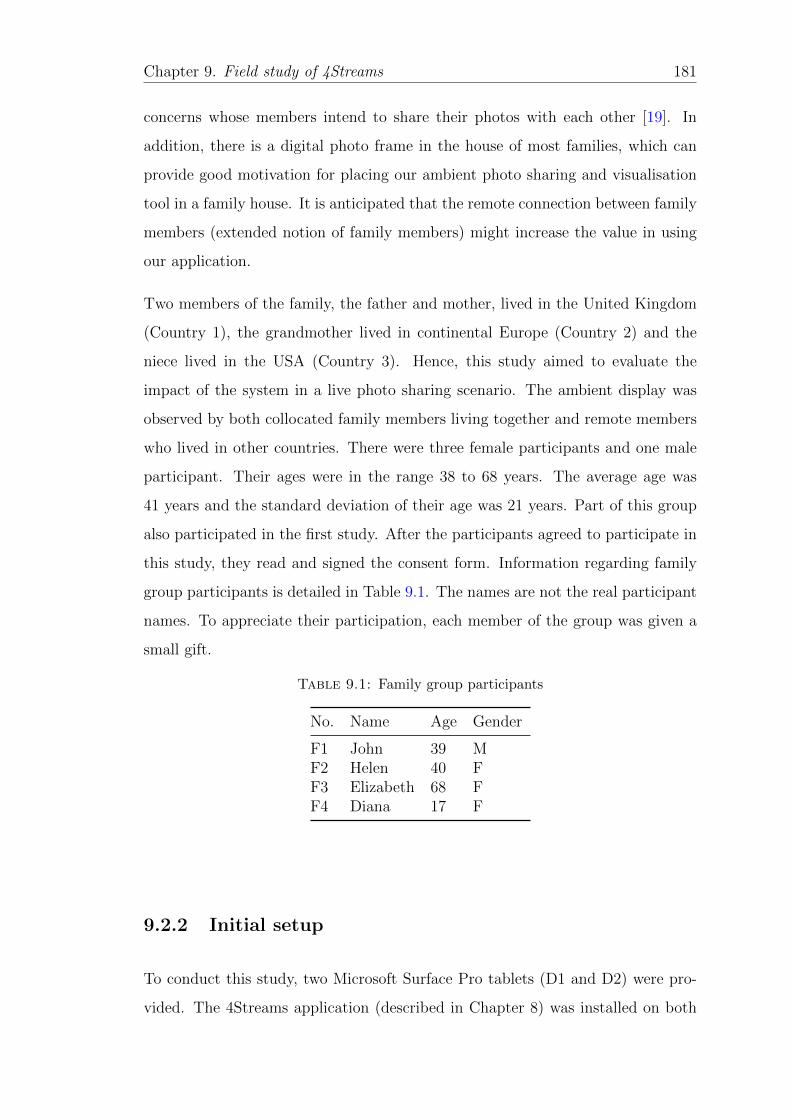
Chapter 9. Field study of 4Streams 181
concerns whose members intend to share their photos with each other [19]. In
addition, there is a digital photo frame in the house of most families, which can
provide good motivation for placing our ambient photo sharing and visualisation
tool in a family house. It is anticipated that the remote connection between family
members (extended notion of family members) might increase the value in using
our application.
Two members of the family, the father and mother, lived in the United Kingdom
(Country 1), the grandmother lived in continental Europe (Country 2) and the
niece lived in the USA (Country 3). Hence, this study aimed to evaluate the
impact of the system in a live photo sharing scenario. The ambient display was
observed by both collocated family members living together and remote members
who lived in other countries. There were three female participants and one male
participant. Their ages were in the range 38 to 68 years. The average age was
41 years and the standard deviation of their age was 21 years. Part of this group
also participated in the first study. After the participants agreed to participate in
this study, they read and signed the consent form. Information regarding family
group participants is detailed in Table 9.1. The names are not the real participant
names. To appreciate their participation, each member of the group was given a
small gift.
Table 9.1: Family group participants
No. Name Age Gender
F1 John 39 MF2 Helen 40 FF3 Elizabeth 68 FF4 Diana 17 F
9.2.2 Initial setup
To conduct this study, two Microsoft Surface Pro tablets (D1 and D2) were pro-
vided. The 4Streams application (described in Chapter 8) was installed on both
Chapter 9. Field study of 4Streams 182
devices and then they were given to the participants. The tablets had Microsoft
Windows 8 operating system installed. The tablets were touchscreens with an
external keyboard. Figure 9.1 illustrates the Microsoft tablet used in this study.
The tablets were kindly provided by Microsoft Research Centre in Cambridge in
support of the study.
Figure 9.1: Microsoft Surface Pro tablet.
One of the tablets was used in F1 and F2’s house in Country 1 and the other
tablet was used in F3’s house in Country 2. F4 was a passive user who just took
photos and notified others.
F1, F2 and F4 had a Facebook account so they only needed to add our system
account (4Streams) to their Facebook friends. F1, the father of the family, created
a Facebook account for F3 and added 4Streams, alongside the other members of
the family, to his friends list. The reason to add the 4Streams account to their
Facebook friends was to be able to share and present their Facebook photos on
the 4Streams display.
Chapter 9. Field study of 4Streams 183
The participants were advised to share their photos on Facebook choosing from
three privacy options in order to share the photos on the 4Streams display. The
first privacy option was to share the photos with all their friends, resulting in
the appearance of the photos on both the screen and the timelines of all their
Facebook friends, regardless of whether they had access to the 4Streams display.
The second option was to share the photos with just the family members of the
study (F1, F2, F3 and F4) and 4Streams. In this case, the family members could
see the photos on the 4Streams display as well as get notifications on Facebook.
The third option was to share the photos solely with 4Streams, thus being only
able to see the photos on the 4Streams display but not on the Facebook timeline.
The participants were advised on the different options of sharing their photos via
Facebook. They could use their point-and-shoot digital camera to take photos
and later upload the photos via their personal computers or tablet devices. In
addition, three participants had smartphones with the ability to connect to the
Internet via Wi-Fi or 3G; therefore, they had the option of taking photos with
their camera phones and uploading them directly. All their smartphones had the
Facebook application for which they could set the privacy setting before uploading
their photos.
The participants were asked to run the application on their Microsoft Windows
operating system whenever they turned on their tablet and to use the tablet as
their preferred device. They were asked to use the Surface tablet as a digital photo
frame. They were also asked to keep the device on as much as possible because
the system did not have the capability of accessing photos retroactively.
In the test phase, all participants uploaded some photos on Facebook and the
photos were visualised on the Surface tablet screen successfully. The participants
were asked to use the timeline and control buttons to refer to photos taken earlier.
The interactions with the system were explained to the participants in detail, and
a demo from the pilot study was shown to them. The family group used the system
and participated in the study for seven consecutive weeks.
Chapter 9. Field study of 4Streams 184
9.3 Data collection and analysis
To collect qualitative data from the group, a semi-structured interview tech-
nique was used alongside the collection of interaction logs as quantitative data.
The method for analysing the qualitative data from the interviews was adopted
from [20] and was undertaken in several stages in the present study. The guidance
form of the interview can be seen in A.7.
The first stage of the analysis was to listen to the recorded interviews. The next
step was to transcribe the interviews; transcripts were read once and, then, were
read again carefully. Once the reading was complete, several passes were made
through the data to code them and define themes and categories using Nvivo
software.
The other method of data analysis was to use quantitative data. Each device in the
study stored the interaction logs. Information such as the time of the upload, the
content of the uploaded photos, the person who shared the photos and the buttons
and settings used, was stored in the logs of the system and analysed quantitatively
later using Microsoft Excel. This technique was also applied for Trials 2 and 3.
9.3.1 Results
This section deals with the results of the qualitative and quantitative analyses.
Firstly, the results from the interviews on the participants’ current photographic
practices are presented. This is followed by an analysis of quantitative data ex-
tracted from the interaction logs. Finally, the user experience of the participants
using 4Streams is described.
Current photographic practice
Capturing Camera phones were the dominant capture device among the partic-
ipants of this group. In the previous study, which took place two years previously,
Chapter 9. Field study of 4Streams 185
both camera phones and point-and-shoot cameras were used equally. The camera
phone was used in situations where the participants did not have swift access to
their point-and-shoot cameras. On the other hand, point-and-shoot cameras were
used only on special occasions where the quality of the photos was of importance
to the participants. However, this study showed that the quality of the photos
taken by camera phones was as satisfactory as common point-and-shoot cameras,
explaining why the participants predominantly used camera phones as their main
capture device.
For example, F1 and F2 both said they used an Apple iPhone device but not any
point-and-shoot cameras any more. F1 said:
“We used to have a simple camera, like the old-school snappy simple
camera. We would take it on holidays or on trips, take photos, come
back home, offload them onto the computer. But we don’t use the
camera anymore; we both have smartphones and we’ve completely lost
contact with cameras.”
F2 added:
“We both have iPhones so they produce pictures of good enough qual-
ity. Yes, so I think I only use that for taking photos.”
The grandmother of the family (F3) had a point-and-shoot camera, but due to
broken battery, she was using an old camera phone to take photographs. Also, she
took photos quite rarely.
Storing In the family group F1 was the manager of their photo collections. F2
said that she does not manage any photos and she just passes them to F1. F1
said that he has two main repositories for the family photos. Firstly, he frequently
uploads their phone photos to an external hard drive. He has set up a Google+
account where he uploads photos from the camera phones automatically. There-
fore, he has all the photos in the Google+ photo cloud and on physical memory.
Chapter 9. Field study of 4Streams 186
He also added that after each update to physical memory, he deletes the photos
from their camera phones. This pointed out that cloud computing, such as social
networks or third-party servers, is emerging as a new means of photo storing.
Sharing The family group did not share their photos on Facebook because of
privacy issues. However, Google+ was very common among them and F1 uploaded
his photos via Google+ when he was away from home due to the stronger privacy
setting provided by Google+. F2 said:
“Like last year when John was in America for two weeks, we were
checking every day on Google+ where he’s been and what he’s done.”
They claimed that their main sharing platform is email and not current social
networks and instant message applications. They were also using other applica-
tions, such as Whatsapp and Viber, for sharing photos between each other, but
not very regularly. Regarding the use of instant message application services for
photo sharing, F2 said:
“You remember you installed WhatsApp for me because you were going
to the market and you were supposed to send me a photo.”
The grandmother of the family was not able to share photos using cloud technolo-
gies. However, other members of this group were using current technologies to
share photos but still not as their main photo sharing platform.
Structure of the family members
The study was taken during summertime and, therefore, some family members
were travelling, which provided a good opportunity for this study to investigate
the impact of the system when family members were remote. In this study, the
structure of the family members was classified into the following five phases:
Chapter 9. Field study of 4Streams 187
1. Start of study in Country 1
2. Reunion of F1 and F3 in Country 2
3. Return of F1 to Country 1
4. Reunion of F2 and F3 in Country 2
5. Return of F2 to Country 1
The participants used the system for seven weeks. Phase 1 of the study started
and finished in two days (10/07 to 12/07) when F1 and F2 were in Country 1 and
had one of the Microsoft Surface tablets devices (D1). F3, the grandmother of the
family, just had a Facebook account and could only upload photos but she was not
provided with a device at that stage (D2); therefore, she was only sharing photos
during that period. F4, the passive user, only acted as a photographer and was
living in Country 3 during this period.
In Phase 2, which started from the third day of Week 1 and continued until the
end of Week 3 (13/07 to 2/08), the father of the family travelled to Country 2
with one of his daughters to stay with F3 for two weeks. Meanwhile, F2 and the
other daughter were in Country 1, and F4 was in Country 3. In this phase, F1
carried D2 from Country 1 to Country 2 to place the device there; therefore, F3
was able to use the display from this phase.
In Phase 3, which started in Week 4 and ended in the middle of that week (3/08
to 6/08), F1 came back to Country 1 and joined F1. F4 was in Country 3 in her
hometown and F3 was in Country 2 using device D2.
In Phase 4, which started from the middle of Week 4 and ended in the middle
of Week 6 (7/08 to 22/08), F2 went to Country 2 to join F3 and F1 stayed in
Country 1. D1 was in Country 1 and D2 was still in Country 2. F4 was still in
Country 3.
In Phase 5, which started from the middle of Week 6 and continued until the end
of Week 7 (23/08 to 2/08), F2 came back to Country 1 to join F1 using D1. F3 was
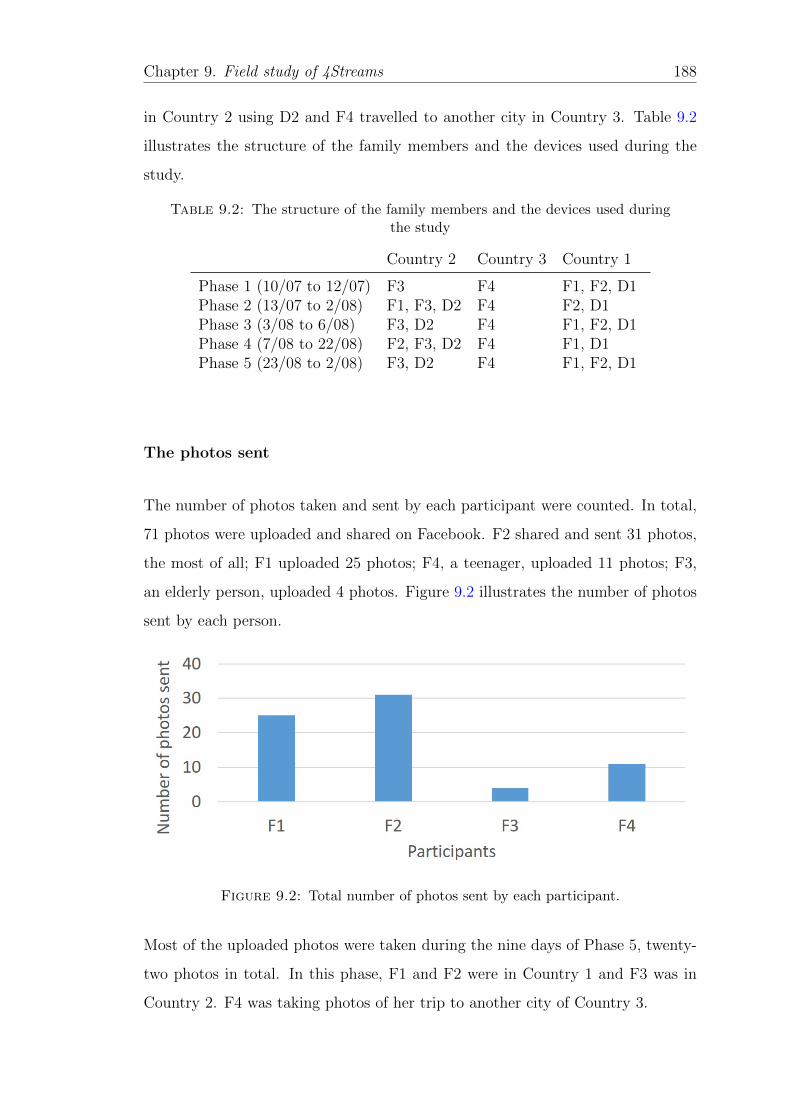
Chapter 9. Field study of 4Streams 188
in Country 2 using D2 and F4 travelled to another city in Country 3. Table 9.2
illustrates the structure of the family members and the devices used during the
study.
Table 9.2: The structure of the family members and the devices used duringthe study
Country 2 Country 3 Country 1
Phase 1 (10/07 to 12/07) F3 F4 F1, F2, D1Phase 2 (13/07 to 2/08) F1, F3, D2 F4 F2, D1Phase 3 (3/08 to 6/08) F3, D2 F4 F1, F2, D1Phase 4 (7/08 to 22/08) F2, F3, D2 F4 F1, D1Phase 5 (23/08 to 2/08) F3, D2 F4 F1, F2, D1
The photos sent
The number of photos taken and sent by each participant were counted. In total,
71 photos were uploaded and shared on Facebook. F2 shared and sent 31 photos,
the most of all; F1 uploaded 25 photos; F4, a teenager, uploaded 11 photos; F3,
an elderly person, uploaded 4 photos. Figure 9.2 illustrates the number of photos
sent by each person.
Figure 9.2: Total number of photos sent by each participant.
Most of the uploaded photos were taken during the nine days of Phase 5, twenty-
two photos in total. In this phase, F1 and F2 were in Country 1 and F3 was in
Country 2. F4 was taking photos of her trip to another city of Country 3.
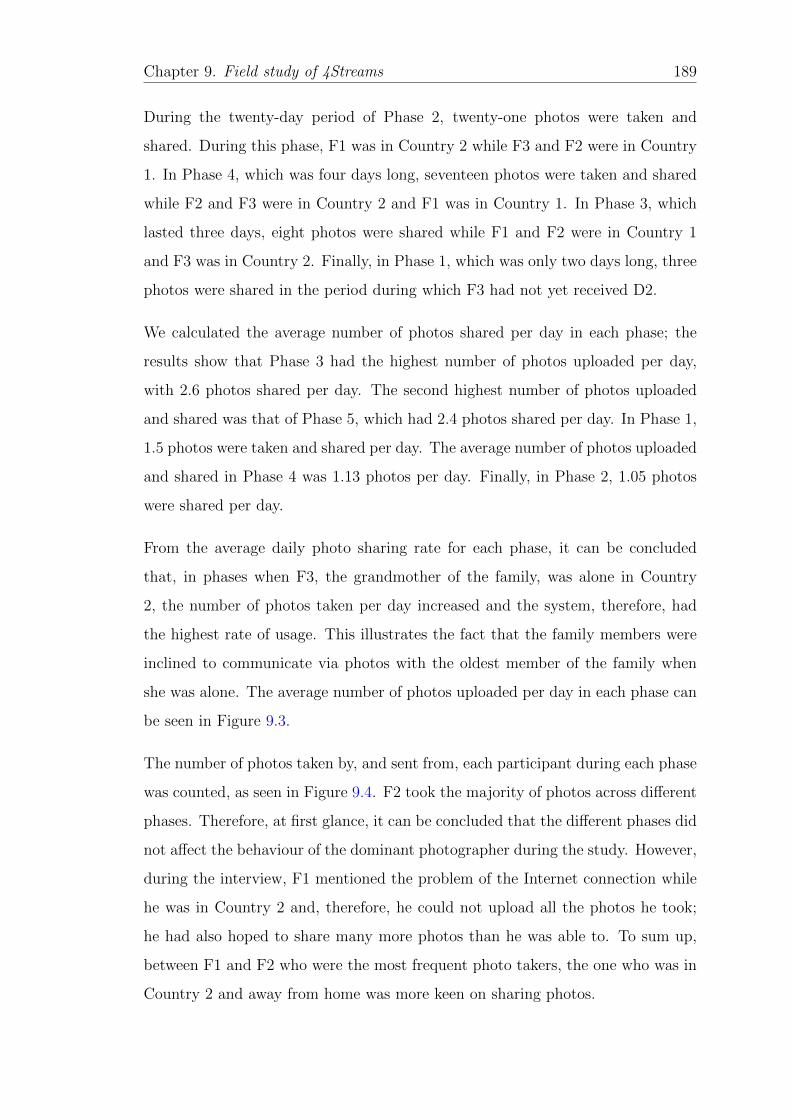
Chapter 9. Field study of 4Streams 189
During the twenty-day period of Phase 2, twenty-one photos were taken and
shared. During this phase, F1 was in Country 2 while F3 and F2 were in Country
1. In Phase 4, which was four days long, seventeen photos were taken and shared
while F2 and F3 were in Country 2 and F1 was in Country 1. In Phase 3, which
lasted three days, eight photos were shared while F1 and F2 were in Country 1
and F3 was in Country 2. Finally, in Phase 1, which was only two days long, three
photos were shared in the period during which F3 had not yet received D2.
We calculated the average number of photos shared per day in each phase; the
results show that Phase 3 had the highest number of photos uploaded per day,
with 2.6 photos shared per day. The second highest number of photos uploaded
and shared was that of Phase 5, which had 2.4 photos shared per day. In Phase 1,
1.5 photos were taken and shared per day. The average number of photos uploaded
and shared in Phase 4 was 1.13 photos per day. Finally, in Phase 2, 1.05 photos
were shared per day.
From the average daily photo sharing rate for each phase, it can be concluded
that, in phases when F3, the grandmother of the family, was alone in Country
2, the number of photos taken per day increased and the system, therefore, had
the highest rate of usage. This illustrates the fact that the family members were
inclined to communicate via photos with the oldest member of the family when
she was alone. The average number of photos uploaded per day in each phase can
be seen in Figure 9.3.
The number of photos taken by, and sent from, each participant during each phase
was counted, as seen in Figure 9.4. F2 took the majority of photos across different
phases. Therefore, at first glance, it can be concluded that the different phases did
not affect the behaviour of the dominant photographer during the study. However,
during the interview, F1 mentioned the problem of the Internet connection while
he was in Country 2 and, therefore, he could not upload all the photos he took;
he had also hoped to share many more photos than he was able to. To sum up,
between F1 and F2 who were the most frequent photo takers, the one who was in
Country 2 and away from home was more keen on sharing photos.
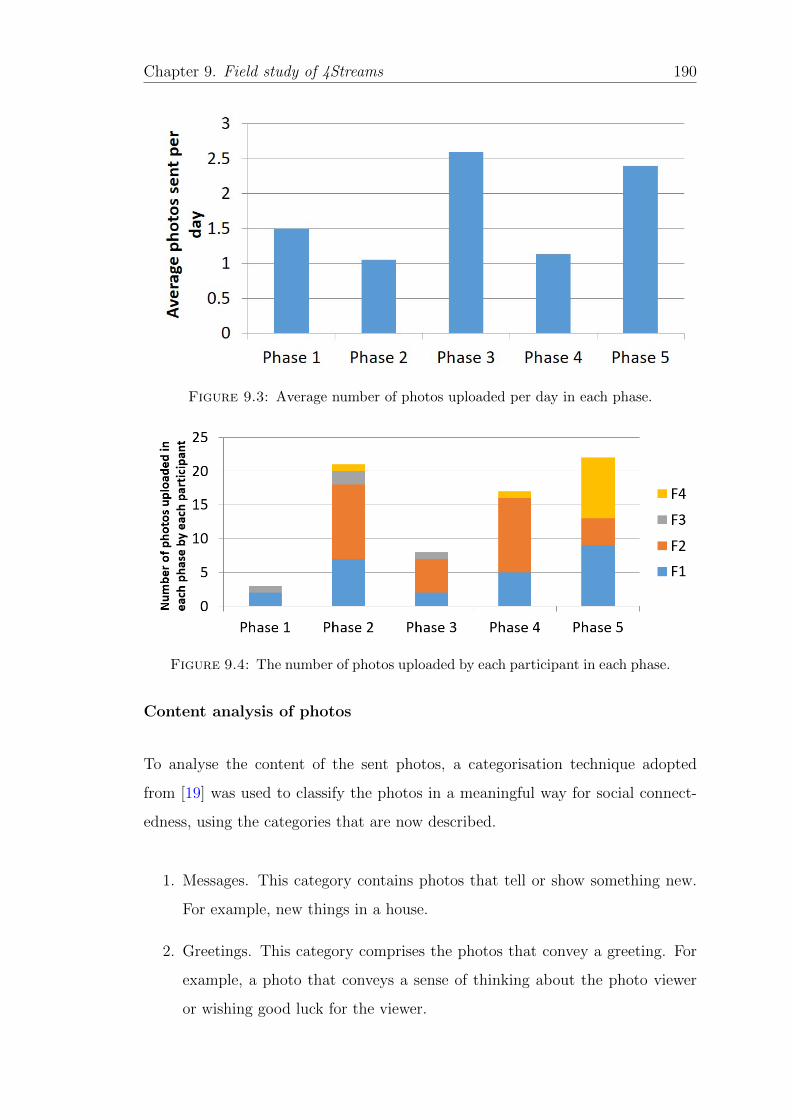
Chapter 9. Field study of 4Streams 190
Figure 9.3: Average number of photos uploaded per day in each phase.
Figure 9.4: The number of photos uploaded by each participant in each phase.
Content analysis of photos
To analyse the content of the sent photos, a categorisation technique adopted
from [19] was used to classify the photos in a meaningful way for social connect-
edness, using the categories that are now described.
1. Messages. This category contains photos that tell or show something new.
For example, new things in a house.
2. Greetings. This category comprises the photos that convey a greeting. For
example, a photo that conveys a sense of thinking about the photo viewer
or wishing good luck for the viewer.
Chapter 9. Field study of 4Streams 191
3. Everyday life. This category contains photos to present the everyday life of
the photographer, such as photos of kids and corners of the house.
4. Special events. This category updates the photo viewer that the photogra-
pher involved in special moment such as a birthday.
5. Something funny or aesthetic. This category presents photos that are funny
or aesthetically pleasing. A photo of a flower or a funny selfie can be con-
sidered as fitting into this category.
The categorisation explained above was used to analyse photos sent between the
four members of the family. Figure 9.5 shows the number of shared photos among
family members in each category.
Figure 9.5: The number of shared photos in each category.
Messages This category contained 28% of the photos and was the second highest
category. Typical examples were photos of the baggage before travelling, screen-
shots of the application and photos of food.
The niece (F4) sent photos of her boyfriend. F1 and F2 shared photos that show
they packed their luggage before travelling. They also sent photos of a meal they
cooked and prepared. F1 took photos of his coffee preparation time and his mug.
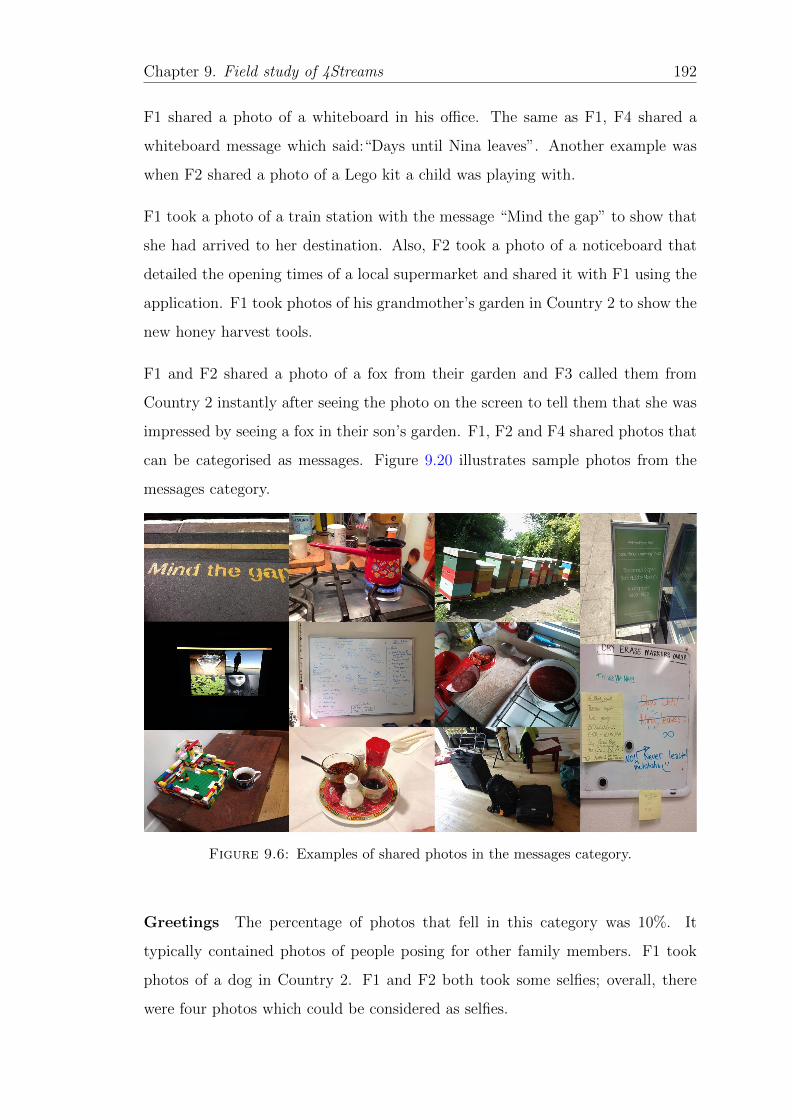
Chapter 9. Field study of 4Streams 192
F1 shared a photo of a whiteboard in his office. The same as F1, F4 shared a
whiteboard message which said:“Days until Nina leaves”. Another example was
when F2 shared a photo of a Lego kit a child was playing with.
F1 took a photo of a train station with the message “Mind the gap” to show that
she had arrived to her destination. Also, F2 took a photo of a noticeboard that
detailed the opening times of a local supermarket and shared it with F1 using the
application. F1 took photos of his grandmother’s garden in Country 2 to show the
new honey harvest tools.
F1 and F2 shared a photo of a fox from their garden and F3 called them from
Country 2 instantly after seeing the photo on the screen to tell them that she was
impressed by seeing a fox in their son’s garden. F1, F2 and F4 shared photos that
can be categorised as messages. Figure 9.20 illustrates sample photos from the
messages category.
Figure 9.6: Examples of shared photos in the messages category.
Greetings The percentage of photos that fell in this category was 10%. It
typically contained photos of people posing for other family members. F1 took
photos of a dog in Country 2. F1 and F2 both took some selfies; overall, there
were four photos which could be considered as selfies.
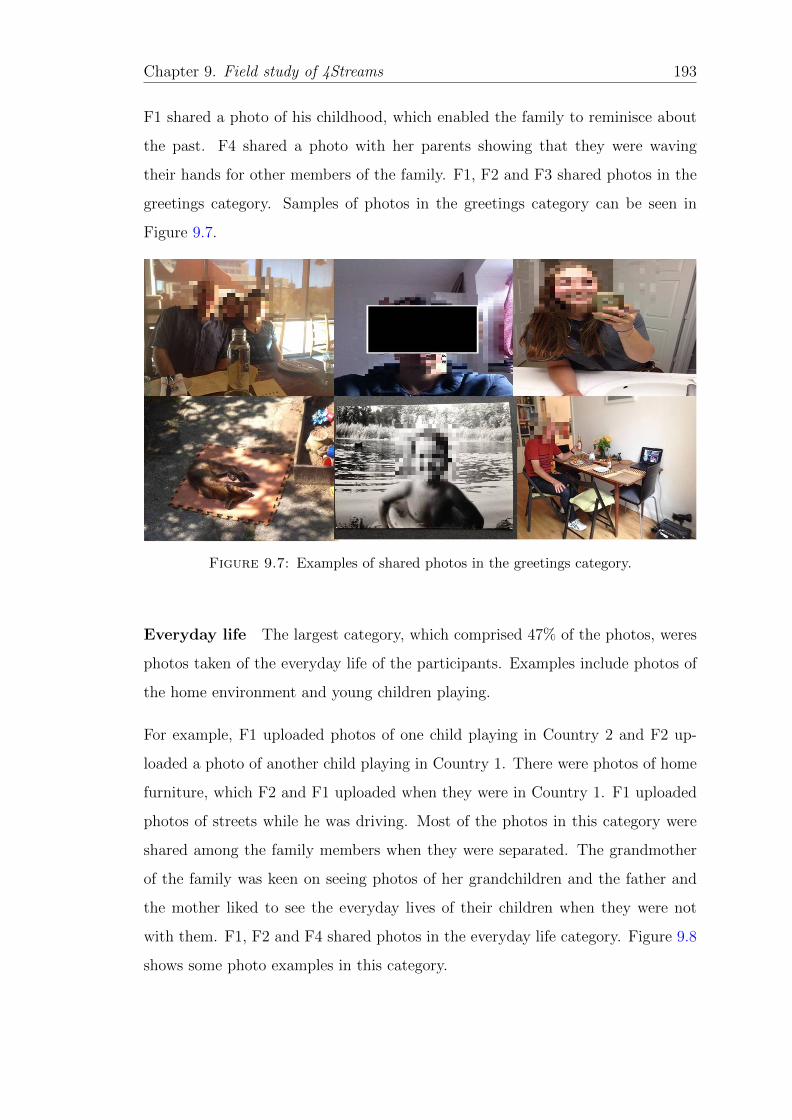
Chapter 9. Field study of 4Streams 193
F1 shared a photo of his childhood, which enabled the family to reminisce about
the past. F4 shared a photo with her parents showing that they were waving
their hands for other members of the family. F1, F2 and F3 shared photos in the
greetings category. Samples of photos in the greetings category can be seen in
Figure 9.7.
Figure 9.7: Examples of shared photos in the greetings category.
Everyday life The largest category, which comprised 47% of the photos, weres
photos taken of the everyday life of the participants. Examples include photos of
the home environment and young children playing.
For example, F1 uploaded photos of one child playing in Country 2 and F2 up-
loaded a photo of another child playing in Country 1. There were photos of home
furniture, which F2 and F1 uploaded when they were in Country 1. F1 uploaded
photos of streets while he was driving. Most of the photos in this category were
shared among the family members when they were separated. The grandmother
of the family was keen on seeing photos of her grandchildren and the father and
the mother liked to see the everyday lives of their children when they were not
with them. F1, F2 and F4 shared photos in the everyday life category. Figure 9.8
shows some photo examples in this category.
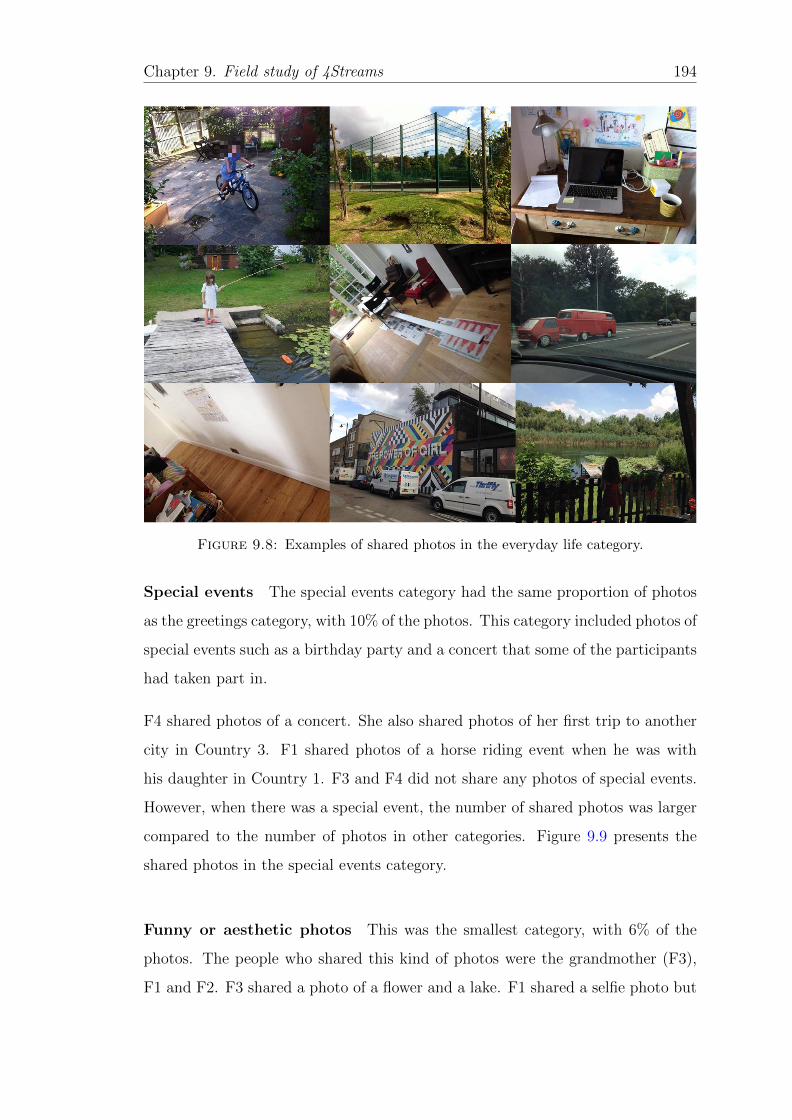
Chapter 9. Field study of 4Streams 194
Figure 9.8: Examples of shared photos in the everyday life category.
Special events The special events category had the same proportion of photos
as the greetings category, with 10% of the photos. This category included photos of
special events such as a birthday party and a concert that some of the participants
had taken part in.
F4 shared photos of a concert. She also shared photos of her first trip to another
city in Country 3. F1 shared photos of a horse riding event when he was with
his daughter in Country 1. F3 and F4 did not share any photos of special events.
However, when there was a special event, the number of shared photos was larger
compared to the number of photos in other categories. Figure 9.9 presents the
shared photos in the special events category.
Funny or aesthetic photos This was the smallest category, with 6% of the
photos. The people who shared this kind of photos were the grandmother (F3),
F1 and F2. F3 shared a photo of a flower and a lake. F1 shared a selfie photo but
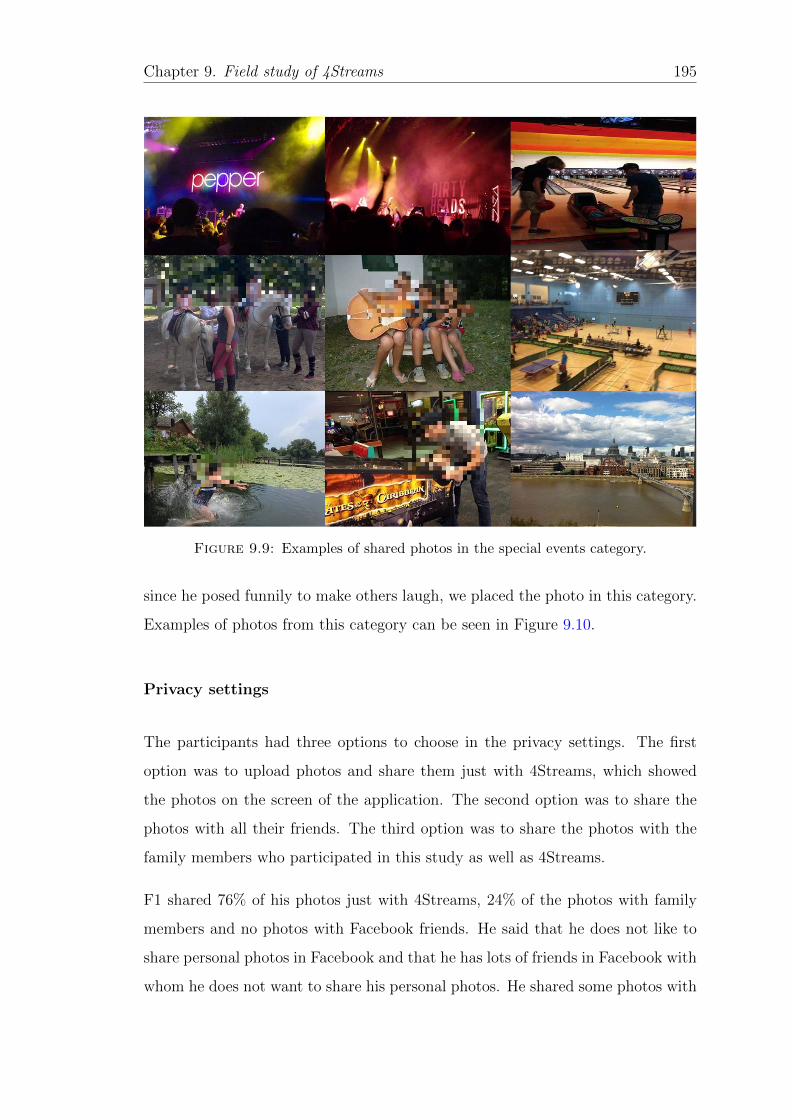
Chapter 9. Field study of 4Streams 195
Figure 9.9: Examples of shared photos in the special events category.
since he posed funnily to make others laugh, we placed the photo in this category.
Examples of photos from this category can be seen in Figure 9.10.
Privacy settings
The participants had three options to choose in the privacy settings. The first
option was to upload photos and share them just with 4Streams, which showed
the photos on the screen of the application. The second option was to share the
photos with all their friends. The third option was to share the photos with the
family members who participated in this study as well as 4Streams.
F1 shared 76% of his photos just with 4Streams, 24% of the photos with family
members and no photos with Facebook friends. He said that he does not like to
share personal photos in Facebook and that he has lots of friends in Facebook with
whom he does not want to share his personal photos. He shared some photos with
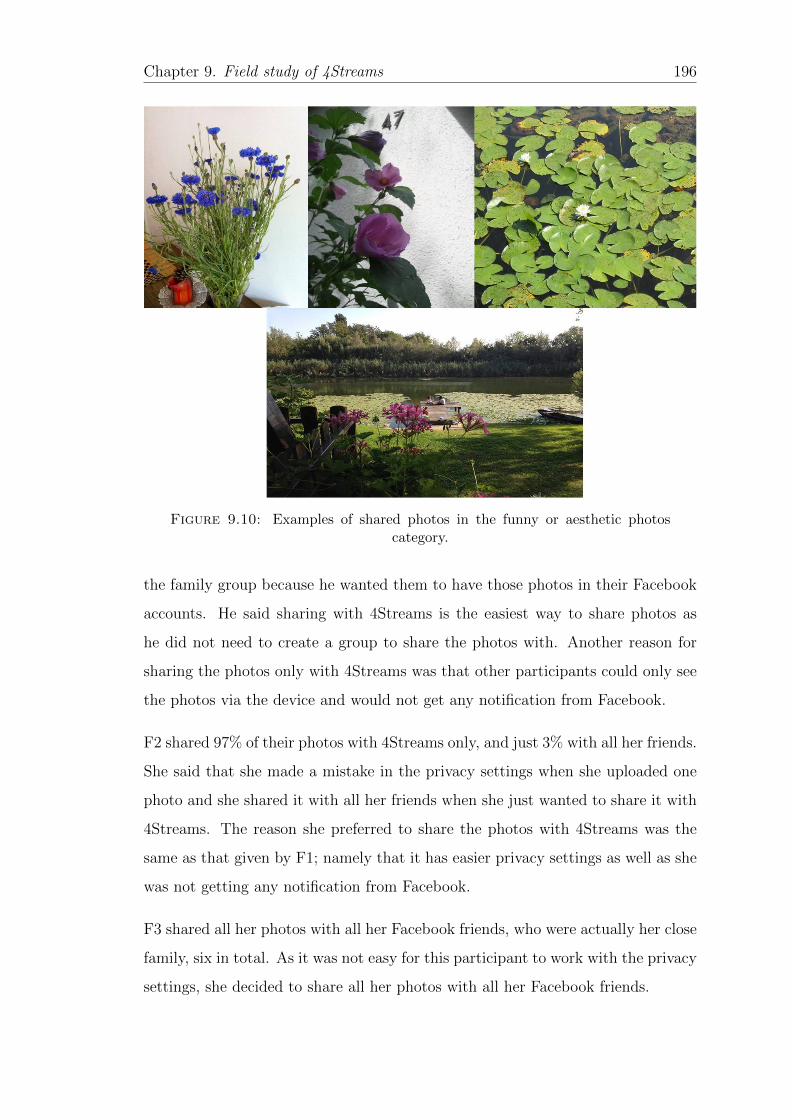
Chapter 9. Field study of 4Streams 196
Figure 9.10: Examples of shared photos in the funny or aesthetic photoscategory.
the family group because he wanted them to have those photos in their Facebook
accounts. He said sharing with 4Streams is the easiest way to share photos as
he did not need to create a group to share the photos with. Another reason for
sharing the photos only with 4Streams was that other participants could only see
the photos via the device and would not get any notification from Facebook.
F2 shared 97% of their photos with 4Streams only, and just 3% with all her friends.
She said that she made a mistake in the privacy settings when she uploaded one
photo and she shared it with all her friends when she just wanted to share it with
4Streams. The reason she preferred to share the photos with 4Streams was the
same as that given by F1; namely that it has easier privacy settings as well as she
was not getting any notification from Facebook.
F3 shared all her photos with all her Facebook friends, who were actually her close
family, six in total. As it was not easy for this participant to work with the privacy
settings, she decided to share all her photos with all her Facebook friends.
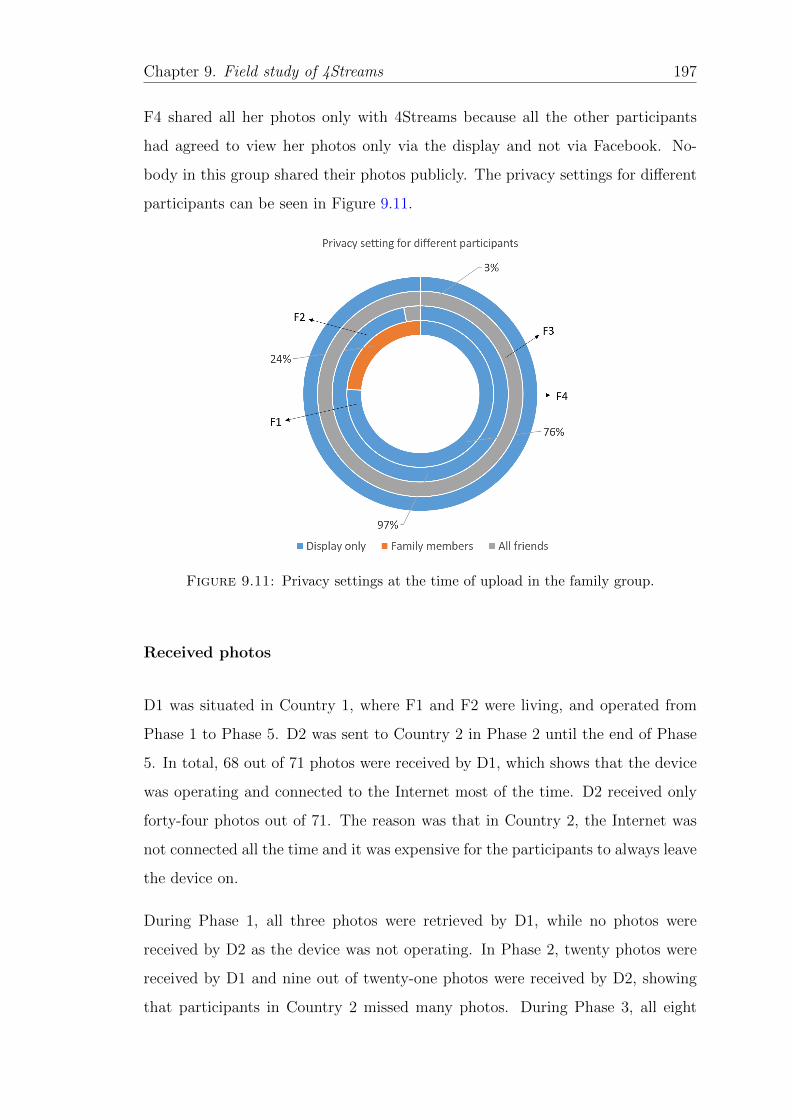
Chapter 9. Field study of 4Streams 197
F4 shared all her photos only with 4Streams because all the other participants
had agreed to view her photos only via the display and not via Facebook. No-
body in this group shared their photos publicly. The privacy settings for different
participants can be seen in Figure 9.11.
Figure 9.11: Privacy settings at the time of upload in the family group.
Received photos
D1 was situated in Country 1, where F1 and F2 were living, and operated from
Phase 1 to Phase 5. D2 was sent to Country 2 in Phase 2 until the end of Phase
5. In total, 68 out of 71 photos were received by D1, which shows that the device
was operating and connected to the Internet most of the time. D2 received only
forty-four photos out of 71. The reason was that in Country 2, the Internet was
not connected all the time and it was expensive for the participants to always leave
the device on.
During Phase 1, all three photos were retrieved by D1, while no photos were
received by D2 as the device was not operating. In Phase 2, twenty photos were
received by D1 and nine out of twenty-one photos were received by D2, showing
that participants in Country 2 missed many photos. During Phase 3, all eight
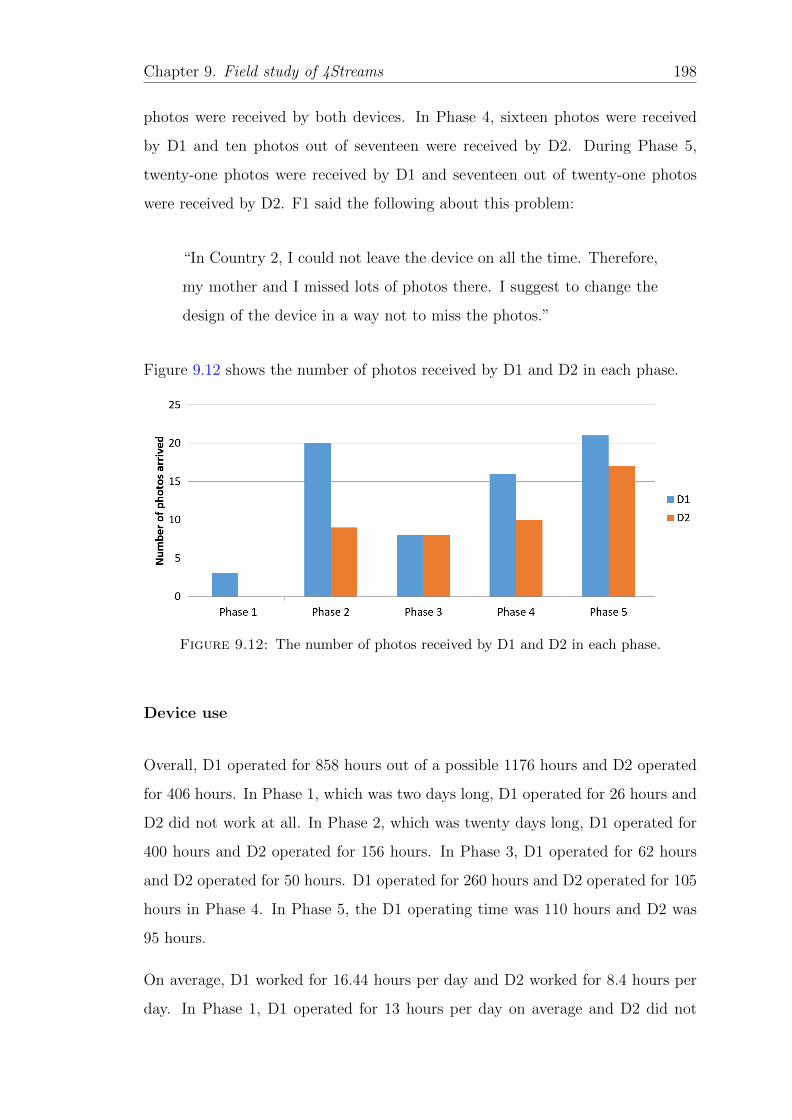
Chapter 9. Field study of 4Streams 198
photos were received by both devices. In Phase 4, sixteen photos were received
by D1 and ten photos out of seventeen were received by D2. During Phase 5,
twenty-one photos were received by D1 and seventeen out of twenty-one photos
were received by D2. F1 said the following about this problem:
“In Country 2, I could not leave the device on all the time. Therefore,
my mother and I missed lots of photos there. I suggest to change the
design of the device in a way not to miss the photos.”
Figure 9.12 shows the number of photos received by D1 and D2 in each phase.
Figure 9.12: The number of photos received by D1 and D2 in each phase.
Device use
Overall, D1 operated for 858 hours out of a possible 1176 hours and D2 operated
for 406 hours. In Phase 1, which was two days long, D1 operated for 26 hours and
D2 did not work at all. In Phase 2, which was twenty days long, D1 operated for
400 hours and D2 operated for 156 hours. In Phase 3, D1 operated for 62 hours
and D2 operated for 50 hours. D1 operated for 260 hours and D2 operated for 105
hours in Phase 4. In Phase 5, the D1 operating time was 110 hours and D2 was
95 hours.
On average, D1 worked for 16.44 hours per day and D2 worked for 8.4 hours per
day. In Phase 1, D1 operated for 13 hours per day on average and D2 did not
Chapter 9. Field study of 4Streams 199
operate at all. In Phase 2, D1 operated for 20 hours per day and D2 operated
for 7.8 hours. D1 and D2 operated for 20.66 and 15.66 hours per day in Phase 3,
respectively. In Phase 4, D1 operated for 17.33 hours per day and D2 operated
for 7 hours. In Phase 5, D1 and D2 operated for 12.22 and 10.55 hours per day,
respectively.
According to the average usage of D1 per day, D1 was used more frequently until
the end of Phase 3, when it reached its peak and, thereafter, the average usage
declined as the interest in using the system declined. In D2, the average usage
of the system per day rose until the end of Phase 3. In Phase 4, the interest
decreased but suddenly in Phase 5, after F3 became alone and F2 left Country 2
for Country 1, the use of the device increased.
Interaction with the system
The users were able to interact with the system. Whenever a user run the appli-
cation, four slideshow windows appeared. The photos taken and shared by each
participant appeared in their designated slideshow windows. The setup mode ap-
peared on the screen when touching any of those slideshow windows. In the setup
mode, the user was able to use the timeline to browse photo streams. In addition,
the user was able to play or play back the slideshow to view the photos from mul-
tiple users in time order. There was a vertical slider which enabled the user to
choose the speed of the slideshow.
Full screen and setup mode In total, D1 was in full screen mode for 857.3
hours, while D2 was in full screen mode for 405.87 hours. In Phase 1, D1 was in
full screen mode for 25.96 hours, while D2 did not operate. In Phase 2, D1 and
D2 were in full screen mode for 399.9 and 155.98 hours, respectively. In Phase 3,
D1 and D2 were in full screen mode for 61.87 and 50 hours, respectively. In the
next phase (Phase 4), D1 and D2 were in this mode for 259.84 and 104.98 hours,
respectively, and in the last phase (Phase 5), D1 was in full screen while D2 was
in this mode for 405.87 hours.
Chapter 9. Field study of 4Streams 200
D1 and D2 were in setup mode for 42 and 7.8 minutes, respectively. In Phase 1,
D1 was in setup mode for 0.04 minutes, while D2 was deactivated. D1 and D2
were in this mode in Phase 2 for 6 and 1.2 minutes, respectively. In Phase 3, the
system was in setup mode in D1 for 7.8 minutes and D2 did not go to setup mode
and stayed in full screen mode all the time. In the next phase (Phase 4), D1 was
in setup mode for 9.6 minutes while D2 was in setup mode for 6.6 minutes. In
Phase 5, D2 did not go to setup mode while D1 was in this mode for 16.2 minutes.
These data show that the system was in full screen mode most of the time. How-
ever, F1 and F2 sometimes used the setup mode to review older photos. In ad-
dition, F3 was not interested in using the setup mode when she was alone. F1
said:
“Everyday I would go back by timeline and play the old photos...most
of the times it was on full screen.”
Single-window slideshow The single-window slideshow was designed to enable
the participants to view a single person’s photo stream; however, the participants
did not used the single-window slideshow to review a single person’s photo stream.
Instead, they used it to see each photo in a bigger size. F1 said:
“I have just to open one picture to see it better - like a bigger picture -
but not for following somebody for some period of time or playing like
that, whatever, his pictures or her pictures again. It’s just for having
a full-screen picture.”
Speed of the slideshow The speed of the slideshow for the family group, while
they were reviewing their multiple photo streams, was fixed to the default value
most of the time; the default value was 5 as the base of the logarithm in the
logarithmic transition. They mentioned that if they had more photos in their
collections, they would change the speed of slideshow, but the presentation length
was not that lengthy so they preferred the default setting. However, in D1 they
Chapter 9. Field study of 4Streams 201
changed the base value between 2 and 900 in three trials, and in D2 they changed
the base value between 2 and 1000 in one trial.
Impact on solitary interaction between the user and the system
In the family group, all three members who had access to the system (F1, F2 and
F3) used the system. During the interview, all of them claimed that they looked
at the screen alone and mentioned that when the system was in full screen mode,
they could see the latest status of the other members of the family. Furthermore,
when they were reviewing the photos, they could see what was happening between
them concurrently; they enjoyed both these experiences. F2 mentioned that when
she was in Country 1 and the other family members were in Country 2, a close
friend was staying with her for a week and the device was on the dinner table
in the dining room. She added that her friend was impressed by the application
and the way they could get the latest news from F2’s family members. During
the interview, F2 added that her children were impressed when they were viewing
their own photos on the screen. Based on this feedback, the solitary interaction
of the participants with the system can be categorised into three scenarios.
The first scenario was when one of the photographers (F1, F2, F3) was viewing
the photos alone. The second scenario was when an audience member other than
the photographer was viewing the photos on the system, namely F2’s best friend.
The third scenario was when subjects of the photos, such as kids, were viewing
the photos on the screen.
Frohlich [2] proposed the following framework for the solitary interactions between
a user and photos during the time of viewing the photos: interpretation, recogni-
tion, recollection and self-recognition. The main elements in this framework were
photographer, subject, audience and their relation with the photo.
Recognition is when a photographer views their own photo. Interpretation is
when an audience member views a photo taken by another person. Recollection
and self-reflection are when the subject of a photo views that photo.
Chapter 9. Field study of 4Streams 202
Based on the information gained during the user experience and the proposed
framework by Frohlich, it can be concluded that participants experienced inter-
pretation, recognition, recollection and self-recognition during this study. The
only difference with the Frohlich framework is that the combination of these ex-
periences happened simultaneously in the current experience. In this section, the
impact on solitary interaction in different scenarios based on our user experience
using 4Streams is described.
Interpretation and recognition At first glance, in the first scenario, when a
participant looks at the screen, they see four photos of which one belongs to them
as the photographer. There are three other photos the other participants captured.
Therefore, each participant is simultaneously a photographer and an audience
member. As a result, it can be claimed that a participant using our system has
the experience of interpretation while looking at the three other windows and
recognition while looking at the photo they took themselves at the same time. F2
said:
“I found it really nice seeing the activity of others while seeing my own
activity and it was really interesting sometimes to see all photos at the
same time.”
She also added:
“I think I would use this application more if I have it because it would
be interesting to see how we spent our days.”
From these two quotes it can be concluded that this participant liked to see her
photos and others at the same time. Moreover, she enjoyed seeing what happened
among the group using the application. This brought a sense of interpretation and
recognition at the same time.
Chapter 9. Field study of 4Streams 203
Interpretation The second scenario was when an audience member who was
neither the photographer nor the subject of any photo viewed the photos; in this
case the viewer just interprets the four photos. As F2 mentioned, one of her friends
spent a week with her while she was the only participant in Country 1. F2 said:
“I had a friend of mine staying with us and she was like “what is this?”.
We explained and she was like “Wow!”. She really liked the idea and
she was sometimes viewing our photos.”
Interpretation, recollection and self-recognition The third scenario was
when a subject viewed themselves in the display. A good example was children,
when their parents took many photos of them. The parents said that the kids
were very interested when they viewed themselves on the screen. In this scenario
the children experienced recollection and self-recognition by viewing the photos
in which they were subjects alongside the experience of interpretation by viewing
photos of others.
Interpretation, recognition, recollection and self-recognition During this
study, there was an interesting scenario where F1 experienced all the mentioned
solitary interactions proposed by Frohlich within the application at the same time.
There was a photo of F1 in the system taken by F2. Hence, F1 was interpreting two
photos taken by F3 and F4; he had a sense of recognition by looking at his shared
photo on the screen and, finally, he experienced recollection and self-recognition
by looking at his photo on the screen as a subject.
Impacts on social interaction between the users and the system
In this section, the social interaction between the people exposed to our system is
analysed. There were moments when more than one person viewed the screen. For
example, F1 and F2 reviewed and viewed the screen together. In addition, they
once reviewed the whole photo stream using our system before we conducted the
Chapter 9. Field study of 4Streams 204
interview. The parents and their children also viewed photos collectively. While F1
and F2 were in Country 2, they viewed the photo streams or the latest statuses of
the photo streams with F3. F2 also viewed the photos with her friend. Moreover,
the grandfather of the family viewed the photo streams with F3.
Frohlich [2] also proposed the following framework for the social interactions be-
tween the user and the photos during the time of viewing the photos: storytelling
and reminiscing. The main elements of this framework are, again, the photogra-
pher, the subject, the audience and their relationship with the photo.
Frohlich defined storytelling as when a photographer is talking about their taken
photos with an audience member. There is another scenario for storytelling,
namely when a subject is talking about their photo with an audience member.
In reminiscing, a subject and a photographer talk about photos. However, in this
application, we found two additional scenarios to this framework, bi-directional
storytelling and social interpretation. Social interpretation is when the audience
talks about a photo they did not take or for which they are not the subject.
Bi-directional storytelling is when two photographers talk about their photos. A
combination of these social interactions occurred during our system experience in
the family group. Different social interactions between the users and the system
are now described.
Bi-directional storytelling and social interpretation There was a moment
when two photographers (F1 and F2) were reviewing and viewing their photos on
our device. During viewing the four photo streams, we observed their behaviour.
We saw that they were explaining what was happening to them individually in
each photo to each other, in detail. For instance, F1 was talking about a photo
he took of his new haircut in Country 2 and F2 was talking about the food she
cooked.
During the time they were viewing their photos in slideshow mode, they suddenly
saw a photo of a man in F4’s photo stream, and they discussed whether he was
Chapter 9. Field study of 4Streams 205
F4’s boyfriend or not; this is considered to be social interpretation between them.
Social interpretation means that they were interpreting a photo they did not take.
From the above-mentioned stories, the experience of two photographers during
viewing their photos using 4Streams can be claimed as the two experiences of
bi-directional storytelling and social interaction.
For example, F1 and F2 were viewing and discussing the photos in Country 2
F2 took. F1 said something about his interest in social interpretation of photo
streams:
“For me it was very interesting to see what’s happening somewhere else
with my family including what Helen was doing with Katy (daughter
of the family) and me and my mom talked about that photo... We
were also talking about the photos we took.”
F1 also experienced the sense of social interaction, as he said:
“My mother mostly was looking at Katy’s photo with me and we were
talking about that.”
Storytelling and social interpretation Another scenario of social interaction
between users and the system is when a photographer and an audience member
view the screen; this happened twice during this study. The first occurrence was
when F1 was with her friend and the second occurrence was when F3 and her
husband were viewing the photos.
F3 said that when she was viewing the photo streams, she saw a photo of a fox
in the garden in Country 1 and she told her husband about it; they then viewed
that photo together and discussed whether or not there are any foxes in Country
1. She was also telling the stories of the photos taken by F1 and she uploaded
them on the system.
Chapter 9. Field study of 4Streams 206
Reminiscing and social interpretation During the revision or live update
there is another scenario when the photographer and the subject of the photo
are viewing the photos together. For example, parents viewed photos with their
children. The children liked to see their own photos alongside their parents and
remembered what was happening to them. During the observation one of the kids
mentioned a photo of when she was in a horse riding event and talked about it
with her father, and F1 continued the conversation with her. She also talked about
a photo of F4, who was her cousin, taken in Country 3 and told her parents and
us “This is Diana, I like her”; this opened a new conversation topic.
Communication tool
Family members were enthusiastic about using photos as a way of keeping in
contact, especially because F3 was living in Country 2, F4 was living in Country 3
and F1 and F2 were leaving Country 1 for different periods to visit F3. Therefore,
our system was used as a communication tool to connect the family members
using photos. F1 and F2 used the system in Phases 3 and 5 to update the older
member of the family, and they were in touch with the family members while
they were away from Country 1. Therefore, this tool could be a new medium for
communication between family members.
F3’s manner of photo sharing was slightly different from that of F1 and F2. The
oldest participant was very pleased about the photos she could see from the other
three family members. Hence, she was mostly expecting the other members to
provide new photos to the system. However, she was not keen on informing others
about her current visual status. Thus, she only shared her old photos and photos
of her garden flowers.
“I was sharing what I believed was interesting for them. I was not
mostly sharing new photos.”
Chapter 9. Field study of 4Streams 207
F1 and F2 shared photos that conveyed live communication to show their latest
statuses mostly to F3 or to each other when they were away from Country 1. F1
said:
“I liked it because we were in different parts of the world at the time
when the experiment was done. I thought that it was so exciting to
see new pictures every day. I found it really nice seeing the current
activity of others so I could understand where F2 was and was it rainy
there?”
Regarding this topic, F2 said:
“I think it’s an interesting way of looking at other people’s lives. I’m
not necessarily interested in what everybody I know is doing in their
life because I can’t cope with that amount of information. But with
the people around me, I think I would like to see a photo of F1 during
the day.”
A trigger for other communication tools
Participants said that during this study, they used our system, phone and Skype
as communication tools among family members. They said that they used Skype
to talk to F3 in Country 2, while the phone was the internal communication tool.
However, our system provided a new platform for communication. We did not
provide any option for comments and captions as we wished to evaluate how plain
photo sharing affected communication within an extended family.
Family members believed that using a photo sharing application as an ambient
display let them know the latest statuses of other members. However, in some
cases it was a trigger for other communication tools. For example, in Phase 5
when F1 and F2 were in Country 1 and F3 was in Country 2, they shared a photo
of a fox in their garden; as a result, F3 and her husband called them instantly
after seeing that photo. F1 said:
Chapter 9. Field study of 4Streams 208
“About the fox; it was a whole thing about the fox. The biggest
thing about the fox is basically that there was a little bit of a story in
our family. We often have foxes in our garden and my father is from
the mountains and he is very familiar with foxes. Whenever he was
in England here visiting us he would never see a fox in the garden.
Granny saw millions of foxes and we have foxes every morning. He
said ‘No way, you’re lying; no foxes are in your garden ever’. Then I
managed to take a photo. This is the first photo when my dad finally
saw a photo of a fox in our garden. It’s an interesting story that
triggered this family conversation about foxes in our garden. That was
proof and it was visual proof and it triggered a lot of communication
in different channels over it. He called me straight after seeing that
photo. ”
Viewing old visual statuses
One feature that was very appealing for the participants was viewing their old
visual statuses concurrently over time in slideshow mode. After using this feature,
they mentioned that they remembered many events that had happened during the
study. The photos were ordered chronologically so that they could follow what
had happened. Regarding the experience he had, F1 said:
“Helen made a new salad and she took a picture of Katy eating it and
so on, and we were so excited about that salad when we were there.
I don’t know why, but I forgot about it and I saw it today, and there
were more photos than I saw then of the salad and of the preparation.
It just completely got me back about there’s a new salad. I remember
now, at the time when I got back and then, Helen made me the same
salad and I had it for the first time and everything just comes back
and that rain, I remember the rain. That car that we saw at the end,
I remember me taking my time driving and taking the photo because I
was very much shocked by the appearance of that car. I forgot about
Chapter 9. Field study of 4Streams 209
it completely, which was not a big deal; I do forget things a lot. But
now, it all came back; that drive to Stansted to pick them up was a
nightmare. It was Friday afternoon; I think it took me three hours to
get to Stansted that afternoon. I was trying all the roads and in the
end, I ended up taking a photo on the M25 of this funny car.”
System understanding
Different participants understood the system differently. F1 and F2 understood
the system as a visual communication tool between family members; therefore,
they were constantly trying to update their latest news and share what they were
doing with others. Moreover, they saw the system as a small-group photo sharing
application with the capability of awareness and comparison. F2 said about her
understanding about the system:
“I think it’s so interesting seeing photos that were taken at the same
time in different places, because it’s like a 3D life between friends. You
have one life that is recorded in photography as two dimensional. But
I think adding somebody else’s experience that is parallel to yours, it’s
almost like another dimension added to what you were doing at the
time for communication.”
F1 added that he sees the system as a platform for sharing artistic photos and
making a competition between family members who can take better photographs.
However, F2 said that she does not follow artistic photography and she just likes
to take photo snaps. F3, interpreted the system as a platform to review younger
family members and, then, she added some photos that she liked. She said that
she likes sharing photos of flowers because it makes her photo streams prettier
and, then, she can follow other streams’ stories.
Chapter 9. Field study of 4Streams 210
Children and socialisation
The four members of the family were not the only persons who used the system; the
children of F1 and F2 were fans of the application and commented on the photos.
Therefore, the application made the children socialise with other members of the
family. Also, the children liked to interact with the system; F2 said that her
daughter interacted with the system more than she did.
F1 said, regarding the children’s reaction:
“Janet would get very emotional. Especially the first two weeks, Janet
and I were alone and Helen and Katy were here and this was basically
the first time for a long time to be separate from Mum. I was there of
course and Granny is there, and she knows Granny and Grandpa very
well, and she has got all the confidence in them. But when she saw
Katy and Mum doing something there, she would be like, ‘I want to go
home’. She would become very emotional when she saw the pictures,
so Janet was reacting as well.”
Decoration tool
The digital ambient display was placed in the participants’ homes as a decoration
tool. In Country 1, the participants said that they placed the tablet on the dining
table and that it operated most of the time. In Country 2, the device was in
two places, the dining table and the the garden table where most family members
gathered.
F1 and F2 both liked to have the system as a digital photo frame at home. F1
liked the idea of having this system at home or even a bigger wall-mounted LCD
to view their photo streams. However, F2 was concerned about privacy issues. She
said that she does not like people other than family see their photos. Therefore,
she did not agree with a big screen. However, she said that she could hide the
Chapter 9. Field study of 4Streams 211
tablet or digital photo frame whenever she wanted. F3 liked to have the system
at home and look at it frequently. She said:
“I can spend the rest of my life just viewing these photos of my family,
so this is interesting and that is exactly what I want to have at home,
like a photo frame and see what children do.”
Facebook versus our system
In the family group, the participants used Facebook to share their photos. There-
fore, they were able to see what they shared via Facebook or our application.
The main platform for viewing photos in this group was our system. They rarely
used Facebook as the main platform for viewing their photos as most of the photo
privacy settings were set to be shared with 4Streams.
F2 said about sharing photos with Facebook:
“It was easy to upload photos through Facebook and send them to the
application.”
F1 said that this application can be used as an additional tool to Facebook. There-
fore, using Facebook and its privacy settings for sharing photos was a convenient
technique for F1 and F2. However, regarding the oldest member of the family, F1
said that using Facebook to share photos was not as easy as viewing photos via
the application. Hence, she did not share many photos. For the oldest member of
the family, the same as for other members, the intention was to view photos on
our system and not on Facebook.
The main reason that F1 and F2 decided to see their photos on our application
was that in our application they just could see the people they like and not other
bulky news from people they did not want to follow. Regarding this, F1 said:
Chapter 9. Field study of 4Streams 212
“You see on Facebook what people are sharing, but on one page you
see a video clip of the new pop singer, some fun stuff and then friends’
pictures. Even that friend is a remote friend and it’s a friend of a friend
and. . . In this application I see only photos...It’s so much stronger
because it’s people you do care about.”
Improvements
Family members suggested two areas of improvement for the system. The first one
was the problem of the Internet connection. During the study, F1 and F2 were in
Country 2, and they did not have access to the Internet all the time. Therefore, D2
did not receive all the photos uploaded by the other participants. The suggestion
was to design the system in a way to enable the retrieval of shared photos even
when the device is not operating.
The second improvement was to install the application on a smartphone so that
participants can be notifid about the latest visual status of each other wherever
they are. F2 said:
“(Install) for the mobile phone because I think this is how people like.
How much time do you spend at home during the day? I arrived when
you arrived (8 PM), if you think about that; what is my display during
the day? The phone.”
9.4 Trial 2: Friends group
9.4.1 Participants
In this trial, the participant group contained four close friends who were first year
Arts students at the University of Surrey. The reason to select close friends was
that in Phase 1 of the study we found that close friends are very keen in sharing
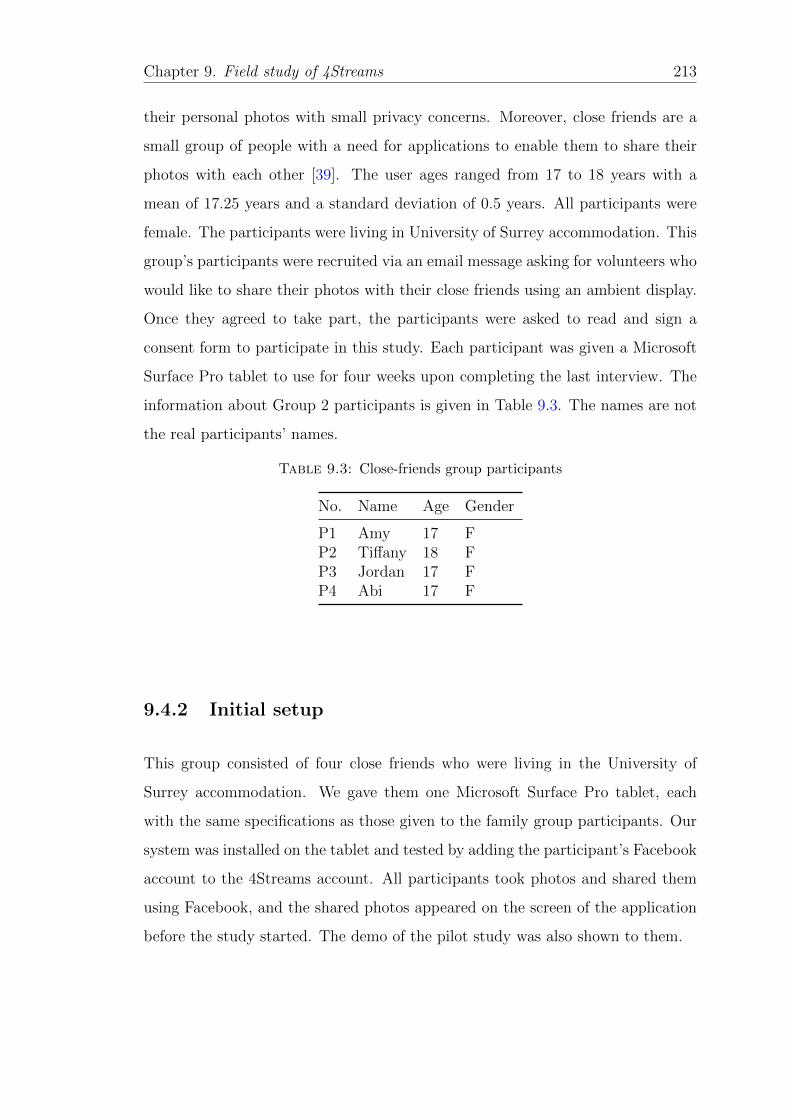
Chapter 9. Field study of 4Streams 213
their personal photos with small privacy concerns. Moreover, close friends are a
small group of people with a need for applications to enable them to share their
photos with each other [39]. The user ages ranged from 17 to 18 years with a
mean of 17.25 years and a standard deviation of 0.5 years. All participants were
female. The participants were living in University of Surrey accommodation. This
group’s participants were recruited via an email message asking for volunteers who
would like to share their photos with their close friends using an ambient display.
Once they agreed to take part, the participants were asked to read and sign a
consent form to participate in this study. Each participant was given a Microsoft
Surface Pro tablet to use for four weeks upon completing the last interview. The
information about Group 2 participants is given in Table 9.3. The names are not
the real participants’ names.
Table 9.3: Close-friends group participants
No. Name Age Gender
P1 Amy 17 FP2 Tiffany 18 FP3 Jordan 17 FP4 Abi 17 F
9.4.2 Initial setup
This group consisted of four close friends who were living in the University of
Surrey accommodation. We gave them one Microsoft Surface Pro tablet, each
with the same specifications as those given to the family group participants. Our
system was installed on the tablet and tested by adding the participant’s Facebook
account to the 4Streams account. All participants took photos and shared them
using Facebook, and the shared photos appeared on the screen of the application
before the study started. The demo of the pilot study was also shown to them.
Chapter 9. Field study of 4Streams 214
The participants were asked to share their photos and set their privacy settings
using the same techniques described for the family group in Section 9.2.2. The
study lasted for four weeks.
In this trial, the same data collection and analysis methodology used in Trial 1
was used, and the results are shown in the next section.
9.4.3 Results
This section deals with the results of the qualitative and quantitative analysis.
First, we start with the current practice of the participants’ photography. Then,
we analyse and present the quantitative data extracted from the interaction logs.
Finally, the user experience of the participants within 4Streams is described.
Current practice of photography
Capturing For this group, who took a lot of photos, the camera phone was their
main or only capture device. We asked them, on average, how much and how often
they take a photo. P4 said:
“Quite a lot. If there is a reason we will. Last night we went to an
event and I personally took around 50 pictures of that event.”
The participants in this group just used their camera phones as well as features
such as photo filtering to capture and edit their photos. P3 said:
“We take our photos on our phones and then upload them...We use
filter options too.”
Storing The main repositories of photo collections for members of the friends
group were their camera phones. They said that whenever they need space on
their phones, or when they buy a new phone, they add their photos to a physical
Chapter 9. Field study of 4Streams 215
memory. They also saved photos they received from other people via Viber and
Whatsapp on their phones. They considered their Facebook tagged photos as
their own photos and Facebook was a cloud base of the photos others took of
them. However, they never used cloud services such as Google+, Dropbox or
Flickr to store and keep their photos.
Sharing In the close friends group the scenario for photo sharing was very dif-
ferent compared to the family group; they used social networks, mainly Facebook
and Instagram, for photo sharing to communicate with their friends and for self-
presentation; they mentioned that Viber and Whatsapp applications are used for
sharing their private photos or funny photos from other sources.
Interestingly, the privacy issues for photo sharing between the friends group and
the family group were significantly different. Family members did not like to share
private photos via Facebook, so that nobody, apart from family members, could
see their photos. In the friends group, however, the main concern was that they
did not want their family members, such as their grandmother, to see their photos;
they did not mind sharing some photos of partying and going out in public. P1
said:
“All the photos that I uploaded I do not mind if people see them.”
P2 said:
“Sometimes Facebook is so public. If you have family members there,
like your grandmother, to see your photos and you can’t specify who
can see your photos.”
Structure of the friends group
Unlike the family group, the friends group’s structure did not vary during the
four weeks of the study. P2 was away for a weekend to visit her hometown for a
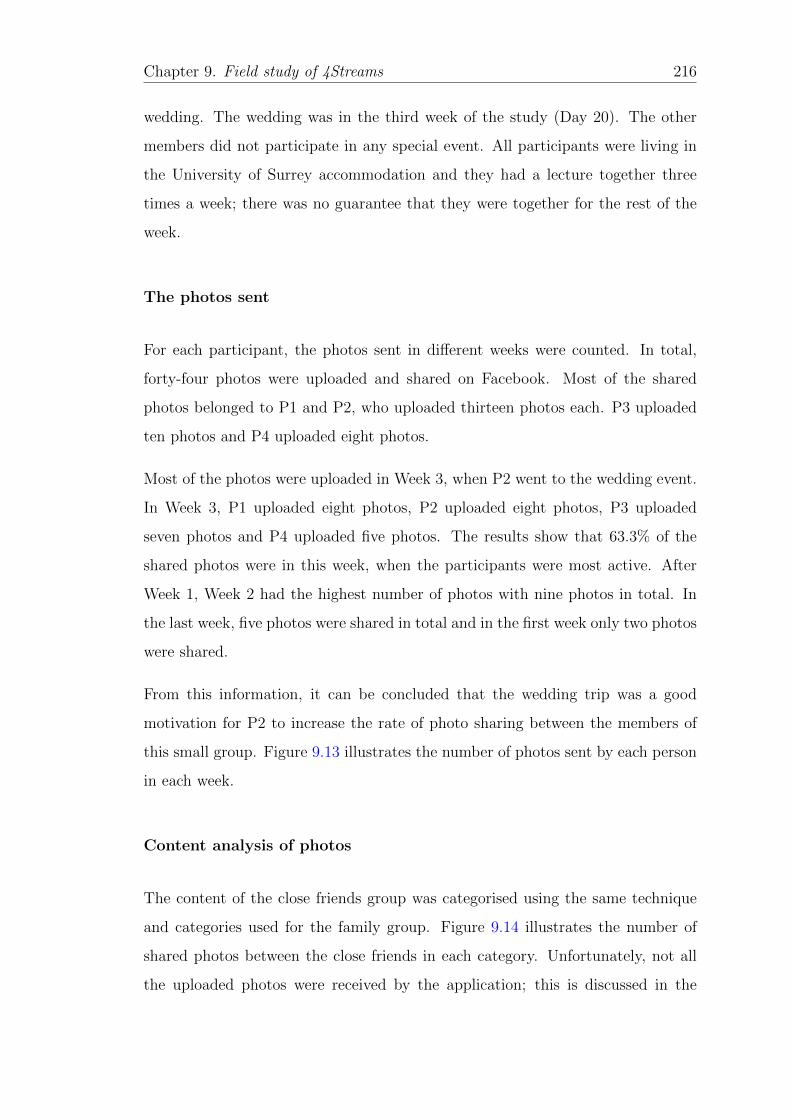
Chapter 9. Field study of 4Streams 216
wedding. The wedding was in the third week of the study (Day 20). The other
members did not participate in any special event. All participants were living in
the University of Surrey accommodation and they had a lecture together three
times a week; there was no guarantee that they were together for the rest of the
week.
The photos sent
For each participant, the photos sent in different weeks were counted. In total,
forty-four photos were uploaded and shared on Facebook. Most of the shared
photos belonged to P1 and P2, who uploaded thirteen photos each. P3 uploaded
ten photos and P4 uploaded eight photos.
Most of the photos were uploaded in Week 3, when P2 went to the wedding event.
In Week 3, P1 uploaded eight photos, P2 uploaded eight photos, P3 uploaded
seven photos and P4 uploaded five photos. The results show that 63.3% of the
shared photos were in this week, when the participants were most active. After
Week 1, Week 2 had the highest number of photos with nine photos in total. In
the last week, five photos were shared in total and in the first week only two photos
were shared.
From this information, it can be concluded that the wedding trip was a good
motivation for P2 to increase the rate of photo sharing between the members of
this small group. Figure 9.13 illustrates the number of photos sent by each person
in each week.
Content analysis of photos
The content of the close friends group was categorised using the same technique
and categories used for the family group. Figure 9.14 illustrates the number of
shared photos between the close friends in each category. Unfortunately, not all
the uploaded photos were received by the application; this is discussed in the
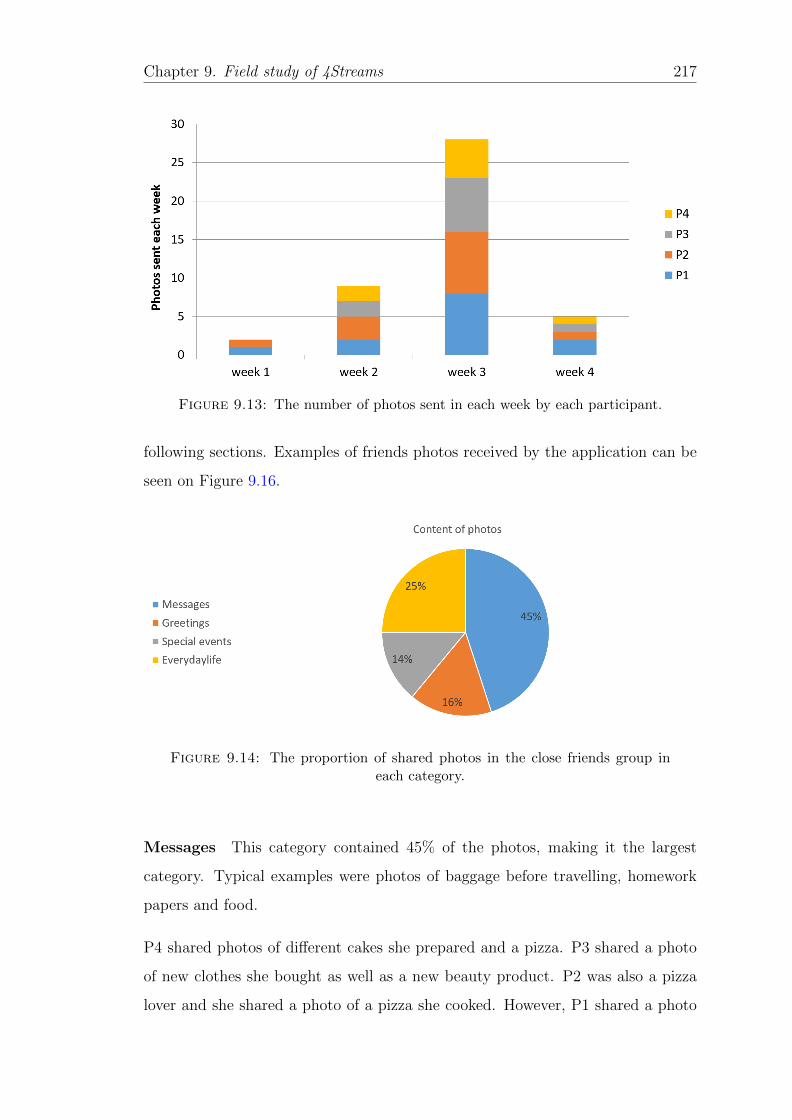
Chapter 9. Field study of 4Streams 217
Figure 9.13: The number of photos sent in each week by each participant.
following sections. Examples of friends photos received by the application can be
seen on Figure 9.16.
Figure 9.14: The proportion of shared photos in the close friends group ineach category.
Messages This category contained 45% of the photos, making it the largest
category. Typical examples were photos of baggage before travelling, homework
papers and food.
P4 shared photos of different cakes she prepared and a pizza. P3 shared a photo
of new clothes she bought as well as a new beauty product. P2 was also a pizza
lover and she shared a photo of a pizza she cooked. However, P1 shared a photo
Chapter 9. Field study of 4Streams 218
of a landscape with a written message describing her current status, using other
photo capturing applications.
Greetings The proportion of photos in this category was 16%. It typically
contained photos of people posing for their friends; for example, P1 took photos
of their mutual friends. All participants, except P4, took a selfie, which can be
placed in this category. P3 shared a photo with her mother and P2 shared a photo
with her hometown friends.
Everyday life The second largest category was that of photos taken from the
everyday life of the participants and comprised 25% of the photos. Examples are
photos of the home environment of the participants. For example, P2 shared a
photo when she went out with friends and P1 shared a photo when she was with
other friends in university. Most of the photos in this category were taken when
the participants were with their friends in university communal areas and lectures.
Special events Special events was the smallest category, with 14% of the photos.
This category included photos of special events such as a wedding event for P2 and
parties other participants went to. P1 also shared a photo of a visit to London.
Privacy settings for photo sharing
The same choices of privacy settings, similar to those of the family group, were
available to this group. However, the participants in this group added another
privacy setting to the study, which we did not predict. They shared some of their
photos publicly.
The participants shared twenty-one out of forty-four photos (48%) with all their
Facebook friends, which shows that most of the time people in this age range had
Facebook on their mind and they wanted to notify all their Facebook friends about
their activities. The contents of the photos they shared with this privacy setting
were from all categories.
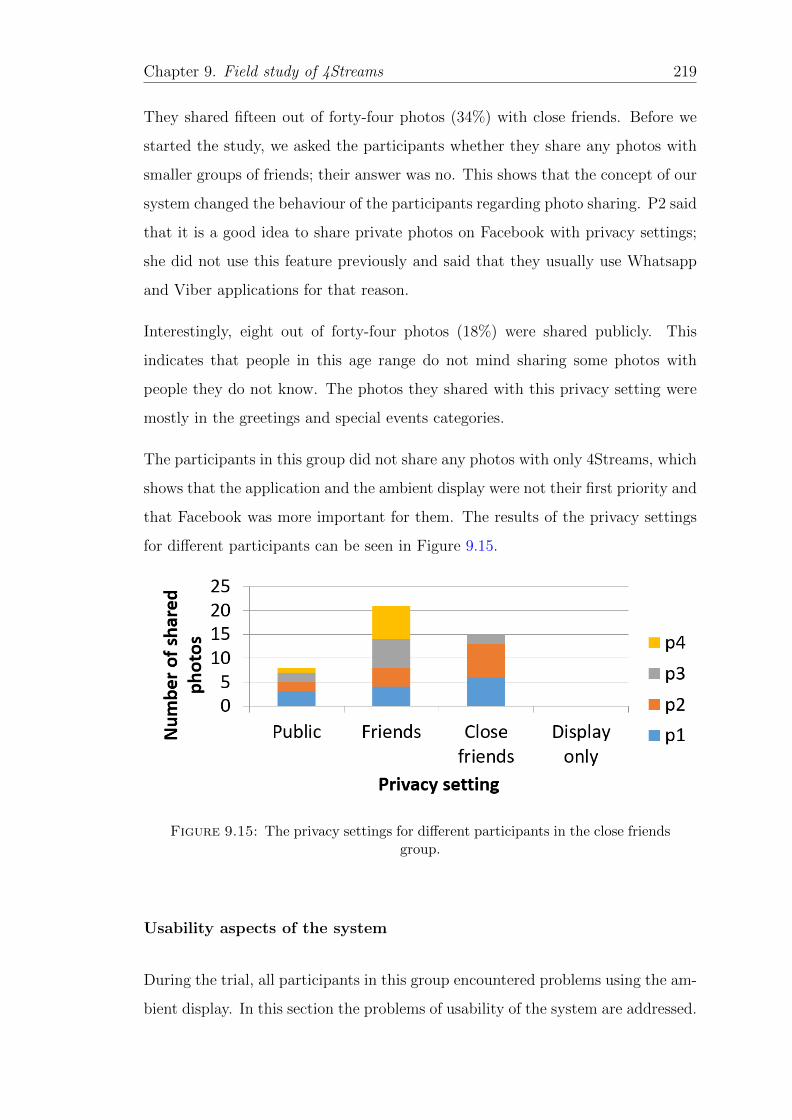
Chapter 9. Field study of 4Streams 219
They shared fifteen out of forty-four photos (34%) with close friends. Before we
started the study, we asked the participants whether they share any photos with
smaller groups of friends; their answer was no. This shows that the concept of our
system changed the behaviour of the participants regarding photo sharing. P2 said
that it is a good idea to share private photos on Facebook with privacy settings;
she did not use this feature previously and said that they usually use Whatsapp
and Viber applications for that reason.
Interestingly, eight out of forty-four photos (18%) were shared publicly. This
indicates that people in this age range do not mind sharing some photos with
people they do not know. The photos they shared with this privacy setting were
mostly in the greetings and special events categories.
The participants in this group did not share any photos with only 4Streams, which
shows that the application and the ambient display were not their first priority and
that Facebook was more important for them. The results of the privacy settings
for different participants can be seen in Figure 9.15.
Figure 9.15: The privacy settings for different participants in the close friendsgroup.
Usability aspects of the system
During the trial, all participants in this group encountered problems using the am-
bient display. In this section the problems of usability of the system are addressed.
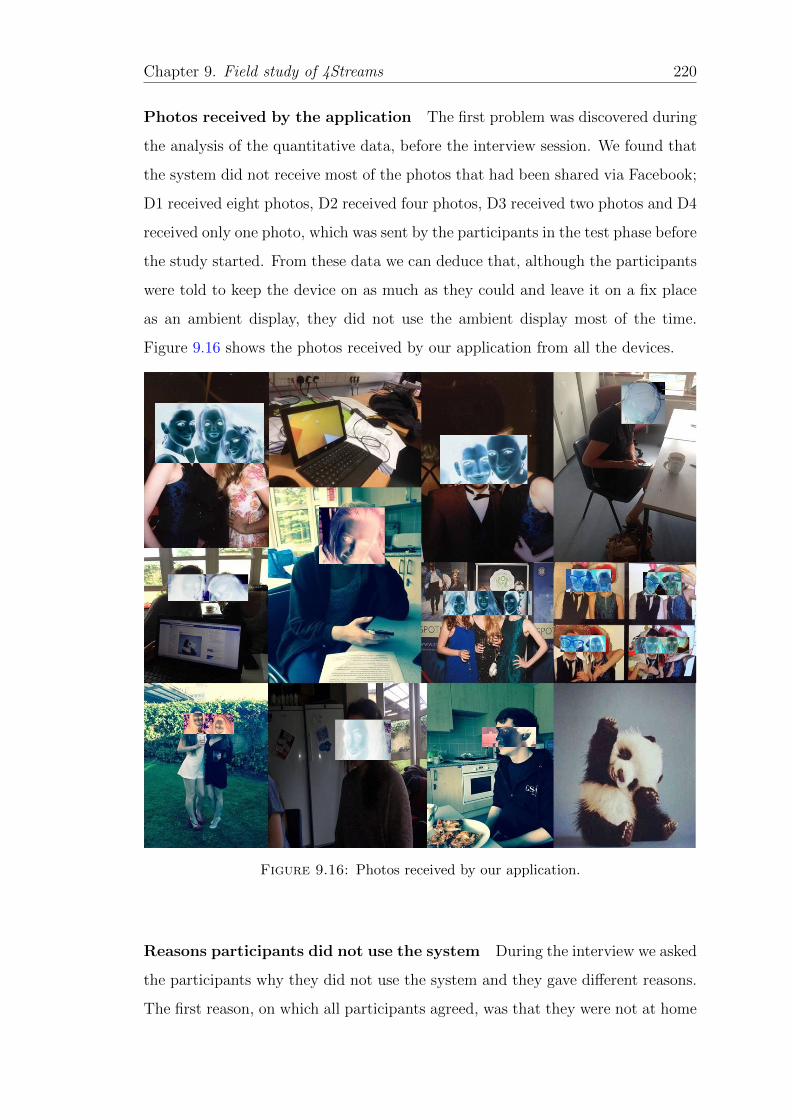
Chapter 9. Field study of 4Streams 220
Photos received by the application The first problem was discovered during
the analysis of the quantitative data, before the interview session. We found that
the system did not receive most of the photos that had been shared via Facebook;
D1 received eight photos, D2 received four photos, D3 received two photos and D4
received only one photo, which was sent by the participants in the test phase before
the study started. From these data we can deduce that, although the participants
were told to keep the device on as much as they could and leave it on a fix place
as an ambient display, they did not use the ambient display most of the time.
Figure 9.16 shows the photos received by our application from all the devices.
Figure 9.16: Photos received by our application.
Reasons participants did not use the system During the interview we asked
the participants why they did not use the system and they gave different reasons.
The first reason, on which all participants agreed, was that they were not at home
Chapter 9. Field study of 4Streams 221
all the time and, therefore, they could not leave the device on all the time at home;
they also had fears about security and safety. P1 also said that the desk in the
university accommodation is too small and she could not leave the display on all
the time there.
One of the main reasons was that they did not share any photos with only 4Streams
and they were getting notifications from Facebook before they used the ambient
display. Hence, they were viewing photos from Facebook rather than our applica-
tion. It can be concluded from this part that Facebook was the participants’ main
platform for photo sharing rather than our application.
The other complaint was that four weeks is a short period of time and P3 said:
“I can’t take photos for the sake of taking photos, I need better reasons”
P1 said:
“We didn’t do photo sharing so much when we were here because we
are close friends and see each at least three times in a week.”
During the study, however, they shared a reasonable number of photos, thus dis-
carding this reason for not using the display.
All participants had unlimited Wi-Fi in their accommodation; however, they de-
cided not to use the system as we described and, instead, they used Facebook for
their photo sharing platform. P1 suggested that she liked to use our system with
her family but not with close friends because she wanted to see her family photos
in the frame when she was away from them and friends cannot be good users for
this system. As a result, it can be said that 4Streams, as an ambient display, did
not fit to the close friends group, in contrast to the family group.
Improvements The first improvement the participants suggested was to not
leave the privacy issue to the participants and instead, to set it with the device
because Facebook privacy settings are not user friendly. P4 said:
Chapter 9. Field study of 4Streams 222
“The worse thing was that we tended to see it on Facebook before we
look at it on tablet. The privacy setting with only the display would
push us to use the display more.”
Another point to improve the system was to design the system in a way to be
with the users all the time, such as implementing 4Streams on a mobile phone
application. P3 said:
“Possibly it was better to have it with us all the time, whereas the
tablet was just in our room so in our Facebook we would see them
quicker before we actually saw them in the tablet.”
Another improvement they mentioned was to design the system in a way to retrieve
old photos whenever they opened the device because they would not like to keep
the system on all the time. P4 said:
“I do not want to have the system on all the time, better to open it
sometimes and see the photos.”
The participants also suggested adding captions to describe more details about a
photo, or to add a voice message as an attachment to a photo to describe it better.
The other medium they were interested in was video. P2 said:
“You could not text at the same time so you sort of made handwriting
photos note on them...Adding audio to the photo is a very good idea
and we would love that (voice message)... we also liked to send videos.”
Finally, the participants suggested creating a different upload interface rather than
Facebook, mostly because the Facebook privacy settings were not easy for them
to use and they might also upload photos such as profile photos that they did not
want to send to the display. P1 said:
Chapter 9. Field study of 4Streams 223
“Having profile picture of Facebook is like showing off to friends like
I am so pretty. Not a good idea to have it there (on the display)....I
would like an option to upload photos into the device rather than
Facebook.”
9.5 Trial 3: Workplace group
9.5.1 Participants
The third group was five colleagues who were working in the same office in the
Department of Electronics at the University of Surrey. There were two reasons to
select this workplace group. Firstly, in the pilot study of Phase 3, the structure of
our participants were colleagues and the experiment showed a high level of interest
between participants for photo sharing using our application. Secondly, we wanted
to evaluate the collocated nature of our display. The participants had worked in
the same office for six months; P1 and P2 were friends and they socialised out of
the office but the rest of the participants did not socialise out of the workplace.
P1 and P2 were PhD students while P3, P4 and P5 were research assistants. All
participants were male and aged between 27 and 40 years old with a mean age of
32 years and a standard deviation of 5.2 years. All participants had been living
in the United Kingdom in the preceding five years.
The participants of this group were recruited by email. The email, which was sent
to people working in the Department of Electronics, asked for volunteers for the
study; those who wanted to volunteer should work in the same office and should
also be willing to share their photos on a display which placed in their office. Once
they agreed, the participants read and signed a consent form to participate in the
study. The participants were given a gift after the interview as an appreciation of
their time and support. Information about the workplace group’s participants is
given in Table 9.4. The names are not the real participants’ names.
Chapter 9. Field study of 4Streams 224
Table 9.4: Workplace group participants
No. Name Age Gender
P1 Alexandro 27 MP2 Pepe 28 MP3 Socrates 38 MP4 Alan 39 MP5 Harry 28 M
9.5.2 Initial setup
As mentioned earlier, the workplace group consisted of five colleagues working in
the same office situated in the Electronics Department of the University of Surrey.
We provided a 42-inch touchscreen monitor and placed it in a free space on a
desk in the office. We asked the participants where they would like to leave the
screen and they decided to leave it close to the coffee machine to provide social
interaction while they are drinking coffee. Moreover, the screen was close to the
main door and, therefore, other people could see the photos from our participants.
The application was installed on a laptop and the laptop was connected to the
LCD monitor via a USB port for touchscreen connectivity and an HDMI port for
screen mirroring. The laptop was hidden under the monitor. The laptop had 2 GB
of RAM, the processor was Intel GMA X3100, the operating system was Windows
Vista and the physical memory capacity was 160 GB.
The participants were instructed in detail how to use the system, the same as the
other groups. The application was tested before starting the trial for each partici-
pant and the privacy setting options were described for uploading and sharing the
photos via Facebook. The participants were advised that if they did not want to
share a photo with the device, they just needed to exclude our application during
the sharing process. The difference in the setup of this group compared to the
other groups was that they used a 42-inch screen in one place rather than the
Microsoft Surface Pro tablets in different places. Moreover, the participants were
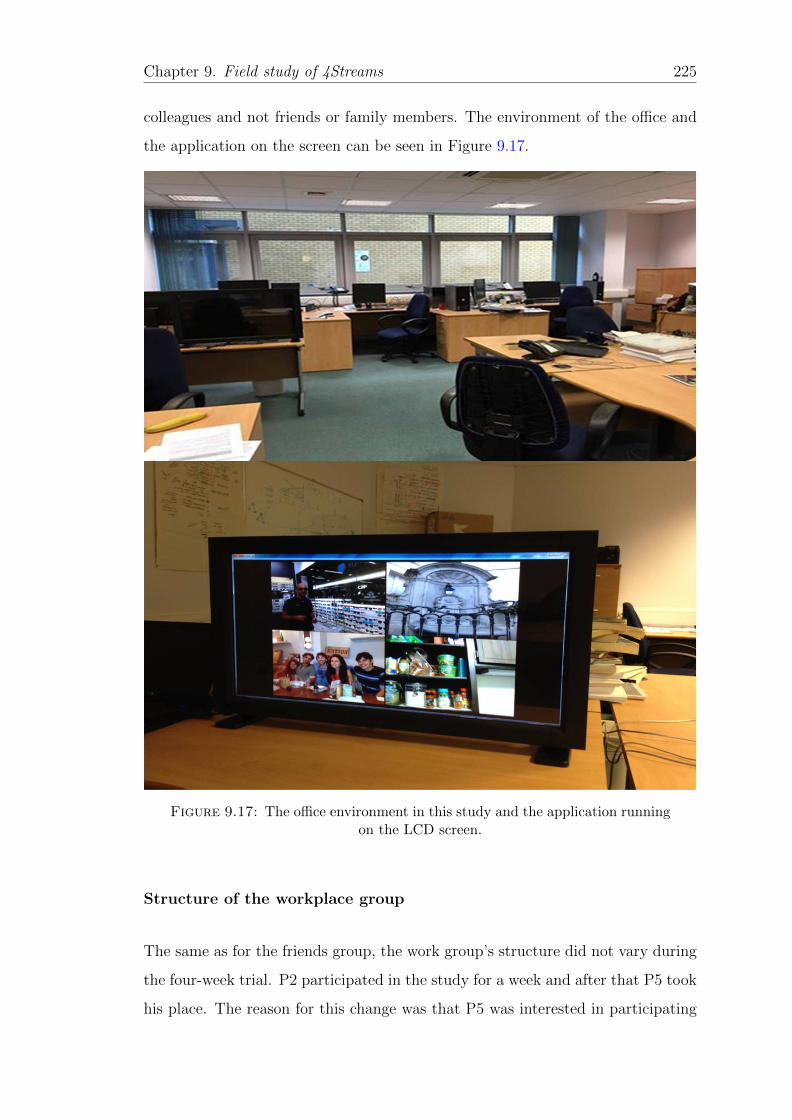
Chapter 9. Field study of 4Streams 225
colleagues and not friends or family members. The environment of the office and
the application on the screen can be seen in Figure 9.17.
Figure 9.17: The office environment in this study and the application runningon the LCD screen.
Structure of the workplace group
The same as for the friends group, the work group’s structure did not vary during
the four-week trial. P2 participated in the study for a week and after that P5 took
his place. The reason for this change was that P5 was interested in participating
Chapter 9. Field study of 4Streams 226
and P2 was too busy during the trial. However, we used both of the participants’
experiences during the interview. During the trial, P1 and P2 went to the same
party, while P3 and P4 were at another event together. P3 and P5 had short
trips and shared photos of those trips. Most of the time, the participants were in
Guildford, United Kingdom.
In this trial, the same data collection and analysis was used as in Trial 1 and the
results are shown in the next section.
9.5.3 Results
This section deals with the results of the qualitative and quantitative analysis.
First, we start with the current practice of participants’ photography. Next, we
analyse and present the quantitative data extracted from the interaction logs.
Finally, the user experience of the participants within 4Streams is described.
Current practice of photography
Capturing Similarly to other groups, in the workplace group the participants’
dominant capture device was their camera phone. Just one of them (P3) used
a point-and-shoot camera and mentioned that his camera phone was his main
capture device. However, he complained about the quality of the camera phone
photos, but his phone was three years older than the other participants’ phones.
He said:
“So almost everything I share I take with my phone, but I do take
other photos with my camera, which are better quality normally and
less kind of instant.”
Storing Participants in this group used several places to store their photos. P1
kept all his photos on his phone’s physical memory, also backing up the photos
Chapter 9. Field study of 4Streams 227
using Dropbox Cloud. P3 used the Amazon server and the rest stored their photos
on their physical memory.
Sharing The workplace group participants used common photo sharing appli-
cations such as email, Viber, Whatsapp, Dropbox and Facebook, but their main
photo sharing application was Facebook; they mentioned that they share photos
with their group and friends mostly using Facebook. P4 said:“’I would say Face-
book is dominant.”. However they added that for more private photos they use
Dropbox. The participants in this group were not interested in instant messaging
services such as Whatsapp or Viber and they did not use them very often. S3
said: ”I’m not cool enough for anything (other applications for photo sharing)
apart from Facebook.”
The photos sent
In this trial, for each participant, the photos sent in during the four weeks were
counted. In total, forty-five photos were uploaded and shared on Facebook. Most
of them belonged to P3, who shared twenty-six out of forty-five photos. P4 shared
nine photos, while P5 shared five photos. P1 and P2 shared four and two photos,
respectively.
Most of the uploaded photos belonged to Week 3, when fourteen photos were
shared. However, the number of shared photos in Week 1 and Week 2, namely
twelve photos for each week, was not too different from the number of photos
shared in Week 3. The fourth week had the fewest shared photos, seven photos.
The number of shared photos in each week shows that, unlike the other groups,
the participants in this trial were similarly active in the first three weeks and the
last week of the trial, and in the first week the momentum for being active in photo
sharing decreased (see Figure 9.18). The results also show that twenty-eight out
of forty-five (62.2%) photos were shared during weekends. From this information
it can be concluded that the weekend was the most convenient time for colleagues
to share their photos. Regarding the weekend, P3 said:
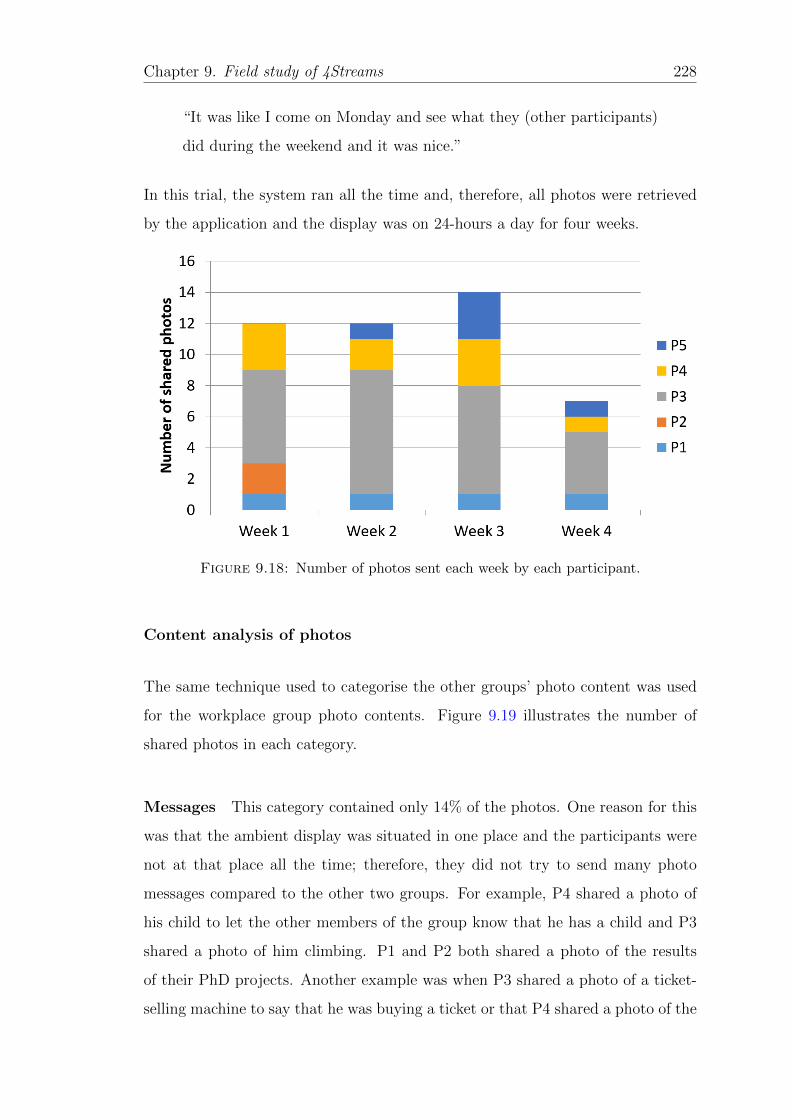
Chapter 9. Field study of 4Streams 228
“It was like I come on Monday and see what they (other participants)
did during the weekend and it was nice.”
In this trial, the system ran all the time and, therefore, all photos were retrieved
by the application and the display was on 24-hours a day for four weeks.
Figure 9.18: Number of photos sent each week by each participant.
Content analysis of photos
The same technique used to categorise the other groups’ photo content was used
for the workplace group photo contents. Figure 9.19 illustrates the number of
shared photos in each category.
Messages This category contained only 14% of the photos. One reason for this
was that the ambient display was situated in one place and the participants were
not at that place all the time; therefore, they did not try to send many photo
messages compared to the other two groups. For example, P4 shared a photo of
his child to let the other members of the group know that he has a child and P3
shared a photo of him climbing. P1 and P2 both shared a photo of the results
of their PhD projects. Another example was when P3 shared a photo of a ticket-
selling machine to say that he was buying a ticket or that P4 shared a photo of the
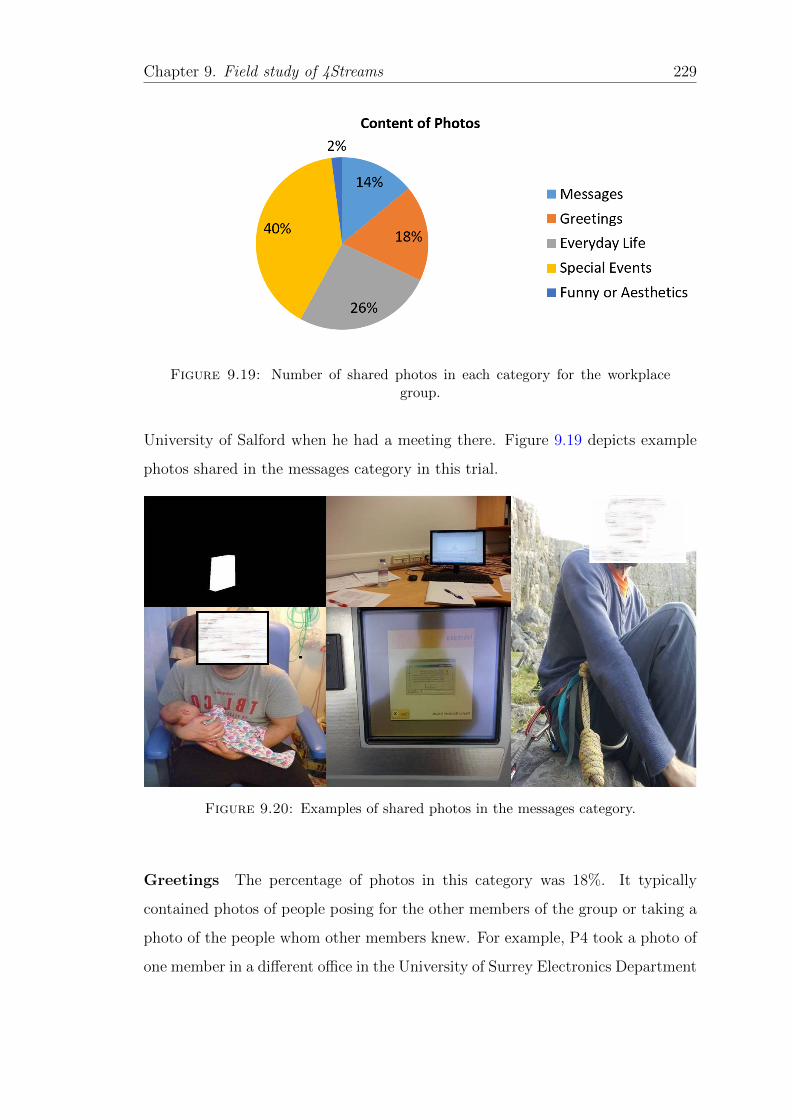
Chapter 9. Field study of 4Streams 229
Figure 9.19: Number of shared photos in each category for the workplacegroup.
University of Salford when he had a meeting there. Figure 9.19 depicts example
photos shared in the messages category in this trial.
Figure 9.20: Examples of shared photos in the messages category.
Greetings The percentage of photos in this category was 18%. It typically
contained photos of people posing for the other members of the group or taking a
photo of the people whom other members knew. For example, P4 took a photo of
one member in a different office in the University of Surrey Electronics Department
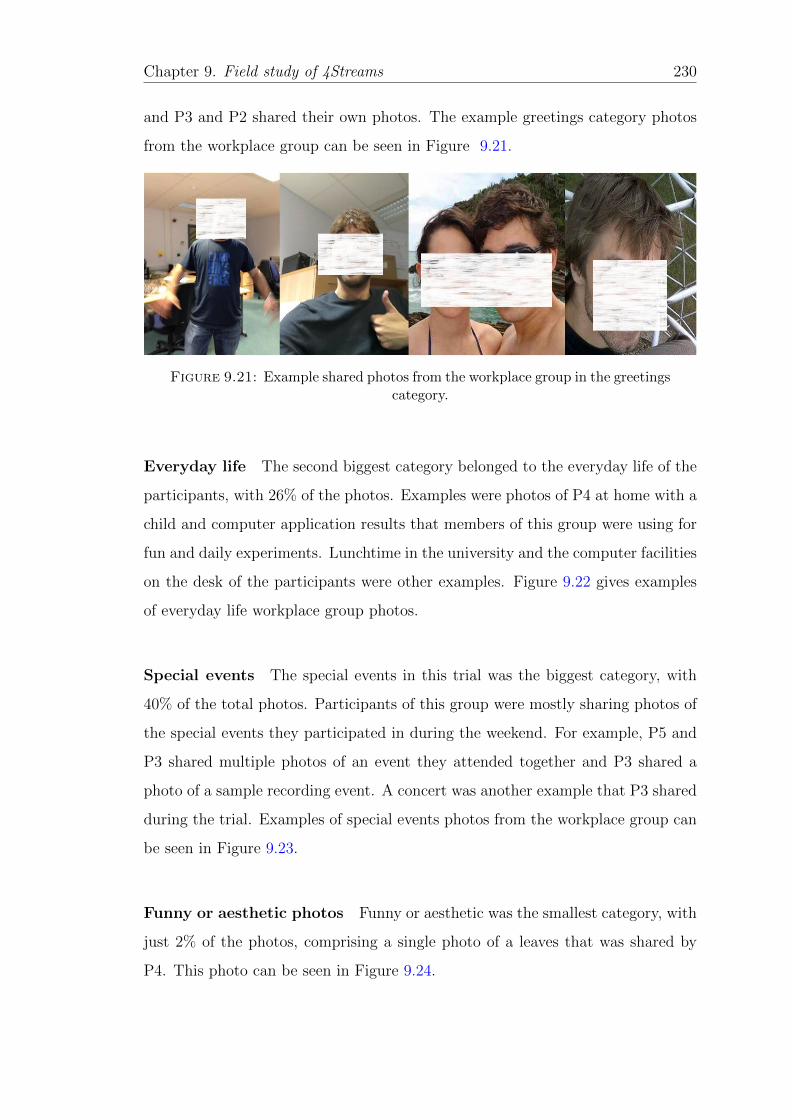
Chapter 9. Field study of 4Streams 230
and P3 and P2 shared their own photos. The example greetings category photos
from the workplace group can be seen in Figure 9.21.
Figure 9.21: Example shared photos from the workplace group in the greetingscategory.
Everyday life The second biggest category belonged to the everyday life of the
participants, with 26% of the photos. Examples were photos of P4 at home with a
child and computer application results that members of this group were using for
fun and daily experiments. Lunchtime in the university and the computer facilities
on the desk of the participants were other examples. Figure 9.22 gives examples
of everyday life workplace group photos.
Special events The special events in this trial was the biggest category, with
40% of the total photos. Participants of this group were mostly sharing photos of
the special events they participated in during the weekend. For example, P5 and
P3 shared multiple photos of an event they attended together and P3 shared a
photo of a sample recording event. A concert was another example that P3 shared
during the trial. Examples of special events photos from the workplace group can
be seen in Figure 9.23.
Funny or aesthetic photos Funny or aesthetic was the smallest category, with
just 2% of the photos, comprising a single photo of a leaves that was shared by
P4. This photo can be seen in Figure 9.24.
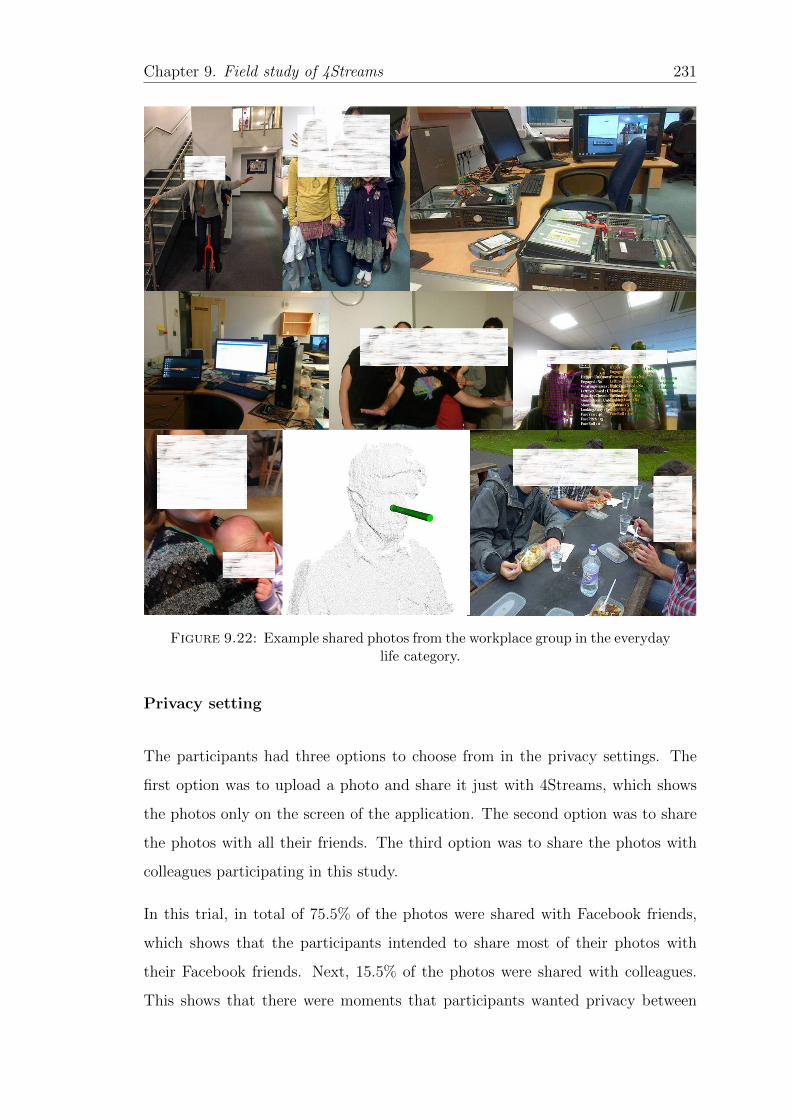
Chapter 9. Field study of 4Streams 231
Figure 9.22: Example shared photos from the workplace group in the everydaylife category.
Privacy setting
The participants had three options to choose from in the privacy settings. The
first option was to upload a photo and share it just with 4Streams, which shows
the photos only on the screen of the application. The second option was to share
the photos with all their friends. The third option was to share the photos with
colleagues participating in this study.
In this trial, in total of 75.5% of the photos were shared with Facebook friends,
which shows that the participants intended to share most of their photos with
their Facebook friends. Next, 15.5% of the photos were shared with colleagues.
This shows that there were moments that participants wanted privacy between
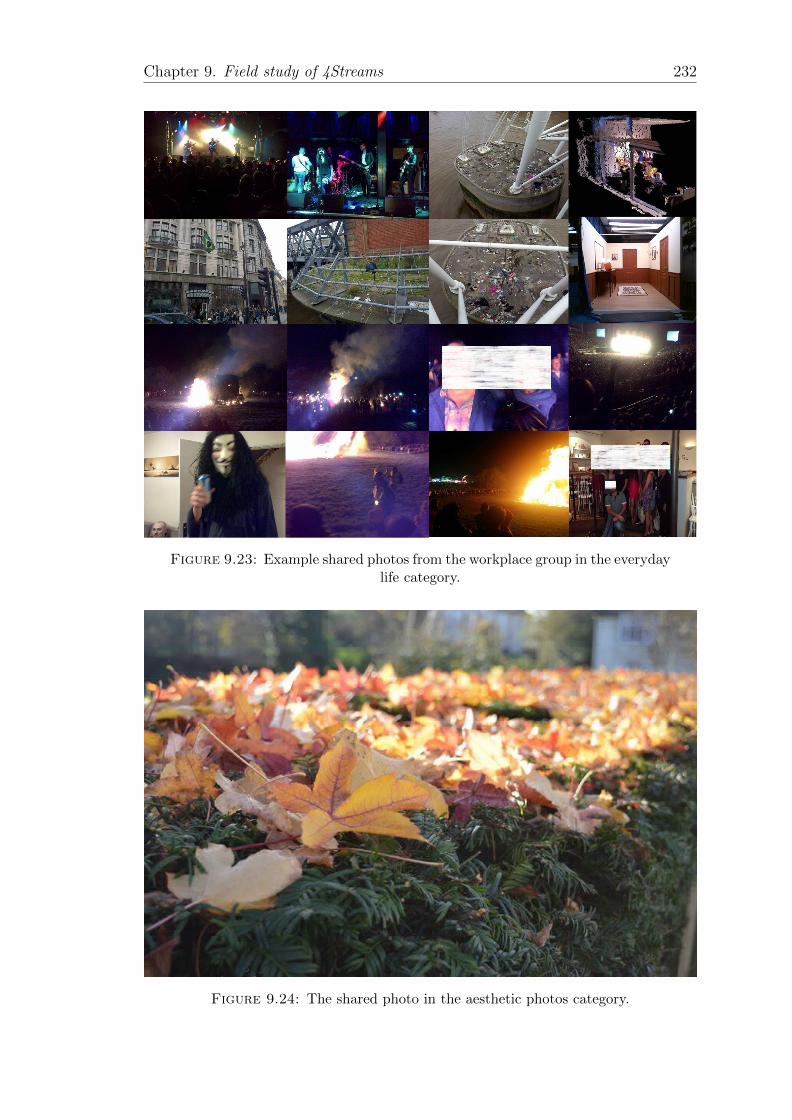
Chapter 9. Field study of 4Streams 232
Figure 9.23: Example shared photos from the workplace group in the everydaylife category.
Figure 9.24: The shared photo in the aesthetic photos category.
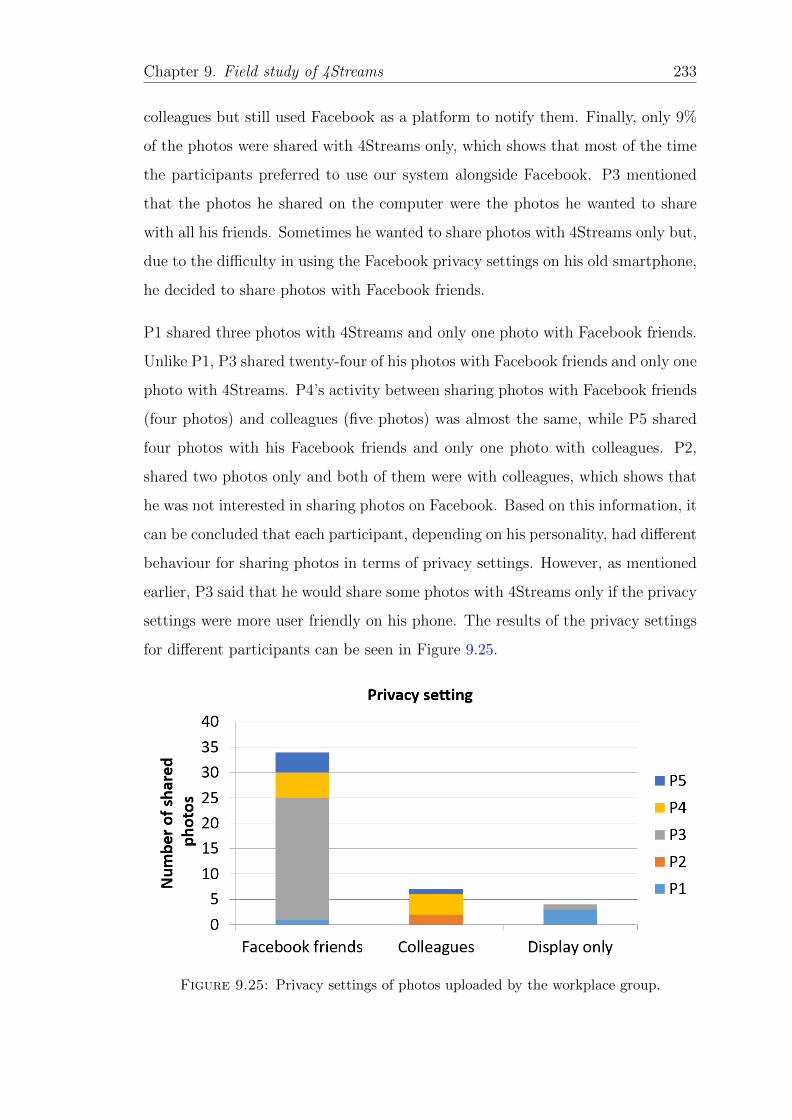
Chapter 9. Field study of 4Streams 233
colleagues but still used Facebook as a platform to notify them. Finally, only 9%
of the photos were shared with 4Streams only, which shows that most of the time
the participants preferred to use our system alongside Facebook. P3 mentioned
that the photos he shared on the computer were the photos he wanted to share
with all his friends. Sometimes he wanted to share photos with 4Streams only but,
due to the difficulty in using the Facebook privacy settings on his old smartphone,
he decided to share photos with Facebook friends.
P1 shared three photos with 4Streams and only one photo with Facebook friends.
Unlike P1, P3 shared twenty-four of his photos with Facebook friends and only one
photo with 4Streams. P4’s activity between sharing photos with Facebook friends
(four photos) and colleagues (five photos) was almost the same, while P5 shared
four photos with his Facebook friends and only one photo with colleagues. P2,
shared two photos only and both of them were with colleagues, which shows that
he was not interested in sharing photos on Facebook. Based on this information, it
can be concluded that each participant, depending on his personality, had different
behaviour for sharing photos in terms of privacy settings. However, as mentioned
earlier, P3 said that he would share some photos with 4Streams only if the privacy
settings were more user friendly on his phone. The results of the privacy settings
for different participants can be seen in Figure 9.25.
Figure 9.25: Privacy settings of photos uploaded by the workplace group.
Chapter 9. Field study of 4Streams 234
Interaction with the system
The users were able to interact with the system. Whenever a user ran the appli-
cation, four slideshow windows appeared. Photos taken and shared by each of the
participants appear on their designated slideshow windows. Setup mode appears
on the screen when touching any of those slideshow windows. In the setup mode,
the user was able to use the timeline to browse the photo streams. In addition, the
user was able to play or play back the slideshow to view the photos from multiple
users in time order. There was a vertical slider that enabled the user to choose
the speed of the slideshow. In this section, the user interactions with the system
are presented.
Full screen and setup mode The display was in full screen mode for a total
of 671.7 hours. In the first week, the display was in this mode for 167.95 hours. In
Week 2, the time the display was on full screen mode decreased to 167.94 hours.
In Week 3, the system was in full screen mode for 167.9 hours. In the last week,
the full screen mode usage rose up to 167.92 hours.
The system was in setup mode for 17.4 minutes overall. In the first week, partici-
pants used the setup mode for 3 minutes and in Week 2 they used the setup mode
for 3.6 minutes. In the third week, the setup mode was used for 6 minutes and in
the last week the setup mode usage was 4.8 minutes.
Based on this data, it can be concluded that, in the first week the participants
were mostly focussing on full screen mode and following that week, as the number
of taken photos increased, the number of minutes the system was in setup mode
increased. In the third week, the participants used the setup mode to review
their uploaded photos and, after that, in Week 4, although the number of photos
increased slightly, the participants used the setup mode less than in the third week.
However, due to the number of uploaded photos, the setup mode usage in Week 4
was more than in the first two weeks.
Chapter 9. Field study of 4Streams 235
Single-window slideshow The single-window slideshow was designed to en-
able the participants to view a single person’s photo stream. Nevertheless, the
participants did not use the single-window slideshow to review a single person’s
photo stream. The logs of the system showed that the system went to single-
window slideshow just a few times. During the interviews, most of the participants
mentioned that this happenned by mistake or curiosity of learning the system’s
features. In this group, they did not use the single-window slideshow to view the
photos in bigger size, as the photos were big enough to be viewed on the screen.
Speed of the slideshow Interestingly, from the logs of the system it was found
that the participants did not even try to change the speed of the slideshow and
they used the default slideshow speed; the base of the logarithm for the logarithmic
transition was 2. P4 said, and other participants also admitted, that:
“It (speed of the slideshow) was fine just to play and it was going on...
Just the default was OK.”
Live visual status during the week
During the weekdays the participants shared 37.8% of the shared photos. Not all
of the participants were in the office all the time; they had different uncoordinated
break times. Therefore, the participants shared photos of new things happening
in the office. For example, P4 and P5 took photos of an officemate who was
riding a one-wheel cycle in the office environment in order to notify P1 and P2
later about what was happening in the office. P3 took a photo of P2’s supervisor
with his children in order to notify him later that he was there. The participants
also shared many photos of their work software applications in order to update
others of their latest research results. Another example was when P4 went to
the University of Salford and updated his colleagues about it by sharing a photo
showing the university main building. The participants were mostly using this tool
during the week to update each other about work and they said that the photos
Chapter 9. Field study of 4Streams 236
they shared during the week were mostly for colleagues and they would not share
those photos with other groups such as family. P4 said:
“I think I shared some photos specifically knowing that they would be
up on the screen in the office. So when I went to a project meeting
in Salford I shared a picture of the University of Salford’s logo, which,
you know, I would have walked normally. But it was kind of different
way of communicating with the people in the office....I would not sent
the Salford logo to mama.”
Weekend news-teller
During the weekends the participants went home and had their own leisure time.
As we mentioned earlier, 62.2% of the photos were shared during the weekend.
Meanwhile, the participants were taking photos and sharing them on Facebook.
However, other participants were not at the office to see the photos live. Moreover,
not all participants were checking their Facebook frequently to see all the shared
photos. They confessed that they sometimes saw some photos on Facebook before
seeing them on the display. The participants gathered on Monday and saw what
had happened during the weekend. P1 said:
“I liked to see what other colleagues are doing when I was not with
them. So I can, for example, come on Monday and see what they did
during the weekend or something like this and it was nice.”
P3 also said:
“Well, I was more interested in seeing the new picture rather than the
old one as I told you before just on Monday to see what was happening
in the weekend or something like this.”
Chapter 9. Field study of 4Streams 237
Getting to know others
In this trial for the workplace group, all the members were not well acquainted
with the social context outside work. For example, P1 and P2 were friends and
P3 and P5 sometimes went out with their other colleagues. P4 had joined the
workplace recently, whereas others had worked there together for long time.
Visualising and sharing the multiple photo streams provided opportunities for the
photographers to introduce information about themselves as well as an opportunity
for social probing. P2 said during the interview:
“I could know others better in the office. For instance, P4’s daughter, I
could see her and I did not know Alan has a daughter or he is married
which lead to knowing Alan and his life better. Actually this made us
know each other better.”
P1 also said:
“I did not know P4 well and we were talking rarely. With the display
our conversations increased and we knew more about each other and
we knew what was happening between us during the weekends. This
was a good start to know new people more in depth in this office.”
4Streams as a conversational tool
Situating the display in the office to let the colleagues share their photos in a semi-
social environment provided a significant conversational environment in the office.
The nature of this conversation varied depending on whether the photographers
were gathering or other colleagues from other offices were entering the room or
viewing the display out of the room.
There was a coffee machine in that office where the colleagues used to gather during
the coffee break. Other office colleagues joined our participants during the coffee
Chapter 9. Field study of 4Streams 238
break to chat. The display raised the question of what it is and how it works. In
addition, the participants were looking at their photo streams and talking about
their latest status while they were taking a photo. P2 said:
“When I was passing in front of there (office) or during the coffee time,
it (the display) was there. So you just take a coffee and talk about the
latest photos and sometimes old photos.”
P1 supported P2 with an example:
“There are some funny pictures there. I remember one that Louis made
a drawing and we shared it, that was fun. It made us laugh so much.”
Regarding the presence of other people from other offices, P5 added:
“Other people outside were curious sometimes and asking about the
display and making funny conversation about our photos.”
P1 said about one of his friends who was working in another building:
“Simon asked how he can be on the display and I told him this is a
special tool for us.”
Intrusiveness of the display in the workplace
The screen was situated in a place where most of the participants could look at
it. When they entered the office, they could see the screen, which was exactly
in front of P5. Undoubtedly, the conversations in the office were not only about
the photos on the display, although it would turn into a conversation about it
later on, as each photo ignited a conversation topic. It is very important to find
whether the device was intrusive and whether conversations regarding the display
interrupted the participants from working. During work, there were photos that
Chapter 9. Field study of 4Streams 239
ignited conversation between the participants during work time. However, there
were moments that a new photo would arrive but the participants did not start to
talk about it at that time. The participants mentioned that the conversations dur-
ing the work time were not long. An example is when a photo from the University
of Salford arrived and P5 updated the others that P4 was there. P5 said:
“I could see when they changed. Like, if it changed I would look over
and see what was new and back to work. Sometimes I talked about the
new photo with others but not all the time as I was busy with work.”
Regarding the idea of non-intrusiveness, P4 said:
“I think having it so you could see it directly from the door as you
came in. We walked past it several times a day, but for me it wasn’t
a distraction to have it there. You just thought of looking at it and
thought ‘ah that’s nice’.”
P5 complained that the screen kept switching off and P3 replied:
“Yes, it’s my fault. Nobody was in the office and I was working so I did
not want to waste energy but most of the times it was a big window-
style box over the corner with all the pictures and it was nice... No I
did not turned it off for intrusiveness.”
It can be concluded that the participants accepted the display as a tool in the
office and that it created short conversations between them but it did not distract
them from work and they accepted the display as a photo frame in the office.
New photography practice
According to the information gathered at the interviews, we noticed that 4Streams
changed the participants’ practice of photography. Before using this application,
Chapter 9. Field study of 4Streams 240
most of the participants’ shared photos were about interesting occasions or scenes.
However, they continued their past photo sharing practices. Therefore, they were
sharing more photos than they were in their normal photo sharing practice. An-
other reason that they shared more photos was that the application was, by itself,
a trigger and motivated them to share more photos. In conclusion, the context of
the display changed their old practice of what and how many photos they were
sending.
P2 said:
“More attempted to share more (photos) with (the display) – especially
things related to work because that’s where the screen was.”
P5 added:
“The incentive was to take and share more photos of people who ac-
tually work in that lab.”
4Streams and Facebook
In the opinion of the participants, this application could be a supportive add-in
application for Facebook. P2 said:
“It looks like a complement for Facebook because there is that big
screen that you can see pictures that your friends posted.”
P3 also added:
“It feels like an extension of Facebook because everything that appears
on that screen you’ve posted on Facebook anyway but with new vision
of the workplace photos.”
Chapter 9. Field study of 4Streams 241
Although they mentioned that the privacy settings in Facebook are not easy and
Google+ offers a better platform for choosing the private circle of friends to share
photos with, they all admitted that 4Streams has the ability to make Facebook
more personal for a small group of friends. They said that, nowadays, their main
photo sharing platform is Facebook and not Google+. Therefore, this application
can support Facebook rather than Google+.
Compared to Facebook, they were interested in viewing the latest photos of only
their colleagues and the photos related to work in the office display. In Facebook,
instead, they could see random photos of different people and did not have the
chance of seeing photos of their colleagues; colleagues were not always those people
whose their photos appeared on the newsfeed page of Facebook. P4 said:
“Because Facebook gives you what you most want to see when you log
in and it probably means that you miss a fair amount of what your
friends actually show on Facebook, like people in this group; whereas
in your system you always see the latest pictures from each person.”
To support this sentence, P2 added:
“It (Facebook) got this machine learning method that basically learned
from your previous behaviour and comments which actually is bad
because it tends to be biased towards places that you’ve seen recently.
And there are some people that just get forgotten from the Facebook
main page.”
Improvements
The participants in this group addressed solutions to enhance application produc-
tivity. The improvements are now described.
The first improvement for the office display was that the participants wanted the
ambient display to be more passive rather than interactive, which prevented them
Chapter 9. Field study of 4Streams 242
from any kind of interaction with the system. All of them said that they did not
like the interaction section and that the photos on the display were static, making
it difficult for them to review older photos. They wanted 4Streams to show old
photo streams automatically and the display to be more dynamic rather than a
fixed four-slideshow window until a new photo arrives. As a result, they wanted a
full passive ambient display to view a slideshow of old photos automatically and
to notify the arrival of a new photo when it just arrived. P1 said:
“It was static and you could just see the last picture. So when I came,
for example, on Monday morning, it was just the last picture that
they took on the weekend, I would like to see all the pictures they took
during the weekend without interacting with the system.”
The second improvement the participants mentioned was to provide a place on
the screen to show the photo captions; this could bring more information about
the photos and they could understand the story of the photos better. However,
it could provide fewer subsequent conversations about the displayed photos. P5
said:
“Something else that just occurred to me was you don’t see captions on
the system, so you might write a witty caption or an amusing caption.”
Furthermore, since not everyone in their office was active, the participants wanted
to add more people to the group so that they could follow the active members. P4
said:
“I like viewing four people and then adding another person you kind
of like and then just switch off the user because he hasn’t been sending
anything...And then switch on whoever was active let’s say.”
Chapter 9. Field study of 4Streams 243
9.6 Summary and discussion
In this chapter, the user experience within 4Streams was described. Three groups
were recruited for the study. It was found in the literature review that there is
a need for sharing photos within a small group of people [39] and what we we
found in Phase 1 of our study was the need for a live photo sharing application
as an ambient display and the importance of showing multiple photo streams
concurrently. 4Streams was built in response to these needs. In this chapter, the
results of a study comprising three groups of people (extended family, close friends
and workplace friends) were presented.
The reason we decided to ask for extended family was that a family is a small
group and they do not hesitate to share their personal photos. Moreover, older
members of the family like to see what is happening to the other members of the
family by photos [19]. In the pilot study, we found that 4Streams was a good
platform for news telling via photos. Therefore, extended family members could
benefit from this characteristic of the system.
The second group was a group of close friends. In our previous study in Phase 1,
we found that friends like to share their photos with each other. Moreover, there
are lots of photo sharing applications currently that close friends use to share their
photos, such as Viber and Whatsapp. However, current photo sharing platforms
do not provide well-organised photo collections between small groups of people.
Therefore, we decided to examine how 4Streams fits with a small group of close
friends.
The third group comprised four colleagues who shared an office. We did not have
information about how a photo sharing application display fits into four workplace
colleagues. The only thing we knew was that many people check their social media
websites at work. We did not even know whether a display would distract them
from work. Therefore, we decided to examine the impact of the photo display in
a university office environment and see in what ways colleagues share their photos
with each other when they have a display at work.
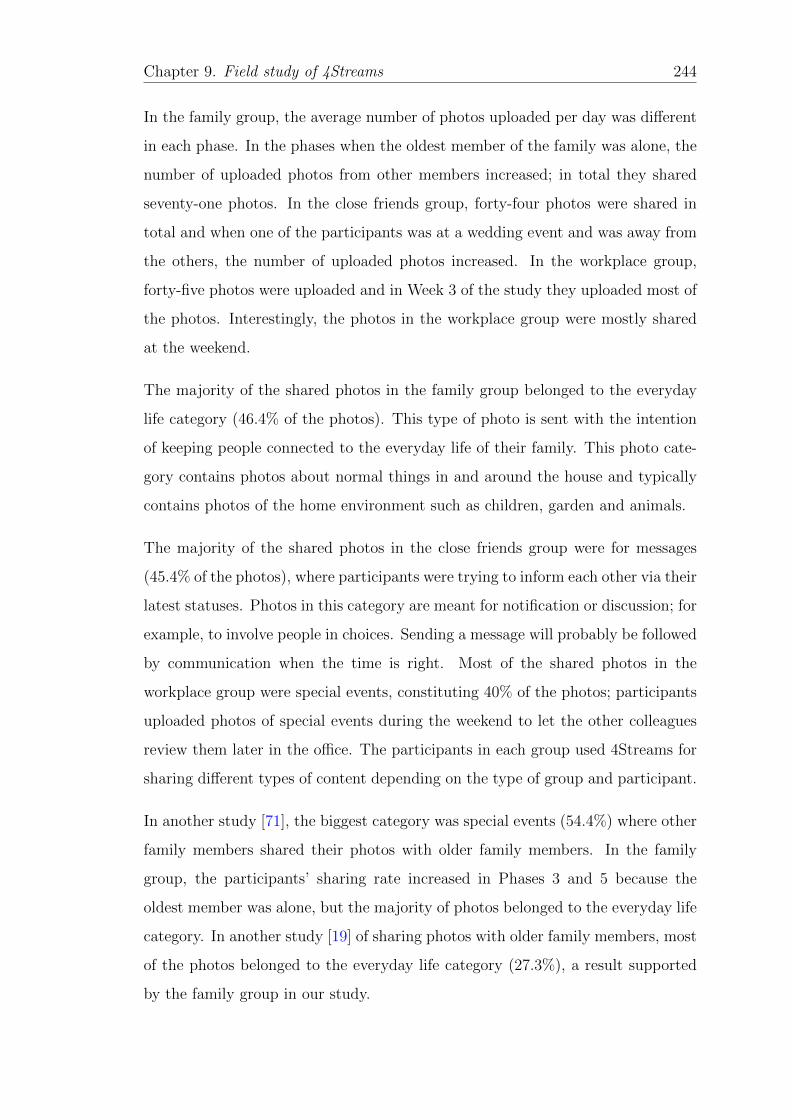
Chapter 9. Field study of 4Streams 244
In the family group, the average number of photos uploaded per day was different
in each phase. In the phases when the oldest member of the family was alone, the
number of uploaded photos from other members increased; in total they shared
seventy-one photos. In the close friends group, forty-four photos were shared in
total and when one of the participants was at a wedding event and was away from
the others, the number of uploaded photos increased. In the workplace group,
forty-five photos were uploaded and in Week 3 of the study they uploaded most of
the photos. Interestingly, the photos in the workplace group were mostly shared
at the weekend.
The majority of the shared photos in the family group belonged to the everyday
life category (46.4% of the photos). This type of photo is sent with the intention
of keeping people connected to the everyday life of their family. This photo cate-
gory contains photos about normal things in and around the house and typically
contains photos of the home environment such as children, garden and animals.
The majority of the shared photos in the close friends group were for messages
(45.4% of the photos), where participants were trying to inform each other via their
latest statuses. Photos in this category are meant for notification or discussion; for
example, to involve people in choices. Sending a message will probably be followed
by communication when the time is right. Most of the shared photos in the
workplace group were special events, constituting 40% of the photos; participants
uploaded photos of special events during the weekend to let the other colleagues
review them later in the office. The participants in each group used 4Streams for
sharing different types of content depending on the type of group and participant.
In another study [71], the biggest category was special events (54.4%) where other
family members shared their photos with older family members. In the family
group, the participants’ sharing rate increased in Phases 3 and 5 because the
oldest member was alone, but the majority of photos belonged to the everyday life
category. In another study [19] of sharing photos with older family members, most
of the photos belonged to the everyday life category (27.3%), a result supported
by the family group in our study.
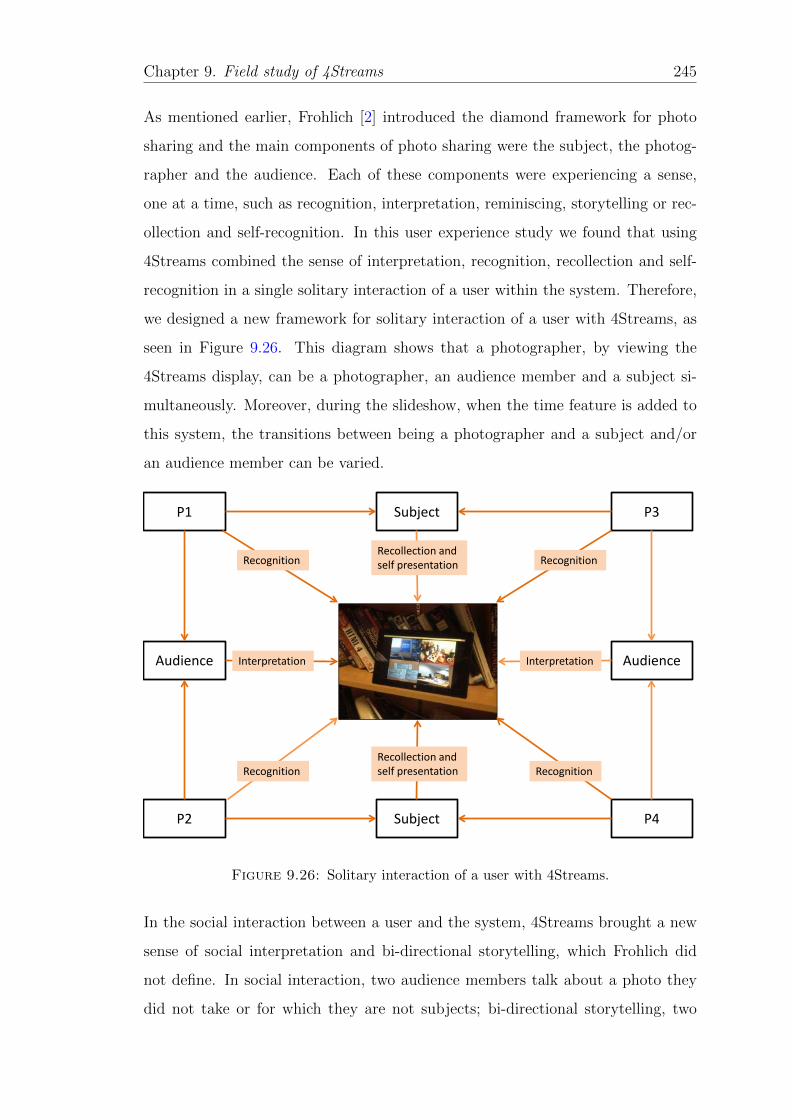
Chapter 9. Field study of 4Streams 245
As mentioned earlier, Frohlich [2] introduced the diamond framework for photo
sharing and the main components of photo sharing were the subject, the photog-
rapher and the audience. Each of these components were experiencing a sense,
one at a time, such as recognition, interpretation, reminiscing, storytelling or rec-
ollection and self-recognition. In this user experience study we found that using
4Streams combined the sense of interpretation, recognition, recollection and self-
recognition in a single solitary interaction of a user within the system. Therefore,
we designed a new framework for solitary interaction of a user with 4Streams, as
seen in Figure 9.26. This diagram shows that a photographer, by viewing the
4Streams display, can be a photographer, an audience member and a subject si-
multaneously. Moreover, during the slideshow, when the time feature is added to
this system, the transitions between being a photographer and a subject and/or
an audience member can be varied.
Audience
Subject
Audience
Subject
P1
P2
P3
P4
Recognition Recognition
Recognition Recognition
Interpretation Interpretation
Recollection and self presentation
Recollection and self presentation
Figure 9.26: Solitary interaction of a user with 4Streams.
In the social interaction between a user and the system, 4Streams brought a new
sense of social interpretation and bi-directional storytelling, which Frohlich did
not define. In social interaction, two audience members talk about a photo they
did not take or for which they are not subjects; bi-directional storytelling, two
Chapter 9. Field study of 4Streams 246
photographers, two subjects or a subject and a photographer who did not take a
photo but were one of the photo sharers, tell a story about their photos to each
other. 4Streams provided a new combined sense of social interaction between the
user and the system, as defined by Frohlich. In Figure 9.27, the possible social
interactions between a user and the system are presented.
Social interpretation and Bi-directional story telling
Reminiscing , social interpretation or Bi-directional story telling and social interpretation
Bi-directional story telling and social interpretation
Photographer
Subject
Audience
Social interpretation
Story telling and social interpretation
Story telling and social interpretation
All of the scenarios
Figure 9.27: Social interaction of the user with 4Streams.
4Streams was also used as a decoration tool by the family and workplace groups.
In the family group, it was placed on the dinner table or a shelf of the house. The
workplace group accepted 4Streams as an ambient photo display in the office for
decoration. However, the close friends group did not show any interest in using
the system as a decoration tool and did not leave the displays on their desks.
4Streams was a trigger for other means of communication between the family group
members; a good example is when the grandmother of the family sent an SMS
message to other members of group after seeing a photo of a fox in their backyard.
On the other hand, in the close friends group, Facebook was the main platform
for photo sharing. In the workplace group, the participants used the Facebook
Chapter 9. Field study of 4Streams 247
comment boxes for talking about the photos. Moreover, the photos taken over the
weekend were discussed during the week by the participants; this made the system
useful as a conversational tool in the office.
4Streams brought other people who were not participating in the study into the
experiment as an extended audience. For example, in the family group, the chil-
dren and a friend of the mother of the family were interacting and talking about
the display, and this provided a good platform for children and socialisation. In
the workplace group, people from other offices were interested in the photos their
colleagues took and talked about these photos with the participants. However,
the close friends group did not mention other people interested in the photos on
display as they did not place the display in their homes.
For the family group, the main sharing platform was the 4Streams display as they
shared most of their photos with the display and they did not use Facebook as their
main platform of photo sharing. The workplace group’s main device for viewing
the photos of others was 4Streams; however, they said that, on some occasions,
they saw the photos on Facebook before viewing them on 4Streams. The close
friends group’s main platform of photo sharing was Facebook and they preferred
using Facebook for viewing photos rather than 4Streams.
The results show that 4Streams was very useful to the family group and family
members expressed their desire to own this type of device. Although we did not
know what the effects of 4Streams might be on the workplace, 4Streams was an
appropriate and non-distracting tool in an office environment. However, the main
concern of the friends group was the mobility of the device; they did not like the
idea of using 4Streams as an ambient display and they liked to have it on their
mobile phones.
Finally, the system had a number of limitations. Participants suggested the system
should be able to retrieve photos when it was not connected to the Internet.
Moreover, participants suggested implementing this application on a mobile phone
platform. Some participants believed that the system should have a different
upload page than Facebook, while others believed that this application is well

Chapter 9. Field study of 4Streams 248
suited for Facebook users. The final suggested improvement was to make the
display show old or new photos automatically based on subtle or implicit user
interactions such as eye-gaze or movement.
Chapter 10
Conclusion
10.1 Introduction
This thesis presented a series of research work dedicated to providing an under-
standing of, and recommendations for, the design of visualisation and sharing of
photo streams by small groups of people such as friends and family members. Sec-
tion 10.2 of this chapter describes the achievements of the work presented in this
thesis and contributions to the knowledge base via the research questions detailed
in the Introduction chapter. Section 10.4 outlines possible future work that could
be carried out as a result of the conclusions of this thesis.
10.2 Conclusions
The major contributions of this thesis allow the conclusions to be summarised as
follows, answering the research questions. In addition, the design recommenda-
tions that are concluded from the results of this thesis are presented at the end of
this section.
249
Chapter 10. Conclusion 250
10.2.1 Values and requirements of sharing and visualisa-
tion of past photo streams by a small group of
friends
Nowadays, people tend to share their photos. Not only are they keen on sharing
their photos with others, but also they want to view other people’s digital photos.
The thorough literature review called for the design of a photo sharing application
to enable people to share and see their photos taken in different places and times
among small groups. In order to fill this gap, a web-based photo sharing and
visualisation application was built and implemented that enabled people to view
and share their old multiple photo streams concurrently and chronologically, thus
enabling them to compare what happened to them in the past via their photos.
A user study was conducted by deploying the system to twenty people and the
result showed that the system surprised the participants when the photos on the
display were from the same time and same place (collocated) or the same time
and different place (remote) in both our layouts, which were multiple- and single-
window slideshow. For the collocated experience, multiple users took photos of
the same event and, therefore, the event was shown more completely from the
perspective of different photographers. For the remote experience, the users were
able to see what happened to others while they were doing something else in the
past. Unlike the single-window slideshow, which did not satisfy the users in this
regard, the participants liked the multiple-window slideshow. There was another
state: Asymmetric transition. In this state, one user had many more photos than
other users; therefore, multiple photo streams were not shown concurrently all the
time. The solution to this problem was to summarise multiple photo streams for
consistency between slideshow windows during the presentation.
In our initial design, there were three transition types designed for the system
in addition to the normal slideshow with a two-second fixed transition to see
whether the user experience increased the joy of the slideshow. The transitions
were proportional, event informer and user desired time. In the proportional
Chapter 10. Conclusion 251
transition, the slideshow transition between each slide was calculated based on
the time difference between consecutive photos. In the user desired time, the total
slideshow time was chosen by the user and the transitions were calculated based
on the user desired time. Finally, in the event informer, multiple photo streams
were clustered based on time features and at the end of each chronologically sorted
cluster there was a message to say the event has changed.
The proportional transition time provided a sense of natural event change for the
participants during the slideshow. However, the problem was that in some cases
the slideshow was very fast or very slow. The event informer showed the event
change message during the slideshow and, therefore, the participants could identify
photos that did not belong to the same event. However, it was not as intuitive and
natural as the proportional transition. The normal slideshow was boring and time
consuming for the participants. In addition, the desired time introduced viewing
photos in a desired time selected by the user for the presentation. However, it did
not give a notion of time for event change or show photos taken in bursts faster.
Another problem of the desired time was when the total slideshow time was short
and the server was not able to load all photos during the slideshow.
The results showed that the proportional transition time was the favourite transi-
tion. However, the average interest in this transition was not significantly higher
compared to the desired time and the event informer. All our proposed transitions
had a significantly higher rank compared to the normal slideshow. However, our
proposed transitions still had problems and the participants proposed combining
these methods in order to solve the problem that some transitions are sometimes
too long and sometimes too short.
In this study there were three groups: family, friends and close friends. In the
family and friends groups, the participants experienced creating a photo diary and
our application made viewing those photos from different angles fun and enjoyable.
The close friends group uploaded their old photos and our application brought an
awareness of their past and comparison between their old photos.
Chapter 10. Conclusion 252
From this experiment it was identified that the requirements for the visualisation
of multiple photo streams using our system are: photo summarisation across mul-
tiple photo streams, image re-targeting, adding a visual status to the system for
communication via photos, making the system ambient, designing a single timeline
for browsing multiple photo streams, combination of transitions and finding the
optimal temporal parameters for the visualisation of photo streams.
10.2.2 Determination of optimal temporal parameters for
the visualisation of multiple photo streams
From the study design and the study conducted in Chapters 4 and 5, we identi-
fied the following three temporal aspects for the visualisation of multiple photo
streams: manual transitions, continuity transition and desired time transitions.
The manual transitions contained the logarithmic, proportional and fixed transi-
tions. In the logarithmic transition and the proportional transition, the slideshow
transition was proportional to the time difference between consecutive photos. In
the fixed transition, the user was able to change the transition manually by a
fixed amount. In the continuity transition, if two consecutive photos were contin-
uous, then the transition was faster than that for two discrete consecutive photos.
The desired time transition contained a logarithmic desired time transition and a
summarisation desired time. The former showed all the photos but the slideshow
transitions increased based on the user desired time and, later, the redundant
photos (Asymmetric transition state) were eliminated by clustering photo streams
based on social metadata and temporal features alongside the selection of the most
representative photo in the cluster by using a SIFT flow algorithm.
The first study was a task-based user experience study and the manual transitions
alongside the system values in remembering the photos were evaluated. Our find-
ings demonstrated that, although the participants might sometimes forget what
happened next in different conditions (mostly in the researcher’s stream), when
we showed them a photo from the presentation of multiple photo streams, they
Chapter 10. Conclusion 253
had a good recollection of the narrative in the multiple photo streams by remem-
bering the photos and what happened next for 79.15% of the time. Hence, this
application was a good platform for recalling the photo collection stories of friends
and comparing previous events via photos.
The findings showed that the logarithmic transition was the preferred transition,
followed by the fixed and proportional transitions. The results also showed that
the transition types affect the total slideshow time and the results of remembering
between transition modes were not significantly different.
The photo streams from camera phones brought more transition between slideshow
windows and, consequently, a better experience of viewing multiple photo streams.
The results also showed that searching via a single timeline was a pleasant expe-
rience, where participants were able to find their own and their friends’ photos
using the timeline and control buttons.
The second study developed a better algorithm for detecting the continuity. Three
algorithms were used to create the continuity transition; these three algorithms
were evaluated and we found that SIFT was the best among them. The logarithmic
transition enabled participants to view photos taken in bursts faster. However,
the continuity transition presented continuous photos taken in bursts faster, thus
enabling viewing of photos taken over a longer period of time in time-lapse mode
(for example, a time-lapse of a flower blooming).
The last study was the comparison of the logarithmic desired time and the sum-
marisation desired time. The results showed that, for short time presentation, the
summarisation desired time is better than the logarithmic desired time. However,
when the total slideshow length increased, the participants preferred the logarith-
mic transition time.
Chapter 10. Conclusion 254
10.2.3 User experience of ambient visualisation of multiple
photo streams within small groups of people
In order to investigate the user experience of the visualisation of multiple photo
streams within small groups of friends, an application was designed and imple-
mented. In this application, people were able to share their photos with our
application via Facebook and follow the latest visual status of others. Moreover,
they were able to review the past photo streams they took concurrently.
This system was deployed separately as a field study, between three groups: close
friends, family and workplace colleagues. In the family group and close friends
group, each participant had the application on a Microsoft Surface Pro tablet in
their own place, while in the workplace group, a large display was situated in
the office for the people working at the same place. After the experiments, the
logs of the participants’ interactions within the system were stored and analysed.
Moreover, a focus group session was conducted and the results were analysed
qualitatively.
The results showed that the system fitted the family group nicely, as they shared
a reasonable number of photos; they viewed the photos from our application on
Microsoft Surface Pro displays provided to them by sharing the photos with that
display only. On the other hand, the close friends group preferred to review their
photos from Facebook by sharing them with both the display and the Facebook
friends rather than our display only. The close friends group participants said that
they did not like having their friends’ photos on the display on their desk while
they could view their photos on Facebook. However, they said that they would
like to share their photos with their family members with our application.
The study with the workplace group showed that the system was not intrusive in
the office and the participants could consider it as a picture box in the office. In
this group, the participants shared the photos of their weekend for discussion on
weekdays; they also shared the photos related mostly to work during the week.
The results showed that our application fitted the workplace group well.
Chapter 10. Conclusion 255
Previously, Frohlich [2] introduced the diamond framework for photo sharing, with
the main components of photo sharing being the subject, the photographer and
the audience. Each of these components experiences one experience at a time,
for example recognition, interpretation, reminiscing, storytelling or recollection
and self-recognition. In this user experience study, we found that using our ap-
plication results in having a combined sense of interpretation, recognition and
recollection and self-recognition in the solitary interaction of the user with the
system. Moreover, in the social interaction between the user and the system, our
application brought a new sense of social interpretation that Frohlich did not de-
fine [2], whereby two audience members talked about a photo they did not take or
they were not a subject of. Moreover, our application provided a new combined
sense of bi-directional storytelling, social interpretation and reminiscing together
in social interaction.
10.2.4 Design recommendations for photo sharing applica-
tions
As found by the user experience studies in this thesis, the sharing and visualisation
of multiple photo streams within small groups of people, such as friends and family
members, was an interesting experience for our participants. According to the
major findings of this study, the design recommendations are listed as follows:
• The designed system for the visualisation and sharing of photo streams
should take advantage of the network connectivity between the devices.
• Due to situations where the Internet connection speed is low or the Internet
becomes disconnected during real-time photo visualisation and organisation,
the photo sharing application should save the photos and keep the latest
photos and their associated information on the hard drive after connecting
to the Internet.
• The photo sharing application should be able to support different screen
sizes such as large displays, mobile phones and digital photo frames.
Chapter 10. Conclusion 256
• In order to have an efficient photo sharing application between multiple peo-
ple within a small group, the application should enable the users to compare
their past by the time of capture, whether or not they were together at the
same time.
• It is necessary to have an option to summarise multiple photo streams when
photos of different streams do not belong to the same time in order to pro-
vide a comparison between streams and decrease the presentation time, thus
avoiding boring presentation.
• Manual transitions, such as the logarithmic and the fixed transition time,
enhance the experience of the slideshow. The nature of the logarithmic
transition time decreases the total slideshow time by improving the compre-
hension and the feeling of event changes; the fixed transition time lets the
user view photos manually in more detail or faster.
• The results showed that 28% of photos in photo collections are continuous,
which means there is a movement feeling between consecutive photos taken
in bursts or as a time-lapse. Therefore, there is a need to design a feature
to show those photos automatically using a video sequence to make the
presentation more pleasant and decrease the presentation time.
• To search through multiple photo streams, a single timeline alongside control
buttons, such as play back and play forward, using different transitions is
beneficial.
• Future photo sharing and visualisation applications should support video
and audio alongside still photos.
• Extended families would benefit from having a photo sharing display at home
to update their visual status regularly with each other as a communication
and decoration tool.
Chapter 10. Conclusion 257
10.3 Limitations
Although the study provided answers to the research questions set out in Chapter 1
and revised in this chapter, a number of issues emerged that provide an opportunity
for further research and which are listed below.
• This thesis was limited to photos shared by camera phones or point-and-
shoot cameras. However, photos from wearable cameras were not used and
the value of using our system with photos from wearable cameras has not
been investigated.
• The final version of the system (4Streams) was not able to retrieve photos
that arrived when the device was off and this issue should be solved in the
future.
• None of our systems were able to support audio files alongside the photo or
video although video and audio are media that provide information in more
detail. Moreover, some participants mentioned during the user study that
they would like the system to have video sharing alongside photo sharing.
• During the user study, we found that the participants wanted to enjoy a sense
of awareness in remote experience, completeness in collocated experience and
live communication via visual statuses using our application. This could be
provided by designing 4Streams to be operated on mobile phones; the current
4Streams design is not suitable for mobile phones as the screen on mobile
phones is too small.
• Another limitation of our system was that it changed the aspect ratio of the
photos. This has been scarified by having all information of the photo rather
than choosing the centre of the photo. Therefore, in some rare cases, the
photos on the screen were not pleasant.
• Another limitation of the system was not designing a subtle or implicit inter-
action with the system, such as using hand gestures or eye gazing. Therefore,
Chapter 10. Conclusion 258
the participants proposed designing a system in a way to be smarter by user
movements rather than showing the latest visual statuses all the times or
detailed interaction of the user within the system for reviewing past photos.
• Our system supported the presentation of multiple photo streams from up
to only four people.
10.4 Future work
We are aware of the limitations of the current system and we suggest further work
in the area of photo sharing within a small group of friends. Hence, this section
presents extended research possibilities.
10.4.1 Investigation of passive photography values using
our system
As described in the literature review, there is a new type of photography, passive
photography [45–47]. In passive photography, users wear a camera and, then,
the capture device takes photos automatically based on different sensors such as
timer, light change and temperature change. The value of passive photography
have been identified previously in [1, 27]. One research area to be considered is
visualisation and sharing of photos taken in a passive manner. Our application has
the potential to present multiple passive photo streams obtained by different users
and, therefore, investigation of the passive photography values using our system
during photography and during visualisation is a good future research driven by
this work.
10.4.2 Combining passive and active photography
Passive photography might become a common type of photography if photo visu-
alisation tools are developed to support this type of photography in the future.
Chapter 10. Conclusion 259
However, undoubtedly, normal active photography with camera phone and point-
and-shoot cameras will still have their own values. Therefore, creating a tool
to enable the user to have an enjoyable experience when reviewing passive photo
streams alongside active ones is another future research are driven by our research.
10.4.3 Designing and studying our application for smaller
screens such as mobile phones
A third suggestion for future studies is to design a new application for concurrent
visualisation of multiple photo streams on mobile phones. As the popularity of
smartphones has increased, the development of natural user interfaces for mobile
phones has drawn attention from both the research and commercial communities.
For example, in current mobile applications, photos are shown in chronological
order in grid view or as a single photo on a screen. Re-targeting [59, 76, 77] is
another approach to fit the smaller size photos on mobile phone screens. Moreover,
Karlsson et al. [9] proposed a solution by summarisation of photo collections on
smartphone displays. Our system presented its own values for sharing and visu-
alisation of multiple photo streams but the users claimed that they need to view
photo streams on their mobile phones, which have small screens. Therefore, it is
worth designing and studying a new application for sharing and visualisation of
multiple photo streams on smaller devices such as mobile phones.
10.4.4 Adding implicit or subtle interaction for larger screens
in home or workplace environments
In this research we found that using our photo sharing application in a fixed place
with a larger display is suitable in the workplace. However, using still images as the
latest visual status of users for a long time was not pleasant for the participants.
Currently, there are many cheap devices to support gesture interaction, such as
Microsoft Kinect [181]. Therefore, designing an implicit or subtle interaction for
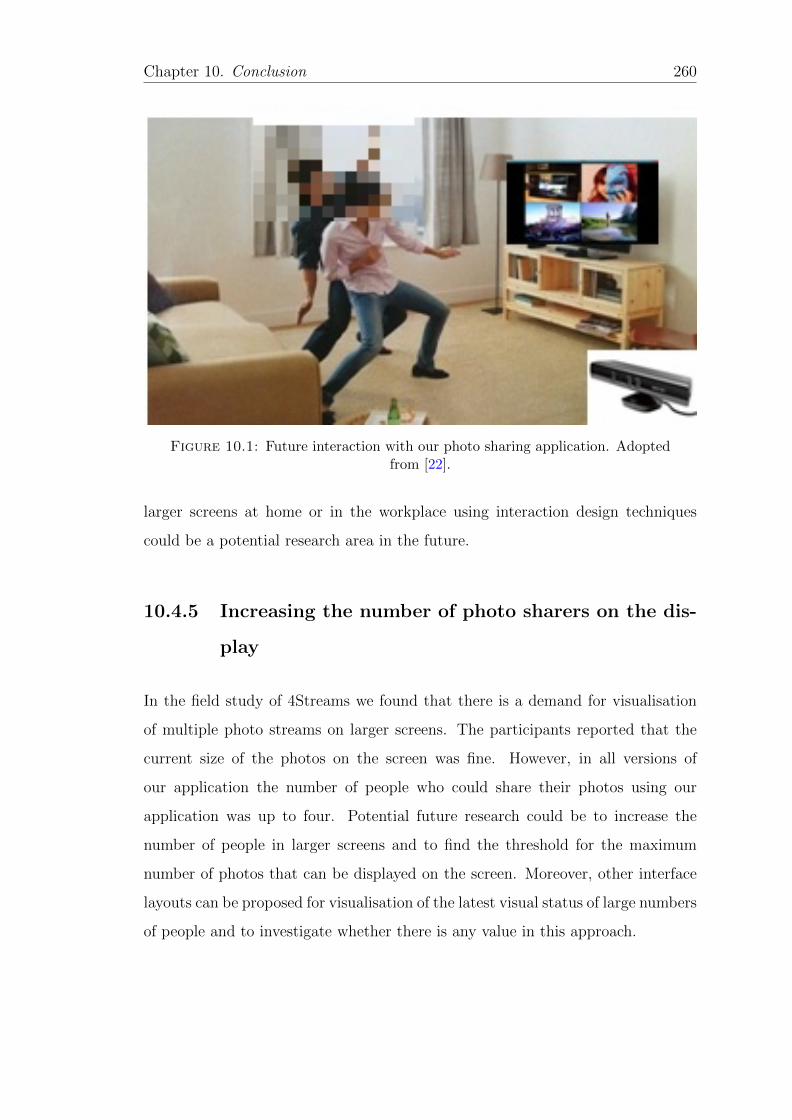
Chapter 10. Conclusion 260
Figure 10.1: Future interaction with our photo sharing application. Adoptedfrom [22].
larger screens at home or in the workplace using interaction design techniques
could be a potential research area in the future.
10.4.5 Increasing the number of photo sharers on the dis-
play
In the field study of 4Streams we found that there is a demand for visualisation
of multiple photo streams on larger screens. The participants reported that the
current size of the photos on the screen was fine. However, in all versions of
our application the number of people who could share their photos using our
application was up to four. Potential future research could be to increase the
number of people in larger screens and to find the threshold for the maximum
number of photos that can be displayed on the screen. Moreover, other interface
layouts can be proposed for visualisation of the latest visual status of large numbers
of people and to investigate whether there is any value in this approach.
Chapter 10. Conclusion 261
10.4.6 Organisation of multiple photo streams
We have described the current organisation tools and algorithms for photo col-
lections in the literature review. Moreover, in our research, a new approach for
presentation and visualisation of photo streams was proposed. The results showed
that, by using timeline and control buttons, the users were able to search their
photos manageably. However, there is still a need to design new interfaces for the
automatic organisation of multiple photo streams collected by different people,
capture devices and social networks. A potential future research could be to de-
sign and implement an interface to organise multiple photo streams automatically
between users using photo metadata and features in different layouts.
10.4.7 Adding other media such as video and audio to our
system
As can be seen in the current trend, as well as from our findings from the user
study, people tend to share their videos alongside their photos because video pro-
vides more detail about an event. Moreover, audio photography [2] could be a
potential future of photo visualisation since audio alongside photo provides better
reminiscing of the past. Therefore, designing a system to support a package of
photo, video and audio photo sharing, and visualisation is another potential future
research area driven from our work.

Appendix A
Appendix
262
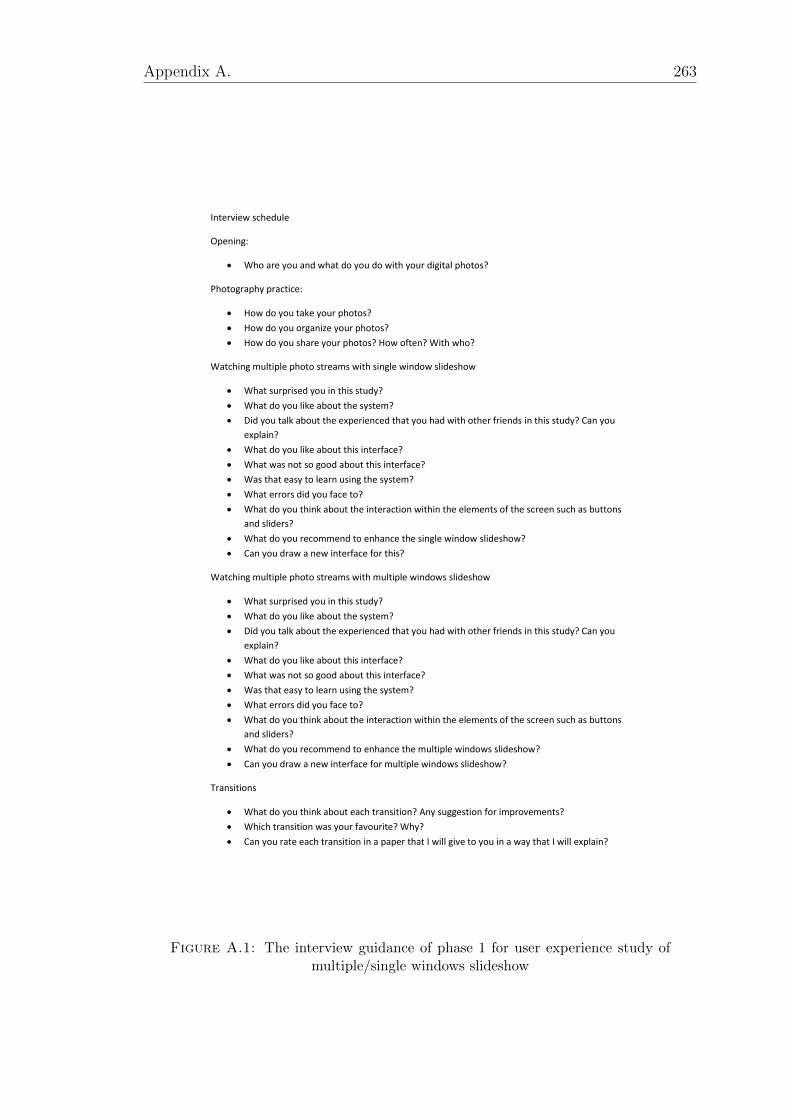
Appendix A. 263
Interview schedule
Opening:
Who are you and what do you do with your digital photos?
Photography practice:
How do you take your photos?
How do you organize your photos?
How do you share your photos? How often? With who?
Watching multiple photo streams with single window slideshow
What surprised you in this study?
What do you like about the system?
Did you talk about the experienced that you had with other friends in this study? Can you
explain?
What do you like about this interface?
What was not so good about this interface?
Was that easy to learn using the system?
What errors did you face to?
What do you think about the interaction within the elements of the screen such as buttons
and sliders?
What do you recommend to enhance the single window slideshow?
Can you draw a new interface for this?
Watching multiple photo streams with multiple windows slideshow
What surprised you in this study?
What do you like about the system?
Did you talk about the experienced that you had with other friends in this study? Can you
explain?
What do you like about this interface?
What was not so good about this interface?
Was that easy to learn using the system?
What errors did you face to?
What do you think about the interaction within the elements of the screen such as buttons
and sliders?
What do you recommend to enhance the multiple windows slideshow?
Can you draw a new interface for multiple windows slideshow?
Transitions
What do you think about each transition? Any suggestion for improvements?
Which transition was your favourite? Why?
Can you rate each transition in a paper that I will give to you in a way that I will explain?
Figure A.1: The interview guidance of phase 1 for user experience study ofmultiple/single windows slideshow
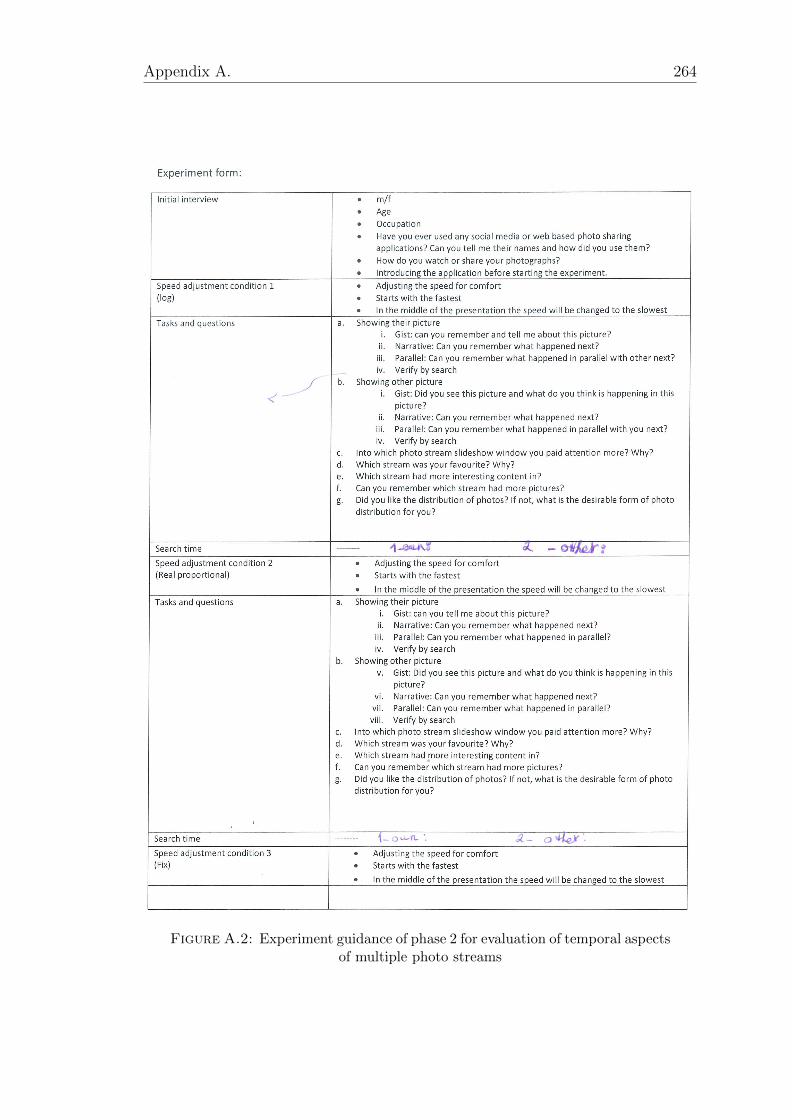
Appendix A. 264
Figure A.2: Experiment guidance of phase 2 for evaluation of temporal aspectsof multiple photo streams
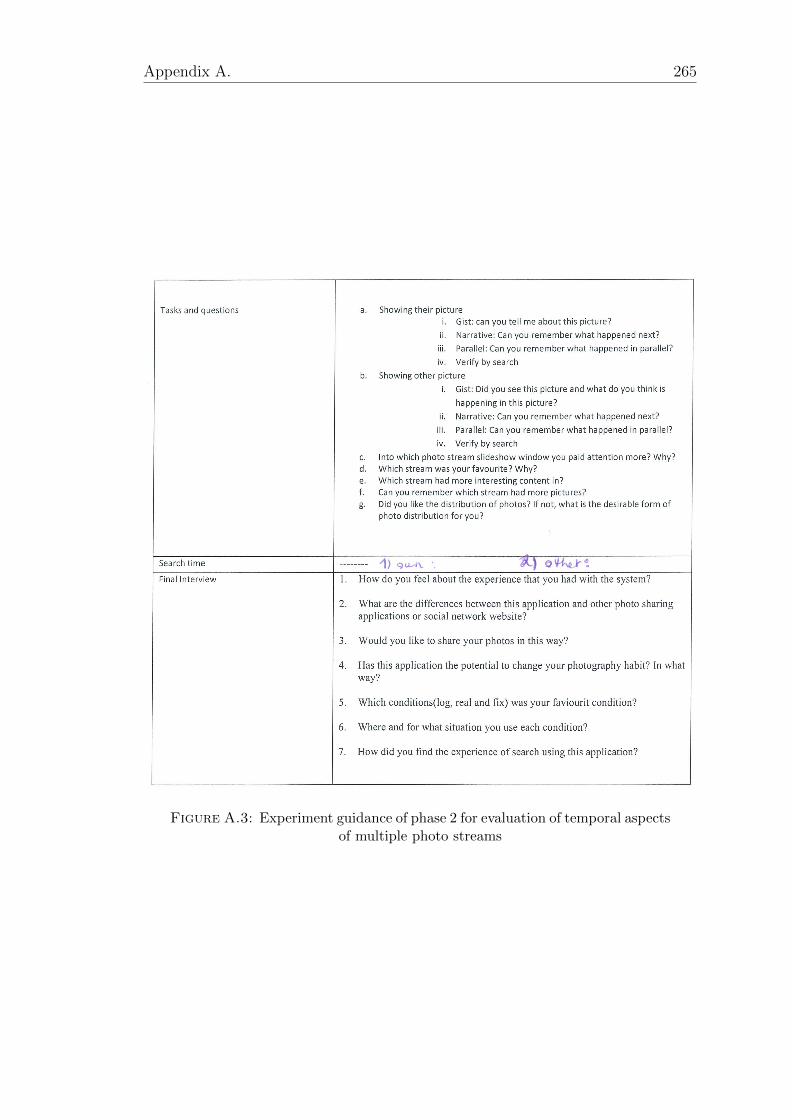
Appendix A. 265
Figure A.3: Experiment guidance of phase 2 for evaluation of temporal aspectsof multiple photo streams
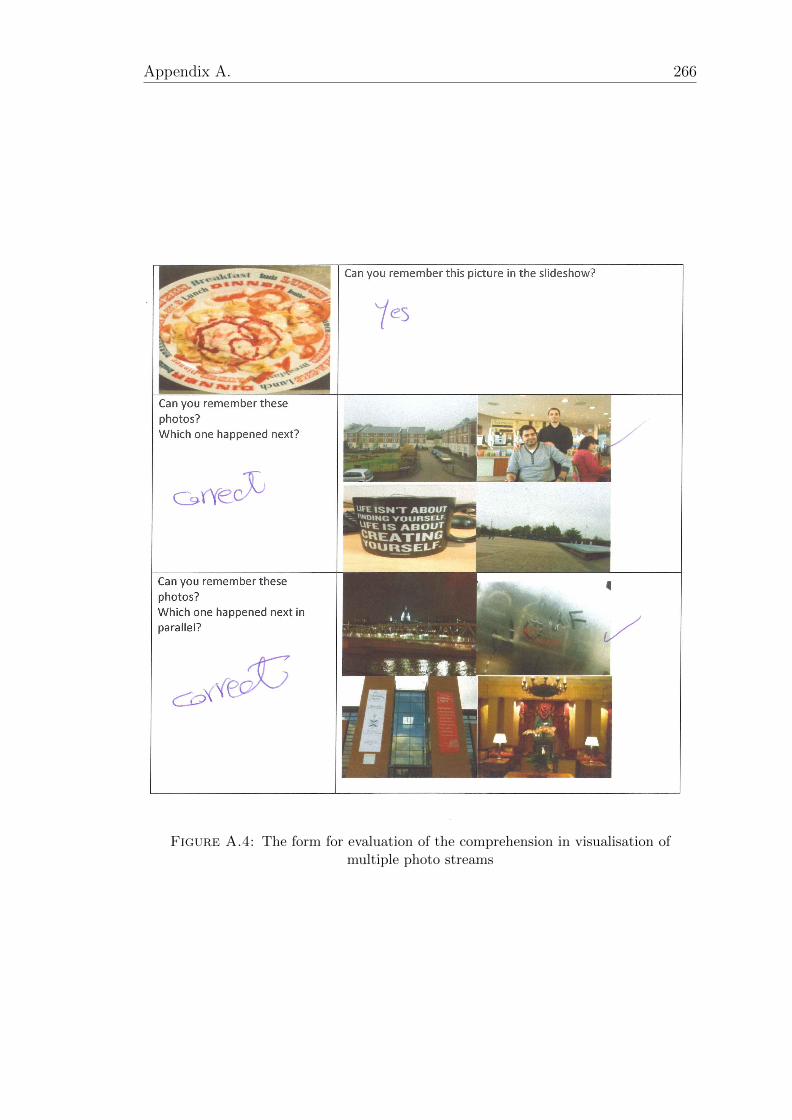
Appendix A. 266
Figure A.4: The form for evaluation of the comprehension in visualisation ofmultiple photo streams

Appendix A. 267
Pre and Post-trial interview schedule (90 min)
Switch on the audio recorder...
Pre Interview
1. Can you introduce your self and how long have you been as a family?
2. How do you stay in touch with other members of family when you are apart?
a. Between you
b. Between other members of family
c. Youngerts
d. Olders
3. How do you take and share photographs today? Can you say alittle bit about that?
a. Family members
b. Friends
c. How often do you take pictures?
d. What device?
e. Who do you share those photos with?
f. How do you share?
4. What social media do you use? Which one involves the sharing of photos?
5. How do you share photos using those media?
6. What kind of photos do you share with different people?
7. What kind of issues do you have with photo sharing today? How can the experience be improved?
8. Do you like photo sharing? Why?
Opening
1. How do you feel about the experience that you had with the system in general? Key Values?
2. What are the best and worst features?
3. How do you compare it with other communication systems? How did this application changed your
sharing habit in compare to other communication sytems?
a. Facebook
b. Twitter
c. Instagram
d. Whats App
e. SMS
f. IM chat
g. Photo display
h. snapchat
4. Who else would you like to do this experience with in future?
Capture and Share
1. What device/devices did you use to take photos?
2. How often were you taking photos?
3. What kind of photos did you take?
4. Did you edit photos before sharing? Approximatly, how many of them?
5. Why did you share your photos with your family?
Figure A.5: Interview guidance for phase 3 in the field study of family group
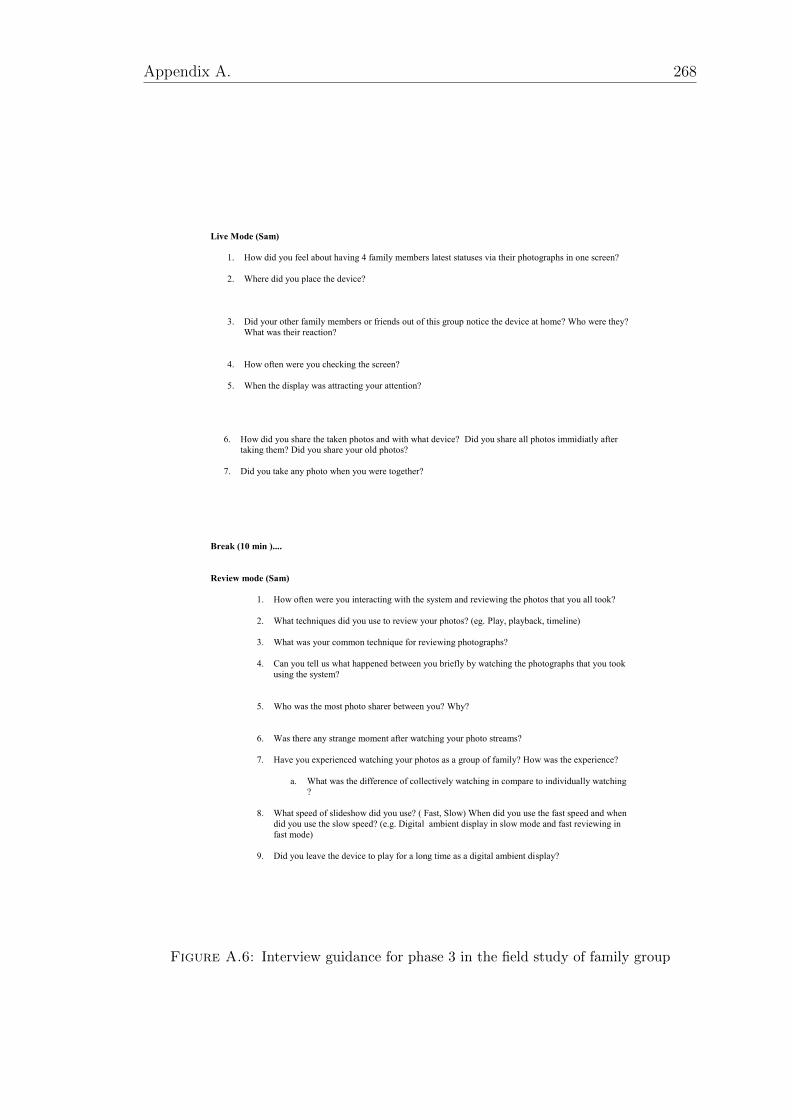
Appendix A. 268
Live Mode (Sam)
1. How did you feel about having 4 family members latest statuses via their photographs in one screen?
2. Where did you place the device?
3. Did your other family members or friends out of this group notice the device at home? Who were they?
What was their reaction?
4. How often were you checking the screen?
5. When the display was attracting your attention?
6. How did you share the taken photos and with what device? Did you share all photos immidiatly after
taking them? Did you share your old photos?
7. Did you take any photo when you were together?
Break (10 min )....
Review mode (Sam)
1. How often were you interacting with the system and reviewing the photos that you all took?
2. What techniques did you use to review your photos? (eg. Play, playback, timeline)
3. What was your common technique for reviewing photographs?
4. Can you tell us what happened between you briefly by watching the photographs that you took
using the system?
5. Who was the most photo sharer between you? Why?
6. Was there any strange moment after watching your photo streams?
7. Have you experienced watching your photos as a group of family? How was the experience?
a. What was the difference of collectively watching in compare to individually watching
?
8. What speed of slideshow did you use? ( Fast, Slow) When did you use the fast speed and when
did you use the slow speed? (e.g. Digital ambient display in slow mode and fast reviewing in
fast mode)
9. Did you leave the device to play for a long time as a digital ambient display?
Figure A.6: Interview guidance for phase 3 in the field study of family group

Appendix A. 269
10. Did you use the single window slideshow? How and when did you use that?
11. Whose photo stream did you see on that mode?
12. Which one did you use the most? Single or multiple windows slideshow? Why?
Design
1. How can we re-design the system better? Any improvment and change?
2. What do you think about A-symmetrical (Setting privacy for each person) design of this system?
3. How many people would you like to see on the screen? Can you explain more?
4. What is your idea about the size of the display and the number of people?
Switch audio recorder off...
Figure A.7: Interview guidance for phase 3 in the field study of family group

Appendix A. 270
Figure A.8: Ethics approval

Appendix A. 271
Figure A.9: Ethics approval
Bibliography
[1] Sian E Lindley, Richard Harper, Dave Randall, Maxine Glancy, and Nicola
Smyth. Fixed in time and time in motion: mobility of vision through a sense-
cam lens. In Proceedings of the 11th International Conference on Human-
Computer Interaction with Mobile Devices and Services, page 2. ACM, 2009.
[2] David M Frohlich. Audiophotography: Bringing photos to life with sounds,
volume 3. Springer, 2004.
[3] David F Huynh, Steven M Drucker, Patrick Baudisch, and Curtis Wong.
Time quilt: scaling up zoomable photo browsers for large, unstructured
photo collections. In CHI’05 extended abstracts on Human factors in com-
puting systems, pages 1937–1940. ACM, 2005.
[4] Kan Ren, Janko Calic, and Risto Sarvas. User study of the free-eye photo
browsing interface. In Image Analysis for Multimedia Interactive Services
(WIAMIS), 2010 11th International Workshop on, pages 1–4. IEEE, 2010.
[5] Ya-Xi Chen, Michael Reiter, and Andreas Butz. Photomagnets: supporting
flexible browsing and searching in photo collections. In International Con-
ference on Multimodal Interfaces and the Workshop on Machine Learning
for Multimodal Interaction, page 25. ACM, 2010.
[6] Carsten Rother, Sanjiv Kumar, Vladimir Kolmogorov, and Andrew Blake.
Digital tapestry [automatic image synthesis]. In Computer Vision and Pat-
tern Recognition, 2005. CVPR 2005. IEEE Computer Society Conference
on, volume 1, pages 589–596. IEEE, 2005.
272
Bibliography 273
[7] Jingdong Wang, Long Quan, Jian Sun, Xiaoou Tang, and Heung-Yeung
Shum. Picture collage. In Computer Vision and Pattern Recognition, 2006
IEEE Computer Society Conference on, volume 1, pages 347–354. IEEE,
2006.
[8] Wei-Ta Chu, Jun-Cheng Chen, and Ja-Ling Wu. Tiling slideshow: an au-
diovisual presentation method for consumer photos. IEEE MultiMedia, 14
(3):36–45, 2007.
[9] Kolbeinn Karlsson, Wei Jiang, and Dong-Qing Zhang. Mobile photo album
management with multiscale timeline. In Proceedings of the ACM Interna-
tional Conference on Multimedia, pages 1061–1064. ACM, 2014.
[10] Janko Calic, David P Gibson, and Neill W Campbell. Efficient layout of
comic-like video summaries. Circuits and Systems for Video Technology,
IEEE Transactions on, 17(7):931–936, 2007.
[11] Daniel Vogel and Ravin Balakrishnan. Interactive public ambient displays:
transitioning from implicit to explicit, public to personal, interaction with
multiple users. In Proceedings of the 17th annual ACM symposium on User
interface software and technology, pages 137–146. ACM, 2004.
[12] John C Platt. Autoalbum: Clustering digital photographs using probabilistic
model merging. In Content-based Access of Image and Video Libraries, 2000.
Proceedings. IEEE Workshop on, pages 96–100. IEEE, 2000.
[13] Google. Google deep learning. http://googleresearch.blogspot.co.uk/
2014/11/a-picture-is-worth-thousand-coherent.html, . Accessed De-
cember 25, 2014.
[14] Wei-Ta Chu and Chia-Hung Lin. Automatic selection of representative photo
and smart thumbnailing using near-duplicate detection. In Proceedings of
the 16th ACM international conference on Multimedia, pages 829–832. ACM,
2008.
Bibliography 274
[15] Nirmal Patel, James Clawson, Amy Voida, and Kent Lyons. Mobiphos:
A study of user engagement with a mobile collocated–synchronous photo
sharing application. International Journal of Human-Computer Studies, 67
(12):1048–1059, 2009.
[16] Martijn ten Bhomer, John Helmes, Kenton O’Hara, and Elise Van
Den Hoven. 4photos: a collaborative photo sharing experience. In Proceed-
ings of the 6th Nordic Conference on Human-Computer Interaction: Extend-
ing Boundaries, pages 52–61. ACM, 2010.
[17] Leonard M Ah Kun and Gary Marsden. Co-present photo sharing on mo-
bile devices. In Proceedings of the 9th international conference on Human
computer interaction with mobile devices and services, pages 277–284. ACM,
2007.
[18] Chuljin Jang, Taijin Yoon, and Hwan-Gue Cho. A smart clustering algorithm
for photo set obtained from multiple digital cameras. In Proceedings of the
2009 ACM symposium on Applied Computing, pages 1784–1791. ACM, 2009.
[19] Margit Biemans, Betsy van Dijk, Pavan Dadlani, and Aart van Halteren.
Let’s stay in touch: sharing photos for restoring social connectedness be-
tween rehabilitants, friends and family. In Proceedings of the 11th interna-
tional ACM SIGACCESS conference on Computers and accessibility, pages
179–186. ACM, 2009.
[20] Helen Sharp, Yvonne Rogers, and Jenny Preece. Interaction design: beyond
human-computer interaction. 2002, 2007.
[21] Interchangeprojec. Prototype types example. http://
interchangeproject.org/wp-content/uploads/2012/12/prototype.
jpg. Accessed January 6, 2015.
[22] Android authority. Kinect. http://cdn03.androidauthority.net/
wp-content/uploads/2013/05/kinect_002.jpg. Accessed December 25,
2014.
Bibliography 275
[23] Peter Thomas and Robert D Macredie. Introduction to the new usability.
ACM Transactions on Computer-Human Interaction (TOCHI), 9(2):69–73,
2002.
[24] David Kirk, Abigail Sellen, Carsten Rother, and Ken Wood. Understanding
photowork. In Proceedings of the SIGCHI conference on Human Factors in
computing systems, pages 761–770. ACM, 2006.
[25] Tim Kindberg, Mirjana Spasojevic, Rowanne Fleck, and Abigail Sellen. The
ubiquitous camera: An in-depth study of camera phone use. Pervasive Com-
puting, IEEE, 4(2):42–50, 2005.
[26] Nancy Van House, Marc Davis, Morgan Ames, Megan Finn, and Vijay
Viswanathan. The uses of personal networked digital imaging: an empir-
ical study of cameraphone photos and sharing. In CHI’05 extended abstracts
on Human factors in computing systems, pages 1853–1856. ACM, 2005.
[27] Sara Ljungblad. Passive photography from a creative perspective: If i would
just shoot the same thing for seven days, it’s like... what’s the point? In Pro-
ceedings of the SIGCHI conference on Human Factors in computing systems,
pages 829–838. ACM, 2009.
[28] David Frohlich, Allan Kuchinsky, Celine Pering, Abbe Don, and Steven
Ariss. Requirements for photoware. In Proceedings of the 2002 ACM confer-
ence on Computer supported cooperative work, pages 166–175. ACM, 2002.
[29] Marko Balabanovic, Lonny L Chu, and Gregory J Wolff. Storytelling with
digital photographs. In Proceedings of the SIGCHI conference on Human
Factors in Computing Systems, pages 564–571. ACM, 2000.
[30] Adrian Graham, Hector Garcia-Molina, Andreas Paepcke, and Terry Wino-
grad. Time as essence for photo browsing through personal digital libraries.
In Proceedings of the 2nd ACM/IEEE-CS joint conference on Digital li-
braries, pages 326–335. ACM, 2002.
Bibliography 276
[31] Alexander C Loui and Andreas Savakis. Automated event clustering and
quality screening of consumer pictures for digital albuming. Multimedia,
IEEE Transactions on, 5(3):390–402, 2003.
[32] Benjamin B Bederson. Photomesa: a zoomable image browser using quan-
tum treemaps and bubblemaps. In Proceedings of the 14th annual ACM
symposium on User interface software and technology, pages 71–80. ACM,
2001.
[33] James Fogarty, Jodi Forlizzi, and Scott E Hudson. Aesthetic information
collages: generating decorative displays that contain information. In Pro-
ceedings of the 14th annual ACM symposium on User interface software and
technology, pages 141–150. ACM, 2001.
[34] Tinghuai Wang, John Collomosse, Rui Hu, David Slatter, Darryl Greig,
and Phil Cheatle. Stylized ambient displays of digital media collections.
Computers & Graphics, 35(1):54–66, 2011.
[35] Tim Kindberg, Mirjana Spasojevic, Rowanne Fleck, and Abigail Sellen. I
saw this and thought of you: some social uses of camera phones. In CHI’05
extended abstracts on Human factors in computing systems, pages 1545–
1548. ACM, 2005.
[36] Nancy Van House, Marc Davis, Yuri Takhteyev, Nathan Good, Anita Wil-
helm, and Megan Finn. From “what?” to “why?”: the social uses of personal
photos. In Proc. of CSCW 2004. Citeseer, 2004.
[37] Richard Chalfen. Snapshot versions of life. 1989.
[38] Martin Hand. Ubiquitous photography. Polity, 2012.
[39] Jarno Ojala and Sanna Malinen. Photo sharing in small groups: identify-
ing design drivers for desired user experiences. In Proceeding of the 16th
International Academic MindTrek Conference, pages 69–76. ACM, 2012.
Bibliography 277
[40] Jiajian Chen, Jun Xiao, and Yuli Gao. islideshow: a content-aware slideshow
system. In Proceedings of the 15th international conference on Intelligent
user interfaces, pages 293–296. ACM, 2010.
[41] Risto Sarvas and David M Frohlich. From Snapshots to Social Media-The
Changing Picture of Domestic Photography: The Changing Picture of Do-
mestic Photography. Springer, 2011.
[42] Alejandro Jaimes, Shih-Fu Chang, and Alexander C Loui. Detection of non-
identical duplicate consumer photographs. In Information, Communications
and Signal Processing, 2003 and Fourth Pacific Rim Conference on Multi-
media. Proceedings of the 2003 Joint Conference of the Fourth International
Conference on, volume 1, pages 16–20. IEEE, 2003.
[43] Andrew D Miller and W Keith Edwards. Give and take: a study of consumer
photo-sharing culture and practice. In Proceedings of the SIGCHI conference
on Human factors in computing systems, pages 347–356. ACM, 2007.
[44] Apple. iphone. https://www.apple.com/uk/iphone/, . Accessed December
20, 2014.
[45] Sensecam. Sensecam. http://research.microsoft.com/en-us/um/
cambridge/projects/sensecam/. Accessed December 20, 2014.
[46] Google. Google glass. http://www.google.co.uk/glass/start/, . Ac-
cessed December 21, 2014.
[47] Autographer. Autographer a passive camera. http://www.autographer.
com/#home. Accessed December 20, 2014.
[48] David Frohlich and Jacqueline Fennell. Sound, paper and memorabilia: re-
sources for a simpler digital photography. Personal and Ubiquitous Comput-
ing, 11(2):107–116, 2007.
[49] Richard Chalfen. Family photograph appreciation: Dynamics of medium,
interpretation and memory. Communication & cognition. Monographies, 31
(2-3):161–178, 1998.
Bibliography 278
[50] Microsoft. Microsoft windows. http://windows.microsoft.com/en-us/
windows/home, . Accessed December 21, 2014.
[51] John Boreczky, Andreas Girgensohn, Gene Golovchinsky, and Shingo Uchi-
hashi. An interactive comic book presentation for exploring video. In Pro-
ceedings of the SIGCHI conference on Human factors in computing systems,
pages 185–192. ACM, 2000.
[52] Shingo Uchihashi, Jonathan Foote, Andreas Girgensohn, and John Boreczky.
Video manga: generating semantically meaningful video summaries. In Pro-
ceedings of the seventh ACM international conference on Multimedia (Part
1), pages 383–392. ACM, 1999.
[53] Allan Kuchinsky, Celine Pering, Michael L Creech, Dennis Freeze, Bill Serra,
and Jacek Gwizdka. Fotofile: a consumer multimedia organization and re-
trieval system. In Proceedings of the SIGCHI conference on Human Factors
in Computing Systems, pages 496–503. ACM, 1999.
[54] Timothy J Mills, David Pye, David Sinclair, and Kenneth R Wood. Shoebox:
A digital photo management system. AT&T Laboratories Cambridge, 2000.
[55] Steven M Drucker, Curtis Wong, Asta Roseway, Steven Glenner, and Steven
De Mar. Mediabrowser: reclaiming the shoebox. In Proceedings of the work-
ing conference on Advanced visual interfaces, pages 433–436. ACM, 2004.
[56] Tao Mei, Bin Wang, Xian-Sheng Hua, He-Qin Zhou, and Shipeng Li. Prob-
abilistic multimodality fusion for event based home photo clustering. In
Multimedia and Expo, 2006 IEEE International Conference on, pages 1757–
1760. IEEE, 2006.
[57] Nicholas Diakopoulos and Irfan Essa. Mediating photo collage authoring. In
Proceedings of the 18th annual ACM symposium on User interface software
and technology, pages 183–186. ACM, 2005.
[58] Wikipedia. Mac os. http://en.wikipedia.org/wiki/Mac_OS, . Accessed
December 29, 2014.
Bibliography 279
[59] Cunxun Zang, Yu Fu, Jian Cheng, Hanqing Lu, and Jian Ma. Human-
centered picture slideshow personalization for mobile devices. In Multime-
dia and Expo, 2009. ICME 2009. IEEE International Conference on, pages
1398–1401. IEEE, 2009.
[60] Huiying Liu, Qingming Huang, and Shuqiang Jiang. Attention based album
slideshow. In Image and Video Technology (PSIVT), 2010 Fourth Pacific-
Rim Symposium on, pages 370–375. IEEE, 2010.
[61] Peter Dunker, Christian Dittmar, Andre Begau, Stefanie Nowak, and
Matthias Gruhne. Semantic high-level features for automated cross-
modal slideshow generation. In Content-Based Multimedia Indexing, 2009.
CBMI’09. Seventh International Workshop on, pages 144–149. IEEE, 2009.
[62] Scott McCloud. Understanding comics: The invisible art. Northampton,
Mass, 1993.
[63] Apple. iphoto. https://www.apple.com/uk/mac/iphoto/, . Accessed De-
cember 25, 2014.
[64] classroom synonym. Multiple narrative. http://classroom.synonym.com/
multiple-narrative-1808.html. Accessed December 25, 2014.
[65] Harry Brignull and Yvonne Rogers. Enticing people to interact with large
public displays in public spaces. In Proceedings of INTERACT, volume 3,
pages 17–24, 2003.
[66] Thorsten Prante, Carsten Rocker, Norbert Streitz, Richard Stenzel, Carsten
Magerkurth, Daniel Van Alphen, and Daniela Plewe. Hello. wall–beyond am-
bient displays. In Adjunct Proceedings of Ubicomp, pages 277–278. Citeseer,
2003.
[67] Norbert A Streitz, Carsten Rocker, Thorsten Prante, Richard Stenzel, and
Daniel van Alphen. Situated interaction with ambient information: Facili-
tating awareness and communication in ubiquitous work environments. In
Bibliography 280
Tenth International Conference on Human-Computer Interaction (HCI In-
ternational 2003). Citeseer, 2003.
[68] Mark Weiser and John Seely Brown. Designing calm technology. PowerGrid
Journal, 1(1):75–85, 1996.
[69] Lars Erik Holmquist and Tobias Skog. Informative art: information visu-
alization in everyday environments. In Proceedings of the 1st international
conference on Computer graphics and interactive techniques in Australasia
and South East Asia, pages 229–235. ACM, 2003.
[70] Sunny Consolvo, Peter Roessler, and Brett E Shelton. The carenet dis-
play: lessons learned from an in home evaluation of an ambient display. In
UbiComp 2004: Ubiquitous Computing, pages 1–17. Springer, 2004.
[71] Margit Biemans and Betsy Van Dijk. Food for talk: Photo frames to sup-
port social connectedness for elderly people in a nursing home. In Euro-
pean Conference on Cognitive Ergonomics: Designing beyond the Product—
Understanding Activity and User Experience in Ubiquitous Environments,
page 15. VTT Technical Research Centre of Finland, 2009.
[72] Han-Sol Ryu, Yeo-Jin Yoon, Myeong-Eun Lim, Chan-Yong Park, Soo-Jun
Park, and Soo-Mi Choi. Picture navigation using an ambient display and
implicit interactions. In Proceedings of the 19th Australasian conference on
Computer-Human Interaction: Entertaining User Interfaces, pages 223–226.
ACM, 2007.
[73] Kenton O’Hara, John Helmes, Abigail Sellen, Richard Harper, Martijn ten
Bhomer, and Elise van den Hoven. Food for talk: phototalk in the context
of sharing a meal. Human–Computer Interaction, 27(1-2):124–150, 2012.
[74] Abigail Durrant, Alex S Taylor, David Frohlich, Abigail Sellen, and David
Uzzell. Photo displays and intergenerational relationships in the family
home. In Proceedings of the 23rd British HCI Group Annual Conference
on People and Computers: Celebrating People and Technology, pages 10–19.
British Computer Society, 2009.
Bibliography 281
[75] Patrick Baudisch and Gerry Chu. Back-of-device interaction allows creat-
ing very small touch devices. In Proceedings of the SIGCHI Conference on
Human Factors in Computing Systems, pages 1923–1932. ACM, 2009.
[76] Denis Simakov, Yaron Caspi, Eli Shechtman, and Michal Irani. Summa-
rizing visual data using bidirectional similarity. In Computer Vision and
Pattern Recognition, 2008. CVPR 2008. IEEE Conference on, pages 1–8.
IEEE, 2008.
[77] Bongwon Suh, Haibin Ling, Benjamin B Bederson, and David W Jacobs.
Automatic thumbnail cropping and its effectiveness. In Proceedings of the
16th annual ACM symposium on User interface software and technology,
pages 95–104. ACM, 2003.
[78] Shai Avidan and Ariel Shamir. Seam carving for content-aware image resiz-
ing. In ACM Transactions on graphics (TOG), volume 26, page 10. ACM,
2007.
[79] Apple. Apple tv. https://www.apple.com/uk/appletv/, . Accessed De-
cember 25, 2014.
[80] Kerry Rodden and Kenneth R Wood. How do people manage their digital
photographs? In Proceedings of the SIGCHI conference on Human factors
in computing systems, pages 409–416. ACM, 2003.
[81] Adobe. Adobe elements. http://www.adobe.com/uk/products/
photoshop-elements.html. Accessed December 25, 2014.
[82] Google. Picasa. http://picasa.google.com/, . Accessed December 25,
2014.
[83] Flickr. Flickr. https://www.flickr.com/. Accessed December 25, 2014.
[84] Facebook. Facebook. https://www.facebook.com/, . Accessed December
25, 2014.
Bibliography 282
[85] Shutterfly. Shutterfly. http://www.shutterfly.com/
kodakgallery/?cid=SEGOO.BRAND&kw=kodak+gallery_exact&gclid=
CPKCrKWb7sICFauWtAoddykAkg&mpch=ads&esch=1, . Accessed December
25, 2014.
[86] Marc Davis, Simon King, Nathan Good, and Risto Sarvas. From context to
content: leveraging context to infer media metadata. In Proceedings of the
12th annual ACM international conference on Multimedia, pages 188–195.
ACM, 2004.
[87] Anil K Jain, M Narasimha Murty, and Patrick J Flynn. Data clustering: a
review. ACM computing surveys (CSUR), 31(3):264–323, 1999.
[88] EXIF. Exif. http://www.exiv2.org/Exif2-2.PDF. Accessed December 25,
2014.
[89] Matthew Cooper, Jonathan Foote, Andreas Girgensohn, and Lynn Wilcox.
Temporal event clustering for digital photo collections. ACM Transac-
tions on Multimedia Computing, Communications, and Applications (TOM-
CCAP), 1(3):269–288, 2005.
[90] Ullas Gargi. Consumer media capture: Time-based analysis and event clus-
tering. HP-Labs Tech Report, 2003.
[91] Ullas Gargi. Modeling and clustering of photo capture streams. In Proceed-
ings of the 5th ACM SIGMM international workshop on Multimedia infor-
mation retrieval, pages 47–54. ACM, 2003.
[92] Risto Sarvas, Erick Herrarte, Anita Wilhelm, and Marc Davis. Metadata
creation system for mobile images. In Proceedings of the 2nd international
conference on Mobile systems, applications, and services, pages 36–48. ACM,
2004.
[93] Kentaro Toyama, Ron Logan, and Asta Roseway. Geographic location tags
on digital images. In Proceedings of the eleventh ACM international confer-
ence on Multimedia, pages 156–166. ACM, 2003.
Bibliography 283
[94] Mor Naaman, Ron B Yeh, Hector Garcia-Molina, and Andreas Paepcke.
Leveraging context to resolve identity in photo albums. In Digital Libraries,
2005. JCDL’05. Proceedings of the 5th ACM/IEEE-CS Joint Conference on,
pages 178–187. IEEE, 2005.
[95] Liangliang Cao, Jiebo Luo, Henry Kautz, and Thomas S Huang. Annotating
collections of photos using hierarchical event and scene models. In Computer
Vision and Pattern Recognition, 2008. CVPR 2008. IEEE Conference on,
pages 1–8. IEEE, 2008.
[96] Vaiva Kalnikaite, Abigail Sellen, Steve Whittaker, and David Kirk. Now
let me see where i was: understanding how lifelogs mediate memory. In
Proceedings of the SIGCHI Conference on Human Factors in Computing
Systems, pages 2045–2054. ACM, 2010.
[97] Pinaki Sinha and Ramesh Jain. Classification and annotation of digital
photos using optical context data. In Proceedings of the 2008 international
conference on Content-based image and video retrieval, pages 309–318. ACM,
2008.
[98] John C Platt, Mary Czerwinski, and Brent A Field. Phototoc: Automatic
clustering for browsing personal photographs. In Information, Communi-
cations and Signal Processing, 2003 and Fourth Pacific Rim Conference on
Multimedia. Proceedings of the 2003 Joint Conference of the Fourth Inter-
national Conference on, volume 1, pages 6–10. IEEE, 2003.
[99] Heng Yang, Qing Wang, and Zhoucan He. Efficient scene image cluster-
ing for internet collections. In Image and Graphics, 2009. ICIG’09. Fifth
International Conference on, pages 471–476. IEEE, 2009.
[100] David G Lowe. Object recognition from local scale-invariant features. In
Computer vision, 1999. The proceedings of the seventh IEEE international
conference on, volume 2, pages 1150–1157. Ieee, 1999.
Bibliography 284
[101] Madirakshi Das and Alexander C Loui. Event classification in personal image
collections. In Multimedia and Expo, 2009. ICME 2009. IEEE International
Conference on, pages 1660–1663. IEEE, 2009.
[102] Facebook. Facebook. www.facebook.com, . Accessed December 20, 2014.
[103] Gang Wei and Ishwar K Sethi. Face detection for image annotation. Pattern
Recognition Letters, 20(11):1313–1321, 1999.
[104] Pinaki Sinha. Summarization of archived and shared personal photo col-
lections. In Proceedings of the 20th international conference companion on
World wide web, pages 421–426. ACM, 2011.
[105] Daniel Kormann, Peter Dunker, and Ronny Paduschek. Automatic rating
and selection of digital photographs. In Semantic Multimedia, pages 192–
195. Springer, 2009.
[106] Stefanie Nowak, Ronny Paduschek, and Uwe Kuhhirt. Photo summary: au-
tomated selection of representative photos from a digital collection. In Pro-
ceedings of the 1st ACM International Conference on Multimedia Retrieval,
page 75. ACM, 2011.
[107] Jun Li, Joo Hwee Lim, and Qi Tian. Automatic summarization for personal
digital photos. In Information, Communications and Signal Processing, 2003
and Fourth Pacific Rim Conference on Multimedia. Proceedings of the 2003
Joint Conference of the Fourth International Conference on, volume 3, pages
1536–1540. IEEE, 2003.
[108] Pinaki Sinha, Hamed Pirsiavash, and Ramesh Jain. Personal photo album
summarization. In Proceedings of the 17th ACM international conference on
Multimedia, pages 1131–1132. ACM, 2009.
[109] Alexandar Jaffe, Mor Naaman, Tamir Tassa, and Marc Davis. Generat-
ing summaries and visualization for large collections of geo-referenced pho-
tographs. In Proceedings of the 8th ACM international workshop on Multi-
media information retrieval, pages 89–98. ACM, 2006.
Bibliography 285
[110] Cliff Lampe, Rick Wash, Alcides Velasquez, and Elif Ozkaya. Motivations to
participate in online communities. In Proceedings of the SIGCHI conference
on Human factors in computing systems, pages 1927–1936. ACM, 2010.
[111] Instagram. Instagram. www.instagram.com. Accessed December 20, 2014.
[112] Sanna Malinen. Strategies for gaining visibility on flickr. In System Sciences
(HICSS), 2011 44th Hawaii International Conference on, pages 1–9. IEEE,
2011.
[113] Jose Van Dijck. Digital photography: communication, identity, memory.
Visual Communication, 7(1):57–76, 2008.
[114] Frank Bentley, Crysta Metcalf, and Gunnar Harboe. Personal vs. commer-
cial content: the similarities between consumer use of photos and music.
In Proceedings of the SIGCHI conference on Human Factors in computing
systems, pages 667–676. ACM, 2006.
[115] Michael S Bernstein, Adam Marcus, David R Karger, and Robert C Miller.
Enhancing directed content sharing on the web. In Proceedings of the
SIGCHI Conference on Human Factors in Computing Systems, pages 971–
980. ACM, 2010.
[116] Shutterfly. Kodak gallery. http://www.shutterfly.com/
kodakgallery/?cid=SEGOO.BRAND&kw=kodak+gallery_exact&gclid=
CIadqbLMyMMCFTDMtAod90UAzA&mpch=ads&esch=1, . Accessed December
29, 2014.
[117] Snapfish. Snapfish. http://www3.snapfish.co.uk/snapfishuk/
welcome/campaignName=semuk_go_brand_gifts/retusr=true?gclid=
CIeTndnMyMMCFcMSwwod-R4Abg&gclsrc=aw.ds. Accessed December 29,
2014.
[118] Apple. icloud photo sharing. https://www.apple.com/uk/icloud/
photos/, . Accessed December 29, 2014.
Bibliography 286
[119] Marc Davis, Nancy Van House, Jeffrey Towle, Simon King, Shane Ahern,
Carrie Burgener, Dan Perkel, Megan Finn, Vijay Viswanathan, and Matthew
Rothenberg. Mmm2: mobile media metadata for media sharing. In CHI’05
extended abstracts on Human factors in computing systems, pages 1335–
1338. ACM, 2005.
[120] Risto Sarvas, Mikko Viikari, Juha Pesonen, and Hanno Nevanlinna. Mob-
share: controlled and immediate sharing of mobile images. In Proceedings of
the 12th annual ACM international conference on Multimedia, pages 724–
731. ACM, 2004.
[121] Michael Armbrust, O Fox, Rean Griffith, Anthony D Joseph, Y Katz, Andy
Konwinski, Gunho Lee, David Patterson, Ariel Rabkin, Ion Stoica, et al.
M.: Above the clouds: a berkeley view of cloud computing. 2009.
[122] Christine Rivers, Janko Calic, and Amy Tan. Combining activity theory
and grounded theory for the design of collaborative interfaces. In Human
Centered Design, pages 312–321. Springer, 2009.
[123] Terry Winograd. The design of interaction. In Beyond calculation, pages
149–161. Springer, 1997.
[124] John Thackara. The design challenge of pervasive computing. interactions,
8(3):46–52, 2001.
[125] Jesse James Garrett. Elements of User Experience, The: User-Centered
Design for the Web and Beyond. Pearson Education, 2010.
[126] Alan Dennis, Barabara Haley Wixom, and David Tegarden. Systems Anal-
ysis and Design UML Version 2.0. Wiley, 2009.
[127] BBC. Prototype. http://www.bbc.co.uk/schools/gcsebitesize/dida/
multimedia/multimedia_prototypingrev1.shtml. Accessed January 6,
2015.
[128] Jim Rudd, Ken Stern, and Scott Isensee. Low vs. high-fidelity prototyping
debate. interactions, 3(1):76–85, 1996.
Bibliography 287
[129] Wikipedia. C# programming language. http://en.wikipedia.org/wiki/
C_Sharp_%28programming_language%29, . Accessed January 6, 2015.
[130] W3school. Html. http://www.w3schools.com/html/html_intro.asp, .
Accessed December 25, 2014.
[131] Matlab. Matlab. http://uk.mathworks.com/products/matlab/. Accessed
December 25, 2014.
[132] Microsoft. Sql server. http://www.microsoft.com/en-gb/server-cloud/
products/sql-server/, . Accessed December 25, 2014.
[133] Norman K Denzin and Yvonna S Lincoln. The SAGE handbook of qualitative
research. Sage, 2011.
[134] Andrew Monk. User-centred design. In Home Informatics and Telematics,
pages 181–190. Springer, 2000.
[135] John McCarthy, Peter Wright, Jayne Wallace, and Andy Dearden. The
experience of enchantment in human–computer interaction. Personal and
Ubiquitous Computing, 10(6):369–378, 2006.
[136] John McCarthy and Peter Wright. Technology as experience. interactions,
11(5):42–43, 2004.
[137] Anselm Strauss and Juliet M Corbin. Basics of qualitative research:
Grounded theory procedures and techniques. Sage Publications, Inc, 1990.
[138] H Coolican. Research methods and statistics in psychology. 1999.
[139] John W Creswell and Vicki L Plano Clark. Designing and conducting mixed
methods research. 1994.
[140] Egon G Guba, Yvonna S Lincoln, et al. Competing paradigms in qualitative
research. Handbook of qualitative research, 2:163–194, 1994.
[141] Matthew B Miles and A Michael Huberman. Qualitative data analysis: An
expanded sourcebook. Sage, 1994.
Bibliography 288
[142] Sharan B Merriam. Case study research in education: A qualitative approach.
Jossey-Bass, 1988.
[143] Mizuko Ito and Daisuke Okabe. Camera phones changing the definition of
picture-worthy. Japan Media Review, 29, 2003.
[144] Sian E Lindley, Dave Randall, M Glancy, N Smyth, and R Harper. Reflecting
on oneself and on others: Multiple perspectives via sensecam. In CHI 2009
workshop on Designing for Reflection on Experience, 2009.
[145] James Clawson, Amy Voida, Nirmal Patel, and Kent Lyons. Mobiphos:
a collocated-synchronous mobile photo sharing application. In Proceedings
of the 10th international conference on Human computer interaction with
mobile devices and services, pages 187–195. ACM, 2008.
[146] Patrick W Jordan. Designing pleasurable products: An introduction to the
new human factors. CRC Press, 2002.
[147] Victor Minichiello, Rosalie Aroni, Eric Timewell, and Loris Alexander. In-
depth interviewing: principles, techniques, analysis 2nd edition, 1995.
[148] Alex S Taylor and Richard Harper. Age-old practices in the’new world’:
a study of gift-giving between teenage mobile phone users. In Proceedings
of the SIGCHI conference on Human factors in computing systems, pages
439–446. ACM, 2002.
[149] Martyn Denscombe. The Good Research Guide: For Small-Scale Social Re-
search Projects: For small-scale social research projects. McGraw-Hill Inter-
national, 2010.
[150] William MK Trochim and JP Donnelly. Research methods: The concise
knowledge base. Atomic Dog Pub., 2005.
[151] Margaret L McLaughlin, Gaurav Sukhatme, Cyrus Shahabi, Joao Hespanha,
Antonio Ortega, and Gerard Medioni. The haptic museum. In Proceedings
of the EVA 2000 conference on electronic imaging and the visual arts, 2000.
Bibliography 289
[152] Joseph S Dumas and Janice Redish. A practical guide to usability testing.
Intellect Books, 1999.
[153] Dennis Wixon and Chauncey Wilson. The usability engineering framework
for product design and evaluation. Handbook of human-computer interaction,
2:653–68, 1997.
[154] Petter Bae Brandtzæg, Marika Luders, and Jan Havard Skjetne. Too many
facebook “friends”? content sharing and sociability versus the need for pri-
vacy in social network sites. Intl. Journal of Human–Computer Interaction,
26(11-12):1006–1030, 2010.
[155] Richard E Boyatzis. Transforming qualitative information: Thematic anal-
ysis and code development. Sage, 1998.
[156] Jennifer Attride-Stirling. Thematic networks: an analytic tool for qualitative
research. Qualitative research, 1(3):385–405, 2001.
[157] Anthony G Tuckett. Applying thematic analysis theory to practice: A re-
searcher’s experience. Contemporary Nurse, 19(1-2):75–87, 2005.
[158] Tom Meehan, Cathryn Vermeer, and Carol Windsor. Patients’ perceptions
of seclusion: a qualitative investigation. Journal of advanced nursing, 31(2):
370–377, 2000.
[159] Elina Vartiainen and Kaisa Vaananen-Vainio-Mattila. User experience of
mobile photo sharing in the cloud. In Proceedings of the 9th International
Conference on Mobile and Ubiquitous Multimedia, page 4. ACM, 2010.
[160] Andres Lucero, Jussi Holopainen, and Tero Jokela. Mobicomics: collab-
orative use of mobile phones and large displays for public expression. In
Proceedings of the 14th international conference on Human-computer inter-
action with mobile devices and services, pages 383–392. ACM, 2012.
[161] Virginia Braun and Victoria Clarke. Using thematic analysis in psychology.
Qualitative research in psychology, 3(2):77–101, 2006.
Bibliography 290
[162] Investopedia. Quantitative study. http://www.investopedia.com/terms/
q/quantitativeanalysis.asp. Accessed January 6, 2015.
[163] William Albert and Thomas Tullis. Measuring the user experience: collect-
ing, analyzing, and presenting usability metrics. Newnes, 2013.
[164] Lisa Anthony, YooJin Kim, and Leah Findlater. Analyzing user-generated
youtube videos to understand touchscreen use by people with motor im-
pairments. In Proceedings of the SIGCHI Conference on Human Factors
in Computing Systems, CHI ’13, pages 1223–1232, New York, NY, USA,
2013. ACM. ISBN 978-1-4503-1899-0. doi: 10.1145/2470654.2466158. URL
http://doi.acm.org/10.1145/2470654.2466158.
[165] Basak Alper, Benjamin Bach, Nathalie Henry Riche, Tobias Isenberg, and
Jean-Daniel Fekete. Weighted graph comparison techniques for brain con-
nectivity analysis. In Proceedings of the SIGCHI Conference on Human
Factors in Computing Systems, CHI ’13, pages 483–492, New York, NY,
USA, 2013. ACM. ISBN 978-1-4503-1899-0. doi: 10.1145/2470654.2470724.
URL http://doi.acm.org/10.1145/2470654.2470724.
[166] University of Surrey. University of surrey ethics. http://www.surrey.
ac.uk/research/integrity/Research%20Ethics/. Accessed December 5,
2015.
[167] Robert Hariman and John Louis Lucaites. Public identity and collective
memory in us iconic photography: The image of” accidental napalm”. Crit-
ical Studies in Media Communication, 20(1):35–66, 2003.
[168] Jiajian Chen, Jun Xiao, and Yuli Gao. islideshow: A content-aware slideshow
system. In Proceedings of the 15th International Conference on Intelligent
User Interfaces, IUI ’10, pages 293–296, New York, NY, USA, 2010. ACM.
ISBN 978-1-60558-515-4. doi: 10.1145/1719970.1720014. URL http://doi.
acm.org/10.1145/1719970.1720014.
Bibliography 291
[169] Abigail J. Sellen and Steve Whittaker. Beyond total capture: a constructive
critique of lifelogging. Commun. ACM, 53(5):70–77, May 2010. ISSN 0001-
0782. doi: 10.1145/1735223.1735243. URL http://doi.acm.org/10.1145/
1735223.1735243.
[170] Bruce D Lucas, Takeo Kanade, et al. An iterative image registration tech-
nique with an application to stereo vision. In IJCAI, volume 81, pages
674–679, 1981.
[171] Ce Liu, Jenny Yuen, and Antonio Torralba. Sift flow: Dense correspondence
across scenes and its applications. Pattern Analysis and Machine Intelli-
gence, IEEE Transactions on, 33(5):978–994, 2011.
[172] Lars Hallnas and Johan Redstrom. Slow technology–designing for reflection.
Personal and ubiquitous computing, 5(3):201–212, 2001.
[173] Mary C Potter and Ellen I Levy. Recognition memory for a rapid sequence
of pictures. Journal of experimental psychology, 81(1):10, 1969.
[174] Michelle R Greene and Aude Oliva. The briefest of glances the time course
of natural scene understanding. Psychological Science, 20(4):464–472, 2009.
[175] Mary C Potter. Short-term conceptual memory for pictures. Journal of
experimental psychology: human learning and memory, 2(5):509, 1976.
[176] Facebook. Facebook developer page. https://developers.facebook.com/,
. Accessed December 20, 2014.
[177] Facebook. Facebook graph api page. https://developers.facebook.com/
docs/graph-api/reference/v2.2?locale=en_GB, . Accessed December
20, 2014.
[178] Facebook. Facebook fql. https://developers.facebook.com/docs/
reference/fql/, . Accessed December 20, 2014.
[179] W3school. Json array. http://www.w3schools.com/json/json_syntax.
asp, . Accessed December 21, 2014.

Bibliography 292
[180] MSDN. Json array implementation in .net. http://msdn.microsoft.com/
en-gb/library/system.json.jsonarray%28v=vs.95%29.aspx. Accessed
December 20, 2014.
[181] Microsoft. Kinect. http://www.microsoft.com/en-us/
kinectforwindows/, . Accessed December 25, 2014.