abdulaziz alanazi - university of surrey
TRANSCRIPT
I
A Study of Novel forms of Thermoluminescent Media for
Clinical Dosimetry
Thesis
By
Abdulaziz Alanazi
Submitted for the degree of Doctorate of Philosophy
Centre for Nuclear and Radiation Physics Department of Physics
Faculty of Engineering and Physical Sciences University of Surrey
Guildford, Surrey GU2 7XH, UK
September 2017
Copyright © 2017 by Abdulaziz H. Alanazi
II
Dedicated to My Parents and Children:
Hussain S. Alabdali & Alsamra U. Alabdali
Mayar, Odhai, Qusai and Raghad
III
Abstract
This work encompasses studies of two novel materials for radiation dosimetry as well
establishment of a novel technique for dosimetry. Silica-based material and CNTs (carbon
nanotubes) were used as passive radiation dosimeters. The atomic effective numbers (Zeff) for
the silica-based materials (glass beads and optical fibres) are similar to that for the bone
tissue, while carbon nanotubes have effective atomic number (Zeff) similar to that of human
soft tissue. Present studies have been carried out seeking to improve upon the
thermoluminescence (TL) yield of commercially produced small diameter telecommunication
optical fibres as well as glass beads. Their small sizes make them of great interest as they can
fulfil the Bragg–Gray cavity theory. In this thesis, demonstration is made of their utilities to
measure the depth-dose profile for protons and neutrons at therapeutic energies range. In
regard to carbon nanotubes, these were made in thin films (known as buckypaper) with
various thickness ranging from ~10 to ~100 µm to fulfil two conditions; (i) satisfying the
Bragg–Gray cavity theory, and; (ii) to present tissue equivalent material. The CNTs were
examined in using conventional thermoluminescence technique. Then, a novel method of
dosimetry was established by use of x-ray photoelectron spectroscopy (XPS).

IV
Acknowledgements
It is my pleasure to thank those who made this project possible. At the outset, I am heartily
grateful to my supervisor, Professor David Bradley, for his human and professional character
that made me come out from this program with “the full experience”. His encouragement,
guidance and support enabled me to develop an understanding of scientific research. I am
indebted to the scientific and technical staff of the Physics Department and Structure
Analysis Laboratory in the University of Surrey for their valuable help in all respects during
the completion of the project. I also offer my regards and blessings to everyone who
supported me especially my wife, parents, siblings, and all my friends for their continuous
understanding and emotional support. Special thanks to my friends, the young promising
scientist Rashid Yaaqib and Saleh Tchalaby for their support. Last but not least, I take this
opportunity to express my deep gratitude to the Prince Mohammed Medical City (PMMC), in
Al Jouf, in Saudi Arabia for granting me the scholarship to complete my PhD.
V
Contents List of Figures .................................................................................................................... XII
Chapter 1 .............................................................................................................................. 1
1 Introduction ................................................................................................................... 1
Chapter 2 .............................................................................................................................. 3
2 Brief overview of Radiation Interaction with Matter ...................................................... 3
2.1.1 Photoelectric Effect .......................................................................................... 4
2.1.2 Compton Scattering ......................................................................................... 4
2.1.3 Pair Production ................................................................................................ 5
2.1.4 Beams Attenuation ........................................................................................... 7
2.1.5 Electrons Stopping Power ................................................................................ 7
Chapter 3 .............................................................................................................................. 9
3 Radiation Therapy Dosimetry: Literature Review .......................................................... 9
3.1.1 Introduction ..................................................................................................... 9
3.2 The Bragg Cavity Theory and its validity .............................................................. 10
3.3 Radiation Therapy ................................................................................................. 11
3.4 Radiation Dosimeters: ........................................................................................... 12
3.5 Application of Dosimeters:.................................................................................... 13
VI
3.5.1 Types of Radiation Dosimeters: ..................................................................... 13
3.6 Physical Principles of Radiation Dosimeters: ........................................................ 19
3.6.1 Accuracy and Precision: ................................................................................. 19
3.6.2 Linearity: ....................................................................................................... 20
3.6.3 Dose Rate Dependence: ................................................................................. 21
3.6.4 Energy Dependence: ...................................................................................... 22
3.6.5 Directional Dependence: ................................................................................ 22
3.6.6 Physical Size and Spatial Resolution: ............................................................. 23
3.6.7 Readout Convenience: ................................................................................... 23
3.6.8 Convenience of Usage: .................................................................................. 24
3.7 Active and Passive Dosimeters: ............................................................................. 24
3.7.1 Active Radiation Dosimeters: ......................................................................... 25
3.7.2 Passive Radiation Dosimeters: ....................................................................... 30
3.8 Thermoluminescence of Ge-doped SiO2 Optical Fibres and Glass Beads............... 31
3.8.1 Introduction ................................................................................................... 31
3.8.2 The Ge-Doped SiO2 Optical Fibres and Glass Beads ...................................... 33
3.8.3 Advantages of Ge-Doped SiO2 Optical Fibres and Glass Beads...................... 34
3.8.4 Limitations in Ge-Doped SiO2 Optical Fibres and Glass Beads ...................... 41
3.8.5 Conclusion in regard to doped silica media .................................................... 42
VII
3.9 The Use of Carbon Nanotubes in Radiation Dosimetry and the Effect of Ionising
Radiation on CNT Structure and Properties ..................................................................... 43
3.9.1 Introduction ................................................................................................... 43
3.9.2 Effect of Ionising Radiation Doses on their Structure and Properties .............. 43
3.9.3 Use of Carbon Nanotubes in Radiation Technology other than Dosimetry ...... 44
3.9.4 Effect of Ionising Radiation Doses on their Structure and Properties .............. 46
3.9.5 Conclusion in regard to CNT media ............................................................... 53
3.10 Methods of Analysis .......................................................................................... 54
3.10.1 Introduction ................................................................................................... 54
3.11 Analytical Methods ........................................................................................... 55
3.11.1 X-ray Photoelectron Spectroscopy ................................................................. 55
3.11.2 Thermal Gravimetric Analysis ....................................................................... 58
3.11.3 Energy Dispersive X-ray Analysis ................................................................. 59
Chapter 4 ............................................................................................................................ 63
4 Silica-Based material Studies ...................................................................................... 63
4.1 Developments in Production of Silica-Based hermoluminescence Dosimeters ....... 63
4.1.1 Introduction ................................................................................................... 63
4.1.2 Silica production routes.................................................................................. 67
4.1.3 Ge-doped optical fibre produced via MCVD technique .................................. 72
VIII
4.1.4 The sol-gel technique ..................................................................................... 73
4.1.5 Ag-doped silica nanoparticles ........................................................................ 74
4.1.6 Examples of fibre TL applications.................................................................. 78
4.1.7 Conclusions ................................................................................................... 83
4.2 Latest developments in silica-based thermoluminescence spectroscopy and
dosimetry ........................................................................................................................ 84
4.2.1 Introduction ................................................................................................... 84
4.2.2 Energy Band Diagram .................................................................................... 86
4.2.3 Energy Level of GeO2-SiO2 Glass .................................................................. 87
4.2.4 Sample Preparation ........................................................................................ 88
4.2.5 Experimental Set-up for Conventional Glow Curves ...................................... 88
4.2.6 The Experimental Set-Up for TL Emission Spectra ........................................ 90
4.2.7 Peak Temperature .......................................................................................... 91
4.2.8 Spectral Analysis ........................................................................................... 92
4.2.9 Cases of Silica Beads Irradiated by an Am-Be Neuron Source ....................... 96
4.2.10 Conclusion ..................................................................................................... 99
4.3 Characterisation of an isotopic neutron source: A comparison of conventional
neutron detectors and micro-silica glass bead thermoluminescent detectors ................... 100
4.3.1 Introduction ................................................................................................. 100
IX
4.3.2 Surface Scan ................................................................................................ 103
4.3.3 Depth Measurement ..................................................................................... 104
4.3.4 Glass Beads ................................................................................................. 104
4.3.5 Calibration ................................................................................................... 105
4.3.6 Monte Carlo Simulation ............................................................................... 106
4.3.7 Results and Discussion ................................................................................. 106
4.3.8 Conclusion and Further Work ...................................................................... 109
Chapter 5 .......................................................................................................................... 111
5 Carbon Nanotubes Buckypaper Radiation Studies for Medical Physics Applications . 111
5.1.1 Introduction ................................................................................................. 111
5.1.2 Carbon Nanotubes ........................................................................................ 111
5.1.3 Buckypaper Samples .................................................................................... 113
5.1.4 Thermogravimetric Analysis, TGA .............................................................. 116
5.1.5 Radiation Sources and System/Sample Set-up .............................................. 121
5.1.6 Results and discussion ................................................................................. 122
5.2 Conclusion .......................................................................................................... 129
Chapter 6 .......................................................................................................................... 130
6 Lower Limits of Detection in using Carbon Nanotubes as Thermoluminescent
Dosimeters of Beta Radiation ............................................................................................ 130
X
6.1.1 Introduction ................................................................................................. 130
6.1.2 Strontium-90 source for Beta Irradiation of CNT Samples ........................... 132
6.1.3 Results and discussion ................................................................................. 133
6.1.4 X-ray Photoelectron Spectroscopy ............................................................... 139
6.1.5 Conclusion ................................................................................................... 141
Chapter 7 .......................................................................................................................... 143
7 Novel Dosimetric Study of sp2 to sp3 Irradiation hybridisation Ratio in Free –Standing
CNTs ................................................................................................................................ 143
7.1.1 Introduction ................................................................................................. 143
7.1.2 Setup of the experiment6.............................................................................. 144
7.1.3 X-ray photoelectron spectroscopy (XPS) ...................................................... 144
7.1.4 Results ......................................................................................................... 148
7.1.4.1 Raw single-wall carbon nanotubes samples ................................................. 148
7.1.4.2 Pure single-wall carbon nanotubes .............................................................. 154
7.1.4.3 Super-pure single-wall carbon nanotubes samples ....................................... 160
7.1.5 Discussion: .................................................................................................. 163
Chapter 8 .......................................................................................................................... 169
8 Conclusion ................................................................................................................ 169
8.1 Future Work ........................................................................................................ 172

XI
9 References ................................................................................................................. 175
10 Appendix ................................................................................................................... 191
XII
List of Figures
Figure 1: The range-energy dependence of product electrons in water, Source (Hendee et al.,
2005)..................................................................................................................................... 3
Figure 2: The Photoelectric effect for high-energy photon interactions. ................................. 4
Figure 3: The Compton scattering effect is energy dependent. ............................................... 5
Figure 4: The Pair Production interaction mechanism. ........................................................... 6
Figure 5: The relationship between the various primary photon interaction mechanisms as a
function of photon energy and the atomic number (Z) of the absorber. From (Evans 1955)
cited in (Knoll 2000). ............................................................................................................ 6
Figure 6: Response characteristics of two dosimetry systems. Source: (Izewska and Rajan,
2005, p.75). ......................................................................................................................... 20
Figure 7: Design Characteristics of the 0.6 cm3 Cylindrical Ionization Chamber. Source:
(Izewska & Rajan, 2005, p.77). ........................................................................................... 26
Figure 8: A Schematic Illustration of an XPS System .......................................................... 56
Figure 9: Typical TGA Instrumentation. Adopted from Duncan Price lecture notes (Price
2006)................................................................................................................................... 59
Figure 10: A Schematic Illustration of the Light Path Subsystem of an EDXRF Spectrometer
........................................................................................................................................... 61
Figure 11: (a) silica molecule; (b) 6-membered ring lattice of silica molecules (adapted from:
http://www.iue.tuwien.ac.at/phd/filipovic/node26.html). ..................................................... 68
Figure 12: Example XRD pattern of silica Nps, the broad peak indicating the silica
nanoparticles to be in an amorphous state. ........................................................................... 75
Figure 13: XRD patterns for Ag-doped silica nanospheres, with crystalline peaks revealing
AgNp within the structure of the pure silica base media. ..................................................... 75
XIII
Figure 14: Mass-normalised nanoparticles TL as a function of radiation dose, the table below
(Table 6) providing information on particle size (Siti Shafiqah et al., 2015). ....................... 76
Figure 15: TL response of pure silica and Ag doped sample within dose range 1- 500 Gy. The
variation in TL yield and error bars of relatively large magnitude are indicative of the control
issues needing to be confronted in product generation. ........................................................ 77
Figure 16: Depth dose distribution of a modulated and un-modulated 62 MeV proton beam.
The upper graph shows the outcome for an undmodulated beam, the parallel plate ion
chamber achieving the predicted peak to plateau ratio of some 5:1 while the fibres approach a
a ratio of 4:1. The lower graph shows the outcome for a modulated beam, the fibres
producing a range that closely agrees with parallel plate ion chamber measurements. .......... 79
Figure 17: TL response of collapsed PCFs and phosphor TLDs subjected to 80 kVp X-ray
irradiation. The inset depicts the TL response of the PCFs and TLD-100 in the absence of
TL-200 data. ....................................................................................................................... 81
Figure 18: Mass normalized TL yield for collapsed PCFs and phosphor TLDs. R1 refers to
the first sample collection (2 months post-burial) and R2 to the second sample collection (4
months post-burial). The five sampling locations, L1 to L5, are identified in Table 7. ......... 82
Figure 19: The glow curve of PCFs obtained in burial at location L1 for the first sample
collection (R1) and second sample collection (R2). ............................................................. 83
Figure 20: Energy band model illustrating the electronic transmissions associated with a TL
material. .............................................................................................................................. 85
Figure21: Modification of the energy band structure of silica by impurity atoms(Ge)or lattice
irregularitiesinthesilicaglassthatcreatelocalizedelectronstates(energy values all in eV).This
figure was constructed with the help of available literature (Randall, 1945; Skuja, 1992, 1998;
Imai andHirashim,1994; Amossov and Ry- baltovsky,1994), showing the various possible
defect energy levels in Ge doped silica. ............................................................................... 86
XIV
Figure 22: The In-house Experimental Setup for measuring emission spectra of the heated
samples P1 and P2............................................................................................................... 89
Figure 23: Glow Curve Deconvolution Analysis for the Oxygen-Rich Sample (P1) ............. 92
Figure 24: Glow Curve Deconvolution Analysis for the Oxygen-Deficient Sample (P2)...... 92
Figure 25: Results of the spectral analysis of samples P1 and P2. The figure illustrates the
total intensity emitted from samples P1 and P2, Sample P2 is characterized by an additional
peak at 5.4 eV. Furthermore, the intensity of P2 is about 12 times that of sample P1. .......... 93
Figure 26: Emission spectrum contour of plot sample P1. The right side of the figure shows
the sample’s relative heat or its associated TL intensity. ...................................................... 95
Figure 27: Emission Spectrum Contour plot of Sample P2. ................................................. 96
Figure 28: Depth-dose distribution in an Am-Be neutron source. (a) 1 mm spatial resolution
depth dose distribution from the Am-Be neutron source; (b) A visual impression of the Monte
Carlo simulation’s mathematical model; (c) Neutron source spectrum; (d) the MCNP Monte
Carlo simulation’s 3 independent runs. ................................................................................ 98
Figure 29: Neutron tank setup and detectors positions for vertical measurement study. While
both the glass beads and gas detectors were depicted in a similar position, their measurements
were undertaken separately. .............................................................................................. 102
Figure 30: Scans across the neutron tank’s surface with the gas detectors. The maximum
intensity appears above the Am-Be source. ....................................................................... 103
Figure 31: individual hollow glass beads. .......................................................................... 104
Figure 32: Vertical Depth Measurements for the 3He Tube and the Glass Beads. ............... 107
Figure 33: Abridged TL Yield Associated with a Mixed Radiation Field. .......................... 108
Figure 34: The structure of Single-Wall Carbon Nanotube, SWCNT, is displayed to the left-
hand side while the Multi-Wall Carbon Nanotubes structure is displayed to the right
(Choudhary and Gupta 2011). Licence: http://creativecommons.org/licenses/by-nc-sa/3.0/ 112
XV
Figure 35: Samples of Buckypaper of different thicknesses have been prepared and developed
in the Nanomaterial and Structure Lab at the University of Surrey..................................... 113
Figure 36: (a) A tip sonication, Branson – Sonifier 150, (b) Eppendorf Centrifuge 5702. .. 114
Figure 37: The preparation of buckypaper in the Material Processing Laboratory at the
University of Surrey, ( a) the mixture before dispersion takes place, (b) the glass stopcock,
(c) the filtration system setup,(d) ) removal of the air bubbles from the solution. .............. 115
Figure 38: The Thermogravimetric Analysis Unit, (a) Cutting the Buckypaper to small pieces,
(b) The small Pan ready to be loaded, (c) The cylindrical furnace and the pan. .................. 117
Figure 39: Thermogravimetric analysis diagram for Buckypaper made of Single-Wall Carbon
Nanotubes. ........................................................................................................................ 118
Figure 40: Thermogravimetric Analysis graph for Triton, illustrating the change in mass
when the temperature is increased from room temperature to 600 ºC under the flow of
nitrogen. ............................................................................................................................ 119
Figure 41: Thermogravimetric Analysis graph for Triton illustrating the change in mass when
the temperature is increased from room temperature to 600 ºC under the flow of air. ......... 120
Figure 42: Scheme of Strontium-90 decay (adopted from (Images SI Inc 2012)). .............. 121
Figure 43: Set-up for the beta irradiation source, 90Sr, the Buckypapers of size (5 × 5mm)
and TLD-100 samples. ...................................................................................................... 122
Figure 44: TL from Buckypaper (sample size 5 × 5 mm) raw SWCNT dispersed in 100 ml of
deionized water using Triton X-100. The results show TL yield post pre-heat of 165 ° C
(Channel Number 0), the temperature subsequently ramping up at 6.5 ° C per second to a
maximum of 330 ° C at channel Number 100. ................................................................... 123
Figure 45: The peak illustrates the TL yield from the raw SWCNT sample post-irradiation,
while the lower line illustrates the TL from the unirradiated sample, post-annealing.......... 124
XVI
Figure 46: The peak illustrates TL yield of raw SWCNT obtained following irradiation to a
beta dose of 2 Gy, the lower line representing subsequent readout from the sample,
demonstrating radical release of the trapped electron and lattice relaxation to have occurred.
......................................................................................................................................... 125
Figure 47: TL from Buckypaper made of pure SWCNT dispersed in 100 ml of deionized
water using Triton X-100 (sample size was 5 × 5mm). ...................................................... 126
Figure 48: The peak illustrates TL yield from pure SWCNT buckypaper irradiated to a dose
of 2 Gy using a beta source 90Sr; the lower line illustrates the signal obtained on second
reading. ............................................................................................................................. 126
Figure 49: TL yield, before irradiation, from buckypaper made of Super-Pure SWCNTs
dispersed in 100ml of deionized water using Triton X-100, (sample size was 5 × 5mm). ... 127
Figure 50: The peak illustrates the TL yield from the super-pure SWCNT sample following
exposure to a dose of 2 Gy using the 90Sr source, and the lower line illustrates the TL yield
from second reading for the same sample. ......................................................................... 128
Figure 51: TL yield from TLD-100 irradiated to a dose of 2 Gy using the 90Sr source. ...... 129
Figure 52: Microscopic view of the Buckypaper sample made of single-wall CNTs. Obtained
using accelerating potential energy of 20 kV, and magnification power of 50,000. The scale is
shown in the form of the 100 nm white bar, provided in the lower part of the figure. ......... 131
Figure 53: Microscope image of one of the buckypaper super-pure single-wall CNT samples,
the image being obtained using an acceleration potential 20 kV and magnification 25x, the
surface roughness being highlighted. A 1mm long scale is provided in the lower part of the
figure. ............................................................................................................................... 131
Figure 54: The diagram shows the beta source irradiation set-up used to expose the CNT
Buckypaper samples.......................................................................................................... 132
XVII
Figure 55: TL yield for the CNTs (the glow curve), encompassed within the temperature
range 180– 250 °C............................................................................................................. 133
Figure 56: Comparison between the energy response for raw, pure, and super-pure (SP)
SWCNTs. The TL yield divided by 1 million to normalize the numbers on the scale of Y-
axis. The inset displays the hyper-sensitivity observed at low doses. ................................. 134
Figure 57: Energy Dispersive X-Ray Analysis (EDX), showing the various elements present
in the raw SWCNT samples. ............................................................................................. 135
Figure 58: TL yield for the CNTs (the glow curve), encompassed within the temperature
range 180– 250 °C............................................................................................................. 136
Figure 59: Comparison between the energy response for raw, pure, and super-pure (SP)
SWCNTs. The TL yield divided by 1 million to normalize the numbers on the scale of Y-
axis. .................................................................................................................................. 137
Figure 60: X-ray Photoelectron Spectroscopy for the super-pure SWCNTs sample pre-
irradiation, showing the separate sp2 and sp3 peaks. ........................................................... 140
Figure 61: X-ray Photoelectron Spectroscopy for the super-pure SWCNTs sample post-
irradiation. The peak of the sp2 and sp3 are displayed. ....................................................... 140
Figure 62: Example for the first derivative for carbon KLL spectra was used to determine the
distance “D” between the most positive maximum and most negative minimum for the raw
sample A, in this case the D-value of 21.0 eV corresponds to the sample pre-irradiation. .. 145
Figure 63: Example for the first derivative for carbon KLL spectra was used to determine the
distance “D” between the most positive maximum and most negative minimum for the raw
sample A, in this case the D-value of 17.7eV for the A sample post irradiation, exposed to a
dose 5.85 Gy. .................................................................................................................... 145
XVIII
Figure 64: Hybridisation of orbital bonding, from sp2 to sp3; for sp2 the angle between the
orbitals is 120° while for sp3 it is 109.5°. The sp2 to sp3 ratio has been observed to change
systematically when the highly carbon-rich sample is exposed to ionising radiation. ......... 146
Figure 65: Examples of samples thickness variations......................................................... 147
Figure 66: Relationship between deposited dose and change in D-value for raw sample A
over the dose range zero to 5.85 Gy; the D-value shows exponential-like reduction with
increase in dose. ................................................................................................................ 149
Figure 67: Display of the percentage sp2 associated with D values for raw sample A. Note
that use has been made of two reference values, namely diamond (100% sp3) and graphite
(100% sp2). ....................................................................................................................... 149
Figure 68: Dose dependent D-values for raw sample D, made using 0.14 g of CNTs, 100 ml
of DI-water and 1 g of Tx-100. .......................................................................................... 151
Figure 69: Percentage sp2 associated with dose-dependent D values for raw sample D. ..... 151
Figure 70: Dose dependent D-values for raw sample H, made using 0.12 g of CNTs, with 100
ml of DI-water and 1 g of Tx-100. ..................................................................................... 152
Figure 71: The percentage of sp2 associated with D values for raw sample H. ................... 153
Figure 72: D-value vs dose for pure sample B1, prepared from 0.05 g CNTs, 100 ml DI-water
and 0.5 g Tx-100. .............................................................................................................. 155
Figure 73: Percentages of sp2 associated with the D values for pure sample B1. ................ 155
Figure 74: D-value vs dose for pure sample B2, prepared using 0.05 g of CNTs, 100 ml DI-
water and 0.5 g of Tx-100. ................................................................................................ 157
Figure 75: The percentages of sp2 associated with the D values for pure sample B2. ......... 157
Figure 76: D-value vs dose for pure sample F, the D-value decreasing in an approximate
linear fashion with dose. .................................................................................................... 159
Figure 77: The percentages of sp2 associated with the D values for pure sample F. ............ 159

XIX
Figure 78: D-value vs dose for super-pure sample G1, the D-value decreasing in a closely
linear fashion with dose. .................................................................................................... 161
Figure 79: The percentage sp2 associated with the D values for super-pure sample G1. ..... 161
Figure 80: D-value vs dose for super-pure sample G2. ...................................................... 162
Figure 81: The percentage sp2 associated with the D values for super-pure sample G2. ..... 163
Figure 82: diagram illustrates the covalent and Van der Waals bonds in the graphite structure.
......................................................................................................................................... 166
1
Chapter 1
1 Introduction
World-wide, there is on-going intensive research into the adaptation of carbon nanotubes
(CNTs) for a wide variety of applications. Numerous studies have attempted to investigate
different properties, including in photonics (Avouris et al., 2008) and radiation sensors (Ma et
al., 2007a, Ma 2008). Of particular note for present interests is that the phenomenon of
luminescence from CNTs has been observed during study of radiation defects on graphite,
specifically by Bonard and his group (Bonard et al., 1998) in investigation of electron field
emission. This has provoked further investigation into carbon structural material, examining
defects induced by beta radiation in graphite and multi-wall carbon nanotubes, MWCNTs
(Chruscinska et al., 2006). That said, the latter study focused almost entirely on defects in the
graphite and multi-wall carbon nanotubes, not considering the potential use of both materials
in radiation physics as a passive radiation dosimeter material. Since it is apparent that very
little research is known to exist in this area of endeavour, representing a potential gap in
knowledge, it is the intention of present work to study the dosimetric characteristics of such
carbon based material, making comparison with other perhaps competitive media.
In the primary investigation, various samples of CNTs are to be irradiated using a range of
sources of ionizing radiation. The thermoluminescence (TL) signal is intended to be detected
from the samples, establishing at the outset the extent to which electron trapping centres exist
in the media types, expected to be of interest given that to-date there have been no known
efforts towards identification of the trapping centres in such media in the literature. The study
aims to further ascertain the radiation sensitivity of CNTs, produced in the form of
buckypaper. Here it is to be mentioned that buckypaper is a network of SWCNT fibres that
form a thin membrane (Wang et al., 2004). By so doing, one wishes to establish baseline data
for applications of buckypaper as a radiation dosimeter media, with potential outlook for
buckypaper-based ion chamber walls and gas sensor devices (Ma et al., 2007b, Modi et al.,
2003). Understanding the effect of radiation on CNTs can help to estimate the limitations on
the sensitivity and precision of any such ion chamber and quality control applications of such
devices.
2
Fundamental understanding of the radiation effect can facilitate optimal implementation of
CNTs in many applications, such as light-weight and strong materials for space applications,
in satellites, aircraft and spacecraft exposed to cosmic radiation. Irradiation-modified thermo
conductivity, electric conductivity and stress-strain properties are of further interest, judged
against a backdrop of pristine CNTs that offer performance rarely matched by other media.
Therefore, the effect of radiation on these properties in CNTs will be also investigated.
Within the present study, and as previously mentioned, comparison will be made of the
performance of CNTs against that of other potential novel competitor media. As an instance,
it is immediately apparent that buckypaper has an effective atomic number (Zeff) that is
similar to that of soft human tissue, pointing to favourable measurement of dose deposited in
the human body. Thus said, precision of measurement represents a considerable challenge
that needs to be achieved in radiation dosimetry. In our primary investigation of the response
of CNTs to ionising radiation it has become immediately clear that weight-for-weight it is not
as sensitive as some known dosimeter materials such as the LiF based TLD-100. While this
may appear to be a setback, the lack of sensitivity could well point to favourable application
of CNTs in dosimetry in cases of elevated doses, such as might be experienced in space
missions, high-energy gamma radiations and heavy particles that need to be contended with
(Parker 2005). In comparing with other novel media, the study will also focus on the TL of
silica fibres (with Zeff approaching that of calcified tissues, bone primarily), directly
comparing dose profiles from different radiotherapy systems that place great demand on
spatial resolution to well below 1 mm. The fibres, purchased from CorActive (Canada), offer
spatial resolution ~ 120 μm, with a doped-core diameter of 50 μm, and a cladding diameter of
123-127 μm. The dimensions and constitution of such media provide the opportunity for in
vivo dosimetry, presently at unprecedented spatial resolution, to be compared against the
buckypaper fabricated down to thicknesses of some few microns, comparable with a fraction
of a cell layer in the human body.
In what is to follow, a brief overview of radiation interaction with matter is first provided. A
more detailed introduction for both materials is then included in the materials and sample
preparations section, forming part of the methodology section. The irradiation methods,
radiotherapy systems used and samples preparation will also be discussed in the same section.
Following that will be an overview of the results obtained to-date, including discussion of
these. Conclusions and prospects for future work will form the last two sections of this thesis.
3
Chapter 2
2 Brief overview of Radiation Interaction with Matter
There are number of possibilities that can occur when ionization radiation interacts with
matter. The result of the interaction can be determined through knowledge of a number of key
parameters that include the energy of the photons (photons being the major source type of
interest herein) and the atomic number of the targeted material. Three main interactions can
occur with photons: the photoelectric effect, Compton scattering and pair production. The
results of these interactions are likely to produce scattered photons, photoelectrons, Compton
electrons, Auger electrons and fluorescence photons and electron-positron pairs.
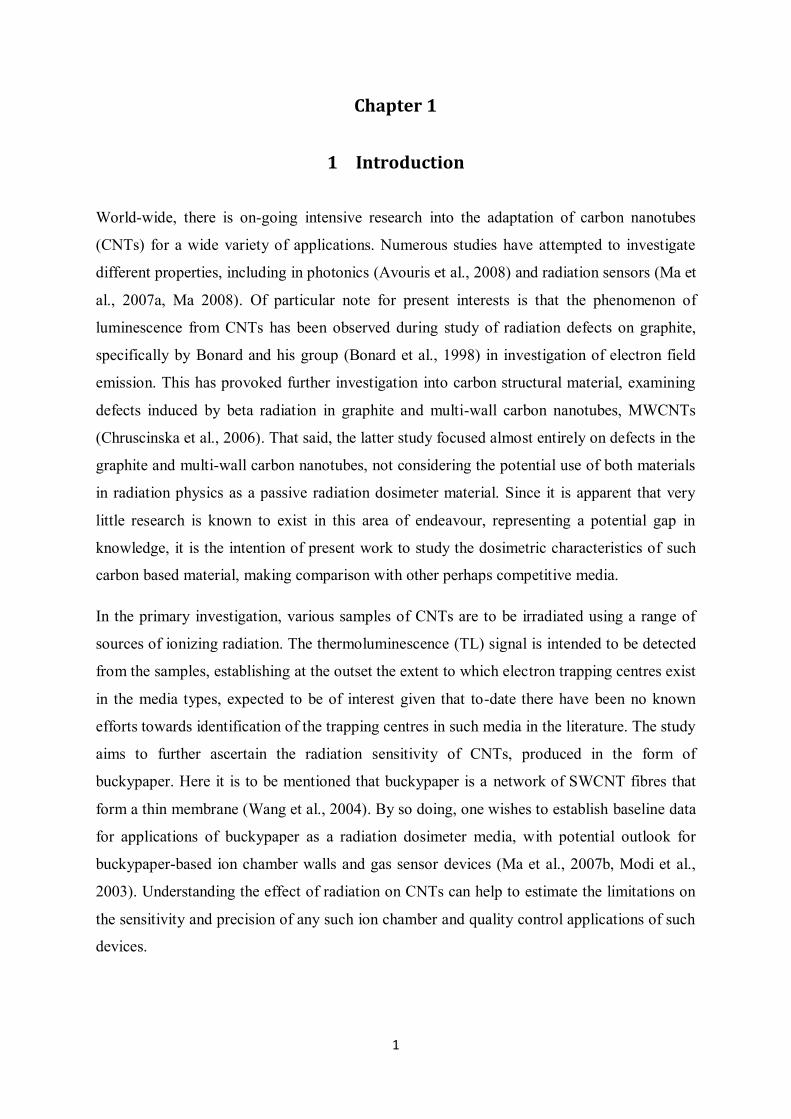
At the atomic level, dose deposition occurs through the slowing down of electrons. As an
example, the range in µm for electrons of different keV energies travelling through water is
displayed in Figure 1, the range increasing with electron energy, albeit in a non-linear fashion
(Hendee et al., 2004).
Figure 1: The range-energy dependence of product electrons in water, Source (Hendee et al., 2005).
In regard to the primary processes for electron production from photon interactions, these are
as discussed below.
4
2.1.1 Photoelectric Effect
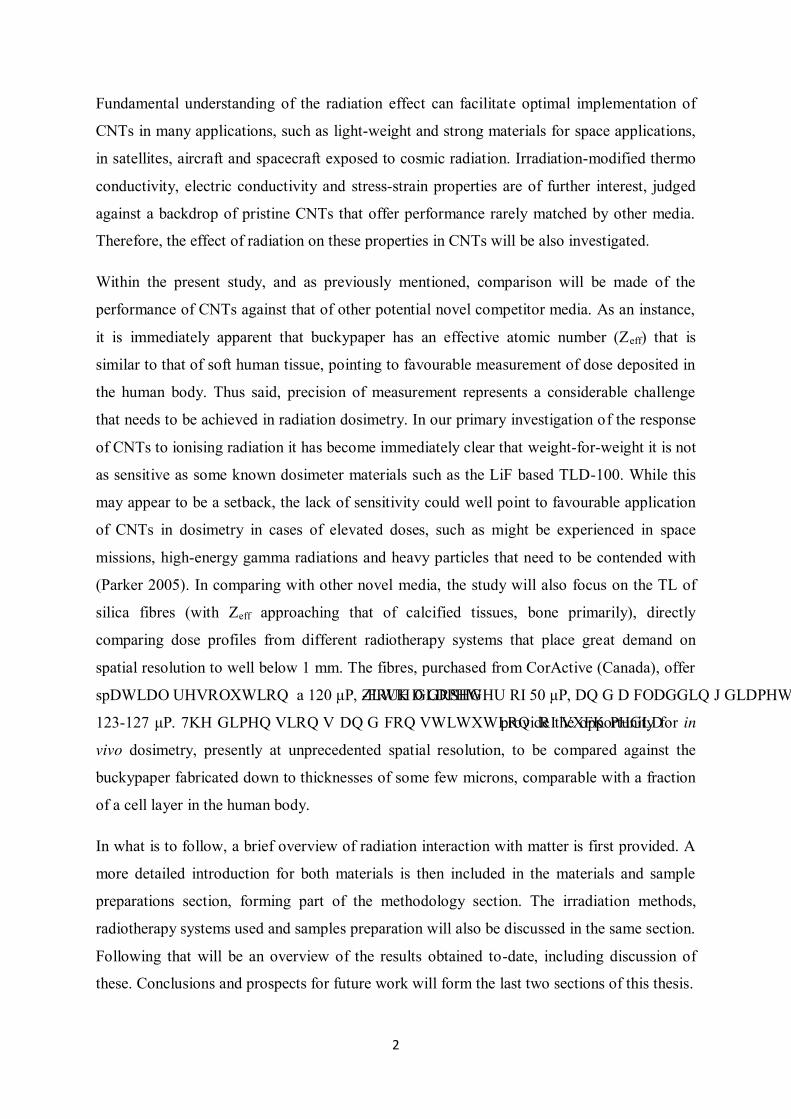
Figure 2: The Photoelectric effect for high-energy photon interactions.
The probability of a photoelectric effect event is directly proportional to some relatively high
power of the atomic number of the medium (~ Z3 to Z4) and inversely proportional to a power
of the energy of the incident photons (typically quoted as E-3). In such an interaction, a
photon of ionising energy is absorbed by an electron, the net result being ejection of the
electron as illustrated in figure 2 for an inner-shell electron, the kinetic energy of the ejected
photoelectron being calculated from the equation below;
bindingk EhvE � …. ( 1 )
Where ℎυ is the energy of the incident photon, 𝐸𝑘 is the energy of the recoil electron, and
𝐸𝑏𝑖𝑛𝑑𝑖𝑛𝑔 is the binding energy of the electron to the nucleus (Turner 2008).
2.1.2 Compton Scattering
The probability of Compton scattering depends on the number of electrons available,
increasing directly with the atomic number and Archimedian density. The energy of the
photons is the main factor in determining the distribution of scattering angles. Figure 3
displays the Compton interaction mechanism.
5
Figure 3: The Compton scattering effect is energy dependent.
Moreover, the probability of Compton scattering decreases with photon energy, but not as
intensely as the photoelectric effect. Compton interactions may contribute a significant
fraction of the total deposited dose for photons energies up to a few MeV (Hendee et al.,
2004).
2.1.3 Pair Production
A photon in the Coulomb field of the nucleus may be annihilated converting its energy to the
production of a positron-electron pair, as illustrated in figure 4. This process is called “Pair
Production”. In this interaction, all of the photon energy is converting into the production of
the pair with an extremely small amount going to the recoil of the nucleus. The equivalent
energy of each electron mass is 0.511 MeV - thus the threshold for the pair production
mechanism is 1.022 MeV. Any further energy is equally divided between the kinetic energy
of the positron and electron. Both particles of the pair will lose energy by atomic ionisation
and excitation as they travel from the point of origin.
6
Figure 4: The Pair Production interaction mechanism.
Ultimately the positron interacts with an electron and the two particles annihilate due to the
different polarity, with their mass energy being transformed into two 0.511 MeV photons
emitted in opposite directions (Turner 2008).
Figure 5: The relationship between the various primary photon interaction mechanisms as a function of photon energy and the atomic number (Z) of the absorber. From (Evans 1955) cited in (Knoll 2000).
7
Figure 5 shows the probability relationship between the various primary photon interactions
as a function of the photon energy and the atomic number of the absorber. As can be seen, the
main dominant interaction for photons in the keV energy range is the photoelectric effect,
greater photon energies resulting in growth of interactions occurring in the Compton region.
Beyond 6 MeV there will be a rapid increase in the Pair Production mechanism. In regard to
medical applications of photons, specifically in radiation therapy, different ranges of photon
energy are selected for use, depending on the location of the tumour. For superficial tumours
the X-ray region is used for which the photoelectric effect is dominant, while for deeper
tumours MeV photons are used for which the Compton effect and pair production become
and start become dominant processes.
2.1.4 Beams Attenuation
As photons are electrically neutral the attenuation is typically characterised in terms of loss of
intensity. In contrast with electrons, photons strongly transport through media while suffering
attenuation, the attenuation for photons being dependent on the energy of the photons and the
effective Z, which is the weight-averaged atomic number for the material. The attenuation for
particular monoenergetic values in a good geometry situation can be calculated by knowing
the linear attenuation coefficient, the thickness of the material, and the intensity of the
incident photons:
…. ( 2 )
where I(x) is the intensity of the transmitted photons and I0 is the intensity of the incident
photons. µ is the linear attenuation coefficient and x is the thickness of the material.
In water, the Compton contribution to the attenuation coefficient becomes equal to the
photoelectric contribution at about 25 keV. The Compton contribution to the attenuation
coefficient becomes dominant when the energy of the photons exceeds 25 keV, until the pair
production mechanism contribution overtakes that of the Compton process at about 30 MeV.
2.1.5 Electrons Stopping Power
When photons interact with matter they produce electrons with a range of energies depending
on the energy of the incident photons and the effective Z of the material. A number of factors
8
dictate the different probability of interactions and thus the resulting electron energy,
including the angle at which the incident photons interact with electrons and location of
atoms within the target medium. Electrons at lower energies predominantly interact via
inelastic collisions with other electrons. For electrons with energies from 10 eV to 10 keV
the major loss mechanism at low effective Z would be by scattering from valence band
electrons. As an instance, for energies from 1 keV to 10 keV the core level contribution
would be less than 10% to the electron interactions. Interactions between the resulting
electrons and the other bound electrons or nuclei in the atom will cause the electrons to
dissipate their energies by ionizing atoms and by bremsstrahlung radiation; consequently the
electrons will eventually stop (Turner 2008).
The stopping power for electrons is different for each material and is energy dependent,
hence S(E). It can be simply defined as the average energy loss per unit path length due to
inelastic collisions with the nucleus or bound electrons of the medium, typically measured in
units of keV µm-1:
.... ( 3 )
By taking density into account, the stopping power can be re-written as:
𝑺‛(𝑬) = – 𝐝𝐄𝛒𝐝𝐱 .... ( 4 )
With units typically quoted in MeV𝑐𝑚2/g. As mentioned, for media of low effective Z,
electrons with energies from 10 eV to 100 keV will dissipate their energy rapidly, the
stopping power being relatively large, in the range 3 to 17 MeV𝑐𝑚2/g (Berger et al., 2011).
Conversely, electrons with energies from 0.1 to 6 MeV would travel further in the medium,
with stopping powers in the range 1 to 3 MeV 𝑐𝑚2 /g. For high Z media (eg gold, Z = 79) the
stopping power for electrons from 10 eV to 100 keV, is also relatively large, within the range
to 1 to 9 MeV 𝑐𝑚2 /g, while at higher energies, 0.1 to 10 MeV, the electrons will travel
further with stopping powers is in the range 0.1 to 1 MeV 𝑐𝑚2/g (Berger et al., 2011).
9
Chapter 3
3 Radiation Therapy Dosimetry: Literature Review
3.1.1 Introduction
According to the International Atomic Energy Agency (IAEA) among numerous other
notables, precision and accuracy are critical elements in atomic science, especially when
measuring invisible phenomena such as ionizing radiation (IAEA 2016). In radiation therapy
(i.e. radiotherapy), ionizing radiation is used in the treatment of cancer patients by destroying
harmful cancerous cells (Zhuang et al., 2016). In the course of radiation therapy treatment,
cancer patients receive extremely specific and targeted quantity/dose of ionizing radiation for
purposes of destroying the harmful cancerous cells (IAEA 2016). Delivering too much or too
little radiation to the targeted cells can have an adverse effect on the cancer patient. In this
regard, the accuracy of predicting and measuring the dose that the whole volume being
irradiated receives thus plays a critical determining role on “the quality of the delivery of
radiation therapy treatment” (Zhuang et al., 2016, p.2). Therefore, the need for enhanced
accuracy and precision in the measurement and delivery of the necessary radiation dose to the
cells has prompted the need for the design and development of in-vivo radiation devices that
ensure the accurate and precise measurement of the radiation dose and its delivery to targeted
tumour cells without occasioning adverse effect on the normal cells (Zhuang et al., 2016).
Radiation dosimetry entails quantitative methods employed in determining the energy
dumped in a medium by projected ionizing radiations (Attix 1986).
The devices that are most commonly employed in radiation dosimetry are the ionization
chamber (IC). However, whereas the IC dosimeter has been regarded as the ‘gold standard’
device for Quality Assurance (QA) in radiation therapy, numerous investigations of the
dosimeters report that these devices utilize relatively high voltages (i.e. several tens of volts
10
or more) to generate the requisite Electric Field (EF) for detecting the ionizing radiation, a
phenomenon that compromises their compatibility and efficiency in in-vivo radiation
dosimetry (Zhuang et al., 2016). In addition, the ICs rely on the “deployment of dose
ionization conversion factors” (Zhuang et al., 2016, p.3), a feature that is largely dependent
on the electron beam dose-rate. Therefore, in view of the foregoing, and given the
significance of the dosimeter in radiation dosimetry, this review explores radiation dosimetry,
with a particular focus on radiation therapy, radiation detectors (i.e. dosimeters), as well as
whether the dosimeter is fulfilling Bragg-Gray Cavity Theory or not (see below). In the next
section, the review provides a brief overview of the concept of radiation therapy.
3.2 The Bragg Cavity Theory and its validity
The Bragg-Gray theory gives route to the determination of absorbed dose in water from a
measurement made in another medium, that of the detector, provided that the following so-
called Bragg-Gray conditions are fulfilled:
1) The cavity (the spatial dimension of the dosimeter) must be small compared to the range of
incident charged particles such that the electron fluence is not perturbed;
2) The absorbed dose in the cavity is deposited solely by the crossing electrons (photon
interactions in the cavity otherwise being considered negligible).
If the cavity does not change the number and energy distribution of crossing electrons in the
irradiated medium, exclusively depositing energy in the cavity, then the following
relationship applies:
𝑬𝒗 = 𝑱𝒗𝑾𝝆 … (5)
11
where is the energy absorbed per unit volume of the medium. is the ionization per unit
volume produced in the cavity. 𝑊 is the average energy lost by the secondary electrons per
pair of ions formed in the cavity, and 𝜌 is the ratio of stopping power of the medium and the
cavity for the secondary electrons. Thus for example, using the NIST ESTAR tabulations for
electrons of energy 60 keV and 200 keV in graphite (density of 1.7 g cm-3), the respective
ranges (using the Completely Slowing Down Approximation, CSDA) are 39 Pm and 300 Pm.
3.3 Radiation Therapy
Radiation therapy, also known as radiotherapy, x-ray therapy, or irradiation, is one of
the methods commonly adopted by oncologists for the treatment of cancer. Other cancer
treatment methods in contemporary medicine, as outlined by (Delwiche 2013), include
chemotherapy and surgery. Radiation therapy can be undertaken alone or administered
together with the other two treatment methods - chemotherapy and surgery. According to the
American Cancer Society (ACS), radiotherapy mainly relies on high-energy particles/waves,
including x-rays, protons, or electron beams to kill tumour cells or cancer cells (ACS 2015).
Treatment of cancer through radiation therapy entails giving the cancer patient specific,
accurate, precise, and targeted doses of radiation. In order to ensure such precision and
accuracy, a dosimeter is placed within a radiation beam, which generates an electrical charge
within the dosimeter (IAEA 2017). Based on the magnitude of current or electric charge,
typically using ICs, radiation therapists are able to determine the corresponding quantity of
deposited energy that is received by the dosimeter (IAEA 2017). The electrical quantity
received by the dosimeter is then converted into a radiation dose through the application of a
calibration coefficient, which is a number that signifies the amount of radiation on the basis
of corresponding electrical quantity (IAEA 2017).
12
However, the accuracy and precision attributed to the measurement of the electrical
quantity is dependent on a number of factors, including the radiation beam in which the
dosimeter is placed (i.e. electrons, protons etc), the material the dosimeter is made of, as well
as the environmental conditions (temperature, pressure and humidity) at the time of
measuring the electrical quantity (IAEA 2017). Therefore, considering its significance in
radiation dosimetry, especially in radiation therapy, what are the various types of radiation
dosimeters employed in radiation therapy? What are the physical principles of the
dosimeter(s)? What are its applications in radiation dosimetry? What advantages and
disadvantages characterize the dosimeter(s) with respect to its application in radiation
dosimetry? Is the dosimeter soft or calcified tissue equivalent? Is the dosimeter fulfilling the
Bragg-Gray Cavity Theory? The next sections of the review thus attempt to answer these
questions.
3.4 Radiation Dosimeters:
(Izewska and Rajan 2005) described a radiation dosimeter as a medical device that is
used by radiation therapists or oncologists to measure and/or evaluate the quantities of the
absorbed or equivalent dose, or the dose rates, or relative amounts of ionizing radiation. The
radiation dosimeter is complemented with a reader, and together these constitute a dosimetry
system (Izewska and Rajan, 2005). The dosimetry system is employed in the experimental
determination of the dosimetric quantity, the value of which is the outcome of the
measurement and which is “expressed as the product of a numerical value and an appropriate
unit” (Izewska and Rajan, 2005, p.71). The dosimeters are applicable in a number of areas as
explored in the following subsection.
13
3.5 Application of Dosimeters:
Generally, dosimeters can be applied in a number of fields, including diagnostic,
radiology, radiation therapy, etc. The application of dosimeters is dealt with in-depth later in
the course of the review.
3.5.1 Types of Radiation Dosimeters:
A number of radiation dosimeters have been developed, tested, and used in radiation
dosimetry for purposes of radiation therapy. Notable examples include thermoluminescent
dosimeters (TLDs), radiochromic films, optical fibres or silica fibres, silicon diodes,
ionization chambers (ICs), and metal-oxide field-effect transistors (MOSFETs) (Hyer et al.,
2009, Lambert et al., 2007, Zhuang et al., 2016). The purposes of this review, radiation
dosimeters are classified into two main techniques namely: active radiation dosimeters/active
radiation detection device and passive detectors (typically integrating dosimeters). The active
radiation dosimeters include ICs, semiconductor diodes, and water-equivalent plastic
scintillation detectors. Passive detectors on the other hand include radiochromic films,
phosphor-based TLDs, Silica-based TLDs and Silica-based fibres. An in-depth review of
these classifications together with their respective medical applications as well as advantages
and disadvantages is presented in the course of this review.
According to Zhuang et al. (2016), the TLD detectors exist in chip, cube or rod types.
Pending treatment, the TLDs can be positioned externally on the body of the patient. In the
subsequent radiation therapy, the TLD detector devices are then able to absorb energy,
ionizations occurring throughout the bulk device (Jarnet et al., 2004). The subsequent readout
requires the heating up of the TLD detector, with consequent emission of visible light from
the typically crystalline medium making up the TLD detector device (Kirby et al., 1986). The
amount of light emitted from the dosimeter medium is most often proportionate to the amount
14
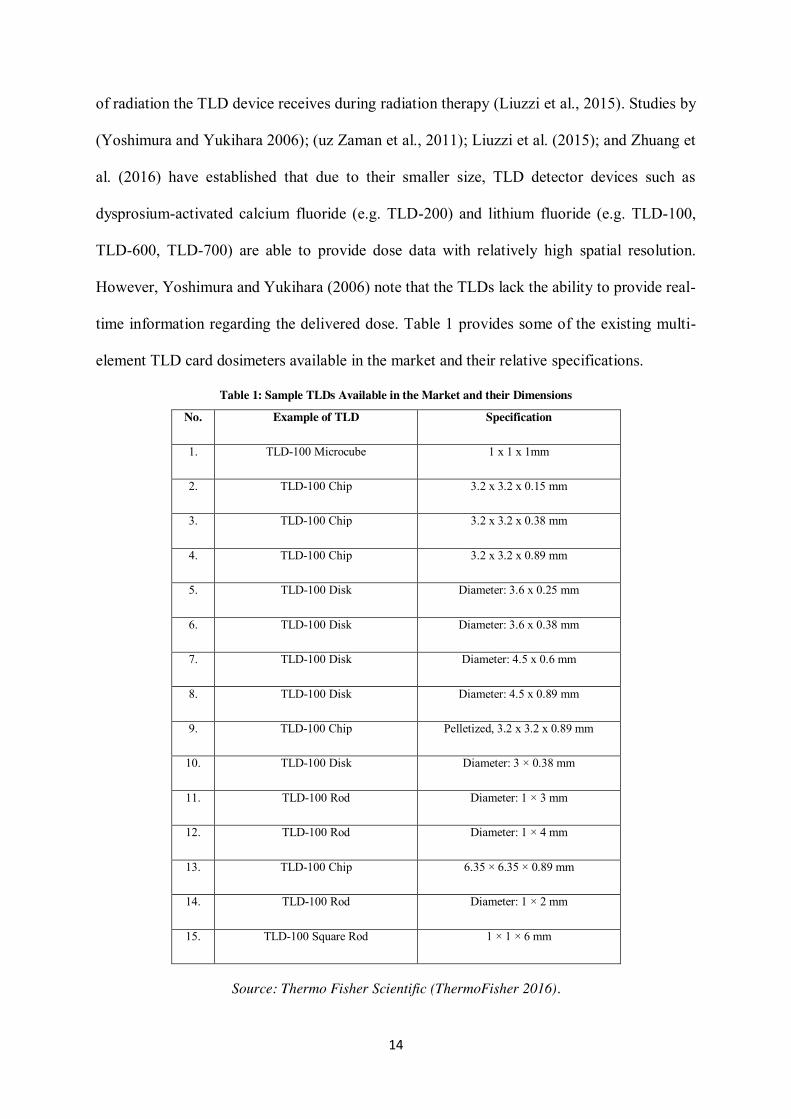
of radiation the TLD device receives during radiation therapy (Liuzzi et al., 2015). Studies by
(Yoshimura and Yukihara 2006); (uz Zaman et al., 2011); Liuzzi et al. (2015); and Zhuang et
al. (2016) have established that due to their smaller size, TLD detector devices such as
dysprosium-activated calcium fluoride (e.g. TLD-200) and lithium fluoride (e.g. TLD-100,
TLD-600, TLD-700) are able to provide dose data with relatively high spatial resolution.
However, Yoshimura and Yukihara (2006) note that the TLDs lack the ability to provide real-
time information regarding the delivered dose. Table 1 provides some of the existing multi-
element TLD card dosimeters available in the market and their relative specifications.
Table 1: Sample TLDs Available in the Market and their Dimensions
No. Example of TLD Specification
1. TLD-100 Microcube 1 x 1 x 1mm
2. TLD-100 Chip 3.2 x 3.2 x 0.15 mm
3. TLD-100 Chip 3.2 x 3.2 x 0.38 mm
4. TLD-100 Chip 3.2 x 3.2 x 0.89 mm
5. TLD-100 Disk Diameter: 3.6 x 0.25 mm
6. TLD-100 Disk Diameter: 3.6 x 0.38 mm
7. TLD-100 Disk Diameter: 4.5 x 0.6 mm
8. TLD-100 Disk Diameter: 4.5 x 0.89 mm
9. TLD-100 Chip Pelletized, 3.2 x 3.2 x 0.89 mm
10. TLD-100 Disk Diameter: 3 × 0.38 mm
11. TLD-100 Rod Diameter: 1 × 3 mm
12. TLD-100 Rod Diameter: 1 × 4 mm
13. TLD-100 Chip 6.35 × 6.35 × 0.89 mm
14. TLD-100 Rod Diameter: 1 × 2 mm
15. TLD-100 Square Rod 1 × 1 × 6 mm
Source: Thermo Fisher Scientific (ThermoFisher 2016).
15
The silica-based optical fibres function in a similar way. However, they have the ability to
provide for much greater spatial resolution, in the range of about 0.1 mm (Bradley et al.,
2017), making them among the smallest of TLDs, also demonstrating great performance and
reliability; for more details see the reviews of David Bradley and group (Bradley et al.,
2012b, Bradley et al., 2017).
In radiation dosimetry, the active silicon diodes are normally characterized by limited
applicability because they are temperature dependent, are damaged by radiation and highly
dependent on photon energy (Dixon and Ekstrand 1982), a phenomenon that (Smith et al.,
1977) attributed to the physical size of the silicon diodes (the physical size of a typically
available single diode is 1.5 × 1.5 × 0.425 mm3). Electronic semiconductor diodes do
however offer certain advantages, given that they can be utilized directly for purposes of
measuring radiation dose, without having to correct for depth dependence (Kinhikar et al.,
2012). Radiochromic films, yet another of the passive dosimeter types, are on the other hand
a radiation dosimeter that has the capacity to provide spatially extensive dimension
measurements for 24-48 hours after radiation therapy (Devic 2011). The radiochromic thin
film (a radiochromic dosimeter) has a dose range of 0.5-200 kGy. The FWT-60 series
Radiochromic Dosimeters available in the market are FWT-60-00 (1 cm x 1 cm x 42-52
microns); FWT-60-20T (10 x 10 cm sheets); FWT-60-20F (15 x 15 cm); and FWT-60-20S
(custom sizes to 45 x 15 cm). One of the disadvantages associated with the radiochromic
films is ironically radiation damage, which leads to the generation of dose intensity
dependence (Zhuang et al., 2016). Also, according to (Liu et al., 2015), the response of the
radiochromic film is dependent on a range of environmental conditions, including
temperature and humidity, all which can have an adverse effect on the dose-rate. Appropriate
factors must therefore be adopted for purposes of correcting the radiochromic film response
results (Zhuang et al., 2016). The MOSFETs, a silicon chip form, typically of dimension (2.5
16
mm × 8 mm × 1.3 mm thick) are on the other hand detectors that measure variations in
voltage shift in the diode before and after exposure of the diode to ionizing radiation
(Yoshizumi et al., 2007). Their small detector size allows pinpoint measurements. In addition
to their small detector size, the MOSFETs are lightweight (minimising any discomfort to the
patient), require minimal power, are easy to use and provide for online readout (Sun et al.,
2017). However, the MOSFETs are known to suffer from an accumulating dose effect, a
phenomenon that significantly limits the lifetime of these dosimeters (Benevides and
Hintenlang 2006). Studies by (Koivisto et al., 2014) and Sun et al. (2017) have also
established that the MOSFETs lack sufficient sensitivity when positioned at distances beyond
10 cm from the radiation source, a phenomenon that limits their utility.
The ICs are often regarded by most authors to be the instruments of choice for
measuring absolute radiation dose (Zhuang et al., 2016). The ICs provide a point-by-point
measurement of radiation, depending on charge generation within an electric field (Zhuang et
al., 2016). Despite being regarded in the practice of radiation therapy as the gold standard
instrument for purposes of ensuring QA, the ICs are not devoid of shortcomings. For
instance, a major disadvantage associated with the IC as a radiation measurement instrument
is its dependence on relatively high voltages to generate the requisite electric field (EF) for
the detection of radiation (Palmans et al., 2010). In this regard, Zhuang et al. (2016) consider
the ICs completely incompatible for in-vivo uses. Another disadvantage associated with the
ICs is that the use of these devices requires “deployment of dose ionization conversion
factors” (Zhuang et al., 2016, p.3), a feature that Zhuang et al. (2016) further note displays an
increasing dependence on electron beam dose-rate, as one example.
In view of the various shortcomings associated with the conventional dosimeters
discussed above, Zhuang et al. (2016) in their study: Embedded Structure Fibre-optic
Radiation Dosimeter for Radiotherapy Applications, presented a novel alternative method for
17
radiation monitoring using scintillators and based on an ordinary plastic optical fibre (POF)
made of polymethyl methacrylate (PMMA). According to Zhuang et al. (2016) this
alternative radiation monitoring approach is characterized by a wide range of advantages,
including low mass, reproducibility, small dimensions, real-time operations, a longer
operating length, continuous sensitivity, insensitivity to external electromagnetic fields, as
well as dose linearity. In addition, Zhuang et al. (2016) note that the alternative radiation
monitoring approach entails a radiation measuring system that is not only simple and robust,
but also clinically compatible.
Scintillating materials used in radiation dosimetry can be classified into organic and
inorganic (Qin et al., 2016). Organic scintillating materials comprise plastic scintillators
(Zhuang et al., 2016). Radiation dosimeters that have been developed using scintillators are
often characterized by a tip composed of a scintillating material that is optically coupled to an
optical fibre end (McCarthy et al., 2014). Exposure of the scintillator to ionizing radiation
leads to the generation of an optical signal that is guided toward a remotely placed detecting
device from the radiation zone by the optical fibre (Zhuang et al., 2016). Separate extensive
literature reviews undertaken by different scholars (Beddar et al., 1992, Beddar et al., 2001,
Clift et al., 2000, Clift et al., 2002) to compare plastic scintillator radiation dosimeters with
traditional detector systems found that the former exhibited desirable dosimetric
characteristics. However, despite their numerous advantages, Zhuang et al. (2016) point out
that the plastic scintillator radiation dosimeters are also not devoid of shortcomings. For
instance, the plastic scintillator radiation dosimeter is characterized by a low signal-to-noise
ratio (SNR), which arises from the Cerenkov radiation emission (Zhuang et al., 2016). In
order to overcome this shortcoming, a parallel-paired fibre light guide together with identical
photomultiplier tubes (PMTs) are incorporated in the design of the plastic scintillator
radiation dosimeter. This helps in subtracting the background signal occasioned by the
18
Cerenkov radiation emission. Nevertheless, Zhuang et al. (2016) contend that this approach
to solving the problem of low SNR leads to a significant enlargement of the volume of the
plastic scintillator radiation dosimeter.
Whereas the organic (i.e. plastic) scintillator radiation dosimeters are characterized by
low SNR, those that are developed using inorganic scintillating materials exhibit high SNR.
For instance, McCarthy et al. (2014) fabricated a radiation dosimeter by employing an
extrinsic fibre optic sensor. The development of the dosimeter fabricated by McCarthy et al.
(2014) entailed injection of a mixture of Gd2O2S:Tb (i.e. a scintillating phosphor material),
hardener, and an epoxy resin onto an exposed PMMA optical fibre. Even though the
fabricated dosimeter demonstrated clinical significance, its design occasioned a homogeneity
shortcoming with “relatively low light efficiency” (cited in Zhuang et al., 2016, p.3), which
consequently limited the dosimeter’s ability to display satisfactory response. Cognizant of the
shortcoming(s) of the dosimeter fabricated by McCarthy et al. (2014), Zhuang et al. (2016)
fabricated a new type of inorganic dosimeter using a novel structure to aid in the
measurement of low-energy absorbed radiation dose from a clinical linear accelerator
(CLINAC). Given its embedded structure, the new inorganic dosimeter by Zhuang et al.
(2016) not only exhibited the advantages associated with inorganic dosimeters, but also
demonstrated ability to overcome the homogenous and low coupling efficiency shortcomings
associated with most dosimeters. An assessment of repeatability and linear response of the
embedded inorganic dosimeter by Zhuang et al. (2016) in accordance with the dose rates of
CLINAC produced a depth-dose curve for a 6 MV photon beam. Therefore, in view of the
foregoing, what then constitute the physical principles of a good dosimeter? The next
subsections of the review explore this important question.
19
3.6 Physical Principles of Radiation Dosimeters:
In order to effectively serve as an effective tool for radiation dosimetry, particularly
for purposes of radiation therapy, the dosimeter is expected to exhibit a range of desirable
characteristics and adhere to certain physical principles. For instance, the radiation dosimeter
is expected to have the ability to accurately determine the exact quantity of absorbed dose to
water at a specific point (Izewska and Rajan, 2005). In addition, Izewska and Rajan (2005)
point out that the dosimeter must precisely derive the dose to the target organ within the
patient, ideally in real-time. In line with the study conducted by Izewska and Rajan (2005),
the physical principles of a radiation dosimeter in the context of this review are characterized
by precision, accuracy, dose/dose-rate dependence, linearity, spatial resolution, energy
response, as well as directional dependence. Nonetheless, it is important to note at this
juncture that no single dosimeter can possess all the desirable characteristics. However, as
pointed out by Bale (1960), the choice of the dosimetry system has to be made judiciously,
taking cognizance of the characteristics of the measurement situation. For instance, for beam
calibrations, radiation therapy ionization chambers are often considered appropriate for
evaluating the dose distribution to the target organs as well as the verification of such dose
(Verma et al., 2016). The following is an in-depth review of the physical principles of
radiation dosimeters.
3.6.1 Accuracy and Precision:
The uncertainty associated with the measurement of radiation in radiotherapy is often
expressed in terms of accuracy and precision, with the latter specifying the reproducibility of
the radiation measurements under similar conditions (Izewska & Rajan, 2005). In
radiotherapy, accuracy of dosimetric measurements implies the proximity of the expected
dosimetric value to the “true/actual value” of the measured quantity of radiation (Horton,
20
1987). Since the results of dosimetric measurements are not often absolutely accurate, the
inaccuracy associated with such measurements is described as “uncertainty” (Izewska and
Rajan, 2005, p.72). In radiotherapy dosimetry, dosimetric measurement uncertainties are
evaluated by using either Type A (statistical methods) or type B (scientific judgment using all
of the relevant information available e.g. manufacture’s specifications, previous measurement
data, etc), see Good Practice Guide No11 (Stephanie 2001).
3.6.2 Linearity:
In the ideal situation, the dosimetric quantity Q and the dosimeter reading M are
expected to be linearly proportional (Izewska & Rajan, 2005). Nevertheless, a non-linear
relationship between the values of M and Q are often witnessed beyond certain dose ranges
(Attix, 1986). The linearity of the relationship between Q and M as well as the non-linearity
behaviour of the values of Q and M are influenced by the type of radiation dosimeter used for
the measurement as well as the physical characteristics of the dosimeter (Izewska & Rajan
2005). Figure 6 presents two typical examples of response characteristics of a dosimeter and
its reader (i.e. the dosimetry system) as used by to explain Izewska and Rajan (2005) to
demonstrate the linearity and non-linearity behavior.
Figure 6: Response characteristics of two dosimetry systems. Source: (Izewska and Rajan, 2005, p.75).
21
In the case of curve A, linearity with dose is first exhibited before supralinear
behaviour is acquired, and a saturation point is then finally attained. This is different from the
case of curve B where linearity is at first exhibited before saturation at high doses is attained
(Izewska & Rajan, 2005). In view of the trends exhibited by the dosimetry system A, as
shown in figure 6, there is need to correct nonlinear behaviour for the dosimetry systems.
According to Izewska and Rajan (2005), even though a dosimeter and its reader may in
certain circumstances display both linear and non-linear characteristics, the combined effect
of the dosimetry system can sometimes result in linearity over wider ranges.
3.6.3 Dose Rate Dependence:
The principle of dose-rate dependence holds that for integrating systems such as the
dosimetry systems of present interest, the measured dosimetric quantity and the rate of the
dosimetric quantity are independent of each other (Sellakumar et al., 2010). In fact, in an
ideal situation, the dosimetric response M/Q (dosimeter reading “M”/dosimetric quantity
“Q”) at two varying dose rates [i.e. (dQ/dt)1 and dQ/dt)2] is expected to be a constant value
(Izewska & Rajan, 2005). However, in practice, the ideal situation rarely exists, and the
dosimeter reading are often influenced by the dose rate (Brualla-González et al., 2015). In
this regard, Izewska and Rajan (2005) urged the need for undertaking appropriate corrections
such as recombining ionization chambers in pulsed beams to establish the correction factors
to account for the incomplete collection of ions at adequately high voltages. Recently,
(Bruggmoser et al., 2006) published saturation coefficients for a different cylindrical
chambers and plane parallel in pulsed electron and photon beams up to 42 mGy pulse−1.
22
3.6.4 Energy Dependence:
In radiotherapy dosimetry, the dosimetry system’s response M/Q is basically
determined by the quality of the radiation beam (the beam energy) in which the dosimeter is
placed (Izewska and Rajan, 2005). Energy dependence refers to a change in instrument
response with respect to the energy of radiation at a constant exposure or exposure rate.
Normally, the calibration of the dosimetry system is intended for a specified radiation beam
quality, and employed for relatively wider energy ranges (Looe et al., 2017). The dosimeter
system’s response to radiation quality variation thus calls for correction (Izewska and Rajan,
2005). In ideal situations, the dosimetry system calibration is expected to be independent of
energy. However, in reality, the determination of Q for a number of radiation measurements
entails the inclusion of the energy correction. The dose to water/tissue is normally the
quantity of interest in the case of radiation therapy (Izewska and Rajan, 2005). Given that no
single dosimeter employed in radiotherapy dosimetry is water/tissue equivalent for every
radiation beam quantities involved, Izewska and Rajan (2005) identified the energy
dependence principle as a critical aspect of the dosimetry system.
3.6.5 Directional Dependence:
The directional or angular dependence of a dosimeter refers to the variation in its
response with the angle of incidence of radiation (Izewska and Rajan, 2005). Based on their
constructional details, the energy of the incident radiation as well as their physical size,
dosimeters often display directional dependence (Orita et al., 2015). The principle of
directional dependence is an important dosimetric characteristic to consider when employing
the dosimetry systems in in-vivo dosimetry, especially when semiconductor dosimeters are
used (Izewska & Rajan, 2005).
23
3.6.6 Physical Size and Spatial Resolution:
Given the point-quantity nature of a dose, an effective dosimeter should allow the
determination of such dose at nanoscale (Izewska and Rajan, 2005). The spatial location of a
dose refers to the location of the point where the dose is determined. Therefore, the spatial
location needs to be clearly defined within a reference coordinate system (Berg et al., 2013).
The MOSFETs and commercial TLDs are examples of point dosimeters (i.e. are relatively
small in dimensions) but so too are the optical fibres, developed with a range of diameters
(0.1 mm to ~ 1 mm), also allowing for the approximation of point measurements (Bradley et
al., 2017). Film dosimeters and gels have impressive 2-D and 3-D resolutions respectively,
and it is ultimately the resolution of the evaluation system that limits the point resolutions in
these dosimeters (Izewska & Rajan, 2005). However, for the ICs, their finite sizes limit their
ability to deliver the requisite sensitivity, although this shortcoming has since been partially
overcome by new generation of pinpoint microchambers (Berg et al., 2013). The original
cylindrical IC (also known as a thimble chamber) was for instance of volume 0.6 cm3. Most
cylindrical ICs have volumes ranging between 0.1 and 1 cm3.
3.6.7 Readout Convenience:
In radiation therapy dosimetry, direct reading dosimeters or active radiation
dosimeters such as ICs are often considered more convenient than their passive counterparts
such as the TLDs and film dosimeters. This is attributed to the fact that passive dosimeters
are only readable upon due processing following the exposure (Izewska & Rajan, 2005). In
addition, the ICs allow for measurement to be undertaken in both integral and differential
modes as opposed to the TLDs and gels, which can only measure in integral mode (Izewska
& Rajan, 2005).
24
3.6.8 Convenience of Usage:
Convenience of use is an important aspect of dosimetric utility in radiation therapy.
Among the various dosimeters available for radiation dosimetry, the ICs are reusable, and
such reusability has minimal or no effect on their sensitivity within their lifespan (Martin
2007). This is perhaps not true for the semiconductor dosimeters, which despite being
reusable, lose their sensitivity gradually within their lifespan (Martin 2007). The films and
gels are designed for measuring dose distribution in a single exposure (Izewska & Rajan,
2005). In terms of handling, the ICs are relatively rugged, and hence their sensitivity are little
affected by handling. This is contrary to the TLDs, whose sensitivity is affected by handling
(Izewska & Rajan, 2005).
3.7 Active and Passive Dosimeters:
In subsection 3.5.1 of this review, it had been stated that this review is essentially
focused on two main classifications of radiation dosimeters, namely active and passive
radiation dosimeters. Izewska and Rajan (2005) while exploring radiation dosimeters
developed five categories of dosimetry systems, namely: (i) ionization chamber dosimetry
systems; (ii) film dosimetry systems; (iii) luminescence dosimetry systems; (iv)
semiconductor dosimetry systems; and (v) other dosimetry systems (e.g. plastic scintillator
dosimetry systems, gel dosimetry systems, diamond dosimeters, etc). Therefore in this
section, and while taking cognizance of the classifications by previous authors, the review
provides an in-depth analysis of the various dosimeters, outlining their characteristics,
applications, advantages, as well as disadvantages, with the ultimate goal of determining two
essential principles; whether the dosimeter fulfills the Bragg-Gray Cavity Theory and
whether is it tissue equivalent.
25
3.7.1 Active Radiation Dosimeters:
To reiterate, active radiation dosimeters are also known as active radiation detection
devices. Under this classification, a number of radiation dosimeters exist, including
dosimeters that belong to the ionization chamber dosimetry system (e.g. the ICs); the
semiconductor dosimetry system (e.g. the semiconductor diodes); as well as other dosimetry
systems such as the plastic scintillator dosimetry system (e.g. the water equivalent plastic
scintillation detectors), gel dosimetry system, and diamond dosimeters. The following
sections provide an in-depth review of the active radiation dosimeters.
3.7.1.1 Ionization Chamber Dosimetry:
The ionization chamber dosimetry system comprises chambers and electrometers,
cylindrical (thimble type) ICs, parallel-plate (plane-parallel) ICs, brachytherapy chambers, as
well as extrapolation chambers. The ICs are mainly employed in radiation therapy and
diagnostic radiology for purposes of determining radiation dose (Sharifi et al., 2015). In
radiation therapy, dose determination is often referred to as beam calibration (Izewska &
Rajan, 2005). The ICs are designed with varying shapes and sizes to meet specific
requirements. Nonetheless, the ICs are essentially designed with gas-filled cavities enclosed
by a conductive outer and a centrally positioned collecting electrode, as shown in figure 7. A
high quality insulator is used to separate the collecting electrode from the wall of the IC. The
separation is necessary for reducing the leakage current when the chamber receives a
polarizing voltage (Izewska and Rajan, 2005). The guard electrode is provided for purposes
of reducing chamber leakage by intercepting leakage current and directing the flow of the
current to the ground. Standard ICs are made of carbon-coated microfilms.
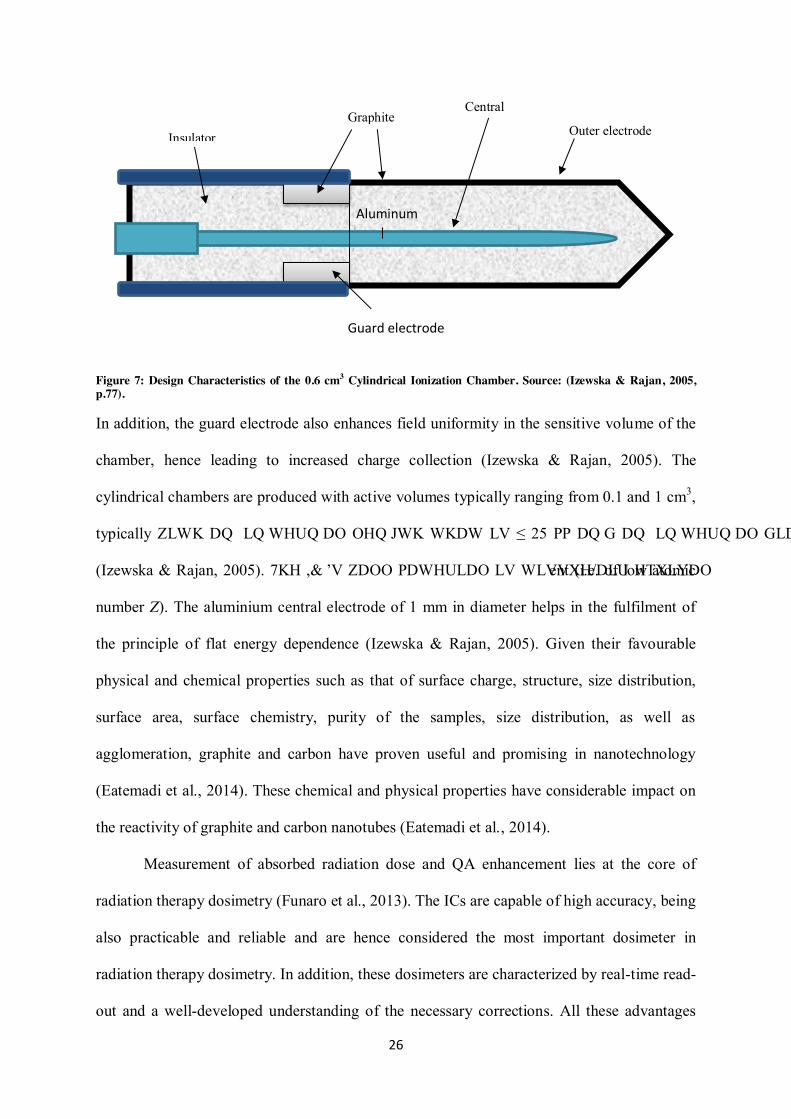
26
Figure 7: Design Characteristics of the 0.6 cm3 Cylindrical Ionization Chamber. Source: (Izewska & Rajan, 2005, p.77).
In addition, the guard electrode also enhances field uniformity in the sensitive volume of the
chamber, hence leading to increased charge collection (Izewska & Rajan, 2005). The
cylindrical chambers are produced with active volumes typically ranging from 0.1 and 1 cm3,
typically with an internal length that is ≤ 25 mm and an internal diameter that is ≤ 7 mm
(Izewska & Rajan, 2005). The IC’s wall material is tissue/air equivalent (i.e. of low atomic
number Z). The aluminium central electrode of 1 mm in diameter helps in the fulfilment of
the principle of flat energy dependence (Izewska & Rajan, 2005). Given their favourable
physical and chemical properties such as that of surface charge, structure, size distribution,
surface area, surface chemistry, purity of the samples, size distribution, as well as
agglomeration, graphite and carbon have proven useful and promising in nanotechnology
(Eatemadi et al., 2014). These chemical and physical properties have considerable impact on
the reactivity of graphite and carbon nanotubes (Eatemadi et al., 2014).
Measurement of absorbed radiation dose and QA enhancement lies at the core of
radiation therapy dosimetry (Funaro et al., 2013). The ICs are capable of high accuracy, being
also practicable and reliable and are hence considered the most important dosimeter in
radiation therapy dosimetry. In addition, these dosimeters are characterized by real-time read-
out and a well-developed understanding of the necessary corrections. All these advantages
Aluminum
Insulator Graphite
Outer electrode Central electrode
Guard electrode
27
thus make the ICs suitable for beam calibration (Izewska & Rajan, 2005). However, their
relatively large physical sizes (i.e. 0.1 and 1 cm3) often limit their spatial resolution (Funaro
et al., 2013). The relatively larger size of the ICs also implies that these dosimeters require a
high bias voltage to attain the appropriate collection of charge, a phenomenon that
compromises their use for in-vivo radiation therapy dosimetry (Zhuang et al., 2016). In
addition, most ICs require connecting cables and a high voltage supply, as well as numerous
corrections, especially for high energy beam dosimetry (Izewska & Rajan, 2005).
Graphite and carbon nanotubes are now being used in the development of ICs to allow
for the development of miniaturized ICs. In addition, the use of graphite and carbon
nanotubes helps in the improvement of IC performance, in terms of best charge collection
efficiency as well as improved working, especially in lower bias voltages as well as zero volts
(Funaro et al., 2013). This was confirmed in a study by Funaro et al. (2013) in which the
researchers proposed novel real-time radiation ICs with collecting electrodes based on
graphene or vertically aligned multiwall carbon nanotubes (MWCNTs). The results of the
study showed that ICs developed based on graphene or carbon nanotubes provided best
charge collection efficiency in addition to working effectively to lower bias voltages and zero
volts (Funaro et al., 2013). In addition, the graphene or carbon nanotube-based ICs do indeed
allow for miniaturization and hence have proved suitable for in-vivo applications (Funaro et
al., 2013).
3.7.1.2 Semiconductor Dosimetry:
The silicon diode dosimeter, a p-n junction diode, is a member of the category of
semiconductor dosimetry systems. For this dosimeter, the production of diodes entails
counter-doping the surface of n-type or p-type to produce the opposite type material (Izewska
and Rajan, 2005). The diodes produced in this manner are referred to in radiation dosimetry
as n-Si or p-Si dosimeters, depending on the material whose surface is counter-doped.
28
Whereas both the n-Si or p-Si dosimeters are available in the market, only the p-Si dosimeters
are suitable for radiation therapy applications (Izewska & Rajan, 2005). This is because the p-
Si dosimeters are least affected by radiation damage. In addition, the p-Si dosimeters are
characterized by small dark current. As a result of irradiation, electron-hole (e-h) pairs and
charges are produced in the dosimeter. The produced charges are then diffused into the
depletion region from where they are dispersed due to the electric field created by the
intrinsic potential. This movement leads to generation of current in the diode, but in the
opposite direction (Izewska and Rajan, 2005).
The semiconductor diodes are suitable for short circuit mode, considering that this
mode is characterized by a linear relationship between the dose and measured charge
(Zhuang et al., 2016). In terms of advantages the diodes are small in size (a popular size is 1.5
× 1.5 × 0.425 mm3) and more sensitive than ICs. However, unlike the ICs, the sensitivity of
diodes changes when used, a result of radiation damage. The diodes are mostly suitable for
measurements in nanofields employed in stereotactic radiosurgery. Contrary to ionization
measured by the ICs, diodes allow for direct measurement of dose distribution when
employed in the measurement of electron beam depth dose (Izewska and Rajan, 2005). These
kinds of dosimeter are not suitable for long radiotherapy treatments because they exhibit
variation in dose response with temperature (Zhuang et al., 2016).
3.7.1.3 Other Dosimetry Systems:
Examples of dosimeters in this category include water equivalent plastic scintillation
dosimeters, diamond dosimeters and the gels. The plastic scintillators are somewhat new
developments in radiation therapy dosimetry. One of the advantages of these dosimeters is
that they can be miniaturized and still provide sufficient sensitivity for radiotherapy
dosimetry. This therefore makes them suitable for use in cases involving high spatial
resolution such as high dose gradient regions and/or interface regions (Izewska and Rajan,
29
2005). In addition, plastic-based scintillation dosimeters have impressive reproducibility and
long-term stability, since they are not significantly affected by radiation damage (Zhuang et
al., 2016). Moreover, these dosimeters are not dependent on dose-rate, and hence are suitable
for use ranging between 10 µGy/min and 10Gy/min (Izewska and Rajan, 2005). Furthermore,
the plastic-based scintillation dosimeters besides not requiring pressure and ambient
temperature, are not characterized by significant directional dependence.
The gels are considered as the only real 3-D dosimeters appropriate for the
measurement of relative dose (Izewska and Rajan, 2005). Apart from being a dosimeter,
Izewska and Rajan (2005) note that the gel is a phantom that has the ability to measure
absorbed dose distribution in a full 3-D geometry. The gels are closely tissue equivalent and
can be fashioned to any desired form and shape. This therefore makes them appropriate for
in-vivo applications (Zhuang et al., 2016). The gel dosimetry can be classified as Fricke MRI
gel and polymer gels. The Fricke MRI gel is based on the Fricke dosimetry, and involves the
dispersal of Fe2+ ions contained in SO4 solution throughout gelatine, PVA matrix, or agarose
(Izewska and Rajan, 2005). The continuous post-irradiation diffusion of Fe2+ ions is regarded
as a major limitation of the Fricke MRI gel (Zhuang et al., 2016). Polymer gel on the other
hand involves dispersal of monomers such as acrylamide in a gelatine or agarose matrix.
Such monomers then undergo a polymerization reaction, giving rise to a 3-D polymer gel
matrix, which can be evaluated using ultrasound or optical tomography (Izewska and Rajan,
2005). Polymer gels are almost water equivalent due to the large portion of water that
characterizes them. The gel dosimetry is a relatively promising technique in automatically
shaped phantoms as well as complex clinical circumstances.
30
3.7.2 Passive Radiation Dosimeters:
Passive radiation dosimeters are also typically known as integrating dosimeters, and
include dosimeters within the film dosimetry system (e.g. the radiochromic films) and the
luminescence dosimetry system (e.g. the phosphor-based TLDs and silica-based TLDs).
These dosimeters are discussed in depth in the following sections:
3.7.2.1 The Film Dosimetry System:
The film dosimetry systems are dominated by silver halide radiographic films and
also radiochromic films. Radiographic x-ray films continue to be applied in radiation therapy,
diagnostic radiology, as well as radiation protection (Devic 2011). A radiographic x-ray film
can serve four important functions in radiation dosimetry, including detecting radiation,
acting as a relative dosimeter, as well as acting as a display device and an archival medium
(Izewska and Rajan, 2005). A number of radiographic x-ray films are available for
applications in radiation therapy dosimetry, including phosphor screen radiographic x-ray
films, which serve as simulators (Izewska and Rajan, 2005). Thus said, as a recording
medium in imaging they are rapidly being replaced by digital imaging devices.
Conversely, the radiochromic systems are novel types of film in radiation therapy
dosimetry and are commonly employed as GafChromic films (Liu et al., 2015). These films
are fitted with a special dye, which become polymerized when exposed to light. One of the
advantages of the radiochromic films is that they are self-developing, and hence require no
fixer or developer (Izewska and Rajan, 2005). In addition, given their grainless nature, these
types of dosimeters are characterized by extremely high resolution and are hence suitable for
high dose gradient regions. Unlike the radiographic films, the radiochromic films are easy to
use, do not require darkroom facilities or film cassettes, are dose-rate independent, and
possess better energy characteristics (Izewska and Rajan, 2005).
31
3.7.2.2 Luminescence Dosimetry System:
Certain materials retain part of the absorbed radiation (energy) in metastable states, to
be subsequently released in various forms, including infrared/visible light or ultraviolet (UV)
light (Izewska and Rajan, 2005). This phenomenon is known as luminescence. This category
of dosimetry comprises fluorescence and phosphorescence, both of which are dependent on
time delay between stimulation and light emission (Jarnet et al., 2004), albeit with completely
different time signatures; the phosphorescent emission has particularly long-lived decay
duration. TLDs are thermoluminescent materials, which are applied purposefully for
dosimetry. The TLDs that are commonly employed for medical applications include
LiF:Mg,Ti, Li2B4O7:Mn and LiF:Mg,Cu,P (Izewska and Rajan, 2005). The suitability of
these TLDs for medical applications is attributed to their tissue equivalence and high
sensitivity. Annealing a basic TLD before using it is necessary for the purpose of erasing the
residual signal (Zaman et al., 2011). When used in radiation therapy, a typical commercially-
available well-prescribed TLD will produce a linear dose response over a wide range of dose.
In terms of applications, the TLDs are suitable for in-vivo dosimetry, dosimetry audits,
treatment verification in different phantoms, as well as comparisons among hospitals
(Izewska and Rajan, 2005), otherwise known as audits.
3.8 Thermoluminescence of Ge-doped SiO2 Optical Fibres and Glass
Beads
3.8.1 Introduction
Radiation dosimetry, construed in the fields of medical physics and health physics to
be the measurement and assessment of the amount of radiation dose the human body
receives, has gained significant interest among medical and health physics professionals,
underpinning as it does diagnosis and, for present interests, effective treatment of cancer
32
patients. The current major approach to cancer treatment by radiotherapy tends to be
utilisation of high-energy electromagnetic waves such as x-rays, gamma-rays (Nawi, Siti
Nurasiah Binti Mat et al., 2015) and also electrons (Murthy et al., 2015, Salguero et al., 2010,
Shen et al., 2015), with at the present time the use of ion-beam therapy and neutrons being
much less prevalent (Ohno 2013, Sulaiman et al., 2014, Takagi et al., 2013). In such
treatment the intent is clearly to massively eradicate the viability of the cells of a localised
tumour (in as far as is possible, killing the greater fraction of the cancerous cells in a tumour,
seeking to enhance the so-called local tumour control probability, TCP) while minimising
cell death in surrounding normal tissues, a quest defined in terms of this therapeutic ratio
(ACS 2015).
The treatment situations referred to above call for the observance of a high degree of
quality assurance in efforts to help ensure effective radiotherapy, radiation being a two-edged
sword, being able to kill cancer cells but also being a potential carcinogenic factor, the risk
increasing with dose (a concern in regard to the irradiation of healthy tissue surrounding the
target volume). A major part of such endeavours involves the use of dosimeters, often
typically being active devices but also sometimes being devices that are passive, placed in
beams that are most often generated by tube x-ray devices or nowadays more usually by
linear accelerators (IAEA 2016). As has been previously mentioned, a radiation dosimeter is
a device that measures and leads to assessment of the amount of absorbed radiation dose
received by the body. Various dosimeters currently exist in the market. One such example, as
discussed above, are thermoluminescent dosimeters (TLD), a passive form of dosimeter,
measuring exposure from ionising radiation (IR) in a multi-step process, in this case in two-
steps, irradiation and subsequent readout. To-date such TLDs have typically comprised a
crystalline medium suitably doped to provide for a required level of sensitivity, two examples
of which are based on calcium sulphate: CaSO4:Dy and CaSO4:Tm, providing for trapping of
33
electrons when irradiated and emitting light (detected by a photomultiplier tube most
typically) when exposed to a controlled level of heat (Carnicer et al., 2011).
Other than conventional TLDs, one further example of which is LiF:Mg,Ti, Ge-doped
SiO2 optical fibres and variously doped glass beads are being developed at the University of
Surrey as well as elsewhere as novel forms of thermoluminescent (TL) dosimeter. There are
now numerous empirical investigations that have been undertaken of these (Benabdesselam
et al., 2013, Bradley et al., 2014, Jafari et al., 2014a, Nawi et al., 2015), seeking to establish
their potential for in vivo and/or small-field radiation therapy dosimetry, as well as in
brachytherapy. This review is therefore intended to examine the basis of the
thermoluminescence of Ge-doped SiO2 optical fibres and glass beads, with a view to
establishing their advantages for radiation therapy dosimetry as well as their limitations. In so
doing, the review examines the molecular structure of the Ge-doped SiO2 optical fibres and
glass beads, their associated trapping centres and activation energy and annealing process,
also applications to-date, including why and how they are used.
3.8.2 The Ge-Doped SiO2 Optical Fibres and Glass Beads
Optical fibres have, for decades, commonly been associated with the
telecommunications industry. However, as pointed out by (Fadzil et al., 2017), recent
innovations in optical fibre technology has seen the use of germanium (Ge)-doped silicon
dioxide (SiO2) fibres in the manufacture of thermoluminescent dosimeters (TLDs). A review
conducted by (Bradley et al., 2012a) to understand the thermoluminescence characteristics of
doped silica optical fibres and their potential applications in radiotherapy dosimetry
established that the suitability of doped silica optical fibre as a TLD is attributed to its
characteristically good spatial resolution and ability to yield the necessary sufficient
thermoluminescence in meeting the sensitivity needs of a TLD for radiotherapy. The next
34
subsection therefore reviews existing empirical evidence for the advantages of Ge-doped
SiO2 optical fibres and glass beads, as TLDs.
3.8.3 Advantages of Ge-Doped SiO2 Optical Fibres and Glass Beads
Unlike the commercial phosphor-based TLDs, which are associated with limited
spatial resolution of a few mm, (Rahman et al., 2012a) have contended that commercially
available Ge-doped SiO2 optical fibres provide for the possibility of high spatial resolution
thermoluminescence dosimetry, typically down to the order of 100 µm, as well as allowing
for an appropriate Bragg-Gray cavity for essentially a non-tissue equivalent probe. A number
of empirical studies have investigated the potential of Ge-doped SiO2 optical fibres and glass
beads for applications in small-field radiotherapy dosimetry (Rahman et al., 2012;
Benabdesselam et al., 2013; Jafari et al., 2014; Bradley et al., 2017), reporting that they
possess a number of suitable thermoluminescence characteristics, including being sensitive to
dose over a wide range as well as offering dose stability and linearity of response. Among the
instances, Rahman et al. (2012) investigated the thermoluminescence of Ge-doped SiO2
optical fibres for such application in radiation therapy dosimetry, finding that at fixed dose-
rate, the Ge-doped SiO2 optical fibres generate a flat response against dose-rate to better than
a mean thermoluminescence yield distribution of 4% (1 S.D). In terms of linearity, Rahman
et al. (2012) noticed that up to a dose of 50 Gy for both electron and photon beams, the
dosimeters exhibited good linearity of response (r2 = 0.998). Results from an additional study
of photo-electron dose enhancement in an iodinated medium (iodine has an atomic number of
53), modelled using Monte Carlo simulation (MCNPX v.2.6), indicated that in support of
measurements the Ge-doped SiO2 optical fibres yield thermoluminescence at a level
approximately 60% greater than that generated by a non-iodinated medium (Rahman et al.,
2012).
35
In a more recent study, investigating the dosimetric and thermoluminescence
characteristics of Ge-doped fibres for varying germanium concentrations and outer diameter,
(Noor et al., 2016) went beyond the scope of a number of previous works that have explored
the basic dosimetric characteristics of the Ge-doped SiO2 optical fibres (Bradley et al., 2014,
Rahman et al., 2012a, Ramli et al., 2015), examining the suitability of Ge-doped SiO2 optical
fibres for interface radiation therapy dosimetry. Among the parameters studied were linearity
of response, energy dependence, reproducibility, thermoluminescence signal loss (fading), as
well as dose sensitivity. Using inter alia, two Ge-doped cylindrical silica fibres of differing
outer diameters of 241 µm and 604 µm, and three varying germanium dopant concentrations
of 6 mol%, 8 mol%, and 10 mol%, Noor et al. (2016) performed a range of experiments to
determine the dosimetric suitability of Ge-doped SiO2 optical fibres for such radiation
therapy applications. The results of the experiments indicated that for both the 241 µm outer
diameter and 604 µm outer diameter fibres, the thermoluminescence yield produced by the 6
mol% Ge-doped fibres was superior to those produced by the 8 mol% and 10 mol% Ge-
doped fibres (Noor et al., 2016). In terms of reproducibility, the 6 mol% germanium dopant
concentration was associated with a superior coefficient of variation (CV) compared to the 8
mol% and 10 mol% germanium dopant concentrations (Noor et al., 2016). Our present
understanding is that with greater dopant concentrations, a greater degree of self-absorption is
to be observed, reducing the TL yield accordingly. The results of the study by Noor et al.
(2016) in respect of energy dependence of the Ge-doped fibres are presented in Table 2.
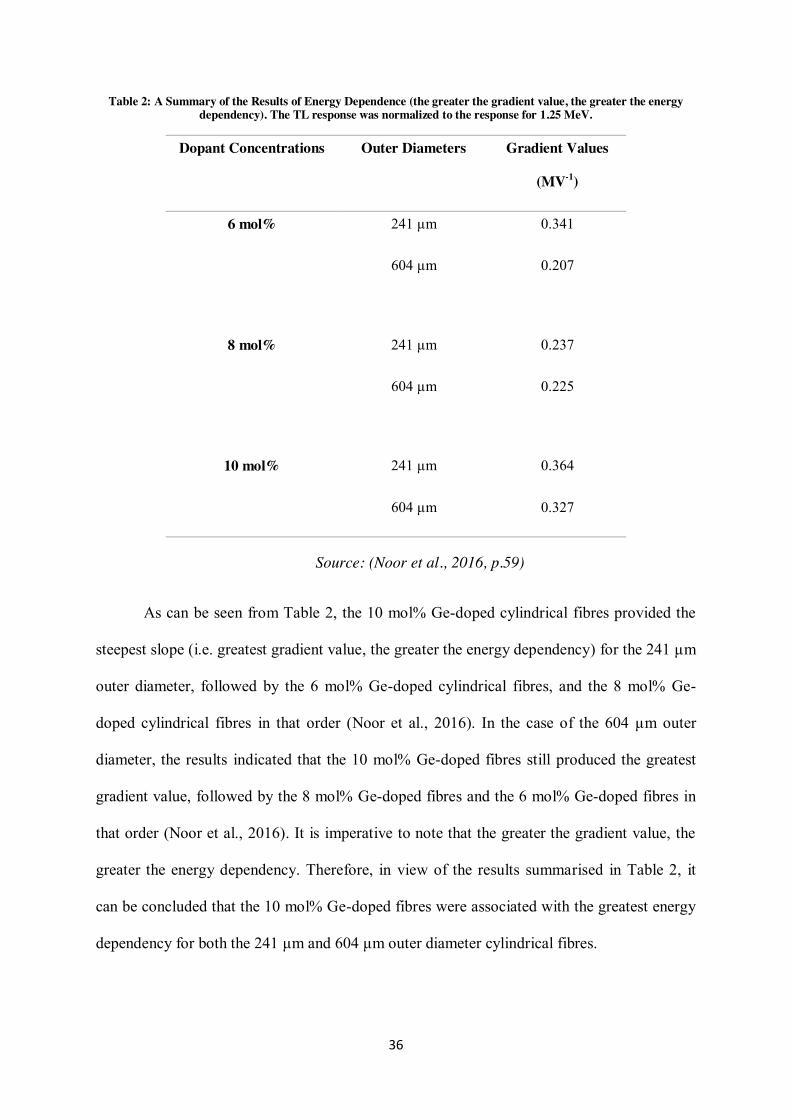
36
Table 2: A Summary of the Results of Energy Dependence (the greater the gradient value, the greater the energy dependency). The TL response was normalized to the response for 1.25 MeV.
Dopant Concentrations Outer Diameters Gradient Values
(MV-1)
6 mol% 241 µm 0.341
604 µm 0.207
8 mol% 241 µm 0.237
604 µm 0.225
10 mol% 241 µm 0.364
604 µm 0.327
Source: (Noor et al., 2016, p.59)
As can be seen from Table 2, the 10 mol% Ge-doped cylindrical fibres provided the
steepest slope (i.e. greatest gradient value, the greater the energy dependency) for the 241 µm
outer diameter, followed by the 6 mol% Ge-doped cylindrical fibres, and the 8 mol% Ge-
doped cylindrical fibres in that order (Noor et al., 2016). In the case of the 604 µm outer
diameter, the results indicated that the 10 mol% Ge-doped fibres still produced the greatest
gradient value, followed by the 8 mol% Ge-doped fibres and the 6 mol% Ge-doped fibres in
that order (Noor et al., 2016). It is imperative to note that the greater the gradient value, the
greater the energy dependency. Therefore, in view of the results summarised in Table 2, it
can be concluded that the 10 mol% Ge-doped fibres were associated with the greatest energy
dependency for both the 241 µm and 604 µm outer diameter cylindrical fibres.
37
Noor et al. (2016) also tested for the characteristic thermoluminescence signal loss
(fading) of the Ge-doped cylindrical fibres for a period of 33 days, following irradiation. The
results indicated that the 8 mol% Ge-doped fibres registered the greatest thermoluminescence
signal loss, while the 6 mol% Ge-doped fibres registered the least thermoluminescence signal
loss (Noor et al., 2016, p.59). In terms of dose sensitivity, Noor et al. (2016) found that the 6
mol% Ge-doped fibres were associated with the smallest minimum detectable dose (Gy). The
results in respect of minimum detectable dose are summarised in Table 3.
Table 3: A Summary of the Results of Minimum Detectable Dose
Dopant
Concentrations
(mol%)
Outer Diameters
of Cylindrical
Fibres (µm)
Minimum
Detectable Dose
(Gy)
6
241
0.126
604 0.027
8 241 0.188
604 0.058
10 241 0.203
604 0.061
Source: (Noor et al., 2016, p.60).
Overall, the 6 mol% Ge-doped optical fibres for both the 241 and 604 outer diameter
cylindrical fibres exhibited superior thermoluminescence performance, in terms of linearity
38
of response, sensitivity to dose, energy dependency, as well as fading rate. The foregoing
results obtained by Noor et al. (2016) therefore demonstrate in particular the suitability of the
6 mol% Ge-doped SiO2 optical fibres for development of novel high-performing TLDs.
Prior to the study by Noor et al. (2016), Jafari et al. (2014) had also investigated the
potential of glass beads and optical fibres as novel TLDs for small-field radiotherapy
dosimetry. In that study, Jafari et al. (2014) characterised commercially existing glass beads
(1.5 mm diameter) and GeO2-doped SiO2 optical fibres (length = 5 mm length and diameter =
120 µm) as TLDs. After comparing the results against Monte-Carlo simulations with EBT3
GAFCHROMIC film and BEAMnrc/DOSXYZnrc, Jafari et al. (2014) found that both the
glass beads and GeO2-doped SiO2 optical fibres exhibited suitable thermoluminescence (TL)
properties for radiation therapy dosimetry applications.
Elsewhere, (Alalawi et al., 2014) measured small photon field doses using GeO2-
doped SiO2 optical fibres and glass beads (GB), comparing them against GAFCHROMIC
film, a small ionisation chamber (PK-018), a p-type silicon diode (SCANDITRONIX,
FI356), as well as Monte Monte-Carlo simulations. The results of the study indicated that
both the GeO2-doped SiO2 optical fibres and the GB were associated with impressive spatial
resolution, with the optical fibres offering spatial resolution of approximately 120 µm and the
GB offering spatial resolution of 2 mm (Alalawi et al. 2014). The optical fibres and GB were
also characterised by large dynamic dose ranges (from tens of mGy up to many tens of Gy)
(Alalawi et al. 2014).
In their recent study on doped silica fibre TL measurements on radiation dose in the
utilisation of 223Ra for prostate cancer secondary bone sarcomas, Bradley et al. (2017)
investigated the thermoluminescence yield associated with different forms of Ge-doped SiO2
optical fibres, including flat and single-mode fibres as well as collapsed and uncollapsed
photonic crystal fibres (PCFs). The results indicated the dosimeters to offer considerable
39
sensitivity and to provide an effective atomic number Zeff that approaches that of bone
(Bradley et al., 2017). Importantly, Bradley et al. (2017) observed that the glass fibres offer
an added advantage in terms of their ability to withstand direct placement into liquid. The
findings by Bradley et al. (2017) thus demonstrated the potential of the Ge-doped SiO2
optical fibres as versatile novel TLDs in a particularly harsh environment. Prior to Bradley et
al. (2017), (Sani et al., 2017) had investigated thermoluminescence yields generated by
different forms of Ge-doped SiO2 optical fibres for in vitro dosimetry of α-particles produced
by the 223Ra decay series. After performing a series of irradiations, Sani et al. (2017)
discovered that the Ge-doped SiO2 optical fibres were associated with particular dosimetric
advantages compared to their conventional counterparts, specifically in regard to the greater
TL yield of flat- and photonic crystal fibres (FF and PCF). Similar to the findings of Bradley
et al. (2017), Sani et al. (2017) found that the Ge-doped SiO2 optical fibres provided a Zeff
value that approach that of bone (with a range of from 11.6 to 13.8, depending upon
composition). Sani et al. (2017) concluded that the dosimetric material in its various forms
(i.e. Ge-doped FF, PCF and single mode fibres (SMF)) provide thermoluminescence
responses favouring applications for radiation therapy dosimetry.
(Begum et al., 2015) attribute the promising thermoluminescence characteristics of
silica optical fibre in radiation therapy dosimetry to its physical makeup, pointing out that the
conventional cylindrical form (e.g. the single mode fibre [SMF] form) is characterised by two
concentric layers (i.e. the “core” and “cladding”), characterised by varying index of
refraction. Among others, (Rahman et al., 2011) have also described the SiO2 optical fibres
for TLD, characterised by structural defects that initiate a trapping process that produces the
thermoluminescence properties associated with the SiO2 optical fibres. Begum et al. (2015),
also echo this, the thermoluminescence response of a dosimetric material being also affected
by the nature and concentration of impurities present in the material. Studies by (Rahman et
40
al., 2010) and (Yaakob et al., 2011) have established that silica optical fibres possess unique
properties (e.g. water resistance, high spatial resolution and low cost), overcoming a number
of limitations associated with conventional thermoluminescent materials, Begum et al. (2015)
also noting that such properties enhance their suitability as TLDs.
In a study using gamma radiation, investigating the photon dose response and fading,
and also reproducibility for five different core-sized Ge-doped SiO2 optical fibres, Begum et
al. (2015) undertook a detailed examination of the Ge-doped SiO2 optical fibres’ relative
elemental composition. The characteristic background signal and low-temperature glow
peaks of the silica optical fibres were manifestly reduced by taking all the five core-sized Ge-
doped SiO2 optical fibres through an annealing process, during which the dosimetric
materials were kept in an aluminium container and annealed for one hour at 400oC (Begum et
al., 2015). After irradiation and conducting a SEM-EDX analysis to map the inherent dopant
concentration and the Zeff values of the optical fibres, Begum et al. (2015) found that the five
fibres provided were characterised by elemental compositions in the range of 13.25 and
13.69, as shown in Table 4.
Table 4: Effective Atomic Numbers of Five Core-Sized Ge-doped SiO2 Optical Fibres
Ge-doped SiO2 Optical Fibre No.
Core/Cladding of Optical Fibre
(µm)
Effective Atomic Number
(Zeff)
1 100/604 13.25
2 80/483 13.69
3 60/362 13.57
4 40/241 13.40
5 20/120 13.43
Source: (Begum et al., 2015, p.798).
(Wagiran et al., 2011) and (Rahman et al., 2012b) record it to be conventional to seek
a Zeff value that is ideally human soft-tissue equivalent (i.e. typically taken to be 7.42), with
41
Begum et al. (2015) going on to record that a Zeff value that is human tissue equivalent is
dependent on the incident photon energy and its direct association with the degree (the
probability) to which primary photon interactions take place within the detector medium.
With tissue equivalency playing a critical role in radiation therapy dosimetry, it is notable for
instance that the photoelectric interaction is dependent on something like the 3rd power of the
dosimetric material atomic number (Z3). As can be seen in Table 4, the Zeff values of the five
core-sized Ge-doped SiO2 optical fibres (ranging from 13.25 to 13.69) are significantly
greater than that of soft tissues (i.e. 7.42). Nonetheless, Begum et al. (2015) found that the
Zeff values of the five optical fibres fall within the human-bones range of from 11.6 to 13.8
(p.799), in keeping with Sani et al. (2017), who also found that the Ge-doped SiO2 optical
fibres provided a Zeff value ranging from 11.6 to 13.8, making the doped silica useful as
human-bone equivalent for dosimetric purposes.
3.8.4 Limitations in Ge-Doped SiO2 Optical Fibres and Glass Beads
Despite their very promising thermoluminescence characteristics for applications in
radiation therapy dosimetry applications, research has shown that the Ge-doped SiO2 optical
fibres and glass beads are not devoid of limitations. For instance, in a recent study of SiO2
optical fibres as potential TLDs for radiotherapy dosimetry, (Rahim et al., 2017) examined
the thermoluminescence dose response of flat optical fibres of differing dimensions (i.e. 270
× 60 µm; 360 × 73 µm; 100 × 510 µm; and 160 × 750 µm), characterising them in terms of
their respective linearity, reproducibility, sensitivity to dose, as well as thermoluminescence
signal loss (i.e. fading). It was found that the optical fibres thermoluminescence signal fading
was approximately 20.4% 30 days post irradiation, with the loss being most rapid in the first
seven days after irradiation (at approximately 17.8%). Therefore, despite their characteristic
rate of loss of thermoluminescence response to fading, comparable to the conventional
42
dosimetric materials, previous investigators such as Rahim et al. (2017) suggest that the Ge-
doped SiO2 optical fibres are still characterised by limited capability, in terms of ensuring
accurate determination and measurement of radiation dose, with a linear dose “response over
wide range therapeutic dose” (Rahim et al., 2017). According to Rahim et al. (2017), this
limitation in the Ge-doped SiO2 optical fibres can be addressed by ensuring improved
selection of the optical fibres for radiation therapy dosimetry applications.
3.8.5 Conclusion in regard to doped silica media
In view of the previous review, the Ge-doped SiO2 optical fibres and glass beads
exhibit a number of thermoluminescence characteristics (i.e. dose stability, sensitivity to
dose, reproducibility, low energy dependency, linearity of response to dose, as well as a low
rate of thermoluminescence signal loss), such that these facets render them highly promising
for radiation therapy dosimetric applications but not comprehensively so. As has been
established by various investigators, including Rahim et al. (2017), the Ge-doped SiO2 optical
fibres still lack the requisite capability to ensure that radiation dose is accurately determined
and measured with a linear dose response over a wide range therapeutic dose, soft tissue
equivalence being one marked issue. In this latter regard, there is need for further research to
devise ways of addressing such limitation. In particular, there is need for a passive dosimeter
of small dimensions, with facets similar to that of the silica media but that which in addition
offer soft-tissue equivalence, pointing the way to for instance skin dosimetry.
43
3.9 The Use of Carbon Nanotubes in Radiation Dosimetry and the
Effect of Ionising Radiation on CNT Structure and Properties
3.9.1 Introduction
This section reviews the uses of carbon nanotubes (CNTs) – single-walled or multi-
walled CNTs as well as mixed-component or free-standing CNTs, as well as the effect of
ionising radiation doses on CNT structure and properties. The review also discusses the
molecular structure(s) of the CNTs, as well as how such structures interact with and are
affected by radiations.
3.9.2 Effect of Ionising Radiation Doses on their Structure and Properties
Since their discovery in the early 1990s (Iijima 1991), carbon nanotubes (CNTs) have gained
increasing popularity in the field of nanotechnology, with an increased interest in the
exploitation of their novel properties (both electronic properties and mechanical properties).
Given their advantageous properties - possession of effective atomic number (Zeff value)
similar to that of adipose tissue, good conductivity, as well as low voltage demand in active
devices (Chen et al., 2011), CNTs have become useful for medical physics applications as
well as for other applications such as chemical sensors (Moradi et al., 2013); biosensors
(Timur et al., 2007); field-emission displays (Saito 2010); memory storage (Lu and Dai
2006); as well as hydrogen storage (Yang et al., 2010). The increased interest in CNTs in
radiation dosimetry is attributed to the fact that the atomic formation of CNTs are
characterised by specific structures providing a range of interesting physical and chemical
properties, including electric and thermo conductivity (Gojny et al., 2006). However, despite
their usefulness in radiation therapy dosimetry, the properties and structure of CNTs are often
affected by ionising radiation doses. The next subsections of this thesis therefore reviews the
44
uses of CNTs and the potential effect of ionising radiation doses on their structure and
properties.
3.9.3 Use of Carbon Nanotubes in Radiation Technology other than Dosimetry
A number of previous attempts have been made to investigate the potential
applications for CNTs in radiation technology. For instance, in a 2002 study, (Yue et al.,
2002) demonstrated how a carbon nanotube (CNT)-based field-emission cathode can be used
for the purposes of generating medical diagnostic x-ray radiation. Purified single-walled CNT
(SWCNT) bundles, produced using the laser ablation method, were the emission material
adopted by Yue et al. (2002). The researchers used electrophoretic deposition (EPD) to coat a
uniform layer of SWCNTs onto a flat metal disc, EPD being a term used to describe various
industrial processes, including anodic electrodeposition, electrophoretic painting, as well as
cathodic electrodeposition.
The adhesion between SWCNTs and the substrate was enhanced by first depositing an
iron layer on the substrate using an electrochemical plating method to provide for nanotube
deposition (Yue et al., 2002). During the study, it was reported that the current, as well as the
nanotube suspension concentration and deposition time, all acted as controls for the nanotube
film thickness and packing density. With regard to measurements of the characteristics of the
CNT, the group of Yue employed a hemispherical current collector to measure the SWCNT
film current-voltage characteristics. The parallel-plate geometry was used to determine the
total emission current generated by the 0.2 cm2 macroscopic cathode. With the applied
voltage being adjusted automatically and total emission current fixed at 6 mA, a significant
improvement of the fluctuation and stability were ensured by incorporating a simple feedback
loop.
45
Yue et al. (2002) went on to establish that a 0.2 cm2 SWCNT film was able to
generate a peak emission current of 28 mA at a rate of 140 mA/cm2. According to their
studies, an emission current of 28 mA, as witnessed with the 0.2 cm2 SWCNT film, is a
higher order of magnitude compared to the values of emission currents that have previously
been generated by macroscopic cathodes. They further employed the triode geometry to test
the potential of SWCNT film as an x-ray-generating cold-cathode. The viability of the
SWCNT film as an x-ray source was demonstrated by them in their imaging of fish as well as
of a humanoid hand, the images being recorded using PolaroidTM films located externally
behind the x-ray chamber. After a series of such experiments, Yue et al. (2002) established
that the SWCNT film generated high-intensity pulsed and high-frequency x-ray radiation,
matters essential for both industrial and medical applications.
As noted by Yue et al. (2002), the CNT-based field emission cathode provides a novel
opportunity for overcoming characteristic limitations of conventional x-ray tubes. For
instance, the cold-cathode x-ray tube whose characteristics were investigated by the group
allows for the elimination of the resistively heated filaments, hence significantly prolonging
the x-ray tube life span (Yue et al., 2002). In addition, given its relatively smaller size and
lower power supply demand, it was contended that the CNT-based field emission cathode
provides an opportunity for producing portable and nano x-ray machines. Moreover, the
CNT-based field emission cathode enhances the production of focused electron beams, which
are characterised by a relatively smaller energy spread. This is critical in such radiation
technology endeavours, as such energy spreads have the potential of enabling the production
of high-resolution imaging x-ray tubes (Yue et al., 2002).
46
3.9.4 Effect of Ionising Radiation Doses on their Structure and Properties
As previously mentioned, CNT composites have a wide range of applications,
including in optical sensor technology, nanotechnology engineering, manufacture of devices
for shielding against electromagnetic interference, as well as in space environments where
characteristically low-density structural materials are expected to withstand exposure to
ionising radiation (Aryasomayajula and Wolter 2013, Jin et al., 2000, Star et al., 2001).
However, empirical evidence from various research suggests that ionising radiation doses do
have a significant effect on the structure and properties of CNTs.
One of the novel studies to have investigated and to have reported upon the effects of
ionising radiation doses on the CNT composites was conducted by (Muisener et al., 2002). In
that study, Muisener et al. employed differential scanning calorimetry to examine the effect
of 0.26 wt% of SWCNT on the composite glass transition temperature before and after
radiation. The CNT composite used in the study was poly(methyl methacrylate)/single-walled
carbon nanotube (PMMA/SWCNT), which is a mixed-component CNT. The ionising
radiation of choice in the study of the group of Muisener et al. was gamma radiation. For the
purposes of allowing comparative investigation, the researchers adopted both polymer-
wrapped SWCNT (PMMA/SWCNT) and pure PMMA for the experiment. The Young’s
modulus of the composites (i.e. PMMA and PMMA/SWCNT) before and after exposure to
the ionising radiation was determined through what Muisener et al. described as “dynamic
mechanical analysis” (p.2508). It is worth noting that multi-walled carbon nanotubes
(MWCNTs) are generally characterized by a “Young modulus of 200-4000 GPa, an
estimated axial compression strength of 100 GPa, and a bending strength of 14 GPa”
(Muisener et al., 2002, p.2507). In that study, Muisener et al. (2002) adopted dielectric
analysis for the determination of the dielectric permittivity and the ionic conductance of the
composites of CNT before and after exposure to the gamma radiation, the latter being the
47
choice of ionising radiation used in that study. With regard to gamma radiation-induced
effects on the SWCNT morphology, the researchers documented such effects using “scanning
electron microscopy (SEM)” (Muisener et al., 2002, p.2508).
Before carrying out the actual experiment, the researchers undertook a number of
preparatory steps, including producing a composite comprising 0.26 wt% polymer-wrapped
SWCNT for use in both the mechanical and thermal tests. The preparation of the 0.26 wt%
polymer-wrapped SWCNT first involved use of a Branson Sonifier 450 to disperse the
SWCNTs in N,N-dimethylformamide (DMF) for a duration of two hours. Methanol was then
used to precipitate the heterogeneous mixture of the polymer-wrapped SWCNT composite
obtained through the sonification process. The PMMA/SWCNT composite product of the
precipitation process was then dried for two days at 110 0C. The dried PMMA/SWCNT
composite was then reduced into pieces before these were then stacked between polished
metal plates and compressed at about 20 MPa of pressure and at a temperature of 275 0C
(Muisener et al., 2002). In order to allow for a well-supported comparison, the pure PMMA
used in the study was also prepared in a similar manner to that for the PMMA/SWCNT
composite.
The next step, conducted in air, was to expose the model samples and the nanotube
paper to ionising radiation doses (5.9 Mrad doses, equivalent to 59 kGy) at a dose rate of 1.28
x 106 rad/h, equivalent to 12.8 kGy/h. The determination of glass transition temperature (Tg)
was carried out using a TA Instruments 2920 Differential Scanning Calorimeter (DSC)
(Muisener et al., 2002). In addition, the researchers erased annealing effects by taking the
glass transition temperatures from the inflection of the second heat curve. Data regarding the
effect of the ionising radiation doses on the mechanical properties of the PMMA/SWCNT
composite was documented using a TA Instruments 2980 dynamic mechanical analyser
(DMA) within a specified temperature range (-125 0C to 150 oC) and rate (40 C/min). The
48
results of the study by Muisener et al. (2002), with respect to changes in the Tg values of the
composites are presented in table 5.
Table 5: A Summary of Tg Values of PMMA and PMMA/SWCNT
Samples
Tg Values
Before Irradiation (Exposure to 5.9
Mrad of Gamma Radiation)
After Irradiation (Exposure to 5.9
Mrad of Gamma Radiation)
PMMA 98 0C 94 0C
PMMA/SWCNT 112 0C 112 0C
Source: (Muisener et al., 2002, p.2509).
From the results presented in Table 5, it is evident that the pure PMMA Tg value
decreased by 4 0C, from 98 0C before irradiation to 94 0C after irradiation. The Tg value of the
PMMA/SWCNT composite on the other hand remained unchanged before and after
irradiation, at 112 0C. Muisener et al. (2002) attributed the decrease in the neat (pure) PMMA
Tg value to the radiation induced scission reactions which the PMMA undergoes. According
to the authors, the radiation induced scission reactions generate low molecular weight
fragments, which are responsible for a reduction of the Tg value of the polymer matrix. Since
such an effect is not inherent in the PMMA/SWCNT composite, its value remains constant
(at 112 0C) before and after irradiation (Muisener et al., 2002).
Muisener et al. (2002) provided three hypothetical explanations for the constant value
of the PMMA/SWCNT composite before and after being exposed to doses of gamma
radiation. The first hypothesis was that the dissolution of the irradiated samples in methylene
chloride denied the nanotubes a chance to cross-link with the polymer matrix. Second, it was
explained that the characteristic sensitivity to motion of the polymer matrix and degradation
49
products was decreased by the network of the nanotubes, which is a reinforcing agent.
Finally, Muisener et al. (2002) posited that degradation of the nanotubes is impeded by the
inherent 𝛑 electron clouds, which serve as radiation sinks. According to the authors, the
radiation energy is localised by the inherent radiation-induced scission in the 𝛑 electron
clouds, a phenomenon that inhibits the energy from migrating to more sensitive degradation-
prone sites within the 𝛑 system. These results corroborated a study by (Clough et al., 1991).
The improved resistivity of the PMMA/SWCNT composite to the ionising radiation
was confirmed by the results documented using the polydimethylsiloxane (DMS). For
instance, the storage modulus of the neat PMMA decreased by 15% upon exposure to the
ionising radiation. This reduction was significant given that the storage modulus of the
PMMA/SWCNT composite registered a reduction of 3% upon exposure to similar radiation
doses.
The results obtained by the group of O’Rourke have thus suggested that the storage
modulus, hardness, as well as the Tg value of PMMA increase with the addition of a 0.26
wt% SWCNTs. This was evident in the constant values of the Tg, Vickers hardness, and
storage modulus for the PMMA/SWCNT composite, after irradiation. Morphological changes
were also confirmed by the SEM characterisation of the nanotube paper.
The authors have also observed that the dielectric properties of CNTs are more prone
to the effects of ionising radiation doses than their mechanical properties. In view of the
foregoing, it is evident that addition of SWCNTs has a reinforcement effect on the
degradation of the polymer matrix. Similar observations have also been made by Najafi and
Shin (2005), who in their investigation of the degradation of poly(methyl methacrylate)-CNT
nanocomposite thin films, established that the addition of 0.5 wt% CNT fillers generates a
reinforcement effect on the extent of degradation occasioned by exposure of a polymer
matrix to high-energy radiations (Najafi and Shin 2005). In that study it was also confirmed
50
that polymer-free radicals enhance the proliferation of degradation. In both studies conducted
separately by Muisener et al. (2002) and Najafi and Shin (2005), it is evident that networks of
CNTs play an effective role in dispersing the radiation damage.
In another similar study, (Vitusevich et al., 2010) investigated the effect of gamma
radiation on transport properties of single-walled carbon nanotube (SWCNT)-based field-
effect transistors (FETs) (SWCNT-FETSs) using a standard source of the radionuclide 60Co.
The 60Co source emitted characteristic 1.25 MeV mean energy gamma rays at the dose-rate of
1 Gy/s. The I-V characteristics of the FETs as well as the low-frequency noise spectra of the
sample were determined via a 1 Hz-100Hz-frequency range before and after irradiation
(Vitusevich et al., 2010). The CNTs used by Vitusevich et al. (2010) were grown for two
minutes at a temperature of 900 oC, using methane, hydrogen, and ethylene flows at rates of
720 ml/min, 500 ml/min, and 12 ml/min respectively. The researchers controlled the
orientation of growth using electric fields (1 V/µm). After measuring the diameters of the
nanotubes using an atomic force microscope, they were found to be 1.3 nm. In addition, the
documented images of the scanning electron beam microscope suggested alignment to the
electric field’s direction, especially to the Mo electrode edges (Vitusevich et al., 2010).
The results of the investigation indicated effects upon the FET output characteristics
following exposure to small doses of gamma radiation. A small dose of gamma radiation
occasioned positive changes on the I-V characteristics of the FETs. Vitusevich et al. (2010)
attributed the changes in the resistivity of the carbon nanotube. After being exposed to
gamma radiation doses of 1 x 10⁴ Gy and 2 x 10⁴ Gy, Vitusevich et al. (2010) reported that
the SWCNT-FET transconductance and noise level did not register significant changes.
However, a decrease in the level of the current was evident. The difference in current was
documented before irradiation (IDSO) as well as after irradiation (IDSR) (DSO and DSR refer to
drain-source current before irradiation and drain-source current after irradiation respectively).
51
The variation of the two values (i.e. IDSO and IDSR) was a linear function on the drain voltage
(Vitusevich et al., 2010). This therefore confirms addition of certain linear resistance to the
nanotubes. The linear function on the drain voltage could also be an indication that the
process of irradiation removed a parallel resistance from the nanotubes (Vitusevich et al.,
2010). In this study, the authors noticed that the CNT resistance registered a 25% increase
after being exposed to a 1 x 10⁴ Gy gamma radiation dose, a phenomenon that confirmed the
effect of irradiation on the transport properties of the CNTs. The results of the study by the
authors suggested that small doses of gamma radiation can improve the SWCNT-FET
transport and noise properties.
Beside the use of gamma rays, as applied in the studies by Muisener et al. (2002) and
Vitusevich et al. (2010) reviewed above, other researchers have opted for other ionising
radiations (e.g. alpha-particles) in their analysis. For instance, in their study, Cress et al.
(2010) investigated the effects of alpha-particles on high-purity freestanding SWCNTs. The
researchers produced and purified (to > 99%) laser-synthesised SWCNTs (Cress et al.,
2010a). A qualitative investigation of the high purity of the SWCNT sample was undertaken
with the help of a scanning electron microscope (SEM), the research being conducted at 2
keV (Cress et al., 2010). A SWCNT paper (35 µm thick) was then prepared and dried for an
hour at 250 oC. After being subjected to alpha-particles emitted isotropically via a thin Ni-Au
coating, their effect on the sample temperature-independent conductivity was documented.
The irradiation of the SWCNT papers was carried out in vacuo (at < 5 x 10⁻⁶ torr).
The results indicated that upon exposure to the alpha-particles, the SWCNT paper
recorded a sustained decrease in the total conductivity with increasing fluence (Cress et al.,
2010). The researchers noted significant changes in the temperature-dependent conductivity
of the SWCNTs, a phenomenon that the authors attributed to the alpha-particles irradiation.
According to the authors, the changes that characterised the SWCNT temperature-dependent
52
conductivity were occasioned by an increase in the number of barriers between the adjacent
SWCNTs and the electronic wavefunction localisation. A calculation of the generated
displacement damage dose profile within the SWCNT sample confirmed that the SWCNT
paper received a uniform displacement damage dose from the environment (Cress et al.,
2010). A nonlinear dependence of resistivity in nonionizing energy loss (NIEL) was observed
when the rates of change in resistivity was performed for SWCNT papers exposed to two
varying radiation doses (i.e. 23 MeV carbon ions and 2 MeV protons). This is a considerable
distinction from the linear response associated with the bulk semiconductors and
superconductors. The evidential implication of the findings of the study by Cress et al. (2010)
is that a localised displacement damage dose imported to a SWCNT from the external
environment has a significant damaging effect on the SWCNT’s conductivity compared to
distributed point effects within the SWCNT exposed to similar total displacement damage
doses (Cress et al., 2010).
In yet another study, (Lobez and Swager 2010) it was demonstrated how the electrical
properties of a multi-walled carbon nanotube (MWCNT) are affected by gamma rays
irradiation. In this study, the researchers had sought to showcase a novel approach to gamma
rays detection that is not reliant upon charge generation or scintillation within semiconductors
(Lobez and Swager, 2010). The composite adopted by Lobez and Swager (2010) for the study
was polymer/MWCNT, which the researchers deemed capable of generating a real-time
signal at room temperature. The polymer matrix underwent ionisation-induced depolarisation
following the irradiation of the composite. Consequently, a lower resistance connection was
created between the MWCNTs (Lobez and Swager, 2010). In addition, the depolarisation of
the polymer matrix occasioned amplification and significant changes in the electrical
properties of the composite. According to Lobez and Swager (2010), the depolymerisation-
induced changes increased the conductivity of the composite, as detected through
53
amperometry. Amperometry is a method of measuring over time the current intensity (I)
between two electrodes at a constant potential (V) (Lobez and Swager, 2010, p.1). The study
thus demonstrated the extent of the effect of gamma rays on the electrical properties of a
multiwalled carbon nanotube.
In another study, (Bardi et al., 2017a) quantitatively investigated the effects of X-ray
radiation on both the physical and chemical properties of SWCNTs, with a particular focus
on relatively low doses of 20 cGy and 45 cGy. Using different characterization techniques
such as scanning electron microscopy and X-ray photoelectron spectroscopy (for a discussion
of this technique see later) to quantify the effects of such radiation doses on the inherent
properties of SWCNTs, Bardi et al. (2017) established that the X-ray irradiation of SWCNTs
reduced the sp2 of the SWCNT bond structure. In addition, Bardi et al. (2017) found that the
electrical properties of SWCNTs were affected by X-ray irradiation, which also resulted in
SWCNT of increased defect density.
3.9.5 Conclusion in regard to CNT media
In conclusion, with strong evidence of changes occurring in various material
characteristics of CNTs as a function of dose, the indication is that the CNTs have the
potential to play an important role in radiation dosimetry, and even more widely in radiation
detection. To-date, the use of CNTs has been identified to overcome limitations (i.e.
resistively heated filaments) associated with conventional x-ray tubes, allowing production of
portable and nano x-ray machines due to their smaller sizes and lower energy dependency, as
well as production of focused electron beams. The ability of CNTs to overcome the
resistively heated filaments helps in prolonging the life span of the x-ray tube. In addition, the
ability of CNTs to enhance the production of focused electron beams that are characterised by
a relatively smaller energy spread is crucial in radiation delivery, in terms of generating high-
resolution imaging x-ray tubes. However, as has been demonstrated in the above review, the
54
properties and structure of the CNTs can be significantly affected by ionising radiations,
including as a result of exposure to gamma rays, x-rays, as well as alpha-particles. As evident
in the studies reviewed herein, the ionising radiations can produce morphological changes in
the CNTs and also alter their dielectric properties. Notably in this respect, the dielectric
properties of the CNTs are more prone to the effects of the ionising radiation doses than their
mechanical properties are. This review therefore provides useful insights for the future
applications for CNTs. Indeed, it is apparent that CNTs can be made use of in the area of
radiation dosimetry. As the literature shows there are defects and atomic displacements that
occur and that can be assessed. These defects can be evaluated with respect to the deposited
doses which make the material a potential candidate for use as a passive radiation dosimeter,
while active devices are also open to development as seen in regard to FET related changes.
3.10 Methods of Analysis
3.10.1 Introduction
This section discusses the analytical methods applied in using carbon nanotubes (CNTs),
seeking a firm basis for their application in radiation dosimetry. The section focuses in
particular on how such methods work. Most specifically, in so-doing the section covers the
characterisation of CNTs in terms of their mass loss during thermal treatment, analysed by
thermogravimetric Analysis (TGA), also their elemental composition through use of Energy
Dispersive X-ray Analysis (EDX), as well as the use of the X-ray Photon Spectroscopy
(XPS) technique to elucidate how CNT bonding is modified as a result of irradiation. In
regard to the latter, the section explores the use of XPS and the fitting of the C1s peak, also
how sp2 and sp3 are distinguished using peak fitting, energy windows, etc. Given the
prominence of the XPS technique in the present work, this will be dealt with first, in
subsection 3.11.1.
55
3.11 Analytical Methods
Within this section, the three analytical methods (XPS, TGA, and EDX) are described
in detail.
3.11.1 X-ray Photoelectron Spectroscopy
Carbon spectroscopy is an important domain in surface science, more so in the study
of novel carbon-based materials such as diamond-like carbon (DLC), nanotubes, carbides,
graphene, as well as carbon nitride (Kaciulis 2012a). According to Kaciulis, identification of
the bonds of diamond, amorphous phases of carbon and graphite is of the essence of carbon
spectroscopy. In this regard, surface scientists often adopt electron spectroscopies such as X-
ray Photoelectron Spectroscopy (XPS), Electron Energy Loss Spectroscopy (EELS), as well
as Auger Electron Spectroscopy (AES), as analytical techniques for the identification
(Kaciulis, 2012).
The XPS analytical technique is a surface-sensitive spectroscopic technique for the
quantitative measurement of the elemental composition, chemical state, empirical
formulation, as well as electronic state of the existing elements within a given material (Kim
et al., 2007). The achievement of XPS spectra is done through irradiation of the material
under investigation with a beam of x-rays, during which the kinetic energy and number of
electrons escaping the top 0-10 nm of the surface of a material are measured and analysed
simultaneously (Turner and Schreifels 1992). The recording of a photoelectron spectrum in
XPS entails counting the ejected electrons over a range of electron kinetic energies
(Sublemontier et al., 2014). The identification and quantification of the surface elements is
aided by electron kinetic energies and the photoelectron peaks which feature in the spectrum.
Figure 8 is schematic illustration of an XPS system.
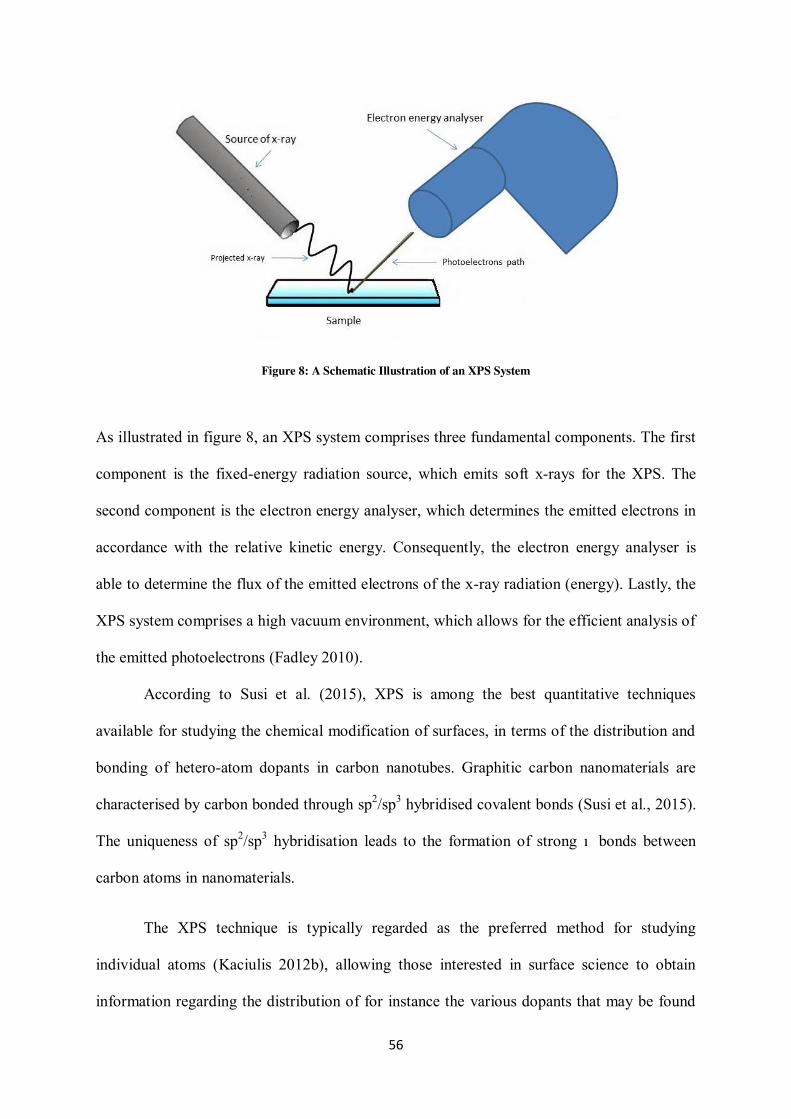
56
Figure 8: A Schematic Illustration of an XPS System
As illustrated in figure 8, an XPS system comprises three fundamental components. The first
component is the fixed-energy radiation source, which emits soft x-rays for the XPS. The
second component is the electron energy analyser, which determines the emitted electrons in
accordance with the relative kinetic energy. Consequently, the electron energy analyser is
able to determine the flux of the emitted electrons of the x-ray radiation (energy). Lastly, the
XPS system comprises a high vacuum environment, which allows for the efficient analysis of
the emitted photoelectrons (Fadley 2010).
According to Susi et al. (2015), XPS is among the best quantitative techniques
available for studying the chemical modification of surfaces, in terms of the distribution and
bonding of hetero-atom dopants in carbon nanotubes. Graphitic carbon nanomaterials are
characterised by carbon bonded through sp2/sp3 hybridised covalent bonds (Susi et al., 2015).
The uniqueness of sp2/sp3 hybridisation leads to the formation of strong σ bonds between
carbon atoms in nanomaterials.
The XPS technique is typically regarded as the preferred method for studying
individual atoms (Kaciulis 2012b), allowing those interested in surface science to obtain
information regarding the distribution of for instance the various dopants that may be found
57
within a given sample. A number of studies have been carried out to demonstrate the role of
the XPS technique in surface investigation of CNTs. For instance, (Mezzi and Kaciulis 2010)
carried out a detailed spectroscopic investigation of two main allotropes of carbon - diamond
and graphite - using the XPS technique. They were able to characterise the carbon phase in
the samples of diamond and graphite by studying the relative photoemission peak spectrum
of each. In addition, these researchers determined the sp2/sp3 ratio from the first derivative of
the Auger line (C KLL) spectrum. Also in using the XPS technique, processing of the
spectroscopic data was enabled by using a spectrometer at 20 eV constant pass energy in
conjunction with CasaXPS v.2.2.84 software (Mezzi & Kaciulis, 2010).
The results obtained by Mezzi and Kaciulis (2010) indicated that the main peak of C
1s for the sp2 and sp3 configurations had closely similar values of binding energy (BE)
(ranging from 284.4 eV to 284.5 eV). The analysis of the C KLL spectra proved more
diagnostic, allowing the researchers to determine the D-values for the allotropes of carbon
(graphite and diamond), the authors considering this as a fingerprint of carbon hybridization
(Mezzi & Kaciulis, 2010). The sp2/sp3 ratio in the materials under investigation was
calculated using a linear approximation between the D-values of the carbon allotropes.
In another study, Kaciulis (2012) demonstrated how the XPS technique can be
employed in characterising the sp2/sp3 ratio of CNTs, including fitting of the C 1s peak, as
well as distinguishing the sp2 bonding from sp3 using peak fitting and energy windows. In
that study, Kaciulis (2012) found that there was linearity of the sp2/sp3 ratio in accord with
the D-value. Using the D-parameter approach, Kaciulis was able to characterise a series of
diamond-like carbon (DLC) media. (Kaciulis et al., 2014) have also confirmed in their
investigation the shape of the Auger C KVV signal (ejection of core shell electrons with
consequent valence to valence transitions) and the acquired relative D parameter such that the
diamond-like carbon (DLC) D-value can act as a fingerprint for recognising graphene. The
58
study also confirmed the potential of XPS in characterising CNTs. As such, the foregoing
results have demonstrated the usefulness of the XPS technique in the fitting of C 1s peak as
well as the use of D-values in calculating the sp2/sp3 ratio.
3.11.2 Thermal Gravimetric Analysis
Thermal gravimetric analysis (TGA) or Thermogravimetric analysis is a thermo
analytical technique for determining the chemical and physical properties of a nanomaterial,
as a function of rising temperature and/or time (Acquah et al., 2017). Through TGA, see
figure 9, one is able to characterise a material, in terms of its physical phenomena, including
absorption, desorption, as well as vaporisation (Sergey 2012). Its underlying principle is the
measurement of the amount and rate of the mass/weight change of a sample in relation to
temperature or time in a controlled environment (Gabbott 2008). TGA is also useful for
chemical characterisation of nanomaterials, in terms of chemisorption, decomposition,
desolvation, and decomposition (Sergey 2012). In most cases TGA is employed in the
determination of specific characteristics of materials that are characterised by mass gain or
mass loss as a consequence of oxidation or decomposition (Acquah et al., 2017).
TGA has emerged as a useful tool in the research and development of a number of
substances and engineering materials (both solid and liquid) – for purposes of gaining insight
about their thermal characteristics, in terms of stability and composition (Loskyll et al.,
2012). Some of the recent applications of TGA include quality control and assurance of raw
materials, compositional analysis of rubber, evaporation loss associated with lubricating oils,
as well as failure analysis of finished products – particularly in polymer processing (Loskyll
et al., 2012, Maurer 1969).
In terms of measuring principle, TGA uses thermal analysis to determine the mass
change of a given sample as a function of temperature or time, within a defined and
59
controlled environment in relation to gas atmosphere, crucible type, heating rate, among other
factors (Gabbott 2008). As shown in figure 9, TGA instrumentation comprises three main
components: a microgram balance, an auto sampler, and a thermocouple for controlling
temperature (sample temperature and furnace temperature).
Figure 9: Typical TGA Instrumentation. Adopted from Duncan Price lecture notes (Price 2006).
3.11.3 Energy Dispersive X-ray Analysis
Energy-dispersive x-ray (EDX) analysis or energy-dispersive x-ray spectroscopy
(EDS) or energy-dispersive X-ray fluorescence (EDXRF) is an x-ray technique for the
identification of the elemental composition or chemical characterisation of materials. This is
normally done using an energy dispersive X-ray spectrometer (Liu et al., 2015). The EDX
technique is dependent on the interaction between the material under investigation and the
60
excitation of the sample resulting from irradiation by the x-ray source (Hotta et al., 2015).
The EDX characterisation is largely based on the principle that each material is defined by a
unique atomic structure, and thus permits a unique set of electromagnetic emission spectrum
peaks for the material (Ravisankar et al., 2014).
As discussed by Yao et al. (2015), EDX analysis of the X-ray fluorescence (XRF)
spectrum is a quantitative approach premised on Moseley’s law, an empirical law relating to
the characteristics of atoms-emitted X-rays. In 1913, Henry Moseley, an English physicist,
conducted an experiment on the characteristics of X-ray, leading to the development of the
concept of atomic number (i.e. number of protons). He later rearranged elements in the
periodic table based on their atomic numbers and atomic weight, as had been the case
previously. Moseley expressed his observations mathematically as shown in equation 6. The
expression in equation (6) is referred to as Moseley’s law, which corresponds to Bohr’s
atomic model.
√𝒇 = 𝒌𝟏(𝒁 − 𝒌𝟐) … (6)
Where: ƒ is the frequency of the observed x-ray emission line
Z = atomic number; and
k1 and k2 = constants that depend on the type of line (K, L, etc. in x-ray notation)
Consequently, the design of the EDXRF spectrometer, as illustrated in figure 10
complies with the Moseley’s law, and comprises four main components namely: a power
source, a subsystem that provides a path for light, a control circuit, and a personal computer
(PC) (Yao et al., 2015). As demonstrated in figure 10, a primary X-ray is emitted by
supplying high-voltage power to the X-ray tube. Once emitted, the primary X-ray irradiates
the sample, which is consequently stimulated to emit XRF. The emitted XRF is then detected
by an XRF detector (Yao et al., 2015). Upon receiving the emitted XRF, the XRF detector
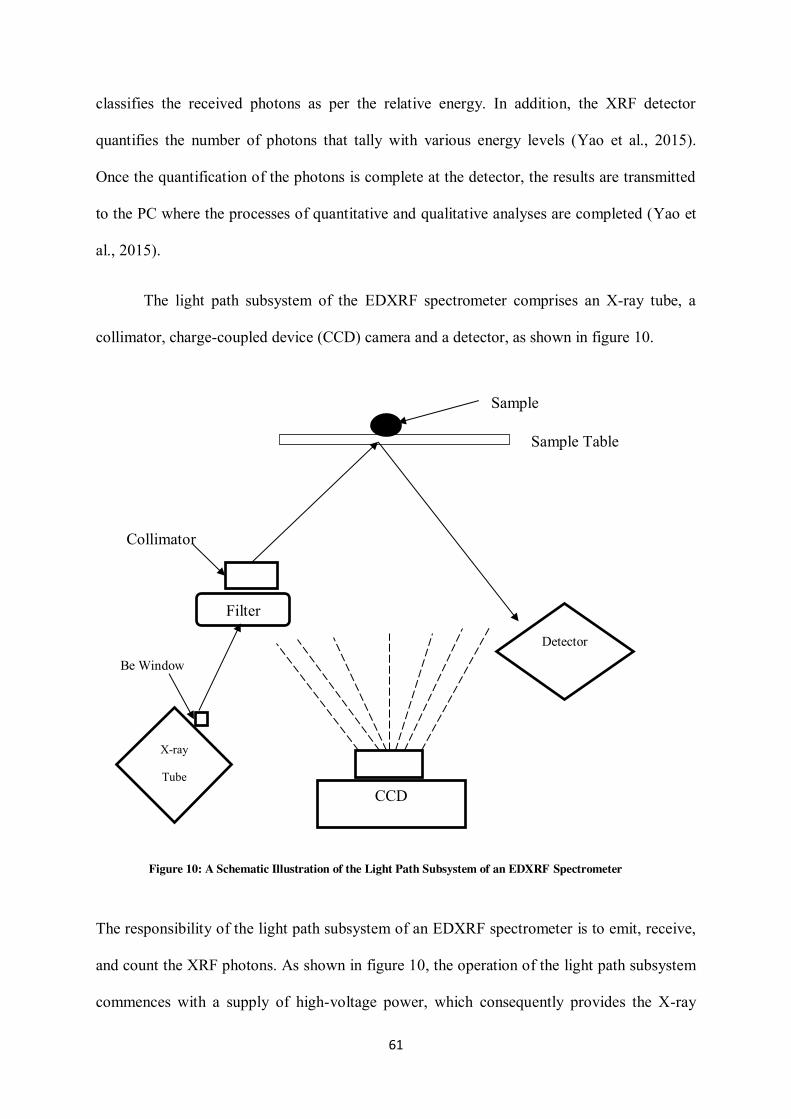
61
classifies the received photons as per the relative energy. In addition, the XRF detector
quantifies the number of photons that tally with various energy levels (Yao et al., 2015).
Once the quantification of the photons is complete at the detector, the results are transmitted
to the PC where the processes of quantitative and qualitative analyses are completed (Yao et
al., 2015).
The light path subsystem of the EDXRF spectrometer comprises an X-ray tube, a
collimator, charge-coupled device (CCD) camera and a detector, as shown in figure 10.
The responsibility of the light path subsystem of an EDXRF spectrometer is to emit, receive,
and count the XRF photons. As shown in figure 10, the operation of the light path subsystem
commences with a supply of high-voltage power, which consequently provides the X-ray
Filter
CCD
Sample
Sample Table
Collimator
X-ray
Tube
Detector
Be Window
Figure 10: A Schematic Illustration of the Light Path Subsystem of an EDXRF Spectrometer
62
tube with high-voltage generated energy (Yao et al., 2015). As summarised before, the high-
voltage energy stimulates the X-ray tube, which then emits a primary X-ray. The emitted
primary X-ray is then transmitted through the Be window, filter, and collimator to irradiate
the sample, stationed on the sample table as shown in figure 10. Once irradiated, the sample
is stimulated and consequently emits XRF, which is then received by the detector. Once
received by the detector, the emitted XRF is transformed into a low-voltage pulse by the
amplifier (Yao et al., 2015). A pulse amplitude that is proportional to the energy of the XRF
received by the detector is amplified further by the main amplifier. The amplified voltage is
then transformed into a digital signal by the analogue-to-digital converter (Yao et al., 2015).
The digital signal undergoes further transformation into a pulse counter. The transformed
digital signal is stored in a mechanical analyser before being formatted to an XRF spectral
line. The spectral information is then transmitted by the detector to the PC for qualitative and
quantitative analyses via a USB hub (Yao et al., 2015). The qualitative analysis in XFR
spectrometry is classified into peak location, peak recognition, and element determination.
63
Chapter 4
4 Silica-Based material Studies
4.1 Developments in Production of Silica-Based hermoluminescence
Dosimeters
The content of the following section has been published in the journal “Radiation Physics and
Chemistry”. D.A. Bradley, A.S. Siti Shafiqah, Z. Siti Rozaila, Siti Norbaini Sabtu, S. F.
Abdul Sani, Abdulaziz Alanazi, S.M. Jafari, G. Amouzad Mahdiraji, F.R. Mahamd Adikan,
M. J. Maah, A. N. Nisbet, N. Tamchek, H. A. Abdul Rashid, M. Alkhorayef, K. Alzimami.
2016. “Developments in Production of Silica-Based Thermoluminescence Dosimeters”
Volume 137, Pages 37-44, (Appendix A). The right to include the article in any thesis or
dissertation has been obtained during assignment of copyright with the publisher. Also, the
right to include this work in this thesis has been obtained from the co-authors. My major role
in this work centred around samples preparations for proton and neutron irradiation, results
analysis together with participation in the interpretation of the results and writing of the
manuscript.
4.1.1 Introduction
Over the past three years the University of Surrey radiation physics group have been
exploring the association between design and performance of silica-based media, our interest
being in the utility of the latter in sensing ionizing radiation and in radiation dosimetry. These
efforts stem from earlier adventitious use of commercially available Ge-doped single mode
telecommunication fibres (SMF) in such applications, the design of these being entirely
unrelated to the needs to which the fibres were put. The SMFs, as well as other
telecommunication fibres such as multi-mode fibres (MMF) and variants of these including
64
Bragg gratings, are fabricated from low-defect silica, as an example, very pure SiO2 in the
form of Suprasil F300, a product of Heraeus (Hanau, Germany). Doped fibre fabrication
starts from a hollow capillary (of a few cm diameter), doped using the Modified Chemical
Vapour Deposition (MCVD) process. This process requires the introduction of gases
(typically germanium tetrachloride, GeCl4, and silicon tetrachloride, SiCl4) into a rotating
hollow silica capillary, at the same time applying highly elevated temperatures, typically
between 1800- and 2100qC, to allow a deformable material and the deposition on the inner
walls of SiO2 and Ge2O3. The preform resulting from this MCVD process can then be pulled
into fine diameter (a 0.1 mm) cylindrical fibres, a form typically used in telecommunications,
again using elevated temperatures to soften the silica. The pulling requires use of a rig
typically referred to as a pulling tower. For telecommunications the extrinsic dopant creates a
change in refractive index between the boundary of the doped silica core and the silica
cladding, light within a particular band of wavelengths suffering total internal refraction,
transporting the light forward with very low losses from as low as 0.2 dB km-1 to perhaps
afew dB km-1.
The presence of defects extrinsically introduced into such silica-based insulator media
provides for the trapping of electrons that have been excited by incident radiation, with these
then being stored as a luminescence signal pending stimulated de-excitation. Storage of the
trapped electrons in such media is typically good, providing integration of the irradiation-
mediated signal, strongly preserved over a period many orders of magnitude greater than the
duration of the exposure. The situation is imperfect, a fraction of the trapped electrons
spontaneously relaxing, due to sources of ambient energy, a loss referred to as fading. The
fractional loss of TL signal depends on the depth of traps, deep traps (a few eV) suffering
markedly less fading than more superficial traps. Practical systems of readout through
stimulated de-trapping can either function through the application of heat, producing
65
thermoluminescence (TL), or exposure to a controlled source of light, producing optically
stimulated luminescence, the emission spectrum that reflects the trapping levels being picked
up by a photomultiplier tube. Such systems provide a passive form of detection, contrasting
with active devices such as diodes or ionisation chambers.
Present interest is in TL, a less favourable practical feature of such systems is the lack of on-
line monitoring capability. For a well-behaved TL medium, one that can be used for radiation
dosimetry, it is desirable for the system to respond sensitively to the radiation levels of
interest and to provide TL yield linear with radiation dose. The range over which this occurs
is referred to as the dynamic range. A highly sensitive medium points to lower limits of
detection, the tendency being for the available defects to become occupied at relatively low
doses. Indeed, the study is currently pursuing doses down to a small fraction of a mGy as will
be shown later. Conversely, the benefit of a less sensitive dosimeter for a particular source of
radiation is that it can be used beyond the upper limit of linearity of the more sensitive
dosimeters. As such, the question as to whether a dosimeter is considered good or poor is
ultimately linked to the level of dose and range of dose that one wishes to detect, the arbiter
of utility being whether it can be used as a monitor of environmental radioactivity,
accumulating annual doses of as low as a few mGy, in dosimetry of synchrotron microbeam
therapy beams delivering doses at a rate of the order of 10 kGy min-1 (Abdul Rahman et al.,
2010), or applied to radiation processing facility dosimetry, with doses of 10s of kGy
delivered over a period of an hour or less.
With this brief overview, it is perhaps clear that there exist a number of issues that need to be
addressed in seeking high performance TL media. As an example, among the issues
confronting use of commercially available fibres such as SMFs, are:
66
(i) undoped silica cladding, a low-defect unproductive component that also acts to
attenuate the TL signal exiting the doped region, as indeed will the doped volume
itself (Nawi et al., 2015);
(ii) dopant concentrations that yield sub-optimal TL levels;
(iii) geometric formation that offers sub-optimal net TL yield;
(iv) a potential inhomogeneously doped medium, with additional need to establish
whether the fibres yield the designed-for dopant concentrations, measured using
techniques such as refractive index profiling (RIP), scanning electron microscope
energy-dispersive x-ray analysis (SEM-EDX) and also proton-induced x-ray
emission/proton-induced gamma emission (PIXE/PIGE) techniques, the PIGE
depending on nuclear reactions and their analysis;
(v) light transmitted through the cladding depending on the incident irradiation and
spectra, trap depth also defining the net luminescence exiting the fibre;
(vi) recognition that the thermal conductivity of SiO2, which while not small, is less
than that of LiF, pointing to potential need for use of a temperature ramp-rate
lower than that typically applied in use of phosphor dosimeters (LIF has a
particularly high thermal conductivity).
In regard to (vi), with fibres popularly cut to 5 mm lengths for ease of handling, to-date the
fibres have been read-out with their long dimension in contact with the planchet (the heating
plate of the TL reader), not least allowing good thermal contact between the heating plate and
TL medium. With TL light transporting preferentially along the fibre, normal to the
photomultiplier tube, this sub-optimal readout situation has nevertheless been shown to offer
excellent capability for radiotherapy applications (with doses from a fraction of a Gy to 10s
67
of Gy and beyond). A further issue in design of silica fibres is that the MCVD and fibre
pulling facilities are expensive to establish and operate.
In what is to follow a review is given on the MCVD-based fabrication method and a wet-
chemistry sol-gel nanoparticle approach that offers lower costs of fabrication, summarizing
what is know from the characterization of defects and the radiation performance parameters.
Example situations will then be provided.
4.1.2 Silica production routes
Understanding the origin of luminescence from the various silica fibres involves study of
instrinsic defects in the starting material, as well as those that result from fabrication, eg
strain-related defects and extrinsic doping, and those that arise from exposure to ionizing
radiation, all existing in differing concentrations and charge states. As intimated, commercial
optical telecommunication fibres can lead to a poorly posed situation, the fabrication
parameters having been set up to provide for optimum telecommunications. As such, the
primary intent of the present collaboration has been to work with preforms and fibres based
on use of the MCVD process, in particular those that have been tailored towards radiation
detection, contrasting this route towards production with the surface decorated nanoparticle
sol-gel approach. The sol-gel route offers a very much cheaper processing technique for
production of doped glass developed for TL purposes (T Rivera et al., 2007; Siti Shafiqah et
al., 2015; Wang et al., 2012) but as with the MCVD product it provides a solution that is not
entirely without issues, not least in seeking to obtain a closely similar quality product from
each production batch. The variant of the sol gel technique of interest herein involves
producing surface-decorated/surface-coated silica nanoparticles, the surface
decoration/coating creating luminescence centres. Herein production of Ag-doped silica
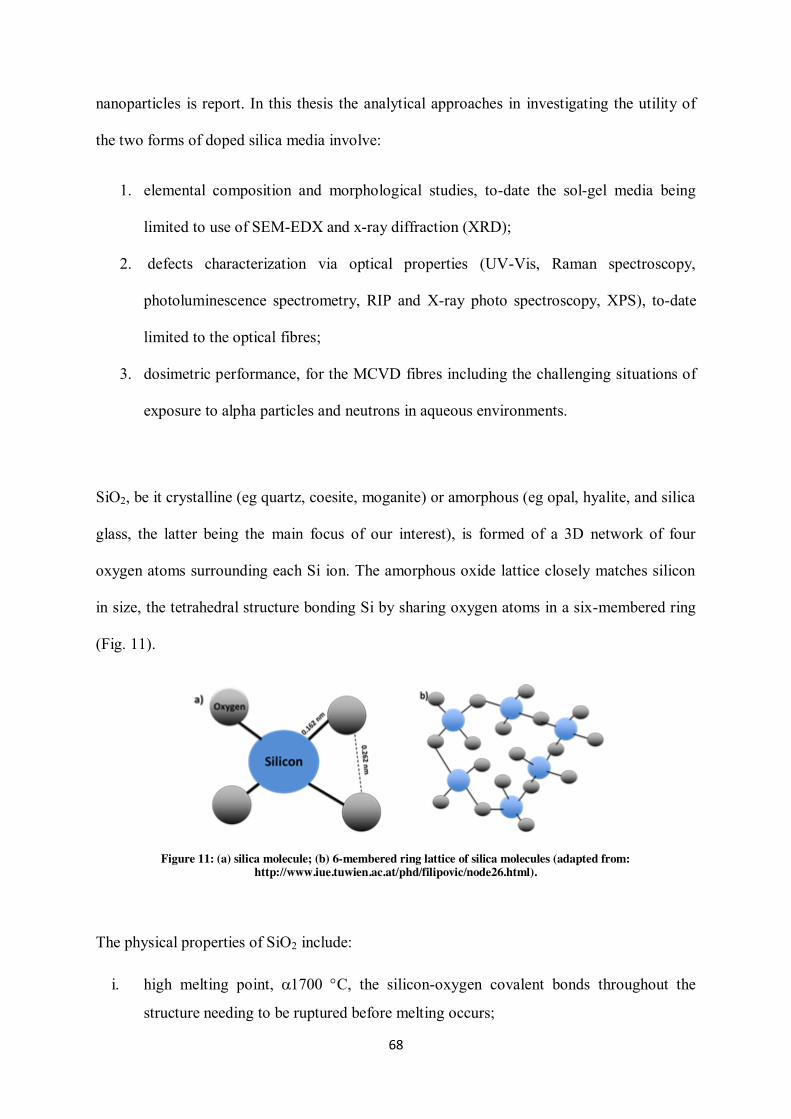
68
nanoparticles is report. In this thesis the analytical approaches in investigating the utility of
the two forms of doped silica media involve:
1. elemental composition and morphological studies, to-date the sol-gel media being
limited to use of SEM-EDX and x-ray diffraction (XRD);
2. defects characterization via optical properties (UV-Vis, Raman spectroscopy,
photoluminescence spectrometry, RIP and X-ray photo spectroscopy, XPS), to-date
limited to the optical fibres;
3. dosimetric performance, for the MCVD fibres including the challenging situations of
exposure to alpha particles and neutrons in aqueous environments.
SiO2, be it crystalline (eg quartz, coesite, moganite) or amorphous (eg opal, hyalite, and silica
glass, the latter being the main focus of our interest), is formed of a 3D network of four
oxygen atoms surrounding each Si ion. The amorphous oxide lattice closely matches silicon
in size, the tetrahedral structure bonding Si by sharing oxygen atoms in a six-membered ring
(Fig. 11).
Figure 11: (a) silica molecule; (b) 6-membered ring lattice of silica molecules (adapted from: http://www.iue.tuwien.ac.at/phd/filipovic/node26.html).
The physical properties of SiO2 include:
i. high melting point, a1700 qC, the silicon-oxygen covalent bonds throughout the
structure needing to be ruptured before melting occurs;
69
ii. being an insulator, with electrons tightly held between atoms;
iii. being insoluble in water and organics solvents, of particular interest for in vivo
applications and those involving aqueous environments.
Defects underpin the mechanism of TL, the electrons and holes released by radiation being
trapped at defect sites, giving rise to optical absorption and luminescence (Chen &
McKeever, 1997). Notwithstanding the many types of defects in silica, present interest
concerns those causing significant TL, intrinsic and extrinsic. Prime examples of the intrinsic
are the broken or dangling bond, the oxygen/silica deficient centre and the self-trapped
exciton. The former are dangling orbitals populated by unpaired electrons, detectable through
electron spin resonance (ESR) (Jafari et al., 2014). Non-bridging oxygen gives rise to oxygen
dangling bonds (potential hole traps) and empty Si orbitals. The oxygen broken bonds have
been identified to be the source of 7.6 eV absorption which, while too deep for direct TL
readout, is nevertheless potentially accessible by photo-transferred TL, PTTL; (see Zulkepely
et al., 2015). Expected to be present in as-grown materials, as in silica, the broken bonds are
also readily created by ionizing radiation. In disrupted SiO2 tetrahedrathe absence of oxygen
or silicon atoms creates oxygen deficient and silicon deficient defects. The oxygen-deficient
centre (ODC), familiarly designated E`, is representative of ≡Si-Si≡ with Si-Si indicating
electron bonding in a chemical reaction. Analysis of the E` centre indicates the presence of an
unpaired spin, localized at the sp3 orbital of the silicon atom, with orbital orientation towards
the oxygen vacancy position (Silsbee, 1961). If two adjacent silicon atoms relax
asymmetrically, the most likely occurrence in vitreous glass givenits inherit asymmetry, then
one electron can stabilize itself on one of the silicon atoms (Beall Fowler and Edwards,
1997). ESR studies in silica glass have shown the same E` structure (Griscom, 1979). The Si-
Si centre is capable of forming a hole–trap (Tsai et al., 1988). At annealing temperatures the
E` centre can transform into a Si-Si centre, while at even greater temperature the Si-Si centres
70
tend to transform into excess silicon atoms in SiO2. These excess silicon atoms will then no
longer produce luminescence (Rebohle et al., 1998).
In regard to the self-trapped exciton, when an electron is excited in a lattice it leaves a hole in
the valence band. This electron will experience a Coulombic interaction with the hole,
screened by ions and other electrons. The electron–hole pair, termed an exciton, can
propagate through the crystal. In SiO2, the electron-hole pair is strongly bound due to the low
dielectric constant of the base compound. The presence of the self-trapped exciton in silica
leads to energy levels inside of the normal bandgap. Tsai et al (1988) have estimated the
exciton binding energy in SiO2 to be about 1.3 eV. Further, the existence of a
photoluminescence (PL) band at 440 nm in SiO2 supports the suggestion that excitons are
trapped in the SiO2 matrix, a phenomenon absent in an ideal crystal. It is now accepted that
the mechanism for this defect in silica is the motion of oxygen atoms in the crystal. The
motion, first proposed by (Fisher et al., 1990) is an oxygen atom rotation about another Si-O
bond of a neighboring silicon atom. This motion causes a lattice distortion that significantly
changes the local energy level in the crystal.
In regard to extrinsic defects or impurity centres, when impurities are introduced into the
SiO2 substrate it involves a model in which the impurity centres become either substitutional
atoms, interstitial atoms or an impurity-intrinsic complex, with any of these being present
inside the material. Apart from the possibility of introducing a new luminescence band,
impurity atoms might also change the number of electron or hole traps or else provide much
deeper traps in the media. One of the main desirable properties involving Ge impurities is its
photosensitivity. Much attention has been paid to the defect produced by the photosensitivity,
71
known as the germanium oxygen deficient centre (GODC). This defect is commonly
considered to be responsible for the changes in the refractive index in germanosilicate glass
(Dianov et al., 2000). Concerning the absorption optical activity of these germanium related
defects, it has been observed to have a connection with the band peaks at 240 nm and 245
nm, referred to as the GODC and NOV (neutral oxygen vacancy) respectively. These two
defects have sometimes been assigned to the wrong bond, such as Ge-Ge, Si-Ge, rather than
the usual Si-O-Ge bond in Ge-doped-silica media. It is found that these defects can be
bleached with UV irradiation, producing defects such as GeE`, Ge (1) and Ge (2). GeE’, Ge
(1) and Ge (2) are the most common Ge related paramagnetic defects that can be detected by
electron paramagnetic resonance (EPR) in irradiated Ge-doped silica media. The GeE’ is
representative of (≡Ge•), associated with an absorption band at 6.2- 6.4 eV. The Ge (1) defect
consists of an electron trapped at the site of a substitutional 4-fold coordinated Ge precursor
(GeO•4) (Chiodini et al., 1999; Neustruev, 1994; Pacchioni & Mazzeo, 2000), attributed to
the absorption band at 4.4 – 4.6 eV. The Ge (2) defect is assigned as ionized twofold
coordinated Ge (=Ge••). Based on EPR analysis, the presence of GeE, Ge (1) and Ge (2) are
found to be in the region g = 1.9937, 1.9933 and 1.9866 respectively.
The photosensitivity of Ge-doped silica material is found to be correlated with a defect
observed in the photoluminescence spectrum, known as the Ge Lone Pair Centre (GLPC)
with microscopic structure that has been illustrated to be similar to the Ge (2) defect. This
defect can be observed in two band peaks in the photoluminescence spectrum, at 3.2 eV and
4.3 eV, with the absorption band referred to as transitions from a point defect ground singlet
state (S0) to the first single state (S1) (Hosono et al., 1992; Skuja, 1992).
72
4.1.3 Ge-doped optical fibre produced via MCVD technique
The fibres used in the current research in TL studies have employed the MCVD technique,
produced in a high temperature environment using GeCl4 and SiCl4 as the precursor
(Jacqueline et al., 2004; Liu et al., 1997; Mat-Sharif et al., 2013). The TL response of
commercial SiO2 doped optical fibre has been investigated for photons (see for instance,
Abdul Rahman et al., 2011; Youssef et al., 2001), electrons (eg Abdul Rahman et al., 2011;
Hashim et al., 2009) and alphas (eg Ramli et al., 2009) in each case showing considerable
potential in dosimetric applications. Abdulla et al. (2001) carried out a study on commercially
available Ge-doped optical fibre using a gamma source, the response being found to be linear
from 1- 120 Gy. Under electron irradiations, the Ge-doped fibres were shown to have a TL
response superior to that of Al doped optical fibre, with linearity over the range of doses
0.02-0.24 Gy (Yaakob et al., 2011), tying in with the fact that Ge in the core allows increase
in the value of the refractive index due to the photosensitivity.
Developments beyond the commercially available telecommunication fibre, also obtained
using the MCVD technique, have included fabrication of hollow cylindrical fibres, collapsed
fibres, photonic crystal fibres and flat fibres, with various Ge dopant concentrations
extrinsically introduced and with various dimensions. As an instance, Ghomeishi et al (2015)
have investigated three types of Ge-doped optical fibres: conventional cylindrical fibre,
capillary fibre, and flat fibre, all fabricated using the same optical fibre preform. For electron
and photon irradiated fibres at doses from 0.5 to 8Gy, the results show for capillary fibre
collapsed into a flat shape that the TL yield is increased by a factor of 5.5, also some 3.2
times that of the cylindrical fibre. This suggests a strain-generated means of production of
suitably sensitive TLD for in-vivo dosimeter applications, with changes in the form of glow
curve also being noted. Begum et al. (2015) have also been among those who have shown
that the sensitivity of FF constructs can be made to be competitive with phosphor-based TLD,
73
in the particular case that of TLD-100 and TLD-700 (doped LiF). Further investigations have
concentrated on novel microstructured fibres, one example being the photonic crystal fibre
(PCF), produced by what is referred to as a stack and draw method (multiple doped fibres
stacked together, as for example in a hexagonal array and then pulled into a fine fibre form),
the TL arising from the dopant (Ge and B as an example) and induced strains (Dermosesian
et al., 2015). Here, an interesting question concerns whether methods might be developed that
could apportion the fractional TL yield due to the strain-related defects and extrinsic
dopant(s). Glow curve analysis would seem to hold the key to this. The report of
Dermosesian et al. shows that PCFs can markedly improve upon the sensitivity of an SMF, in
one instance by a factor of ~ 30.
4.1.4 The sol-gel technique
Chemical precursors are applied in this low temperature technique, providing a means of
producing ceramics and glasses with purity and homogeneity greater than that achievable
using the conventional high temperature MCVD technique. The method has been used to
produce a wide range of compositions, mostly oxides, in various forms including powders
(Rivera et al., 2007b; Rivera et al., 2007c), fillers (Wen and Mark, 1994), coatings (Kurz et
al., 2006; Natsume & Sakata, 2000) and thin films (Kajitvichyanukul et al., 2005;
Marikkannan et al., 2015).The technique starts from mixtures of a chemical solution, the
precursors acting as the source of elements to be incorporated into the final product. The most
common precursor used for silica glass is tetraethylorthosilicate, Si(OC2H5)4, commonly
referred to as TEOS. The main chemicals in the mixture are then made to undergo chemical
processes with the intent of forming a colloidal suspension known as sol. After going through
a sequence of chemical reactions the sol stiffens to form a gel, subsequently heated and dried
to form solid (sometimes as powders).In fabrication, Dabbaghian et al., (2010) found ethanol
74
co-solvent to have the most significant effect on particle size and size distribution of the
synthesized silica nanoparticles. Park et al. (2002) reported that smaller sized silica particles
can be obtained by employing a small ratio of ethanol in the mixture. The synthesis of mono-
dispersed silica particles have been explained in detail by Bogush et al. (1988). To-date, most
TLDs in nanoparticle form have been made of ceramics such as ZrO2 and ZnS. Purpose-made
for TLD studies, these have been demonstrated to have good performance under UV light
(Azorín et al., 2005). Fewer studies have reported on the TL response of silica nanoparticles,
Carvalho Jr et al. (2010) reporting on the TL response to gamma rays of natural quartz at nm
particle size and Mendoza-Anaya et al. (2003) discussing the TL performance of pure silica
nanoparticles, comparing these with Fe and Cu-doped material. Pandey et al. ( 2004)
investigated TL from pure silica nanoparticles supported by results from photoluminescence
spectroscopy for defect characterization.
4.1.5 Ag-doped silica nanoparticles
In the following section nanoparticles are abbreviated to Np and the focus is on Ag as the
dopant of interest. Elsewhere, CdS and ZnS have been doped with Ag (Tiwari et al., 2014),
the TL intensity increasing with increase in UV exposure time, indicative of TLD potential.
The use of Ag nanoparticles in ZnO2 has resulted in modification of the kinetic parameters,
inducing a shift of the TL temperature towards higher values (Villa-Sanchéz et al., 2007),
being of particular importance in ensuring a low fading rate of the stored TL signal.
One concern in introducing dopants into SiO2 in the form of molten glass is the solubility.
While in principle any element can mix with the SiO2 precursor during the solution stage,the
doping of Ag in SiO2 is advantageous, SiO2 reducing the tendency towards Ag Np
agglomeration, important in achieving mono-dispersal of the AgNp. There is already a good
deal of experience in working with Ag nanoparticles. As an example, coating of nanoparticles
75
of this metal with a SiO2 shell has been studied in attempts to enhance colloidal and chemical
stability (Niitsoo and Couzis, 2011). SiO2 coatings have also been successfully produced in
forming a controlled dielectric environment around the AgNp, improving precision in surface
plasmon resonance (SPR) sensing. Ag-doped SiO2 has also been applied in surface enhanced
Raman scattering (SERS), with Ag as one of the plasmonic materials, light excitation
enhancing the local electromagnetic field (Feng Xian Liu et al., 2001; Long et al., 2012). In
Fig 12 , the Cu KD XRD pattern shows a broad distribution peaking at 2θ = 23°, indicating
successful production of amorphous silica and agreeing with others (Gorji et al., 2012;
Tabatabaei et al., 2006).
Figure 13: XRD patterns for Ag-doped silica nanospheres, with crystalline peaks revealing AgNp within the structure of the pure silica base media.
Figure 12: Example XRD pattern of silica Nps, the broad peak indicating the silica nanoparticles to be in an amorphous state.
76
The results of Figure 13 reveal crystalline peaks for the Ag-doped medium, at 2θ = 38.2,
44.4, 64.7 and 77.5°, confirming the presence of Ag nanoparticles in agreement with others
(Hilonga et al., 2012; Mie et al., 2014; Torres et al., 2007)]
Table 6: Mean particle size (±1σ) silica nanoparticles (Siti Shafiqah et al., 2015)
Sample Mean particle size (nm)
E5 <10
E10 80 ±18
E20 140 ±17
E30 550 ±9
In Figure 14, it is apparent that particle size manifestly influences the TL properties of the
silica nanoparticles, smaller particles, with proportionately greater surface area, exhibiting the
greater TL yield compared to that of larger samples (Siti Shafiqah et al., 2015). As such, there
Figure 14: Mass-normalised nanoparticles TL as a function of radiation dose, the table below (Table 6) providing information on particle size (Siti Shafiqah et al., 2015).
77
are a proportionately greater number of light-emitting ions on the surface. The TL response
of the nanoparticles increases with dose, pointing to the possibility of using silica
nanoparticle powder as a dosimetric base-material. Mendoza-Anaya et al. (2003) report silica
gel glow peaks to achieve an intensity maximum at much lower temperature compared to
present results, indicative of a potential for enhanced TL performance in using present
nanoparticle samples.
Figure 15: TL response of pure silica and Ag doped sample within dose range 1- 500 Gy. The variation in TL yield and error bars of relatively large magnitude are indicative of the control issues needing to be confronted in product
generation.
With Ag as the extrinsic impurity, effects are revealed in Figure 15 that contrast with the use
of Ge, one similarity being that with both Ag- and Ge-dopants saturation appears at much
greater dose, beyond 500 Gy, compared to that of pure silica samples. For the latter,
saturation starts at around 300 Gy. For present samples the AgNps reduce the TL signal, with
response less than that of the pure silica samples. Here the Ag multilayer coating the silica
surface acts not only as a promoter of TL yield on the silica nanoparticles surface but also as
an attenuator, absorbing and scattering a fraction of the incident radiation. Additionally, the
layer acts as an inhibitor, reducing the efficiency for transport of TL from the silica
nanoparticle surface. Thus said, a particularly attractive feature of the Ag is the extended
dynamic range, providing greater versatility of the Ag-doped medium in radiation technology
applications at elevated doses, as are found in radiation processing.
78
4.1.6 Examples of fibre TL applications
Here two situations were selected, the first being that of modulated and unmodulated proton
beams, illustrating the considerable spatial resolution (0.1 mm) capability of fibres in making
depthdose measurements, in this case of a 62 MeV proton beam. Use was made of
commercial Ge-doped silica fibres, purchased from CorActive (Canada), the fibres having a
core diameter of 50 μm and a cladding diameter of 125–127 µm. In order to use the fibres, the
coating was first carefully removed through use of a fibre stripper (Miller, USA). The fibre
was then cleaned to remove any residual polymer. The product was then cut into small fibre
lengths of approximately 0.3 ± 0.1 cm, use being made of a scalpel.
The measurements (Fig. 16) were made in a thin window (0.1 mm mica) water phantom, the
irradiations being carried out using the UK National Health Service Clatterbridge proton
therapy facility. The results have been compared against gold standard parallel plate
ionization chamber measurements. In measuring the Bragg peak, the commonly observed
issue of a quenching effect is evident, with a decreased response with increasing ionization
density of the radiation field. This dose underestimation in the Bragg peak of heavy charged-
particles (Rah et al. 2012), also re ferred to as the quenching effect (Azangwe et al. 2014),
has been reported most for chemical dosimeters such as film, polyacrylamide gels (PAG),
Fricke gels, PRESAGEs, and alanine (Doran et al. 2015; Baldock et al. 2010 and Gustavsson
et al. 2004). This phenomenon is not yet fully understood; high-dose saturation, ion-
recombination and track structure theory are among the possible explanations, as discussed
by Gustavsson et al. (2004); Jirasek and Duzenli (2002); Katz (1978); Zhao et al. (2012) and
Gorjiara et al. (2012). More detailed investigations are ongoing, the present work simply
being to illustrate the utility of the fibres. From this preliminary study it is evident that:
x Data for the profile can be obtained in a single exposure, saving considerable beam
time, a matter contrary to the experience in making use of a parallel plate ionization
79
chamber for point-by-point measurements;
x Very high resolution range verification is to be had;
x The irradiated fibres show variations about the mean of up to ±10%, an outcome that
is highly competitive with results obtainable using the well-established LiF:Mg, Ti
(TLD-100) phosphor-based medium.
Figure 16: Depth dose distribution of a modulated and un-modulated 62 MeV proton beam. The upper graph shows the outcome for an undmodulated beam, the parallel plate ion chamber achieving the predicted peak to plateau ratio of some 5:1 while the fibres approach a a ratio of 4:1. The lower graph shows the outcome for a modulated beam, the
fibres producing a range that closely agrees with parallel plate ion chamber measurements.
0
20
40
60
80
100
120
0 10 20 30 40
Nor
amlis
ed d
ose
(%)
Depth in water (mm)
Depth Dose Profile for 62 MeV Proton Beam
PPICOptical Fibre
0
20
40
60
80
100
120
0 10 20 30 40
Nor
amlis
ed d
ose
(%)
Depth in water (mm)
80
The graphed results of Figure 17, relate to the second set of situations, showing mass-
normalised data from irradations of fibres of various form and also of phosphor-based TLDs,
obtained using a tube x-ray facility (model ERESCO 200 MF4-RW) located at the Physics
Department of the University of Malaya. For present work the tube x-ray facility was
operated at 80 kVp nominal tube potential, with doses to the samples ranging from 0.5 mGy
to 10 mGy, verified through use of a calibrated ionisation chamber. The fibre results are for
doped PCFs (Ge and B doped), PCFc_Ge and PCFc_B, the subscript c indicating that under
the action of a vacuum, the fibres were collaped down from hollow bores into a solid
assembly (see for instance, Ghomeishi et al., 2015; Dermosesian et al., 2015), inducing
strain-related defects and thus additional TL sensitivity. The inset shows the sensitivity of the
PCFs to greatly exceed that of TLD-100 (a doped LiF medium) while the main figure
illustrates the sensitivity of TLD-200 (CaF2:Dy) phosphor, a material notable for its ability to
sense environmental levels. Under the well-controlled situation of x-ray irradiations, the
senstivity of TLD-200 is seen to out perform the present capability of our PCF media. It is to
be noted that at calibrated doses the individual TLDs have been selected to provide uniform
response to within ± 5% of the mean TL yield.
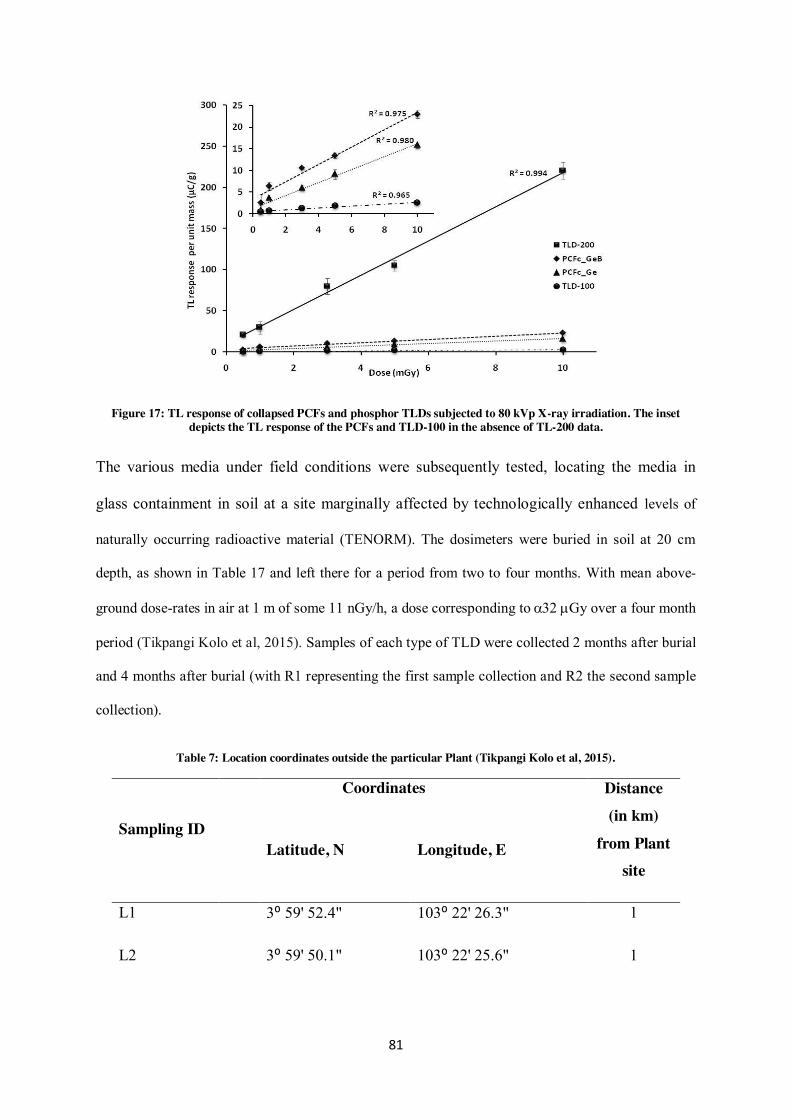
81
Figure 17: TL response of collapsed PCFs and phosphor TLDs subjected to 80 kVp X-ray irradiation. The inset depicts the TL response of the PCFs and TLD-100 in the absence of TL-200 data.
The various media under field conditions were subsequently tested, locating the media in
glass containment in soil at a site marginally affected by technologically enhanced levels of
naturally occurring radioactive material (TENORM). The dosimeters were buried in soil at 20 cm
depth, as shown in Table 17 and left there for a period from two to four months. With mean above-
ground dose-rates in air at 1 m of some 11 nGy/h, a dose corresponding to a32 PGy over a four month
period (Tikpangi Kolo et al, 2015). Samples of each type of TLD were collected 2 months after burial
and 4 months after burial (with R1 representing the first sample collection and R2 the second sample
collection).
Table 7: Location coordinates outside the particular Plant (Tikpangi Kolo et al, 2015).
Sampling ID
Coordinates Distance (in km)
from Plant site
Latitude, N Longitude, E
L1 3⁰ 59' 52.4" 103⁰ 22' 26.3" 1
L2 3⁰ 59' 50.1" 103⁰ 22' 25.6" 1
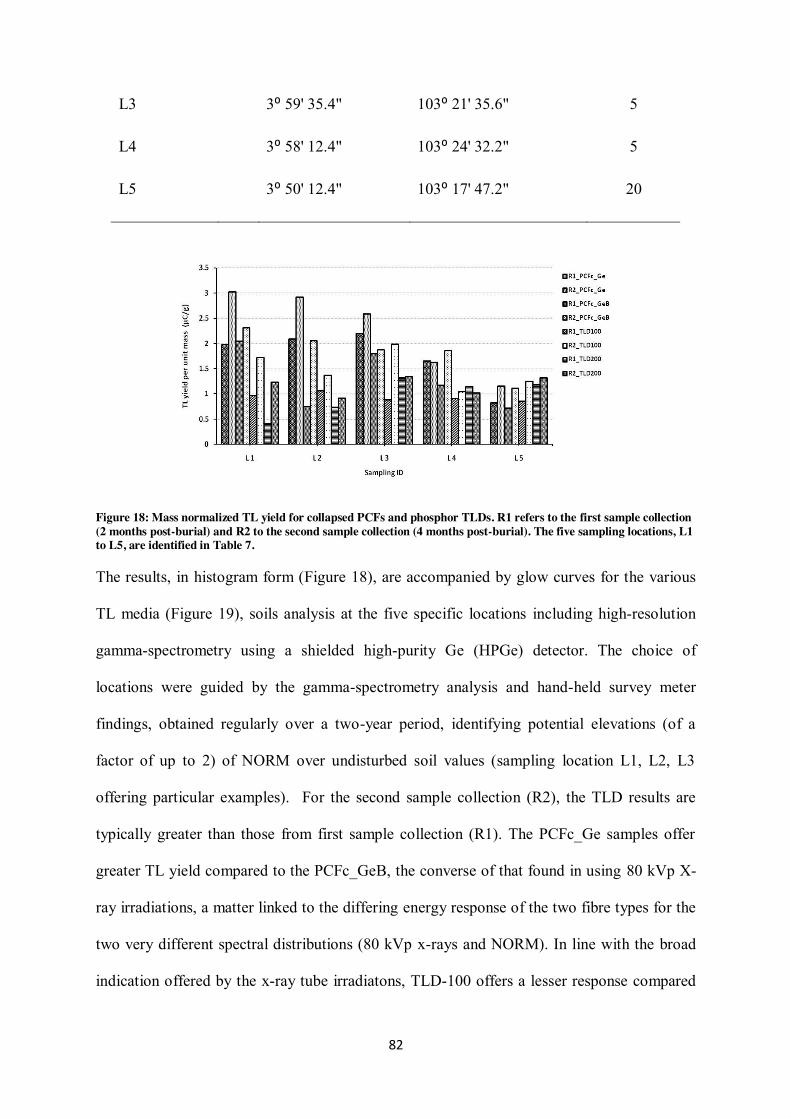
82
L3 3⁰ 59' 35.4" 103⁰ 21' 35.6" 5
L4 3⁰ 58' 12.4" 103⁰ 24' 32.2" 5
L5 3⁰ 50' 12.4" 103⁰ 17' 47.2" 20
Figure 18: Mass normalized TL yield for collapsed PCFs and phosphor TLDs. R1 refers to the first sample collection (2 months post-burial) and R2 to the second sample collection (4 months post-burial). The five sampling locations, L1 to L5, are identified in Table 7.
The results, in histogram form (Figure 18), are accompanied by glow curves for the various
TL media (Figure 19), soils analysis at the five specific locations including high-resolution
gamma-spectrometry using a shielded high-purity Ge (HPGe) detector. The choice of
locations were guided by the gamma-spectrometry analysis and hand-held survey meter
findings, obtained regularly over a two-year period, identifying potential elevations (of a
factor of up to 2) of NORM over undisturbed soil values (sampling location L1, L2, L3
offering particular examples). For the second sample collection (R2), the TLD results are
typically greater than those from first sample collection (R1). The PCFc_Ge samples offer
greater TL yield compared to the PCFc_GeB, the converse of that found in using 80 kVp X-
ray irradiations, a matter linked to the differing energy response of the two fibre types for the
two very different spectral distributions (80 kVp x-rays and NORM). In line with the broad
indication offered by the x-ray tube irradiatons, TLD-100 offers a lesser response compared
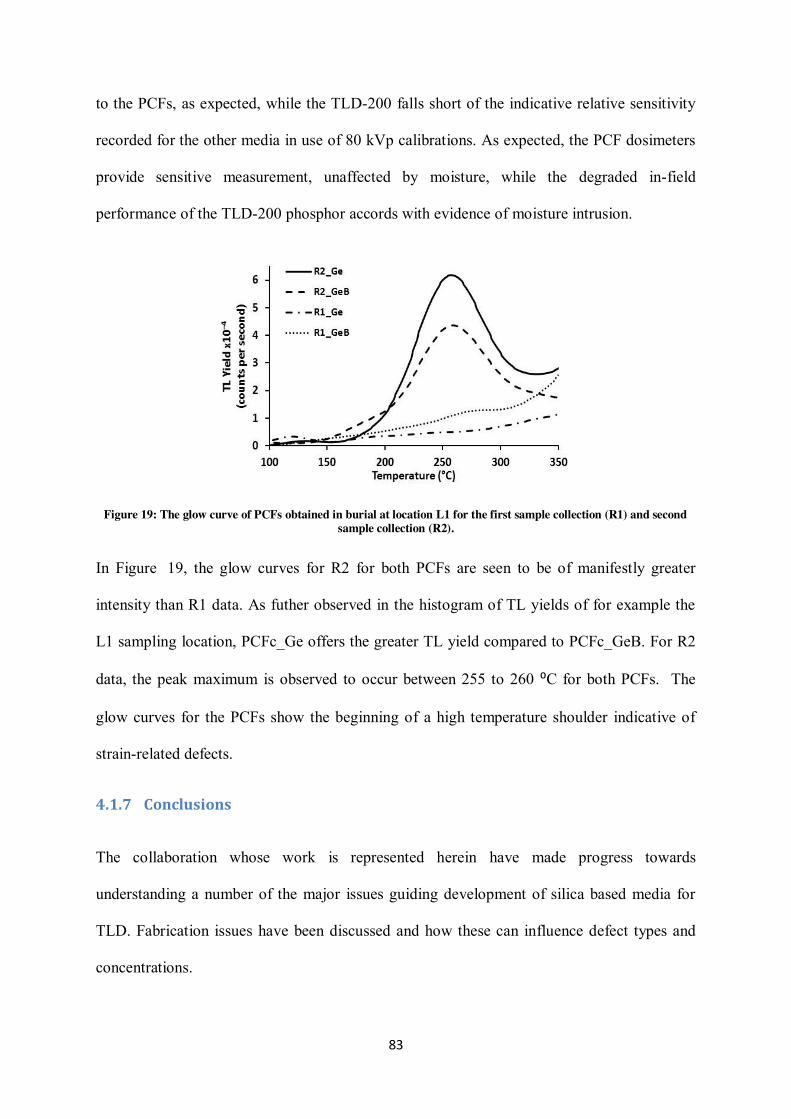
83
to the PCFs, as expected, while the TLD-200 falls short of the indicative relative sensitivity
recorded for the other media in use of 80 kVp calibrations. As expected, the PCF dosimeters
provide sensitive measurement, unaffected by moisture, while the degraded in-field
performance of the TLD-200 phosphor accords with evidence of moisture intrusion.
Figure 19: The glow curve of PCFs obtained in burial at location L1 for the first sample collection (R1) and second sample collection (R2).
In Figure 19, the glow curves for R2 for both PCFs are seen to be of manifestly greater
intensity than R1 data. As futher observed in the histogram of TL yields of for example the
L1 sampling location, PCFc_Ge offers the greater TL yield compared to PCFc_GeB. For R2
data, the peak maximum is observed to occur between 255 to 260 ⁰C for both PCFs. The
glow curves for the PCFs show the beginning of a high temperature shoulder indicative of
strain-related defects.
4.1.7 Conclusions
The collaboration whose work is represented herein have made progress towards
understanding a number of the major issues guiding development of silica based media for
TLD. Fabrication issues have been discussed and how these can influence defect types and
concentrations.
84
4.2 Latest developments in silica-based thermoluminescence
spectroscopy and dosimetry
The content of the following section has been published in the journal “Applied Radiation
and Isotopes”: " D.A. Bradley, S.M. Jafari, A.S. Siti Shafiqah, N. Tamcheck, A. Shutt, Z.Siti
Rozaila, S.F. Abdul Sani, Siti Norbaini Sabtu, Abdulaziz Alanazi, G. Amouzad Mahdiraji,
H.A. Abdul Rashid, and M.J. Maah. Volume 117, November 2016, Pages 128-134, “Latest
developments in silica-based thermoluminescence spectroscopy and dosimetry” (Appendix
B). The right to include the article in any thesis or dissertation has been obtained during
assignment of copyright with the publisher. Also, the right to include this work in this thesis
has been obtained from the co-authors. My major role in this work centred around samples
preparations for proton and neutron irradiation, results analysis together with participation in
the interpretation of the results and writing of the manuscript.
4.2.1 Introduction
The last three years has witnessed an increased desire to improve luminescence
dosimetry through the development of GeO2 doped SiO2 fibres of fine diameter (0.1 mm – 1
mm). Our previous investigations of commercial jewelry beads have shown that such beads
are characterized by additional benefits, in terms of robust utility and reduced cost. With both
media (i.e. GeO2 doped SiO2 fibres and commercial jewelry beads) being silica-based,
compositional investigations by previous researchers, including Jafari et al. (2014a), have
established the presence and concentration of dopants in the silica, with the purpose of
developing highly sensitive thermoluminescence dosimeters (TLDs).
Through the use of a custom-built spectrometer, this section presents first findings for
emission wavelengths, which indicate a dominance of wavelengths towards the blue end of
the visible spectrum. Our focus on thermoluminescence (TL) yield is aimed at defining the
85
optimal concentration of GeO2 in the SiO2 fibres, which currently ranges between the
standard of 4 mol% up to 12 mol%. Whereas short-range SiO2 network experiences minimal
strain at low dopant concentrations, studies by Abdul Sani et al. (2015a, 2015b) have
established that elevating Ge dopant concentrations above the standard 4 mol% lead to lower
TL yield due to concentration quenching or “self-absorption. The present work thus
predominantly investigates the preforms upon which the fibres are formed.
Given the current interest in Ge-doped silica preforms, this section attempted to determine
changes in emission occasioned by changes in defect concentrations. To commence the study
of the TL glow curve, a description of the standard energy levels for the inherent defects in
the Ge-doped silica preforms media was undertaken as modeled in figure 1. The band model
presented in figure 20 is characterized by different types of energy bands as demonstrated. Ec
is the activation energy or conduction energy, and is the least energy necessary for de-
trapping.
Figure 20: Energy band model illustrating the electronic transmissions associated with a TL material.
Ev refers to valence band energy, while Ef is the Fermi energy. Electrons and holes are
generated in the region a of figure 20 while region b allows for electron-hole trapping.
86
Thermal stimulation leads to the release of electrons in region c while recombination occurs
in region d of figure 20.
4.2.2 Energy Band Diagram
The absorption and thermoluminescence process are the concerns of optical activity.
The introduction of Ge atom into the glass-matrix lattice leads to the modification in the bond
energy, as the Ge atoms move to take up interstitial or substitutional positions. Such
modification occasions the free movement of the donor electrons from one ion to another.
The energy gap between silica’s valence and conduction band widens at approximately 9 eV,
as illustrated in figure 21.
Figure21: Modification of the energy band structure of silica by impurity atoms(Ge)or lattice irregularitiesinthesilicaglassthatcreatelocalizedelectronstates(energy values all in eV).This figure was constructed with the help of available literature (Randall, 1945; Skuja, 1992, 1998; Imai andHirashim,1994; Amossov and Ry-
baltovsky,1994), showing the various possible defect energy levels in Ge doped silica.
The electrons can transition from ground energy to the conduction energy upon absorbing
sufficiently greater light energy, and consequently, a current is produced. Trapping of the
electrons by the Ge atoms (impurity atoms) in the silica glass can take place at intermediate
energies, a phenomenon that leads to the creation of localized electron states which are often
characterized by extremely narrow energy level, and can trap electrons longer (up to years).
Such energies are released in the form of photons and are classified in accordance with
typical time scales, as is the case in fluorescence (10-7 s) as well as phosphorescence (102 s).
The phosphorescence process has a range of applications. This photon forms our main
interest in the current work. The localized energy states occasioned by impurity atoms such
87
as the Ge atoms, have been investigated by a number of researchers, including Randall
(1945), Skuja (1998), Imai and Hirashim (1994), as well as Amossov and Rybaltovsky
(1994). The results of these studies have provided for a comprehensive summary of the Ge-
doped silica glass energy levels as shown in table 8.
Table 8: Silica’s Optical Absorption and Luminescence Band Defect Centres
Acronym(s) of Defect
Proposed Structural
Model(s)
Situation of Optical
Absorption Band
Peaks (eV)
PL Bands Peaks
(eV)
Si ODC(II), Ge ODC(II) Oxygen vacancy 6.8-7.0 4.2-4.3
B2(Si), Oxygen divacancy 4.95-5.05 4.3-4.4
B2(Ge) Oxygen divacancy 5.1-5.4 4.3-4.4
Si𝟎𝟐 discoordinated Si/Ge 3.15 2.7-2.8
Ge𝟎𝟐, Ge2+ Discoordinated Ge 3.7 3.0-3.2
Non-bridging-oxygen
hole centre (NBOHC)
≡Si–O 4.8 1.85-1.95
4.2.3 Energy Level of GeO2-SiO2 Glass
The production of the point defects in an insulator’s or semiconductor’s extrinsic
doping adopts the form of a mixture of vacancies and interstitials, all which lead to the
distortion of the structure plane, and thus occasioning the alteration of compactness and local
charge as well as strain. Colour centres are produced by the point defects as a consequence of
88
the modification of electronic neutrality. The line defects and area defects emanate from
dislocations and instance grain boundaries respectively. The standard energy level description
of GeO2-SiO2, as shown in figure 21, provides a reflection of the defects, while table 8
summarizes the results of previous investigations of doped media such as silica doped by
GeO2. In the current study, our focus is limited to the study of glow curves and emission
spectrum. In particular, an examination of two samples of GeO2 doped silica proforms
namely: oxygen-rich Ge-doped silica preform and oxygen-deficient Ge-doped silica preform
was undertaken.
4.2.4 Sample Preparation
The approach taken in the present work has been that of developing the two preform
samples of oxygen-rich Ge-doped silica preform (P1) and oxygen-deficient Ge-doped silica
preform (P2). A description of the preparation these samples as well as their optical
spectroscopic characteristics have been provided by Tamchek et al. (2013) and Siti Shafiqah
et al. (2015).
4.2.5 Experimental Set-up for Conventional Glow Curves
In order to obtain the necessary glow curves, the University Malaya Radiation
Laboratory’s Harshaw Model 3500 Manual TLD reader was used. The two samples adopted
for the investigation (P1 and P2) had to undergo pre-heating up to a temperature of 80 oC so
as to get rid of the thermally unstable thermoluminescence component associated with the
glow curve. The pre-heated samples were then subjected to further heating to a temperature
of up to 400 oC at a rate of 10 oC/second. What followed then was the analysis and
deconvolving of the glow curves, beginning with Voigt profile, from which it was
demonstrated in the current work that the components peaks can be approximated by the
89
Gaussian function, which also allows the approximation of the peak central temperature and
FWHM. Nevertheless, Alawiah et al. (2015) noted that this is a limited approach.
In the current case, the extremely smaller Lorentzian contribution to the Voigt profile
was neglected while fitting the information to the Randall and Wilkins’ TL model. Figure 20
illustrates the activation energy (Ec) of the glow curves. A characteristic feature of the
Randall and Wilkins’ TL model is that the peak positions remain fixed, while their heights
are directly proportionate to the dose. The analysis of thermoluminescence emission spectra
was performed using an in-house experimental setup (figure 22) as described in the following
subsections.
Figure 22: The In-house Experimental Setup for measuring emission spectra of the heated samples P1 and P2.
90
4.2.6 The Experimental Set-Up for TL Emission Spectra
The experimental setup adopted for measuring the heated samples’ emission spectra is
presented in figure 22. The entire system of the set-up (figure 22) comprises three main
components namely: a heating chamber, the spectrograph, and a high sensitivity CCD array.
The design of the system was intended to allow for the measurement of extremely low light
intensities, given that the sample underwent heating over a pre-defined interval. A large
diameter (24 mm) collimation lens, with a focal length of 35.4 mm was used to collect
emission spectra from the heated samples. A Czerny-Turner spectrograph, utilizing a 600 µm
core diameter was used for transferring the collected light. A grating groove of 150 g/mm to
follow the dispersion of the spectra was used. The grating groove had the capability of
producing a spectral bandwidth of 400 nm and spectral resolution of 0.4 nm. A high
sensitivity cooled charge detector (CCD) of Andor Technology (Model iDUS DU401) was
used to acquire the spectral information. The CCD was characterized by a pixel array of 1024
x 128, a pixel size of 26 x 26 µm, as well as a quantum efficiency above 95% within visible
region (550 nm). The total dark current stands at 0.001 electrons/pixel/second, when the CCD
is cooled to -80 oC. Our observation of the system light suggest that it can be compared to a
conventional photomultiplier tube. A double layer copper cylinder, with a glass wood
insulator, was used to shield the heater chamber was for purposes of reducing heat loss from
the heater ceramic. The heater ceramic’s heat capacity and heat conductivity of 900 W and
100 W/(m K) respectively, allow maximum heat transfer to the sample. For purposes of
ensuring accurate measurement of temperature, an external type K temperature probe fixed at
the top of the sample was used. The sample’s and CCD’s temperatures sing a customized
automation software were recorded and controlled, which was ran by a personal computer
(PC) using LabView.
91
Both control and irradiated samples were placed in the heater and heater chamber in
turns, with N2 being used to purge the irradiated sample to rid it of water vapor as well as to
prevent it from being oxidized. The samples were heated at a temperature rate of 1.5
oC/second, and record the emission spectra for a duration of 250 seconds. The CCD in the
Photon Accounting mode was used, and accumulated the data at 5 x the shutter duration of
150 ms. In this regard, 1 sec/oC was not only the time that a single acquisition took, but also
the time taken to stabilize the sample temperature. Correction of the emission spectra for
background emission was obtained, ceramic heater blackbody radiation, as well as CCD
quantum efficiency.
4.2.7 Peak Temperature
The results of the glow curve study for samples P1 and P2 are shown in figures 23
and 24 respectively. The deconvolved results for P1, as shown in figure 23, indicate that the
sample is characterized by two peaks – the lower peak (peak 1) and the maximum peak (peak
2). The lower peak attains a maximum yield at a temperature of 234.8 oC, which matches the
use of the Arrhenius equation with an Ec of 0.4567 eV. The upper peak of P1 on the other
hand attains maximum yield at a temperature of 328.5 oC, and which coincides with an Ec of
0.5035 eV.
92
Figure 23: Glow Curve Deconvolution Analysis for the Oxygen-Rich Sample (P1)
In the case of P2, the results shown in figure 24 suggest that the sample is characterized by a
single peak, which attains a maximum yield at a temperature of 315.6 oC, and which
coincides with an Ec of 0.5377 eV. Figure 24 illustrates the results of sample P2.
Figure 24: Glow Curve Deconvolution Analysis for the Oxygen-Deficient Sample (P2)
4.2.8 Spectral Analysis
The preform samples (P1 and P2) were analyzed using the customized spectrograph.
The results of the analysis are presented in figure 25.
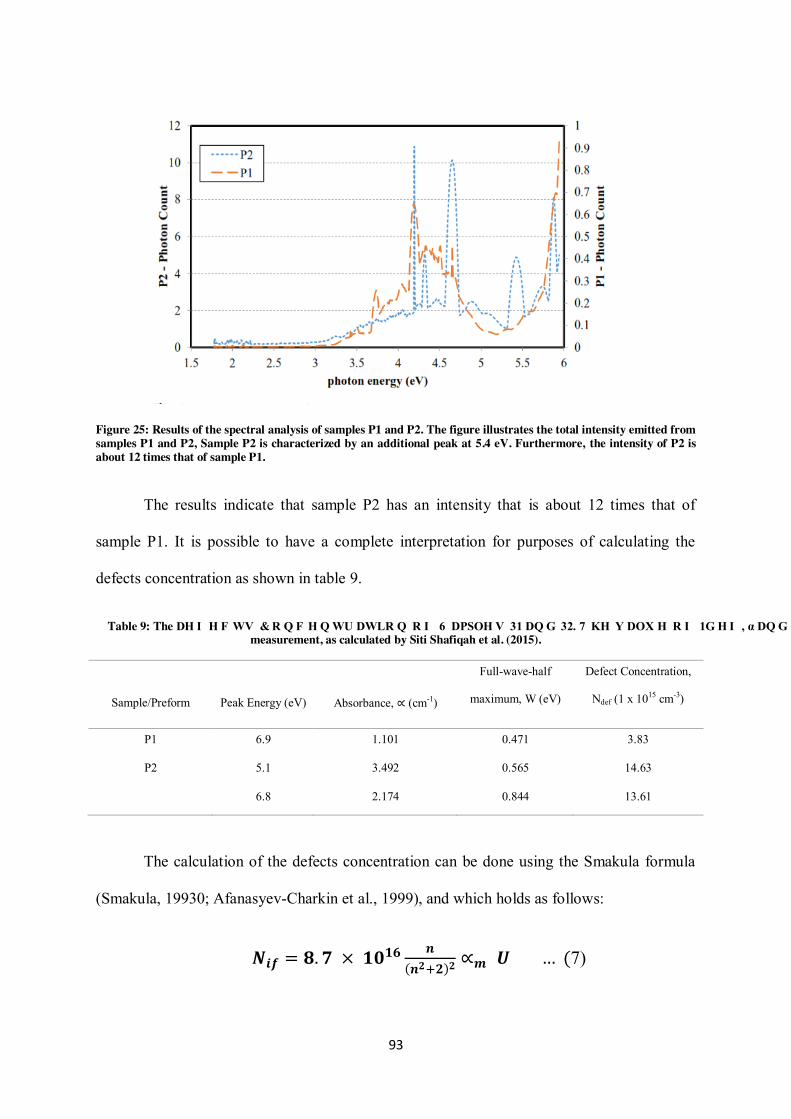
93
Figure 25: Results of the spectral analysis of samples P1 and P2. The figure illustrates the total intensity emitted from samples P1 and P2, Sample P2 is characterized by an additional peak at 5.4 eV. Furthermore, the intensity of P2 is about 12 times that of sample P1.
The results indicate that sample P2 has an intensity that is about 12 times that of
sample P1. It is possible to have a complete interpretation for purposes of calculating the
defects concentration as shown in table 9.
Table 9: The Defects Concentration of Samples P1 and P2. The value of Ndef, α and W obtained from absorption measurement, as calculated by Siti Shafiqah et al. (2015).
Sample/Preform
Peak Energy (eV)
Absorbance, ∝ (cm-1)
Full-wave-half
maximum, W (eV)
Defect Concentration,
Ndef (1 x 1015 cm-3)
P1 6.9 1.101 0.471 3.83
P2 5.1 3.492 0.565 14.63
6.8 2.174 0.844 13.61
The calculation of the defects concentration can be done using the Smakula formula
(Smakula, 19930; Afanasyev-Charkin et al., 1999), and which holds as follows:
𝑵𝒊𝒇 = 𝟖. 𝟕 × 𝟏𝟎𝟏𝟔 𝒏(𝒏𝟐+𝟐)𝟐 ∝𝒎 𝑼 … (7)
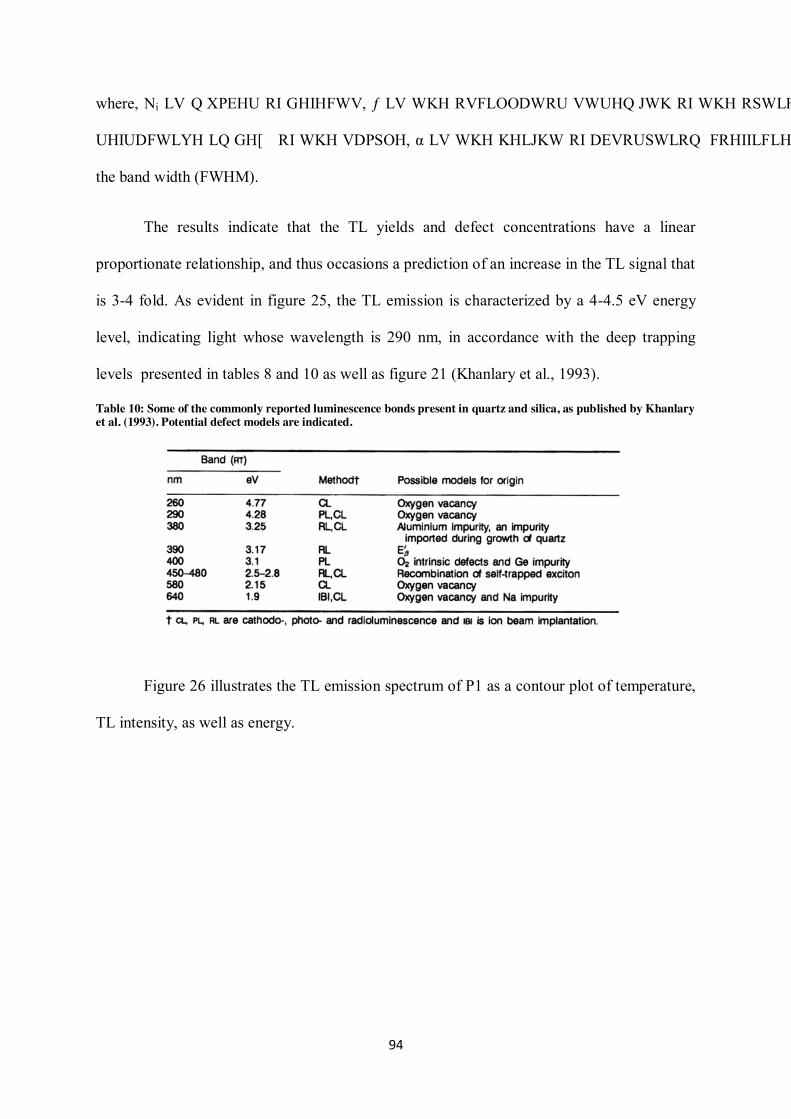
94
where, Ni is number of defects, ƒ is the oscillator strength of the optical transition, η is the
refractive index of the sample, α is the height of absorption coefficient of the peak and U is
the band width (FWHM).
The results indicate that the TL yields and defect concentrations have a linear
proportionate relationship, and thus occasions a prediction of an increase in the TL signal that
is 3-4 fold. As evident in figure 25, the TL emission is characterized by a 4-4.5 eV energy
level, indicating light whose wavelength is 290 nm, in accordance with the deep trapping
levels presented in tables 8 and 10 as well as figure 21 (Khanlary et al., 1993).
Table 10: Some of the commonly reported luminescence bonds present in quartz and silica, as published by Khanlary et al. (1993). Potential defect models are indicated.
Figure 26 illustrates the TL emission spectrum of P1 as a contour plot of temperature,
TL intensity, as well as energy.
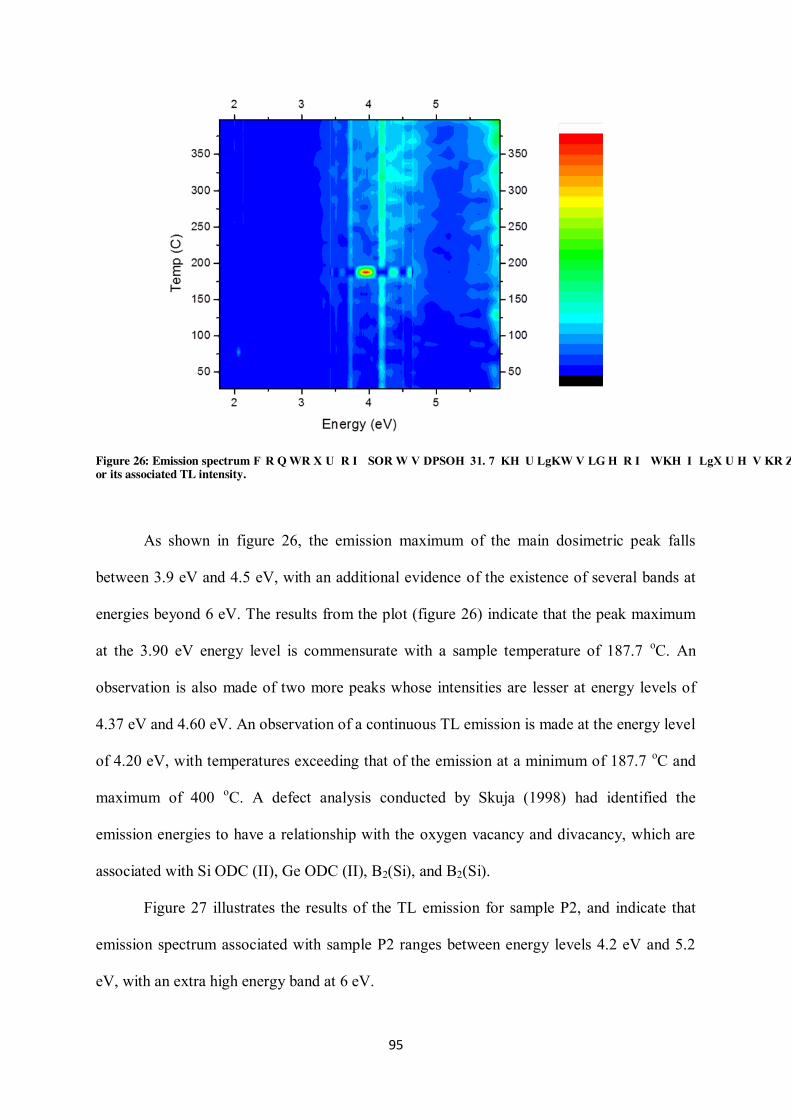
95
Figure 26: Emission spectrum contour of plot sample P1. The right side of the figure shows the sample’s relative heat or its associated TL intensity.
As shown in figure 26, the emission maximum of the main dosimetric peak falls
between 3.9 eV and 4.5 eV, with an additional evidence of the existence of several bands at
energies beyond 6 eV. The results from the plot (figure 26) indicate that the peak maximum
at the 3.90 eV energy level is commensurate with a sample temperature of 187.7 oC. An
observation is also made of two more peaks whose intensities are lesser at energy levels of
4.37 eV and 4.60 eV. An observation of a continuous TL emission is made at the energy level
of 4.20 eV, with temperatures exceeding that of the emission at a minimum of 187.7 oC and
maximum of 400 oC. A defect analysis conducted by Skuja (1998) had identified the
emission energies to have a relationship with the oxygen vacancy and divacancy, which are
associated with Si ODC (II), Ge ODC (II), B2(Si), and B2(Si).
Figure 27 illustrates the results of the TL emission for sample P2, and indicate that
emission spectrum associated with sample P2 ranges between energy levels 4.2 eV and 5.2
eV, with an extra high energy band at 6 eV.
96
Figure 27: Emission Spectrum Contour plot of Sample P2.
The peak maximum form sample P2 was established at 4.94 eV. In addition, the
intensity of P2 was found to be greater compared to that of P1. Nevertheless, important to
note is that the peaks of sample P2 begin to emit at a temperature of 368 oC, which is
relatively higher, and which corresponds that associated with the conventional glow curve
measurement. Based on the results of defect analysis presented in Table 8, there is evidence
to suggest that there is a relationship between this emission energy and the oxygen divacancy,
which belongs to B2(Si) and B2(Ge).
4.2.9 Cases of Silica Beads Irradiated by an Am-Be Neuron Source
With the foregoing underpinning information, investigation of the potential of doped
silica media for developing versatile thermoluminescence dosimeters continued, with a
particular focus on neutron detection capability. In doing so, hollow silica beads, with a 1 mm
diameter were adopted, and which have previously been adopted by Jafari et al. (2014a,
2014b, 2014c) for photon TL dosimetry. Figure 28 shows the preliminary depth-dose
distributions that obtained from an Americium Beryllium (Am-Be) neutron source placed in a
97
water tank. While keeping the beads threaded onto a nylon filament, thin in size, the string of
beads was suspended directly over the neutron source, whose activity was 17.6 GBq, and
allowed a neutron emission rate of 62.6 n/s/MBq. The distance between the source surface
and the nearest bead was kept at approximately 0.6 cm, with the rest of the 168 equi-spaced
beads being placed at as far as approximately 20 cm away from the source surface. The
exposure of the arrangement to the source lasted for a duration of 10 days, with beads
undergoing sensitivity corrections from a photon irradiation to a standard dose. Detailed
description of the calibration was produced in a previous publication (Jafari et al., 2014b).
The utility of getting dense spatially resolved detection of the neutrons at unsurpassed
spacing is demonstrated in figure 28. A general agreement was obtained in shape using the
Monte Carlo simulation, as described by Yury Zevallos-Chavez and Bugno Zamboni (2005).
What seems to be an intriguing feature of our measurements, and that which is yet to
be explored further, is the observed instances of variation in the otherwise uniform downward
trend in the data. A prominent instance was the variation near a source to detector separation
of a distance of 5 cm. Through the use of Monte Carlo simulation, sharp peaks are
established, which are re-obtainable at similar points as those of the measured data, as
indicated in figure 28.
98
Figure 28: Depth-dose distribution in an Am-Be neutron source. (a) 1 mm spatial resolution depth dose distribution from the Am-Be neutron source; (b) A visual impression of the Monte Carlo simulation’s mathematical model; (c) Neutron source spectrum; (d) the MCNP Monte Carlo simulation’s 3 independent runs.
Although further investigations are ongoing, it is worth noting that the particular MCNP code
adopted for the simulation of our experiment did not factor in diffractional phenomena or
take into account the 59.54 eV gamma rays that emanate from the 241Am source following
alpha emission. The 59.54 eV gamma rays associated with the 241Am source contributed to
the observed differences in intensity.
99
4.2.10 Conclusion
Using two samples of oxygen-rich (P1) and oxygen-deficient (P2) preforms, an in-
depth overview of the physics upon which investigations of thermoluminescence of irradiated
doped silica media are anchored has been produced. In particular, the band gap model and the
defects that occasion the TL phenomenon are described in a detailed manner. The
observations suggests the existence of a correspondence between the doped silica’s model
system, as documented in literature, and our empirical measurements of the emission
spectrum and glow curves from the doped silica preforms, as described in the current work.
The scope of the current work is also extended to include a demonstration of the versatility of
the silica media by taking TL measurements from a neutron source dipped in a water tank,
with a view to establishing the unsurpassed spatial resolutions that can be obtained with such
dosimeters.
100
4.3 Characterisation of an isotopic neutron source: A comparison of
conventional neutron detectors and micro-silica glass bead
thermoluminescent detectors
The content of the following section has been published in the journal “Radiation Physics and
Chemistry” Y.M Abubakar et. al., M.P. Taggart, A. Alsubaie, A. Alanazi, A. Alyahyawi, A.
Lohstroh, A. Shutt, S.M. Jafari, and D.A. Bradley. 2017. Volume 140, November 2017,
Pages 497-501, “Characterisation of an isotopic neutron source: A comparison of
conventional neutron detectors and micro-silica glass bead thermoluminescent detectors”
(Appendix C). The right to include the article in any thesis or dissertation has been obtained
during assignment of copyright with the publisher. Also, the right to include this work in this
thesis has been obtained from the co-authors. My major role in this work centred around
samples preparations for proton and neutron irradiation, results analysis together with
participation in the interpretation of the results and writing of the manuscript.
4.3.1 Introduction
Achieving mm spatial resolution by mapping mixed radiation fields using
conventional glass-based neutron detectors is a challenging undertaking. However,
developing an in-depth knowledge of various radiation intensities as a consequent of the
location of the environment enveloping neutron sources is of the essence if such sources are
to be utilized as characterization tools. Therefore, in the present work, the potential of using
thermoluminescence response of 1.1 mm diameter micro-silica glass beads for purposes of
mapping the radiation field occasioned by an Am-Be neutron source dipped in a water tank
was explored.
101
When convoluted through moderation and increasing of the distance from the source,
Thompson and Tylor (1965); Anderson and Neff (1972); Lorch (1973); as well as Caehlo et
al. (1989) have reported that the neutron emission energies occasion peaks in the distribution
of the neutron capture cross section. In fact, this phenomenon has been corroborated by
previous studies conducted by Mathews (1979); Nicolaou (1983); and Taggart (2007). As
reported by Jafari et al. (2014a), a far finer ΔE (neutron) sensitivity is obtainable with the ∼1
mm sized dosimeter than with alternative techniques. While the energy response of
conventional gas detectors is properly documented in existing literature, Jafari et al. (2014c)
have previously reported on that of glass beads.
Most of the previous work, including those by Chang and Timmerman (2007) and Teoh et al.
(2011), have been focused on investigating the effectiveness of dosimeters for application in
radiation dosimetry, and with a specific emphasis on the need to develop dosimeters with
small dimensions vis-à-vis the radiation field dimension (Bjärngard et al., 1990; Higgins et
al., 1995; Fracesco et al., 1998; Sauer and Wilbert, 2007; Aspradakis et al., 2010; Jafari et al.,
2014a). However, most of the recent studies have shifted focus by investigating the potential
of a mixed radiation field, as was the case in Bradley et al. (2016) as well as in the current
study. The intention to observe this point is informed by the understanding that the glass
beads’ response cannot be a function of neutron interactions per se, as a substantial gamma
factor is expected to make a significant contribution to the TL yield, even though the γ
efficiency remains extremely low for the comparative gas detectors as noted by Reilly et al.
(1991) and Kouzes et al. (2009).
2. Experimental Setup
The experiments were undertaken using a mono 11 GBq Am-Be source (Ziegler,
2007), which was available at the University of Surrey, as described in figure 29.
102
Figure 29: Neutron tank setup and detectors positions for vertical measurement study. While both the glass beads and gas detectors were depicted in a similar position, their measurements were undertaken separately.
The glass beads were submerged in the water contained in the water tank. The vertical gas
detectors (i.e. the 3H and boron trifluoride) on the other hand were enveloped within an air-
tube. Instead of preferentially selecting fast neutrons by displacing the moderating water, the
high-voltage supply was protected by raising the air-tube using the detector. The gas detector
was powered with an Ortec 710 PSU, holding the 3He tube and the BF3 detector at 1200 V
and 1800 V respectively. Respective detector outputs were led into an Ortec 142A
preamplifier and an Ortec 672 spectroscopy amplifier was feted, with each tube being
assigned a shaping time of 3 µs. The Ortec Maestro program (Ortec, 2016) provided online
monitoring. Using the Root framework (Brun & Rademakers, 1997), a customized code, with
which was performed offline analysis was builted.
103
4.3.2 Surface Scan
The initial measurements were aimed at investigating the gas detectors scanning
response across the neutron tank’s surface. As evident in figure 30, both detector systems are
characterized by a similar response curve peaking regarding the source location.
Figure 30: Scans across the neutron tank’s surface with the gas detectors. The maximum intensity appears above the Am-Be source.
However, the 3He tube provided a relatively greater neutron reaction, which permitted
the generation of neutron count that proved more statistically reliable. Nevertheless, it was
found both detectors to have comparatively poor spatial resolution, with the active volume of
the 3H tube and the BF3 being 76 cm3 and 152 cm3 respectively. These findings are
commensurate with a spatial “bite” of approximately 2 cm within the horizontal surface
plane. Besides performing detector measurements, data were repeatedly recorded set using a
cadmium sheath, so as to reduce the effect of thermal neutrons. However, the cadmium
sheath-based analysis proved statistically unsound in the case of the BF3 detector, and hence
the BF3 results obtained through this analysis were excluded from this analysis.
104
4.3.3 Depth Measurement
The 3He detector was used to measure depth comparison. This was necessitated by the
fact that the BF3 tube is characterized by a limited resolution, and thus was not suitable for
the depth comparison measurements. A substantial “energy bite” was observed for every data
point, courtesy of the gas detector’s relatively large active area. The substantial “energy bite”
observed in this experiment justifies the poor spatial resolution that characterizes the
conventional neutron detectors. However, this confirmed the availability of spectroscopy in
this instance. In addition, it was observed that measurements improved due to the
significantly reduced gamma interaction component. Similarly, cadmium-sheathed have
measurements were also undertaken on the surface measurements.
4.3.4 Glass Beads
Figure 31 shows a sample of the ∼1.1 mm diameter glass beads were used in this
study. Before irradiating the glass beads, preparation in accordance with the procedure
outlined by Jafari et al. (2014b) was made.
Figure 31: individual hollow glass beads.
105
The individual beads were subjected to annealation at 400 oC for a period of 1 hour with a
ramp rate 10 oC/minute and a cool down rate of 1 oC/minute, so as to rid them of any
historical record of irradiation, and thus ensure the provision of a clean dosimeter. The
annealed samples were consequently maintained at 80oC for duration of 16 hours. In their
previous measurements, Jafari et al. (2014b) had confirmed that annealation does not impact
on the radiation response of the glass beads.
Three independent strings of glass beads were suspended directly above the neutron
source as illustrated in figure 29, while ensuring a gap of approximately 31 mm between the
glass beads at the bottom and the neutron source, with each of the three strings of beads
containing a total of 370 individual hollow beads (see figure 31 for examples). The beads
were threaded onto a nylon filament for an estimated length of 410 mm. Then irradiation of
the glass bead samples using the 11 GBq Am-Be source for a period of 14 days was acquired.
This corresponds to a neutron fluence of about 9.5 k neutrons per seconds per square
centimeter for closer beads down to approximately 1.2 neutrons per seconds per square
centimeter at the maximum length of the bead string.
A Toledo 654 TLD reader from the University of Surrey was used to measure the
bead sets in the post-irradiation phase. The measurements in this regard were anchored on the
technique provided by Jafari et al. (2014b). Before undertaking the measurement, the risk of
the rapid fading of the TL material was eliminated by storing the irradiated glass beads in a
dark environment as well as allowing the beads to undergo stabilization (Jafari et al., 2014c).
4.3.5 Calibration
A previous publication by Jafari et al. (2014b) has demonstrated that individual glass
beads exhibit better uncertainty in response compared to other conventional TLD materials.
According to Jafari et al. (2014b), and indeed as confirmed in by us, glass beads are
106
characterized by a variation of approximately 8%. This variability corresponds with the
estimated 15% variability associated with the LiF TLDs, as reported by Jafari et al. (2015).
Despite the current lack absolute reference before performing the calibration, as suggested in
the conclusion with respect to further work, it is worth pointing out that the data variation as
illustrated in figure 33 concurs within uncertainty, and thus look forward to the same yields
from the individual glass beads, with an exception of the peaks.
4.3.6 Monte Carlo Simulation
The Am-Be source’s mixed radiation field together with the dual neutron-gamma
response of the dosimeter makes deconvolution of respective components a necessity. Using
the general Monte Carlo N-Particle transport code, MVNPX proposed by Hendricks et al.
(2008), a simulation was developed, during the modulation of the neutrons’ passage via the
pure water shield. In a previous work by Bradley et al. (2016), this simulation procedure,
which is based on preliminary mathematical model, had been discussed extensively. A
number of assumptions were made regarding the Am-Be source, including a neutron energy
spectrum being emitted by the Amersham source calibration data as well as the construction
of an internal source based on an Am-Be layered structure.
4.3.7 Results and Discussion
As indicated in figure 30, the surface scanning measurements suggest slight variations
in neutron yield over the water tank’s surface, with some greater than 20 cm being deemed
necessary for exhibiting a two-fold reduction in count rate, which is not an unreasonable
outcome, as far as classical trigonometry is concerned. As evident in figure 32, there is
evidence of the vertical depth measurements in both the 3He tube and the glass beads.
107
Figure 32: Vertical Depth Measurements for the 3He Tube and the Glass Beads.
These measurements indicate the cumulative effect of the geometric range of data as well as a
reduction in the moderation of neutron. Measurements for the 3He detector using a ∼1.1 mm-
thick cadmium sheath were taken, the results which indicate a predicted fall in count rate as a
result of the resonances associated with the neutron capture cross section as the energy range
transit from the fast region and the neutrons undergo thermalization.
The vertical measurements presented in figure 32 suggest a similar trend of falling
count rate with rising distance to the neutron source for every experimental data set and the
simulation. However, it is possible to observe far finer structure courtesy of the glass beads
greater spatial resolution. The energy regions that the numerous glass beads encounter are
simultaneously integrated by the gas detectors. This therefore confirms the glass beads’
superior performance, in terms of providing greater spatial resolution.
In addition to the observed apparent energy sensitivity, further observations can be
made through a closer examination of the glass bead data presented in figure 32 as well as the
measurements of the additional bead string presented in figure 33. The glass bead dosimeters
seem to exhibit an apparent lower level plateau region, a phenomenon that is not noticeable in
108
the case of the gas detectors. This therefore depicts a lower energy limit, and the glass beads
may become insensitive when operated below such energy limit. It is found that such distance
is commensurate with a distance of about 23 cm from the neutron source. The characteristic
energy and dose limitations of the glass bead dosimeters have previously been described by
Jafari et al. (2014c).
Figure 33: Abridged TL Yield Associated with a Mixed Radiation Field.
However, the quasi-regular spikes present in the TL intensity, and which are reproduced
during the simulation, is perhaps the prominent feature of the glass bead spectra. The
similarity observed between the TL intensity spikes attributed to the dosimetric data sets is
not enough grounds to arrive at the conclusion that the peaks of the Am-Be neutron energy
spectrum is the origin of the feature (Thomson & Taylor, 1965; Anderson & Neff, 1972;
Lorch, 1973; Coehlo et al., 1989). Therefore, as noted by Lorch (1969) and Wright (1994), it
must stated that some other phenomena are involved in determining the origin of the feature,
or that such origin is potentially a function of a neutron-induced charged-particle reaction,
such as (n,α) or (n,p). In a previous discussion, Jafari et al. (2014c) had identified silicon
109
(33.62% by weight), oxygen (42.18% by weight), and Sodium (10.55% by weight) as the
primary components of the elemental composition. Kim et al. (2013) had reported that the
dominant neutron interaction associated with every element containing the glass beads is
elastic scattering in nature, a phenomenon was observed in all the energy range investigated,
and most of which corroborate the theory that the elastic scattering associated with the
dominant neutron interaction is caused by high Q-values.
Before the Am-Be source adopted for our investigation was installed (Ziegler, 2007),
Bradley et al. (2016) had carried out a similar measurement using two Am-Be sources placed
approximately 20 cm apart, although with a relatively different configuration. Therefore,
based on the previous studies, independent contribution from every individual source is
expected. However, due to the lower spatial resolution (Nicolaou, 1983; Taggarat, 2007), the
possibility of observing the spikes was less likely. The less likelihood of observing the spikes
may also have been due to the potential effect of integrating contributions from the two
neutron sources submerged in the water tank as reported by Bradley et al. (2016).
4.3.8 Conclusion and Further Work
Work is in progress to determine the potential of the commercial glass beads for
dosimetric applications. However, with the little investigations so far, there has been
evidence to suggest that these beads bear significant dosimetric features with regard to the
neutron tank. Four areas that further work must address immediately with respect to this work
were suggested. They include the following:
i. The need for secondary calibration through the Am-Be “halo”.
ii. The need to optimize the sophistication of Monte Carlo simulation.
iii. The need to evaluate the relative n/γ bead sensitivity by undertaking repeated
measurements involving additional lead shielding.
110
iv. The need to evaluate the relative fast/thermal neutron sensitivity through cadmium
shielding.
The “halo” configuration is intended to ensure a constant source-bead distance, and
thus makes it possible for all the glass beads to receive the mixed radiation field dose in an
equal manner. It is possible to uncover the possible source(s) of the “quasi-regular” spikes
based on the experiments have been performed in the present study. For example, in instances
of neutron-induced charged-particle reactions, a change in position regarding future
simulation would be expected. Similarly, where a reaction is the source, the presence of the
“halo” configuration spikes was predicted.
The following three chapters present a full study in radiation dosimetry. Single-wall carbon
nanotubes (SWCNTs) were formed in a buckypaper to represent human tissue for radiation
dosimetry application. The results show promising prospects on the novel methodology used
that was applied on SWCNTs.
111
Chapter 5
5 Carbon Nanotubes Buckypaper Radiation Studies for Medical
Physics Applications
Most of the content of this chapter has been published in the journal “Applied Radiation and
Isotopes”: "Abdulaziz Alanazi et al., 2016. “Carbon Nanotubes Buckypaper Radiation
Studies for Medical Physics Applications" Volume 117, November 2016, Pages 106-110,
(Appendix D). The right to include the article in any thesis or dissertation has been obtained
during assignment of copyright with the publisher.
5.1.1 Introduction
As discussed in the review of literature (see 3.9.5) passive dosimeters with a Zeff similar to
tissue-equivalent are needed. In the following two chapters, the use of single-wall CNTs were
made use of to demonstrate their ability to perform as a passive dosimeter with Zeff similar to
soft tissue.
5.1.2 Carbon Nanotubes
Since CNTs were first reported upon by Iijima in the early 1990s (Iijima 1991), the properties
of carbon nanotubes were investigated intensively and have been considered for many
potential applications, such as chemical sensors (Kong et al., 2000, Moradi et al., 2013, Penza
et al., 2010, Wongchoosuk et al., 2010, Zhao et al., 2005), biosensors (Balasubramanian and
Burghard 2006, Koehne et al., 2004, Li et al., 2003, Timur et al., 2007, Wang 2005), field-
emission displays (Choi et al., 1999, Kuznetzov et al., 2010, Lee et al., 2001, Saito 2010,
112
Talin et al., 2001), memory storage (Ganguly et al., 2005, Lu and Dai 2006) and hydrogen
storage (Liu et al., 2010, Ranjbar et al., 2010, Yang et al., 2010). The specific structure of the
atoms forming the carbon nanotubes gives interesting physical and chemical properties such
as electric and thermo conductivity. Carbon nanotubes, CNTs, can be described as a beehive
sheet bended to form a cylinder and the two ends of the cylinder are open or can be closed
with a semicircle lid. This cylinder-like form can be shielded by other cylinders with open
ends to form a multi-wall carbon nanotubes structure (MWCNTs). Figure 34 displays single
and multi-wall carbon nanotubes with open ends. The dimensions of the structure, just
described, are of the range of nanometers. The diameters range from a few nm to 30 nm and
the length of the tubes can go up to ~ 1 µm (Iijima 1991). These dimensions can vary
depending on the method of growth and the procedure parameters (Arjmand et al., 2016,
Nihei et al., 2003, Yazyev and Pasquarello 2008).
Figure 34: The structure of Single-Wall Carbon Nanotube, SWCNT, is displayed to the left-hand side while the Multi-Wall Carbon Nanotubes structure is displayed to the right (Choudhary and Gupta 2011). Licence: http://creativecommons.org/licenses/by-nc-sa/3.0/
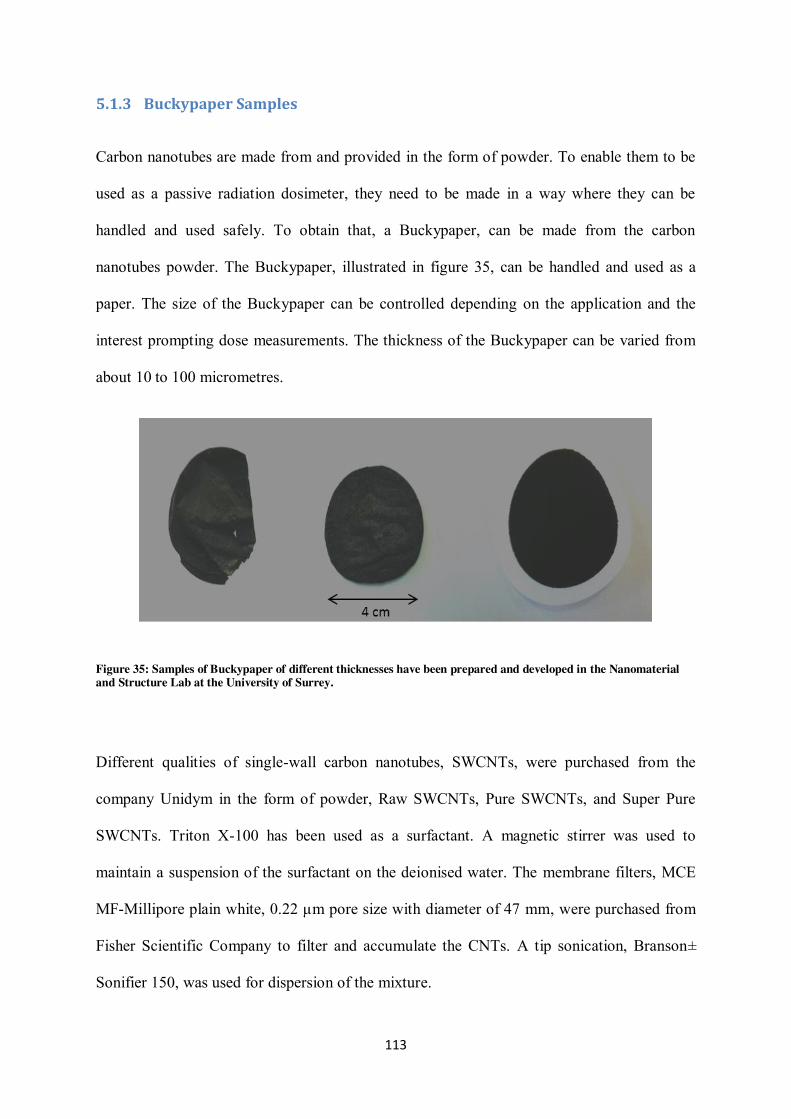
113
5.1.3 Buckypaper Samples
Carbon nanotubes are made from and provided in the form of powder. To enable them to be
used as a passive radiation dosimeter, they need to be made in a way where they can be
handled and used safely. To obtain that, a Buckypaper, can be made from the carbon
nanotubes powder. The Buckypaper, illustrated in figure 35, can be handled and used as a
paper. The size of the Buckypaper can be controlled depending on the application and the
interest prompting dose measurements. The thickness of the Buckypaper can be varied from
about 10 to 100 micrometres.
Figure 35: Samples of Buckypaper of different thicknesses have been prepared and developed in the Nanomaterial and Structure Lab at the University of Surrey.
Different qualities of single-wall carbon nanotubes, SWCNTs, were purchased from the
company Unidym in the form of powder, Raw SWCNTs, Pure SWCNTs, and Super Pure
SWCNTs. Triton X-100 has been used as a surfactant. A magnetic stirrer was used to
maintain a suspension of the surfactant on the deionised water. The membrane filters, MCE
MF-Millipore plain white, 0.22 µm pore size with diameter of 47 mm, were purchased from
Fisher Scientific Company to filter and accumulate the CNTs. A tip sonication, Branson–
Sonifier 150, was used for dispersion of the mixture.
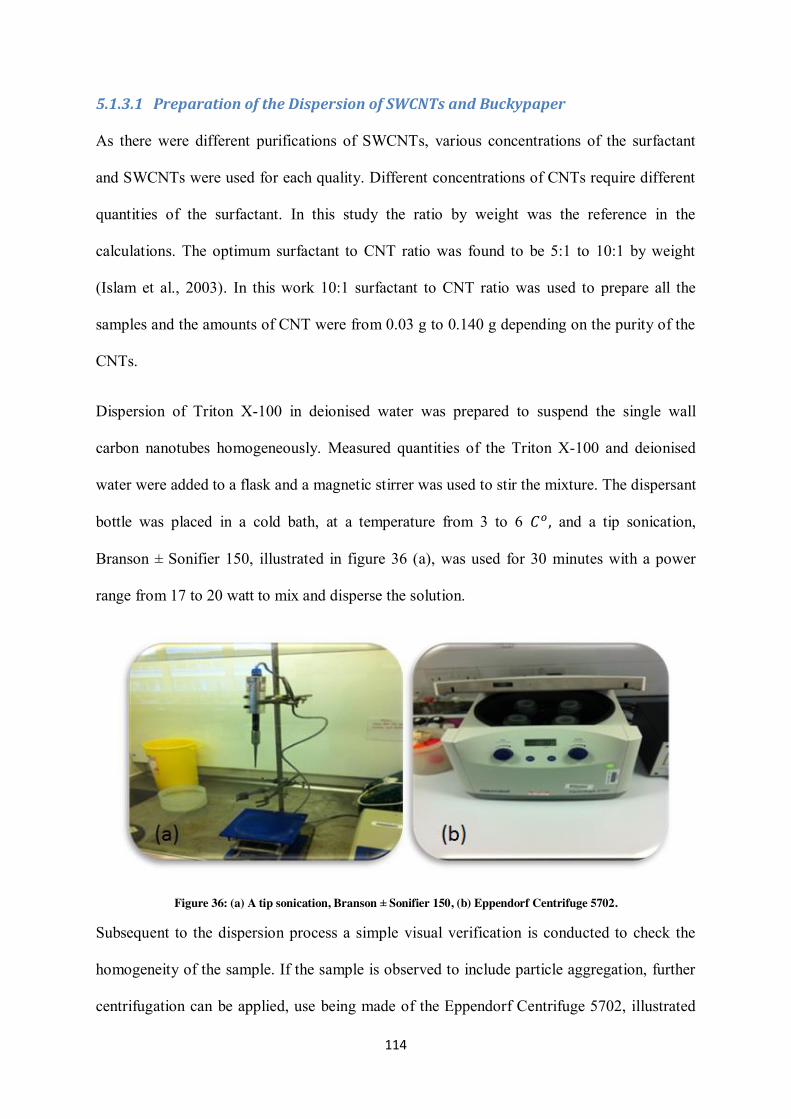
114
5.1.3.1 Preparation of the Dispersion of SWCNTs and Buckypaper
As there were different purifications of SWCNTs, various concentrations of the surfactant
and SWCNTs were used for each quality. Different concentrations of CNTs require different
quantities of the surfactant. In this study the ratio by weight was the reference in the
calculations. The optimum surfactant to CNT ratio was found to be 5:1 to 10:1 by weight
(Islam et al., 2003). In this work 10:1 surfactant to CNT ratio was used to prepare all the
samples and the amounts of CNT were from 0.03 g to 0.140 g depending on the purity of the
CNTs.
Dispersion of Triton X-100 in deionised water was prepared to suspend the single wall
carbon nanotubes homogeneously. Measured quantities of the Triton X-100 and deionised
water were added to a flask and a magnetic stirrer was used to stir the mixture. The dispersant
bottle was placed in a cold bath, at a temperature from 3 to 6 𝐶𝑜, and a tip sonication,
Branson – Sonifier 150, illustrated in figure 36 (a), was used for 30 minutes with a power
range from 17 to 20 watt to mix and disperse the solution.
Figure 36: (a) A tip sonication, Branson – Sonifier 150, (b) Eppendorf Centrifuge 5702.
Subsequent to the dispersion process a simple visual verification is conducted to check the
homogeneity of the sample. If the sample is observed to include particle aggregation, further
centrifugation can be applied, use being made of the Eppendorf Centrifuge 5702, illustrated
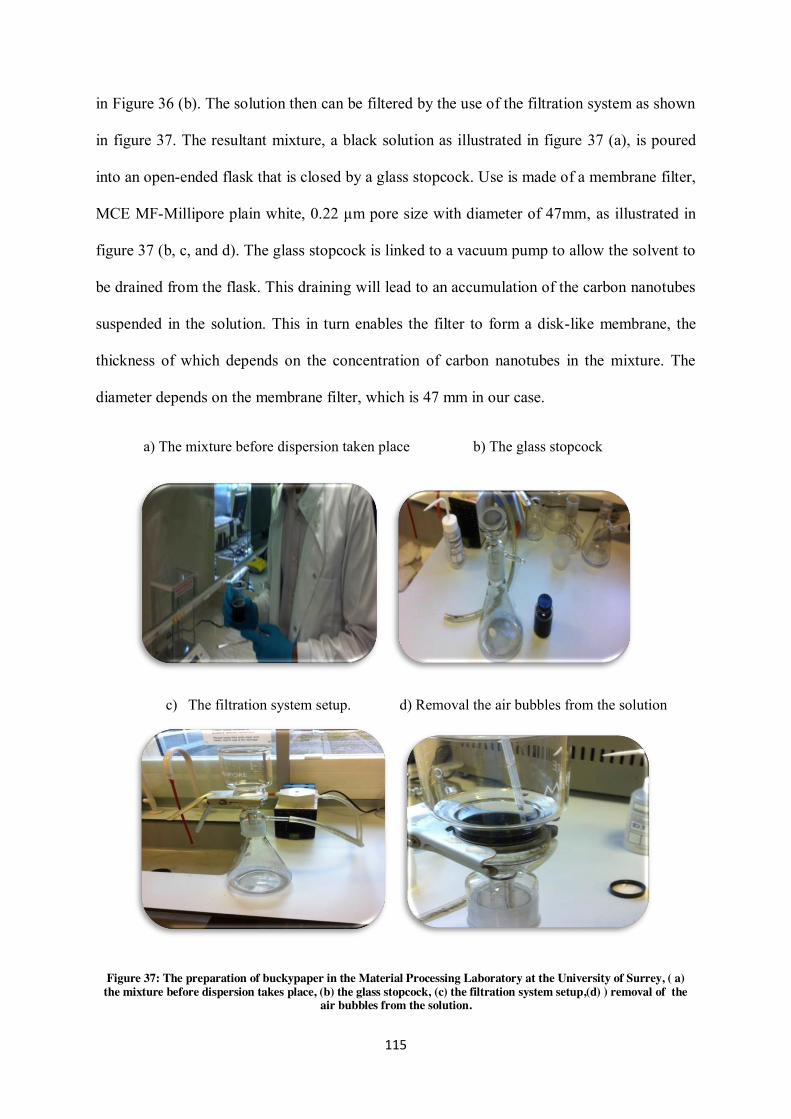
115
in Figure 36 (b). The solution then can be filtered by the use of the filtration system as shown
in figure 37. The resultant mixture, a black solution as illustrated in figure 37 (a), is poured
into an open-ended flask that is closed by a glass stopcock. Use is made of a membrane filter,
MCE MF-Millipore plain white, 0.22 µm pore size with diameter of 47mm, as illustrated in
figure 37 (b, c, and d). The glass stopcock is linked to a vacuum pump to allow the solvent to
be drained from the flask. This draining will lead to an accumulation of the carbon nanotubes
suspended in the solution. This in turn enables the filter to form a disk-like membrane, the
thickness of which depends on the concentration of carbon nanotubes in the mixture. The
diameter depends on the membrane filter, which is 47 mm in our case.
Figure 37: The preparation of buckypaper in the Material Processing Laboratory at the University of Surrey, ( a) the mixture before dispersion takes place, (b) the glass stopcock, (c) the filtration system setup,(d) ) removal of the
air bubbles from the solution.
a) The mixture before dispersion taken place b) The glass stopcock
c) The filtration system setup. d) Removal the air bubbles from the solution
116
Before the vacuum pump can be turned on, the solution needs to be cleared of any air bubbles
left in the solvent. Then the vacuum pump is turned on and the solvent takes up to several
hours to be drained from the flask depending on the concentration of CNTs in the mixture.
When all the solvent is drained, the membrane filter is removed from the system and left to
dry. After the Buckypaper is dried, the accumulated carbon nanotubes (as illustrated in figure
35) can be peeled away from the membrane filter. The buckypaper now is ready to be used
and can be cut into different sizes depending on the TLD Reader sample holder. In the
current case, the sample holder can accommodate sample sizes of 5 × 5mm or less.
5.1.4 Thermogravimetric Analysis, TGA
During thermoluminescence readout both the CNTs and Silica Fibre undergo a heat cycle. As
such a thermal stability test for the two materials is required. This can be conducted by use
of the Thermogravimetric Analysis Unit at the University of Surrey Nanomaterials and
Structures Lab. Thermogravimetric analysis (TGA) is an analytical technique that examines
the change of material mass as a function of temperature. The TGA consists of a high
precision balance that can detect mass change up to 0.1 µg. The temperature of the TGA
furnace can reach up to 2000 °C and the ramp temperature can be controlled depending on
the experiment requirement. The balance in the TGA consists of a small pan, figure 38 (b)
which after being loaded is to be placed inside the cylindrical furnace. The pan can be loaded
by a small amount of sample, about 1.0 g (Fig. 38a). The test can take a couple of hours
depending on the temperature ramp and the maximum temperature that has been chosen.
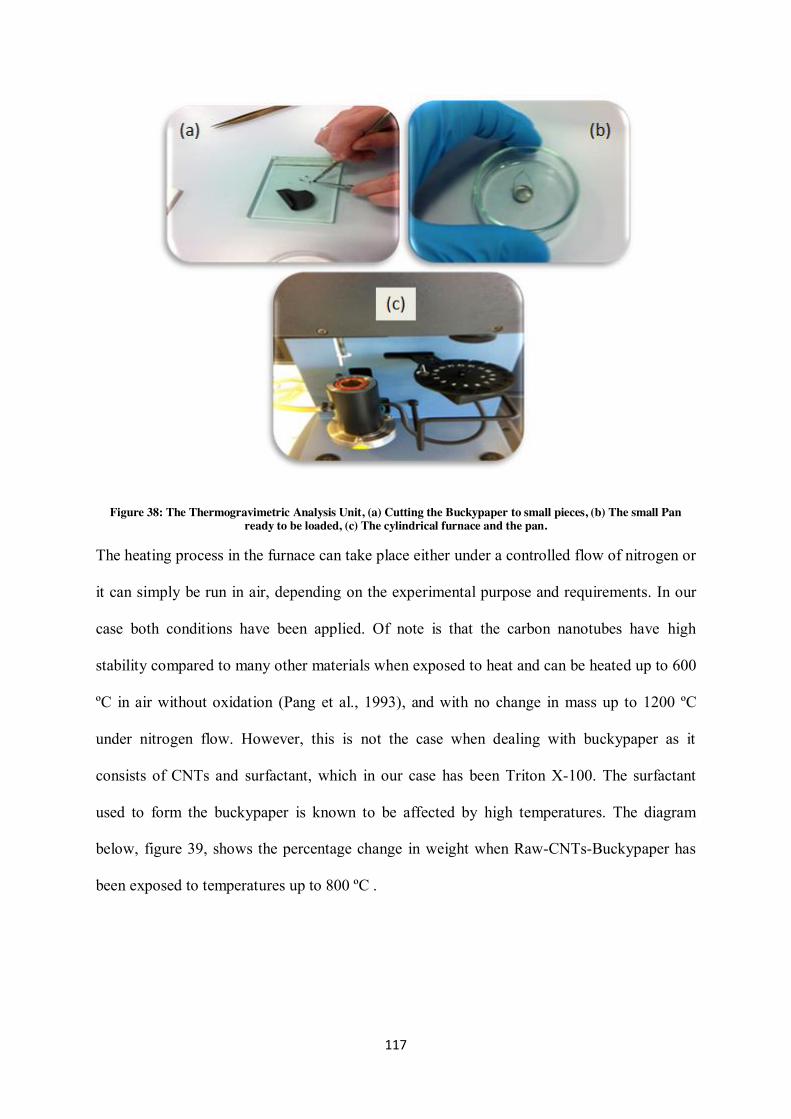
117
Figure 38: The Thermogravimetric Analysis Unit, (a) Cutting the Buckypaper to small pieces, (b) The small Pan ready to be loaded, (c) The cylindrical furnace and the pan.
The heating process in the furnace can take place either under a controlled flow of nitrogen or
it can simply be run in air, depending on the experimental purpose and requirements. In our
case both conditions have been applied. Of note is that the carbon nanotubes have high
stability compared to many other materials when exposed to heat and can be heated up to 600
ºC in air without oxidation (Pang et al., 1993), and with no change in mass up to 1200 ºC
under nitrogen flow. However, this is not the case when dealing with buckypaper as it
consists of CNTs and surfactant, which in our case has been Triton X-100. The surfactant
used to form the buckypaper is known to be affected by high temperatures. The diagram
below, figure 39, shows the percentage change in weight when Raw-CNTs-Buckypaper has
been exposed to temperatures up to 800 ºC .
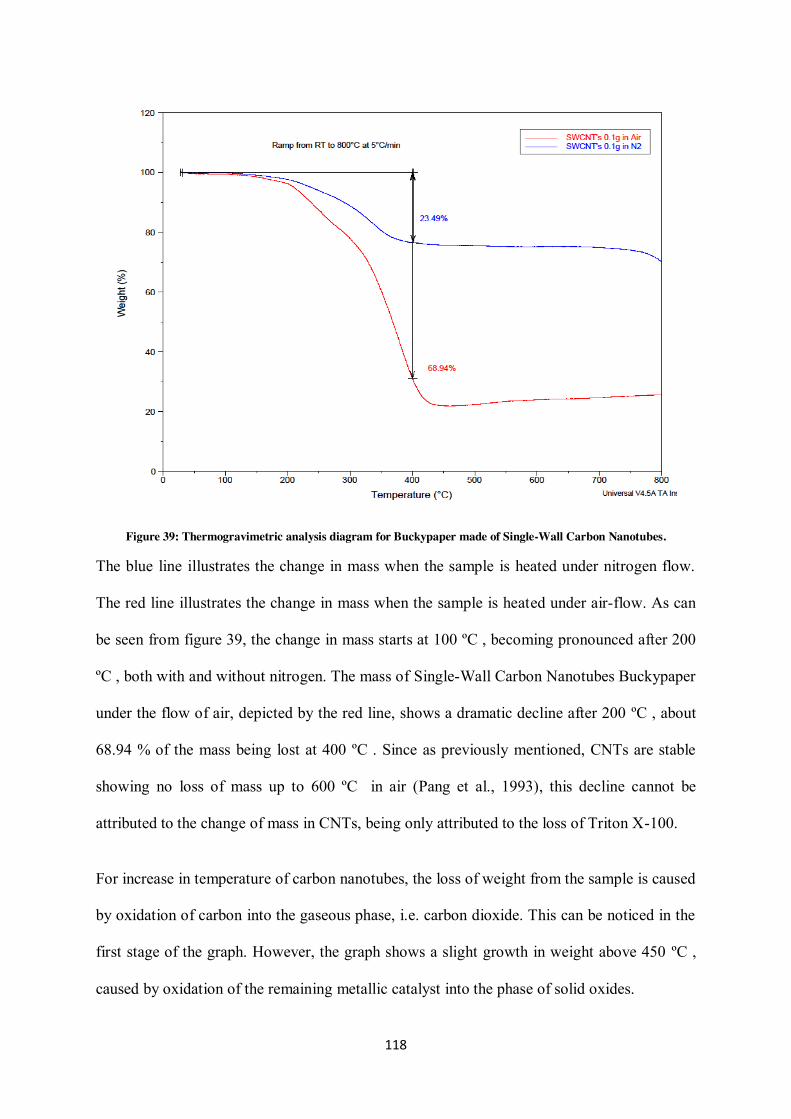
118
Figure 39: Thermogravimetric analysis diagram for Buckypaper made of Single-Wall Carbon Nanotubes.
The blue line illustrates the change in mass when the sample is heated under nitrogen flow.
The red line illustrates the change in mass when the sample is heated under air-flow. As can
be seen from figure 39, the change in mass starts at 100 ºC , becoming pronounced after 200
ºC , both with and without nitrogen. The mass of Single-Wall Carbon Nanotubes Buckypaper
under the flow of air, depicted by the red line, shows a dramatic decline after 200 ºC , about
68.94 % of the mass being lost at 400 ºC . Since as previously mentioned, CNTs are stable
showing no loss of mass up to 600 ºC in air (Pang et al., 1993), this decline cannot be
attributed to the change of mass in CNTs, being only attributed to the loss of Triton X-100.
For increase in temperature of carbon nanotubes, the loss of weight from the sample is caused
by oxidation of carbon into the gaseous phase, i.e. carbon dioxide. This can be noticed in the
first stage of the graph. However, the graph shows a slight growth in weight above 450 ºC ,
caused by oxidation of the remaining metallic catalyst into the phase of solid oxides.
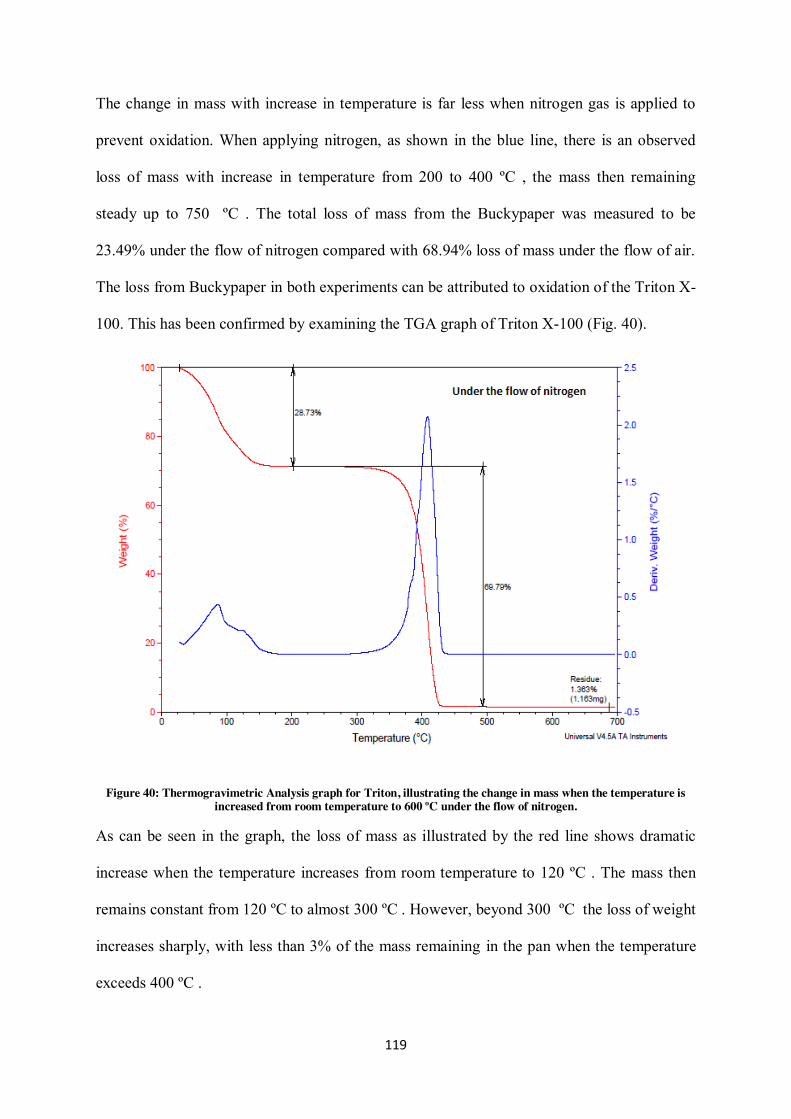
119
The change in mass with increase in temperature is far less when nitrogen gas is applied to
prevent oxidation. When applying nitrogen, as shown in the blue line, there is an observed
loss of mass with increase in temperature from 200 to 400 ºC , the mass then remaining
steady up to 750 ºC . The total loss of mass from the Buckypaper was measured to be
23.49% under the flow of nitrogen compared with 68.94% loss of mass under the flow of air.
The loss from Buckypaper in both experiments can be attributed to oxidation of the Triton X-
100. This has been confirmed by examining the TGA graph of Triton X-100 (Fig. 40).
Figure 40: Thermogravimetric Analysis graph for Triton, illustrating the change in mass when the temperature is increased from room temperature to 600 ºC under the flow of nitrogen.
As can be seen in the graph, the loss of mass as illustrated by the red line shows dramatic
increase when the temperature increases from room temperature to 120 ºC . The mass then
remains constant from 120 ºC to almost 300 ºC . However, beyond 300 ºC the loss of weight
increases sharply, with less than 3% of the mass remaining in the pan when the temperature
exceeds 400 ºC .
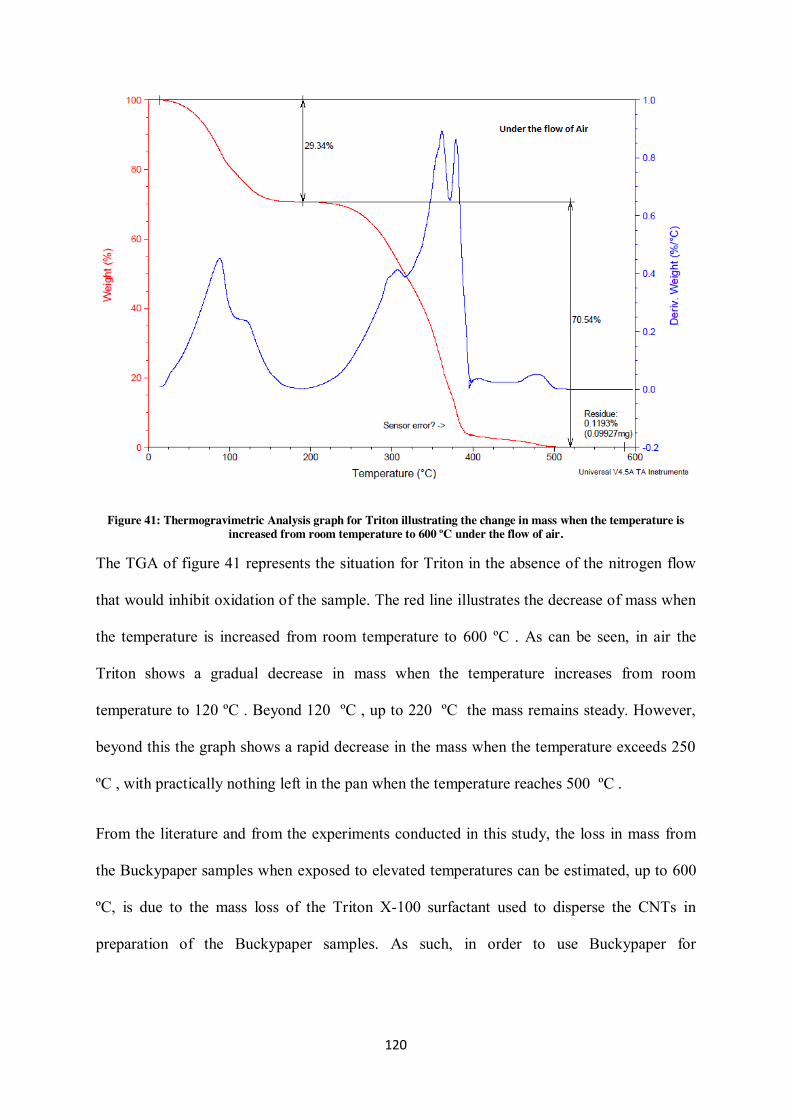
120
Figure 41: Thermogravimetric Analysis graph for Triton illustrating the change in mass when the temperature is increased from room temperature to 600 ºC under the flow of air.
The TGA of figure 41 represents the situation for Triton in the absence of the nitrogen flow
that would inhibit oxidation of the sample. The red line illustrates the decrease of mass when
the temperature is increased from room temperature to 600 ºC . As can be seen, in air the
Triton shows a gradual decrease in mass when the temperature increases from room
temperature to 120 ºC . Beyond 120 ºC , up to 220 ºC the mass remains steady. However,
beyond this the graph shows a rapid decrease in the mass when the temperature exceeds 250
ºC , with practically nothing left in the pan when the temperature reaches 500 ºC .
From the literature and from the experiments conducted in this study, the loss in mass from
the Buckypaper samples when exposed to elevated temperatures can be estimated, up to 600
ºC, is due to the mass loss of the Triton X-100 surfactant used to disperse the CNTs in
preparation of the Buckypaper samples. As such, in order to use Buckypaper for
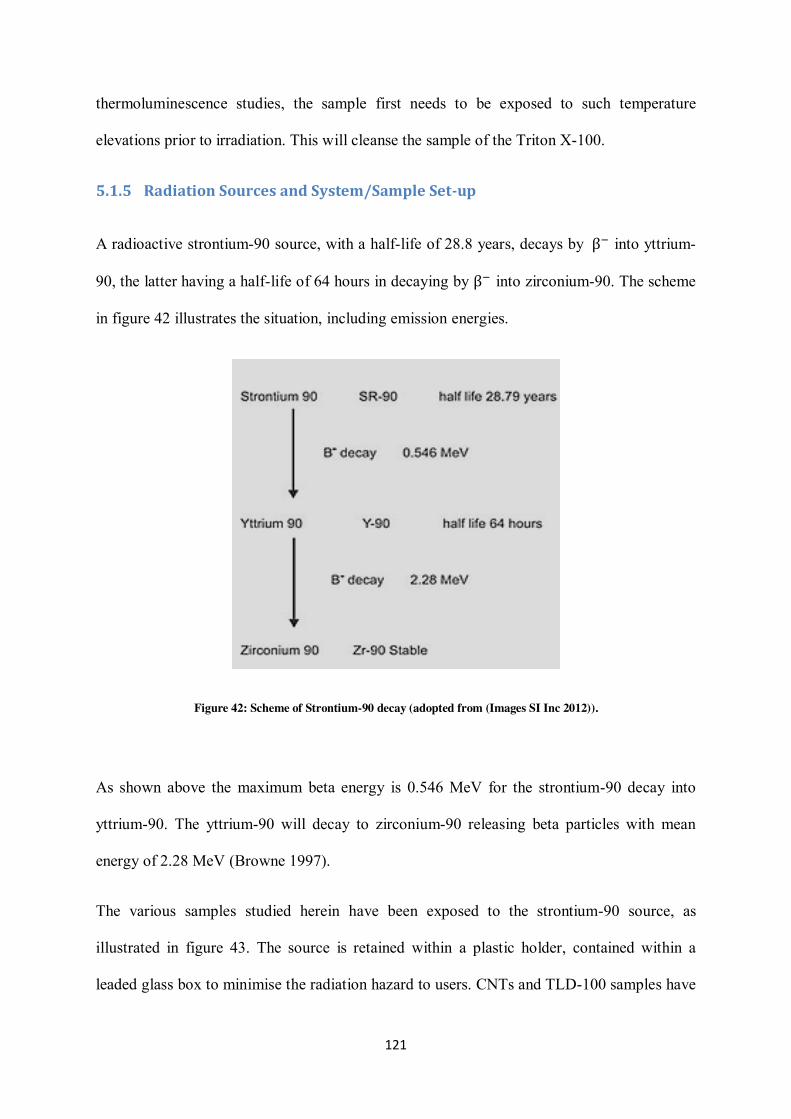
121
thermoluminescence studies, the sample first needs to be exposed to such temperature
elevations prior to irradiation. This will cleanse the sample of the Triton X-100.
5.1.5 Radiation Sources and System/Sample Set-up
A radioactive strontium-90 source, with a half-life of 28.8 years, decays by β− into yttrium-
90, the latter having a half-life of 64 hours in decaying by β− into zirconium-90. The scheme
in figure 42 illustrates the situation, including emission energies.
Figure 42: Scheme of Strontium-90 decay (adopted from (Images SI Inc 2012)).
As shown above the maximum beta energy is 0.546 MeV for the strontium-90 decay into
yttrium-90. The yttrium-90 will decay to zirconium-90 releasing beta particles with mean
energy of 2.28 MeV (Browne 1997).
The various samples studied herein have been exposed to the strontium-90 source, as
illustrated in figure 43. The source is retained within a plastic holder, contained within a
leaded glass box to minimise the radiation hazard to users. CNTs and TLD-100 samples have
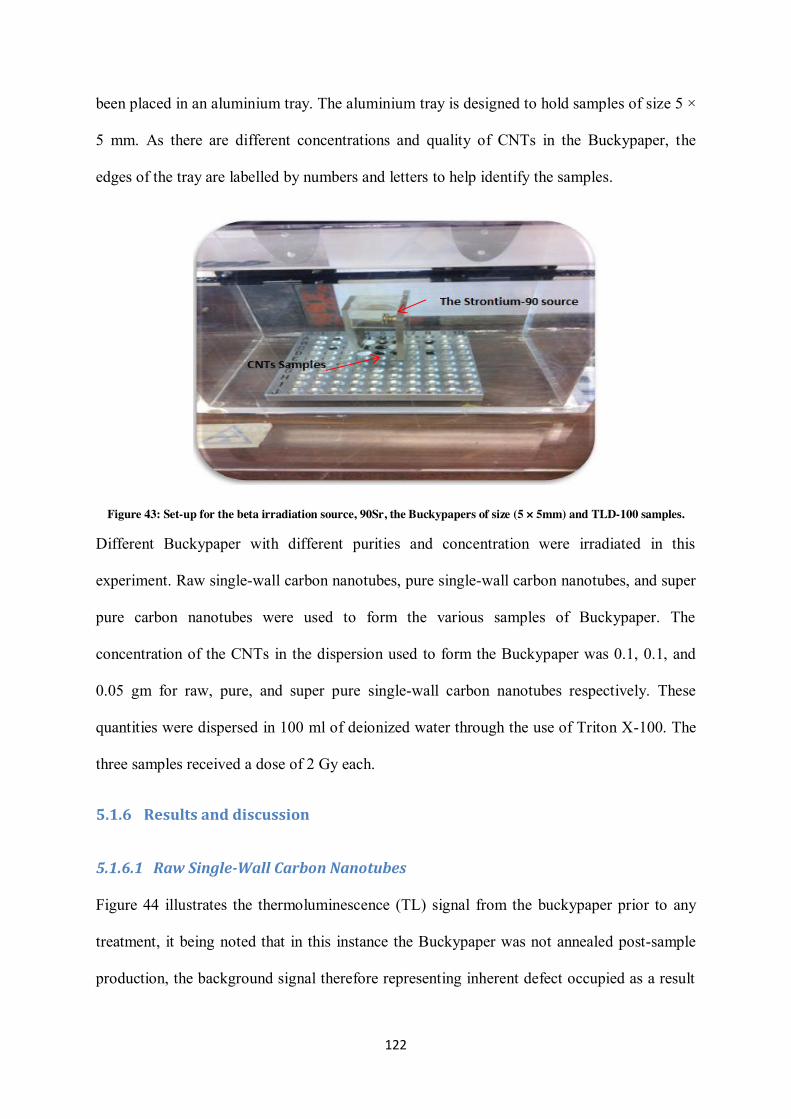
122
been placed in an aluminium tray. The aluminium tray is designed to hold samples of size 5 ×
5 mm. As there are different concentrations and quality of CNTs in the Buckypaper, the
edges of the tray are labelled by numbers and letters to help identify the samples.
Figure 43: Set-up for the beta irradiation source, 90Sr, the Buckypapers of size (5 × 5mm) and TLD-100 samples.
Different Buckypaper with different purities and concentration were irradiated in this
experiment. Raw single-wall carbon nanotubes, pure single-wall carbon nanotubes, and super
pure carbon nanotubes were used to form the various samples of Buckypaper. The
concentration of the CNTs in the dispersion used to form the Buckypaper was 0.1, 0.1, and
0.05 gm for raw, pure, and super pure single-wall carbon nanotubes respectively. These
quantities were dispersed in 100 ml of deionized water through the use of Triton X-100. The
three samples received a dose of 2 Gy each.
5.1.6 Results and discussion
5.1.6.1 Raw Single-Wall Carbon Nanotubes
Figure 44 illustrates the thermoluminescence (TL) signal from the buckypaper prior to any
treatment, it being noted that in this instance the Buckypaper was not annealed post-sample
production, the background signal therefore representing inherent defect occupied as a result
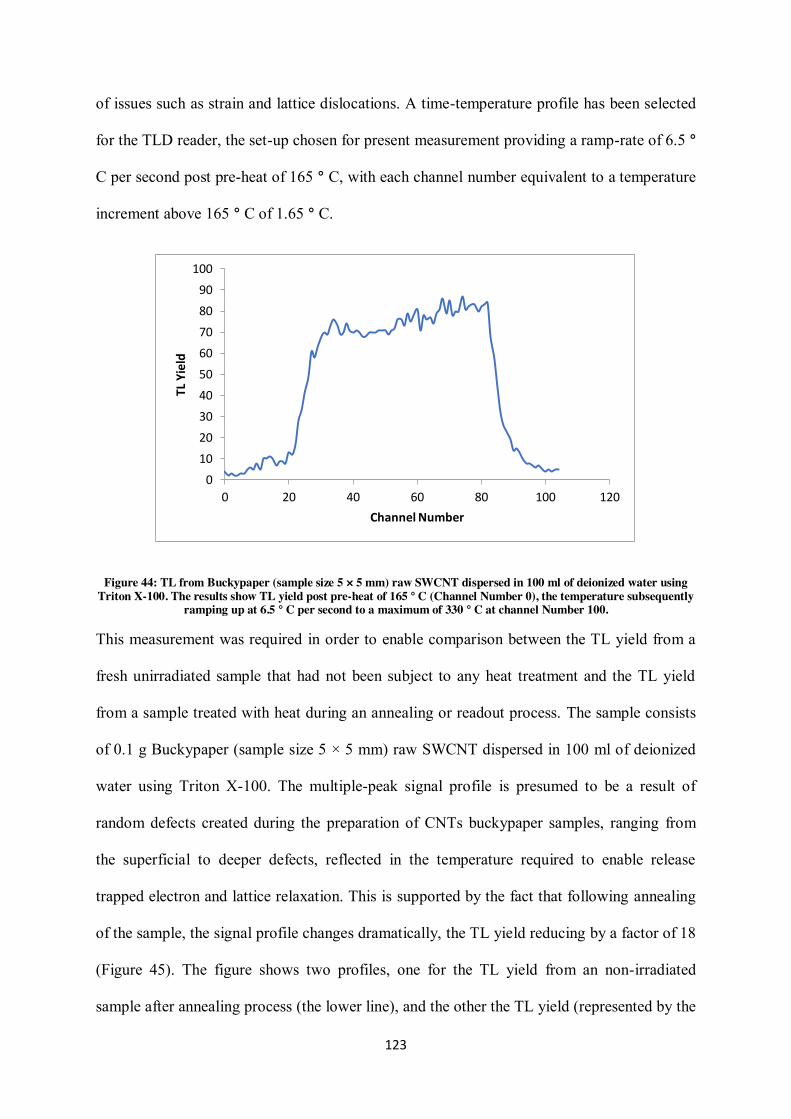
123
of issues such as strain and lattice dislocations. A time-temperature profile has been selected
for the TLD reader, the set-up chosen for present measurement providing a ramp-rate of 6.5 °
C per second post pre-heat of 165 ° C, with each channel number equivalent to a temperature
increment above 165 ° C of 1.65 ° C.
Figure 44: TL from Buckypaper (sample size 5 × 5 mm) raw SWCNT dispersed in 100 ml of deionized water using Triton X-100. The results show TL yield post pre-heat of 165 ° C (Channel Number 0), the temperature subsequently
ramping up at 6.5 ° C per second to a maximum of 330 ° C at channel Number 100.
This measurement was required in order to enable comparison between the TL yield from a
fresh unirradiated sample that had not been subject to any heat treatment and the TL yield
from a sample treated with heat during an annealing or readout process. The sample consists
of 0.1 g Buckypaper (sample size 5 × 5 mm) raw SWCNT dispersed in 100 ml of deionized
water using Triton X-100. The multiple-peak signal profile is presumed to be a result of
random defects created during the preparation of CNTs buckypaper samples, ranging from
the superficial to deeper defects, reflected in the temperature required to enable release
trapped electron and lattice relaxation. This is supported by the fact that following annealing
of the sample, the signal profile changes dramatically, the TL yield reducing by a factor of 18
(Figure 45). The figure shows two profiles, one for the TL yield from an non-irradiated
sample after annealing process (the lower line), and the other the TL yield (represented by the
0
10
20
30
40
50
60
70
80
90
100
0 20 40 60 80 100 120
TL Y
ield
Channel Number
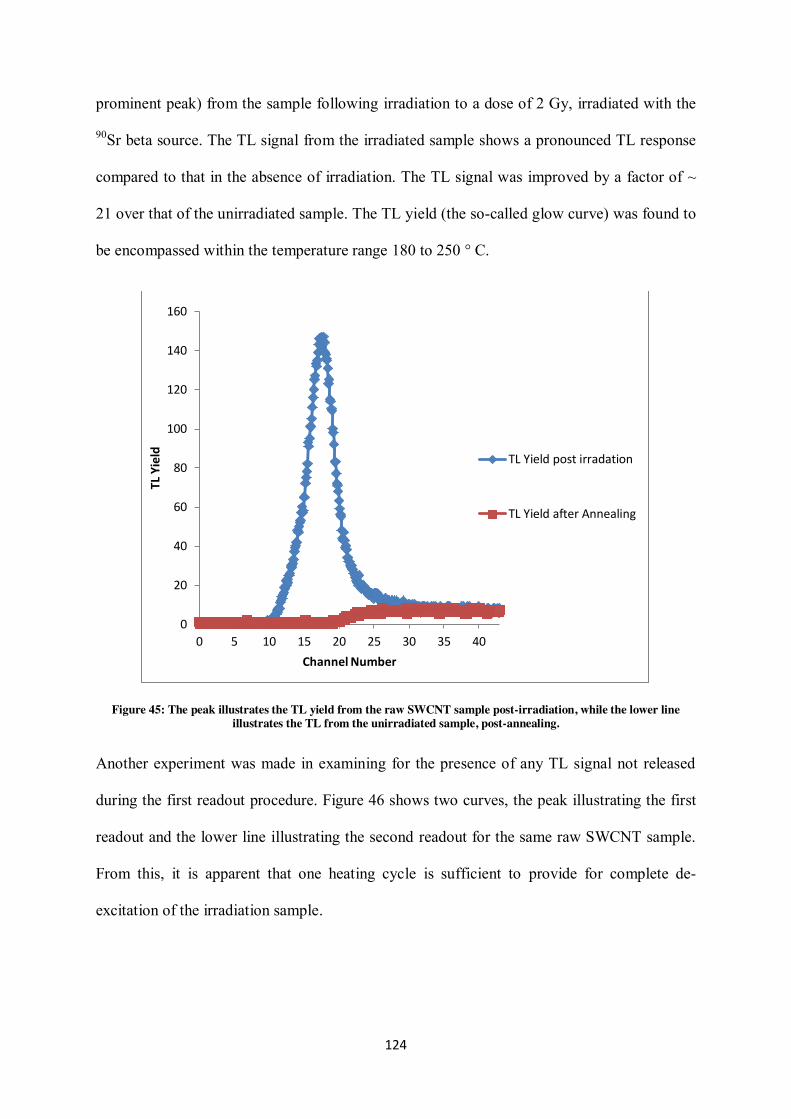
124
prominent peak) from the sample following irradiation to a dose of 2 Gy, irradiated with the
90Sr beta source. The TL signal from the irradiated sample shows a pronounced TL response
compared to that in the absence of irradiation. The TL signal was improved by a factor of ~
21 over that of the unirradiated sample. The TL yield (the so-called glow curve) was found to
be encompassed within the temperature range 180 to 250 ° C.
Figure 45: The peak illustrates the TL yield from the raw SWCNT sample post-irradiation, while the lower line illustrates the TL from the unirradiated sample, post-annealing.
Another experiment was made in examining for the presence of any TL signal not released
during the first readout procedure. Figure 46 shows two curves, the peak illustrating the first
readout and the lower line illustrating the second readout for the same raw SWCNT sample.
From this, it is apparent that one heating cycle is sufficient to provide for complete de-
excitation of the irradiation sample.
0
20
40
60
80
100
120
140
160
0 5 10 15 20 25 30 35 40
TL Y
ield
Channel Number
TL Yield post irradation
TL Yield after Annealing
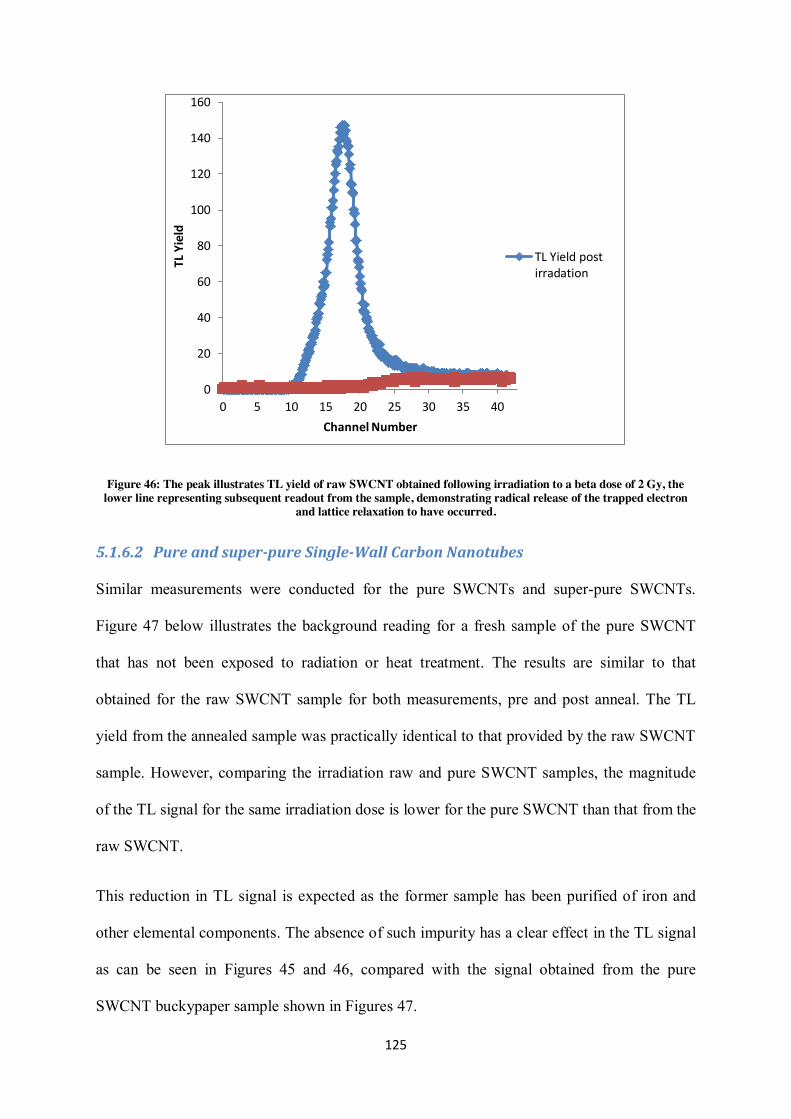
125
Figure 46: The peak illustrates TL yield of raw SWCNT obtained following irradiation to a beta dose of 2 Gy, the lower line representing subsequent readout from the sample, demonstrating radical release of the trapped electron
and lattice relaxation to have occurred.
5.1.6.2 Pure and super-pure Single-Wall Carbon Nanotubes
Similar measurements were conducted for the pure SWCNTs and super-pure SWCNTs.
Figure 47 below illustrates the background reading for a fresh sample of the pure SWCNT
that has not been exposed to radiation or heat treatment. The results are similar to that
obtained for the raw SWCNT sample for both measurements, pre and post anneal. The TL
yield from the annealed sample was practically identical to that provided by the raw SWCNT
sample. However, comparing the irradiation raw and pure SWCNT samples, the magnitude
of the TL signal for the same irradiation dose is lower for the pure SWCNT than that from the
raw SWCNT.
This reduction in TL signal is expected as the former sample has been purified of iron and
other elemental components. The absence of such impurity has a clear effect in the TL signal
as can be seen in Figures 45 and 46, compared with the signal obtained from the pure
SWCNT buckypaper sample shown in Figures 47.
0
20
40
60
80
100
120
140
160
0 5 10 15 20 25 30 35 40
TL Y
ield
Channel Number
TL Yield postirradation
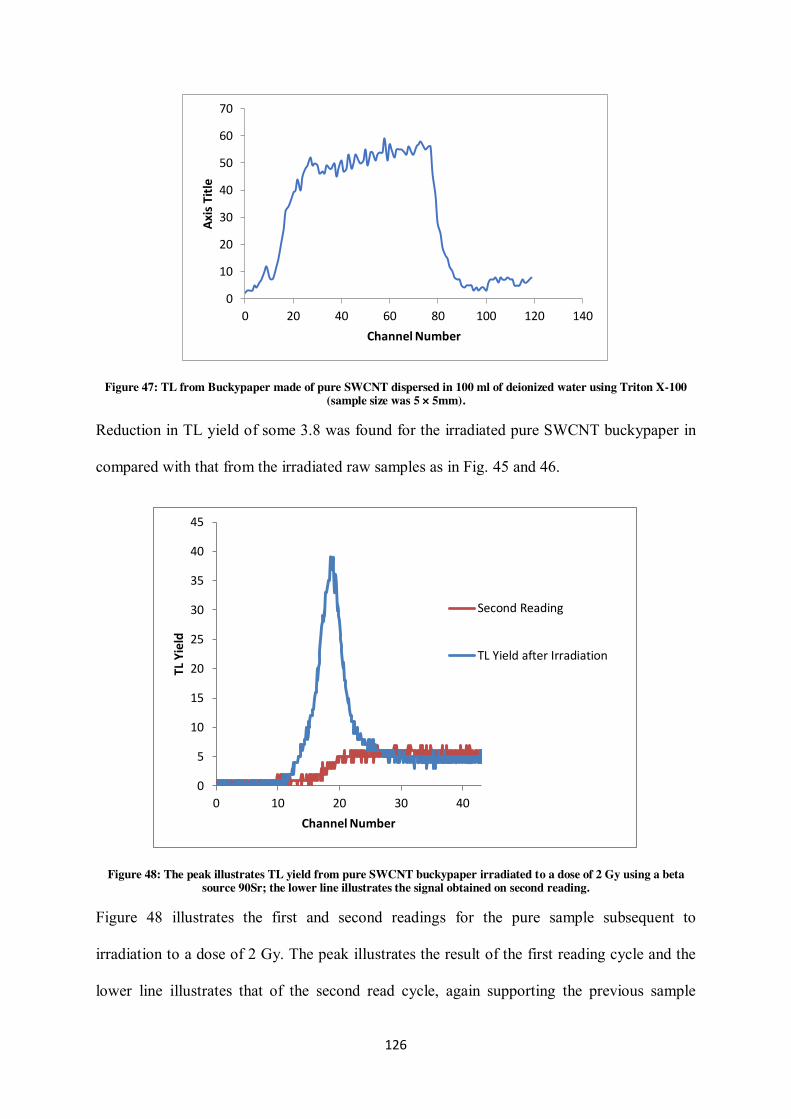
126
Figure 47: TL from Buckypaper made of pure SWCNT dispersed in 100 ml of deionized water using Triton X-100 (sample size was 5 × 5mm).
Reduction in TL yield of some 3.8 was found for the irradiated pure SWCNT buckypaper in
compared with that from the irradiated raw samples as in Fig. 45 and 46.
Figure 48: The peak illustrates TL yield from pure SWCNT buckypaper irradiated to a dose of 2 Gy using a beta source 90Sr; the lower line illustrates the signal obtained on second reading.
Figure 48 illustrates the first and second readings for the pure sample subsequent to
irradiation to a dose of 2 Gy. The peak illustrates the result of the first reading cycle and the
lower line illustrates that of the second read cycle, again supporting the previous sample
0
10
20
30
40
50
60
70
0 20 40 60 80 100 120 140
Axi
s Ti
tle
Channel Number
0
5
10
15
20
25
30
35
40
45
0 10 20 30 40
TL Y
ield
Channel Number
Second Reading
TL Yield after Irradiation
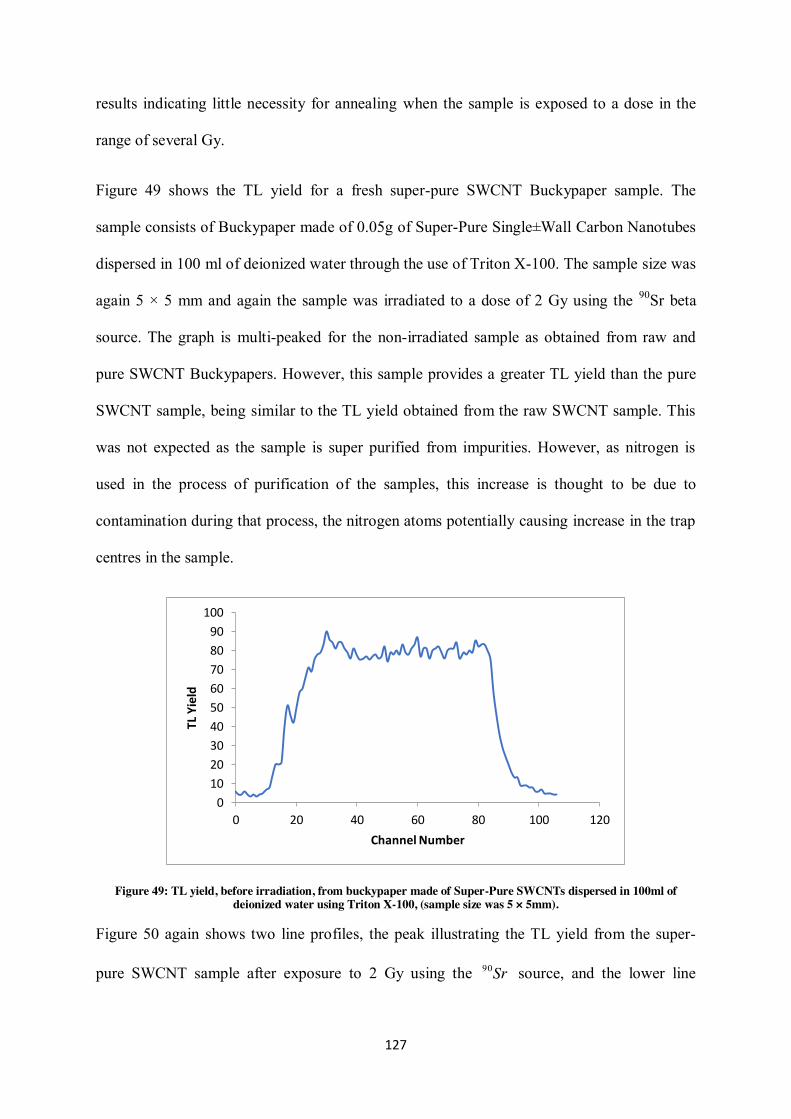
127
results indicating little necessity for annealing when the sample is exposed to a dose in the
range of several Gy.
Figure 49 shows the TL yield for a fresh super-pure SWCNT Buckypaper sample. The
sample consists of Buckypaper made of 0.05g of Super-Pure Single–Wall Carbon Nanotubes
dispersed in 100 ml of deionized water through the use of Triton X-100. The sample size was
again 5 × 5 mm and again the sample was irradiated to a dose of 2 Gy using the 90Sr beta
source. The graph is multi-peaked for the non-irradiated sample as obtained from raw and
pure SWCNT Buckypapers. However, this sample provides a greater TL yield than the pure
SWCNT sample, being similar to the TL yield obtained from the raw SWCNT sample. This
was not expected as the sample is super purified from impurities. However, as nitrogen is
used in the process of purification of the samples, this increase is thought to be due to
contamination during that process, the nitrogen atoms potentially causing increase in the trap
centres in the sample.
Figure 49: TL yield, before irradiation, from buckypaper made of Super-Pure SWCNTs dispersed in 100ml of deionized water using Triton X-100, (sample size was 5 × 5mm).
Figure 50 again shows two line profiles, the peak illustrating the TL yield from the super-
pure SWCNT sample after exposure to 2 Gy using the Sr90 source, and the lower line
0
10
20
30
40
50
60
70
80
90
100
0 20 40 60 80 100 120
TL Y
ield
Channel Number
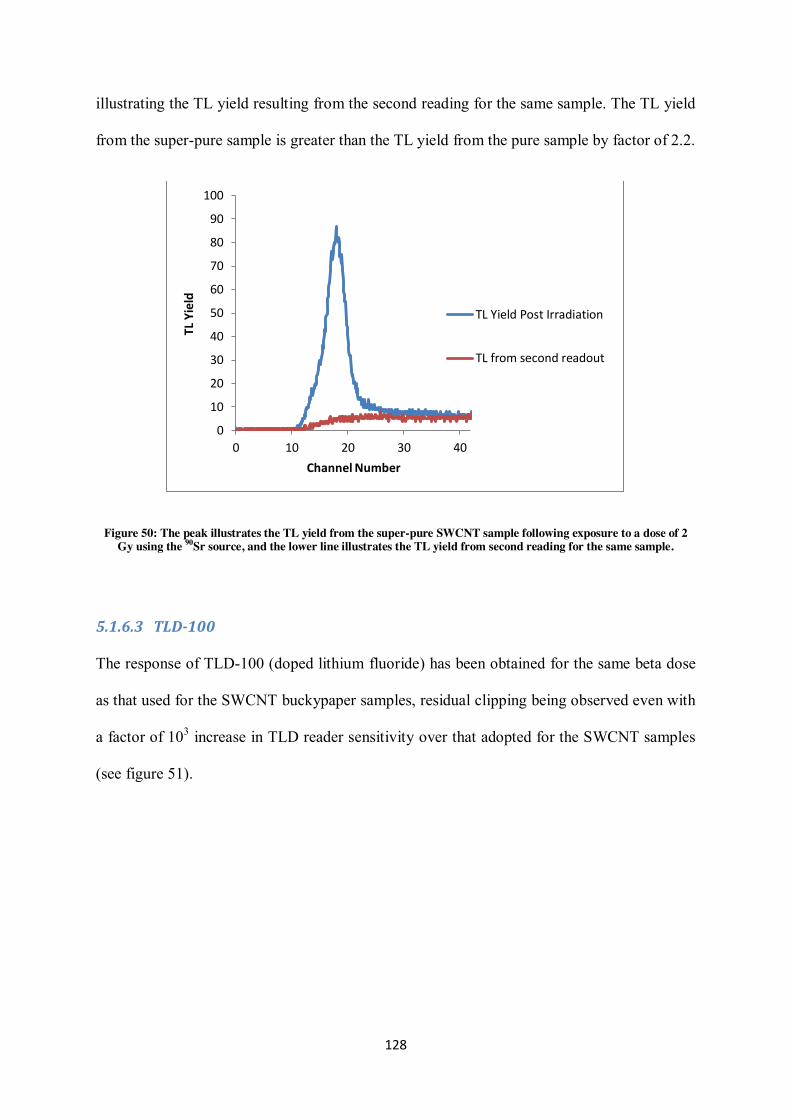
128
illustrating the TL yield resulting from the second reading for the same sample. The TL yield
from the super-pure sample is greater than the TL yield from the pure sample by factor of 2.2.
Figure 50: The peak illustrates the TL yield from the super-pure SWCNT sample following exposure to a dose of 2 Gy using the 90Sr source, and the lower line illustrates the TL yield from second reading for the same sample.
5.1.6.3 TLD-100
The response of TLD-100 (doped lithium fluoride) has been obtained for the same beta dose
as that used for the SWCNT buckypaper samples, residual clipping being observed even with
a factor of 103 increase in TLD reader sensitivity over that adopted for the SWCNT samples
(see figure 51).
0
10
20
30
40
50
60
70
80
90
100
0 10 20 30 40
TL Y
ield
Channel Number
TL Yield Post Irradiation
TL from second readout
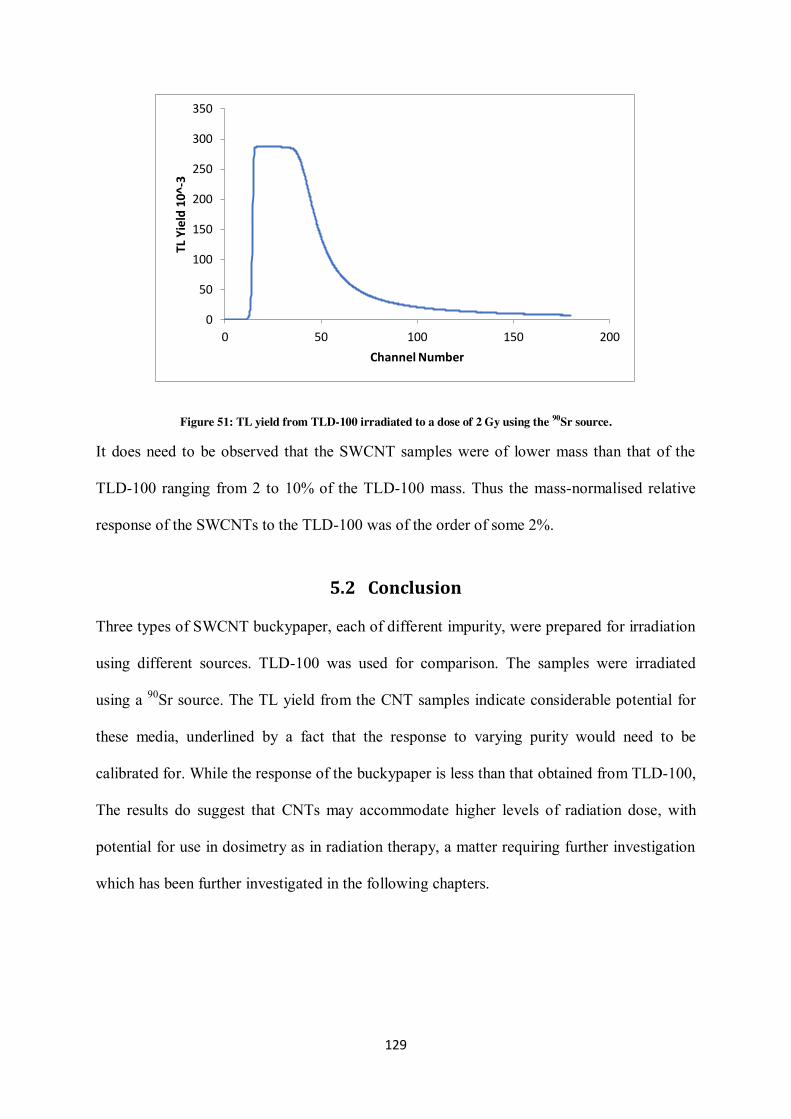
129
Figure 51: TL yield from TLD-100 irradiated to a dose of 2 Gy using the 90Sr source.
It does need to be observed that the SWCNT samples were of lower mass than that of the
TLD-100 ranging from 2 to 10% of the TLD-100 mass. Thus the mass-normalised relative
response of the SWCNTs to the TLD-100 was of the order of some 2%.
5.2 Conclusion
Three types of SWCNT buckypaper, each of different impurity, were prepared for irradiation
using different sources. TLD-100 was used for comparison. The samples were irradiated
using a 90Sr source. The TL yield from the CNT samples indicate considerable potential for
these media, underlined by a fact that the response to varying purity would need to be
calibrated for. While the response of the buckypaper is less than that obtained from TLD-100,
The results do suggest that CNTs may accommodate higher levels of radiation dose, with
potential for use in dosimetry as in radiation therapy, a matter requiring further investigation
which has been further investigated in the following chapters.
0
50
100
150
200
250
300
350
0 50 100 150 200
TL Y
ield
10^
-3
Channel Number
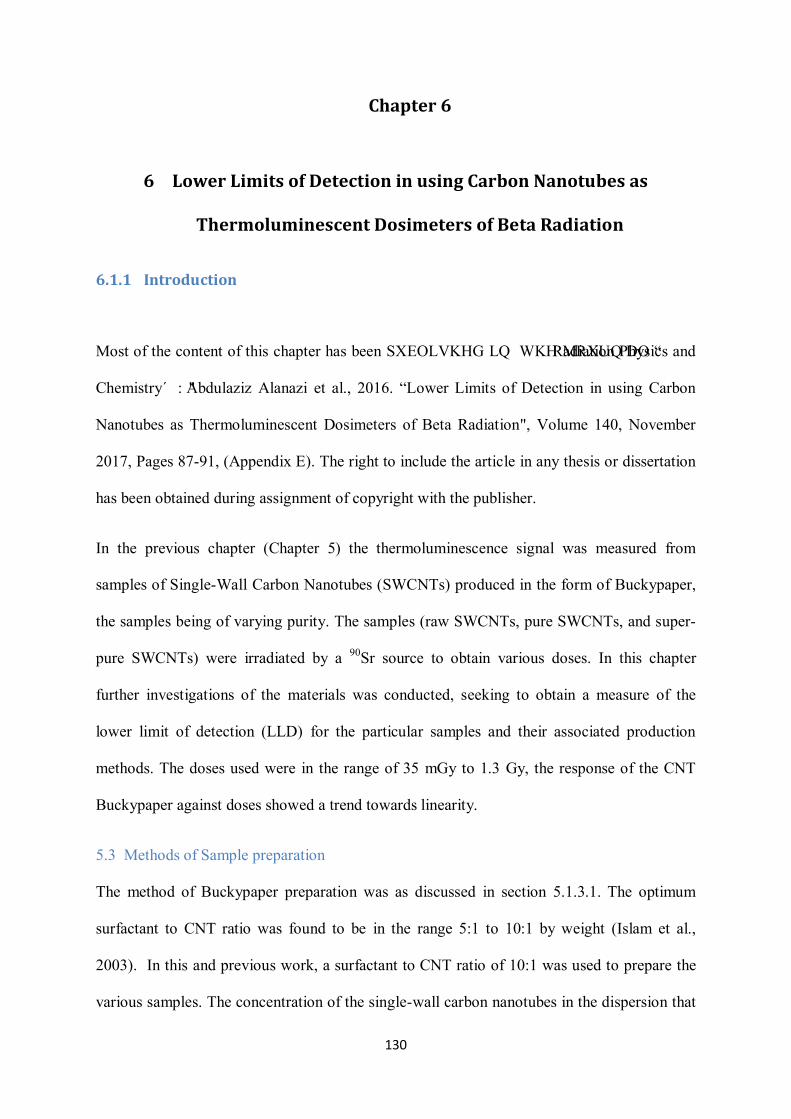
130
Chapter 6
6 Lower Limits of Detection in using Carbon Nanotubes as
Thermoluminescent Dosimeters of Beta Radiation
6.1.1 Introduction
Most of the content of this chapter has been published in the journal “Radiation Physics and
Chemistry”: "Abdulaziz Alanazi et al., 2016. “Lower Limits of Detection in using Carbon
Nanotubes as Thermoluminescent Dosimeters of Beta Radiation", Volume 140, November
2017, Pages 87-91, (Appendix E). The right to include the article in any thesis or dissertation
has been obtained during assignment of copyright with the publisher.
In the previous chapter (Chapter 5) the thermoluminescence signal was measured from
samples of Single-Wall Carbon Nanotubes (SWCNTs) produced in the form of Buckypaper,
the samples being of varying purity. The samples (raw SWCNTs, pure SWCNTs, and super-
pure SWCNTs) were irradiated by a 90Sr source to obtain various doses. In this chapter
further investigations of the materials was conducted, seeking to obtain a measure of the
lower limit of detection (LLD) for the particular samples and their associated production
methods. The doses used were in the range of 35 mGy to 1.3 Gy, the response of the CNT
Buckypaper against doses showed a trend towards linearity.
5.3 Methods of Sample preparation The method of Buckypaper preparation was as discussed in section 5.1.3.1. The optimum
surfactant to CNT ratio was found to be in the range 5:1 to 10:1 by weight (Islam et al.,
2003). In this and previous work, a surfactant to CNT ratio of 10:1 was used to prepare the
various samples. The concentration of the single-wall carbon nanotubes in the dispersion that
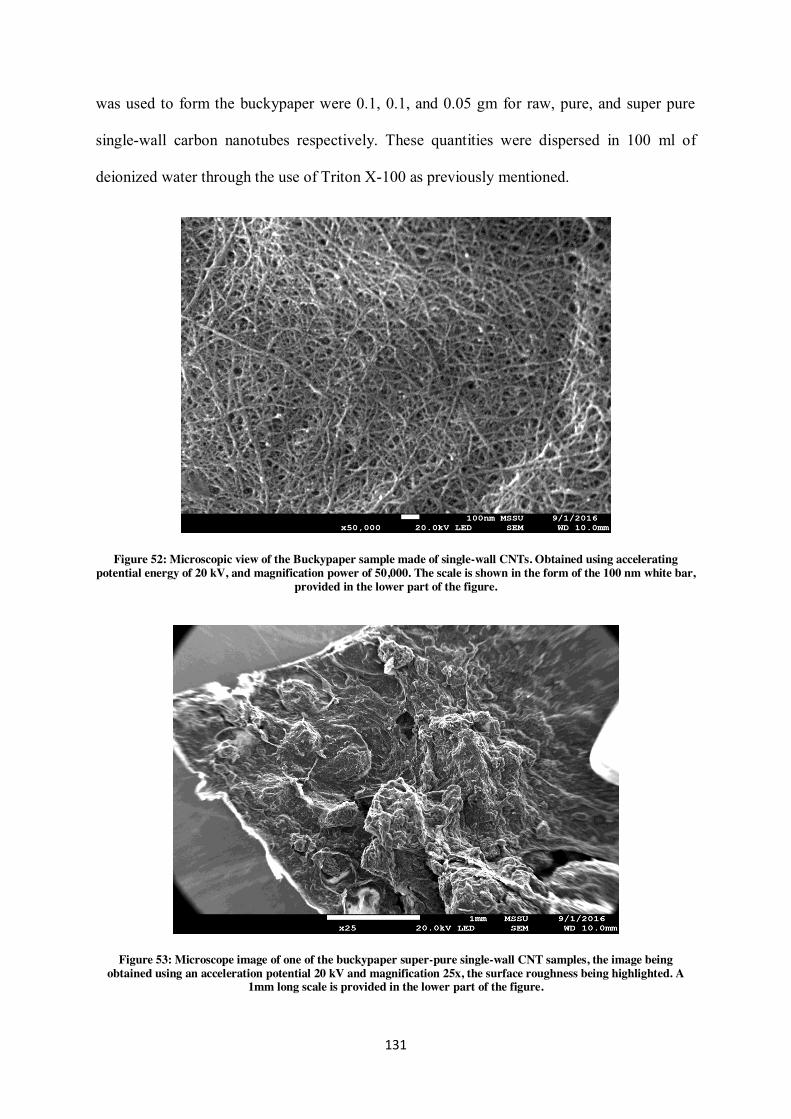
131
was used to form the buckypaper were 0.1, 0.1, and 0.05 gm for raw, pure, and super pure
single-wall carbon nanotubes respectively. These quantities were dispersed in 100 ml of
deionized water through the use of Triton X-100 as previously mentioned.
Figure 52: Microscopic view of the Buckypaper sample made of single-wall CNTs. Obtained using accelerating potential energy of 20 kV, and magnification power of 50,000. The scale is shown in the form of the 100 nm white bar,
provided in the lower part of the figure.
Figure 53: Microscope image of one of the buckypaper super-pure single-wall CNT samples, the image being obtained using an acceleration potential 20 kV and magnification 25x, the surface roughness being highlighted. A
1mm long scale is provided in the lower part of the figure.
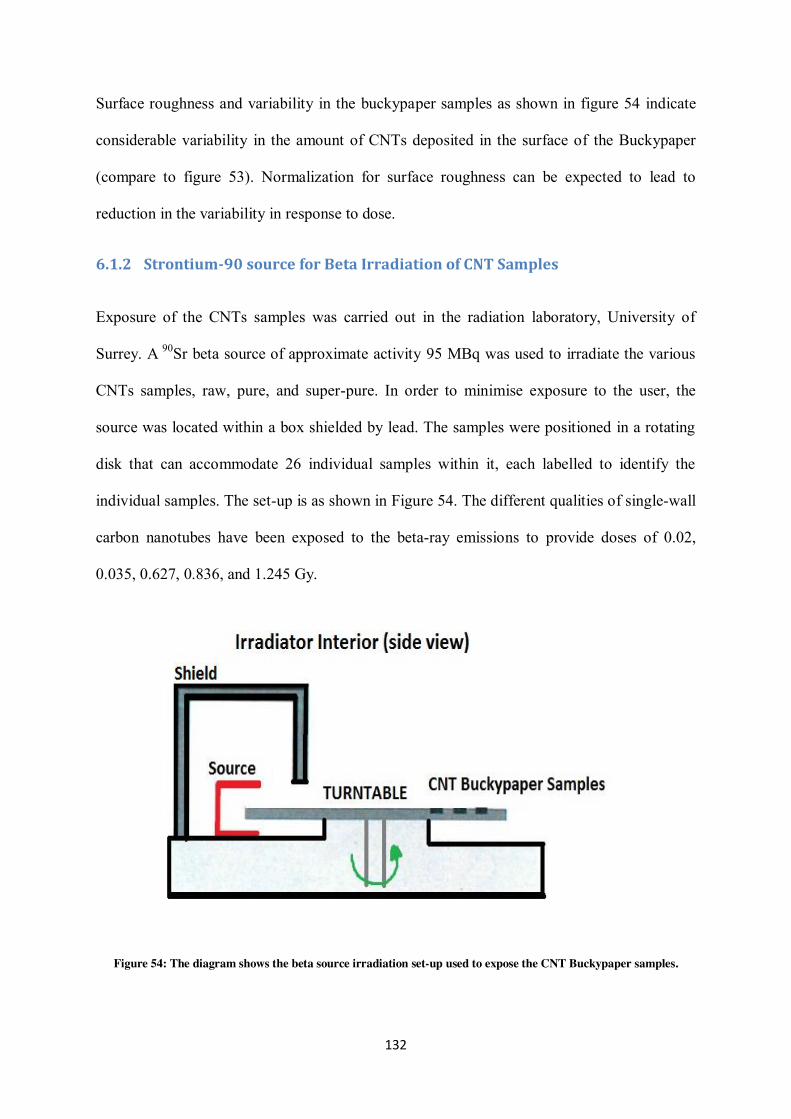
132
Surface roughness and variability in the buckypaper samples as shown in figure 54 indicate
considerable variability in the amount of CNTs deposited in the surface of the Buckypaper
(compare to figure 53). Normalization for surface roughness can be expected to lead to
reduction in the variability in response to dose.
6.1.2 Strontium-90 source for Beta Irradiation of CNT Samples
Exposure of the CNTs samples was carried out in the radiation laboratory, University of
Surrey. A 90Sr beta source of approximate activity 95 MBq was used to irradiate the various
CNTs samples, raw, pure, and super-pure. In order to minimise exposure to the user, the
source was located within a box shielded by lead. The samples were positioned in a rotating
disk that can accommodate 26 individual samples within it, each labelled to identify the
individual samples. The set-up is as shown in Figure 54. The different qualities of single-wall
carbon nanotubes have been exposed to the beta-ray emissions to provide doses of 0.02,
0.035, 0.627, 0.836, and 1.245 Gy.
Figure 54: The diagram shows the beta source irradiation set-up used to expose the CNT Buckypaper samples.
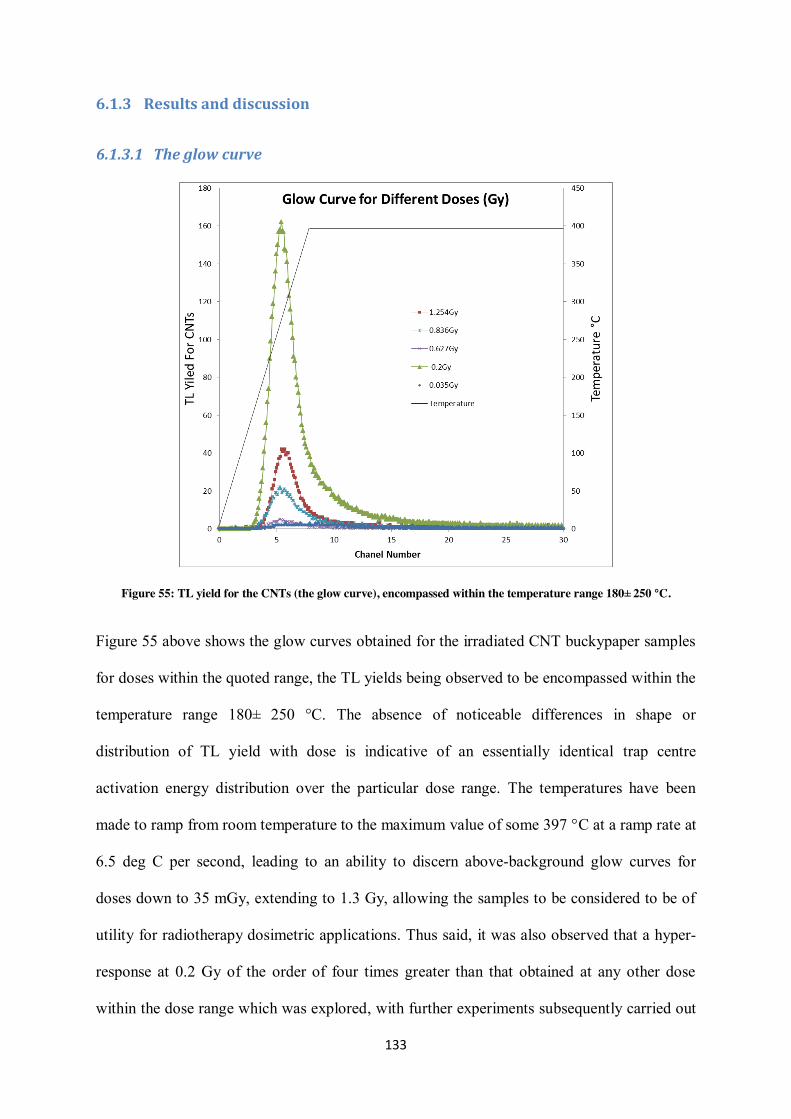
133
6.1.3 Results and discussion
6.1.3.1 The glow curve
Figure 55: TL yield for the CNTs (the glow curve), encompassed within the temperature range 180– 250 °C.
Figure 55 above shows the glow curves obtained for the irradiated CNT buckypaper samples
for doses within the quoted range, the TL yields being observed to be encompassed within the
temperature range 180– 250 °C. The absence of noticeable differences in shape or
distribution of TL yield with dose is indicative of an essentially identical trap centre
activation energy distribution over the particular dose range. The temperatures have been
made to ramp from room temperature to the maximum value of some 397 °C at a ramp rate at
6.5 deg C per second, leading to an ability to discern above-background glow curves for
doses down to 35 mGy, extending to 1.3 Gy, allowing the samples to be considered to be of
utility for radiotherapy dosimetric applications. Thus said, it was also observed that a hyper-
response at 0.2 Gy of the order of four times greater than that obtained at any other dose
within the dose range which was explored, with further experiments subsequently carried out
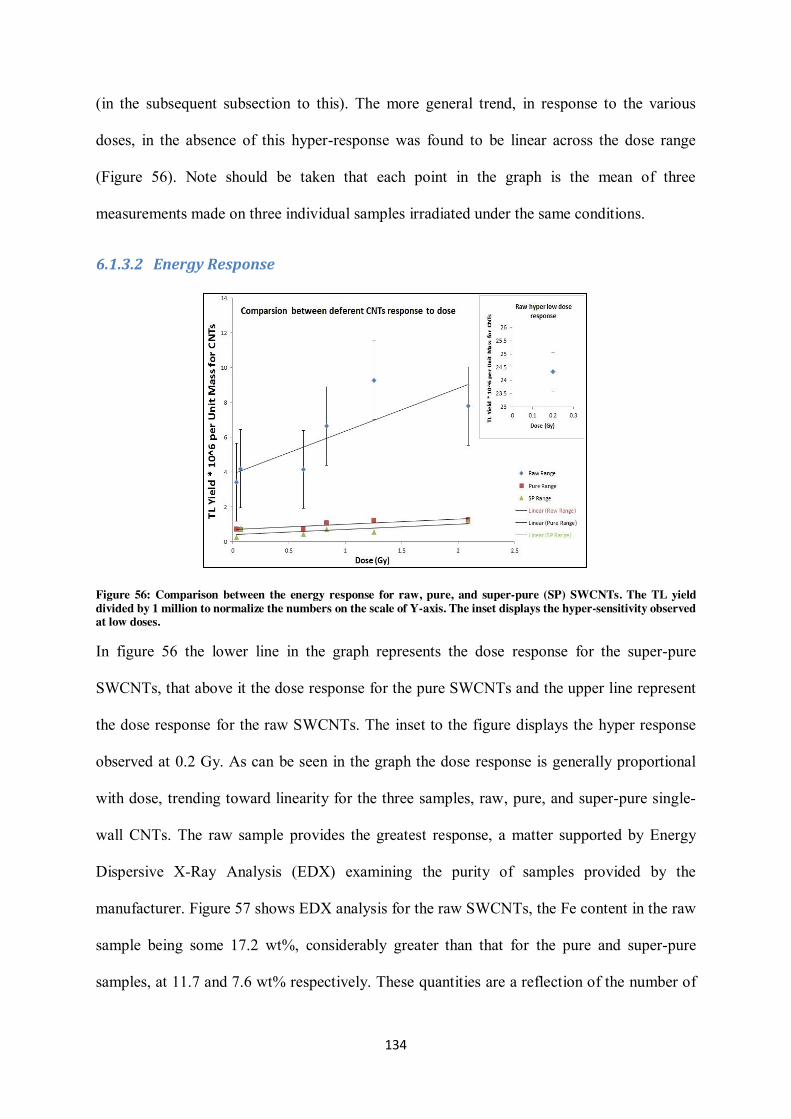
134
(in the subsequent subsection to this). The more general trend, in response to the various
doses, in the absence of this hyper-response was found to be linear across the dose range
(Figure 56). Note should be taken that each point in the graph is the mean of three
measurements made on three individual samples irradiated under the same conditions.
6.1.3.2 Energy Response
Figure 56: Comparison between the energy response for raw, pure, and super-pure (SP) SWCNTs. The TL yield divided by 1 million to normalize the numbers on the scale of Y-axis. The inset displays the hyper-sensitivity observed at low doses.
In figure 56 the lower line in the graph represents the dose response for the super-pure
SWCNTs, that above it the dose response for the pure SWCNTs and the upper line represent
the dose response for the raw SWCNTs. The inset to the figure displays the hyper response
observed at 0.2 Gy. As can be seen in the graph the dose response is generally proportional
with dose, trending toward linearity for the three samples, raw, pure, and super-pure single-
wall CNTs. The raw sample provides the greatest response, a matter supported by Energy
Dispersive X-Ray Analysis (EDX) examining the purity of samples provided by the
manufacturer. Figure 57 shows EDX analysis for the raw SWCNTs, the Fe content in the raw
sample being some 17.2 wt%, considerably greater than that for the pure and super-pure
samples, at 11.7 and 7.6 wt% respectively. These quantities are a reflection of the number of
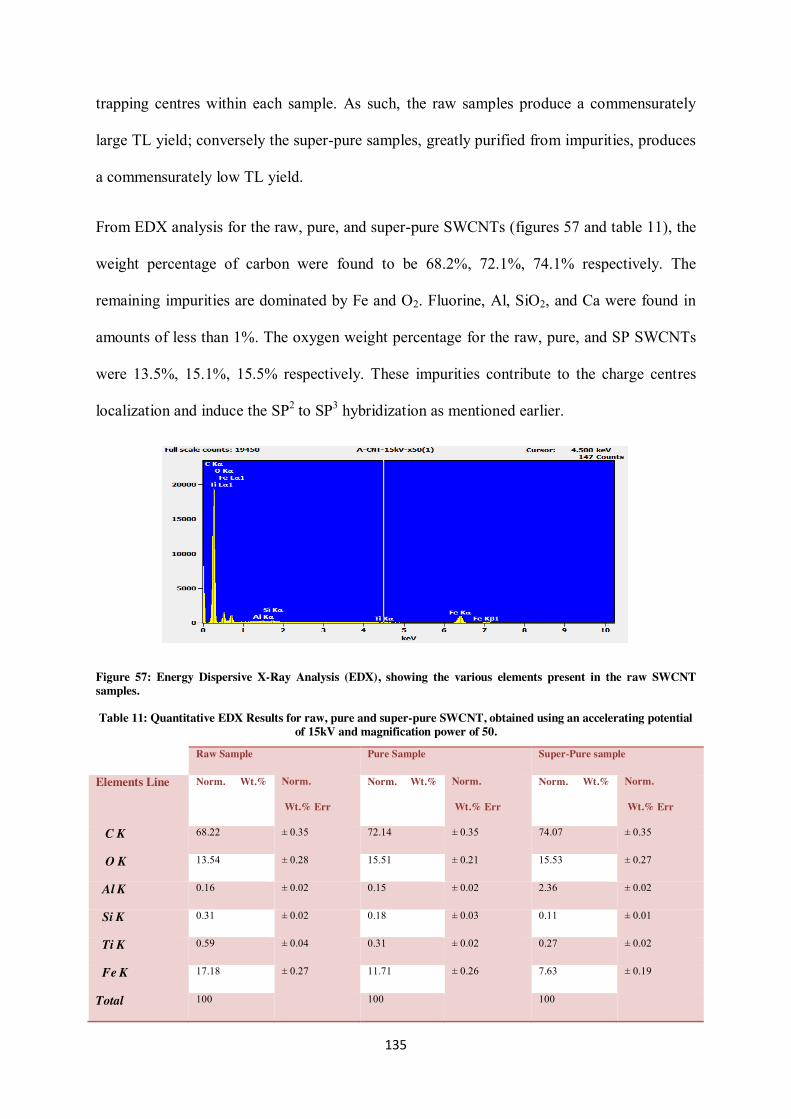
135
trapping centres within each sample. As such, the raw samples produce a commensurately
large TL yield; conversely the super-pure samples, greatly purified from impurities, produces
a commensurately low TL yield.
From EDX analysis for the raw, pure, and super-pure SWCNTs (figures 57 and table 11), the
weight percentage of carbon were found to be 68.2%, 72.1%, 74.1% respectively. The
remaining impurities are dominated by Fe and O2. Fluorine, Al, SiO2, and Ca were found in
amounts of less than 1%. The oxygen weight percentage for the raw, pure, and SP SWCNTs
were 13.5%, 15.1%, 15.5% respectively. These impurities contribute to the charge centres
localization and induce the SP2 to SP3 hybridization as mentioned earlier.
Figure 57: Energy Dispersive X-Ray Analysis (EDX), showing the various elements present in the raw SWCNT samples.
Table 11: Quantitative EDX Results for raw, pure and super-pure SWCNT, obtained using an accelerating potential of 15kV and magnification power of 50.
Raw Sample Pure Sample Super-Pure sample
Elements Line Norm. Wt.% Norm.
Norm.
Wt.% Err
Norm. Wt.% Norm.
Norm.
Wt.% Err
Norm. Wt.% Norm.
Norm.
Wt.% Err
C K 68.22 ± 0.35 72.14 ± 0.35 74.07 ± 0.35
O K 13.54 ± 0.28 15.51 ± 0.21 15.53 ± 0.27
Al K 0.16 ± 0.02 0.15 ± 0.02 2.36 ± 0.02
Si K 0.31 ± 0.02 0.18 ± 0.03 0.11 ± 0.01
Ti K 0.59 ± 0.04 0.31 ± 0.02 0.27 ± 0.02
Fe K 17.18 ± 0.27 11.71 ± 0.26 7.63 ± 0.19
Total 100 100 100
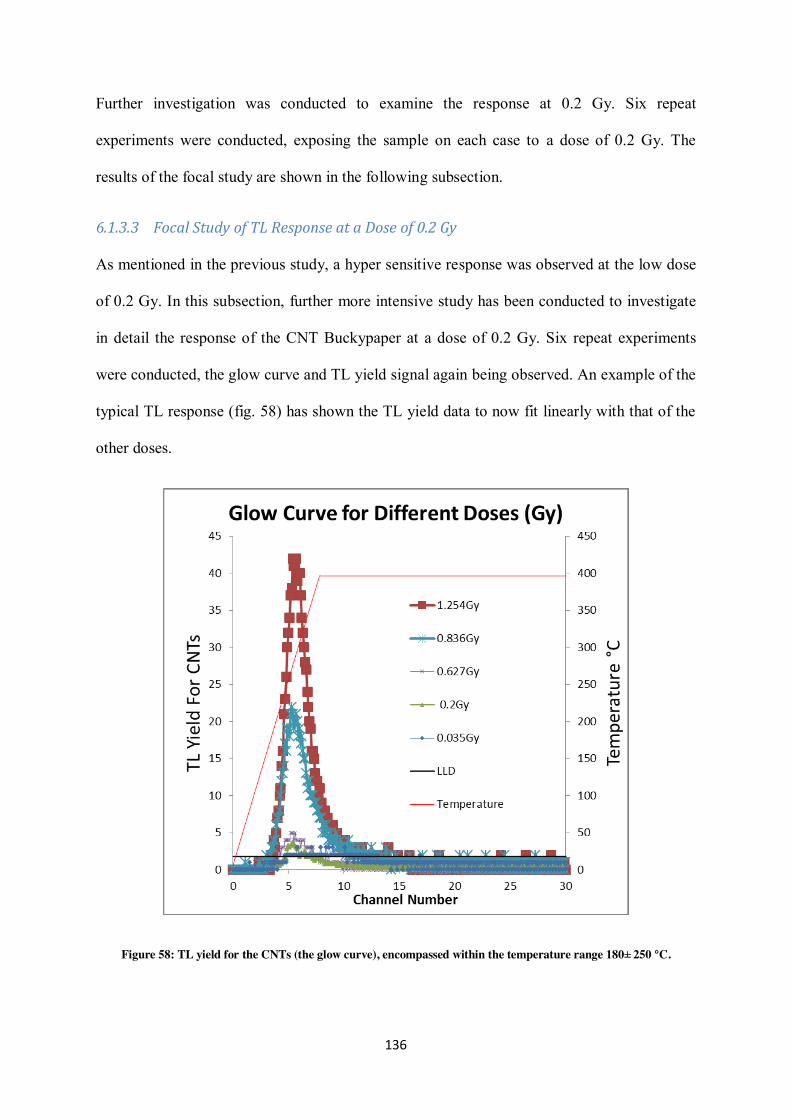
136
Further investigation was conducted to examine the response at 0.2 Gy. Six repeat
experiments were conducted, exposing the sample on each case to a dose of 0.2 Gy. The
results of the focal study are shown in the following subsection.
6.1.3.3 Focal Study of TL Response at a Dose of 0.2 Gy
As mentioned in the previous study, a hyper sensitive response was observed at the low dose
of 0.2 Gy. In this subsection, further more intensive study has been conducted to investigate
in detail the response of the CNT Buckypaper at a dose of 0.2 Gy. Six repeat experiments
were conducted, the glow curve and TL yield signal again being observed. An example of the
typical TL response (fig. 58) has shown the TL yield data to now fit linearly with that of the
other doses.
Figure 58: TL yield for the CNTs (the glow curve), encompassed within the temperature range 180– 250 °C.
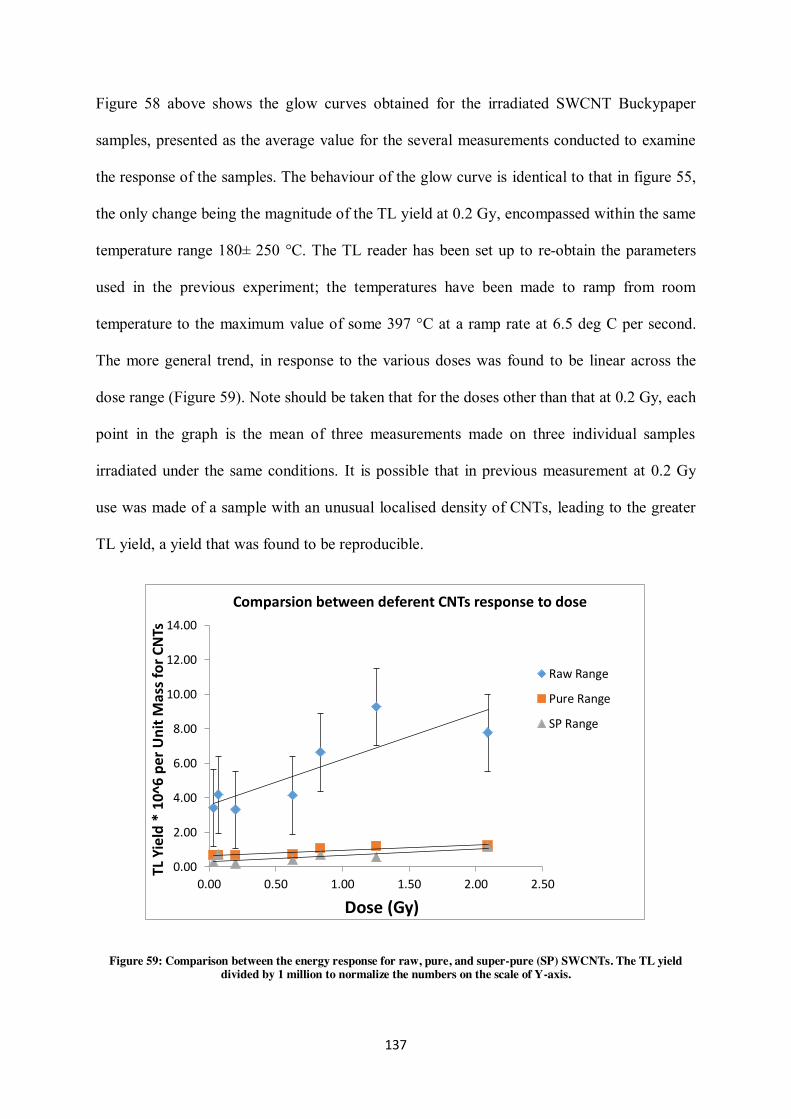
137
Figure 58 above shows the glow curves obtained for the irradiated SWCNT Buckypaper
samples, presented as the average value for the several measurements conducted to examine
the response of the samples. The behaviour of the glow curve is identical to that in figure 55,
the only change being the magnitude of the TL yield at 0.2 Gy, encompassed within the same
temperature range 180– 250 °C. The TL reader has been set up to re-obtain the parameters
used in the previous experiment; the temperatures have been made to ramp from room
temperature to the maximum value of some 397 °C at a ramp rate at 6.5 deg C per second.
The more general trend, in response to the various doses was found to be linear across the
dose range (Figure 59). Note should be taken that for the doses other than that at 0.2 Gy, each
point in the graph is the mean of three measurements made on three individual samples
irradiated under the same conditions. It is possible that in previous measurement at 0.2 Gy
use was made of a sample with an unusual localised density of CNTs, leading to the greater
TL yield, a yield that was found to be reproducible.
Figure 59: Comparison between the energy response for raw, pure, and super-pure (SP) SWCNTs. The TL yield divided by 1 million to normalize the numbers on the scale of Y-axis.
0.00
2.00
4.00
6.00
8.00
10.00
12.00
14.00
0.00 0.50 1.00 1.50 2.00 2.50
TL Y
ield
* 1
0^6
per
Un
it M
ass
for
CN
Ts
Dose (Gy)
Comparsion between deferent CNTs response to dose
Raw Range
Pure Range
SP Range
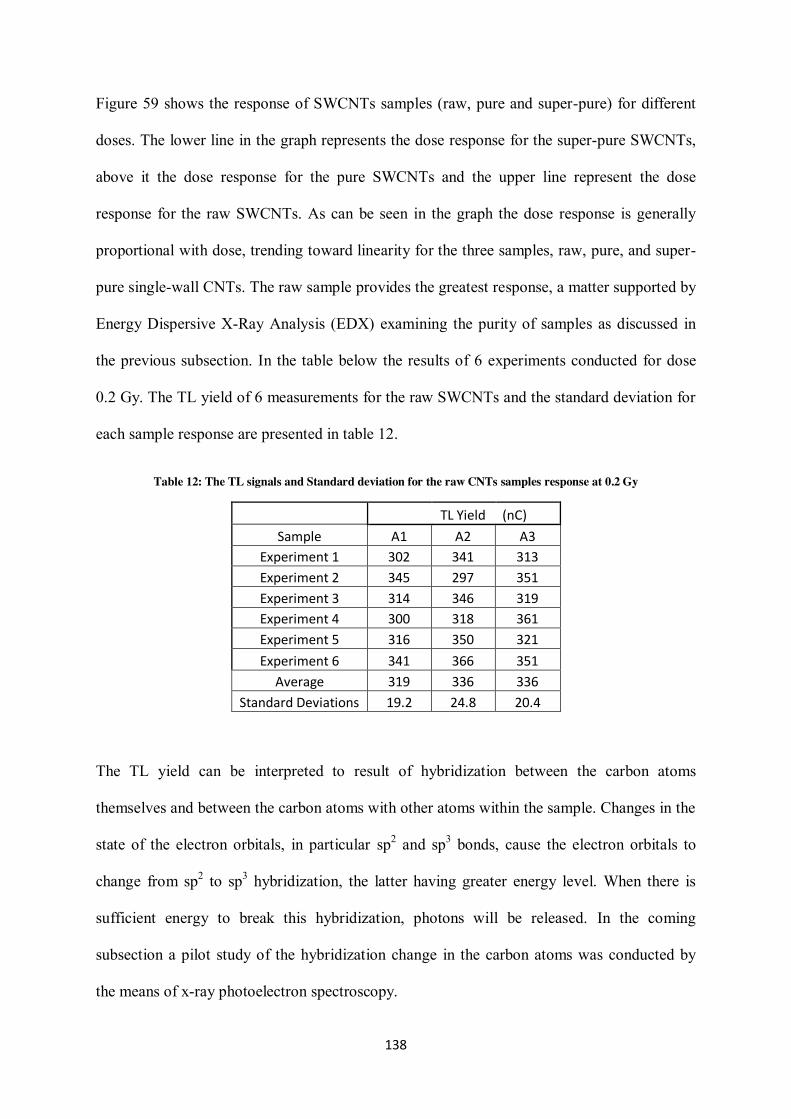
138
Figure 59 shows the response of SWCNTs samples (raw, pure and super-pure) for different
doses. The lower line in the graph represents the dose response for the super-pure SWCNTs,
above it the dose response for the pure SWCNTs and the upper line represent the dose
response for the raw SWCNTs. As can be seen in the graph the dose response is generally
proportional with dose, trending toward linearity for the three samples, raw, pure, and super-
pure single-wall CNTs. The raw sample provides the greatest response, a matter supported by
Energy Dispersive X-Ray Analysis (EDX) examining the purity of samples as discussed in
the previous subsection. In the table below the results of 6 experiments conducted for dose
0.2 Gy. The TL yield of 6 measurements for the raw SWCNTs and the standard deviation for
each sample response are presented in table 12.
Table 12: The TL signals and Standard deviation for the raw CNTs samples response at 0.2 Gy
TL Yield (nC)
Sample A1 A2 A3
Experiment 1 302 341 313
Experiment 2 345 297 351
Experiment 3 314 346 319
Experiment 4 300 318 361
Experiment 5 316 350 321
Experiment 6 341 366 351
Average 319 336 336
Standard Deviations 19.2 24.8 20.4
The TL yield can be interpreted to result of hybridization between the carbon atoms
themselves and between the carbon atoms with other atoms within the sample. Changes in the
state of the electron orbitals, in particular sp2 and sp3 bonds, cause the electron orbitals to
change from sp2 to sp3 hybridization, the latter having greater energy level. When there is
sufficient energy to break this hybridization, photons will be released. In the coming
subsection a pilot study of the hybridization change in the carbon atoms was conducted by
the means of x-ray photoelectron spectroscopy.
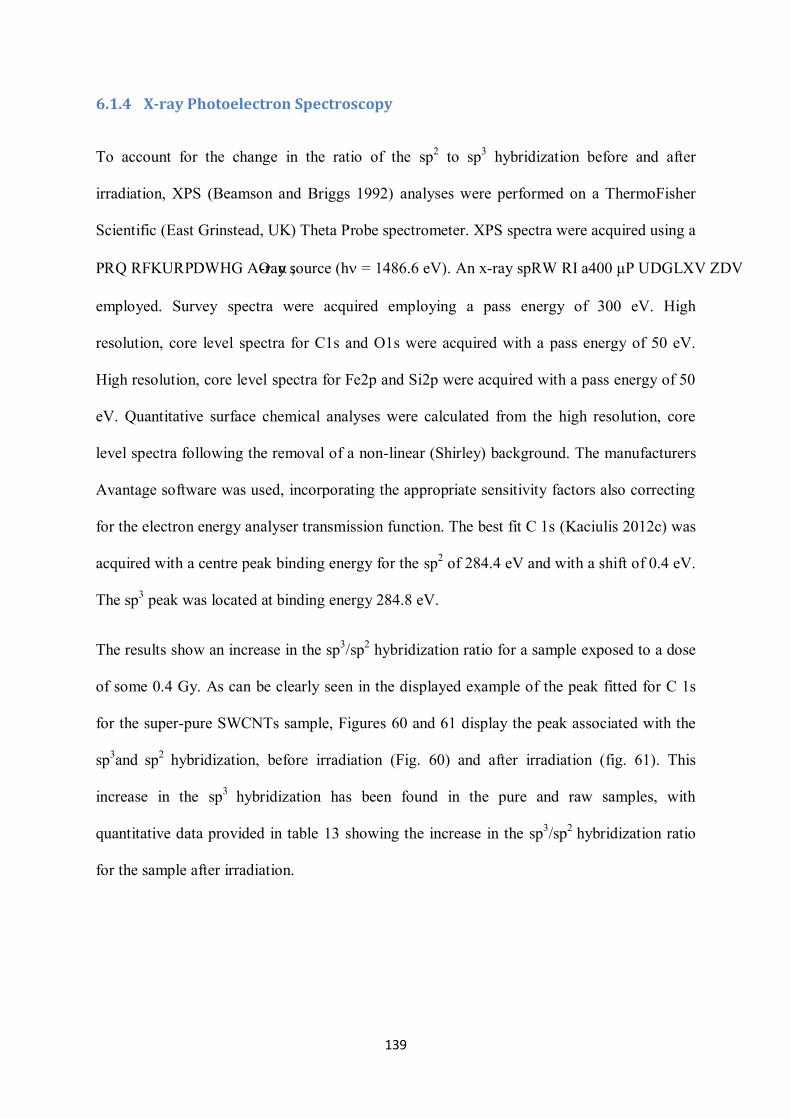
139
6.1.4 X-ray Photoelectron Spectroscopy
To account for the change in the ratio of the sp2 to sp3 hybridization before and after
irradiation, XPS (Beamson and Briggs 1992) analyses were performed on a ThermoFisher
Scientific (East Grinstead, UK) Theta Probe spectrometer. XPS spectra were acquired using a
monochromated Al Kα X-ray source (hQ = 1486.6 eV). An x-ray spot of ~400 μm radius was
employed. Survey spectra were acquired employing a pass energy of 300 eV. High
resolution, core level spectra for C1s and O1s were acquired with a pass energy of 50 eV.
High resolution, core level spectra for Fe2p and Si2p were acquired with a pass energy of 50
eV. Quantitative surface chemical analyses were calculated from the high resolution, core
level spectra following the removal of a non-linear (Shirley) background. The manufacturers
Avantage software was used, incorporating the appropriate sensitivity factors also correcting
for the electron energy analyser transmission function. The best fit C 1s (Kaciulis 2012c) was
acquired with a centre peak binding energy for the sp2 of 284.4 eV and with a shift of 0.4 eV.
The sp3 peak was located at binding energy 284.8 eV.
The results show an increase in the sp3/sp2 hybridization ratio for a sample exposed to a dose
of some 0.4 Gy. As can be clearly seen in the displayed example of the peak fitted for C 1s
for the super-pure SWCNTs sample, Figures 60 and 61 display the peak associated with the
sp3and sp2 hybridization, before irradiation (Fig. 60) and after irradiation (fig. 61). This
increase in the sp3 hybridization has been found in the pure and raw samples, with
quantitative data provided in table 13 showing the increase in the sp3/sp2 hybridization ratio
for the sample after irradiation.
140
Figure 60: X-ray Photoelectron Spectroscopy for the super-pure SWCNTs sample pre-irradiation, showing the separate sp2 and sp3 peaks.
Figure 61: X-ray Photoelectron Spectroscopy for the super-pure SWCNTs sample post-irradiation. The peak of the sp2 and sp3 are displayed.
From table 9, sp2/sp3 hybridization ratio pre-irradiation for the raw, pure, and super-pure
SWCNT samples were 44%, 22%, and 25% respectively, increasing post-irradiation by
factors of 1.8, 1.9, and 2.7 respectively.
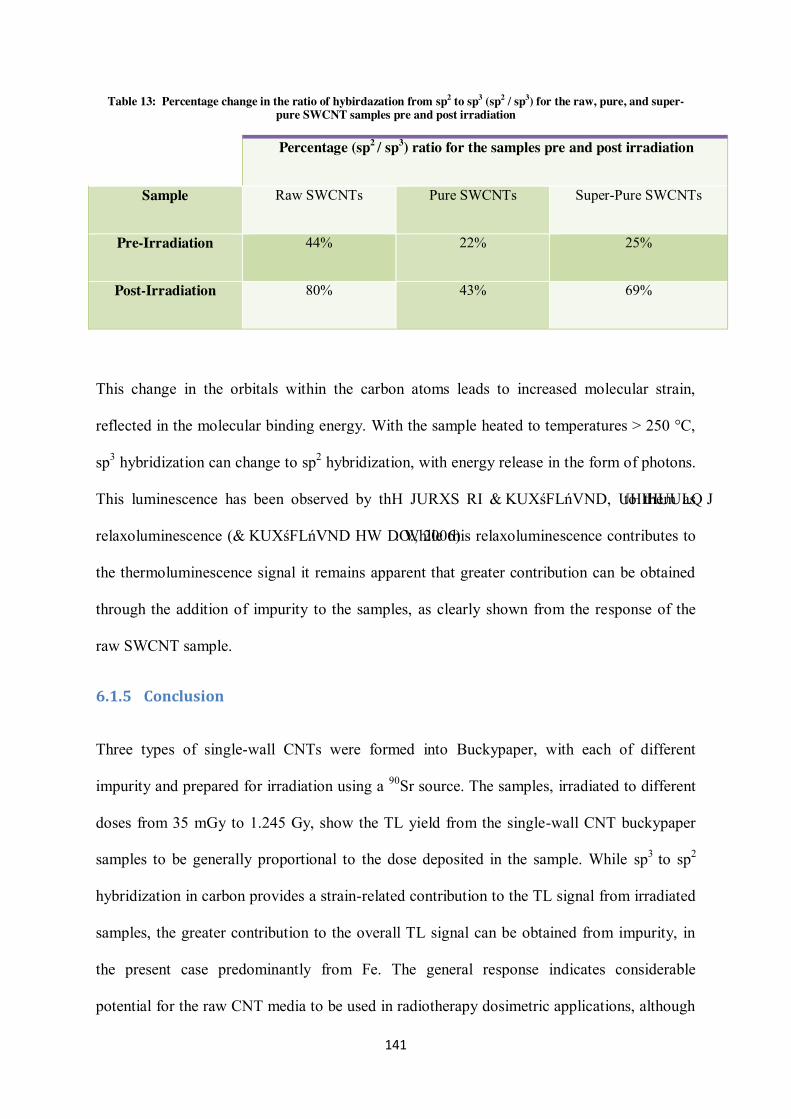
141
Table 13: Percentage change in the ratio of hybirdazation from sp2 to sp3 (sp2 / sp3) for the raw, pure, and super-pure SWCNT samples pre and post irradiation
Percentage (sp2 / sp3) ratio for the samples pre and post irradiation
Sample Raw SWCNTs Pure SWCNTs Super-Pure SWCNTs
Pre-Irradiation 44% 22% 25%
Post-Irradiation 80% 43% 69%
This change in the orbitals within the carbon atoms leads to increased molecular strain,
reflected in the molecular binding energy. With the sample heated to temperatures > 250 °C,
sp3 hybridization can change to sp2 hybridization, with energy release in the form of photons.
This luminescence has been observed by the group of Chruścińska, referring to them as
relaxoluminescence (Chruścińska et al., 2006). While this relaxoluminescence contributes to
the thermoluminescence signal it remains apparent that greater contribution can be obtained
through the addition of impurity to the samples, as clearly shown from the response of the
raw SWCNT sample.
6.1.5 Conclusion
Three types of single-wall CNTs were formed into Buckypaper, with each of different
impurity and prepared for irradiation using a 90Sr source. The samples, irradiated to different
doses from 35 mGy to 1.245 Gy, show the TL yield from the single-wall CNT buckypaper
samples to be generally proportional to the dose deposited in the sample. While sp3 to sp2
hybridization in carbon provides a strain-related contribution to the TL signal from irradiated
samples, the greater contribution to the overall TL signal can be obtained from impurity, in
the present case predominantly from Fe. The general response indicates considerable
potential for the raw CNT media to be used in radiotherapy dosimetric applications, although
142
there remains a need to develop means for control of surface roughness of the buckypaper
CNTs in order to obtain more uniform response. The following chapter discusses the new
technique developed using XPS to examine the change of hybridization (sp3 to sp2) with
deposited doses and proposing this to be a new method of dosimetry.
143
Chapter 7
7 Novel Dosimetric Study of sp2 to sp3 Irradiation hybridisation
Ratio in Free –Standing CNTs
7.1.1 Introduction
Most of the content of this chapter has been published in the journal “Radiation Physics and
Chemistry”: "Abdulaziz Alanazi et al., 2016. “Novel dosimetric study of the sp2 to sp3
hybridisation ratio in free–standing carbon nanotubes buckypaper", DOI:
https://doi.org/10.1016/j.radphyschem.2018.02.006 , (Appendix F). The right to include the
article in any thesis or dissertation has been obtained during assignment of copyright with the
publisher.
As shown in section 6.1.3.3 (focusing on lower levels of detection), an apparent reproducible
hypersensitivity has been observed at lower dose (by which for present purposes one
understands this to mean a fraction of 1 Gy), in particular herein at about 0.2 Gy. While
further investigation conducted using various CNT samples have not typically reproduced the
deviation from linearity at the same low dose nevertheless, and much less frequently, the
enhanced response has been obtained. This presents one with several possibilities as to
influencing factors, including variation in buckypaper thickness at the effective point of
measurement, also imperfect thermal contact across the sample, both exacerbated by the
decreasing signal to noise ratio at low dose. In part, this suggests need for a microscopic
investigation to enable better understanding of the effect of radiation dose on the CNTs. This
chapter reports on use of x-ray photoelectron spectroscopy (XPS) in a surface analysis study
exploring the CNTs pre and post irradiation.
144
7.1.2 Setup of the experiment6
XPS analyses were performed using a Thermo Fisher Scientific Instruments (East Grinstead,
UK) K-Alpha+ spectrometer. XPS spectra were acquired using a monochromated Al Kα X-
ray source (hQ = 1486.6 eV). An X-ray spot of ~400 μm radius was employed. Carbon KLL
Auger peaks were acquired using a Pass Energy of 50 eV and the samples D parameter
determined. Quantitative surface chemical analyses were calculated from the high resolution,
core-level spectra following the removal of a non-linear (Shirley) background. The
manufacturers’ Avantage software was used for analysis, incorporating the appropriate
sensitivity factors and corrections for the electron energy analyser transmission function.
7.1.3 X-ray photoelectron spectroscopy (XPS)
Use of XPS enables exploration of the effects of ionising radiation on the structure of CNTs.
In particular, XPS is a surface sensitive technique that provides quantitative spectroscopic
measurements of elemental composition, also providing information on the
chemical/electronic configurational state of the surface of the target medium. XPS spectra are
acquired by exposure of the material to X-ray radiation, simultaneously measuring the kinetic
energy and number of electrons that travel from the upper-most surface of the material (0 to
10 nm) via use of an electron energy analyser detector. The technique requires relatively high
vacuum conditions (a 1 u 10-7 millibar) and reference to the D parameter, the latter based on
separation of the pair of maxima and minima observed in the X-ray excited carbon KLL
transition (see figures 62 and 63). This has been used to estimate the hybridisation ratio
(sp2/sp3), representing the change in orbital bonding with respect to dose received. Figure 64
illustrates the change in hybridisation of the carbon atom orbitals. The study has been carried
out for three different purities of CNT sample, raw, pure and super-pure, each exposed to
various doses.
145
Figure 62: Example for the first derivative for carbon KLL spectra was used to determine the distance “D” between
the most positive maximum and most negative minimum for the raw sample A, in this case the D-value of 21.0 eV corresponds to the sample pre-irradiation.
Figure 63: Example for the first derivative for carbon KLL spectra was used to determine the distance “D” between the most positive maximum and most negative minimum for the raw sample A, in this case the D-value of 17.7eV for
the A sample post irradiation, exposed to a dose 5.85 Gy.
146
Figure 64: Hybridisation of orbital bonding, from sp2 to sp3; for sp2 the angle between the orbitals is 120° while for sp3 it is 109.5°. The sp2 to sp3 ratio has been observed to change systematically when the highly carbon-rich sample
is exposed to ionising radiation.
The XPS technique has been used to explore the surface structure samples of single-wall
carbon nanotubes (SWCNTs) of various degrees of purity, raw, pure and super pure. In
present investigations the buckypaper samples have been irradiated with beta-particle
ionising radiation, use being made of a 90Sr irradiator. The rationale for this choice has been
to ensure dose deposition throughout the buckypaper, the thickness of samples ranging from
as low as 10 Pm to as great as 100 Pm (with a mean and standard deviation of 12.9 ± 1.7 Pm
for the most uniformly flat sample and 82.5 ± 26.4 Pm for the least uniform sample, see
histograms in figure 65 for sample thicknesses).
147
Figure 65: Examples of samples thickness variations.
The stopping power of 90Sr/90Y beta particles in graphite (U = 1.7 g cm-3) is of the order of
0.3 keV Pm-1 [ESTAR (electron stopping power and range) database, (NIST 14 June 2017)],
also noting that the maximum decay energy of the beta decay from 90Sr to 90Y is 0.546 MeV
while that of the subsequent decay to 90 Zr with a half-life of 64.1 h is 2.28 MeV. The short
versus long half-life relationship between 90Y and 90Sr respectively provides the basis for
secular equilibrium between the two radionuclides.
XPS analyses were performed using a Thermo Fisher Scientific Instruments K-Alpha+
spectrometer (East Grinstead, UK). XPS spectra were acquired using a monochromated Al
Kα X-ray source (hQ = 1486.6 eV) and an x-ray spot size of radius ~ 400 μm. Carbon KLL
Auger peaks were acquired using 50 eV Pass Energy and the sample D parameter was
determined. With removal of a non-linear (Shirley) background, quantitative surface
chemical analyses were obtained from the high resolution, core-level spectra. For analysis,
148
use was made of the manufacturers’ Avantage software, the latter incorporating the
appropriate sensitivity factors and corrections for the electron energy analyser transmission
function.
To observe dose-dependent change, the XPS technique was applied to samples pre- and post-
irradiation, the source providing a dose-rate that allowed delivery of doses in the range 0.2 to
6 Gy in irradiation times of between 24 hours and 28 days. After each exposure the surface of
the SWCNTs was examined through use of the XPS technique, the results giving information
on the relative presence of the two carbon orbital forms, sp2 and sp3, as discussed above. In
so-doing, the investigation has concerned whether, as a result of deposited dose, the bonding
in the surface structure changes in a proportionate and sensitive way.
7.1.4 Results
For all three qualities of CNT, the ratio sp2/sp3 shows an exponential-like dose-dependent
response (see for example, Figure 66), the functional dependency differing from sample to
sample, a reflection of sample variation, including level of impurity, thickness and surface
roughness. Fitting by non-linear least-squares, carried out using the Python package SciPy
data analysis toolkit (Jones, 2001), produced equations of the form:
𝒚 = 𝑨 ∗ 𝒆−𝒃∗𝒙 + 𝒄 … (8)
With y the D-value, x the dose and A, b, c constants for the particular sample and type (raw,
pure or super-pure). Such exponential behaviour has also been reported by (McEnaney and
Wickham 1996) in their study of degradation of nuclear graphite properties.
7.1.4.1 Raw single-wall carbon nanotubes samples
For preparation of raw sample A, use was made of 0.1 g of CNT, 80 ml of deionised (DI)
water and 1 g of Triton X-100 (Tx-100) to act as surfactant, see section 5.1.3.1 for more
details of the method of preparations. The curve fitting parameters were: [A = 3.5 eV, b =
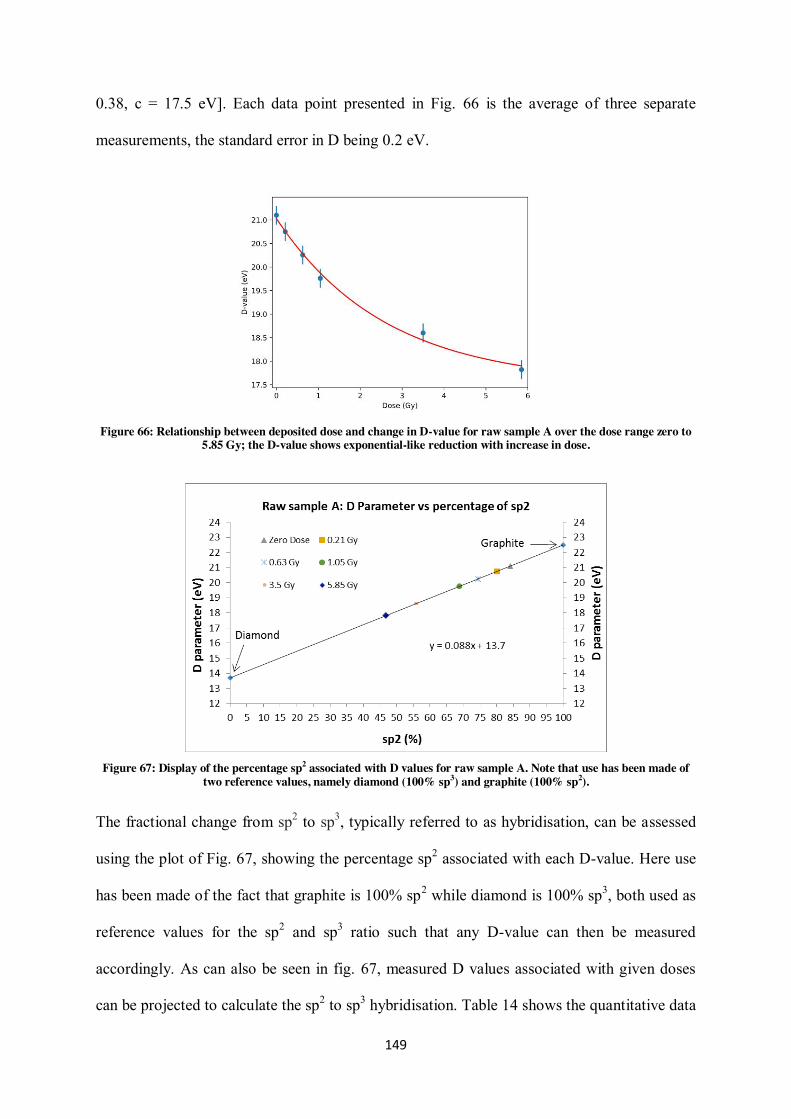
149
0.38, c = 17.5 eV]. Each data point presented in Fig. 66 is the average of three separate
measurements, the standard error in D being 0.2 eV.
Figure 66: Relationship between deposited dose and change in D-value for raw sample A over the dose range zero to
5.85 Gy; the D-value shows exponential-like reduction with increase in dose.
Figure 67: Display of the percentage sp2 associated with D values for raw sample A. Note that use has been made of
two reference values, namely diamond (100% sp3) and graphite (100% sp2).
The fractional change from sp2 to sp3, typically referred to as hybridisation, can be assessed
using the plot of Fig. 67, showing the percentage sp2 associated with each D-value. Here use
has been made of the fact that graphite is 100% sp2 while diamond is 100% sp3, both used as
reference values for the sp2 and sp3 ratio such that any D-value can then be measured
accordingly. As can also be seen in fig. 67, measured D values associated with given doses
can be projected to calculate the sp2 to sp3 hybridisation. Table 14 shows the quantitative data
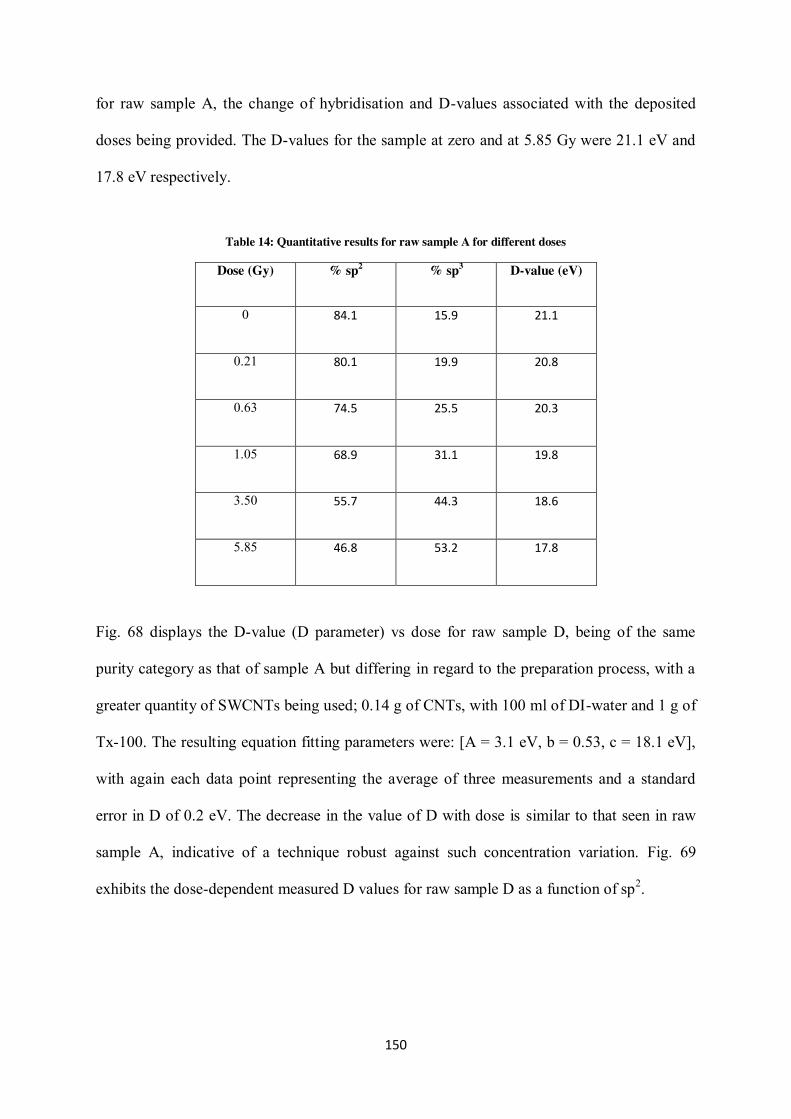
150
for raw sample A, the change of hybridisation and D-values associated with the deposited
doses being provided. The D-values for the sample at zero and at 5.85 Gy were 21.1 eV and
17.8 eV respectively.
Table 14: Quantitative results for raw sample A for different doses
Dose (Gy) % sp2 % sp3 D-value (eV)
0 84.1 15.9 21.1
0.21 80.1 19.9 20.8
0.63 74.5 25.5 20.3
1.05 68.9 31.1 19.8
3.50 55.7 44.3 18.6
5.85 46.8 53.2 17.8
Fig. 68 displays the D-value (D parameter) vs dose for raw sample D, being of the same
purity category as that of sample A but differing in regard to the preparation process, with a
greater quantity of SWCNTs being used; 0.14 g of CNTs, with 100 ml of DI-water and 1 g of
Tx-100. The resulting equation fitting parameters were: [A = 3.1 eV, b = 0.53, c = 18.1 eV],
with again each data point representing the average of three measurements and a standard
error in D of 0.2 eV. The decrease in the value of D with dose is similar to that seen in raw
sample A, indicative of a technique robust against such concentration variation. Fig. 69
exhibits the dose-dependent measured D values for raw sample D as a function of sp2.
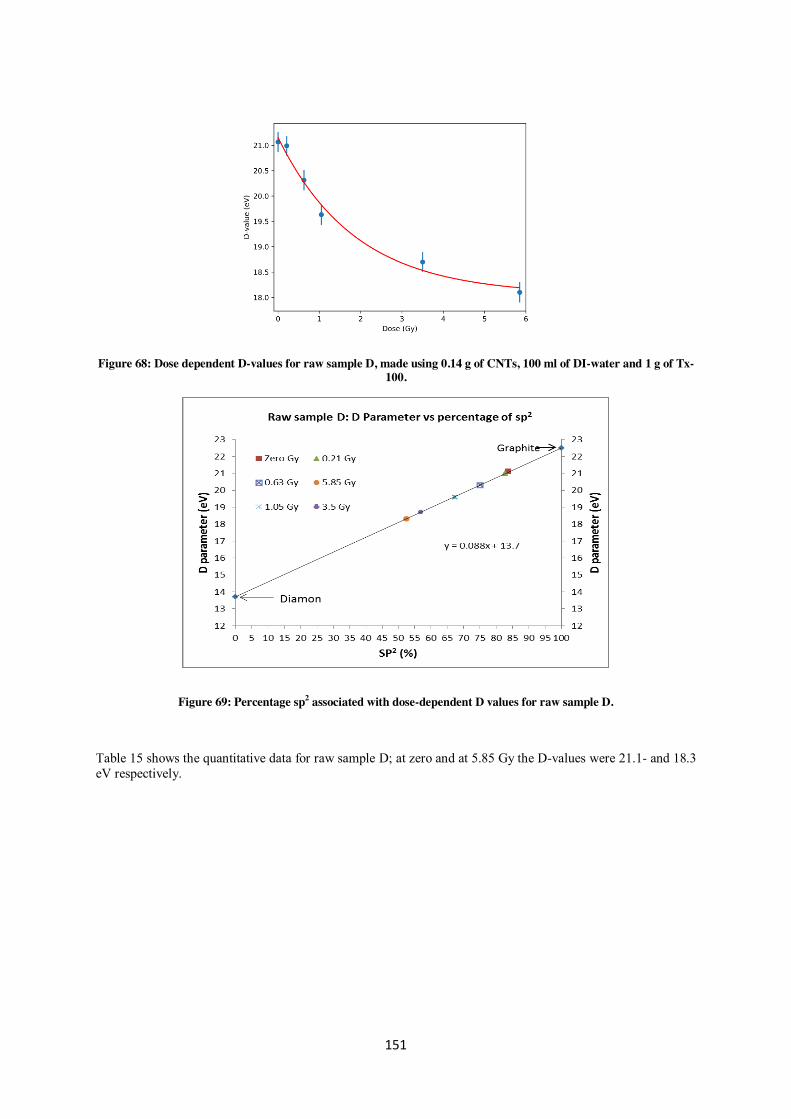
151
Figure 68: Dose dependent D-values for raw sample D, made using 0.14 g of CNTs, 100 ml of DI-water and 1 g of Tx-100.
Figure 69: Percentage sp2 associated with dose-dependent D values for raw sample D.
Table 15 shows the quantitative data for raw sample D; at zero and at 5.85 Gy the D-values were 21.1- and 18.3 eV respectively.
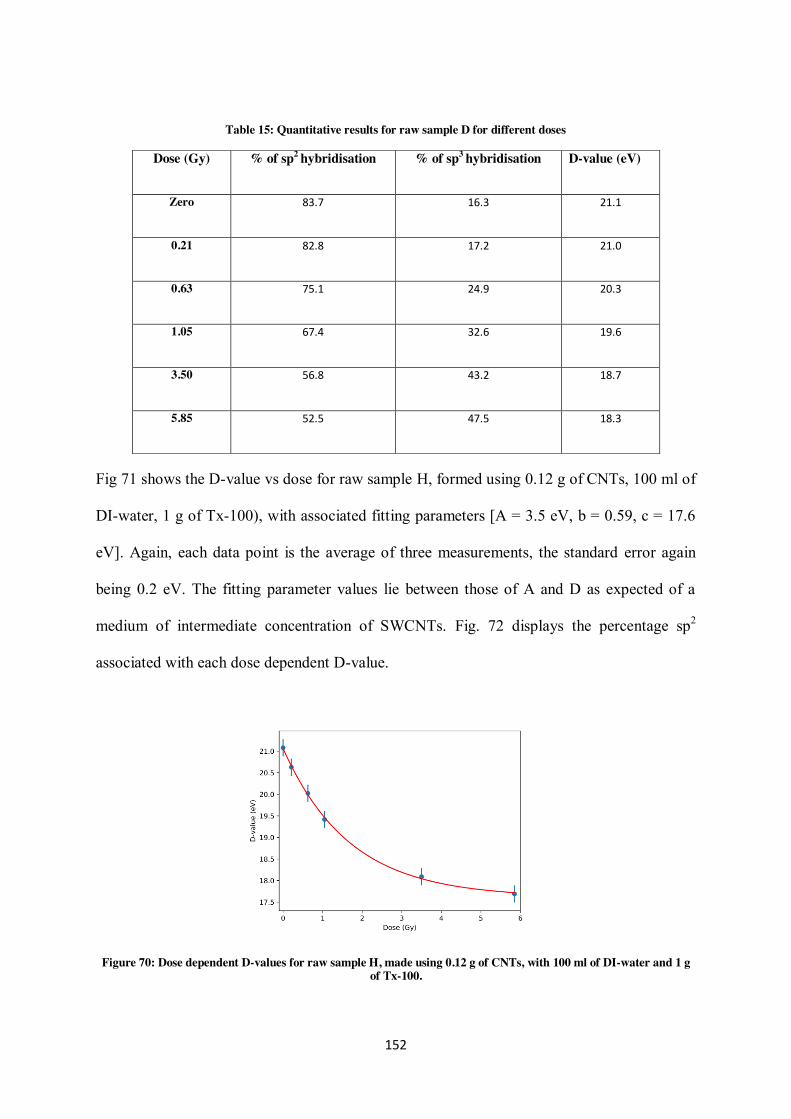
152
Table 15: Quantitative results for raw sample D for different doses
Fig 71 shows the D-value vs dose for raw sample H, formed using 0.12 g of CNTs, 100 ml of
DI-water, 1 g of Tx-100), with associated fitting parameters [A = 3.5 eV, b = 0.59, c = 17.6
eV]. Again, each data point is the average of three measurements, the standard error again
being 0.2 eV. The fitting parameter values lie between those of A and D as expected of a
medium of intermediate concentration of SWCNTs. Fig. 72 displays the percentage sp2
associated with each dose dependent D-value.
Figure 70: Dose dependent D-values for raw sample H, made using 0.12 g of CNTs, with 100 ml of DI-water and 1 g of Tx-100.
Dose (Gy) % of sp2 hybridisation % of sp3 hybridisation D-value (eV)
Zero 83.7 16.3 21.1
0.21 82.8 17.2 21.0
0.63 75.1 24.9 20.3
1.05 67.4 32.6 19.6
3.50 56.8 43.2 18.7
5.85 52.5 47.5 18.3
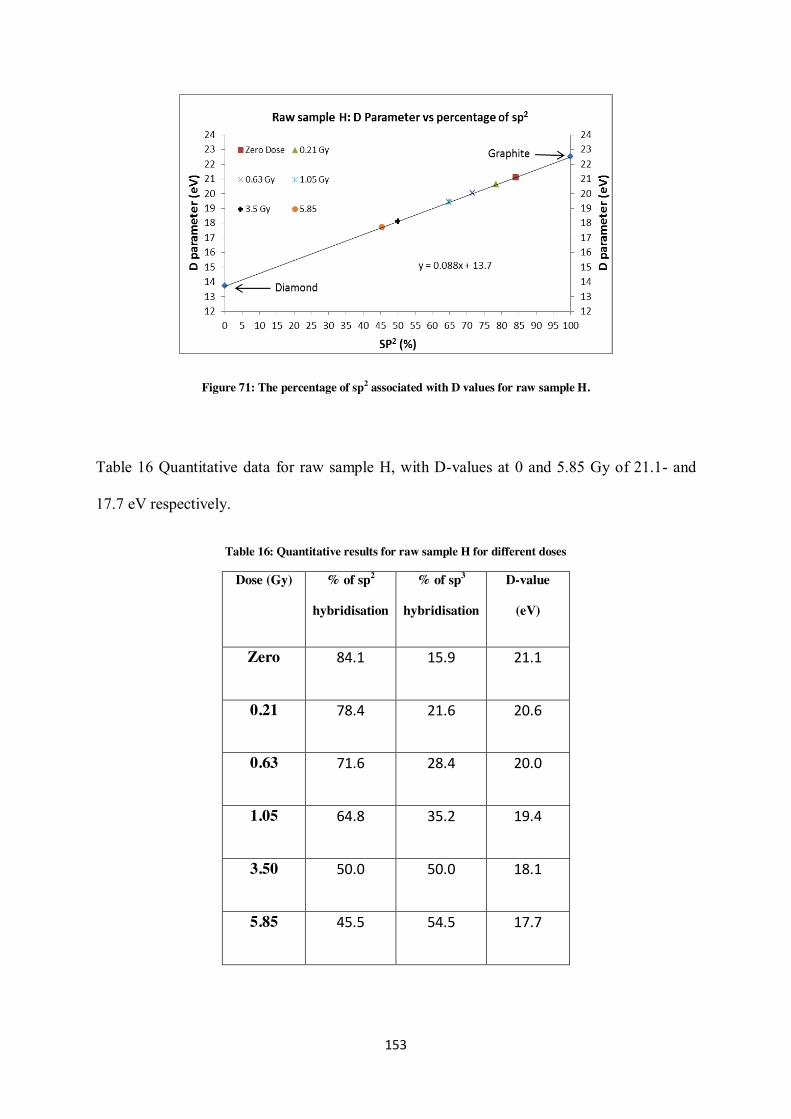
153
Figure 71: The percentage of sp2 associated with D values for raw sample H.
Table 16 Quantitative data for raw sample H, with D-values at 0 and 5.85 Gy of 21.1- and
17.7 eV respectively.
Table 16: Quantitative results for raw sample H for different doses
Dose (Gy) % of sp2
hybridisation
% of sp3
hybridisation
D-value
(eV)
Zero 84.1 15.9 21.1
0.21 78.4 21.6 20.6
0.63 71.6 28.4 20.0
1.05 64.8 35.2 19.4
3.50 50.0 50.0 18.1
5.85 45.5 54.5 17.7
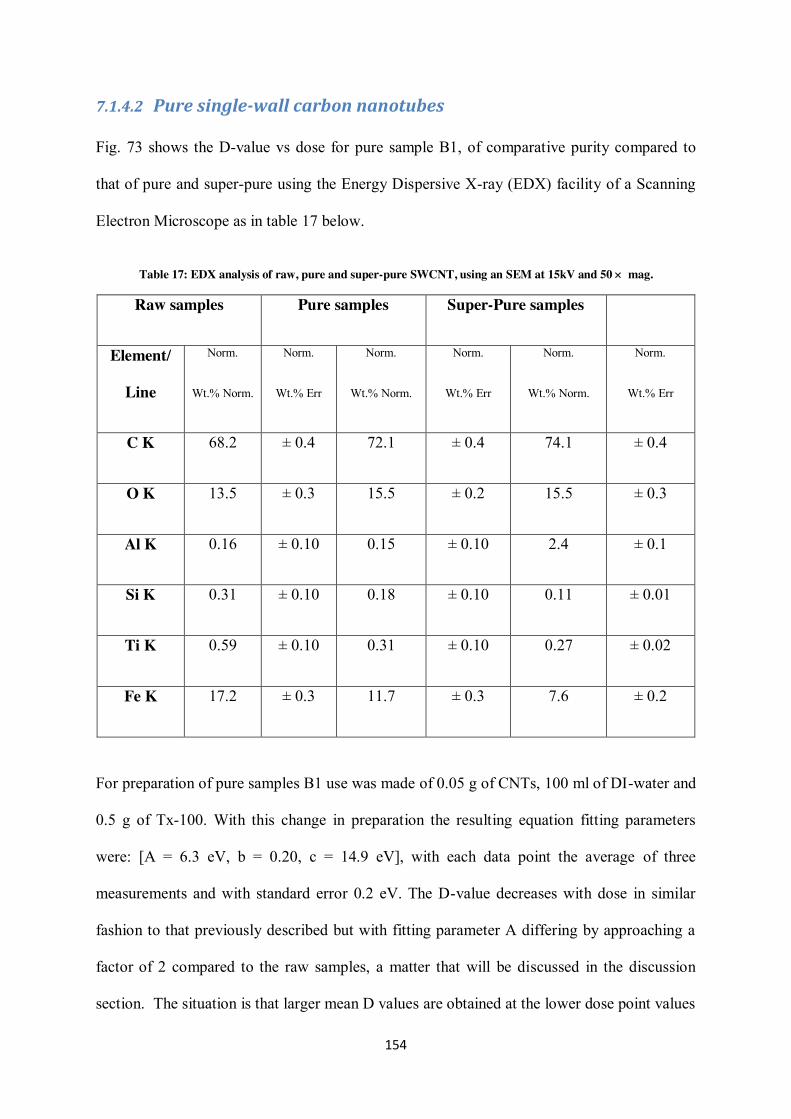
154
7.1.4.2 Pure single-wall carbon nanotubes
Fig. 73 shows the D-value vs dose for pure sample B1, of comparative purity compared to
that of pure and super-pure using the Energy Dispersive X-ray (EDX) facility of a Scanning
Electron Microscope as in table 17 below.
Table 17: EDX analysis of raw, pure and super-pure SWCNT, using an SEM at 15kV and 50 u mag.
Raw samples Pure samples Super-Pure samples
Element/
Line
Norm.
Wt.% Norm.
Norm.
Wt.% Err
Norm.
Wt.% Norm.
Norm.
Wt.% Err
Norm.
Wt.% Norm.
Norm.
Wt.% Err
C K 68.2 ± 0.4 72.1 ± 0.4 74.1 ± 0.4
O K 13.5 ± 0.3 15.5 ± 0.2 15.5 ± 0.3
Al K 0.16 ± 0.10 0.15 ± 0.10 2.4 ± 0.1
Si K 0.31 ± 0.10 0.18 ± 0.10 0.11 ± 0.01
Ti K 0.59 ± 0.10 0.31 ± 0.10 0.27 ± 0.02
Fe K 17.2 ± 0.3 11.7 ± 0.3 7.6 ± 0.2
For preparation of pure samples B1 use was made of 0.05 g of CNTs, 100 ml of DI-water and
0.5 g of Tx-100. With this change in preparation the resulting equation fitting parameters
were: [A = 6.3 eV, b = 0.20, c = 14.9 eV], with each data point the average of three
measurements and with standard error 0.2 eV. The D-value decreases with dose in similar
fashion to that previously described but with fitting parameter A differing by approaching a
factor of 2 compared to the raw samples, a matter that will be discussed in the discussion
section. The situation is that larger mean D values are obtained at the lower dose point values
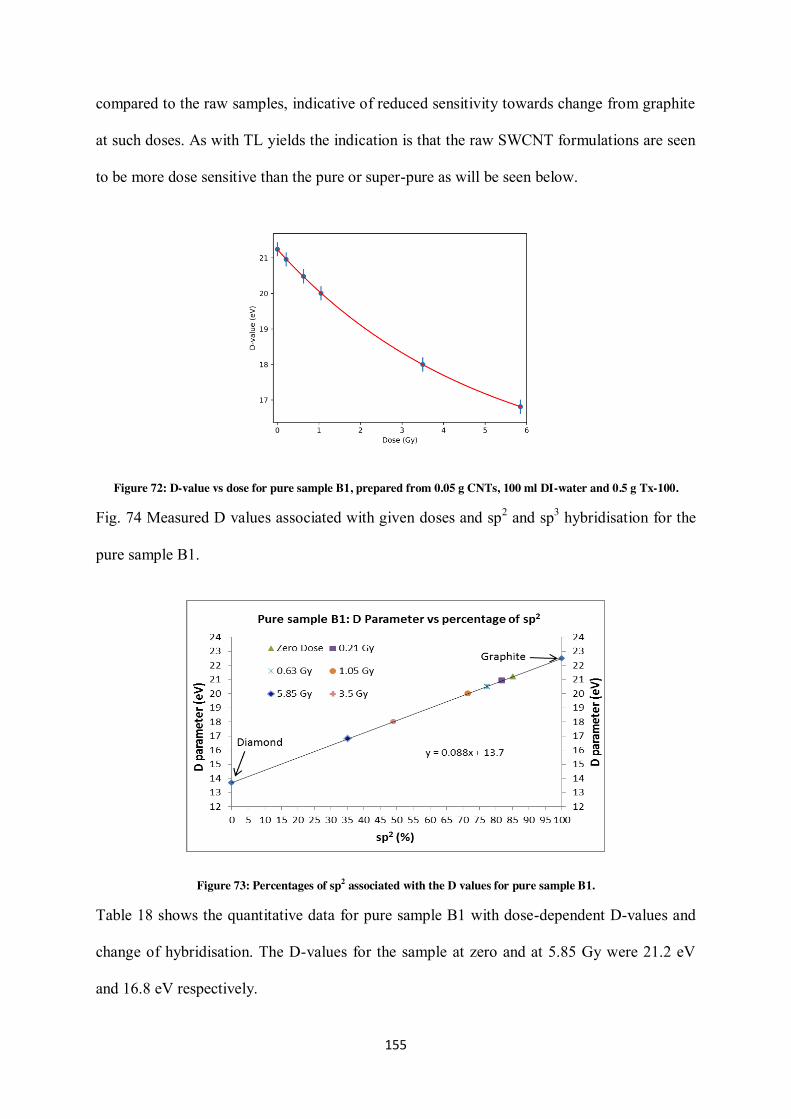
155
compared to the raw samples, indicative of reduced sensitivity towards change from graphite
at such doses. As with TL yields the indication is that the raw SWCNT formulations are seen
to be more dose sensitive than the pure or super-pure as will be seen below.
Figure 72: D-value vs dose for pure sample B1, prepared from 0.05 g CNTs, 100 ml DI-water and 0.5 g Tx-100.
Fig. 74 Measured D values associated with given doses and sp2 and sp3 hybridisation for the
pure sample B1.
Figure 73: Percentages of sp2 associated with the D values for pure sample B1.
Table 18 shows the quantitative data for pure sample B1 with dose-dependent D-values and
change of hybridisation. The D-values for the sample at zero and at 5.85 Gy were 21.2 eV
and 16.8 eV respectively.
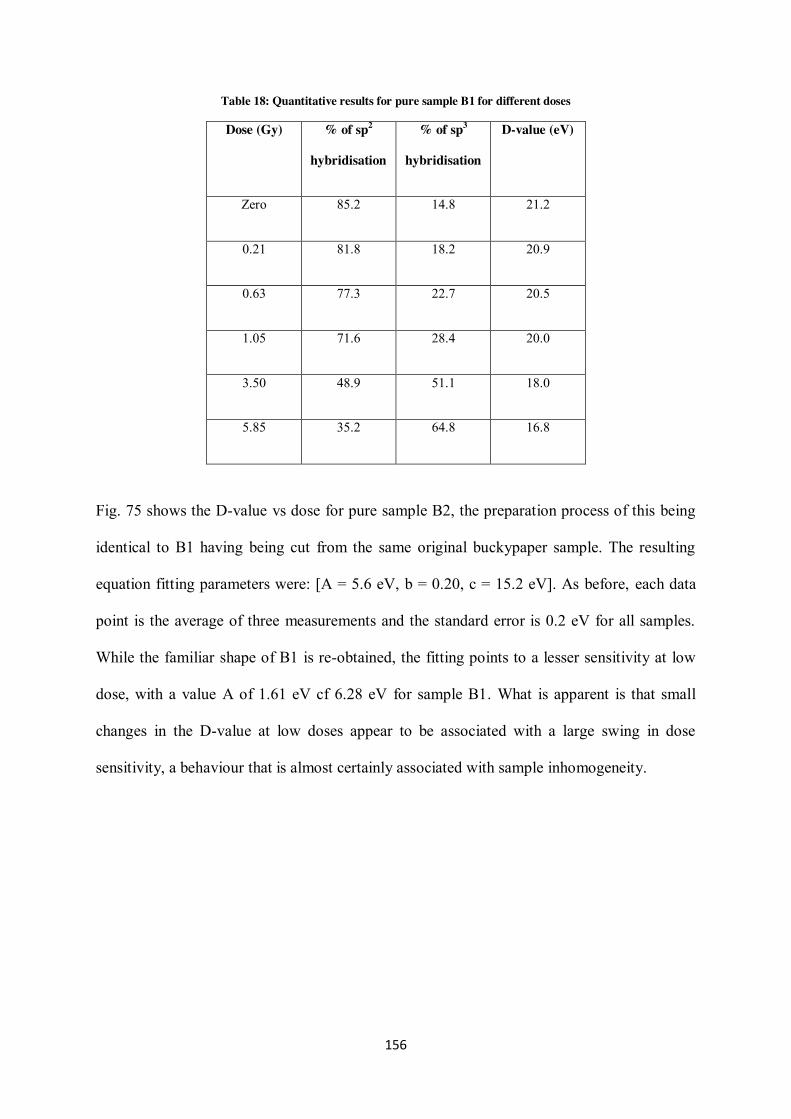
156
Table 18: Quantitative results for pure sample B1 for different doses
Dose (Gy) % of sp2
hybridisation
% of sp3
hybridisation
D-value (eV)
Zero 85.2 14.8 21.2
0.21 81.8 18.2 20.9
0.63 77.3 22.7 20.5
1.05 71.6 28.4 20.0
3.50 48.9 51.1 18.0
5.85 35.2 64.8 16.8
Fig. 75 shows the D-value vs dose for pure sample B2, the preparation process of this being
identical to B1 having being cut from the same original buckypaper sample. The resulting
equation fitting parameters were: [A = 5.6 eV, b = 0.20, c = 15.2 eV]. As before, each data
point is the average of three measurements and the standard error is 0.2 eV for all samples.
While the familiar shape of B1 is re-obtained, the fitting points to a lesser sensitivity at low
dose, with a value A of 1.61 eV cf 6.28 eV for sample B1. What is apparent is that small
changes in the D-value at low doses appear to be associated with a large swing in dose
sensitivity, a behaviour that is almost certainly associated with sample inhomogeneity.
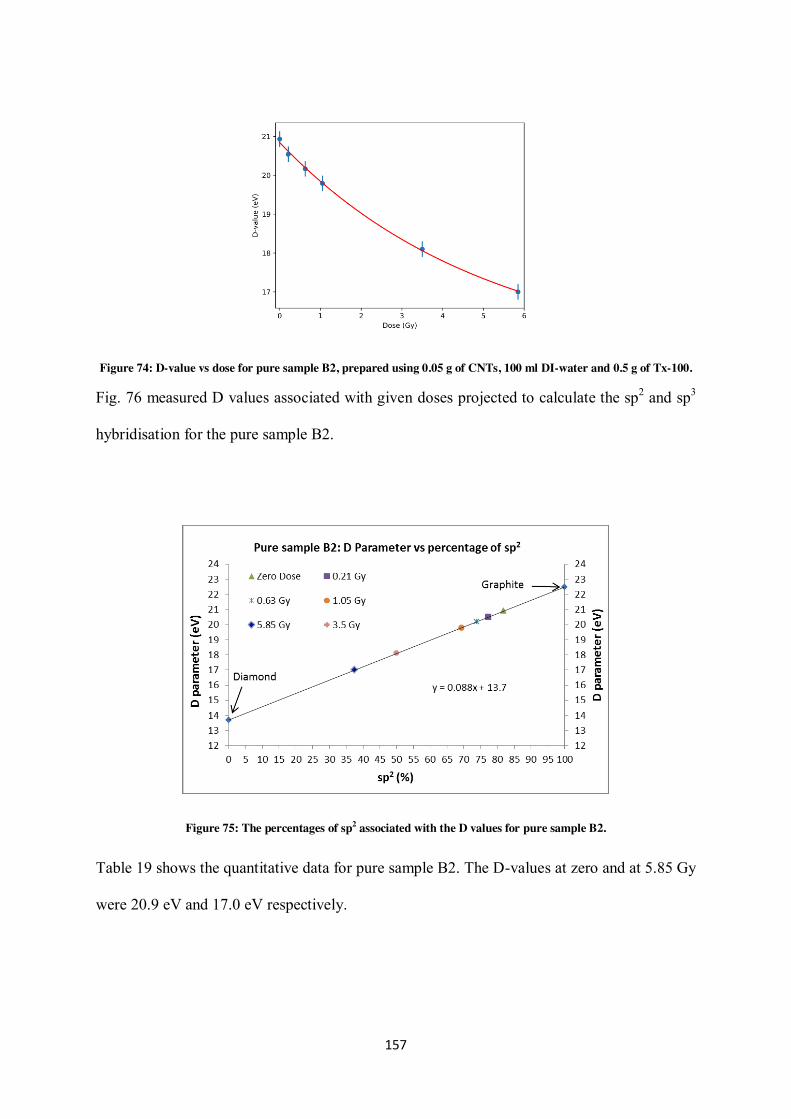
157
Figure 74: D-value vs dose for pure sample B2, prepared using 0.05 g of CNTs, 100 ml DI-water and 0.5 g of Tx-100.
Fig. 76 measured D values associated with given doses projected to calculate the sp2 and sp3
hybridisation for the pure sample B2.
Figure 75: The percentages of sp2 associated with the D values for pure sample B2.
Table 19 shows the quantitative data for pure sample B2. The D-values at zero and at 5.85 Gy
were 20.9 eV and 17.0 eV respectively.
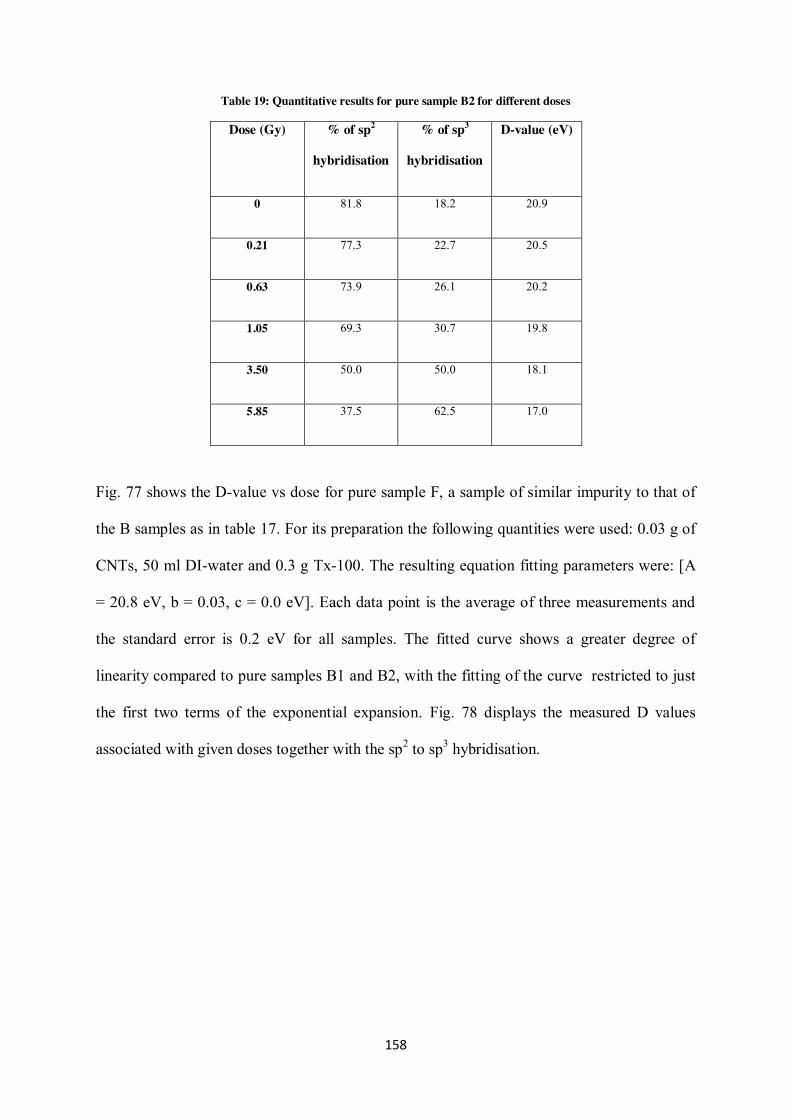
158
Table 19: Quantitative results for pure sample B2 for different doses
Dose (Gy) % of sp2
hybridisation
% of sp3
hybridisation
D-value (eV)
0 81.8 18.2 20.9
0.21 77.3 22.7 20.5
0.63 73.9 26.1 20.2
1.05 69.3 30.7 19.8
3.50 50.0 50.0 18.1
5.85 37.5 62.5 17.0
Fig. 77 shows the D-value vs dose for pure sample F, a sample of similar impurity to that of
the B samples as in table 17. For its preparation the following quantities were used: 0.03 g of
CNTs, 50 ml DI-water and 0.3 g Tx-100. The resulting equation fitting parameters were: [A
= 20.8 eV, b = 0.03, c = 0.0 eV]. Each data point is the average of three measurements and
the standard error is 0.2 eV for all samples. The fitted curve shows a greater degree of
linearity compared to pure samples B1 and B2, with the fitting of the curve restricted to just
the first two terms of the exponential expansion. Fig. 78 displays the measured D values
associated with given doses together with the sp2 to sp3 hybridisation.
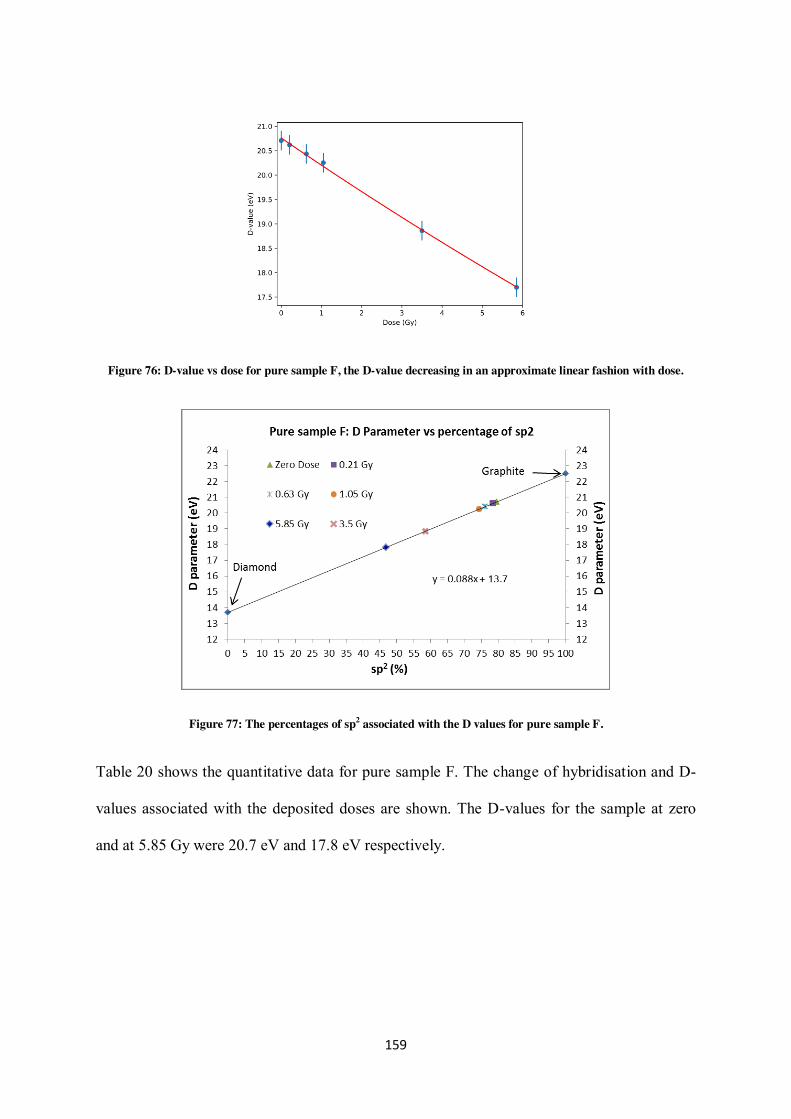
159
Figure 76: D-value vs dose for pure sample F, the D-value decreasing in an approximate linear fashion with dose.
Figure 77: The percentages of sp2 associated with the D values for pure sample F.
Table 20 shows the quantitative data for pure sample F. The change of hybridisation and D-
values associated with the deposited doses are shown. The D-values for the sample at zero
and at 5.85 Gy were 20.7 eV and 17.8 eV respectively.
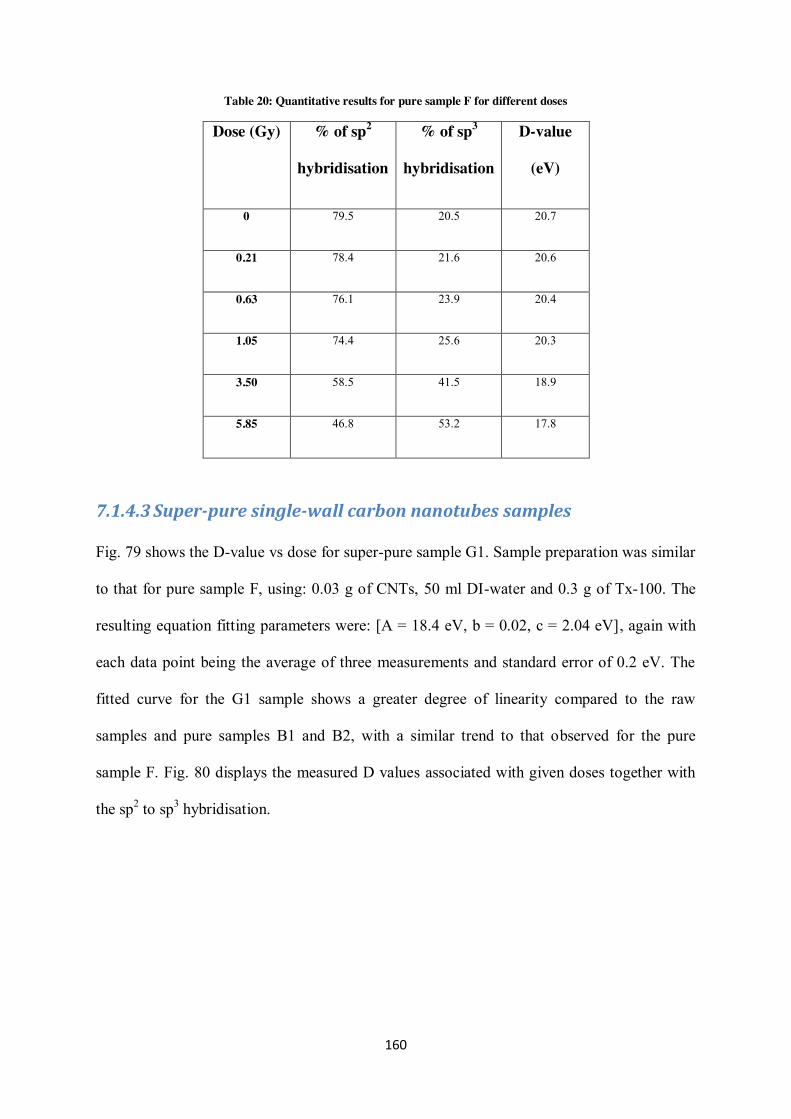
160
Table 20: Quantitative results for pure sample F for different doses
Dose (Gy) % of sp2
hybridisation
% of sp3
hybridisation
D-value
(eV)
0 79.5 20.5 20.7
0.21 78.4 21.6 20.6
0.63 76.1 23.9 20.4
1.05 74.4 25.6 20.3
3.50 58.5 41.5 18.9
5.85 46.8 53.2 17.8
7.1.4.3 Super-pure single-wall carbon nanotubes samples
Fig. 79 shows the D-value vs dose for super-pure sample G1. Sample preparation was similar
to that for pure sample F, using: 0.03 g of CNTs, 50 ml DI-water and 0.3 g of Tx-100. The
resulting equation fitting parameters were: [A = 18.4 eV, b = 0.02, c = 2.04 eV], again with
each data point being the average of three measurements and standard error of 0.2 eV. The
fitted curve for the G1 sample shows a greater degree of linearity compared to the raw
samples and pure samples B1 and B2, with a similar trend to that observed for the pure
sample F. Fig. 80 displays the measured D values associated with given doses together with
the sp2 to sp3 hybridisation.
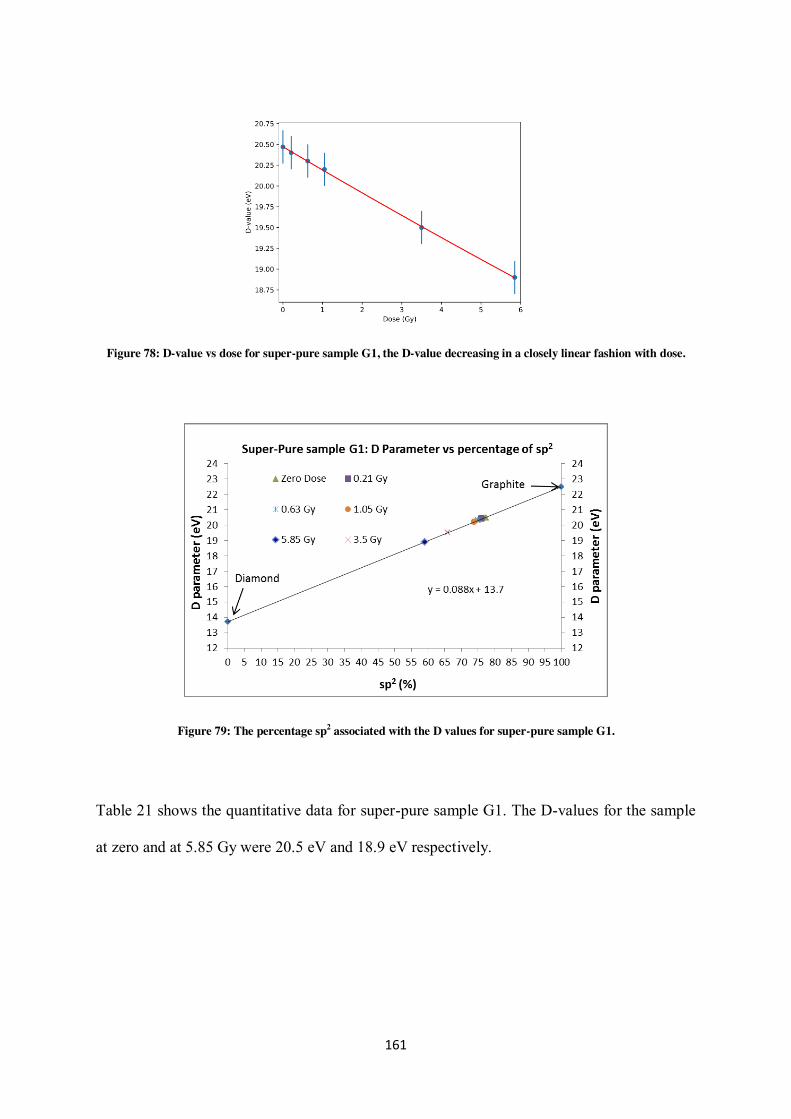
161
Figure 78: D-value vs dose for super-pure sample G1, the D-value decreasing in a closely linear fashion with dose.
Figure 79: The percentage sp2 associated with the D values for super-pure sample G1.
Table 21 shows the quantitative data for super-pure sample G1. The D-values for the sample
at zero and at 5.85 Gy were 20.5 eV and 18.9 eV respectively.
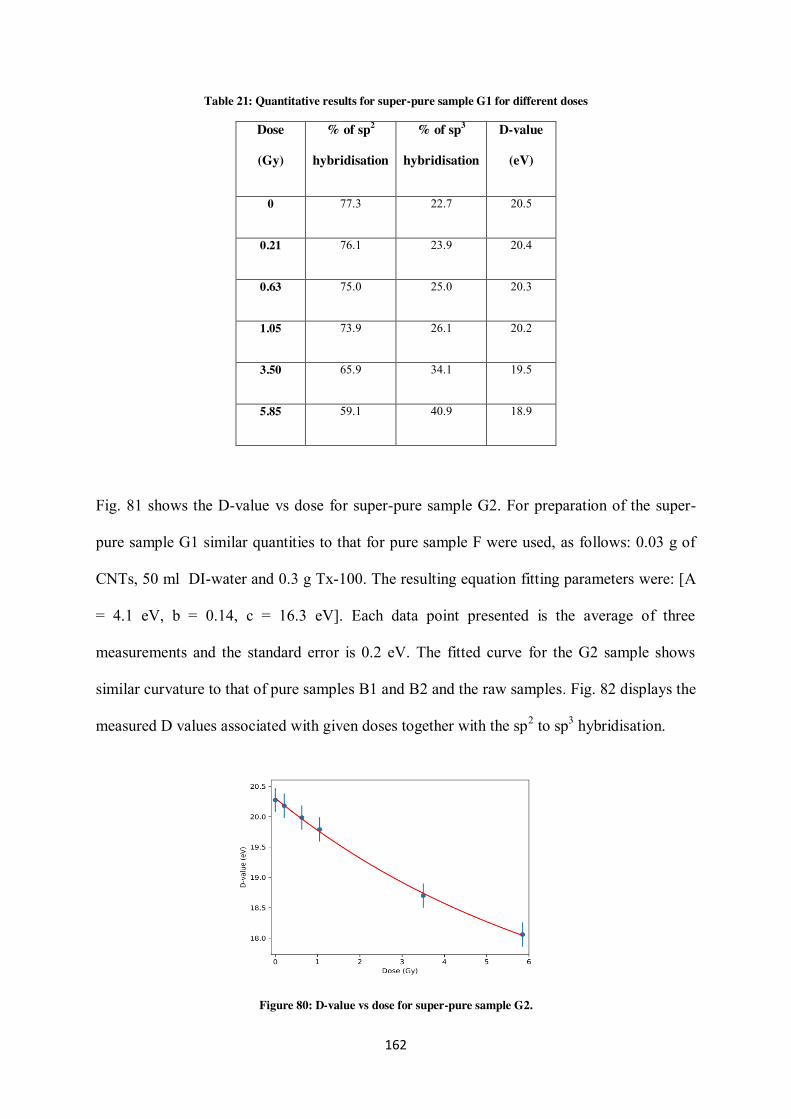
162
Table 21: Quantitative results for super-pure sample G1 for different doses
Dose
(Gy)
% of sp2
hybridisation
% of sp3
hybridisation
D-value
(eV)
0 77.3 22.7 20.5
0.21 76.1 23.9 20.4
0.63 75.0 25.0 20.3
1.05 73.9 26.1 20.2
3.50 65.9 34.1 19.5
5.85 59.1 40.9 18.9
Fig. 81 shows the D-value vs dose for super-pure sample G2. For preparation of the super-
pure sample G1 similar quantities to that for pure sample F were used, as follows: 0.03 g of
CNTs, 50 ml DI-water and 0.3 g Tx-100. The resulting equation fitting parameters were: [A
= 4.1 eV, b = 0.14, c = 16.3 eV]. Each data point presented is the average of three
measurements and the standard error is 0.2 eV. The fitted curve for the G2 sample shows
similar curvature to that of pure samples B1 and B2 and the raw samples. Fig. 82 displays the
measured D values associated with given doses together with the sp2 to sp3 hybridisation.
Figure 80: D-value vs dose for super-pure sample G2.
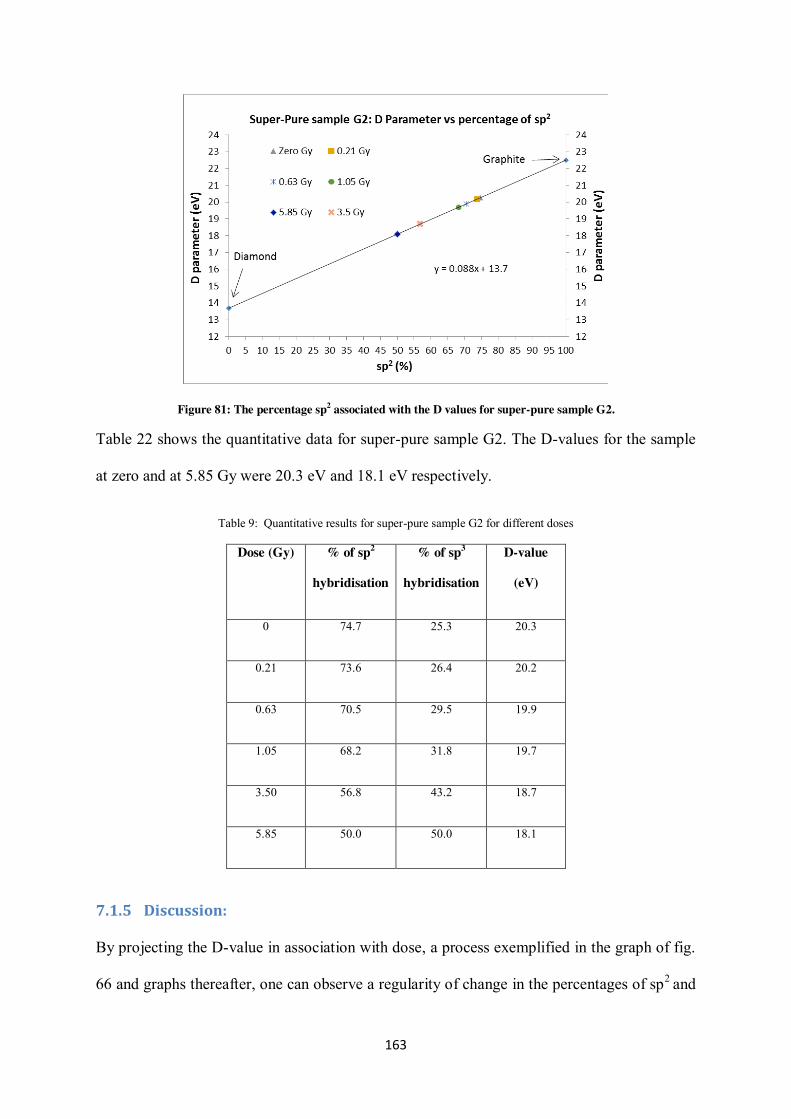
163
Figure 81: The percentage sp2 associated with the D values for super-pure sample G2.
Table 22 shows the quantitative data for super-pure sample G2. The D-values for the sample
at zero and at 5.85 Gy were 20.3 eV and 18.1 eV respectively.
Table 9: Quantitative results for super-pure sample G2 for different doses
Dose (Gy) % of sp2
hybridisation
% of sp3
hybridisation
D-value
(eV)
0 74.7 25.3 20.3
0.21 73.6 26.4 20.2
0.63 70.5 29.5 19.9
1.05 68.2 31.8 19.7
3.50 56.8 43.2 18.7
5.85 50.0 50.0 18.1
7.1.5 Discussion:
By projecting the D-value in association with dose, a process exemplified in the graph of fig.
66 and graphs thereafter, one can observe a regularity of change in the percentages of sp2 and
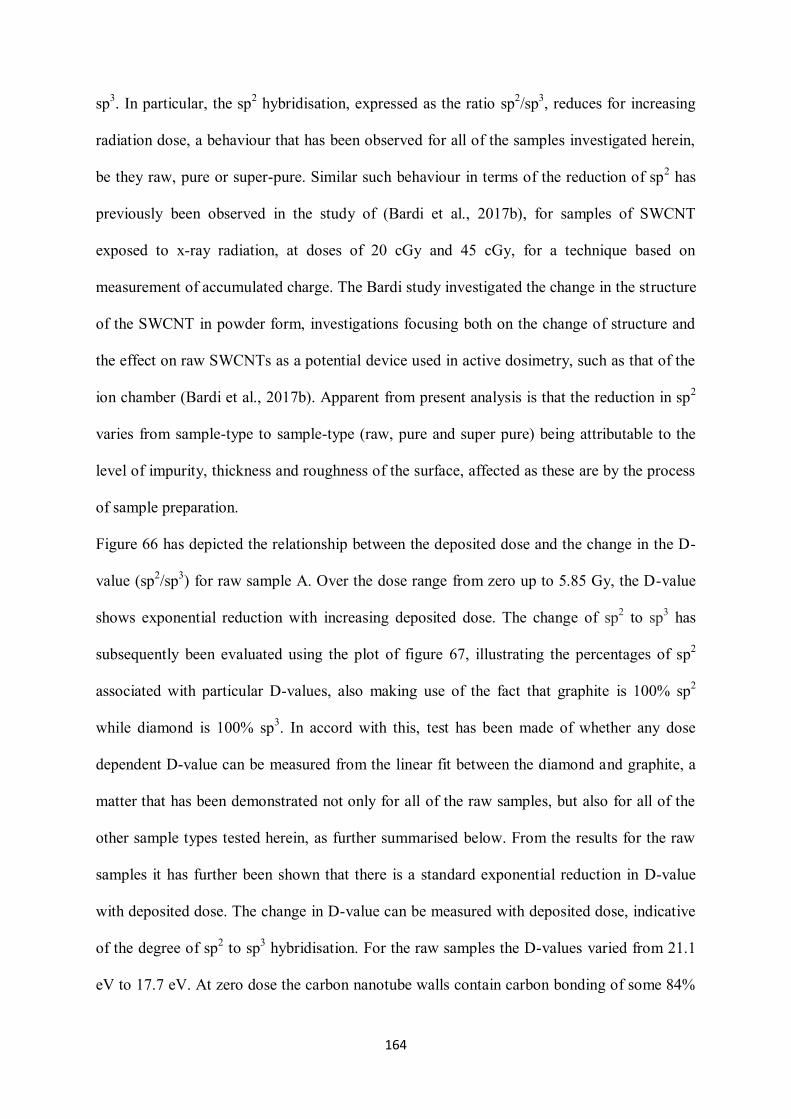
164
sp3. In particular, the sp2 hybridisation, expressed as the ratio sp2/sp3, reduces for increasing
radiation dose, a behaviour that has been observed for all of the samples investigated herein,
be they raw, pure or super-pure. Similar such behaviour in terms of the reduction of sp2 has
previously been observed in the study of (Bardi et al., 2017b), for samples of SWCNT
exposed to x-ray radiation, at doses of 20 cGy and 45 cGy, for a technique based on
measurement of accumulated charge. The Bardi study investigated the change in the structure
of the SWCNT in powder form, investigations focusing both on the change of structure and
the effect on raw SWCNTs as a potential device used in active dosimetry, such as that of the
ion chamber (Bardi et al., 2017b). Apparent from present analysis is that the reduction in sp2
varies from sample-type to sample-type (raw, pure and super pure) being attributable to the
level of impurity, thickness and roughness of the surface, affected as these are by the process
of sample preparation.
Figure 66 has depicted the relationship between the deposited dose and the change in the D-
value (sp2/sp3) for raw sample A. Over the dose range from zero up to 5.85 Gy, the D-value
shows exponential reduction with increasing deposited dose. The change of sp2 to sp3 has
subsequently been evaluated using the plot of figure 67, illustrating the percentages of sp2
associated with particular D-values, also making use of the fact that graphite is 100% sp2
while diamond is 100% sp3. In accord with this, test has been made of whether any dose
dependent D-value can be measured from the linear fit between the diamond and graphite, a
matter that has been demonstrated not only for all of the raw samples, but also for all of the
other sample types tested herein, as further summarised below. From the results for the raw
samples it has further been shown that there is a standard exponential reduction in D-value
with deposited dose. The change in D-value can be measured with deposited dose, indicative
of the degree of sp2 to sp3 hybridisation. For the raw samples the D-values varied from 21.1
eV to 17.7 eV. At zero dose the carbon nanotube walls contain carbon bonding of some 84%
165
sp2 and 16% sp3 hybridisation. Depositing 0.21 Gy of beta particle dose is seen to lead to a
reduction of sp2 from 84% to ~ 80% and enhancement of sp3 to 20%.
When comparing the raw sample dose-dependent D-value curves against those for the pure
and super-pure samples, with increasing purity it can be seen that the curves trend towards a
more linear dependency. This phenomenon, attributed to the impurities in the raw samples,
accords with the EDX analysis (see 6.1.3.2), showing that the raw samples have greater
amounts of iron in them than the pure and super-pure, at 17.2%, 11.7% and 7.6%
respectively.
For graphite, the lowest energy required for carbon atom displacement, on the c-axis
direction, was found by (Banhart et al., 1997) to be 15-20 eV. Another study suggests the
threshold energy required for carbon atom displacement in graphite 15-17 eV
(Krasheninnikov and Nordlund 2004). Yet another threshold value for carbon atom
displacement for SWCNT was reported to be 16.9 eV (Cress et al., 2010b). Simmons
reported the value to be 25 eV in neutron damaged graphite, cited in (Marsden 1996).
Conversely, for diamond, another form of carbon, the displacement threshold has been
reported to be 30-48 eV (Bourgoin and Massarani 1976) (Koike et al., 1992). Thus said,
graphite is formed from two different chemical bonds on each plane, a van der Waals bonds
that links the basal planes and covalent bonds that work within the planes; Banhart has
subsequently pointed out that SWCNTs are the smallest graphite-based structure, their
specific geometry allowing them to be unaffected by van der Waals forces (Banhart 1999).
From these studies in graphite it has been estimated by the group of Banhart that the
threshold energy required to displace a carbon atom in the walls of the SWCNTs is in the
range 15-20 eV, estimated assuming the lack of van der Waals bonds between the graphite
layers in the SWCNTs (see fig. 83). Such atomic displacement can be expected when the beta
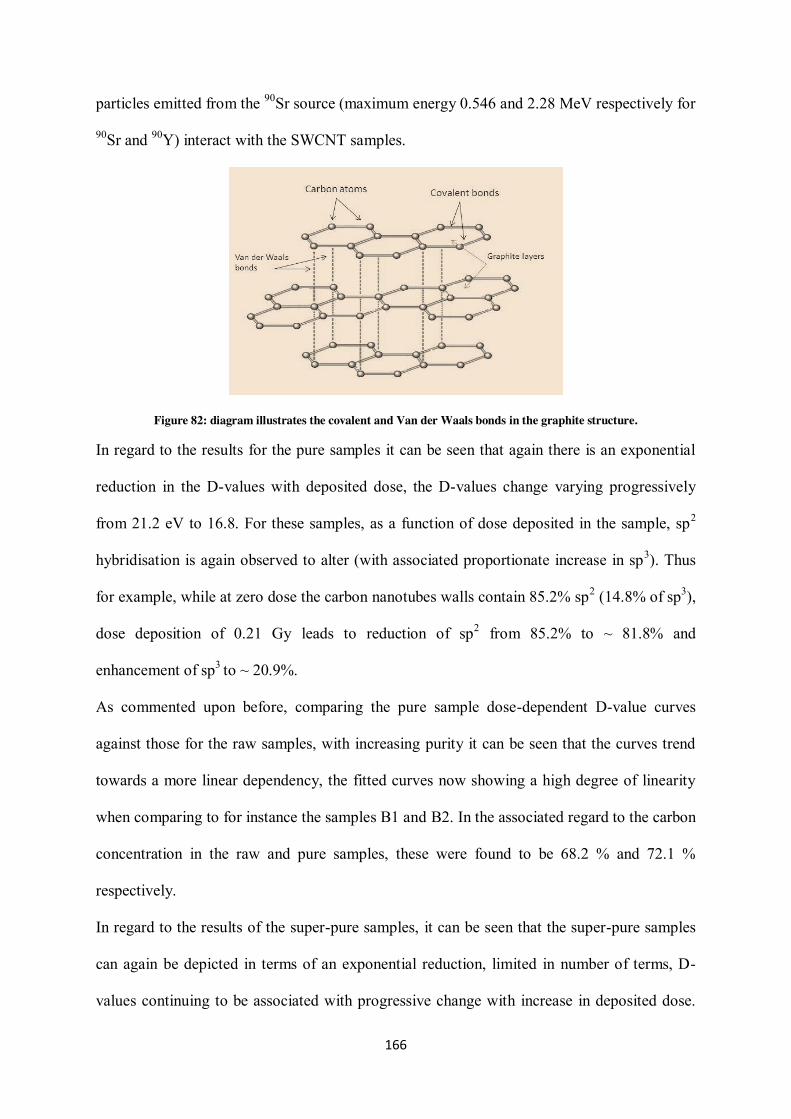
166
particles emitted from the 90Sr source (maximum energy 0.546 and 2.28 MeV respectively for
90Sr and 90Y) interact with the SWCNT samples.
Figure 82: diagram illustrates the covalent and Van der Waals bonds in the graphite structure.
In regard to the results for the pure samples it can be seen that again there is an exponential
reduction in the D-values with deposited dose, the D-values change varying progressively
from 21.2 eV to 16.8. For these samples, as a function of dose deposited in the sample, sp2
hybridisation is again observed to alter (with associated proportionate increase in sp3). Thus
for example, while at zero dose the carbon nanotubes walls contain 85.2% sp2 (14.8% of sp3),
dose deposition of 0.21 Gy leads to reduction of sp2 from 85.2% to ~ 81.8% and
enhancement of sp3 to ~ 20.9%.
As commented upon before, comparing the pure sample dose-dependent D-value curves
against those for the raw samples, with increasing purity it can be seen that the curves trend
towards a more linear dependency, the fitted curves now showing a high degree of linearity
when comparing to for instance the samples B1 and B2. In the associated regard to the carbon
concentration in the raw and pure samples, these were found to be 68.2 % and 72.1 %
respectively.
In regard to the results of the super-pure samples, it can be seen that the super-pure samples
can again be depicted in terms of an exponential reduction, limited in number of terms, D-
values continuing to be associated with progressive change with increase in deposited dose.
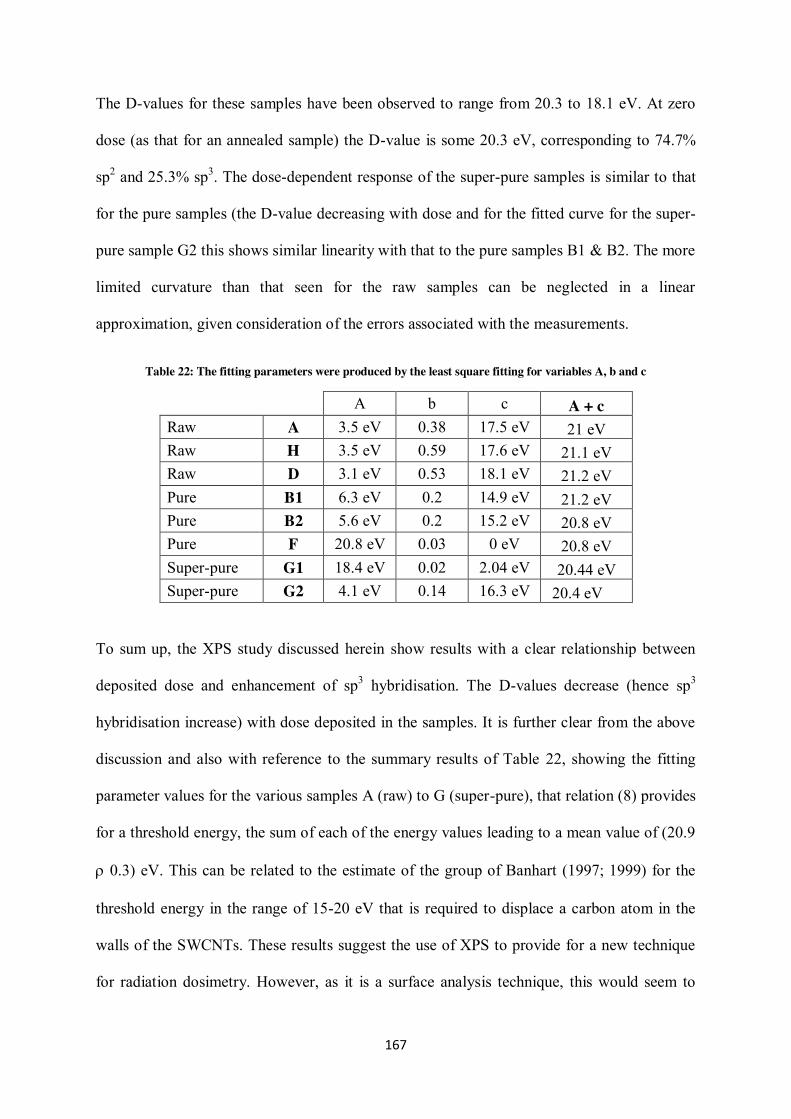
167
The D-values for these samples have been observed to range from 20.3 to 18.1 eV. At zero
dose (as that for an annealed sample) the D-value is some 20.3 eV, corresponding to 74.7%
sp2 and 25.3% sp3. The dose-dependent response of the super-pure samples is similar to that
for the pure samples (the D-value decreasing with dose and for the fitted curve for the super-
pure sample G2 this shows similar linearity with that to the pure samples B1 & B2. The more
limited curvature than that seen for the raw samples can be neglected in a linear
approximation, given consideration of the errors associated with the measurements.
Table 22: The fitting parameters were produced by the least square fitting for variables A, b and c
A b c A + c Raw A 3.5 eV 0.38 17.5 eV 21 eV Raw H 3.5 eV 0.59 17.6 eV 21.1 eV Raw D 3.1 eV 0.53 18.1 eV 21.2 eV Pure B1 6.3 eV 0.2 14.9 eV 21.2 eV Pure B2 5.6 eV 0.2 15.2 eV 20.8 eV Pure F 20.8 eV 0.03 0 eV 20.8 eV Super-pure G1 18.4 eV 0.02 2.04 eV 20.44 eV Super-pure G2 4.1 eV 0.14 16.3 eV 20.4 eV
To sum up, the XPS study discussed herein show results with a clear relationship between
deposited dose and enhancement of sp3 hybridisation. The D-values decrease (hence sp3
hybridisation increase) with dose deposited in the samples. It is further clear from the above
discussion and also with reference to the summary results of Table 22, showing the fitting
parameter values for the various samples A (raw) to G (super-pure), that relation (8) provides
for a threshold energy, the sum of each of the energy values leading to a mean value of (20.9
r 0.3) eV. This can be related to the estimate of the group of Banhart (1997; 1999) for the
threshold energy in the range of 15-20 eV that is required to displace a carbon atom in the
walls of the SWCNTs. These results suggest the use of XPS to provide for a new technique
for radiation dosimetry. However, as it is a surface analysis technique, this would seem to
168
limit the application to relatively low penetration radiation, potentially including alpha (for
ultra-thin CNTs) and beta particles and low-energy photons. Thus said, the limitation points
to considerable potential for the use of this novel soft tissue equivalent technique in
estimating skin dose in personal dosimetry (noting that the previous work of Bardi (2017) has
shown measurable effects at mGy levels) and when electrons or ions are used to treat
superficial tumours.
169
Chapter 8
8 Conclusion
In its practice, radiotherapy, one of the major methods of cancer treatment, targets the
cancerous cells with deposition of high/low-energy ionization radiation whilst seeking to
minimize dose to the surrounding healthy tissue. Numerous methods and techniques have
been introduced to control the dose distribution and minimize the dose to the surrounding
healthy tissue, including IMRT (Intensity Modulated Radiation Therapy), IGRT (Image
Guided Radiation Therapy), and heavy ion radiation. Generally, all radiotherapy treatment
techniques are associated with and dependent on the performance of the radiation dosimetry
system. In other words, dose delivery requires the support of a precise and accurate means of
radiation dosimetry. For example, the small radiation beam produced by the IMRT technique
requires a dosimetry system that is small in size (submillimetre) and of large dynamic range
in order to verify the precision and accuracy of the delivered dose to the target. There has
been much in the way of research to develop radiation dosimetry systems that meets Bragg-
Gray cavity theory requirements, while less effort has been paid for example in providing for
a bone-tissue equivalent dosimetric medium that satisfies the theory. This research have
sought to provide for both soft and calciferous tissues, developing novel passive dosimetry
materials that meet the challenge of providing soft tissue and bone equivalent materials. The
novelty within current research lies in studies on proton dosimetry and neutron dosimetry
(using doped silica materials for TL investigations) and electron dosimetry (using carbon
nanotubes for TL and XPS-based investigations). Optical fibres with a diameter of 126 µm
have been used to determine the dose for proton and neutrons at therapeutic energies, while
SWCNTs (single-wall carbon nanotubes) in the form of buckypaper (with thickness ranging
from ~ 10- to ~ 100 µm) have been developed along with a new technique, that of XPS, for
170
dosimetry. It must be noted that this method has not been previously used and the study
herein has therefore sought to characterise the various aspects needed in development of the
methodology.
With regards to protons, two situations were examined in the use of commercially available
Ge-doped silica fibres. The first situation was a modulated proton beam, wherein the depth-
dose profile was measured for a 62 MeV proton beam at high spatial resolution (0.1mm).
Such resolution for point dose measurement is unsurpassed, as recorded in the various
sources of literature, underlining the potential importance of the use of this proposed method.
For an unmodulated beam, a similar methodology to that for the modulated beam was applied
and showed similar capability for this material in providing for the high spatial resolution
demands of a modern radiation therapy beam. This application could also be adopted to help
determine the depth-dose profile for other types of radiation therapy beams. Moreover, for
heavy charged-particles previous literature has drawn attention to the commonly shared issue
of there being a quenching effect that results from the increasing ionization density of the
radiation field in the Bragg peak region. Judging from the obtained results for the silica fibres
it has been evident that single exposures to a continuous collection of fibres aligned in a row
can provide data profiles that accord well with expectation, saving a considerable amount of
time when compared to point-by-point measurements of a parallel plate ionization chamber.
In addition, the irradiated fibres with variations of up to 10% provide analogous performance
to well established methods such as that of the LiF:Mg, Ti (TLD-100) phosphor-based
medium. To sum up, one can conclude that the now established optical fibre method gives
access to very high spatial resolution measurements, also offering high dynamic range, and is
highly competitive to gold-standard methods such as the parallel plate ionization chambers.
171
Over and above rapid changes in dose-rate as above, previous Surrey scholars have also
emphasized the significance of small size detectors with regard to challenging radiation field
dimensions, this also being realised through investigations illustrating the effectiveness of
glass (silica) bead dosimeters for applications in radiation dosimetry. Extending beyond this,
a similar study to that carried out using protons was adopted to explore the depth-dose
distributions for an Americium-Beryllium (241Am-Be) neutron source placed in a water tank.
The silica beads used have a diameter of 1 mm, offering the highest spatial resolution neutron
detection method to-date. The results achieved through use of such high-density spatially-
resolved detection of neutrons point to general agreement in shape with that obtained using
Monte Carlo simulation. However, going beyond this, the exceptional spatial resolution has
also discerned fine resolution spikes in intensity that have previously not been documented in
the literature, a matter that clearly invites further investigation.
The afore-mentioned work concentrated on silica-based media (optical fibres and glass
beads) modeling effective atomic numbers closely equivalent to human tissue, in particular
calcified tissues. The following discussion summarizes findings on the effects of electrons
(beta particles) on the soft tissue equivalent material provided by single-wall carbon
nanotubes (SWCNTs) in the form of free-standing buckypaper (with thicknesses down to that
of human cells a10 µm). Different purity samples of single-wall carbon nanotubes, raw, pure
and super pure were exposed to a strontium-90 source, allowing delivery of various doses to
the samples, as follows: 0.21, 0.63, 1.05, 3.5 and 5.85 Gy. The first method explored was the
conventional thermoluminescence technique, the SWCNT buckypaper showing a TL
response that is proportional to the deposited doses. This line of investigation then progressed
to that of investigation of the effect of radiation (in this case beta particles) on the structure of
172
SWCNTs. The X-ray photoelectron spectroscopy technique (XPS) was used to study the
bonding orbitals in the lattice between the atoms of the carbon nanotubes.
In regard to the above, the XPS technique was applied to the various samples before and
post-irradiation, it becoming evident that this approach provides an alternative technique to
that of TL, representing a novel dosimetric method, with the change in carbon orbital bonding
from sp2 to sp3 (referred to as hybridization) investigated by the XPS. The change of the
hybridization in the orbitals was found to increase exponentially with dose, whereby sp2
decreases and sp3 increases. Further apparent has been that reduction in sp2 varies from
sample-type to sample-type, being attributable to the level of impurity (raw, pure and super-
pure), thickness and roughness of the surface, all being factors that affect the sample as these
are introduced in the process of preparation. The XPS study has shown a clear relationship to
exist between the projected dose and enhancement of sp3 orbital hybridisation. The findings
concern a surface analysis technique, the investigations currently being limited to low
penetration radiations, beta particles specifically, although it is thought to also be applicable
to alpha particles, heavy ions and low-energy photons. Thus said, the limitation indicates
substantial potential for the use of this innovative soft tissue equivalent technique in
providing accurate estimates for skin dose in personal dosimetry and when electrons/ions are
used to treat superficial tumours.
8.1 Future Work
The work performed in this thesis has the potential to be enhanced through further study of
the following issues:
1. The buckypaper samples used in present study were developed at the University of
Surrey using different impurities of carbon nanotubes in the form of powder, the
173
methods of preparation being altered to obtain different thicknesses for different
levels of impurity (raw, pure and super-pure CNTs). The methods of preparation
resulted in non-homogeneous samples and it might be expected that having
homogeneous samples would improve the quality of results. While this might be
solved by following a number of techniques that have been suggested in the literature,
the purchase of commercially available samples could be more effective, not least
saving money and time. Additionally, the purchase of samples from reputable
producers and suppliers is surely important in allowing other researchers to obtain the
same materials, semiconducting carbon nanotubes and metallic like SWCNTs being
certainly available in the market, allowing conduct of similar studies and examination
of the performance of different impurities. The thickness of the buckypaper samples
needs to be considered when purchasing these semiconductors or metallic like
samples. It might be useful to obtain samples with thickness in the micrometer range.
2. In highly preliminary work, carried out by the present investigator, a shift from sp2 to
sp3 in orbital hybridization was witnessed in study of car-engine polymer coated
wires. The wires were examined pre and post irradiation through use of the XPS
technique. Thus, further investigations are needed to verify the change in
hybridizations of the orbitals in such materials.
3. During a study of the neutron depth-dose distribution using glass beads, samples of
SWCNTs buckypaper were also irradiated and a TL signal was observed. Detailed
investigations should now be performed, also examining the structural effects on
SWCNTs resulting from neutron irradiation. It may be noted that the effect of
neutrons on graphite in power reactor systems suggest that such investigation using
the XPS dosimetry technique could be important. Here it is worth mentioning that the
degradation of a number of graphite properties has been noted to change
174
exponentially, being in line with that observed in regard to the shift of sp2 to sp3 in
this research.
4. Research is currently in progress to understand radiation damage on carbon nanotubes
using Raman microspectrometry technique, a facility that is widely available. While
it is not suggested that the technique is preferable to study of sp2 to sp3 hybridization,
however it could give other structural information which could enhance the finding of
the XPS technique and help explain the cause of these shifts in the orbital
hybridization.
In the above, the research has somewhat widened the possible applications, the observed
exponential change in SWCNTs in regard to bonding also having been described in the
degradation of graphite properties that result from neutrons emitted by nuclear reactors. It is
believed that this points to potentially exciting prospects for XPS dosimetry study of graphite
moderators in power reactor systems. Also of pertinence is XPS dosimetry study of car-
engine polymer coated wires that are cross-linked by high dose electron irradiation (a a few
hundred kGy) in order to withstand the elevated temperatures that such wiring will be
exposed to over periods of many years. In both of these industrial applications, the medium
under irradiation would become its own dosimeter, in the case of the polymer coatings
leading to inherent self-validation of dose, an ultimate target in quality assurance terms.
Finally, one other extension to present studies would be examination of spectral changes in
use of Raman microspectrometry, and with this possibility of using a technique that is
currently more widely available than access to XPS systems. In the wider terms, such
investigations might also be expected to have important biomedical consequences, being
matters that have yet to be understood.
175
9 References
Abdul Sani, S., Grime, G., Palitsin, V., Mahdiraji, G.A., Abdul Rashid, H., Maah, M. & Bradley, D. 2015, "Micro‐PIXE analysis of doped SiO2 fibres intended as TL dosimeters for radiation measurements", X‐Ray Spectrometry, vol. 44, no. 2, pp. 33-40.
Abdulla, Y., Amin, Y. & Bradley, D. 2001, "The effect of dose and annealing on TL sensitivity of germanium and erbium doped optical fibres", J.Fiz.Malaysia, vol. 22, no. 3/4, pp. 49-53.
Abdulla, Y.A., Amin, Y. & Bradley, D. 2001, "The thermoluminescence response of Ge-doped optical fibre subjected to photon irradiation", Radiation Physics and Chemistry, vol. 61, no. 3, pp. 409-410.
Acquah, G.E., Via, B.K., Fasina, O.O., Adhikari, S., Billor, N. & Eckhardt, L.G. 2017, "Chemometric modeling of thermogravimetric data for the compositional analysis of forest biomass", PloS one, vol. 12, no. 3, pp. e0172999.
ACS 2015, 2015-last update, What is radiation therapy? When is it used? [Homepage of American Cancer Society], [Online]. Available: https://www.cancer.org/treatment/treatments-and-side-effects/treatment- ypes/radiation/radiation-therapy-guide/what-is-radiation-therapy.html [2017, March/9].
Afanasyev-Charkin, I., Gritsyna, V., Cooke, D., Bennett, B., Evans, C., Hollander, M. & Sickafus, K. 1999, "Optical absorption and thermoluminescence of MgAl 2 O 4 spinel crystals implanted with Xe ions", Nuclear Instruments and Methods in Physics Research Section B: Beam Interactions with Materials and Atoms, vol. 148, no. 1, pp. 787-792.
Alalawi, A.I., Jafari, S., Najem, M., Alsaleh, W., Clark, C., Nisbet, A., Abolaban, F., Hugtenburg, R., Hussein, M. & Alzimami, K.S. 2014, "Preliminary investigations of two types of silica-based dosimeter for small-field radiotherapy", Radiation Physics and Chemistry, vol. 104, pp. 139-144.
Alawiah, A., Bauk, S., Marashdeh, M., Nazura, M., Abdul-Rashid, H., Yusoff, Z., Gieszczyk, W., Noramaliza, M., Adikan, F.M. & Mahdiraji, G. 2015, "The thermoluminescence glow curve and the deconvoluted glow peak characteristics of erbium doped silica fibre exposed to 70–130kVp x-rays", Applied Radiation and Isotopes, vol. 104, pp. 197-202.
Amossov, A. & Rybaltovsky, A. 1994, "Oxygen-deficient centers in silica glasses: a review of their properties and structure", Journal of Non-Crystalline Solids, vol. 179, pp. 75-83.
n) sources", Nuclear Instruments and Methods, vol. 99, no. 2, pp. 231-235.
Arjmand, M., Chizari, K., Krause, B., Poetschke, P. & Sundararaj, U. 2016, "Effect of synthesis catalyst on structure of nitrogen-doped carbon nanotubes and electrical conductivity and electromagnetic interference shielding of their polymeric nanocomposites", Carbon, vol. 98, pp. 358-372.
Aryasomayajula, L. & Wolter, K. 2013, "Carbon nanotube composites for electronic packaging applications: a review", Journal of Nanotechnology, vol. 2013.
Aspradakis, M., Byrne, J., Palmans, H., Duane, S., Conway, J., Warrington, A. & Rosser, K. 2010, IPEM Report 103: Small field MV photon dosimetry, .
Attix, F.H. 1986, "Gamma‐and X‐Ray Interactions in Matter", Introduction to radiological physics and radiation dosimetry, pp. 124-159.
176
Avouris, P., Freitag, M. & Perebeinos, V. 2008, "Carbon-nanotube photonics and optoelectronics", Nature photonics, vol. 2, no. 6, pp. 341-350.
Azorín, J., Rivera, T., Furetta, C. & Sánchez-Rodríguez, A. 2005, "Ultraviolet induced thermoluminescence in gadolinium-doped zirconium oxide films", Materials Science ForumTrans Tech Publ, pp. 145.
Balasubramanian, K. & Burghard, M. 2006, "Biosensors based on carbon nanotubes", Analytical and bioanalytical chemistry, vol. 385, no. 3, pp. 452-468.
Banhart, F., Füller, T., Redlich, P. & Ajayan, P. 1997, "The formation, annealing and self-compression of carbon onions under electron irradiation", Chemical Physics Letters, vol. 269, no. 3-4, pp. 349-355.
Banhart, F. 1999, "Irradiation effects in carbon nanostructures", Reports on progress in physics, vol. 62, no. 8, pp. 1181.
Bardi, N., Jurewicz, I., King, A., Alkhorayef, M., Bradley, D. & Dalton, A. 2017, "X-ray irradiation-induced structural changes on Single Wall Carbon Nanotubes", Radiation Physics and Chemistry, .
Bardi, N., Jurewicz, I., King, A., Alkhorayef, M., Bradley, D. & Dalton, A. 2017, "X-ray irradiation-induced structural changes on Single Wall Carbon Nanotubes", Radiation Physics and Chemistry, .
Beamson, G. & Briggs, D. 1992, High resolution XPS of organic polymers, Wiley.
Beddar, A., Kinsella, K., Ikhlef, A. & Sibata, C. 2001, "A miniature" scintillator-fibreoptic-PMT" detector system for the dosimetry of small fields in stereotactic radiosurgery", IEEE Transactions on Nuclear Science, vol. 48, no. 3, pp. 924-928.
Beddar, A., Mackie, T. & Attix, F. 1992, "Water-equivalent plastic scintillation detectors for high-energy beam dosimetry: I. Physical characteristics and theoretical considerations", Physics in Medicine and Biology, vol. 37, no. 10, pp. 1883.
Begum, M., Rahman, A.M., Abdul-Rashid, H., Yusoff, Z., Begum, M., Mat-Sharif, K., Amin, Y. & Bradley, D. 2015, "Thermoluminescence characteristics of Ge-doped optical fibres with different dimensions for radiation dosimetry", Applied Radiation and Isotopes, vol. 100, pp. 79-83.
Benabdesselam, M., Mady, F., Girard, S., Mebrouk, Y., Duchez, J.B., Gaillardin, M. & Paillet, P. 2013, "Performance of Ge-doped optical fibre as a thermoluminescent dosimeter", IEEE Transactions on Nuclear Science, vol. 60, no. 6, pp. 4251-4256.
Benevides, L.A. & Hintenlang, D.E. 2006, "Characterization of metal oxide semiconductor field effect transistor dosimeters for application in clinical mammography", Medical physics, vol. 33, no. 2, pp. 514-520.
Berg, A., Wieland, M., Naumann, J. & Jaekel, O. 2013, "High resolution dosimetry in monoenergetic proton beam therapy on a normoxic polymer gel: the importance of high spatial resolution for reduced Bragg-Peak-quenching", Journal of Physics: Conference SeriesIOP Publishing, pp. 012054.
Berger, M.J., Coursey, J.S., Zucker, M.A. & and Chang, J. 2011, , Stopping-Power and Range Tables for Electrons, Protons, and Helium Ions. Available: http://physics.nist.gov/PhysRefData/Star/Text/ESTAR.html [2014, 09/24].
Bjärngard, B., Tsai, J. & Rice, R. 1990, "Doses on the central axes of narrow 6‐MV x‐ray beams", Medical physics, vol. 17, no. 5, pp. 794-799.
177
Bogush, G., Tracy, M. & Zukoski, C. 1988, "Preparation of monodisperse silica particles: control of size and mass fraction", Journal of Non-Crystalline Solids, vol. 104, no. 1, pp. 95-106.
Bonard, J., Stöckli, T., Maier, F., de Heer, W.A., Châtelain, A., Salvetat, J. & Forró, L. 1998, "Field-emission-induced luminescence from carbon nanotubes", Physical Review Letters, vol. 81, no. 7, pp. 1441.
Bourgoin, J. & Massarani, B. 1976, "Threshold energy for atomic displacement in diamond", Physical Review B, vol. 14, no. 8, pp. 3690.
Bradley, D., Hugtenburg, R., Nisbet, A., Rahman, A.T.A., Issa, F., Noor, N.M. & Alalawi, A. 2012, "Review of doped silica glass optical fibre: their TL properties and potential applications in radiation therapy dosimetry", Applied Radiation and Isotopes, vol. 71, pp. 2-11.
Bradley, D., Jafari, S., Shafiqah, A.S., Tamcheck, N., Shutt, A., Rozaila, Z.S., Sani, S.A., Sabtu, S.N., Alanazi, A. & Mahdiraji, G.A. 2016, "Latest developments in silica-based thermoluminescence spectrometry and dosimetry", Applied Radiation and Isotopes, vol. 117, pp. 128-134.
Bradley, D., Sani, S.A., Shafiqah, A.S., Collins, S., Hugtenburg, R., Rashid, H.A., Zulkepely, N.N. & Maah, M. 2017, "Doped silica fibre thermoluminescence measurements of radiation dose in the use of 223 Ra ", Applied Radiation and Isotopes, vol. 16, no. 1, pp. 311-319.
Bradley, D.A., Sani, S.F.A., Alalawi, A.I., Jafari, S., Noor, N.M., Azhar, A.H., Mahdiraji, G.A., Tamchek, N., Ghosh, S. & Paul, M.C. 2014, "Development of tailor-made silica fibres for TL dosimetry", Radiation Physics and Chemistry, vol. 104, pp. 3-9.
Browne, E. 1997, "Nuclear data sheets for A= 90", Nuclear Data Sheets, vol. 82, no. 3, pp. 379-546.
Brualla-González, L., Gómez, F., Pombar, M. & Pardo-Montero, J. 2015, "Dose rate dependence of the PTW 60019 microDiamond detector in high dose-per-pulse pulsed beams", Physics in Medicine and Biology, vol. 61, no. 1, pp. N11.
Bruggmoser, G., Saum, R., Schmachtenberg, A., Schmid, F. & Schüle, E. 2006, "Determination of the recombination correction factor kS for some specific plane-parallel and cylindrical ionization chambers in pulsed photon and electron beams", Physics in Medicine and Biology, vol. 52, no. 2, pp. N35.
Brun, R. & Rademakers, F. 1997, "ROOT—an object oriented data analysis framework", Nuclear Instruments and Methods in Physics Research Section A: Accelerators, Spectrometers, Detectors and Associated Equipment, vol. 389, no. 1-2, pp. 81-86.
Carnicer, A., Ginjaume, M., Duch, M., Vanhavere, F., Merce, M.S., Baechler, S., Barth, I., Donadille, L., Ferrari, P. & Fulop, M. 2011, "The use of different types of thermoluminescent dosimeters to measure extremity doses in nuclear medicine", Radiation Measurements, vol. 46, no. 12, pp. 1835-1838.
Carvalho Junior, Álvaro Barbosa de, Guzzo, P.L., Sulasi, H.L. & Khoury, H.J. 2010, "Effect of particle size in the TL response of natural quartz sensitized by high dose of gamma radiation and heat-treatments", Materials Research, vol. 13, no. 2, pp. 265-271.
Chang, B.K. & Timmerman, R.D. 2007, "Stereotactic body radiation therapy: a comprehensive review", American journal of clinical oncology, vol. 30, no. 6, pp. 637-644.
Chen, L., Liu, C., Liu, K., Meng, C., Hu, C., Wang, J. & Fan, S. 2011, "High-performance, low-voltage, and easy-operable bending actuator based on aligned carbon nanotube/polymer composites", ACS nano, vol. 5, no. 3, pp. 1588-1593.
178
Chen, R. & Mckeever, S.W. 1997, Theory of Thermoluminescence and Related Phenomena. , World Scientific Publishing Co Pte Ltd.
Chiodini, N., Meinardi, F., Morazzoni, F., Paleari, A. & Scotti, R. 1999, "Optical transitions of paramagnetic Ge sites created by x-ray irradiation of oxygen-defect-free Ge-doped SiO 2 by the sol-gel method", Physical Review B, vol. 60, no. 4, pp. 2429.
Choi, W., Chung, D., Kang, J., Kim, H., Jin, Y., Han, I., Lee, Y., Jung, J., Lee, N. & Park, G. 1999, "Fully sealed, high-brightness carbon-nanotube field-emission display", Applied Physics Letters, vol. 75, no. 20, pp. 3129-3131.
Choudhary, V. & Gupta, A. 2011, "Polymer/carbon nanotube nanocomposites", .
Chruscinska, A., Przegietka, K., Szroeder, P., Oczkowski, H. & Rozploch, F. 2006, "Luminescence from beta-Irradiated Graphene Layers", ACTA PHYSICA POLONICA SERIES A, vol. 110, no. 1, pp. 71.
Clift, M., Johnston, P. & Webb, D. 2002, "A temporal method of avoiding the Cerenkov radiation generated in organic scintillator dosimeters by pulsed mega-voltage electron and photon beams", Physics in Medicine and Biology, vol. 47, no. 8, pp. 1421.
Clift, M., Sutton, R. & Webb, D. 2000, "Dealing with Cerenkov radiation generated in organic scintillator dosimeters by bremsstrahlung beams", Physics in Medicine and Biology, vol. 45, no. 5, pp. 1165.
Clough, R.L., Gillen, K.T. & Dole, M. 1991, "Radiation resistance of polymers and composites" in Irradiation effects on polymers.
Coelho, P.R., Da Silva, A.A. & Maiorino, J.R. 1989, "Neutron energy spectrum measurements of neutron sources with an NE-213 spectrometer", Nuclear Instruments and Methods in Physics Research Section A: Accelerators, Spectrometers, Detectors and Associated Equipment, vol. 280, no. 2-3, pp. 270-272.
Cress, C.D., Schauerman, C.M., Landi, B.J., Messenger, S.R., Raffaelle, R.P. & Walters, R.J. 2010, "Radiation effects in single-walled carbon nanotube papers", Journal of Applied Physics, vol. 107, no. 1, pp. 014316.
Dabbaghian, M., Babalou, A., Hadi, P. & Jannatdoust, E. 2010, "A parametric study of the synthesis of silica nanoparticles via sol-gel precipitation method", International Journal of Nanoscience and Nanotechnology, vol. 6, no. 2, pp. 104-113.
Delwiche, F.A. 2013, "Mapping the literature of radiation therapy", Journal of the Medical Library Association : JMLA, vol. 101, no. 2, pp. 120-127.
Devic, S. 2011, "Radiochromic film dosimetry: past, present, and future", Physica medica, vol. 27, no. 3, pp. 122-134.
Dianov, E., Starodubov, D., Vasiliev, S., Frolov, A. & Medvedkov, O. 1996, "Near-UV photosensitivity of germanosilicate glass: application for fibre grating fabrication", Lasers and Electro-Optics Society Annual Meeting, 1996. LEOS 96., IEEEIEEE, , pp. 374.
Dixon, R.L. & Ekstrand, K. 1982, "Silicon diode dosimetry", The International journal of applied radiation and isotopes, vol. 33, no. 11, pp. 1171-1176.
Eatemadi, A., Daraee, H., Karimkhanloo, H., Kouhi, M., Zarghami, N., Akbarzadeh, A., Abasi, M., Hanifehpour, Y. & Joo, S.W. 2014, "Carbon nanotubes: properties, synthesis, purification, and medical applications", Nanoscale research letters, vol. 9, no. 1, pp. 393-276X-9-393. eCollection 2014.
179
Evans, R.D. 1955, "The atomic nucleus".
Fadley, C. 2010, "X-ray photoelectron spectroscopy: Progress and perspectives", Journal of Electron Spectroscopy and Related Phenomena, vol. 178, pp. 2-32.
Fadzil, M.S.A., Min, U.N., Bradley, D.A. & Noor, N.M. 2017, "Different Germanium Dopant Concentration and the Thermoluminescence Characteristics of Flat Ge-Doped Optical Fibres", PERTANIKA JOURNAL OF SOCIAL SCIENCE AND HUMANITIES, vol. 25, no. 1, pp. 327-335.
Fisher, A., Hayes, W. & Stoneham, A. 1990, "Structure of the self-trapped exciton in quartz", Physical Review Letters, vol. 64, no. 22, pp. 2667.
Fowler, W.B. & Edwards, A. 1997, "Theory of defects and defect processes in silicon dioxide", Journal of Non-Crystalline Solids, vol. 222, pp. 33-41.
Francescon, P., Cora, S., Cavedon, C., Scalchi, P., Reccanello, S. & Colombo, F. 1998, "Use of a new type of radiochromic film, a new parallel‐plate micro‐chamber, MOSFETs, and TLD 800 microcubes in the dosimetry of small beams", Medical physics, vol. 25, no. 4, pp. 503-511.
Funaro, M., Sarno, M., Ciambelli, P., Altavilla, C. & Proto, A. 2013, "Real time radiation dosimeters based on vertically aligned multiwall carbon nanotubes and graphene", Nanotechnology, vol. 24, no. 7, pp. 075704.
Gabbott, P. 2008, Principles and applications of thermal analysis, John Wiley & Sons.
Ganguly, U., Kan, E.C. & Zhang, Y. 2005, "Carbon nanotube-based nonvolatile memory with charge storage in metal nanocrystals", Applied Physics Letters, vol. 87, no. 4, pp. 043108.
Gojny, F.H., Wichmann, M.H., Fiedler, B., Kinloch, I.A., Bauhofer, W., Windle, A.H. & Schulte, K. 2006, "Evaluation and identification of electrical and thermal conduction mechanisms in carbon nanotube/epoxy composites", Polymer, vol. 47, no. 6, pp. 2036-2045.
Gorji, B., Allahgholi Ghasri, M., Fazaeli, R. & Niksirat, N. 2012, "Synthesis and characterizations of silica nanoparticles by a new sol-gel method", Journal of Applied Chemical Research, vol. 6, no. 3, pp. 22-26.
Griscom, D.L. 1979, "E′ center in glassy Si O 2: Microwave saturation properties and confirmation of the primary Si 29 hyperfine structure", Physical Review B, vol. 20, no. 5, pp. 1823.
Hashim, S., Al-Ahbabi, S., Bradley, D., Webb, M., Jeynes, C., Ramli, A. & Wagiran, H. 2009, "The thermoluminescence response of doped SiO 2 optical fibres subjected to photon and electron irradiations", Applied Radiation and Isotopes, vol. 67, no. 3, pp. 423-427.
Hendee, W., Ibbott, G. & Hendee, E. (eds) 2005, Radition Therapy Physics, 3rd edn, WILEY, United State.
Hendricks, J., McKinney, G., Fensin, M., James, M., Johns, R., Durkee, J., Finch, J., Pelowitz, D., Waters, L. and Johnson, M. 2008, MCNPX Users Manual Version 2.6.0. , Technical Report LA-UR-08-2216 edn, Los Alamos National Laboratory.
Higgins, P.D., Sibata, C.H., Siskind, L. & Sohn, J.W. 1995, "Deconvolution of detector size effect for small field measurement", Medical physics, vol. 22, no. 10, pp. 1663-1666.
Hilonga, A., Kim, J., Sarawade, P.B., Quang, D.V., Shao, G., Elineema, G. & Kim, H.T. 2012, "Silver-doped silica powder with antibacterial properties", Powder Technology, vol. 215, pp. 219-222.
Hosono, H., Abe, Y., Kinser, D.L., Weeks, R.A., Muta, K. & Kawazoe, H. 1992, "Nature and origin of the 5-eV band in SiO 2: GeO 2 glasses", Physical Review B, vol. 46, no. 18, pp. 11445.
180
Hotta, F., Eguchi, H., Imai, S., Miyamoto, T., Mitamura-Aizawa, S. & Mitamura, Y. 2015, "Scanning Electron Microscopy Findings With Energy-Dispersive X-ray Investigations of Cosmetically Tinted Contact Lenses", Eye & contact lens, vol. 41, no. 5, pp. 291-296.
Hyer, D.E., Fisher, R.F. & Hintenlang, D.E. 2009, "Characterization of a water-equivalent fibre-optic coupled dosimeter for use in diagnostic radiology. ", Med. Phys., vol. 36, no. 5, pp. 1711-1716.
IAEA 2016, January, 2016-last update, Nuclear Sciences and Applications [Homepage of International Atomic Energy Agency], [Online]. Available: http://www-naweb.iaea.org/na/news-na/na-what-is-dosimetry.html [2017, July/8].
Iijima, S. 1991, "Helical microtubules of graphitic carbon", Nature, vol. 354, no. 6348, pp. 56-58.
Images SI Inc 2012, Energy Spectrum of Strontium 90 Beta Radiation Source. Available: http://www.imagesco.com/geiger/nuclear_experiments/experiment1.html [2014, 09/16].
Imai, H. & Hirashima, H. 1994, "Intrinsic-and extrinsic-defect formation in silica glasses by radiation", Journal of Non-Crystalline Solids, vol. 179, pp. 202-213.
Islam, M., Rojas, E., Bergey, D., Johnson, A. & Yodh, A. 2003, "High weight fraction surfactant solubilization of single-wall carbon nanotubes in water", Nano Letters, vol. 3, no. 2, pp. 269-273.
Jacqueline, A., Poumellec, B., Chervin, J., Garcıa-Blanco, S. & Esnouf, S. 2004, "Raman investigation of structural changes induced by e-beam irradiation in Ge doped silica MCVD glasses", Materials Science and Engineering: B, vol. 107, no. 1, pp. 46-52.
Jafari, S.M., Alalawi, A.I., Hussein, M., Alsaleh, W., Najem, M.A., Hugtenburg, R.P., Bradley, D.A., Spyrou, N.M., Clark, C.H. & Nisbet, A. 2014, "Glass beads and Ge-doped optical fibres as thermoluminescence dosimeters for small field photon dosimetry", Physics in Medicine and Biology, vol. 59, no. 22, pp. 6875.
Jafari, S.M., Alalawi, A.I., Hussein, M., Alsaleh, W., Najem, M.A., Hugtenburg, R.P., Bradley, D.A., Spyrou, N.M., Clark, C.H. & Nisbet, A. 2014, "Glass beads and Ge-doped optical fibres as thermoluminescence dosimeters for small field photon dosimetry", Physics in Medicine and Biology, vol. 59, no. 22, pp. 6875.
Jafari, S.M., Jordan, T.J., Distefano, G., Bradley, D.A., Spyrou, N.M., Nisbet, A. & Clark, C.H. 2015, "Feasibility of using glass-bead thermoluminescent dosimeters for radiotherapy treatment plan verification", The British journal of radiology, vol. 88, no. 1055, pp. 20140804.
Jafari, S., Bradley, D., Gouldstone, C., Sharpe, P., Alalawi, A., Jordan, T., Clark, C., Nisbet, A. & Spyrou, N. 2014, "Low-cost commercial glass beads as dosimeters in radiotherapy", Radiation Physics and Chemistry, vol. 97, pp. 95-101.
Jafari, S., Bradley, D., Gouldstone, C., Sharpe, P., Alalawi, A., Jordan, T., Clark, C., Nisbet, A. & Spyrou, N. 2014, "Low-cost commercial glass beads as dosimeters in radiotherapy", Radiation Physics and Chemistry, vol. 97, pp. 95-101.
Jafari, S., Jordan, T., Hussein, M., Bradley, D., Clark, C., Nisbet, A. & Spyrou, N. 2014, "Energy response of glass bead TLDs irradiated with radiation therapy beams", Radiation Physics and Chemistry, vol. 104, pp. 208-211.
Jafari, S., Jordan, T., Hussein, M., Bradley, D., Clark, C., Nisbet, A. & Spyrou, N. 2014, "Energy response of glass bead TLDs irradiated with radiation therapy beams", Radiation Physics and Chemistry, vol. 104, pp. 208-211.
181
Jarnet, D., Denizot, B., Hindre, F., Venier-Julienne, M., Lisbona, A., Bardies, M. & Jallet, P. 2004, "New thermoluminescent dosimeters (TLD): optimization and characterization of TLD threads sterilizable by autoclave", Physics in Medicine and Biology, vol. 49, no. 9, pp. 1803.
Jin, Z., Sun, X., Xu, G., Goh, S.H. & Ji, W. 2000, "Nonlinear optical properties of some polymer/multi-walled carbon nanotube composites", Chemical Physics Letters, vol. 318, no. 6, pp. 505-510.
Kaciulis, S. 2012, "Spectroscopy of carbon: from diamond to nitride films", Surface and Interface Analysis, vol. 44, no. 8, pp. 1155-1161.
Kaciulis, S., Mezzi, A., Calvani, P. & Trucchi, D. 2014, "Electron spectroscopy of the main allotropes of carbon", Surface and Interface Analysis, vol. 46, no. 10-11, pp. 966-969.
Kajitvichyanukul, P., Ananpattarachai, J. & Pongpom, S. 2005, "Sol–gel preparation and properties study of TiO 2 thin film for photocatalytic reduction of chromium (VI) in photocatalysis process", Science and Technology of Advanced Materials, vol. 6, no. 3, pp. 352-358.
Khanlary, M., Townsend, P. & Townsend, J. 1993, "Luminescence spectra of germanosilicate optical fibres. I. Radioluminescence and cathodoluminescence", Journal of Physics D: Applied Physics, vol. 26, no. 3, pp. 371.
Kim, D., Kim, H., Gill, C.S. & Lee, Y.O. ACE-format nuclear data library. Available: http://atom.kaeri.re.kr/NDVG/ace_NDL.jsp?select=KNE71 [2016, August, 2016].
Kim, S.Y., Park, J., Choi, H.C., Ahn, J.P., Hou, J.Q. & Kang, H.S. 2007, "X-ray photoelectron spectroscopy and first principles calculation of BCN nanotubes", Journal of the American Chemical Society, vol. 129, no. 6, pp. 1705-1716.
Kinhikar, R., Chaudhari, S., Kadam, S., Dhote, D. & Deshpande, D. 2012, "Dosimetric validation of new semiconductor diode dosimetry system for intensity modulated radiotherapy", Journal of cancer research and therapeutics, vol. 8, no. 1, pp. 86.
Kirby, T., Hanson, W., Gastorf, R., Chu, C. & Shalek, R. 1986, "Mailable TLD system for photon and electron therapy beams", International Journal of Radiation Oncology* Biology* Physics, vol. 12, no. 2, pp. 261-265.
Knoll, G. 2000, Radiation detection and measurement, John Wiley & Sons, United State of America.
Koehne, J., Li, J., Cassell, A.M., Chen, H., Ye, Q., Ng, H.T., Han, J. & Meyyappan, M. 2004, "The fabrication and electrochemical characterization of carbon nanotube nanoelectrode arrays", Journal of Materials Chemistry, vol. 14, no. 4, pp. 676-684.
Koike, J., Parkin, D. & Mitchell, T. 1992, "Displacement threshold energy for type IIa diamond", Applied Physics Letters, vol. 60, no. 12, pp. 1450-1452.
Koivisto, J., Schulze, D., Wolff, J. & Rottke, D. 2014, "Effective dose assessment in the maxillofacial region using thermoluminescent (TLD) and metal oxide semiconductor field-effect transistor (MOSFET) dosemeters: a comparative study", Dentomaxillofacial Radiology, vol. 43, no. 8, pp. 20140202.
Kong, J., Franklin, N.R., Zhou, C., Chapline, M.G., Peng, S., Cho, K. & Dai, H. 2000, "Nanotube molecular wires as chemical sensors", Science (New York, N.Y.), vol. 287, no. 5453, pp. 622-625.
Krasheninnikov, A. & Nordlund, K. 2004, "Irradiation effects in carbon nanotubes", Nuclear Instruments and Methods in Physics Research Section B: Beam Interactions with Materials and Atoms, vol. 216, pp. 355-366.
182
Kurz, A., Brakecha, K., Puetz, J. & Aegerter, M.A. 2006, "Strategies for novel transparent conducting sol–gel oxide coatings", Thin Solid Films, vol. 502, no. 1, pp. 212-218.
Kuznetzov, A.A., Lee, S.B., Zhang, M., Baughman, R.H. & Zakhidov, A.A. 2010, "Electron field emission from transparent multiwalled carbon nanotube sheets for inverted field emission displays", Carbon, vol. 48, no. 1, pp. 41-46.
Lambert, J., Nakano, T., Law, S., Elsey, J., McKenzie, D.R. & Suchowerska, N. 2007, ". In vivo dosimeters for HDR brachytherapy: a comparison of a diamond detector, MOSFET, TLD, and scintillation detector. ", Med. Phys., vol. 34, no. 5, pp. 1759-1765.
Lee, N., Chung, D., Han, I., Kang, J., Choi, Y., Kim, H., Park, S., Jin, Y., Yi, W. & Yun, M. 2001, "Application of carbon nanotubes to field emission displays", Diamond and related materials, vol. 10, no. 2, pp. 265-270.
Li, J., Ng, H.T., Cassell, A., Fan, W., Chen, H., Ye, Q., Koehne, J., Han, J. & Meyyappan, M. 2003, "Carbon nanotube nanoelectrode array for ultrasensitive DNA detection", Nano letters, vol. 3, no. 5, pp. 597-602.
Liu, C., Chen, Y., Wu, C., Xu, S. & Cheng, H. 2010, "Hydrogen storage in carbon nanotubes revisited", Carbon, vol. 48, no. 2, pp. 452-455.
Liu, F., Qian, J., Wang, X., Liu, L. & Ming, H. 1997, "UV irradiation-induced defect study of GeO 2− S i O 2 glasses by Raman spectroscopy", Physical Review B, vol. 56, no. 6, pp. 3066.
Liu, H., Gräfe, J., Khan, R., Olivotto, I. & Barajas, J.E.V. 2015, "Role of in vivo dosimetry with radiochromic films for dose verification during cutaneous radiation therapy", Radiation Oncology, vol. 10, no. 1, pp. 12.
Liuzzi, R., Savino, F., D’Avino, V., Pugliese, M. & Cella, L. 2015, "Evaluation of LiF: Mg, Ti (TLD-100) for intraoperative electron radiation therapy quality assurance", PloS one, vol. 10, no. 10, pp. e0139287.
Lobez, J.M. & Swager, T.M. 2010, "Radiation detection: Resistivity responses in functional poly (olefin sulfone)/carbon nanotube composites", Angewandte Chemie International Edition, vol. 49, no. 1, pp. 95-98.
Looe, H.K., Harder, D. & Poppe, B. 2017, "The energy dependence of the lateral dose response functions of detectors with various densities in photon-beam dosimetry", Physics in Medicine and Biology, vol. 62, no. 3, pp. N32.
Lorch, E. 1969, "Neutron diffraction by germania, silica and radiation-damaged silica glasses", Journal of Physics C: Solid State Physics, vol. 2, no. 2, pp. 229.
Lorch, E.A. 1973, "Neutron spectra of 214 Am/B, 241 Am/Be, 241 Am/F, 242 Cm/Be, 238 Pu/13 C and 252 Cf isotopic neutron sources", The International journal of applied radiation and isotopes, vol. 24, no. 10, pp. 585-591.
Loskyll, J., Maier, W.F. & Stoewe, K. 2012, "Application of a simultaneous TGA-DSC thermal analysis system for high-throughput screening of catalytic activity", ACS combinatorial science, vol. 14, no. 11, pp. 600-604.
Lu, X. & Dai, J. 2006, "Memory effects of carbon nanotubes as charge storage nodes for floating gate memory applications", Applied Physics Letters, vol. 88, no. 11, pp. 113104-113104-3.
Ma, J., Yeow, J., Chow, J. & Barnett, R. 2007, "A carbon nanotube-based radiation sensor", International Journal of Robotics and Automation, vol. 22, no. 1, pp. 49-58.
Ma, J. 2008, "Carbon Nanotube and Carbon Fibre Based Radiation Dosimetry".
183
Marikkannan, M., Vishnukanthan, V., Vijayshankar, A., Mayandi, J. & Pearce, J.M. 2015, "A novel synthesis of tin oxide thin films by the sol-gel process for optoelectronic applications", Aip Advances, vol. 5, no. 2, pp. 027122.
Marsden, B.J. 1996, "FUNDAMENTALS OF IRRADIATION DAMAGE IN GRAPHITE DUE TO ENERGETIC NEUTRONS", Graphite moderator lifecycle behaviour, ed. IAEA, INIS Clearinghouse, Vienna, Austria, 24th-27th September 1995, pp. 21.
Martin, C. 2007, "An evaluation of semiconductor and ionization chamber detectors for diagnostic x-ray dosimetry measurements", Physics in Medicine and Biology, vol. 52, no. 15, pp. 4465.
Mat-Sharif, K., Zulkifli, M., Muhamad-Yassin, S., Tamchek, N., Aljamimi, S., Yusoff, A., Amin, Y., Shafiqah, S.S. & Abdul-Rashid, H. 2013, "Effect of GeCl 4/SiCl 4 flow ratio on Germanium incorporation in MCVD process", Photonics (ICP), 2013 IEEE 4th International Conference onIEEE, , pp. 284.
Matthews, I.P. 1979, Prompt and delay gamma ray measurements for'in vivo'neutron activation analysis using a cyclic system, University of Surrey.
Maurer, J. 1969, "Application of differential thermal analysis and thermogravimetric analysis to elastomer systems", Rubber Chemistry and Technology, vol. 42, no. 1, pp. 110-158.
McCarthy, D., O'Keeffe, S., Lewis, E., Sporea, D.G., Sporea, A., Tiseanu, I., Woulfe, P. & Cronin, J. 2014, "Radiation dosimeter using an extrinsic fibre optic sensor", IEEE Sensors Journal, vol. 14, no. 3, pp. 673-685.
McEnaney, B. & Wickham, A.J. 1996, "Effect of Oxidation", Graphite moderator lifecycle behaviour, ed. IAEA, INIS Clearinghouse, Vienna, Austria, 24th-27th September 1995, pp. 12.
Mendoza-Anaya, D., Angeles, C., Salas, P., Rodríguez, R. & Castaño, V. 2003, "Nanoparticle-enhanced thermoluminescence in silica gels", Nanotechnology, vol. 14, no. 12, pp. L19.
Mezzi, A. & Kaciulis, S. 2010, "Surface investigation of carbon films: from diamond to graphite", Surface and Interface Analysis, vol. 42, no. 6‐7, pp. 1082-1084.
Mie, R., Samsudin, M.W., Din, L.B., Ahmad, A., Ibrahim, N. & Adnan, S.N. 2014, "Synthesis of silver nanoparticles with antibacterial activity using the lichen Parmotrema praesorediosum", International journal of nanomedicine, vol. 9, pp. 121-127.
Modi, A., Koratkar, N., Lass, E., Wei, B. & Ajayan, P.M. 2003, "Miniaturized gas ionization sensors using carbon nanotubes", Nature, vol. 424, no. 6945, pp. 171-174.
Moradi, R., Sebt, S., Karimi-Maleh, H., Sadeghi, R., Karimi, F., Bahari, A. & Arabi, H. 2013, "Synthesis and application of FePt/CNTs nanocomposite as a sensor and novel amide ligand as a mediator for simultaneous determination of glutathione, nicotinamide adenine dinucleotide and tryptophan", Physical Chemistry Chemical Physics, vol. 15, no. 16, pp. 5888-5897.
Muisener, P.O., Clayton, L., D'Angelo, J., Harmon, J., Sikder, A., Kumar, A., Cassell, A. & Meyyappan, M. 2002, "Effects of gamma radiation on poly (methyl methacrylate)/single-wall nanotube composites", Journal of Materials Research, vol. 17, no. 10, pp. 2507-2513.
Murthy, R., Gupta, H., Krishnatry, R. & Laskar, S. 2015, "Electron beam radiotherapy for the management of recurrent extensive ocular surface squamous neoplasia with orbital extension", Indian journal of ophthalmology, vol. 63, no. 8, pp. 672-674.
Najafi, E. & Shin, K. 2005, "Radiation resistant polymer–carbon nanotube nanocomposite thin films", Colloids and Surfaces A: Physicochemical and Engineering Aspects, vol. 257, pp. 333-337.
184
Natsume, Y. & Sakata, H. 2000, "Zinc oxide films prepared by sol-gel spin-coating", Thin Solid Films, vol. 372, no. 1, pp. 30-36.
Nawi, Siti Nurasiah Binti Mat, Wahib, N.F.B., Zulkepely, N.N.B., Amin, Y.B.M., Min, U.N., Bradley, D.A., Nor, R.B.M. & Maah, M.J. 2015, "The Thermoluminescence Response of Ge-Doped Flat Fibres to Gamma Radiation", Sensors, vol. 15, no. 8, pp. 20557-20569.
Neustruev, V. 1994, "Colour centres in germanosilicate glass and optical fibres", Journal of Physics: Condensed Matter, vol. 6, no. 35, pp. 6901.
Nihei, M., Kawabata, A. & Awano, Y. 2003, "Direct diameter-controlled growth of multiwall carbon nanotubes on nickel-silicide layer", Japanese journal of applied physics, vol. 42, no. 6B, pp. L721.
Niitsoo, O. & Couzis, A. 2011, "Facile synthesis of silver core–silica shell composite nanoparticles", Journal of colloid and interface science, vol. 354, no. 2, pp. 887-890.
NIST, E. 14 June 2017, , National Institute of Standards and Technology. Available: https://physics.nist.gov/PhysRefData/Star/Text/ESTAR.html [2017, 08/15].
Noor, N.M., Fadzil, M.A., Ung, N., Maah, M., Mahdiraji, G., Abdul-Rashid, H. & Bradley, D. 2016, "Radiotherapy dosimetry and the thermoluminescence characteristics of Ge-doped fibres of differing germanium dopant concentration and outer diameter", Radiation Physics and Chemistry, vol. 126, pp. 56-61.
Ohno, T. 2013, "Particle radiotherapy with carbon ion beams", EPMA Journal, vol. 4, no. 1, pp. 9.
Orita, M., Hayashida, N., Taira, Y., Fukushima, Y., Ide, J., Endo, Y., Kudo, T., Yamashita, S. & Takamura, N. 2015, "Measurement of individual doses of radiation by personal dosimeter is important for the return of residents from evacuation order areas after nuclear disaster", PloS one, vol. 10, no. 3, pp. e0121990.
Ortec, (2016). Maestro 7 multichannel analyzer MCA emulation software. ⟨http://www. ortec- online.com/Products-Solutions/Applications-Software-MAESTRO.aspx) (Accessed August 2016).
Pacchioni, G. & Mazzeo, C. 2000, "Paramagnetic centers in Ge-doped silica: A first-principles study", Physical Review B, vol. 62, no. 9, pp. 5452.
Palmans, H., Thomas, R., Duane, S., Sterpin, E. & Vynckier, S. 2010, "Ion recombination for ionization chamber dosimetry in a helical tomotherapy unit", Medical physics, vol. 37, no. 6, pp. 2876-2889.
Pandey, A., Sahare, P. & Kanjilal, D. 2004, "Thermoluminescence and photoluminescence characteristics of sol–gel prepared pure and europium doped silica glasses", Journal of Physics D: Applied Physics, vol. 37, no. 6, pp. 842.
Pang, L.S., Saxby, J.D. & Chatfield, S.P. 1993, "Thermogravimetric analysis of carbon nanotubes and nanoparticles", The Journal of physical chemistry, vol. 97, no. 27, pp. 6941-6942.
Park, S.K., Do Kim, K. & Kim, H.T. 2002, "Preparation of silica nanoparticles: determination of the optimal synthesis conditions for small and uniform particles", Colloids and Surfaces A: Physicochemical and Engineering Aspects, vol. 197, no. 1, pp. 7-17.
Parker, E.N. 2005, "Shielding space explorers from cosmic rays", Space Weather, vol. 3, no. 8.
Penza, M., Rossi, R., Alvisi, M., Signore, M., Serra, E., Paolesse, R., D’Amico, A. & Di Natale, C. 2010, "Metalloporphyrins-modified carbon nanotubes networked films-based chemical sensors
185
for enhanced gas sensitivity", Sensors and Actuators B: Chemical, vol. 144, no. 2, pp. 387-394.
Price, D. 2006, Thermogravimetry, 1st edn, Loughborough University, UK.
Qin, Z., Hu, Y., Ma, Y., Lin, W., Luo, X., Zhao, W., Sun, W., Zhang, D., Chen, Z. & Wang, B. 2016, "Water-equivalent fibre radiation dosimeter with two scintillating materials", Biomedical optics express, vol. 7, no. 12, pp. 4919-4927.
Rahim, A.A., Zahaimi, N., Zin, H., Bradley, D., Mahdiraji, G. & Rahman, A.A. 2017, "Characterisation of sensitive Ge-doped silica flat fibre-based thermoluminescence detectors for high resolution radiotherapy dosimetry", Journal of Physics, vol. 851, no. 1, pp. 1-7.
Rahman, A.A., Bradley, D., Doran, S., Thierry, B., Bräuer-Krisch, E. & Bravin, A. 2010, "The thermoluminescence response of Ge-doped silica fibres for synchrotron microbeam radiation therapy dosimetry", Nuclear Instruments and Methods in Physics Research Section A: Accelerators, Spectrometers, Detectors and Associated Equipment, vol. 619, no. 1, pp. 167-170.
Rahman, A.A., Bradley, D., Doran, S., Thierry, B., Bräuer-Krisch, E. & Bravin, A. 2010, "The thermoluminescence response of Ge-doped silica fibres for synchrotron microbeam radiation therapy dosimetry", Nuclear Instruments and Methods in Physics Research Section A: Accelerators, Spectrometers, Detectors and Associated Equipment, vol. 619, no. 1, pp. 167-170.
Rahman, A.A., Hugtenburg, R., Sani, S.F.A., Alalawi, A., Issa, F., Thomas, R., Barry, M., Nisbet, A. & Bradley, D. 2012, "An investigation of the thermoluminescence of Ge-doped SiO 2 optical fibres for application in interface radiation dosimetry", Applied Radiation and Isotopes, vol. 70, no. 7, pp. 1436-1441.
Rahman, A.A., Nisbet, A. & Bradley, D. 2011, "Dose-rate and the reciprocity law: TL response of Ge-doped SiO 2 optical fibres at therapeutic radiation doses", Nuclear Instruments and Methods in Physics Research Section A: Accelerators, Spectrometers, Detectors and Associated Equipment, vol. 652, no. 1, pp. 891-895.
Rahman, A.A., Nisbet, A. & Bradley, D. 2011, "Dose-rate and the reciprocity law: TL response of Ge-doped SiO 2 optical fibres at therapeutic radiation doses", Nuclear Instruments and Methods in Physics Research Section A: Accelerators, Spectrometers, Detectors and Associated Equipment, vol. 652, no. 1, pp. 891-895.
Ramli, A.T., Bradley, D., Hashim, S. & Wagiran, H. 2009, "The thermoluminescence response of doped SiO 2 optical fibres subjected to alpha-particle irradiation", Applied Radiation and Isotopes, vol. 67, no. 3, pp. 428-432.
Ramli, N., Salleh, H., Mahdiraji, G., Zulkifli, M., Hashim, S., Bradley, D. & Noor, N. 2015, "Characterization of amorphous thermoluminescence dosimeters for patient dose measurement in X-ray diagnostic procedures", Radiation Physics and Chemistry, vol. 116, pp. 130-134.
Randall, J. & Wilkins, M.H.F. 1945, "Phosphorescence and electron traps. I. The study of trap distributions", Proceedings of the Royal Society of London A: Mathematical, Physical and Engineering SciencesThe Royal Society, , pp. 365.
Ranjbar, A., Ismail, M., Guo, Z., Yu, X. & Liu, H.K. 2010, " Effects of CNTs on the hydrogen storage properties of MgH 2 and MgH 2-BCC composite", International Journal of Hydrogen Energy, vol. 35, no. 15, pp. 7821-7826.
Ravisankar, R., Naseerutheen, A., Chandrasekaran, A., Bramha, S., Kanagasabapathy, K., Prasad, M. & Satpathy, K. 2014, "Energy dispersive X-ray fluorescence analysis of ancient potteries
186
from Vellore District Tamilnadu, India with statistical approach", Journal of Radiation Research and Applied Sciences, vol. 7, no. 1, pp. 44-54.
Rebohle, L., Von Borany, J., Grötzschel, R., Markwitz, A., Schmidt, B., Tyschenko, I., Skoruba, W., Fröb, H. & Leo, K. 1998, "Strong Blue and Violet Photo‐and Electroluminescence from Ge‐and Si‐Implanted Silicon Dioxide", physica status solidi (a), vol. 165, no. 1, pp. 31-35.
Reilly, D., Ensslin, N., Smith Jr, H. & Kreiner, S. 1991, Passive nondestructive assay of nuclear materials, .
Rivera, T., Azorin, J., Barrera, M. & Soto, A. 2007, "Nanostructural processing of advanced thermoluminescent materials", Radiation Effects & Defects in Solids, vol. 162, no. 10-11, pp. 731-736.
Rivera, T., Furetta, C., Azorin, J., Barrera, M. & Soto, A. 2007, "Thermoluminescence (TL) of europium-doped ZrO2 obtained by sol–gel method", Radiation Effects & Defects in Solids, vol. 162, no. 5, pp. 379-383.
Rivera, T., Olvera, L., Martínez, A., Molina, D., Azorín, J., Barrera, M., Soto, A., Sosa, R. & Furetta, C. 2007, "Thermoluminescence properties of copper doped zirconium oxide for UVR dosimetry", Radiation Measurements, vol. 42, no. 4, pp. 665-667.
Saito, Y. 2010, Carbon Nanotube and Related Field Emitters: Fundamentals and Applications, John Wiley & Sons.
Salguero, F.J., Arráns, R., Palma, B.A. & Leal, A. 2010, "Intensity-and energy-modulated electron radiotherapy by means of an xMLC for head and neck shallow tumors", Physics in Medicine and Biology, vol. 55, no. 5, pp. 1413.
Sani, S.A., Mahdiraji, G.A., Shafiqah, A.S., Grime, G., Palitsin, V., Hinder, S., Tamchek, N., Rashid, H.A., Maah, M. & Watts, J. 2015, "XPS and PIXE analysis of doped silica fibre for radiation dosimetry", Journal of Lightwave Technology, vol. 33, no. 11, pp. 2268-2278.
Sani, S.A., Shafiqah, A.S., Collins, S., Hugtenburg, R., Rashid, H.A., Zulkepely, N.N. & Maah, M. 2017, "Doped silica fibre thermoluminescence measurements of radiation dose in the use of 223 Ra", Applied Radiation and Isotopes, .
Sellakumar, P., Samuel, E.J.J. & Kumar, D.S. 2010, "Dose-rate dependence of PAGAT polymer gel dosimeter evaluated using X-ray CT scanner", Journal of Physics: Conference SeriesIOP Publishing, , pp. 012074.
Sergey, V. (ed) 2012, Thermogravimetric Analysis. Characterization of Materials., Second Edition edn, John Wiley & Sons, USA.
Shafiqah, A.S., Amin, Y., Nor, R.M. & Bradley, D. 2015, "Effect of particle size on the thermoluminescence (TL) response of silica nanoparticles", Radiation Physics and Chemistry, vol. 117, pp. 102-107.
Shafiqah, A.S., Amin, Y., Nor, R.M., Tamchek, N. & Bradley, D. 2015, "Enhanced TL response due to radiation induced defects in Ge-doped silica preforms", Radiation Physics and Chemistry, vol. 111, pp. 87-90.
Sharifi, B., Zeinali, H.Z., Alipoor, A., Shahvar, A. & Negarestani, A. 2015, "The Calibration and Use of a New Ring-Shaped Ionization Chamber for Monitoring and Dosimetry of X-Ray Beams", World Journal of Nuclear Science and Technology, vol. 5, no. 03, pp. 200.
Shen, J., Lian, X., Sun, Y., Wang, X., Hu, K., Hou, X., Sun, S., Yan, J., Yu, L. & Sun, X. 2015, "Hypofractionated electron-beam radiation therapy for keloids: retrospective study of 568 cases with 834 lesions", Journal of radiation research, vol. 56, no. 5, pp. 811-817.
187
Silsbee, R.H. 1961, "Electron spin resonance in neutron‐irradiated quartz", Journal of Applied Physics, vol. 32, no. 8, pp. 1459-1462.
Skuja, L. 1998, "Optically active oxygen-deficiency-related centers in amorphous silicon dioxide", Journal of Non-Crystalline Solids, vol. 239, no. 1, pp. 16-48.
Skuja, L. 1992, "Isoelectronic series of twofold coordinated Si, Ge, and Sn atoms in glassy SiO 2: a luminescence study", Journal of Non-Crystalline Solids, vol. 149, no. 1, pp. 77-95.
Skuja, L. 1992, "Isoelectronic series of twofold coordinated Si, Ge, and Sn atoms in glassy SiO 2: a luminescence study", Journal of Non-Crystalline Solids, vol. 149, no. 1, pp. 77-95.
Smakula, A. 1930, "Über erregung und entfärbung lichtelektrisch leitender alkalihalogenide", Zeitschrift für Physik A Hadrons and Nuclei, vol. 59, no. 9, pp. 603-614.
Smith, A.R., Rosen, I.I., Hogstrom, K.R. & Prichard, H.M. 1977, "The silicon diode as an in vivo dosimeter for fast neutrons", International Journal of Radiation Oncology* Biology* Physics, vol. 2, no. 1-2, pp. 111-116.
Star, A., Stoddart, J.F., Steuerman, D., Diehl, M., Boukai, A., Wong, E.W., Yang, X., Chung, S., Choi, H. & Heath, J.R. 2001, "Preparation and properties of polymer‐wrapped single‐walled carbon nanotubes", Angewandte Chemie International Edition, vol. 40, no. 9, pp. 1721-1725.
Stephanie, B. 2001, March 2001-last update, Good Practice Guide No. 11 [Homepage of National Physical Laboratory], [Online]. Available: http://publications.npl.co.uk/npl_web/pdf/mgpg11.pdf [2017, September].
Sublemontier, O., Nicolas, C., Aureau, D., Patanen, M., Kintz, H., Liu, X., Gaveau, M., Le Garrec, J., Robert, E. & Barreda, F. 2014, "X-ray photoelectron spectroscopy of isolated nanoparticles", The journal of physical chemistry letters, vol. 5, no. 19, pp. 3399-3403.
Sulaiman, N.S., Fujii, O., Demizu, Y., Terashima, K., Niwa, Y., Akagi, T., Daimon, T., Murakami, M., Sasaki, R. & Fuwa, N. 2014, "Particle beam radiation therapy using carbon ions and protons for oligometastatic lung tumors", Radiation Oncology, vol. 9, no. 1, pp. 183.
Sun, W., Wang, B., Qiu, B., Liang, J., Xie, W., Deng, X. & Qi, Z. 2017, "Assessment of female breast dose for thoracic cone-beam CT using MOSFET dosimeters", Oncotarget, vol. 8, no. 12, pp. 20179-20186.
Susi, T., Pichler, T. & Ayala, P. 2015, "X-ray photoelectron spectroscopy of graphitic carbon nanomaterials doped with heteroatoms", Beilstein journal of nanotechnology, vol. 6, pp. 177-192.
Tabatabaei, S., Shukohfar, A., Aghababazadeh, R. & Mirhabibi, A. 2006, "Experimental study of the synthesis and characterisation of silica nanoparticles via the sol-gel method", Journal of Physics: Conference SeriesIOP Publishing, , pp. 371.
Taggart, M. 2007, Surveying the thermal neutron capture flux via activation analysis, .
Takagi, M., Yusuke, D., Naoki, H., Masayuki, M., Kazuki, T., Osamu, F., Dongcun, J., Yasue, N., Masao, M. & Nobukazu, F. 2013, "Treatment Outcomes of Proton or Carbon Ion Radiation Therapy for Adenoid Cystic Carcinoma of the Head and Neck", International Journal of Radiation Oncology• Biology• Physics, vol. 87, no. 2, pp. S466.
Talin, A., Dean, K. & Jaskie, J. 2001, "Field emission displays: a critical review", Solid-State Electronics, vol. 45, no. 6, pp. 963-976.
188
Tamchek, N., Siti, S.A., Amin, Y., Nor, R., Mat-Sharif, K. & Abdul-Rashid, H. 2013, "Optical properties of GeO 2-doped silica preform from absorption and vibrational spectroscopy", Photonics (ICP), 2013 IEEE 4th International Conference onIEEE, , pp. 221.
Teoh, M., Clark, C., Wood, K., Whitaker, S. & Nisbet, A. 2011, "Volumetric modulated arc therapy: a review of current literature and clinical use in practice", The British journal of radiology, vol. 84, no. 1007, pp. 967-996.
ThermoFisher 2016, TLD-100™ Thermoluminescent Dosimetry Material [Homepage of Thermo Fisher Scientific], [Online]. Available: https://www.thermofisher.com/order/catalog/product/SNO10106 [2017, 07/15].
Thompson, M. & Taylor, J. 1965, "Neutron spectra from Am-α-Be and Ra-α-Be sources", Nuclear Instruments and Methods, vol. 37, pp. 305-308.
Timur, S., Anik, U., Odaci, D. & Gorton, L. 2007, "Development of a microbial biosensor based on carbon nanotube (CNT) modified electrodes", Electrochemistry Communications, vol. 9, no. 7, pp. 1810-1815.
Tiwari, R., Taunk, P.B., Tamrakar, R.K., Swamd, N. & Dubey, V. 2014, "Synthesis, characterization and thermoluminescence behavior of (Cd, Zn) S mixed phosphor doped with silver", Chalcogenide Letters, vol. 11, no. 3, pp. 141-158.
Torres, V., Popa, M., Crespo, D. & Moreno, J.M.C. 2007, "Silver nanoprism coatings on optical glass substrates", Microelectronic engineering, vol. 84, no. 5, pp. 1665-1668.
Tsai, T., Griscom, D. & Friebele, E. 1988, "Mechanism of intrinsic Si E′-center photogeneration in high-purity silica", Physical Review Letters, vol. 61, no. 4, pp. 444.
Turner, J.E. 2008, Atoms, radiation, and radiation protection, John Wiley & Sons.
Turner, N.H. & Schreifels, J.A. 1992, "Surface analysis: X-ray photoelectron spectroscopy and Auger electron spectroscopy", Analytical Chemistry, vol. 64, no. 12, pp. 302R-320R.
uz Zaman, M., Fatima, N., Naqvi, M., Parveen, R. & Sajjad, Z. 2011, "Radiation dosimetry: from thermoluminescence dosimeter (TLD) to optically stimulated luminescence dosimeter (OSLD)", PJR, vol. 21, no. 3, pp. 107-109.
Villa-Sanchéz, G., Mendoza-Anaya, D., Gutiérrez-Wing, C., Pérez-Hernández, R., González-Martínez, P. & Angeles-Chavez, C. 2007, "Ag nanoparticle effects on the thermoluminescent properties of monoclinic ZrO2 exposed to ultraviolet and gamma radiation", Nanotechnology, vol. 18, no. 26, pp. 265703.
Vitusevich, S., Sydoruk, V., Petrychuk, M., Danilchenko, B., Klein, N., Offenhäusser, A., Ural, A. & Bosman, G. 2010, "Transport properties of single-walled carbon nanotube transistors after gamma radiation treatment", Journal of Applied Physics, vol. 107, no. 6, pp. 063701.
Wagiran, H., Hossain, I. & Asni, H. and Ramli, A. T. 2011, "Thermoluminescence energy response of a germanium-doped optical fibre obtained using a Monte Carlo N-partical Code simulation.", Journal of the Korean Physical Society, vol. 59, no. 2, pp. 337-340.
Wang, J. 2005, "Carbon‐nanotube based electrochemical biosensors: A review", Electroanalysis, vol. 17, no. 1, pp. 7-14.
Wang, Q., Tie, C. & Dai, K. 2012, "Thermoluminescence of Al2O3: Cr3 films synthesized by the nonaqueous sol–gel method", Radiation Effects and Defects in Solids, vol. 167, no. 5, pp. 361-366.
189
Wang, Z., Liang, Z., Wang, B., Zhang, C. & Kramer, L. 2004, "Processing and property investigation of single-walled carbon nanotube (SWNT) buckypaper/epoxy resin matrix nanocomposites", Composites Part A: applied science and manufacturing, vol. 35, no. 10, pp. 1225-1232.
Wen, J. & Mark, J.E. 1994, "Precipitation of Silica-titania mixed-oxide fillers into poly (dimethylsiloxane) networks", Rubber chemistry and technology, vol. 67, no. 5, pp. 806-819.
Wongchoosuk, C., Wisitsoraat, A., Tuantranont, A. & Kerdcharoen, T. 2010, " Portable electronic nose based on carbon nanotube-SnO 2 gas sensors and its application for detection of methanol contamination in whiskeys", Sensors and Actuators B: Chemical, vol. 147, no. 2, pp. 392-399.
Wright, A.C. 1994, "Neutron scattering from vitreous silica. V. The structure of vitreous silica: What have we learned from 60 years of diffraction studies?", Journal of Non-Crystalline Solids, vol. 179, pp. 84-115.
Yaakob, N., Wagiran, H., Hossain, I., Ramli, A.T., Bradley, D., Hashim, S. & Ali, H. 2011, "Electron irradiation response on Ge and Al-doped SiO 2 optical fibres", Nuclear Instruments and Methods in Physics Research Section A: Accelerators, Spectrometers, Detectors and Associated Equipment, vol. 637, no. 1, pp. 185-189.
Yaakob, N.H., Wagiran, H., Hossain, M.I., Ramli, A.T., Bradley, D.A., Hashim, S. & Ali, H. 2011, "Thermoluminescence response of Ge-and Al-doped optical fibres subjected to low-dose electron irradiation", Journal of Nuclear Science and Technology, vol. 48, no. 7, pp. 1115-1117.
Yang, S.J., Cho, J.H., Nahm, K.S. & Park, C.R. 2010, "Enhanced hydrogen storage capacity of Pt-loaded CNT@ MOF-5 hybrid composites", International Journal of Hydrogen Energy, vol. 35, no. 23, pp. 13062-13067.
Yao, M., Wang, D. & Zhao, M. 2015, "Element analysis based on energy-dispersive X-ray fluorescence", Advances in Materials Science and Engineering, vol. 2015, pp. 7.
Yazyev, O.V. & Pasquarello, A. 2008, "Effect of metal elements in catalytic growth of carbon nanotubes", Physical Review Letters, vol. 100, no. 15, pp. 156102.
Yoshimura, E. & Yukihara, E. 2006, "Optically stimulated luminescence of magnesium aluminate (MgAl2O4) spinel", Radiation Measurements, vol. 41, no. 2, pp. 163-169.
Yoshizumi, T.T., Goodman, P.C., Frush, D.P., Nguyen, G., Toncheva, G., Sarder, M. & Barnes, L. 2007, "Validation of metal oxide semiconductor field effect transistor technology for organ dose assessment during CT: comparison with thermoluminescent dosimetry", American Journal of Roentgenology, vol. 188, no. 5, pp. 1332-1336.
Yue, G., Qiu, Q., Gao, B., Cheng, Y., Zhang, J., Shimoda, H., Chang, S., Lu, J. & Zhou, O. 2002, "Generation of continuous and pulsed diagnostic imaging x-ray radiation using a carbon-nanotube-based field-emission cathode", Applied Physics Letters, vol. 81, no. 2, pp. 355-357.
Zevalos, C., Juan, Y. & Zamboni, C.B. 2005, "Evaluation of the neutron flux distribution in an Am-Be irradiator using the MCNP4C code", Braz. J. Phys., vol. 35, no. 1.
zewska, J. and Rajan, G "Izewska, J. & Rajan, G. (2005). Chapter 3: Radiation Dosimeters. In: Podgorsak, E. B. (Ed.), Radiation Oncology Physics: A Handbook for Teachers and Students (pp.71-99). International Atomic Energy Agency-IAEA, Vienna." in .
Zhao, Q., Buongiorno Nardelli, M., Lu, W. & Bernholc, J. 2005, "Carbon nanotube-metal cluster composites: A new road to chemical sensors?", Nano letters, vol. 5, no. 5, pp. 847-851.

190
Zhuang, Q., Yaosheng, H., Yu, M., Wenhui, Z., Weimin, S., Daxin, Z., Ziyin, C. & Elfed, L. 2016, "Embedded structure fibre-optic radiation dosimeter for radiotherapy applications", Optics Express, vol. 24, no. 5, pp. 5172-5185.
Ziegler, E. (2007). Reference & calibration sources. ⟨http://hightechsource.co.uk/ wp- content/uploads/Catalogue-IPL-Std-Ref2008.pdf⟩. (Accessed September 2016).
Zulkepely, N.N., Amin, Y.M., Nor, R.M., Bradley, D., Maah, M.J., Nawi, S.N.M. & Wahib, N.F. 2015, "Preliminary results on the photo-transferred thermoluminescence from Ge-doped SiO 2 optical fibre", Radiation Physics and Chemistry, vol. 117, pp. 108-111.

191
10 Appendix
Radiation Physics and Chemistry 137 (2017) 37–44Appendix A
Contents lists available at ScienceDirect
Radiation Physics and Chemistry
http://d0969-80
n Corrford, Su
E-m
journal homepage: www.elsevier.com/locate/radphyschem
Developments in production of silica-based thermoluminescencedosimeters
D.A. Bradley a,b,n, A.S. Siti Shafiqah c, Z. Siti Rozaila b, Siti Norbaini Sabtu b, S.F. Abdul Sani b,Abdulaziz H. Alanazi a, S.M. Jafari a,d, G. Amouzad Mahdiraji e, F.R. Mahamd Adikan e,M.J. Maah f, A.N. Nisbet a,g, N. Tamchek h, H.A. Abdul Rashid i, M. Alkhorayef a,j,K. Alzimami a,j
a Department of Physics, University of Surrey, Guildford, Surrey GU2 7XH, UKb Department of Physics, University of Malaya, 50603 Kuala Lumpur, Malaysiac Department of Physics, International Islamic University Malaysia, 25200 Kuantan, Pahang, Malaysiad Radiotherapy Physics, Level B, Queen Alexandra Hospital, Portsmouth, PO6 3LY, UKe Department of Electrical Engineering, University of Malaya, 50603 Kuala Lumpur, Malaysiaf Department of Chemistry, University of Malaya, 50603 Kuala Lumpur, Malaysiag Department of Medical Physics, Royal Surrey County Hospital NHS Foundation Trust, Egerton Road, Guildford, GU2 7XX, UKh Department of Physics, Universiti Putra Malaysia, 43400 Serdang, Selangor, Malaysiai Faculty of Engineering, Multimedia University, 2010, Cyberjaya, Selangor, Malaysiaj Department of Radiological Sciences, College of Applied Medical Sciences, King Saud University, PO Box 10219, Riyadh 11433, Saudi Arabia
H I G H L I G H T S
� Review of developments in doped silica dosimetry.
� Overview of fabrication and irradiation dependent defects.� Application to proton radiotherapy dosimetry.� Applications in environmental radioactivity.a r t i c l e i n f o
Article history:Received 27 October 2015Received in revised form12 December 2015Accepted 12 January 2016Available online 13 January 2016
Keywords:Thermoluminescence dosimetryOptical fibresDefectsProton beamEnvironmental radioactivity
x.doi.org/10.1016/j.radphyschem.2016.01.0136X/& 2016 Elsevier Ltd. All rights reserved.
esponding author at: Department of Physicsrrey GU2 7XH, UK.ail address: [email protected] (D.A. Bra
a b s t r a c t
This work addresses purpose-made thermoluminescence dosimeters (TLD) based on doped silica fibresand sol–gel nanoparticles, produced via Modified Chemical Vapour Deposition (MCVD) and wet chem-istry techniques respectively. These seek to improve upon the versatility offered by conventional phos-phor-based TLD forms such as that of doped LiF. Fabrication and irradiation-dependent factors are seen toproduce defects of differing origin, influencing the luminescence of the media. In coming to a close, weillustrate the utility of Ge-doped silica media for ionizing radiation dosimetry, first showing results fromgamma-irradiated Ag-decorated nanoparticles, in the particular instance pointing to an extended dy-namic range of dose. For the fibres, at radiotherapy dose levels, we show high spatial resolution (0.1 mm)depth-dose results for proton irradiations. For novel microstructured fibres (photonic crystal fibres, PCFs)we show first results from a study of undisturbed and technologically modified naturally occurringradioactivity environments, measuring doses of some 10 s of μGy over a period of several months.
& 2016 Elsevier Ltd. All rights reserved.
1. Introduction
Over the past three years we have been exploring the asso-ciation between design and performance of silica-based media,our interest being in the utility of the latter in sensing ionizing
, University of Surrey, Guild-
dley).
radiation and in radiation dosimetry. Our efforts stem from earlieradventitious use of commercially available Ge-doped single modetelecommunication fibres (SMF) in such applications, the design ofthese being entirely unrelated to the needs to which the fibreswere put. The SMFs, as well as other telecommunication fibressuch as multi-mode fibres (MMF) and variants of these includingBragg gratings, are fabricated from low-defect silica, as an ex-ample, very pure SiO2 in the form of Suprasil F300, a product ofHeraeus (Hanau, Germany). Doped fibre fabrication starts from a
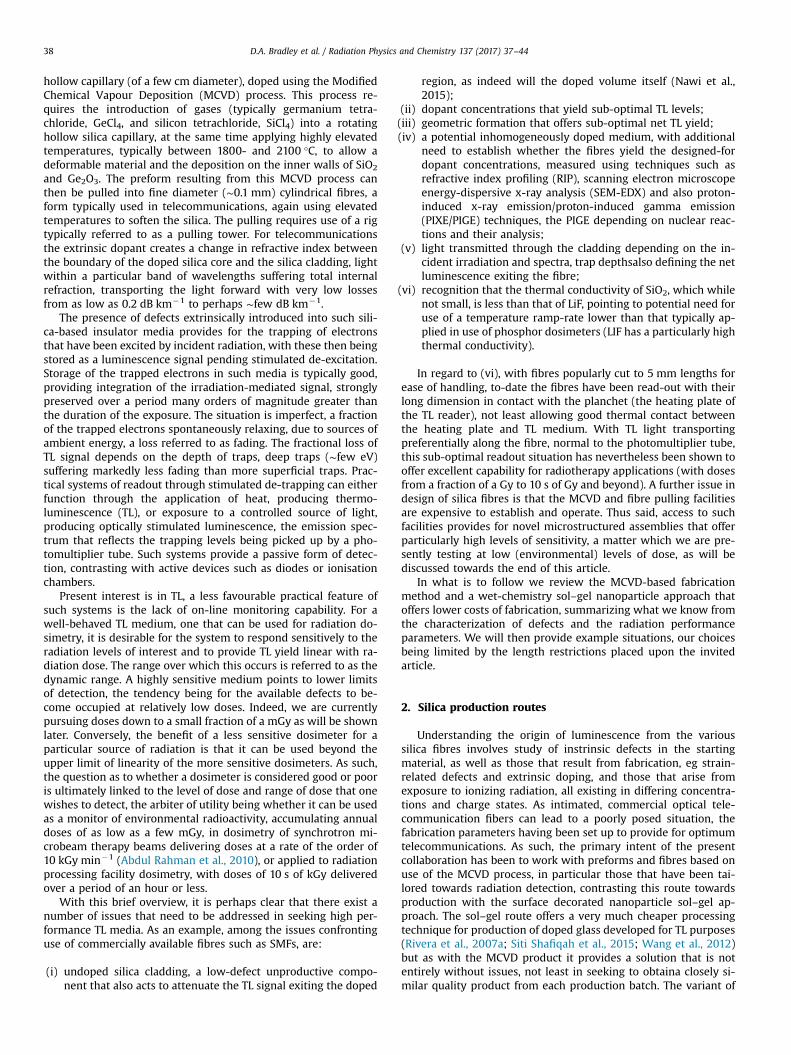
(
D.A. Bradley et al. / Radiation Physics and Chemistry 137 (2017) 37–4438
hollow capillary (of a few cm diameter), doped using the ModifiedChemical Vapour Deposition (MCVD) process. This process re-quires the introduction of gases (typically germanium tetra-chloride, GeCl4, and silicon tetrachloride, SiCl4) into a rotatinghollow silica capillary, at the same time applying highly elevatedtemperatures, typically between 1800- and 2100 °C, to allow adeformable material and the deposition on the inner walls of SiO2
and Ge2O3. The preform resulting from this MCVD process canthen be pulled into fine diameter (∼0.1 mm) cylindrical fibres, aform typically used in telecommunications, again using elevatedtemperatures to soften the silica. The pulling requires use of a rigtypically referred to as a pulling tower. For telecommunicationsthe extrinsic dopant creates a change in refractive index betweenthe boundary of the doped silica core and the silica cladding, lightwithin a particular band of wavelengths suffering total internalrefraction, transporting the light forward with very low lossesfrom as low as 0.2 dB km�1 to perhaps ∼few dB km�1.
The presence of defects extrinsically introduced into such sili-ca-based insulator media provides for the trapping of electronsthat have been excited by incident radiation, with these then beingstored as a luminescence signal pending stimulated de-excitation.Storage of the trapped electrons in such media is typically good,providing integration of the irradiation-mediated signal, stronglypreserved over a period many orders of magnitude greater thanthe duration of the exposure. The situation is imperfect, a fractionof the trapped electrons spontaneously relaxing, due to sources ofambient energy, a loss referred to as fading. The fractional loss ofTL signal depends on the depth of traps, deep traps (∼few eV)suffering markedly less fading than more superficial traps. Prac-tical systems of readout through stimulated de-trapping can eitherfunction through the application of heat, producing thermo-luminescence (TL), or exposure to a controlled source of light,producing optically stimulated luminescence, the emission spec-trum that reflects the trapping levels being picked up by a pho-tomultiplier tube. Such systems provide a passive form of detec-tion, contrasting with active devices such as diodes or ionisationchambers.
Present interest is in TL, a less favourable practical feature ofsuch systems is the lack of on-line monitoring capability. For awell-behaved TL medium, one that can be used for radiation do-simetry, it is desirable for the system to respond sensitively to theradiation levels of interest and to provide TL yield linear with ra-diation dose. The range over which this occurs is referred to as thedynamic range. A highly sensitive medium points to lower limitsof detection, the tendency being for the available defects to be-come occupied at relatively low doses. Indeed, we are currentlypursuing doses down to a small fraction of a mGy as will be shownlater. Conversely, the benefit of a less sensitive dosimeter for aparticular source of radiation is that it can be used beyond theupper limit of linearity of the more sensitive dosimeters. As such,the question as to whether a dosimeter is considered good or pooris ultimately linked to the level of dose and range of dose that onewishes to detect, the arbiter of utility being whether it can be usedas a monitor of environmental radioactivity, accumulating annualdoses of as low as a few mGy, in dosimetry of synchrotron mi-crobeam therapy beams delivering doses at a rate of the order of10 kGy min�1 (Abdul Rahman et al., 2010), or applied to radiationprocessing facility dosimetry, with doses of 10 s of kGy deliveredover a period of an hour or less.
With this brief overview, it is perhaps clear that there exist anumber of issues that need to be addressed in seeking high per-formance TL media. As an example, among the issues confrontinguse of commercially available fibres such as SMFs, are:
(i) undoped silica cladding, a low-defect unproductive compo-nent that also acts to attenuate the TL signal exiting the doped
region, as indeed will the doped volume itself (Nawi et al.,2015);
(ii) dopant concentrations that yield sub-optimal TL levels;iii) geometric formation that offers sub-optimal net TL yield;(iv) a potential inhomogeneously doped medium, with additional
need to establish whether the fibres yield the designed-fordopant concentrations, measured using techniques such asrefractive index profiling (RIP), scanning electron microscopeenergy-dispersive x-ray analysis (SEM-EDX) and also proton-induced x-ray emission/proton-induced gamma emission(PIXE/PIGE) techniques, the PIGE depending on nuclear reac-tions and their analysis;
(v) light transmitted through the cladding depending on the in-cident irradiation and spectra, trap depthsalso defining the netluminescence exiting the fibre;
(vi) recognition that the thermal conductivity of SiO2, which whilenot small, is less than that of LiF, pointing to potential need foruse of a temperature ramp-rate lower than that typically ap-plied in use of phosphor dosimeters (LIF has a particularly highthermal conductivity).
In regard to (vi), with fibres popularly cut to 5 mm lengths forease of handling, to-date the fibres have been read-out with theirlong dimension in contact with the planchet (the heating plate ofthe TL reader), not least allowing good thermal contact betweenthe heating plate and TL medium. With TL light transportingpreferentially along the fibre, normal to the photomultiplier tube,this sub-optimal readout situation has nevertheless been shown tooffer excellent capability for radiotherapy applications (with dosesfrom a fraction of a Gy to 10 s of Gy and beyond). A further issue indesign of silica fibres is that the MCVD and fibre pulling facilitiesare expensive to establish and operate. Thus said, access to suchfacilities provides for novel microstructured assemblies that offerparticularly high levels of sensitivity, a matter which we are pre-sently testing at low (environmental) levels of dose, as will bediscussed towards the end of this article.
In what is to follow we review the MCVD-based fabricationmethod and a wet-chemistry sol–gel nanoparticle approach thatoffers lower costs of fabrication, summarizing what we know fromthe characterization of defects and the radiation performanceparameters. We will then provide example situations, our choicesbeing limited by the length restrictions placed upon the invitedarticle.
2. Silica production routes
Understanding the origin of luminescence from the varioussilica fibres involves study of instrinsic defects in the startingmaterial, as well as those that result from fabrication, eg strain-related defects and extrinsic doping, and those that arise fromexposure to ionizing radiation, all existing in differing concentra-tions and charge states. As intimated, commercial optical tele-communication fibers can lead to a poorly posed situation, thefabrication parameters having been set up to provide for optimumtelecommunications. As such, the primary intent of the presentcollaboration has been to work with preforms and fibres based onuse of the MCVD process, in particular those that have been tai-lored towards radiation detection, contrasting this route towardsproduction with the surface decorated nanoparticle sol–gel ap-proach. The sol–gel route offers a very much cheaper processingtechnique for production of doped glass developed for TL purposes(Rivera et al., 2007a; Siti Shafiqah et al., 2015; Wang et al., 2012)but as with the MCVD product it provides a solution that is notentirely without issues, not least in seeking to obtaina closely si-milar quality product from each production batch. The variant of
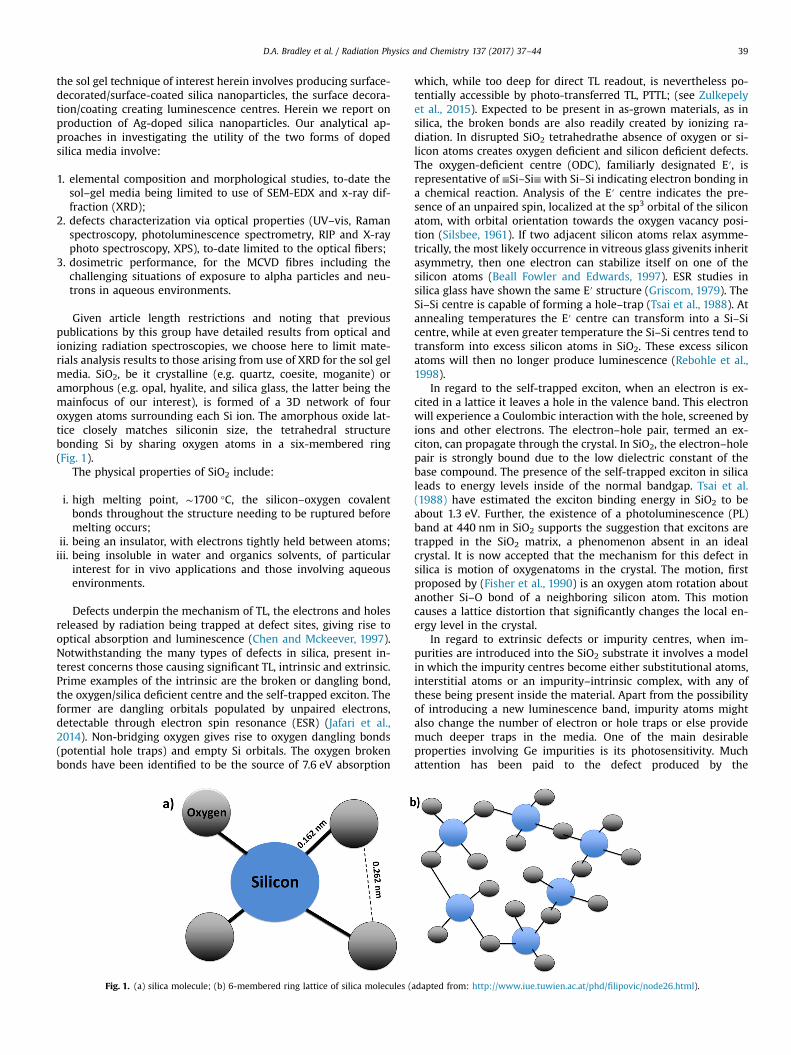
D.A. Bradley et al. / Radiation Physics and Chemistry 137 (2017) 37–44 39
the sol gel technique of interest herein involves producing surface-decorated/surface-coated silica nanoparticles, the surface decora-tion/coating creating luminescence centres. Herein we report onproduction of Ag-doped silica nanoparticles. Our analytical ap-proaches in investigating the utility of the two forms of dopedsilica media involve:
1. elemental composition and morphological studies, to-date thesol–gel media being limited to use of SEM-EDX and x-ray dif-fraction (XRD);
2. defects characterization via optical properties (UV–vis, Ramanspectroscopy, photoluminescence spectrometry, RIP and X-rayphoto spectroscopy, XPS), to-date limited to the optical fibers;
3. dosimetric performance, for the MCVD fibres including thechallenging situations of exposure to alpha particles and neu-trons in aqueous environments.
Given article length restrictions and noting that previouspublications by this group have detailed results from optical andionizing radiation spectroscopies, we choose here to limit mate-rials analysis results to those arising from use of XRD for the sol gelmedia. SiO2, be it crystalline (e.g. quartz, coesite, moganite) oramorphous (e.g. opal, hyalite, and silica glass, the latter being themainfocus of our interest), is formed of a 3D network of fouroxygen atoms surrounding each Si ion. The amorphous oxide lat-tice closely matches siliconin size, the tetrahedral structurebonding Si by sharing oxygen atoms in a six-membered ring(Fig. 1).
The physical properties of SiO2 include:
i. high melting point, ∼1700 °C, the silicon–oxygen covalentbonds throughout the structure needing to be ruptured beforemelting occurs;
ii. being an insulator, with electrons tightly held between atoms;iii. being insoluble in water and organics solvents, of particular
interest for in vivo applications and those involving aqueousenvironments.
Defects underpin the mechanism of TL, the electrons and holesreleased by radiation being trapped at defect sites, giving rise tooptical absorption and luminescence (Chen and Mckeever, 1997).Notwithstanding the many types of defects in silica, present in-terest concerns those causing significant TL, intrinsic and extrinsic.Prime examples of the intrinsic are the broken or dangling bond,the oxygen/silica deficient centre and the self-trapped exciton. Theformer are dangling orbitals populated by unpaired electrons,detectable through electron spin resonance (ESR) (Jafari et al.,2014). Non-bridging oxygen gives rise to oxygen dangling bonds(potential hole traps) and empty Si orbitals. The oxygen brokenbonds have been identified to be the source of 7.6 eV absorption
Fig. 1. (a) silica molecule; (b) 6-membered ring lattice of silica molecules (
which, while too deep for direct TL readout, is nevertheless po-tentially accessible by photo-transferred TL, PTTL; (see Zulkepelyet al., 2015). Expected to be present in as-grown materials, as insilica, the broken bonds are also readily created by ionizing ra-diation. In disrupted SiO2 tetrahedrathe absence of oxygen or si-licon atoms creates oxygen deficient and silicon deficient defects.The oxygen-deficient centre (ODC), familiarly designated E′, isrepresentative of ≡Si–Si≡ with Si–Si indicating electron bonding ina chemical reaction. Analysis of the E′ centre indicates the pre-sence of an unpaired spin, localized at the sp3 orbital of the siliconatom, with orbital orientation towards the oxygen vacancy posi-tion (Silsbee, 1961). If two adjacent silicon atoms relax asymme-trically, the most likely occurrence in vitreous glass givenits inheritasymmetry, then one electron can stabilize itself on one of thesilicon atoms (Beall Fowler and Edwards, 1997). ESR studies insilica glass have shown the same E′ structure (Griscom, 1979). TheSi–Si centre is capable of forming a hole–trap (Tsai et al., 1988). Atannealing temperatures the E′ centre can transform into a Si–Sicentre, while at even greater temperature the Si–Si centres tend totransform into excess silicon atoms in SiO2. These excess siliconatoms will then no longer produce luminescence (Rebohle et al.,1998).
In regard to the self-trapped exciton, when an electron is ex-cited in a lattice it leaves a hole in the valence band. This electronwill experience a Coulombic interaction with the hole, screened byions and other electrons. The electron–hole pair, termed an ex-citon, can propagate through the crystal. In SiO2, the electron–holepair is strongly bound due to the low dielectric constant of thebase compound. The presence of the self-trapped exciton in silicaleads to energy levels inside of the normal bandgap. Tsai et al.(1988) have estimated the exciton binding energy in SiO2 to beabout 1.3 eV. Further, the existence of a photoluminescence (PL)band at 440 nm in SiO2 supports the suggestion that excitons aretrapped in the SiO2 matrix, a phenomenon absent in an idealcrystal. It is now accepted that the mechanism for this defect insilica is motion of oxygenatoms in the crystal. The motion, firstproposed by (Fisher et al., 1990) is an oxygen atom rotation aboutanother Si–O bond of a neighboring silicon atom. This motioncauses a lattice distortion that significantly changes the local en-ergy level in the crystal.
In regard to extrinsic defects or impurity centres, when im-purities are introduced into the SiO2 substrate it involves a modelin which the impurity centres become either substitutional atoms,interstitial atoms or an impurity–intrinsic complex, with any ofthese being present inside the material. Apart from the possibilityof introducing a new luminescence band, impurity atoms mightalso change the number of electron or hole traps or else providemuch deeper traps in the media. One of the main desirableproperties involving Ge impurities is its photosensitivity. Muchattention has been paid to the defect produced by the
adapted from: http://www.iue.tuwien.ac.at/phd/filipovic/node26.html).
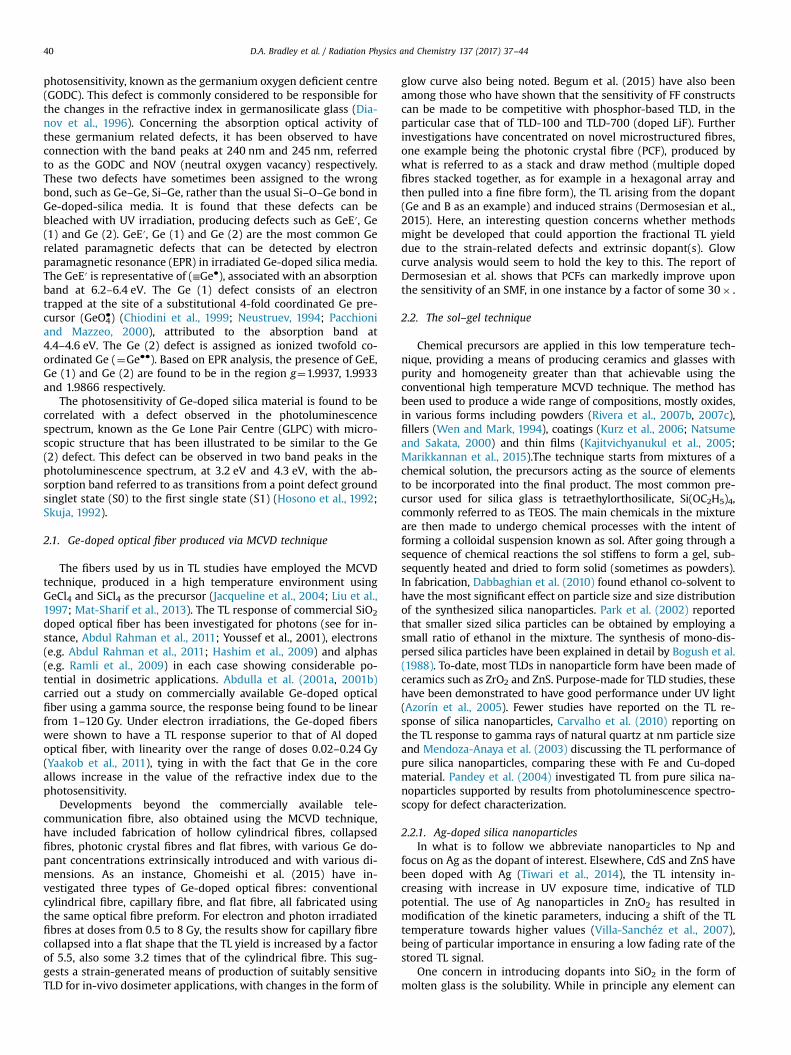
D.A. Bradley et al. / Radiation Physics and Chemistry 137 (2017) 37–4440
photosensitivity, known as the germanium oxygen deficient centre(GODC). This defect is commonly considered to be responsible forthe changes in the refractive index in germanosilicate glass (Dia-nov et al., 1996). Concerning the absorption optical activity ofthese germanium related defects, it has been observed to haveconnection with the band peaks at 240 nm and 245 nm, referredto as the GODC and NOV (neutral oxygen vacancy) respectively.These two defects have sometimes been assigned to the wrongbond, such as Ge–Ge, Si–Ge, rather than the usual Si–O–Ge bond inGe-doped-silica media. It is found that these defects can bebleached with UV irradiation, producing defects such as GeE′, Ge(1) and Ge (2). GeE′, Ge (1) and Ge (2) are the most common Gerelated paramagnetic defects that can be detected by electronparamagnetic resonance (EPR) in irradiated Ge-doped silica media.The GeE′ is representative of (≡Ge�), associated with an absorptionband at 6.2–6.4 eV. The Ge (1) defect consists of an electrontrapped at the site of a substitutional 4-fold coordinated Ge pre-cursor (GeO�4) (Chiodini et al., 1999; Neustruev, 1994; Pacchioniand Mazzeo, 2000), attributed to the absorption band at4.4–4.6 eV. The Ge (2) defect is assigned as ionized twofold co-ordinated Ge (¼Ge��). Based on EPR analysis, the presence of GeE,Ge (1) and Ge (2) are found to be in the region g¼1.9937, 1.9933and 1.9866 respectively.
The photosensitivity of Ge-doped silica material is found to becorrelated with a defect observed in the photoluminescencespectrum, known as the Ge Lone Pair Centre (GLPC) with micro-scopic structure that has been illustrated to be similar to the Ge(2) defect. This defect can be observed in two band peaks in thephotoluminescence spectrum, at 3.2 eV and 4.3 eV, with the ab-sorption band referred to as transitions from a point defect groundsinglet state (S0) to the first single state (S1) (Hosono et al., 1992;Skuja, 1992).
2.1. Ge-doped optical fiber produced via MCVD technique
The fibers used by us in TL studies have employed the MCVDtechnique, produced in a high temperature environment usingGeCl4 and SiCl4 as the precursor (Jacqueline et al., 2004; Liu et al.,1997; Mat-Sharif et al., 2013). The TL response of commercial SiO2
doped optical fiber has been investigated for photons (see for in-stance, Abdul Rahman et al., 2011; Youssef et al., 2001), electrons(e.g. Abdul Rahman et al., 2011; Hashim et al., 2009) and alphas(e.g. Ramli et al., 2009) in each case showing considerable po-tential in dosimetric applications. Abdulla et al. (2001a, 2001b)carried out a study on commercially available Ge-doped opticalfiber using a gamma source, the response being found to be linearfrom 1–120 Gy. Under electron irradiations, the Ge-doped fiberswere shown to have a TL response superior to that of Al dopedoptical fiber, with linearity over the range of doses 0.02–0.24 Gy(Yaakob et al., 2011), tying in with the fact that Ge in the coreallows increase in the value of the refractive index due to thephotosensitivity.
Developments beyond the commercially available tele-communication fibre, also obtained using the MCVD technique,have included fabrication of hollow cylindrical fibres, collapsedfibres, photonic crystal fibres and flat fibres, with various Ge do-pant concentrations extrinsically introduced and with various di-mensions. As an instance, Ghomeishi et al. (2015) have in-vestigated three types of Ge-doped optical fibres: conventionalcylindrical fibre, capillary fibre, and flat fibre, all fabricated usingthe same optical fibre preform. For electron and photon irradiatedfibres at doses from 0.5 to 8 Gy, the results show for capillary fibrecollapsed into a flat shape that the TL yield is increased by a factorof 5.5, also some 3.2 times that of the cylindrical fibre. This sug-gests a strain-generated means of production of suitably sensitiveTLD for in-vivo dosimeter applications, with changes in the form of
glow curve also being noted. Begum et al. (2015) have also beenamong those who have shown that the sensitivity of FF constructscan be made to be competitive with phosphor-based TLD, in theparticular case that of TLD-100 and TLD-700 (doped LiF). Furtherinvestigations have concentrated on novel microstructured fibres,one example being the photonic crystal fibre (PCF), produced bywhat is referred to as a stack and draw method (multiple dopedfibres stacked together, as for example in a hexagonal array andthen pulled into a fine fibre form), the TL arising from the dopant(Ge and B as an example) and induced strains (Dermosesian et al.,2015). Here, an interesting question concerns whether methodsmight be developed that could apportion the fractional TL yielddue to the strain-related defects and extrinsic dopant(s). Glowcurve analysis would seem to hold the key to this. The report ofDermosesian et al. shows that PCFs can markedly improve uponthe sensitivity of an SMF, in one instance by a factor of some 30� .
2.2. The sol–gel technique
Chemical precursors are applied in this low temperature tech-nique, providing a means of producing ceramics and glasses withpurity and homogeneity greater than that achievable using theconventional high temperature MCVD technique. The method hasbeen used to produce a wide range of compositions, mostly oxides,in various forms including powders (Rivera et al., 2007b, 2007c),fillers (Wen and Mark, 1994), coatings (Kurz et al., 2006; Natsumeand Sakata, 2000) and thin films (Kajitvichyanukul et al., 2005;Marikkannan et al., 2015).The technique starts from mixtures of achemical solution, the precursors acting as the source of elementsto be incorporated into the final product. The most common pre-cursor used for silica glass is tetraethylorthosilicate, Si(OC2H5)4,commonly referred to as TEOS. The main chemicals in the mixtureare then made to undergo chemical processes with the intent offorming a colloidal suspension known as sol. After going through asequence of chemical reactions the sol stiffens to form a gel, sub-sequently heated and dried to form solid (sometimes as powders).In fabrication, Dabbaghian et al. (2010) found ethanol co-solvent tohave the most significant effect on particle size and size distributionof the synthesized silica nanoparticles. Park et al. (2002) reportedthat smaller sized silica particles can be obtained by employing asmall ratio of ethanol in the mixture. The synthesis of mono-dis-persed silica particles have been explained in detail by Bogush et al.(1988). To-date, most TLDs in nanoparticle form have been made ofceramics such as ZrO2 and ZnS. Purpose-made for TLD studies, thesehave been demonstrated to have good performance under UV light(Azorín et al., 2005). Fewer studies have reported on the TL re-sponse of silica nanoparticles, Carvalho et al. (2010) reporting onthe TL response to gamma rays of natural quartz at nm particle sizeand Mendoza-Anaya et al. (2003) discussing the TL performance ofpure silica nanoparticles, comparing these with Fe and Cu-dopedmaterial. Pandey et al. (2004) investigated TL from pure silica na-noparticles supported by results from photoluminescence spectro-scopy for defect characterization.
2.2.1. Ag-doped silica nanoparticlesIn what is to follow we abbreviate nanoparticles to Np and
focus on Ag as the dopant of interest. Elsewhere, CdS and ZnS havebeen doped with Ag (Tiwari et al., 2014), the TL intensity in-creasing with increase in UV exposure time, indicative of TLDpotential. The use of Ag nanoparticles in ZnO2 has resulted inmodification of the kinetic parameters, inducing a shift of the TLtemperature towards higher values (Villa-Sanchéz et al., 2007),being of particular importance in ensuring a low fading rate of thestored TL signal.
One concern in introducing dopants into SiO2 in the form ofmolten glass is the solubility. While in principle any element can
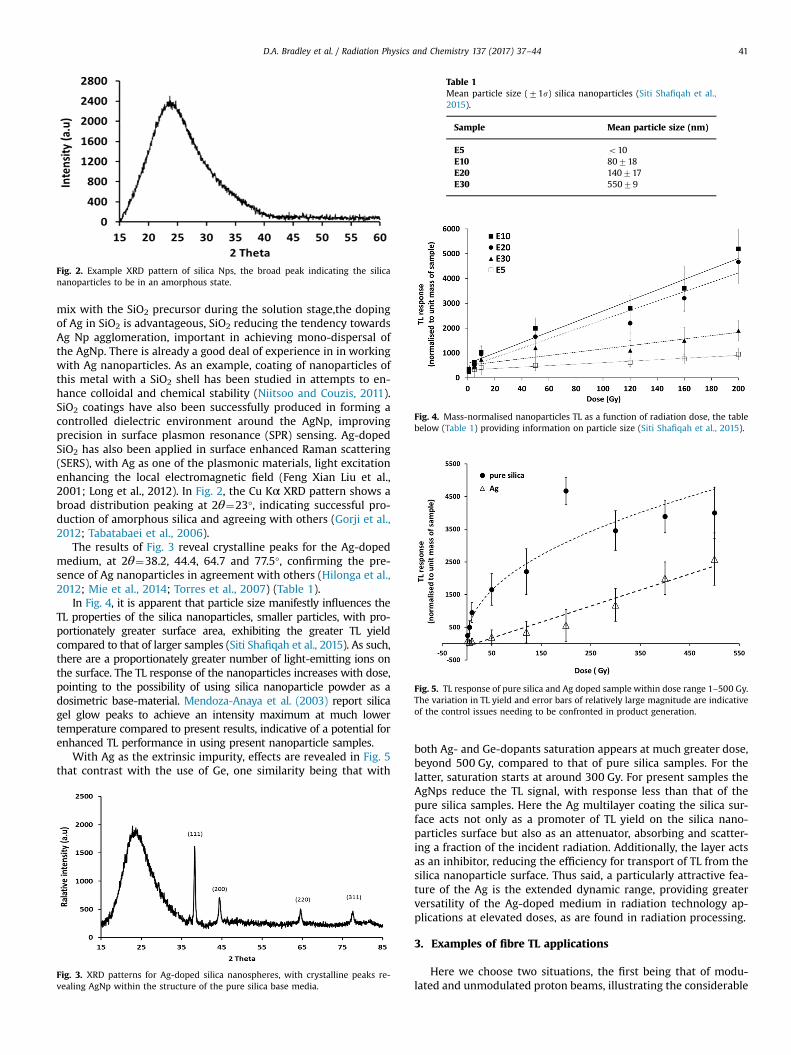
Fig. 2. Example XRD pattern of silica Nps, the broad peak indicating the silicananoparticles to be in an amorphous state.
Table 1Mean particle size (71s) silica nanoparticles (Siti Shafiqah et al.,2015).
Sample Mean particle size (nm)
E5 o10E10 80718E20 140717E30 55079
Fig. 4. Mass-normalised nanoparticles TL as a function of radiation dose, the tablebelow (Table 1) providing information on particle size (Siti Shafiqah et al., 2015).
Fig. 5. TL response of pure silica and Ag doped sample within dose range 1–500 Gy.The variation in TL yield and error bars of relatively large magnitude are indicativeof the control issues needing to be confronted in product generation.
D.A. Bradley et al. / Radiation Physics and Chemistry 137 (2017) 37–44 41
mix with the SiO2 precursor during the solution stage,the dopingof Ag in SiO2 is advantageous, SiO2 reducing the tendency towardsAg Np agglomeration, important in achieving mono-dispersal ofthe AgNp. There is already a good deal of experience in in workingwith Ag nanoparticles. As an example, coating of nanoparticles ofthis metal with a SiO2 shell has been studied in attempts to en-hance colloidal and chemical stability (Niitsoo and Couzis, 2011).SiO2 coatings have also been successfully produced in forming acontrolled dielectric environment around the AgNp, improvingprecision in surface plasmon resonance (SPR) sensing. Ag-dopedSiO2 has also been applied in surface enhanced Raman scattering(SERS), with Ag as one of the plasmonic materials, light excitationenhancing the local electromagnetic field (Feng Xian Liu et al.,2001; Long et al., 2012). In Fig. 2, the Cu Kα XRD pattern shows abroad distribution peaking at 2θ¼23°, indicating successful pro-duction of amorphous silica and agreeing with others (Gorji et al.,2012; Tabatabaei et al., 2006).
The results of Fig. 3 reveal crystalline peaks for the Ag-dopedmedium, at 2θ¼38.2, 44.4, 64.7 and 77.5°, confirming the pre-sence of Ag nanoparticles in agreement with others (Hilonga et al.,2012; Mie et al., 2014; Torres et al., 2007) (Table 1).
In Fig. 4, it is apparent that particle size manifestly influences theTL properties of the silica nanoparticles, smaller particles, with pro-portionately greater surface area, exhibiting the greater TL yieldcompared to that of larger samples (Siti Shafiqah et al., 2015). As such,there are a proportionately greater number of light-emitting ions onthe surface. The TL response of the nanoparticles increases with dose,pointing to the possibility of using silica nanoparticle powder as adosimetric base-material. Mendoza-Anaya et al. (2003) report silicagel glow peaks to achieve an intensity maximum at much lowertemperature compared to present results, indicative of a potential forenhanced TL performance in using present nanoparticle samples.
With Ag as the extrinsic impurity, effects are revealed in Fig. 5that contrast with the use of Ge, one similarity being that with
Fig. 3. XRD patterns for Ag-doped silica nanospheres, with crystalline peaks re-vealing AgNp within the structure of the pure silica base media.
both Ag- and Ge-dopants saturation appears at much greater dose,beyond 500 Gy, compared to that of pure silica samples. For thelatter, saturation starts at around 300 Gy. For present samples theAgNps reduce the TL signal, with response less than that of thepure silica samples. Here the Ag multilayer coating the silica sur-face acts not only as a promoter of TL yield on the silica nano-particles surface but also as an attenuator, absorbing and scatter-ing a fraction of the incident radiation. Additionally, the layer actsas an inhibitor, reducing the efficiency for transport of TL from thesilica nanoparticle surface. Thus said, a particularly attractive fea-ture of the Ag is the extended dynamic range, providing greaterversatility of the Ag-doped medium in radiation technology ap-plications at elevated doses, as are found in radiation processing.
3. Examples of fibre TL applications
Here we choose two situations, the first being that of modu-lated and unmodulated proton beams, illustrating the considerable
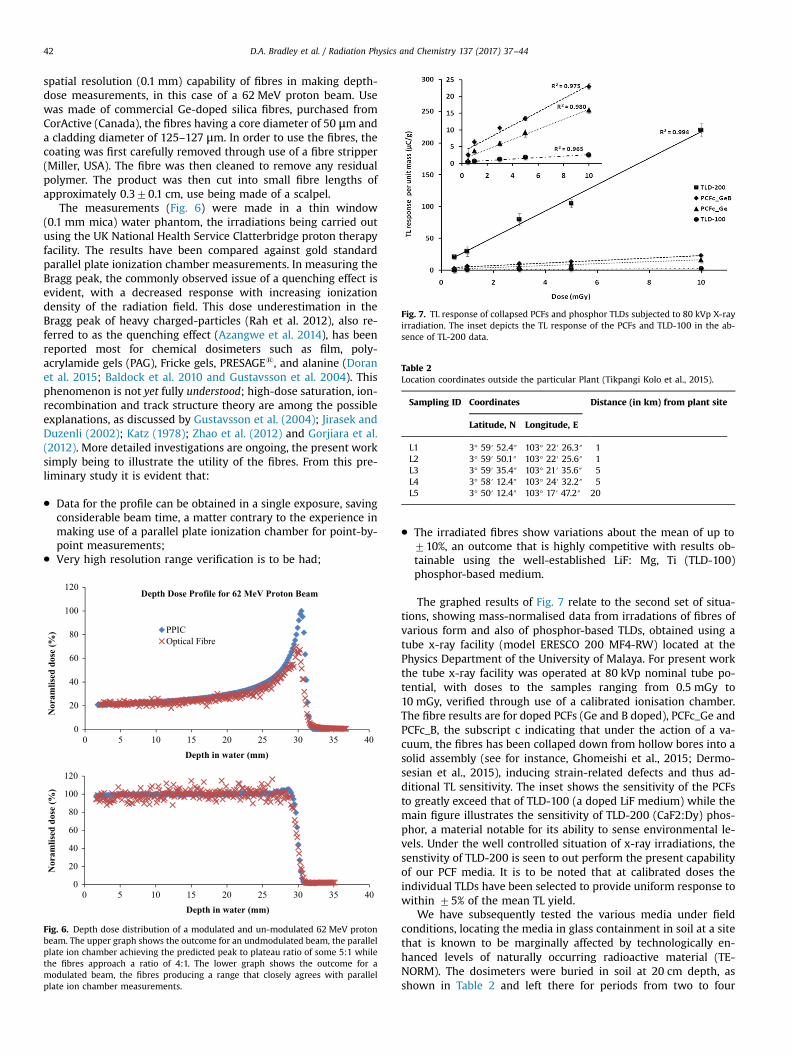
Fig. 7. TL response of collapsed PCFs and phosphor TLDs subjected to 80 kVp X-rayirradiation. The inset depicts the TL response of the PCFs and TLD-100 in the ab-sence of TL-200 data.
Table 2Location coordinates outside the particular Plant (Tikpangi Kolo et al., 2015).
Sampling ID Coordinates Distance (in km) from plant site
Latitude, N Longitude, E
L1 3° 59′ 52.4″ 103° 22′ 26.3″ 1L2 3° 59′ 50.1″ 103° 22′ 25.6″ 1L3 3° 59′ 35.4″ 103° 21′ 35.6″ 5L4 3° 58′ 12.4″ 103° 24′ 32.2″ 5L5 3° 50′ 12.4″ 103° 17′ 47.2″ 20
D.A. Bradley et al. / Radiation Physics and Chemistry 137 (2017) 37–4442
spatial resolution (0.1 mm) capability of fibres in making depth-dose measurements, in this case of a 62 MeV proton beam. Usewas made of commercial Ge-doped silica fibres, purchased fromCorActive (Canada), the fibres having a core diameter of 50 μm anda cladding diameter of 125–127 μm. In order to use the fibres, thecoating was first carefully removed through use of a fibre stripper(Miller, USA). The fibre was then cleaned to remove any residualpolymer. The product was then cut into small fibre lengths ofapproximately 0.370.1 cm, use being made of a scalpel.
The measurements (Fig. 6) were made in a thin window(0.1 mm mica) water phantom, the irradiations being carried outusing the UK National Health Service Clatterbridge proton therapyfacility. The results have been compared against gold standardparallel plate ionization chamber measurements. In measuring theBragg peak, the commonly observed issue of a quenching effect isevident, with a decreased response with increasing ionizationdensity of the radiation field. This dose underestimation in theBragg peak of heavy charged-particles (Rah et al. 2012), also re-ferred to as the quenching effect (Azangwe et al. 2014), has beenreported most for chemical dosimeters such as film, poly-acrylamide gels (PAG), Fricke gels, PRESAGEs, and alanine (Doranet al. 2015; Baldock et al. 2010 and Gustavsson et al. 2004). Thisphenomenon is not yet fully understood; high-dose saturation, ion-recombination and track structure theory are among the possibleexplanations, as discussed by Gustavsson et al. (2004); Jirasek andDuzenli (2002); Katz (1978); Zhao et al. (2012) and Gorjiara et al.(2012). More detailed investigations are ongoing, the present worksimply being to illustrate the utility of the fibres. From this pre-liminary study it is evident that:
� Data for the profile can be obtained in a single exposure, savingconsiderable beam time, a matter contrary to the experience inmaking use of a parallel plate ionization chamber for point-by-point measurements;
� Very high resolution range verification is to be had;
0
20
40
60
80
100
120
Nor
amlis
ed d
ose
(%)
Depth in water (mm)
Depth Dose Profile for 62 MeV Proton Beam
PPICOptical Fibre
0
20
40
60
80
100
120
0 5 10 15 20 25 30 35 40
0 5 10 15 20 25 30 35 40
Nor
amlis
ed d
ose
(%)
Depth in water (mm)
Fig. 6. Depth dose distribution of a modulated and un-modulated 62 MeV protonbeam. The upper graph shows the outcome for an undmodulated beam, the parallelplate ion chamber achieving the predicted peak to plateau ratio of some 5:1 whilethe fibres approach a ratio of 4:1. The lower graph shows the outcome for amodulated beam, the fibres producing a range that closely agrees with parallelplate ion chamber measurements.
� The irradiated fibres show variations about the mean of up to710%, an outcome that is highly competitive with results ob-tainable using the well-established LiF: Mg, Ti (TLD-100)phosphor-based medium.
The graphed results of Fig. 7 relate to the second set of situa-tions, showing mass-normalised data from irradations of fibres ofvarious form and also of phosphor-based TLDs, obtained using atube x-ray facility (model ERESCO 200 MF4-RW) located at thePhysics Department of the University of Malaya. For present workthe tube x-ray facility was operated at 80 kVp nominal tube po-tential, with doses to the samples ranging from 0.5 mGy to10 mGy, verified through use of a calibrated ionisation chamber.The fibre results are for doped PCFs (Ge and B doped), PCFc_Ge andPCFc_B, the subscript c indicating that under the action of a va-cuum, the fibres has been collaped down from hollow bores into asolid assembly (see for instance, Ghomeishi et al., 2015; Dermo-sesian et al., 2015), inducing strain-related defects and thus ad-ditional TL sensitivity. The inset shows the sensitivity of the PCFsto greatly exceed that of TLD-100 (a doped LiF medium) while themain figure illustrates the sensitivity of TLD-200 (CaF2:Dy) phos-phor, a material notable for its ability to sense environmental le-vels. Under the well controlled situation of x-ray irradiations, thesenstivity of TLD-200 is seen to out perform the present capabilityof our PCF media. It is to be noted that at calibrated doses theindividual TLDs have been selected to provide uniform response towithin 75% of the mean TL yield.
We have subsequently tested the various media under fieldconditions, locating the media in glass containment in soil at a sitethat is known to be marginally affected by technologically en-hanced levels of naturally occurring radioactive material (TE-NORM). The dosimeters were buried in soil at 20 cm depth, asshown in Table 2 and left there for periods from two to four
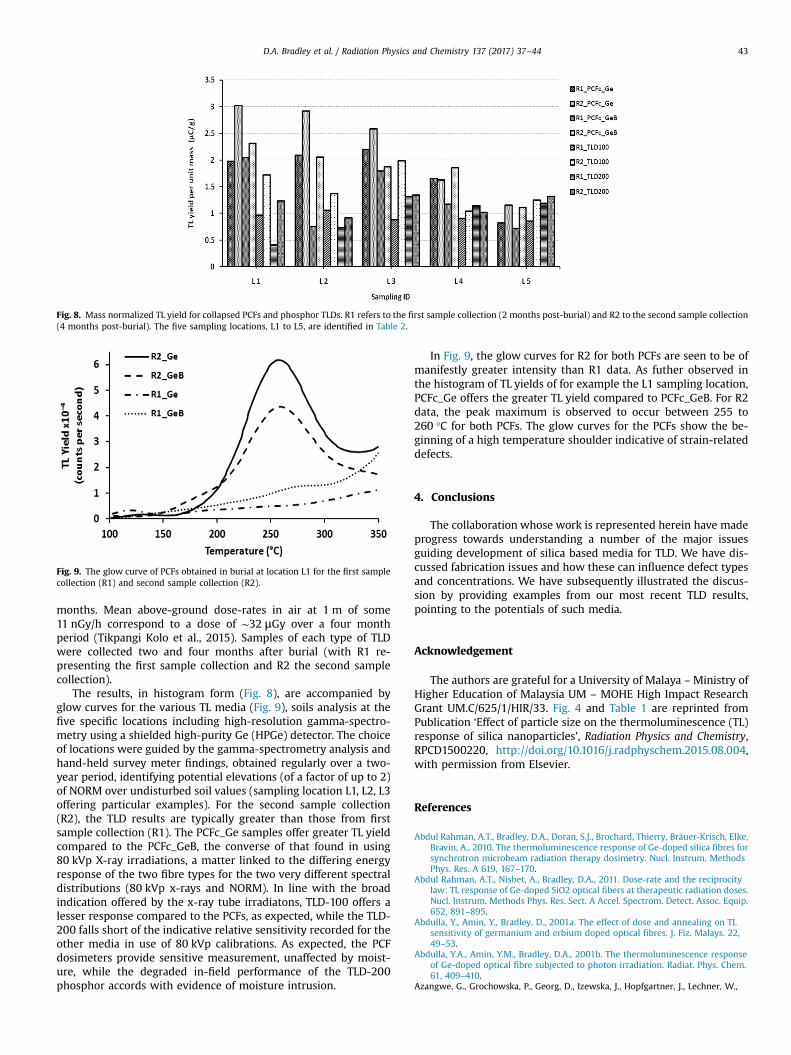
Fig. 8. Mass normalized TL yield for collapsed PCFs and phosphor TLDs. R1 refers to the first sample collection (2 months post-burial) and R2 to the second sample collection(4 months post-burial). The five sampling locations, L1 to L5, are identified in Table 2.
Fig. 9. The glow curve of PCFs obtained in burial at location L1 for the first samplecollection (R1) and second sample collection (R2).
D.A. Bradley et al. / Radiation Physics and Chemistry 137 (2017) 37–44 43
months. Mean above-ground dose-rates in air at 1 m of some11 nGy/h correspond to a dose of ∼32 μGy over a four monthperiod (Tikpangi Kolo et al., 2015). Samples of each type of TLDwere collected two and four months after burial (with R1 re-presenting the first sample collection and R2 the second samplecollection).
The results, in histogram form (Fig. 8), are accompanied byglow curves for the various TL media (Fig. 9), soils analysis at thefive specific locations including high-resolution gamma-spectro-metry using a shielded high-purity Ge (HPGe) detector. The choiceof locations were guided by the gamma-spectrometry analysis andhand-held survey meter findings, obtained regularly over a two-year period, identifying potential elevations (of a factor of up to 2)of NORM over undisturbed soil values (sampling location L1, L2, L3offering particular examples). For the second sample collection(R2), the TLD results are typically greater than those from firstsample collection (R1). The PCFc_Ge samples offer greater TL yieldcompared to the PCFc_GeB, the converse of that found in using80 kVp X-ray irradiations, a matter linked to the differing energyresponse of the two fibre types for the two very different spectraldistributions (80 kVp x-rays and NORM). In line with the broadindication offered by the x-ray tube irradiatons, TLD-100 offers alesser response compared to the PCFs, as expected, while the TLD-200 falls short of the indicative relative sensitivity recorded for theother media in use of 80 kVp calibrations. As expected, the PCFdosimeters provide sensitive measurement, unaffected by moist-ure, while the degraded in-field performance of the TLD-200phosphor accords with evidence of moisture intrusion.
In Fig. 9, the glow curves for R2 for both PCFs are seen to be ofmanifestly greater intensity than R1 data. As futher observed inthe histogram of TL yields of for example the L1 sampling location,PCFc_Ge offers the greater TL yield compared to PCFc_GeB. For R2data, the peak maximum is observed to occur between 255 to260 °C for both PCFs. The glow curves for the PCFs show the be-ginning of a high temperature shoulder indicative of strain-relateddefects.
4. Conclusions
The collaboration whose work is represented herein have madeprogress towards understanding a number of the major issuesguiding development of silica based media for TLD. We have dis-cussed fabrication issues and how these can influence defect typesand concentrations. We have subsequently illustrated the discus-sion by providing examples from our most recent TLD results,pointing to the potentials of such media.
Acknowledgement
The authors are grateful for a University of Malaya – Ministry ofHigher Education of Malaysia UM – MOHE High Impact ResearchGrant UM.C/625/1/HIR/33. Fig. 4 and Table 1 are reprinted fromPublication ‘Effect of particle size on the thermoluminescence (TL)response of silica nanoparticles’, Radiation Physics and Chemistry,RPCD1500220, http://doi.org/10.1016/j.radphyschem.2015.08.004,with permission from Elsevier.
References
Abdul Rahman, A.T., Bradley, D.A., Doran, S.J., Brochard, Thierry, Bräuer-Krisch, Elke,Bravin, A., 2010. The thermoluminescence response of Ge-doped silica fibres forsynchrotron microbeam radiation therapy dosimetry. Nucl. Instrum. MethodsPhys. Res. A 619, 167–170.
Abdul Rahman, A.T., Nisbet, A., Bradley, D.A., 2011. Dose-rate and the reciprocitylaw: TL response of Ge-doped SiO2 optical fibers at therapeutic radiation doses.Nucl. Instrum. Methods Phys. Res. Sect. A Accel. Spectrom. Detect. Assoc. Equip.652, 891–895.
Abdulla, Y., Amin, Y., Bradley, D., 2001a. The effect of dose and annealing on TLsensitivity of germanium and erbium doped optical fibres. J. Fiz. Malays. 22,49–53.
Abdulla, Y.A., Amin, Y.M., Bradley, D.A., 2001b. The thermoluminescence responseof Ge-doped optical fibre subjected to photon irradiation. Radiat. Phys. Chem.61, 409–410.
Azangwe, G., Grochowska, P., Georg, D., Izewska, J., Hopfgartner, J., Lechner, W.,
D.A. Bradley et al. / Radiation Physics and Chemistry 137 (2017) 37–4444
Andersen, N.F., Beierholm, A.R., Helt-Hansen, J., Mizuno, H., Fukumura, A., Ya-jima, K., Gouldstone, C., Sharpe, P., Meghzifene, A., Palmans, H., 2014. Detectorto detector corrections: a comprehensive experimental study of detector spe-cific correction factors for beam output measurements for small radiotherapybeams. Med. Phys. 41 (7), 072103. http://dx.doi.org/10.1118/1.4883795.
Azorín, J., Rivera, T., Furetta, C., Sánchez-Rodríguez, A., 2005. Ultraviolet inducedthermoluminescence in gadolinium-doped zirconium oxide films. Mater. Sci.Forum 480–481, 145–148.
Baldock, C., De Deene, Y., Doran, S., Ibbott, G., Jirasek, A., Lepage, M., McAuley, K.B.,Oldham, M., Schreiner, L.J., 2010. Polymer gel dosimetry. Phys. Med. Biol. 55,R1–63.
Beall Fowler, W., Edwards, A.H., 1997. Theory of defects and defect processes insilicon dioxide. J. Non-Cryst. Solids 222, 33–41.
Bogush, G.H., Tracy, M.A., Zukoski IV, C.F., 1988. Preparation of monodisperse silicaparticles: control of size and mass fraction. J. Non-Cryst. Solids 104, 95–106.
Carvalho Jr, Á.B., de, Guzzo, P.L., Sullasi, H.L., Khoury, H.J., 2010. Effect of particle sizein the TL response of natural quartz sensitized by high dose of gamma radiationand heat-treatments. Mater. Res. 13, 265–271.
Chen, R., Mckeever, S.W., 1997. Theory of Thermoluminescence and Related Phe-nomena. World Scientific Publishing Co Pte Ltd, Singapore.
Chiodini, N., Meinardi, F., Morazzoni, F., Paleari, A., Scotti, R., 1999. Optical transi-tions of paramagnetic Ge sites created by x-ray irradiation of oxygen-defect-free Ge-doped by the sol–gel method. Phys. Rev. B 60, 2429–2435.
Dabbaghian, M.A., Babalou, A.A., Hadi, P., Jannatdoust, E., 2010. A parametric studyof the synthesis of silica nanoparticles via sol–gel precipitation method. Int. J.Nanosci. Nanotechnol. 6, 104–113.
Dianov, E.M., Starodubov, D.S., Vasiliev, S.A., Frolov, A.A., Medvedkov, O.I., 1996.Near-UV photosensitivity of germanosilicate glass: application for fiber gratingfabrication. In: Conference Proceedings LEOS'96 9th Annual Meeting IEEE La-sers and Electro-Optics Society. IEEE, pp. 374–375.
Doran, S.J., Gorjiara, T., Adamovics, J., Kuncic, Z., Kacperek, A., Baldock, C., 2015. Thequenching effect in PRESAGEs dosimetry of proton beams: is an empiricalcorrection feasible? J. Phys.: Conf. Ser. 573 012043 . http://dx.doi.org/10.1088/1742-6596/573/1/012043.
Fisher, A.J., Hayes, W., Stoneham, A.M., 1990. Structure of the self-trapped exciton inquartz. Phys. Rev. Lett. 64, 2667–2670.
Gorjiara, T., Kuncic, Z., Doran, S., Adamovics, J., Baldock, C., 2012. Water and tissueequivalence of a new PRESAGE(s) formulation for 3D proton beam dosimetry:a Monte Carlo study. Med. Phys. 39 (11), 7071–7079.
Gorji, B., Ghasri, M.R.A., Fazaeli, R., Niksirat, N., 2012. Synthesis and Characteriza-tions of Silica Nanoparticles by a New Sol–Gel Method, vol. 26, pp. 22–26.
Griscom, D.L., 1979. E′ Center in glassy SiO2: microwave saturation properties andconfirmation of the primary 29Si hyperfine structure. Phys. Rev. B 20,1823–1834.
Gustavsson, H., Back, S., Lepage, M., Rintoul, L., Baldock, C., 2004. Development andoptimization of a 2-hydroxyethylacrylate MRI polymer gel dosimeter. Phys.Med. Biol. 49, 227–241.
Hashim, S., Al-Ahbabi, S., Bradley, D. a, Webb, M., Jeynes, C., Ramli, a T., Wagiran, H.,2009. The thermoluminescence response of doped SiO2 optical fibres subjectedto photon and electron irradiations. Appl. Radiat. Isot. 67, 423–427.
Hilonga, A., Kim, J.-K., Sarawade, P.B., Quang, D.V., Shao, G., Elineema, G., Kim, H.T.,2012. Silver-doped silica powder with antibacterial properties. Powder Technol.215–216, 219–222.
Hosono, H., Abe, Y., Kinser, D.L., Weeks, R.A., Muta, K., Kawazoe, H., 1992. Natureand origin of the 5-eV band in SiO2–GeO2 glasses. Phys. Rev. B 46, 11445–11451.
Jacqueline, Poumellec, A.-S., Chervin, B., Garcia-Blanco, J.C., Esnouf, S., Sa-Blanco, S.,2004. Raman investigation of structural changes induced by e-beam irradiationin Ge doped silica MCVD glasses. Mater. Sci. Eng. B 107, 46–52.
Jafari, S.M., Bradley, D.A., Gouldstone, C.A., Sharpe, P.H.G., Alalawi, A., Jordan, T.J.,Clark, C.H., Nisbet, A., Spyrou, N.M., 2014. Low-cost commercial glass beads asdosimeters in radiotherapy. Radiat. Phys. Chem. 97, 95–101.
Jirasek, A.I., Duzenli, C., 2002. Relative effectiveness of polyacrylamide gel dosi-meters applied to proton beams: Fourier transform Raman observations andtrack structure calculations. Med. Phys. 29, 569–577.
Katz, R., 1978. Track structure in radiobiology and in radiation protection. Nucl.Track Detect. 2, 1–28.
Kajitvichyanukul, P., Ananpattarachai, J., Pongpom, S., 2005. Sol–gel preparationand properties study of TiO2 thin film for photocatalytic reduction of chromium(VI) in photocatalysis process. Sci. Technol. Adv. Mater. 6, 352–358.
Kurz, A., Brakecha, K., Puetz, J., Aegerter, M.A., 2006. Strategies for novel trans-parent conducting sol–gel oxide coatings. Thin Solid Films 502, 212–218.
Liu, F.X., Qian, J.Y., Wang, X.L., Liu, L., Ming, H., 1997. UV irradiation-induced defectstudy of GeO2�SiO2 glasses by Raman spectroscopy glasses by Raman spec-troscopy. Phys. Rev. B 56, 3066–3071.
Marikkannan, M., Vishnukanthan, V., Vijayshankar, A., Mayandi, J., Pearce, J.M.,2015. A novel synthesis of tin oxide thin films by the sol–gel process for op-toelectronic applications. AIP Adv. 5, 027122.
Mat-Sharif, K.A., Zulkifli, M.I., Muhamad-Yassin, S.Z., Tamchek, N., Aljamimi, S.M.,Yusoff, A., Amin, Y.M., Shafiqah, S.A.S., Abdul-Rashid, H.A., 2013. Effect of GeClflow ratio on Germanium incorporation in MCVD process. In: Proceedings ofthe 2013 IEEE 4th International Conference on Photonics (ICP). IEEE, pp. 284–287.
Mendoza-Anaya, D., Angeles, C., Salas, P., Rodríguez, R., Castaño, V.M., 2003. Na-noparticle-enhanced thermoluminescence in silica gels. Nanotechnology 14,L19–L22.
Mie, R., Samsudin, M.W., Din, L.B., Ahmad, A., Ibrahim, N., Adnan, S.N.A., 2014.Synthesis of silver nanoparticles with antibacterial activity using the lichenParmotrema praesorediosum. Int. J. Nanomed. 9, 121–127.
Natsume, Y., Sakata, H., 2000. Zinc oxide films prepared by sol–gel spin-coating.Thin Solid Films 372, 30–36.
Neustruev, V.B., 1994. Colour centres in germanosilicate glass and optical fibres. J.Phys. Condens. Matter 6, 6901–6936.
Niitsoo, O., Couzis, A., 2011. Facile synthesis of silver core-silica shell compositenanoparticles. J. Colloid Interface Sci. 354, 887–890.
Pacchioni, G., Mazzeo, C., 2000. Paramagnetic centers in Ge-doped silica: a first-principles study. Phys. Rev. B 62, 5452–5460.
Pandey, A., Sahare, P.D., Shahnawaz, Kanjilal, D., 2004. Thermoluminescence andphotoluminescence characteristics of sol–gel prepared pure and europiumdoped silica glasses. J. Phys. D Appl. Phys. 37, 842–846.
Park, S.K., Kim, K., Do, Kim, H.T., 2002. Preparation of silica nanoparticles: de-termination of the optimal synthesis conditions for small and uniform particles.Colloids Surfaces A Physicochem. Eng. Asp. 197, 7–17.
Ramli, A.T., Bradley, D.A., Hashim, S., Wagiran, H., 2009. The thermoluminescenceresponse of doped SiO2 optical fibres subjected to alpha-particle irradiation.Appl. Radiat. Isot. 67, 428–432.
Rebohle, L., von Borany, J., Grötzschel, R., Markwitz, A., Schmidt, B., Tyschenko, I.E.,Skoruba, W., Fröb, H., Leo, K., 1998. Strong blue and violet photo- and elec-troluminescence from Ge- and Si-implanted silicon dioxide. Phys. Status Solidi165, 31–35.
Rivera, T., Azorin, J., Barrera, M., Soto, A.M., 2007a. Nanostructural processing ofadvanced thermoluminescent materials. Radiat. Eff. Defects Solids 162,731–736.
Rivera, T., Furetta, C., Azorín, J., Barrera, M., Soto, A.M., 2007b. Thermoluminescence(TL) of europium-doped ZrO2 obtained by sol–gel method. Radiat. Eff. DefectsSolids 162, 379–383.
Rivera, T., Olvera, L., Martínez, A., Molina, D., Azorín, J., Barrera, M., Soto, A.M., Sosa,R., Furetta, C., 2007c. Thermoluminescence properties of copper doped zirco-nium oxide for UVR dosimetry. Radiat. Meas. 42, 665–667.
Silsbee, R.H., 1961. Electron spin resonance in neutron-irradiated quartz. J. Appl.Phys. 32, 1459.
Siti Shafiqah, A., Amin, Y., Md Nor, R., Bradley, D., 2015. Effect of particle size on thethermoluminescence (TL) response of silica nanoparticles. Radiat. Phys. Chem.,RPCD1500220
Skuja, L., 1992. Isoelectronic series of twofold coordinated Si, Ge, and Sn atoms inglassy SiO2: a luminescence study. J. Non-Cryst. Solids 149, 77–95.
Tabatabaei, S., Shukohfar, a, Aghababazadeh, R., Mirhabibi, a, 2006. Experimentalstudy of the synthesis and characterisation of silica nanoparticles via the sol–gel method. J. Phys. Conf. Ser. 26, 371–374.
Tiwari, R., Bala Taunk, P., Tamrakar, R.K., Swamy, N.K., Dubey, V., 2014. Synthesis,characterization and thermoluminescence behavior of (Cd, Zn)S mixed phos-phor doped with silver. Chalcogenide Lett. 11, 141–158.
Torres, V., Popa, M., Crespo, D., Calderón Moreno, J.M., 2007. Silver nanoprismcoatings on optical glass substrates. Microelectron. Eng. 84, 1665–1668.
Tsai, T.E., Griscom, D.L., Friebele, E.J., 1988. Mechanism of intrinsic Si E -centerphotogeneration in high-purity silica. Phys. Rev. Lett. 61, 444–446.
Villa-Sanchéz, G., Mendoza-Anaya, D., Gutiérrez-Wing, C., Pérez-Hernández, R.,González-Martínez, P.R., Ángeles-Chavez, C., 2007. Ag nanoparticle effects onthe thermoluminescent properties of monoclinic ZrO2 exposed to ultravioletand gamma radiation. Nanotechnology 18, 265703.
Wang, Q., Tie, C., Dai, K., 2012. Thermoluminescence of Al2O3 : Cr3þ films synthe-sized by the nonaqueous sol–gel method. Radiat. Eff. Defects Solids 167,361–366.
Wen, J., Mark, J.E., 1994. Precipitation of silica-titania mixed-oxide fillers into poly(Dimethylsiloxane) networks. Rubber Chem. Technol. 67, 806–819.
Yaakob, N.H., Wagiran, H., Hossain, M.I., Ramli, A.T., Bradley, D.A., Hashim, S., Ali, H.,2011. Thermoluminescence response of Ge- and Al-doped optical fibers sub-jected to low-dose electron irradiation. J. Nucl. Sci. Technol. 48, 1115–1117.
Zhao, L., Newton, J., Oldham, M., Das, I.J., Cheng, C.W., Adamovics, J., 2012. Feasi-bility of using PRESAGEs for relative 3D dosimetry of small proton fields. Phys.Med. Biol. 57, 431–443.
Zulkepely, N.N., Amin, Y.M., Md Nor, R., Bradley, D. a, Maah, M.J., Mat Nawi, S.N.,Wahib, N.F., 2015. Preliminary results on the photo-transferred thermo-luminescence from Ge-doped SiO2 optical fiber. Radiat. Phys. Chem. 117,108–111.
Applied Radiation and Isotopes 117 (2016) 128–134Appendix B
Contents lists available at ScienceDirect
Applied Radiation and Isotopes
http://d0969-80
n Corrford, Su
E-m
journal homepage: www.elsevier.com/locate/apradiso
Latest developments in silica-based thermoluminescencespectrometry and dosimetry
D.A. Bradley a,b,n, S.M. Jafari a,c, A.S. Siti Shafiqah d, N. Tamcheck e, A. Shutt f, Z. Siti Rozaila b,S.F. Abdul Sani b, Siti Norbaini Sabtu b, Abdulaziz Alanazi a, G. Amouzad Mahdiraji g,H.A. Abdul Rashid h, M.J. Maah i
a Department of Physics, University of Surrey, Guildford, Surrey GU2 7XH, UKb Department of Physics, University of Malaya, 50603 Kuala Lumpur, Malaysiac Radiotherapy Physics, Level B, Queen Alexandra Hospital, Portsmouth PO6 3LY, UKd Department of Physics, Kuliyah of Science, International Islamic University Malaysia, 25200 Kuantan, Malaysiae Department of Physics, Universiti Putra Malaysia, 43400 Serdang, Selangor, Malaysiaf Public Health England, CRCE, Chilton, Didcot, Oxon OX11 0RQ, UKg Integrated Lightwave Research Group, Department of Electrical Engineering, Faculty of Engineering, University of Malaya, 50603 Kuala Lumpur, Malaysiah Faculty of Engineering, Multimedia University, 2010 Cyberjaya, Selangor, Malaysiai Department of Chemistry, University of Malaya, 50603 Kuala Lumpur, Malaysia
H I G H L I G H T S
� We provide a status report for our work on silica-doped media for TL dosimetry.
� The construction and performance of a TL emission spectra facility is described.� Oxygen-rich/oxygen deficient Ge-doped SiO2 defects/lattice relaxation phenomena are related to TL spectra.� Ge-doped SiO2 are used to obtain high spatial-resolution Am–Be neutron source measurements.a r t i c l e i n f o
Article history:Received 29 October 2015Received in revised form8 December 2015Accepted 9 December 2015Available online 22 December 2015
Keywords:DosimetryGe-doped silica fibreThermoluminescenceGlass beads TLDs
x.doi.org/10.1016/j.apradiso.2015.12.03443/& 2015 Elsevier Ltd. All rights reserved.
esponding author at: Department of Physicsrrey GU2 7XH, UK.ail address: [email protected] (D.A. Bra
a b s t r a c t
Using irradiated doped-silica preforms from which fibres for thermoluminescence dosimetry applica-tions can be fabricated we have carried out a range of luminescence studies, the TL yield of the fibresystems offering many advantages over conventional passive dosimetry types. In this paper we in-vestigate such media, showing emission spectra for irradiated preforms and the TL response of glassbeads following irradiation to an 241Am–Be neutron source located in a tank of water, the glass fibres andbeads offering the advantage of being able to be placed directly into liquid. The outcomes from these andother lines of research are intended to inform development of doped silica radiation dosimeters ofversatile utility, extending from environmental evaluations through to clinical and industrial applica-tions.
& 2015 Elsevier Ltd. All rights reserved.
1. Introduction
Over the past three years the consortium effort that this workrepresents has focused on developing small diameter (0.1 mmthrough to ∼1 mm) GeO2 doped SiO2 glass fibres for luminescencedosimetry. For the same reasons, we have also investigated com-mercial jewellery beads of various diameters (1–3 mm), with theadditional benefit of reduced cost and robust utility. Both media
, University of Surrey, Guild-
dley).
are silica based, with compositional studies being carried out tolocate and quantify dopants within the silica; see for instance theelemental analysis studies of beads, conducted by Jafari et al.(2014a). The intention has been to produce high spatial resolutionthermoluminescence dosimeters (TL) for sensitive radiationdetection.
For the preforms from which the fibres are produced, using acustom-built spectrometer we show first results for emissionwavelengths, revealing the predominant wavelengths to be to-wards the blue end of the visible spectrum. In respect of TL yield,we are seeking to define optimal concentrations of GeO2 in SiO2
fibres, to-date the dopant concentration being incremented from
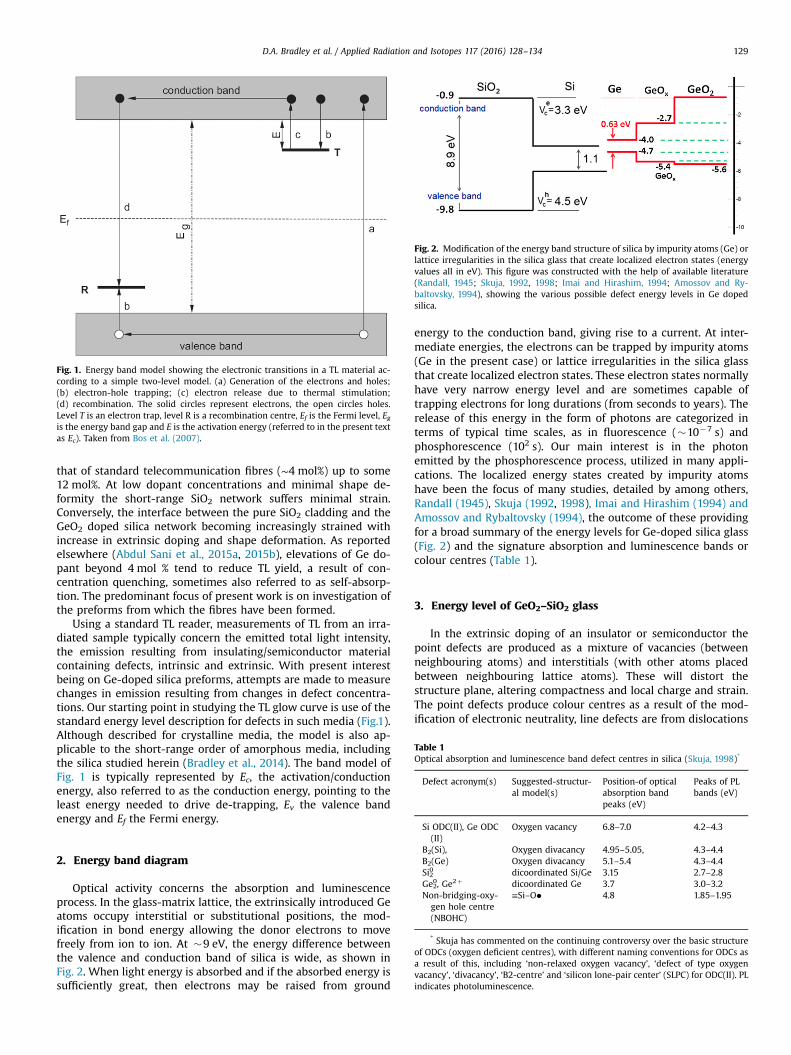
Fig. 1. Energy band model showing the electronic transitions in a TL material ac-cording to a simple two-level model. (a) Generation of the electrons and holes;(b) electron-hole trapping; (c) electron release due to thermal stimulation;(d) recombination. The solid circles represent electrons, the open circles holes.Level T is an electron trap, level R is a recombination centre, Ef is the Fermi level, Egis the energy band gap and E is the activation energy (referred to in the present textas Ec). Taken from Bos et al. (2007).
Fig. 2. Modification of the energy band structure of silica by impurity atoms (Ge) orlattice irregularities in the silica glass that create localized electron states (energyvalues all in eV). This figure was constructed with the help of available literature(Randall, 1945; Skuja, 1992, 1998; Imai and Hirashim, 1994; Amossov and Ry-baltovsky, 1994), showing the various possible defect energy levels in Ge dopedsilica.
Table 1Optical absorption and luminescence band defect centres in silica (Skuja, 1998)*
Defect acronym(s) Suggested-structur-al model(s)
Position-of opticalabsorption bandpeaks (eV)
Peaks of PLbands (eV)
D.A. Bradley et al. / Applied Radiation and Isotopes 117 (2016) 128–134 129
that of standard telecommunication fibres (∼4 mol%) up to some12 mol%. At low dopant concentrations and minimal shape de-formity the short-range SiO2 network suffers minimal strain.Conversely, the interface between the pure SiO2 cladding and theGeO2 doped silica network becoming increasingly strained withincrease in extrinsic doping and shape deformation. As reportedelsewhere (Abdul Sani et al., 2015a, 2015b), elevations of Ge do-pant beyond 4 mol % tend to reduce TL yield, a result of con-centration quenching, sometimes also referred to as self-absorp-tion. The predominant focus of present work is on investigation ofthe preforms from which the fibres have been formed.
Using a standard TL reader, measurements of TL from an irra-diated sample typically concern the emitted total light intensity,the emission resulting from insulating/semiconductor materialcontaining defects, intrinsic and extrinsic. With present interestbeing on Ge-doped silica preforms, attempts are made to measurechanges in emission resulting from changes in defect concentra-tions. Our starting point in studying the TL glow curve is use of thestandard energy level description for defects in such media (Fig.1).Although described for crystalline media, the model is also ap-plicable to the short-range order of amorphous media, includingthe silica studied herein (Bradley et al., 2014). The band model ofFig. 1 is typically represented by Ec, the activation/conductionenergy, also referred to as the conduction energy, pointing to theleast energy needed to drive de-trapping, Ev the valence bandenergy and Ef the Fermi energy.
Si ODC(II), Ge ODC(II)
Oxygen vacancy 6.8–7.0 4.2–4.3
B2(Si), Oxygen divacancy 4.95–5.05, 4.3–4.4B2(Ge) Oxygen divacancy 5.1–5.4 4.3–4.4Si02 dicoordinated Si/Ge 3.15 2.7–2.8Ge02, Ge2þ dicoordinated Ge 3.7 3.0–3.2Non-bridging-oxy-gen hole centre(NBOHC)
≡Si–O� 4.8 1.85–1.95
* Skuja has commented on the continuing controversy over the basic structureof ODCs (oxygen deficient centres), with different naming conventions for ODCs asa result of this, including ‘non-relaxed oxygen vacancy’, ‘defect of type oxygenvacancy’, ‘divacancy’, ‘B2-centre’ and ‘silicon lone-pair center’ (SLPC) for ODC(II). PLindicates photoluminescence.
2. Energy band diagram
Optical activity concerns the absorption and luminescenceprocess. In the glass-matrix lattice, the extrinsically introduced Geatoms occupy interstitial or substitutional positions, the mod-ification in bond energy allowing the donor electrons to movefreely from ion to ion. At �9 eV, the energy difference betweenthe valence and conduction band of silica is wide, as shown inFig. 2. When light energy is absorbed and if the absorbed energy issufficiently great, then electrons may be raised from ground
energy to the conduction band, giving rise to a current. At inter-mediate energies, the electrons can be trapped by impurity atoms(Ge in the present case) or lattice irregularities in the silica glassthat create localized electron states. These electron states normallyhave very narrow energy level and are sometimes capable oftrapping electrons for long durations (from seconds to years). Therelease of this energy in the form of photons are categorized interms of typical time scales, as in fluorescence (�10�7 s) andphosphorescence (102 s). Our main interest is in the photonemitted by the phosphorescence process, utilized in many appli-cations. The localized energy states created by impurity atomshave been the focus of many studies, detailed by among others,Randall (1945), Skuja (1992, 1998), Imai and Hirashim (1994) andAmossov and Rybaltovsky (1994), the outcome of these providingfor a broad summary of the energy levels for Ge-doped silica glass(Fig. 2) and the signature absorption and luminescence bands orcolour centres (Table 1).
3. Energy level of GeO2–SiO2 glass
In the extrinsic doping of an insulator or semiconductor thepoint defects are produced as a mixture of vacancies (betweenneighbouring atoms) and interstitials (with other atoms placedbetween neighbouring lattice atoms). These will distort thestructure plane, altering compactness and local charge and strain.The point defects produce colour centres as a result of the mod-ification of electronic neutrality, line defects are from dislocations
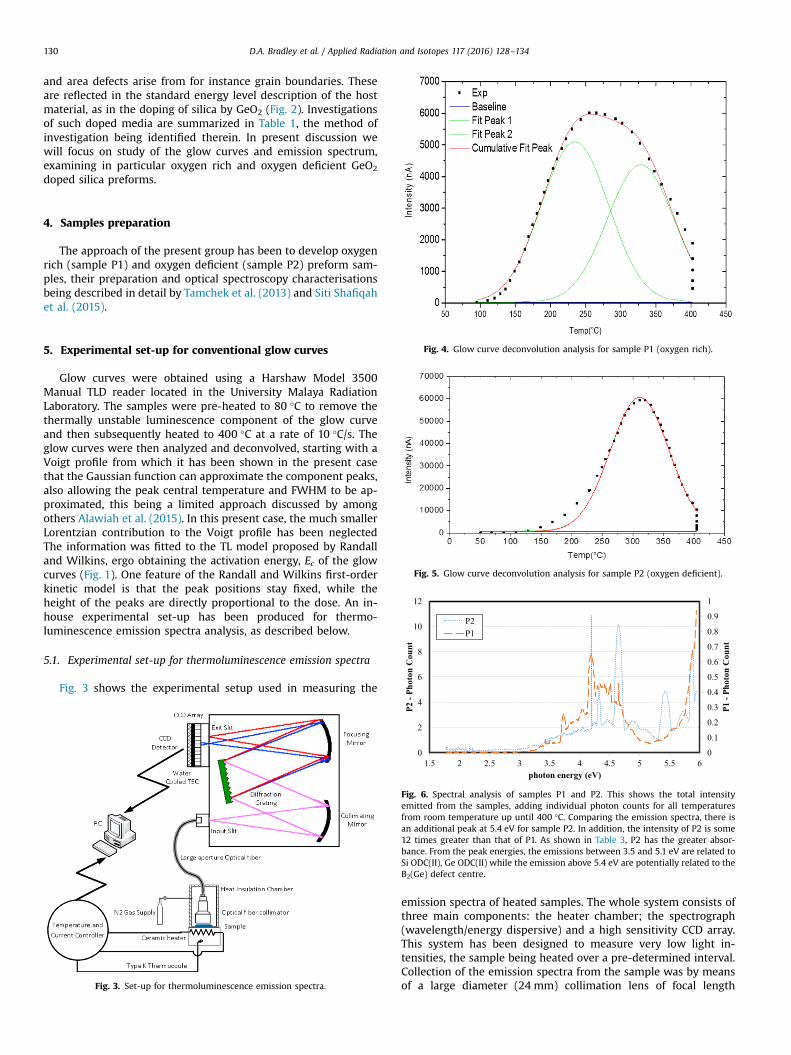
D.A. Bradley et al. / Applied Radiation and Isotopes 117 (2016) 128–134130
and area defects arise from for instance grain boundaries. Theseare reflected in the standard energy level description of the hostmaterial, as in the doping of silica by GeO2 (Fig. 2). Investigationsof such doped media are summarized in Table 1, the method ofinvestigation being identified therein. In present discussion wewill focus on study of the glow curves and emission spectrum,examining in particular oxygen rich and oxygen deficient GeO2
doped silica preforms.
4. Samples preparation
The approach of the present group has been to develop oxygenrich (sample P1) and oxygen deficient (sample P2) preform sam-ples, their preparation and optical spectroscopy characterisationsbeing described in detail by Tamchek et al. (2013) and Siti Shafiqahet al. (2015).
Fig. 4. Glow curve deconvolution analysis for sample P1 (oxygen rich).
Fig. 5. Glow curve deconvolution analysis for sample P2 (oxygen deficient).
0.4
0.5
0.6
0.7
0.8
0.9
1
6
8
10
12
Pho
ton
Cou
nt
Pho
ton
Cou
nt
P2 P1
5. Experimental set-up for conventional glow curves
Glow curves were obtained using a Harshaw Model 3500Manual TLD reader located in the University Malaya RadiationLaboratory. The samples were pre-heated to 80 °C to remove thethermally unstable luminescence component of the glow curveand then subsequently heated to 400 °C at a rate of 10 °C/s. Theglow curves were then analyzed and deconvolved, starting with aVoigt profile from which it has been shown in the present casethat the Gaussian function can approximate the component peaks,also allowing the peak central temperature and FWHM to be ap-proximated, this being a limited approach discussed by amongothers Alawiah et al. (2015). In this present case, the much smallerLorentzian contribution to the Voigt profile has been neglectedThe information was fitted to the TL model proposed by Randalland Wilkins, ergo obtaining the activation energy, Ec of the glowcurves (Fig. 1). One feature of the Randall and Wilkins first-orderkinetic model is that the peak positions stay fixed, while theheight of the peaks are directly proportional to the dose. An in-house experimental set-up has been produced for thermo-luminescence emission spectra analysis, as described below.
5.1. Experimental set-up for thermoluminescence emission spectra
Fig. 3 shows the experimental setup used in measuring the
Fig. 3. Set-up for thermoluminescence emission spectra.
0
0.1
0.2
0.3
0
2
4
1.5 2 2.5 3 3.5 4 4.5 5 5.5 6
P1 -
P2 -
photon energy (eV)
Fig. 6. Spectral analysis of samples P1 and P2. This shows the total intensityemitted from the samples, adding individual photon counts for all temperaturesfrom room temperature up until 400 °C. Comparing the emission spectra, there isan additional peak at 5.4 eV for sample P2. In addition, the intensity of P2 is some12 times greater than that of P1. As shown in Table 3, P2 has the greater absor-bance. From the peak energies, the emissions between 3.5 and 5.1 eV are related toSi ODC(II), Ge ODC(II) while the emission above 5.4 eV are potentially related to theB2(Ge) defect centre.
emission spectra of heated samples. The whole system consists ofthree main components: the heater chamber; the spectrograph(wavelength/energy dispersive) and a high sensitivity CCD array.This system has been designed to measure very low light in-tensities, the sample being heated over a pre-determined interval.Collection of the emission spectra from the sample was by meansof a large diameter (24 mm) collimation lens of focal length
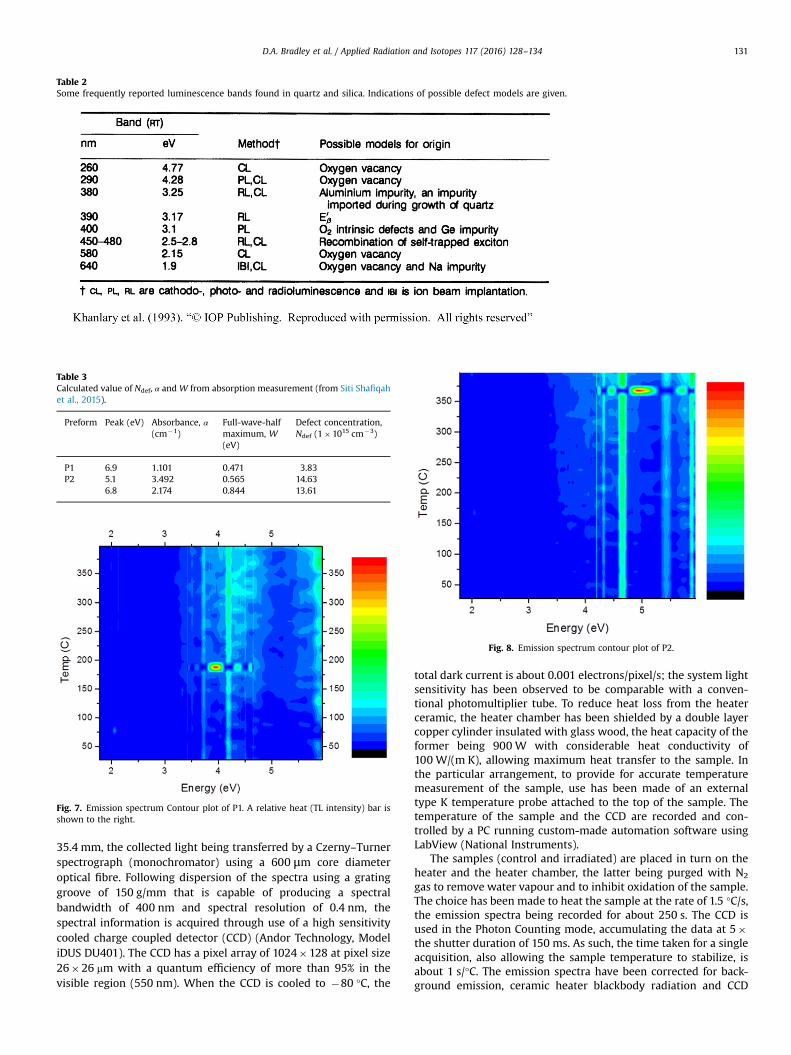
Table 2Some frequently reported luminescence bands found in quartz and silica. Indications of possible defect models are given.
Table 3Calculated value of Ndef, α and W from absorption measurement (from Siti Shafiqahet al., 2015).
Preform Peak (eV) Absorbance, α(cm�1)
Full-wave-halfmaximum, W(eV)
Defect concentration,Ndef (1�1015 cm�3)
P1 6.9 1.101 0.471 3.83P2 5.1 3.492 0.565 14.63
6.8 2.174 0.844 13.61
Fig. 7. Emission spectrum Contour plot of P1. A relative heat (TL intensity) bar isshown to the right.
Fig. 8. Emission spectrum contour plot of P2.
D.A. Bradley et al. / Applied Radiation and Isotopes 117 (2016) 128–134 131
35.4 mm, the collected light being transferred by a Czerny–Turnerspectrograph (monochromator) using a 600 μm core diameteroptical fibre. Following dispersion of the spectra using a gratinggroove of 150 g/mm that is capable of producing a spectralbandwidth of 400 nm and spectral resolution of 0.4 nm, thespectral information is acquired through use of a high sensitivitycooled charge coupled detector (CCD) (Andor Technology, ModeliDUS DU401). The CCD has a pixel array of 1024�128 at pixel size26�26 mm with a quantum efficiency of more than 95% in thevisible region (550 nm). When the CCD is cooled to �80 °C, the
total dark current is about 0.001 electrons/pixel/s; the system lightsensitivity has been observed to be comparable with a conven-tional photomultiplier tube. To reduce heat loss from the heaterceramic, the heater chamber has been shielded by a double layercopper cylinder insulated with glass wood, the heat capacity of theformer being 900 W with considerable heat conductivity of100 W/(m K), allowing maximum heat transfer to the sample. Inthe particular arrangement, to provide for accurate temperaturemeasurement of the sample, use has been made of an externaltype K temperature probe attached to the top of the sample. Thetemperature of the sample and the CCD are recorded and con-trolled by a PC running custom-made automation software usingLabView (National Instruments).
The samples (control and irradiated) are placed in turn on theheater and the heater chamber, the latter being purged with N2
gas to remove water vapour and to inhibit oxidation of the sample.The choice has been made to heat the sample at the rate of 1.5 °C/s,the emission spectra being recorded for about 250 s. The CCD isused in the Photon Counting mode, accumulating the data at 5�the shutter duration of 150 ms. As such, the time taken for a singleacquisition, also allowing the sample temperature to stabilize, isabout 1 s/°C. The emission spectra have been corrected for back-ground emission, ceramic heater blackbody radiation and CCD
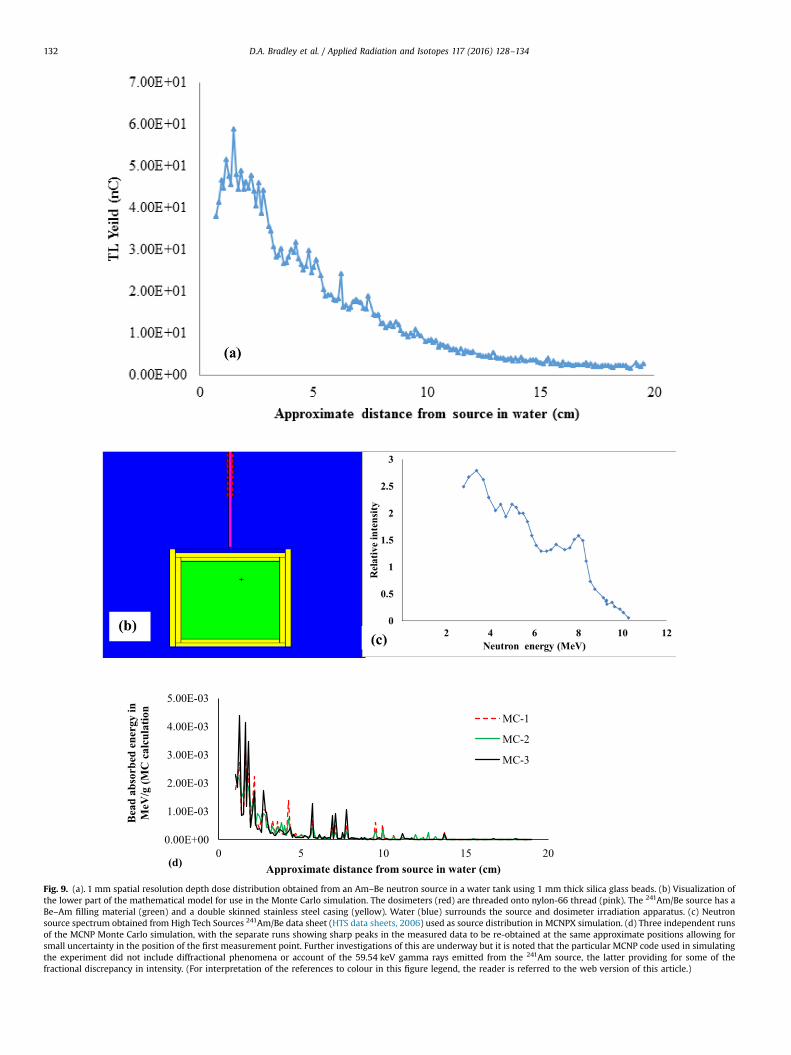
Fig. 9. (a). 1 mm spatial resolution depth dose distribution obtained from an Am–Be neutron source in a water tank using 1 mm thick silica glass beads. (b) Visualization ofthe lower part of the mathematical model for use in the Monte Carlo simulation. The dosimeters (red) are threaded onto nylon-66 thread (pink). The 241Am/Be source has aBe–Am filling material (green) and a double skinned stainless steel casing (yellow). Water (blue) surrounds the source and dosimeter irradiation apparatus. (c) Neutronsource spectrum obtained from High Tech Sources 241Am/Be data sheet (HTS data sheets, 2006) used as source distribution in MCNPX simulation. (d) Three independent runsof the MCNP Monte Carlo simulation, with the separate runs showing sharp peaks in the measured data to be re-obtained at the same approximate positions allowing forsmall uncertainty in the position of the first measurement point. Further investigations of this are underway but it is noted that the particular MCNP code used in simulatingthe experiment did not include diffractional phenomena or account of the 59.54 keV gamma rays emitted from the 241Am source, the latter providing for some of thefractional discrepancy in intensity. (For interpretation of the references to colour in this figure legend, the reader is referred to the web version of this article.)
D.A. Bradley et al. / Applied Radiation and Isotopes 117 (2016) 128–134132
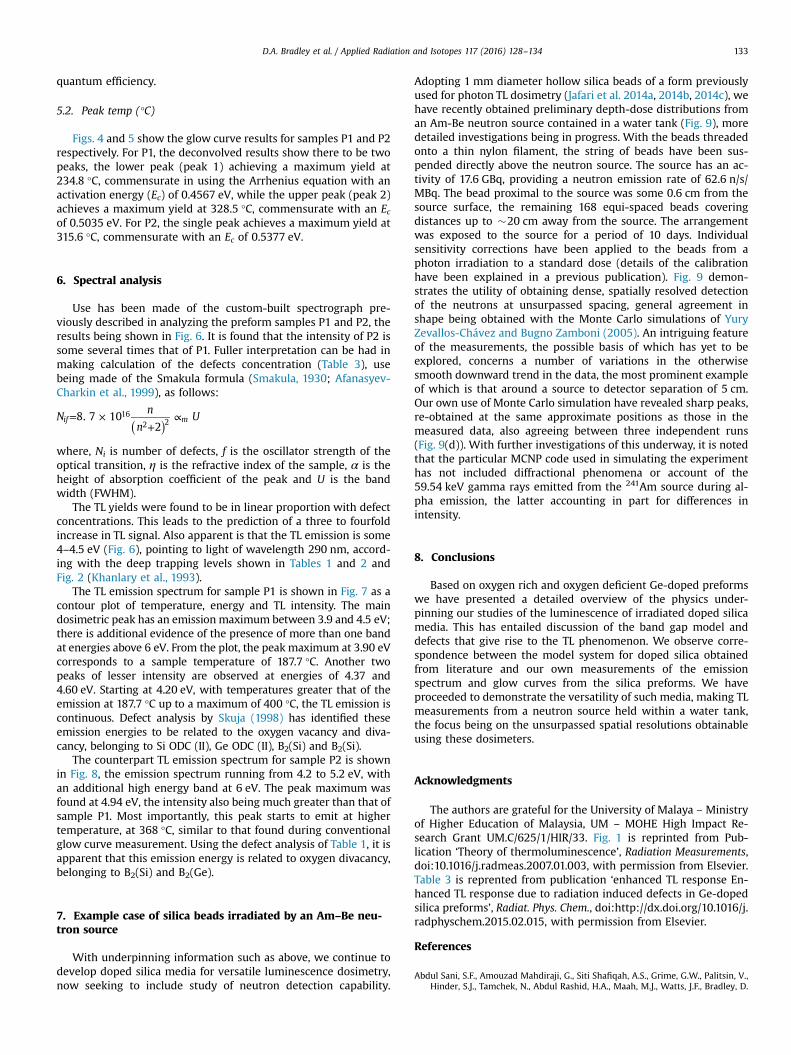
D.A. Bradley et al. / Applied Radiation and Isotopes 117 (2016) 128–134 133
quantum efficiency.
5.2. Peak temp (°C)
Figs. 4 and 5 show the glow curve results for samples P1 and P2respectively. For P1, the deconvolved results show there to be twopeaks, the lower peak (peak 1) achieving a maximum yield at234.8 °C, commensurate in using the Arrhenius equation with anactivation energy (Ec) of 0.4567 eV, while the upper peak (peak 2)achieves a maximum yield at 328.5 °C, commensurate with an Ecof 0.5035 eV. For P2, the single peak achieves a maximum yield at315.6 °C, commensurate with an Ec of 0.5377 eV.
6. Spectral analysis
Use has been made of the custom-built spectrograph pre-viously described in analyzing the preform samples P1 and P2, theresults being shown in Fig. 6. It is found that the intensity of P2 issome several times that of P1. Fuller interpretation can be had inmaking calculation of the defects concentration (Table 3), usebeing made of the Smakula formula (Smakula, 1930; Afanasyev-Charkin et al., 1999), as follows:
( )= ×
+∝N
n
nU8. 7 10
2if m
162 2
where, Ni is number of defects, f is the oscillator strength of theoptical transition, η is the refractive index of the sample, α is theheight of absorption coefficient of the peak and U is the bandwidth (FWHM).
The TL yields were found to be in linear proportion with defectconcentrations. This leads to the prediction of a three to fourfoldincrease in TL signal. Also apparent is that the TL emission is some4–4.5 eV (Fig. 6), pointing to light of wavelength 290 nm, accord-ing with the deep trapping levels shown in Tables 1 and 2 andFig. 2 (Khanlary et al., 1993).
The TL emission spectrum for sample P1 is shown in Fig. 7 as acontour plot of temperature, energy and TL intensity. The maindosimetric peak has an emission maximum between 3.9 and 4.5 eV;there is additional evidence of the presence of more than one bandat energies above 6 eV. From the plot, the peak maximum at 3.90 eVcorresponds to a sample temperature of 187.7 °C. Another twopeaks of lesser intensity are observed at energies of 4.37 and4.60 eV. Starting at 4.20 eV, with temperatures greater that of theemission at 187.7 °C up to a maximum of 400 °C, the TL emission iscontinuous. Defect analysis by Skuja (1998) has identified theseemission energies to be related to the oxygen vacancy and diva-cancy, belonging to Si ODC (II), Ge ODC (II), B2(Si) and B2(Si).
The counterpart TL emission spectrum for sample P2 is shownin Fig. 8, the emission spectrum running from 4.2 to 5.2 eV, withan additional high energy band at 6 eV. The peak maximum wasfound at 4.94 eV, the intensity also being much greater than that ofsample P1. Most importantly, this peak starts to emit at highertemperature, at 368 °C, similar to that found during conventionalglow curve measurement. Using the defect analysis of Table 1, it isapparent that this emission energy is related to oxygen divacancy,belonging to B2(Si) and B2(Ge).
7. Example case of silica beads irradiated by an Am–Be neu-tron source
With underpinning information such as above, we continue todevelop doped silica media for versatile luminescence dosimetry,now seeking to include study of neutron detection capability.
Adopting 1 mm diameter hollow silica beads of a form previouslyused for photon TL dosimetry (Jafari et al. 2014a, 2014b, 2014c), wehave recently obtained preliminary depth-dose distributions froman Am-Be neutron source contained in a water tank (Fig. 9), moredetailed investigations being in progress. With the beads threadedonto a thin nylon filament, the string of beads have been sus-pended directly above the neutron source. The source has an ac-tivity of 17.6 GBq, providing a neutron emission rate of 62.6 n/s/MBq. The bead proximal to the source was some 0.6 cm from thesource surface, the remaining 168 equi-spaced beads coveringdistances up to �20 cm away from the source. The arrangementwas exposed to the source for a period of 10 days. Individualsensitivity corrections have been applied to the beads from aphoton irradiation to a standard dose (details of the calibrationhave been explained in a previous publication). Fig. 9 demon-strates the utility of obtaining dense, spatially resolved detectionof the neutrons at unsurpassed spacing, general agreement inshape being obtained with the Monte Carlo simulations of YuryZevallos-Chávez and Bugno Zamboni (2005). An intriguing featureof the measurements, the possible basis of which has yet to beexplored, concerns a number of variations in the otherwisesmooth downward trend in the data, the most prominent exampleof which is that around a source to detector separation of 5 cm.Our own use of Monte Carlo simulation have revealed sharp peaks,re-obtained at the same approximate positions as those in themeasured data, also agreeing between three independent runs(Fig. 9(d)). With further investigations of this underway, it is notedthat the particular MCNP code used in simulating the experimenthas not included diffractional phenomena or account of the59.54 keV gamma rays emitted from the 241Am source during al-pha emission, the latter accounting in part for differences inintensity.
8. Conclusions
Based on oxygen rich and oxygen deficient Ge-doped preformswe have presented a detailed overview of the physics under-pinning our studies of the luminescence of irradiated doped silicamedia. This has entailed discussion of the band gap model anddefects that give rise to the TL phenomenon. We observe corre-spondence between the model system for doped silica obtainedfrom literature and our own measurements of the emissionspectrum and glow curves from the silica preforms. We haveproceeded to demonstrate the versatility of such media, making TLmeasurements from a neutron source held within a water tank,the focus being on the unsurpassed spatial resolutions obtainableusing these dosimeters.
Acknowledgments
The authors are grateful for the University of Malaya – Ministryof Higher Education of Malaysia, UM – MOHE High Impact Re-search Grant UM.C/625/1/HIR/33. Fig. 1 is reprinted from Pub-lication ‘Theory of thermoluminescence’, Radiation Measurements,doi:10.1016/j.radmeas.2007.01.003, with permission from Elsevier.Table 3 is reprented from publication ‘enhanced TL response En-hanced TL response due to radiation induced defects in Ge-dopedsilica preforms’, Radiat. Phys. Chem., doi:http://dx.doi.org/10.1016/j.radphyschem.2015.02.015, with permission from Elsevier.
References
Abdul Sani, S.F., Amouzad Mahdiraji, G., Siti Shafiqah, A.S., Grime, G.W., Palitsin, V.,Hinder, S.J., Tamchek, N., Abdul Rashid, H.A., Maah, M.J., Watts, J.F., Bradley, D.
D.A. Bradley et al. / Applied Radiation and Isotopes 117 (2016) 128–134134
A., 2015. Xps and PIXE analysis of doped silica fibre for radiation dosimetry. J.Light Technol. http://dx.doi.org/10.1109/jlt.2015.2406394 17118-2014
Abdul Sani, S.F., Grime, G.W., Palitsin, V., Amouzad Mahdiraji, G., Abdul Rashid, H.A.,Maah, M.J., Bradley, D.A., 2015b. Micro-PIXE analysis of doped SiO2 fibres in-tended as TL dosimeters for radiation measurements. X-Ray Spectrom. http://dx.doi.org/10.1002/xrs.2575
Afanasyev-Charkin, I.V., Gritsyna, V.T., Cooke, D.W., Bennet, B.L., Evans, C.R., Hol-lander, M.G., Sickafus, K.E., 1999. Nucl. Intsrum. Methods Phys. Res. B 148,787–792.
Alawiah, A., Bauk, S., Marashdeh, M.W., Nazura, M.Z.N., Abdul-Rashid, H.A., Yusoff,Z., Gieszczyk, W., Noramaliza, M.N, MahamdAdikan, F.R., Mahdiraji, G.A., Tam-chek, N., Muhd-Yassin, S.Z., Mat-Sharif, K.A., Zulkifli, M.I., Omar, N., Wa-nAbdullah, W.S., Bradley, D.A., 2015. The thermoluminescence glow curve andthe deconvoluted glow peak characteristics of erbium doped silica fiber ex-posed to 70–130 kVp x-rays. Appl. Radiat. Isot., 197–202.
Amossov, A.V., Rybaltovsky, A.O., 1994. Oxygen-deficient centers in silica glasses: areview of their properties and structure. J. Non -Cryst. Solids 179, 75–83.
Bos, A.J.J., et al., 2007. Theory of thermoluminescence. Radiat. Meas. 41, S45–S56.http://dx.doi.org/10.1016/j.radmeas.2007.01.003.
Bradley, D.A., Abdul Sani Siti, F., Alalawi Amani, I., Jafari, S.M., Noor, N.M., HairulAzhar, A.R., Mahdiraji, G.A., Tamchek, N., Ghosh, S., Paul, M.C., Alzimami, K.S.,Nisbet, A., 2014. Development of tailor-made silica fibres for TL dosimetry.Radiat. Phys. Chem. 10, 3–9, http://dx.doi.org/10.1016/j.radphyschem.2014.03.042.
Imai, Hiroaki, Hirashima, Hiroshi, 1994. Intrinsic- and extrinsic-defect formation insilica glasses by radiation. J. Non -Cryst. Solids 179, 202–213.
HTS data sheet, 2006. Americium/beryllium neutron source data sheet. Publishedby High Tech Sources LTD, Didcot, Oxon, OX11 7HP, UK.
Jafari, S.M., Jordan, T.J., Hussein, M., Bradley, D.A., Clark, C.H., Nisbet, A., Spyrou, N.M., 2014a. Energy response of glass bead TLDs irradiated with radiation therapybeams. Radiat. Phys. Chem. 104, 208–211.
Jafari, S.M., Bradley, D.A., Gouldstone, C.A., Sharpe, P.H.G., Alalawi, A., Jordan, T.J.,Clark, C.H., Nisbet, A., Spyrou, N.M., 2014b. Low-cost commercial glass beads asdosimeters in radiotherapy. Radiat. Phys. Chem. 97, 95–101.
Jafari, S.M., Alalawi, A.I., Hussein, M., Alsaleh, W., Najem, M.A., Bradley, D.A., Spyrou,N.M., Clark, C.H., Nisbet, A., 2014c. Glass beads and Ge-doped optical fibres asthermoluminescence dosimeters for small field photon dosimetry. Phys. Med.Biol. 59, 6875–6889.
Khanlary, M.R., Townsend, P.D., Townsend, J.E., 1993. Luminescence spectra ofgermanosilicate optical fibres. I. Radioluminescence and cathodoluminescence.
J. Phys. D.: Appl. Phys. 26, 371–378.Randall, J.T., 1945. Phosphorescence and electron traps I. The study of trap dis-
tributions. Proc. R. Soc. Lond. A 1945 184 365-389 . http://dx.doi.org/10.1098/rspa.1945.0024.
Siti Shafiqah, A.S., Amin, Y.M., Md Nor, R., Tamchek, N., Bradley, D.A., 2015. En-hanced TL response due to radiation induced defects in Ge-doped silica pre-forms. Radiat. Phys. Chem. 111, 87–90, doi:http://dx.doi.org/10.1016/j.radphyschem.2015.02.015.
Skuja, L., 1992. Isoelectronic series of twofold coordinated Si, Ge, and Sn atoms inglassy SiO2: a luminescence Study. J. Non -Cryst. Solids 149, 77–95.
Skuja, L., 1998. Optically active oxygen-deficiency-related centers in amorphoussilicon dioxide. J. Non -Cryst. Solids 239, 16–48.
Smakula, A., 1930. Über Erregung und Entfärbung lichtelektrisch leitender Alkali-halogenide. Z. Phys. 59, 603–614.
Tamchek, N., Siti Shafiqah, A.S., Amin, Y.M., Mat-Sharif, K.A., Abdul-Rashid, H.A.,Optical properties of GeO2-doped silica preform from absorption and vibra-tional spectroscopy. In: Proceedings of the 4th International Conference onPhotonics, ICP 2013. Conference Proceeding 6687120, pp. 221–223 doi:10.1109/ICP.2013.6687120.
Yury Zevallos-Chávez, J., Bugno Zamboni, C., 2005. Evaluation of the neutron fluxdistribution in an Am–Be irradiator using the MCNP-4C code. Braz. J. Phys., 35,http://dx.doi.org/10.1590/S0103-97332005000500020.
Further readings
Brown, F.B., Kahler, A.C., McKinney, G.W., Mosteller, R.D., White, M.G., 2007.MCNP5þDataþMCNPX Workshop. Workshop presentation at the 2007 ANSMathematics & Computation Division Topical Meeting (M&CþSNA-2007),Monterey, CA, April 15, 2007, (LA-UR-07-2053).
Golias, E., Tsetseris, L., Dimoulas, A., 2011. Ge-related impurities in high-k oxides:caries traps and interaction with native defects. Microelectron. Eng. 88,1432–1435.
Jacqueline, A.S., Poumellec, B., 2005. Microstructural and defect population changein electron beam irradiated Ge:SiO2 MCVD glasses in the conditions of re-fractive index change writing. J. Non-Cryst. Solids 351; , pp. 1196–1201.
Jia-Yu, Zhang, Yong-hong, Ye, Xi-Mao, Bao, 1998. Photoluminescence of defects inGeþ ion implanted thermal SiO2 films. J. Non -Cryst. Solids 241, 184–189.
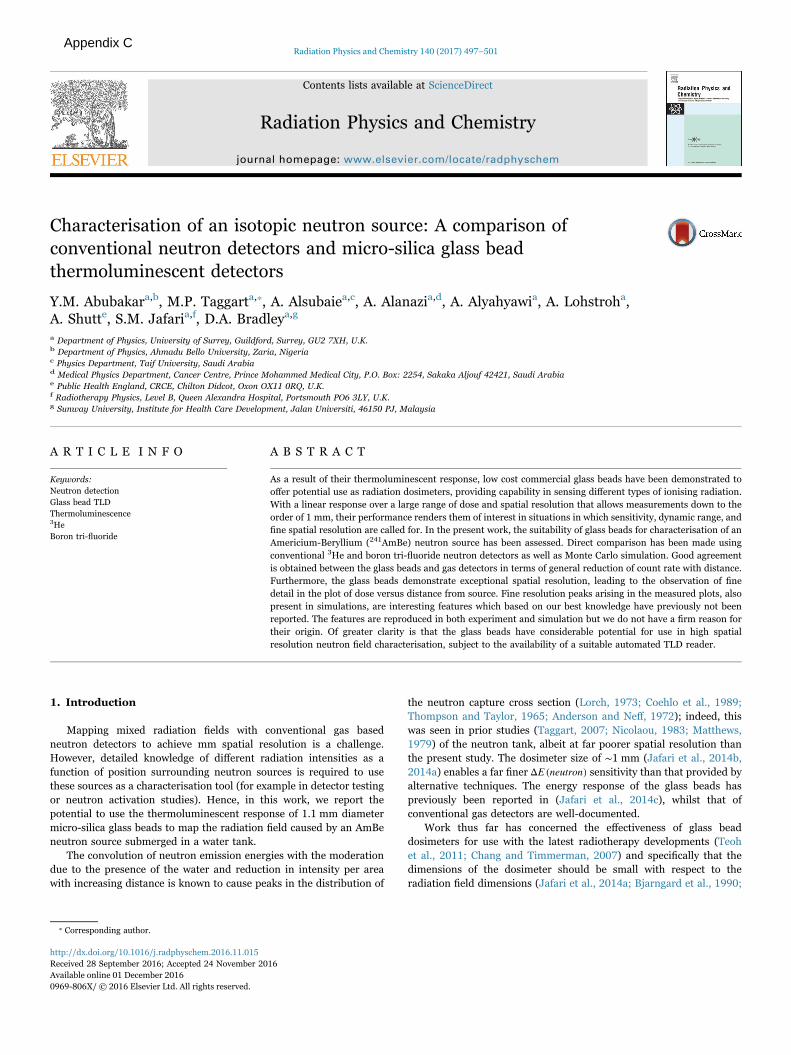
Contents lists available at ScienceDirect
Radiation Physics and Chemistry
journal homepage: www.elsevier.com/locate/radphyschem
Characterisation of an isotopic neutron source: A comparison ofconventional neutron detectors and micro-silica glass beadthermoluminescent detectors
Y.M. Abubakara,b, M.P. Taggarta,⁎, A. Alsubaiea,c, A. Alanazia,d, A. Alyahyawia, A. Lohstroha,A. Shutte, S.M. Jafaria,f, D.A. Bradleya,g
a Department of Physics, University of Surrey, Guildford, Surrey, GU2 7XH, U.K.b Department of Physics, Ahmadu Bello University, Zaria, Nigeriac Physics Department, Taif University, Saudi Arabiad Medical Physics Department, Cancer Centre, Prince Mohammed Medical City, P.O. Box: 2254, Sakaka Aljouf 42421, Saudi Arabiae Public Health England, CRCE, Chilton Didcot, Oxon OX11 0RQ, U.K.f Radiotherapy Physics, Level B, Queen Alexandra Hospital, Portsmouth PO6 3LY, U.K.g Sunway University, Institute for Health Care Development, Jalan Universiti, 46150 PJ, Malaysia
A R T I C L E I N F O
Keywords:Neutron detectionGlass bead TLDThermoluminescence3HeBoron tri-fluoride
A B S T R A C T
As a result of their thermoluminescent response, low cost commercial glass beads have been demonstrated tooffer potential use as radiation dosimeters, providing capability in sensing different types of ionising radiation.With a linear response over a large range of dose and spatial resolution that allows measurements down to theorder of 1 mm, their performance renders them of interest in situations in which sensitivity, dynamic range, andfine spatial resolution are called for. In the present work, the suitability of glass beads for characterisation of anAmericium-Beryllium (241AmBe) neutron source has been assessed. Direct comparison has been made usingconventional 3He and boron tri-fluoride neutron detectors as well as Monte Carlo simulation. Good agreementis obtained between the glass beads and gas detectors in terms of general reduction of count rate with distance.Furthermore, the glass beads demonstrate exceptional spatial resolution, leading to the observation of finedetail in the plot of dose versus distance from source. Fine resolution peaks arising in the measured plots, alsopresent in simulations, are interesting features which based on our best knowledge have previously not beenreported. The features are reproduced in both experiment and simulation but we do not have a firm reason fortheir origin. Of greater clarity is that the glass beads have considerable potential for use in high spatialresolution neutron field characterisation, subject to the availability of a suitable automated TLD reader.
1. Introduction
Mapping mixed radiation fields with conventional gas basedneutron detectors to achieve mm spatial resolution is a challenge.However, detailed knowledge of different radiation intensities as afunction of position surrounding neutron sources is required to usethese sources as a characterisation tool (for example in detector testingor neutron activation studies). Hence, in this work, we report thepotential to use the thermoluminescent response of 1.1 mm diametermicro-silica glass beads to map the radiation field caused by an AmBeneutron source submerged in a water tank.
The convolution of neutron emission energies with the moderationdue to the presence of the water and reduction in intensity per areawith increasing distance is known to cause peaks in the distribution of
the neutron capture cross section (Lorch, 1973; Coehlo et al., 1989;Thompson and Taylor, 1965; Anderson and Neff, 1972); indeed, thiswas seen in prior studies (Taggart, 2007; Nicolaou, 1983; Matthews,1979) of the neutron tank, albeit at far poorer spatial resolution thanthe present study. The dosimeter size of ∼1 mm (Jafari et al., 2014b,2014a) enables a far finer E neutronΔ ( ) sensitivity than that provided byalternative techniques. The energy response of the glass beads haspreviously been reported in (Jafari et al., 2014c), whilst that ofconventional gas detectors are well-documented.
Work thus far has concerned the effectiveness of glass beaddosimeters for use with the latest radiotherapy developments (Teohet al., 2011; Chang and Timmerman, 2007) and specifically that thedimensions of the dosimeter should be small with respect to theradiation field dimensions (Jafari et al., 2014a; Bjarngard et al., 1990;
http://dx.doi.org/10.1016/j.radphyschem.2016.11.015Received 28 September 2016; Accepted 24 November 2016
⁎ Corresponding author.
Radiation Physics and Chemistry 140 (2017) 497–501
Available online 01 December 20160969-806X/ © 2016 Elsevier Ltd. All rights reserved.
MARK
Appendix C
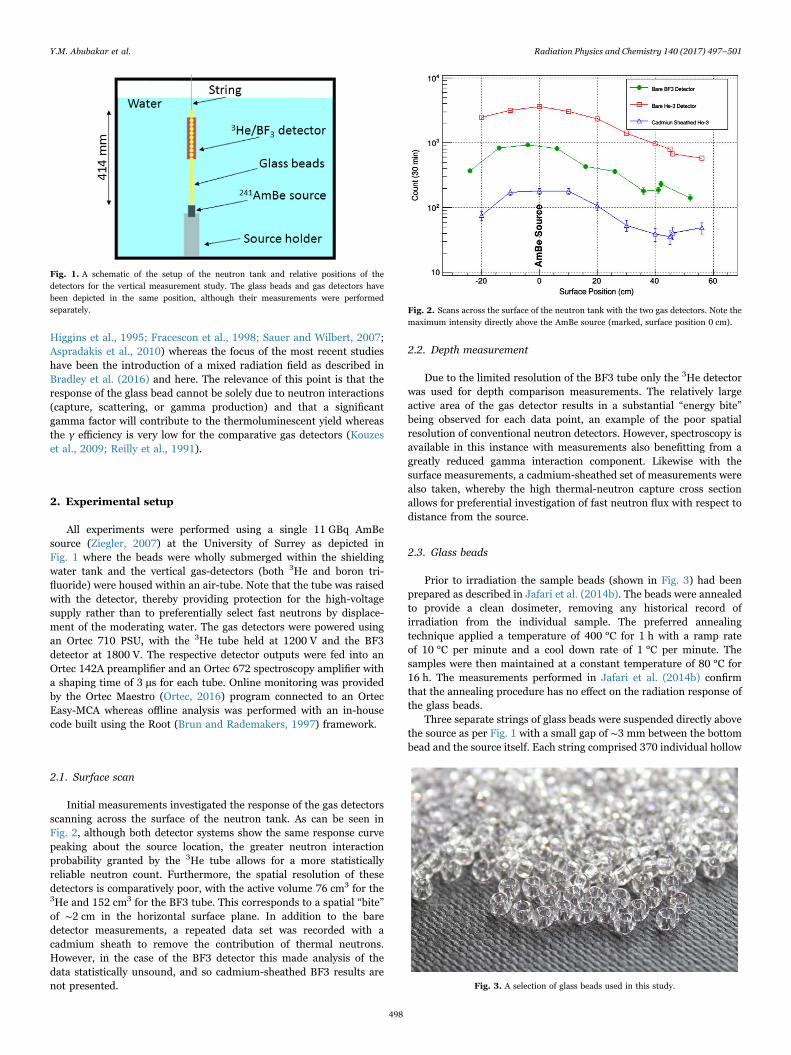
Higgins et al., 1995; Fracescon et al., 1998; Sauer and Wilbert, 2007;Aspradakis et al., 2010) whereas the focus of the most recent studieshave been the introduction of a mixed radiation field as described inBradley et al. (2016) and here. The relevance of this point is that theresponse of the glass bead cannot be solely due to neutron interactions(capture, scattering, or gamma production) and that a significantgamma factor will contribute to the thermoluminescent yield whereasthe γ efficiency is very low for the comparative gas detectors (Kouzeset al., 2009; Reilly et al., 1991).
2. Experimental setup
All experiments were performed using a single 11 GBq AmBesource (Ziegler, 2007) at the University of Surrey as depicted inFig. 1 where the beads were wholly submerged within the shieldingwater tank and the vertical gas-detectors (both 3He and boron tri-fluoride) were housed within an air-tube. Note that the tube was raisedwith the detector, thereby providing protection for the high-voltagesupply rather than to preferentially select fast neutrons by displace-ment of the moderating water. The gas detectors were powered usingan Ortec 710 PSU, with the 3He tube held at 1200 V and the BF3detector at 1800 V. The respective detector outputs were fed into anOrtec 142A preamplifier and an Ortec 672 spectroscopy amplifier witha shaping time of 3 μs for each tube. Online monitoring was providedby the Ortec Maestro (Ortec, 2016) program connected to an OrtecEasy-MCA whereas offline analysis was performed with an in-housecode built using the Root (Brun and Rademakers, 1997) framework.
2.1. Surface scan
Initial measurements investigated the response of the gas detectorsscanning across the surface of the neutron tank. As can be seen inFig. 2, although both detector systems show the same response curvepeaking about the source location, the greater neutron interactionprobability granted by the 3He tube allows for a more statisticallyreliable neutron count. Furthermore, the spatial resolution of thesedetectors is comparatively poor, with the active volume 76 cm3 for the3He and 152 cm3 for the BF3 tube. This corresponds to a spatial “bite”of ∼2 cm in the horizontal surface plane. In addition to the baredetector measurements, a repeated data set was recorded with acadmium sheath to remove the contribution of thermal neutrons.However, in the case of the BF3 detector this made analysis of thedata statistically unsound, and so cadmium-sheathed BF3 results arenot presented.
2.2. Depth measurement
Due to the limited resolution of the BF3 tube only the 3He detectorwas used for depth comparison measurements. The relatively largeactive area of the gas detector results in a substantial “energy bite”being observed for each data point, an example of the poor spatialresolution of conventional neutron detectors. However, spectroscopy isavailable in this instance with measurements also benefitting from agreatly reduced gamma interaction component. Likewise with thesurface measurements, a cadmium-sheathed set of measurements werealso taken, whereby the high thermal-neutron capture cross sectionallows for preferential investigation of fast neutron flux with respect todistance from the source.
2.3. Glass beads
Prior to irradiation the sample beads (shown in Fig. 3) had beenprepared as described in Jafari et al. (2014b). The beads were annealedto provide a clean dosimeter, removing any historical record ofirradiation from the individual sample. The preferred annealingtechnique applied a temperature of 400 °C for 1 h with a ramp rateof 10 °C per minute and a cool down rate of 1 °C per minute. Thesamples were then maintained at a constant temperature of 80 °C for16 h. The measurements performed in Jafari et al. (2014b) confirmthat the annealing procedure has no effect on the radiation response ofthe glass beads.
Three separate strings of glass beads were suspended directly abovethe source as per Fig. 1 with a small gap of ∼3 mm between the bottombead and the source itself. Each string comprised 370 individual hollow
Fig. 1. A schematic of the setup of the neutron tank and relative positions of thedetectors for the vertical measurement study. The glass beads and gas detectors havebeen depicted in the same position, although their measurements were performedseparately. Fig. 2. Scans across the surface of the neutron tank with the two gas detectors. Note the
maximum intensity directly above the AmBe source (marked, surface position 0 cm).
Fig. 3. A selection of glass beads used in this study.
Y.M. Abubakar et al. Radiation Physics and Chemistry 140 (2017) 497–501
498
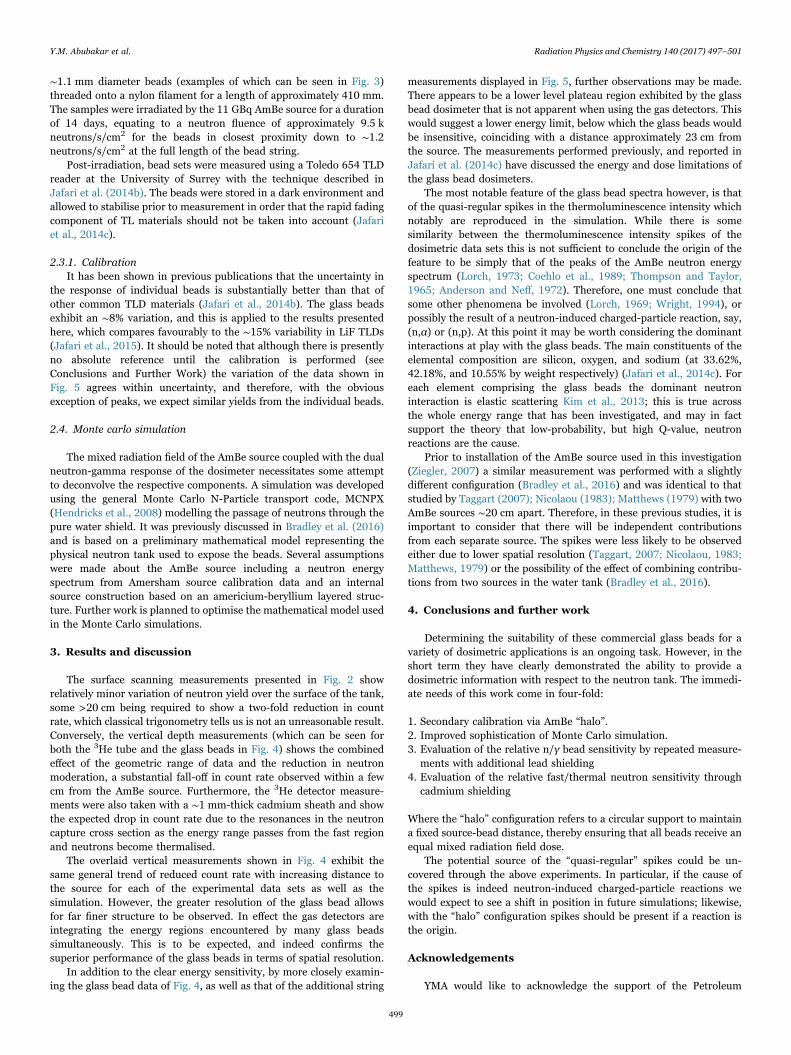
∼1.1 mm diameter beads (examples of which can be seen in Fig. 3)threaded onto a nylon filament for a length of approximately 410 mm.The samples were irradiated by the 11 GBq AmBe source for a durationof 14 days, equating to a neutron fluence of approximately 9.5 kneutrons/s/cm2 for the beads in closest proximity down to ∼1.2neutrons/s/cm2 at the full length of the bead string.
Post-irradiation, bead sets were measured using a Toledo 654 TLDreader at the University of Surrey with the technique described inJafari et al. (2014b). The beads were stored in a dark environment andallowed to stabilise prior to measurement in order that the rapid fadingcomponent of TL materials should not be taken into account (Jafariet al., 2014c).
2.3.1. CalibrationIt has been shown in previous publications that the uncertainty in
the response of individual beads is substantially better than that ofother common TLD materials (Jafari et al., 2014b). The glass beadsexhibit an ∼8% variation, and this is applied to the results presentedhere, which compares favourably to the ∼15% variability in LiF TLDs(Jafari et al., 2015). It should be noted that although there is presentlyno absolute reference until the calibration is performed (seeConclusions and Further Work) the variation of the data shown inFig. 5 agrees within uncertainty, and therefore, with the obviousexception of peaks, we expect similar yields from the individual beads.
2.4. Monte carlo simulation
The mixed radiation field of the AmBe source coupled with the dualneutron-gamma response of the dosimeter necessitates some attemptto deconvolve the respective components. A simulation was developedusing the general Monte Carlo N-Particle transport code, MCNPX(Hendricks et al., 2008) modelling the passage of neutrons through thepure water shield. It was previously discussed in Bradley et al. (2016)and is based on a preliminary mathematical model representing thephysical neutron tank used to expose the beads. Several assumptionswere made about the AmBe source including a neutron energyspectrum from Amersham source calibration data and an internalsource construction based on an americium-beryllium layered struc-ture. Further work is planned to optimise the mathematical model usedin the Monte Carlo simulations.
3. Results and discussion
The surface scanning measurements presented in Fig. 2 showrelatively minor variation of neutron yield over the surface of the tank,some >20 cm being required to show a two-fold reduction in countrate, which classical trigonometry tells us is not an unreasonable result.Conversely, the vertical depth measurements (which can be seen forboth the 3He tube and the glass beads in Fig. 4) shows the combinedeffect of the geometric range of data and the reduction in neutronmoderation, a substantial fall-off in count rate observed within a fewcm from the AmBe source. Furthermore, the 3He detector measure-ments were also taken with a ∼1 mm-thick cadmium sheath and showthe expected drop in count rate due to the resonances in the neutroncapture cross section as the energy range passes from the fast regionand neutrons become thermalised.
The overlaid vertical measurements shown in Fig. 4 exhibit thesame general trend of reduced count rate with increasing distance tothe source for each of the experimental data sets as well as thesimulation. However, the greater resolution of the glass bead allowsfor far finer structure to be observed. In effect the gas detectors areintegrating the energy regions encountered by many glass beadssimultaneously. This is to be expected, and indeed confirms thesuperior performance of the glass beads in terms of spatial resolution.
In addition to the clear energy sensitivity, by more closely examin-ing the glass bead data of Fig. 4, as well as that of the additional string
measurements displayed in Fig. 5, further observations may be made.There appears to be a lower level plateau region exhibited by the glassbead dosimeter that is not apparent when using the gas detectors. Thiswould suggest a lower energy limit, below which the glass beads wouldbe insensitive, coinciding with a distance approximately 23 cm fromthe source. The measurements performed previously, and reported inJafari et al. (2014c) have discussed the energy and dose limitations ofthe glass bead dosimeters.
The most notable feature of the glass bead spectra however, is thatof the quasi-regular spikes in the thermoluminescence intensity whichnotably are reproduced in the simulation. While there is somesimilarity between the thermoluminescence intensity spikes of thedosimetric data sets this is not sufficient to conclude the origin of thefeature to be simply that of the peaks of the AmBe neutron energyspectrum (Lorch, 1973; Coehlo et al., 1989; Thompson and Taylor,1965; Anderson and Neff, 1972). Therefore, one must conclude thatsome other phenomena be involved (Lorch, 1969; Wright, 1994), orpossibly the result of a neutron-induced charged-particle reaction, say,(n,α) or (n,p). At this point it may be worth considering the dominantinteractions at play with the glass beads. The main constituents of theelemental composition are silicon, oxygen, and sodium (at 33.62%,42.18%, and 10.55% by weight respectively) (Jafari et al., 2014c). Foreach element comprising the glass beads the dominant neutroninteraction is elastic scattering Kim et al., 2013; this is true acrossthe whole energy range that has been investigated, and may in factsupport the theory that low-probability, but high Q-value, neutronreactions are the cause.
Prior to installation of the AmBe source used in this investigation(Ziegler, 2007) a similar measurement was performed with a slightlydifferent configuration (Bradley et al., 2016) and was identical to thatstudied by Taggart (2007); Nicolaou (1983); Matthews (1979) with twoAmBe sources ∼20 cm apart. Therefore, in these previous studies, it isimportant to consider that there will be independent contributionsfrom each separate source. The spikes were less likely to be observedeither due to lower spatial resolution (Taggart, 2007; Nicolaou, 1983;Matthews, 1979) or the possibility of the effect of combining contribu-tions from two sources in the water tank (Bradley et al., 2016).
4. Conclusions and further work
Determining the suitability of these commercial glass beads for avariety of dosimetric applications is an ongoing task. However, in theshort term they have clearly demonstrated the ability to provide adosimetric information with respect to the neutron tank. The immedi-ate needs of this work come in four-fold:
1. Secondary calibration via AmBe “halo”.2. Improved sophistication of Monte Carlo simulation.3. Evaluation of the relative n/γ bead sensitivity by repeated measure-
ments with additional lead shielding4. Evaluation of the relative fast/thermal neutron sensitivity through
cadmium shielding
Where the “halo” configuration refers to a circular support to maintaina fixed source-bead distance, thereby ensuring that all beads receive anequal mixed radiation field dose.
The potential source of the “quasi-regular” spikes could be un-covered through the above experiments. In particular, if the cause ofthe spikes is indeed neutron-induced charged-particle reactions wewould expect to see a shift in position in future simulations; likewise,with the “halo” configuration spikes should be present if a reaction isthe origin.
Acknowledgements
YMA would like to acknowledge the support of the Petroleum
Y.M. Abubakar et al. Radiation Physics and Chemistry 140 (2017) 497–501
499
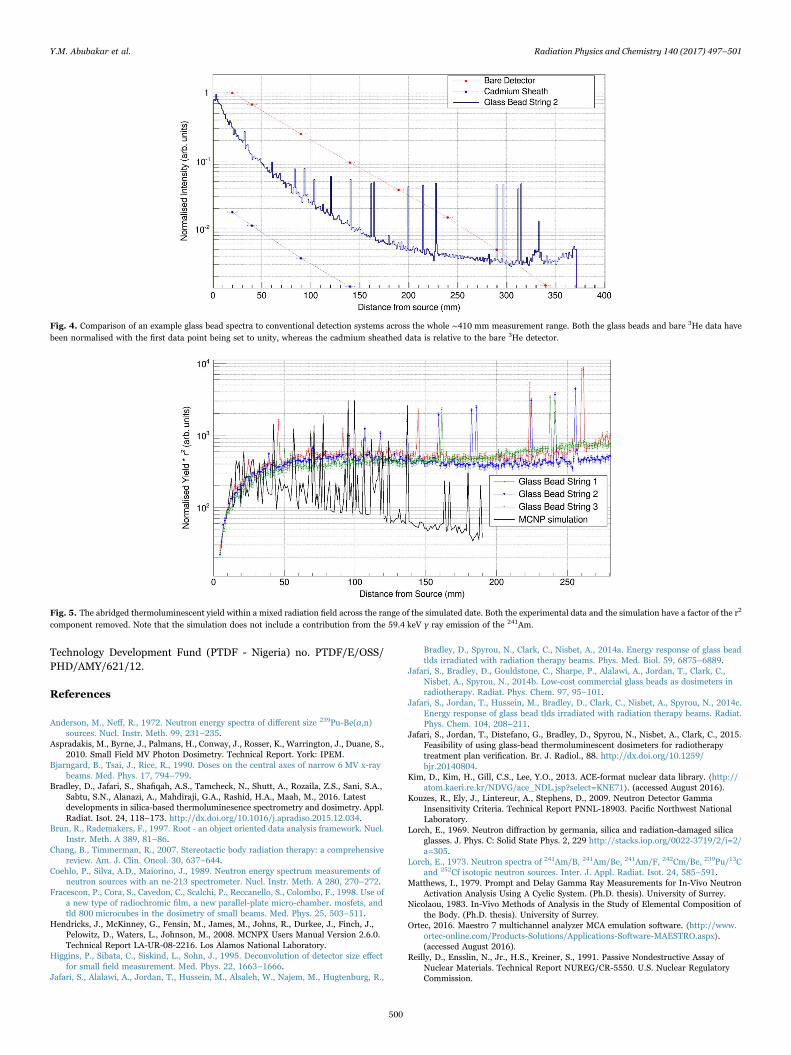
Technology Development Fund (PTDF - Nigeria) no. PTDF/E/OSS/PHD/AMY/621/12.
References
Anderson, M., Neff, R., 1972. Neutron energy spectra of different size 239Pu-Be(α,n)sources. Nucl. Instr. Meth. 99, 231–235.
Aspradakis, M., Byrne, J., Palmans, H., Conway, J., Rosser, K., Warrington, J., Duane, S.,2010. Small Field MV Photon Dosimetry. Technical Report. York: IPEM.
Bjarngard, B., Tsai, J., Rice, R., 1990. Doses on the central axes of narrow 6 MV x-raybeams. Med. Phys. 17, 794–799.
Bradley, D., Jafari, S., Shafiqah, A.S., Tamcheck, N., Shutt, A., Rozaila, Z.S., Sani, S.A.,Sabtu, S.N., Alanazi, A., Mahdiraji, G.A., Rashid, H.A., Maah, M., 2016. Latestdevelopments in silica-based thermoluminesence spectrometry and dosimetry. Appl.Radiat. Isot. 24, 118–173. http://dx.doi.org/10.1016/j.apradiso.2015.12.034.
Brun, R., Rademakers, F., 1997. Root - an object oriented data analysis framework. Nucl.Instr. Meth. A 389, 81–86.
Chang, B., Timmerman, R., 2007. Stereotactic body radiation therapy: a comprehensivereview. Am. J. Clin. Oncol. 30, 637–644.
Coehlo, P., Silva, A.D., Maiorino, J., 1989. Neutron energy spectrum measurements ofneutron sources with an ne-213 spectrometer. Nucl. Instr. Meth. A 280, 270–272.
Fracescon, P., Cora, S., Cavedon, C., Scalchi, P., Reccanello, S., Colombo, F., 1998. Use ofa new type of radiochromic film, a new parallel-plate micro-chamber. mosfets, andtld 800 microcubes in the dosimetry of small beams. Med. Phys. 25, 503–511.
Hendricks, J., McKinney, G., Fensin, M., James, M., Johns, R., Durkee, J., Finch, J.,Pelowitz, D., Waters, L., Johnson, M., 2008. MCNPX Users Manual Version 2.6.0.Technical Report LA-UR-08-2216. Los Alamos National Laboratory.
Higgins, P., Sibata, C., Siskind, L., Sohn, J., 1995. Deconvolution of detector size effectfor small field measurement. Med. Phys. 22, 1663–1666.
Jafari, S., Alalawi, A., Jordan, T., Hussein, M., Alsaleh, W., Najem, M., Hugtenburg, R.,
Bradley, D., Spyrou, N., Clark, C., Nisbet, A., 2014a. Energy response of glass beadtlds irradiated with radiation therapy beams. Phys. Med. Biol. 59, 6875–6889.
Jafari, S., Bradley, D., Gouldstone, C., Sharpe, P., Alalawi, A., Jordan, T., Clark, C.,Nisbet, A., Spyrou, N., 2014b. Low-cost commercial glass beads as dosimeters inradiotherapy. Radiat. Phys. Chem. 97, 95–101.
Jafari, S., Jordan, T., Hussein, M., Bradley, D., Clark, C., Nisbet, A., Spyrou, N., 2014c.Energy response of glass bead tlds irradiated with radiation therapy beams. Radiat.Phys. Chem. 104, 208–211.
Jafari, S., Jordan, T., Distefano, G., Bradley, D., Spyrou, N., Nisbet, A., Clark, C., 2015.Feasibility of using glass-bead thermoluminescent dosimeters for radiotherapytreatment plan verification. Br. J. Radiol., 88. http://dx.doi.org/10.1259/bjr.20140804.
Kim, D., Kim, H., Gill, C.S., Lee, Y.O., 2013. ACE-format nuclear data library. ⟨http://atom.kaeri.re.kr/NDVG/ace_NDL.jsp?select=KNE71⟩. (accessed August 2016).
Kouzes, R., Ely, J., Lintereur, A., Stephens, D., 2009. Neutron Detector GammaInsensitivity Criteria. Technical Report PNNL-18903. Pacific Northwest NationalLaboratory.
Lorch, E., 1969. Neutron diffraction by germania, silica and radiation-damaged silicaglasses. J. Phys. C: Solid State Phys. 2, 229 http://stacks.iop.org/0022-3719/2/i=2/a=305.
Lorch, E., 1973. Neutron spectra of 241Am/B, 241Am/Be, 241Am/F, 242Cm/Be, 239Pu/13Cand 252Cf isotopic neutron sources. Inter. J. Appl. Radiat. Isot. 24, 585–591.
Matthews, I., 1979. Prompt and Delay Gamma Ray Measurements for In-Vivo NeutronActivation Analysis Using A Cyclic System. (Ph.D. thesis). University of Surrey.
Nicolaou, 1983. In-Vivo Methods of Analysis in the Study of Elemental Composition ofthe Body. (Ph.D. thesis). University of Surrey.
Ortec, 2016. Maestro 7 multichannel analyzer MCA emulation software. ⟨http://www.ortec-online.com/Products-Solutions/Applications-Software-MAESTRO.aspx⟩.(accessed August 2016).
Reilly, D., Ensslin, N., Jr., H.S., Kreiner, S., 1991. Passive Nondestructive Assay ofNuclear Materials. Technical Report NUREG/CR-5550. U.S. Nuclear RegulatoryCommission.
Fig. 4. Comparison of an example glass bead spectra to conventional detection systems across the whole ∼410 mm measurement range. Both the glass beads and bare 3He data havebeen normalised with the first data point being set to unity, whereas the cadmium sheathed data is relative to the bare 3He detector.
Fig. 5. The abridged thermoluminescent yield within a mixed radiation field across the range of the simulated date. Both the experimental data and the simulation have a factor of the r2
component removed. Note that the simulation does not include a contribution from the 59.4 keV γ ray emission of the 241Am.
Y.M. Abubakar et al. Radiation Physics and Chemistry 140 (2017) 497–501
500
Sauer, O., Wilbert, J., 2007. Measurement of output factors for small photon beams.Med. Phys. 34, 1983–1988.
Taggart, M., 2007. Surveying the Thermal Neutron Capture Flux Via Activation Analysis.Master's thesis. University of Surrey.
Teoh, M., Clark, C., Wood, K., Whitaker, S., Nisbet, A., 2011. Volumetric modulated arctherapy: a review of current literature and clinical use in practice. Br. J. Radiol. 84,967–996.
Thompson, M., Taylor, J., 1965. Neutron spectra from Am-α-Be and Ra-α-Be sources.Nucl. Instr. Meth. 37, 305–308.
Wright, A., 1994. Neutron scattering from vitreous silica. v. the structure of vitreoussilica: What have we learned from 60 years of diffraction studies? J. Non-Cryst.Solids 179, 84–115.
Ziegler, Eckert, 2007. Reference & calibration sources. ⟨http://hightechsource.co.uk/wp-content/uploads/Catalogue-IPL-Std-Ref2008.pdf⟩. (accessed September 2016)
Y.M. Abubakar et al. Radiation Physics and Chemistry 140 (2017) 497–501
501
Applied Radiation and Isotopes 117 (2016) 106–110Appendix D
Contents lists available at ScienceDirect
Applied Radiation and Isotopes
http://d0969-80
n Corrof Physi
E-mmalkhoIzabela.A.Dalton
journal homepage: www.elsevier.com/locate/apradiso
Carbon nanotubes buckypaper radiation studies for medical physicsapplications
Abdulaziz Alanazi a,b,n, Mohammed Alkhorayef a,c, Khalid Alzimami c, Izabela Jurewicz e,Nouf Abuhadi d, Alan Dalton e, D.A. Bradley a,f
a Centre for Nuclear and Radiation Physics, Department of Physics, University of Surrey, Guildford, Surrey GU2 7XH, UKb Medical Physics Department, Cancer Centre, Prince Mohammed Medical City, P.O. Box: 2254, Sakaka Aljouf 42421, Saudi Arabiac Department of Radiological Sciences, King Saud University, P.O. Box 10219, Riyadh 11433, Saudi Arabiad Diagnostic radiology department, Faculty of medical applied sciences, Jazan University, P. O. Box 114, Jazan, Saudi Arabiae Department of Physics, Faculty of Eng & Physical Sciences, University of Surrey, Guildford, Surrey GU2 7XH, UKf Department of Physics, University of Malaya, 50603 Kuala Lumpur, Malaysia
H I G H L I G H T S
� Carbon nanotubes explored as a dosimeter for ionising radiation.
� The potential for application at therapy doses investigated.� Predominant TL yield found between 180 and 250 °C.a r t i c l e i n f o
Article history:Received 28 October 2015Received in revised form11 December 2015Accepted 3 January 2016Available online 5 January 2016
Keywords:ThermoluminescenceCarbon nanotubesRadiation therapy
x.doi.org/10.1016/j.apradiso.2016.01.00143/& 2016 Elsevier Ltd. All rights reserved.
esponding author at: Centre for Nuclear and Rcs, University of Surrey, Guildford, Surrey GUail addresses: [email protected], [email protected] (M. Alkhorayef), [email protected] (I. Jurewicz), n_pasint@@surrey.ac.uk (A. Dalton), D.A.Bradley@surre
a b s t r a c t
Graphite ion chambers and semiconductor diode detectors have been used to make measurements inphantoms but these active devices represent a clear disadvantage when considered for in vivo dosimetry.In such circumstance, dosimeters with atomic number similar to human tissue are needed. Carbon na-notubes have properties that potentially meet the demand, requiring low voltage in active devices and anatomic number similar to adipose tissue. In this study, single-wall carbon nanotubes (SWCNTs) buck-ypaper has been used to measure the beta particle dose deposited from a strontium-90 source, themedium displaying thermoluminescence at potentially useful sensitivity. As an example, the samplesshow a clear response for a dose of 2 Gy. This finding suggests that carbon nanotubes can be used as apassive dosimeter specifically for the high levels of radiation exposures used in radiation therapy. Fur-thermore, the finding points towards further potential applications such as for space radiation mea-surements, not least because the medium satisfies a demand for light but strong materials of minimalcapacitance.
& 2016 Elsevier Ltd. All rights reserved.
1. Introduction
Since CNTs were first reported upon by Iijima on early 1990s(Iijima, 1991), the properties of carbon nanotubes have been thesubject of intensive investigation and have been considered for manypotential applications, such as chemical sensors (Kong et al., 2000;Moradi et al., 2013; Penza et al., 2010; Wongchoosuk et al., 2010;
adiation Physics, Department2 7XH, [email protected] (A. Alanazi),[email protected] (K. Alzimami),hotmail.com (N. Abuhadi),y.ac.uk (D.A. Bradley).
Zhao et al., 2005), biosensors (Timur et al., 2007; Balasubramanianand Burghard, 2006; Koehne et al., 2004; Li et al., 2003; Wang, 2005)field-emission displays (Talin et al., 2001; Saito, 2010; Lee et al., 2001;Kuznetzov et al., 2010; Choi et al., 1999), memory storage (Lu, Dai,2006, Ganguly et al., 2005) and hydrogen storage (Yang et al., 2010;Ranjbar et al., 2010; Liu et al., 2010). In particular, the structural ar-rangement of the atoms forming the carbon nanotubes give inter-esting physical and chemical properties such as electric and thermoconductivity. Carbon nanotubes, CNTs, can be described as a beehivesheet fabricated to form a cylinder, the two ends of the cylinder beingopen or closed with a semicircle lid. This cylinder-like form can beshielded by other cylinders with open ends to form a multi-wallcarbon nanotubes structure, MWCNTs. Fig. 1 displays single andmulti-wall carbon nanotubes with open ends. The dimensions of the
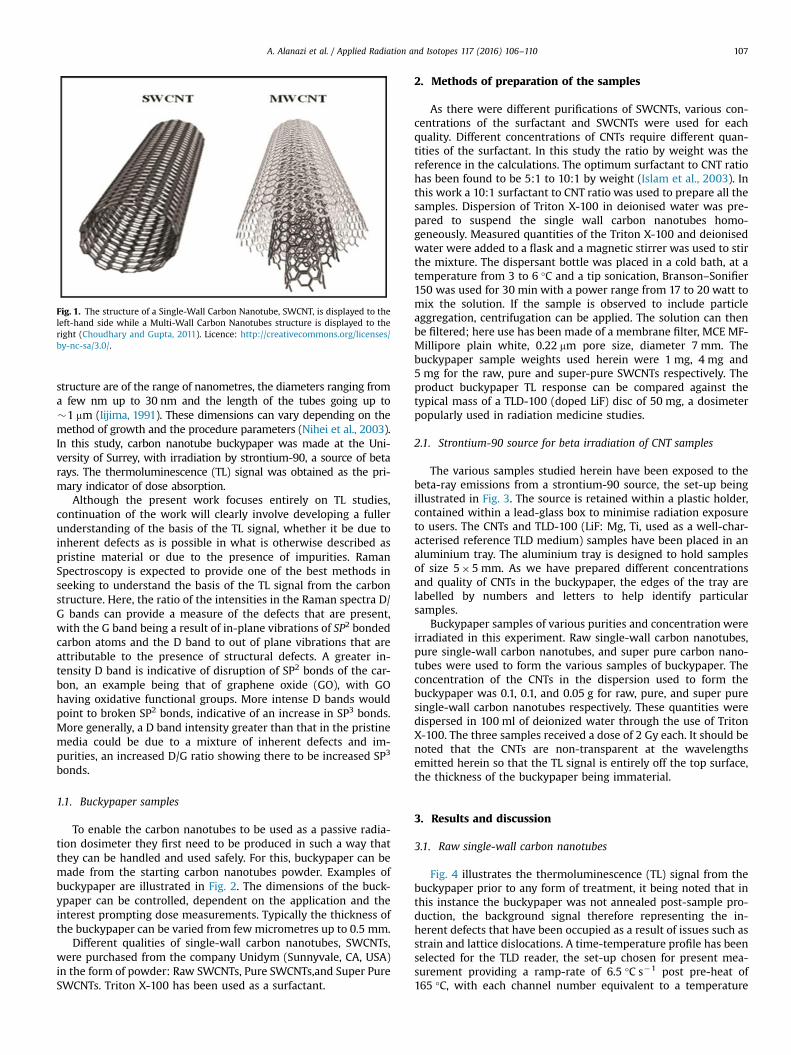
Fig. 1. The structure of a Single-Wall Carbon Nanotube, SWCNT, is displayed to theleft-hand side while a Multi-Wall Carbon Nanotubes structure is displayed to theright (Choudhary and Gupta, 2011). Licence: http://creativecommons.org/licenses/by-nc-sa/3.0/.
A. Alanazi et al. / Applied Radiation and Isotopes 117 (2016) 106–110 107
structure are of the range of nanometres, the diameters ranging froma few nm up to 30 nm and the length of the tubes going up to�1 mm (Iijima, 1991). These dimensions can vary depending on themethod of growth and the procedure parameters (Nihei et al., 2003).In this study, carbon nanotube buckypaper was made at the Uni-versity of Surrey, with irradiation by strontium-90, a source of betarays. The thermoluminescence (TL) signal was obtained as the pri-mary indicator of dose absorption.
Although the present work focuses entirely on TL studies,continuation of the work will clearly involve developing a fullerunderstanding of the basis of the TL signal, whether it be due toinherent defects as is possible in what is otherwise described aspristine material or due to the presence of impurities. RamanSpectroscopy is expected to provide one of the best methods inseeking to understand the basis of the TL signal from the carbonstructure. Here, the ratio of the intensities in the Raman spectra D/G bands can provide a measure of the defects that are present,with the G band being a result of in-plane vibrations of SP2 bondedcarbon atoms and the D band to out of plane vibrations that areattributable to the presence of structural defects. A greater in-tensity D band is indicative of disruption of SP2 bonds of the car-bon, an example being that of graphene oxide (GO), with GOhaving oxidative functional groups. More intense D bands wouldpoint to broken SP2 bonds, indicative of an increase in SP3 bonds.More generally, a D band intensity greater than that in the pristinemedia could be due to a mixture of inherent defects and im-purities, an increased D/G ratio showing there to be increased SP3
bonds.
1.1. Buckypaper samples
To enable the carbon nanotubes to be used as a passive radia-tion dosimeter they first need to be produced in such a way thatthey can be handled and used safely. For this, buckypaper can bemade from the starting carbon nanotubes powder. Examples ofbuckypaper are illustrated in Fig. 2. The dimensions of the buck-ypaper can be controlled, dependent on the application and theinterest prompting dose measurements. Typically the thickness ofthe buckypaper can be varied from fewmicrometres up to 0.5 mm.
Different qualities of single-wall carbon nanotubes, SWCNTs,were purchased from the company Unidym (Sunnyvale, CA, USA)in the form of powder: Raw SWCNTs, Pure SWCNTs,and Super PureSWCNTs. Triton X-100 has been used as a surfactant.
2. Methods of preparation of the samples
As there were different purifications of SWCNTs, various con-centrations of the surfactant and SWCNTs were used for eachquality. Different concentrations of CNTs require different quan-tities of the surfactant. In this study the ratio by weight was thereference in the calculations. The optimum surfactant to CNT ratiohas been found to be 5:1 to 10:1 by weight (Islam et al., 2003). Inthis work a 10:1 surfactant to CNT ratio was used to prepare all thesamples. Dispersion of Triton X-100 in deionised water was pre-pared to suspend the single wall carbon nanotubes homo-geneously. Measured quantities of the Triton X-100 and deionisedwater were added to a flask and a magnetic stirrer was used to stirthe mixture. The dispersant bottle was placed in a cold bath, at atemperature from 3 to 6 °C and a tip sonication, Branson–Sonifier150 was used for 30 min with a power range from 17 to 20 watt tomix the solution. If the sample is observed to include particleaggregation, centrifugation can be applied. The solution can thenbe filtered; here use has been made of a membrane filter, MCE MF-Millipore plain white, 0.22 mm pore size, diameter 7 mm. Thebuckypaper sample weights used herein were 1 mg, 4 mg and5 mg for the raw, pure and super-pure SWCNTs respectively. Theproduct buckypaper TL response can be compared against thetypical mass of a TLD-100 (doped LiF) disc of 50 mg, a dosimeterpopularly used in radiation medicine studies.
2.1. Strontium-90 source for beta irradiation of CNT samples
The various samples studied herein have been exposed to thebeta-ray emissions from a strontium-90 source, the set-up beingillustrated in Fig. 3. The source is retained within a plastic holder,contained within a lead-glass box to minimise radiation exposureto users. The CNTs and TLD-100 (LiF: Mg, Ti, used as a well-char-acterised reference TLD medium) samples have been placed in analuminium tray. The aluminium tray is designed to hold samplesof size 5�5 mm. As we have prepared different concentrationsand quality of CNTs in the buckypaper, the edges of the tray arelabelled by numbers and letters to help identify particularsamples.
Buckypaper samples of various purities and concentration wereirradiated in this experiment. Raw single-wall carbon nanotubes,pure single-wall carbon nanotubes, and super pure carbon nano-tubes were used to form the various samples of buckypaper. Theconcentration of the CNTs in the dispersion used to form thebuckypaper was 0.1, 0.1, and 0.05 g for raw, pure, and super puresingle-wall carbon nanotubes respectively. These quantities weredispersed in 100 ml of deionized water through the use of TritonX-100. The three samples received a dose of 2 Gy each. It should benoted that the CNTs are non-transparent at the wavelengthsemitted herein so that the TL signal is entirely off the top surface,the thickness of the buckypaper being immaterial.
3. Results and discussion
3.1. Raw single-wall carbon nanotubes
Fig. 4 illustrates the thermoluminescence (TL) signal from thebuckypaper prior to any form of treatment, it being noted that inthis instance the buckypaper was not annealed post-sample pro-duction, the background signal therefore representing the in-herent defects that have been occupied as a result of issues such asstrain and lattice dislocations. A time-temperature profile has beenselected for the TLD reader, the set-up chosen for present mea-surement providing a ramp-rate of 6.5 °C s�1 post pre-heat of165 °C, with each channel number equivalent to a temperature
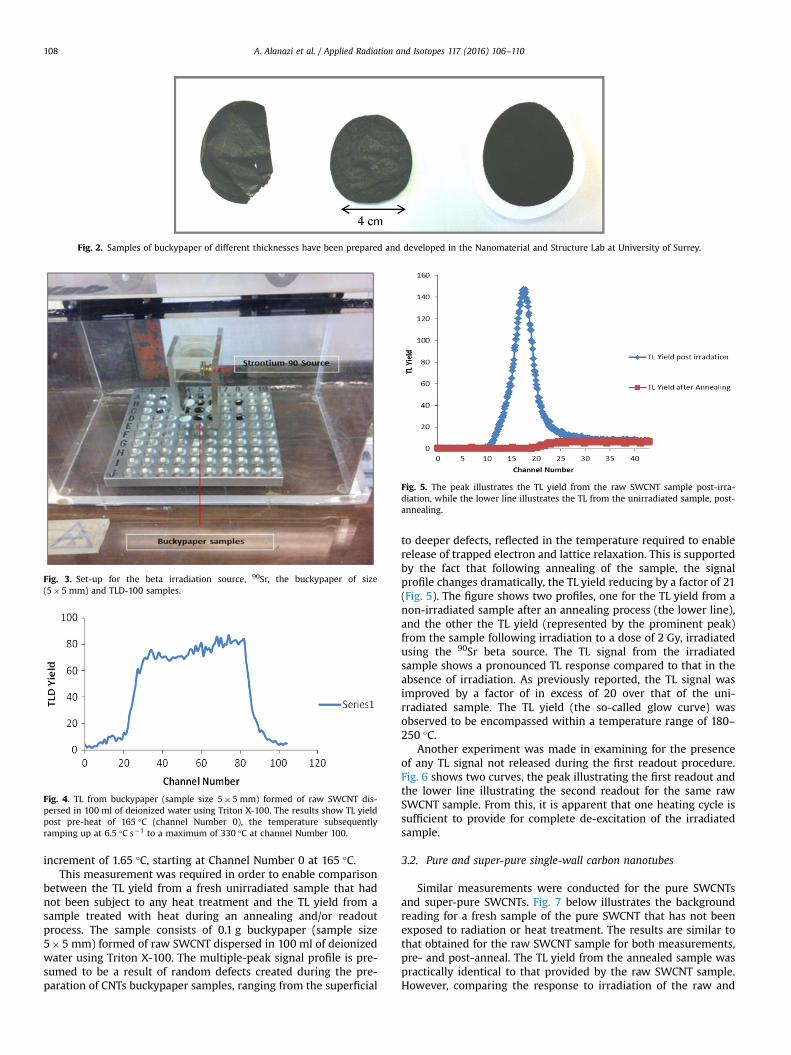
Fig. 2. Samples of buckypaper of different thicknesses have been prepared and developed in the Nanomaterial and Structure Lab at University of Surrey.
Fig. 3. Set-up for the beta irradiation source, 90Sr, the buckypaper of size(5�5 mm) and TLD-100 samples.
Fig. 4. TL from buckypaper (sample size 5�5 mm) formed of raw SWCNT dis-persed in 100 ml of deionized water using Triton X-100. The results show TL yieldpost pre-heat of 165 °C (channel Number 0), the temperature subsequentlyramping up at 6.5 °C s�1 to a maximum of 330 °C at channel Number 100.
Fig. 5. The peak illustrates the TL yield from the raw SWCNT sample post-irra-diation, while the lower line illustrates the TL from the unirradiated sample, post-annealing.
A. Alanazi et al. / Applied Radiation and Isotopes 117 (2016) 106–110108
increment of 1.65 °C, starting at Channel Number 0 at 165 °C.This measurement was required in order to enable comparison
between the TL yield from a fresh unirradiated sample that hadnot been subject to any heat treatment and the TL yield from asample treated with heat during an annealing and/or readoutprocess. The sample consists of 0.1 g buckypaper (sample size5�5 mm) formed of raw SWCNT dispersed in 100 ml of deionizedwater using Triton X-100. The multiple-peak signal profile is pre-sumed to be a result of random defects created during the pre-paration of CNTs buckypaper samples, ranging from the superficial
to deeper defects, reflected in the temperature required to enablerelease of trapped electron and lattice relaxation. This is supportedby the fact that following annealing of the sample, the signalprofile changes dramatically, the TL yield reducing by a factor of 21(Fig. 5). The figure shows two profiles, one for the TL yield from anon-irradiated sample after an annealing process (the lower line),and the other the TL yield (represented by the prominent peak)from the sample following irradiation to a dose of 2 Gy, irradiatedusing the 90Sr beta source. The TL signal from the irradiatedsample shows a pronounced TL response compared to that in theabsence of irradiation. As previously reported, the TL signal wasimproved by a factor of in excess of 20 over that of the uni-rradiated sample. The TL yield (the so-called glow curve) wasobserved to be encompassed within a temperature range of 180–250 °C.
Another experiment was made in examining for the presenceof any TL signal not released during the first readout procedure.Fig. 6 shows two curves, the peak illustrating the first readout andthe lower line illustrating the second readout for the same rawSWCNT sample. From this, it is apparent that one heating cycle issufficient to provide for complete de-excitation of the irradiatedsample.
3.2. Pure and super-pure single-wall carbon nanotubes
Similar measurements were conducted for the pure SWCNTsand super-pure SWCNTs. Fig. 7 below illustrates the backgroundreading for a fresh sample of the pure SWCNT that has not beenexposed to radiation or heat treatment. The results are similar tothat obtained for the raw SWCNT sample for both measurements,pre- and post-anneal. The TL yield from the annealed sample waspractically identical to that provided by the raw SWCNT sample.However, comparing the response to irradiation of the raw and
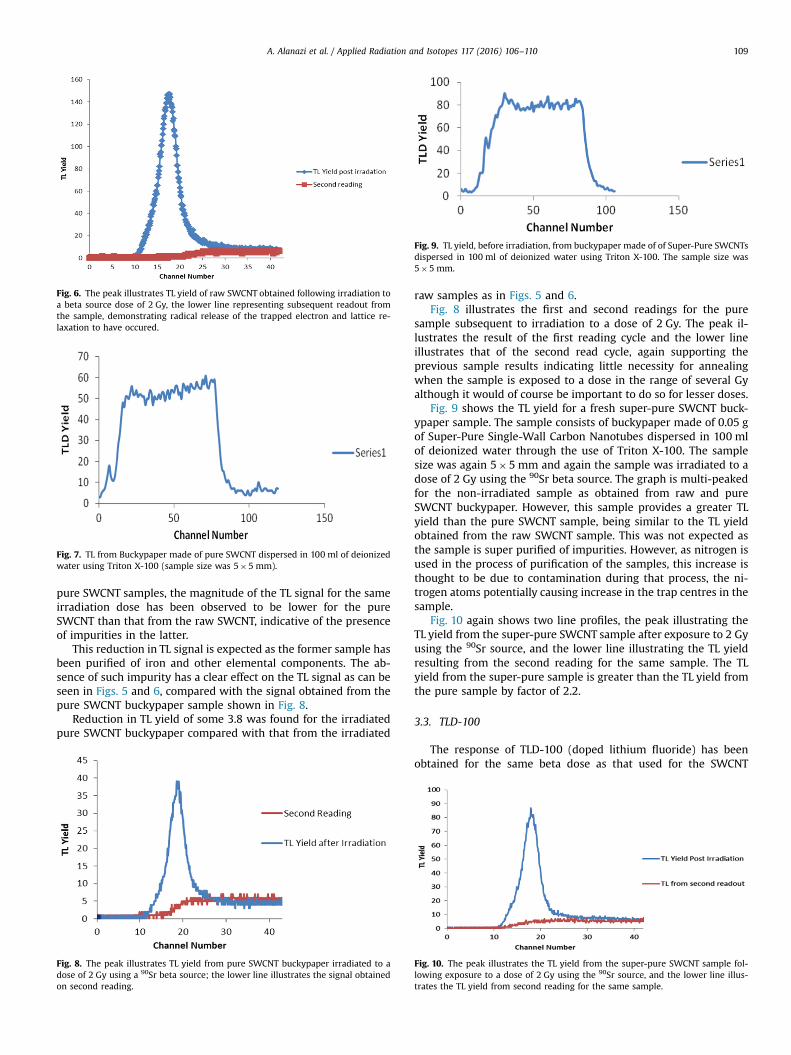
Fig. 6. The peak illustrates TL yield of raw SWCNT obtained following irradiation toa beta source dose of 2 Gy, the lower line representing subsequent readout fromthe sample, demonstrating radical release of the trapped electron and lattice re-laxation to have occured.
Fig. 7. TL from Buckypaper made of pure SWCNT dispersed in 100 ml of deionizedwater using Triton X-100 (sample size was 5�5 mm).
Fig. 9. TL yield, before irradiation, from buckypaper made of of Super-Pure SWCNTsdispersed in 100 ml of deionized water using Triton X-100. The sample size was5�5 mm.
A. Alanazi et al. / Applied Radiation and Isotopes 117 (2016) 106–110 109
pure SWCNT samples, the magnitude of the TL signal for the sameirradiation dose has been observed to be lower for the pureSWCNT than that from the raw SWCNT, indicative of the presenceof impurities in the latter.
This reduction in TL signal is expected as the former sample hasbeen purified of iron and other elemental components. The ab-sence of such impurity has a clear effect on the TL signal as can beseen in Figs. 5 and 6, compared with the signal obtained from thepure SWCNT buckypaper sample shown in Fig. 8.
Reduction in TL yield of some 3.8 was found for the irradiatedpure SWCNT buckypaper compared with that from the irradiated
Fig. 8. The peak illustrates TL yield from pure SWCNT buckypaper irradiated to adose of 2 Gy using a 90Sr beta source; the lower line illustrates the signal obtainedon second reading.
raw samples as in Figs. 5 and 6.Fig. 8 illustrates the first and second readings for the pure
sample subsequent to irradiation to a dose of 2 Gy. The peak il-lustrates the result of the first reading cycle and the lower lineillustrates that of the second read cycle, again supporting theprevious sample results indicating little necessity for annealingwhen the sample is exposed to a dose in the range of several Gyalthough it would of course be important to do so for lesser doses.
Fig. 9 shows the TL yield for a fresh super-pure SWCNT buck-ypaper sample. The sample consists of buckypaper made of 0.05 gof Super-Pure Single-Wall Carbon Nanotubes dispersed in 100 mlof deionized water through the use of Triton X-100. The samplesize was again 5�5 mm and again the sample was irradiated to adose of 2 Gy using the 90Sr beta source. The graph is multi-peakedfor the non-irradiated sample as obtained from raw and pureSWCNT buckypaper. However, this sample provides a greater TLyield than the pure SWCNT sample, being similar to the TL yieldobtained from the raw SWCNT sample. This was not expected asthe sample is super purified of impurities. However, as nitrogen isused in the process of purification of the samples, this increase isthought to be due to contamination during that process, the ni-trogen atoms potentially causing increase in the trap centres in thesample.
Fig. 10 again shows two line profiles, the peak illustrating theTL yield from the super-pure SWCNT sample after exposure to 2 Gyusing the 90Sr source, and the lower line illustrating the TL yieldresulting from the second reading for the same sample. The TLyield from the super-pure sample is greater than the TL yield fromthe pure sample by factor of 2.2.
3.3. TLD-100
The response of TLD-100 (doped lithium fluoride) has beenobtained for the same beta dose as that used for the SWCNT
Fig. 10. The peak illustrates the TL yield from the super-pure SWCNT sample fol-lowing exposure to a dose of 2 Gy using the 90Sr source, and the lower line illus-trates the TL yield from second reading for the same sample.
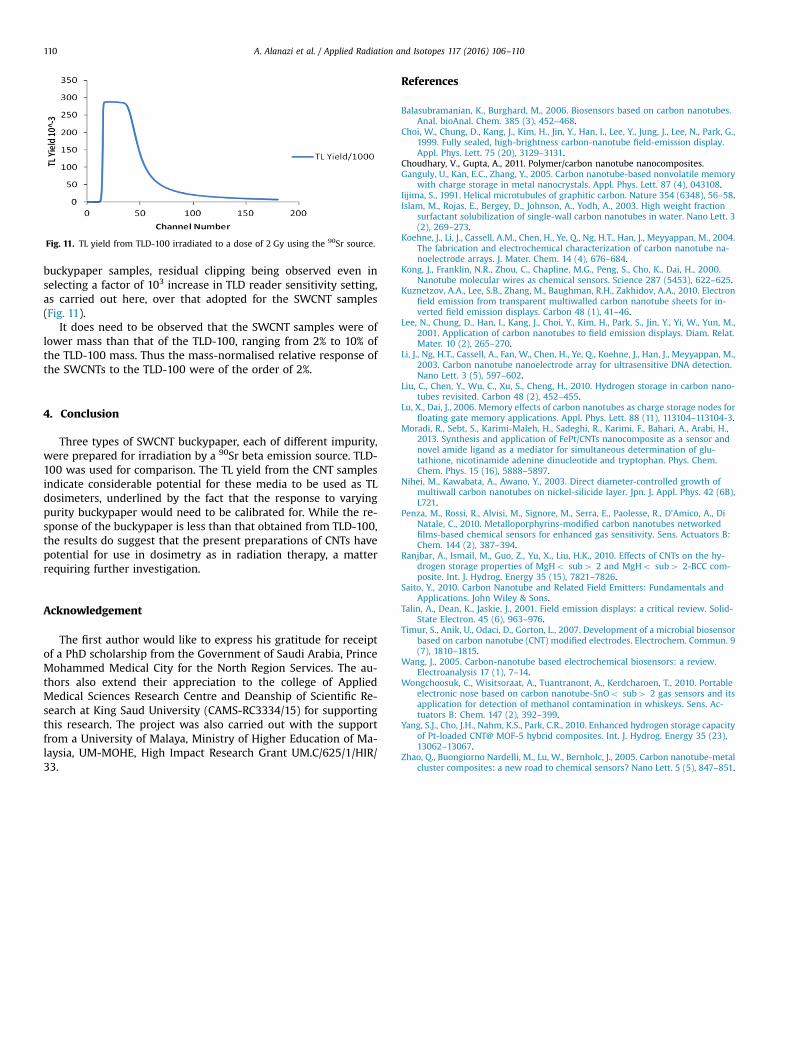
Fig. 11. TL yield from TLD-100 irradiated to a dose of 2 Gy using the 90Sr source.
A. Alanazi et al. / Applied Radiation and Isotopes 117 (2016) 106–110110
buckypaper samples, residual clipping being observed even inselecting a factor of 103 increase in TLD reader sensitivity setting,as carried out here, over that adopted for the SWCNT samples(Fig. 11).
It does need to be observed that the SWCNT samples were oflower mass than that of the TLD-100, ranging from 2% to 10% ofthe TLD-100 mass. Thus the mass-normalised relative response ofthe SWCNTs to the TLD-100 were of the order of 2%.
4. Conclusion
Three types of SWCNT buckypaper, each of different impurity,were prepared for irradiation by a 90Sr beta emission source. TLD-100 was used for comparison. The TL yield from the CNT samplesindicate considerable potential for these media to be used as TLdosimeters, underlined by the fact that the response to varyingpurity buckypaper would need to be calibrated for. While the re-sponse of the buckypaper is less than that obtained from TLD-100,the results do suggest that the present preparations of CNTs havepotential for use in dosimetry as in radiation therapy, a matterrequiring further investigation.
Acknowledgement
The first author would like to express his gratitude for receiptof a PhD scholarship from the Government of Saudi Arabia, PrinceMohammed Medical City for the North Region Services. The au-thors also extend their appreciation to the college of AppliedMedical Sciences Research Centre and Deanship of Scientific Re-search at King Saud University (CAMS-RC3334/15) for supportingthis research. The project was also carried out with the supportfrom a University of Malaya, Ministry of Higher Education of Ma-laysia, UM-MOHE, High Impact Research Grant UM.C/625/1/HIR/33.
References
Balasubramanian, K., Burghard, M., 2006. Biosensors based on carbon nanotubes.Anal. bioAnal. Chem. 385 (3), 452–468.
Choi, W., Chung, D., Kang, J., Kim, H., Jin, Y., Han, I., Lee, Y., Jung, J., Lee, N., Park, G.,1999. Fully sealed, high-brightness carbon-nanotube field-emission display.Appl. Phys. Lett. 75 (20), 3129–3131.
Choudhary, V., Gupta, A., 2011. Polymer/carbon nanotube nanocomposites.Ganguly, U., Kan, E.C., Zhang, Y., 2005. Carbon nanotube-based nonvolatile memory
with charge storage in metal nanocrystals. Appl. Phys. Lett. 87 (4), 043108.Iijima, S., 1991. Helical microtubules of graphitic carbon. Nature 354 (6348), 56–58.Islam, M., Rojas, E., Bergey, D., Johnson, A., Yodh, A., 2003. High weight fraction
surfactant solubilization of single-wall carbon nanotubes in water. Nano Lett. 3(2), 269–273.
Koehne, J., Li, J., Cassell, A.M., Chen, H., Ye, Q., Ng, H.T., Han, J., Meyyappan, M., 2004.The fabrication and electrochemical characterization of carbon nanotube na-noelectrode arrays. J. Mater. Chem. 14 (4), 676–684.
Kong, J., Franklin, N.R., Zhou, C., Chapline, M.G., Peng, S., Cho, K., Dai, H., 2000.Nanotube molecular wires as chemical sensors. Science 287 (5453), 622–625.
Kuznetzov, A.A., Lee, S.B., Zhang, M., Baughman, R.H., Zakhidov, A.A., 2010. Electronfield emission from transparent multiwalled carbon nanotube sheets for in-verted field emission displays. Carbon 48 (1), 41–46.
Lee, N., Chung, D., Han, I., Kang, J., Choi, Y., Kim, H., Park, S., Jin, Y., Yi, W., Yun, M.,2001. Application of carbon nanotubes to field emission displays. Diam. Relat.Mater. 10 (2), 265–270.
Li, J., Ng, H.T., Cassell, A., Fan, W., Chen, H., Ye, Q., Koehne, J., Han, J., Meyyappan, M.,2003. Carbon nanotube nanoelectrode array for ultrasensitive DNA detection.Nano Lett. 3 (5), 597–602.
Liu, C., Chen, Y., Wu, C., Xu, S., Cheng, H., 2010. Hydrogen storage in carbon nano-tubes revisited. Carbon 48 (2), 452–455.
Lu, X., Dai, J., 2006. Memory effects of carbon nanotubes as charge storage nodes forfloating gate memory applications. Appl. Phys. Lett. 88 (11), 113104–113104-3.
Moradi, R., Sebt, S., Karimi-Maleh, H., Sadeghi, R., Karimi, F., Bahari, A., Arabi, H.,2013. Synthesis and application of FePt/CNTs nanocomposite as a sensor andnovel amide ligand as a mediator for simultaneous determination of glu-tathione, nicotinamide adenine dinucleotide and tryptophan. Phys. Chem.Chem. Phys. 15 (16), 5888–5897.
Nihei, M., Kawabata, A., Awano, Y., 2003. Direct diameter-controlled growth ofmultiwall carbon nanotubes on nickel-silicide layer. Jpn. J. Appl. Phys. 42 (6B),L721.
Penza, M., Rossi, R., Alvisi, M., Signore, M., Serra, E., Paolesse, R., D’Amico, A., DiNatale, C., 2010. Metalloporphyrins-modified carbon nanotubes networkedfilms-based chemical sensors for enhanced gas sensitivity. Sens. Actuators B:Chem. 144 (2), 387–394.
Ranjbar, A., Ismail, M., Guo, Z., Yu, X., Liu, H.K., 2010. Effects of CNTs on the hy-drogen storage properties of MgHo sub4 2 and MgHo sub4 2-BCC com-posite. Int. J. Hydrog. Energy 35 (15), 7821–7826.
Saito, Y., 2010. Carbon Nanotube and Related Field Emitters: Fundamentals andApplications. John Wiley & Sons.
Talin, A., Dean, K., Jaskie, J., 2001. Field emission displays: a critical review. Solid-State Electron. 45 (6), 963–976.
Timur, S., Anik, U., Odaci, D., Gorton, L., 2007. Development of a microbial biosensorbased on carbon nanotube (CNT) modified electrodes. Electrochem. Commun. 9(7), 1810–1815.
Wang, J., 2005. Carbon‐nanotube based electrochemical biosensors: a review.Electroanalysis 17 (1), 7–14.
Wongchoosuk, C., Wisitsoraat, A., Tuantranont, A., Kerdcharoen, T., 2010. Portableelectronic nose based on carbon nanotube-SnOo sub4 2 gas sensors and itsapplication for detection of methanol contamination in whiskeys. Sens. Ac-tuators B: Chem. 147 (2), 392–399.
Yang, S.J., Cho, J.H., Nahm, K.S., Park, C.R., 2010. Enhanced hydrogen storage capacityof Pt-loaded CNT@ MOF-5 hybrid composites. Int. J. Hydrog. Energy 35 (23),13062–13067.
Zhao, Q., Buongiorno Nardelli, M., Lu, W., Bernholc, J., 2005. Carbon nanotube-metalcluster composites: a new road to chemical sensors? Nano Lett. 5 (5), 847–851.
Contents lists available at ScienceDirect
Radiation Physics and Chemistry
journal homepage: www.elsevier.com/locate/radphyschem
Lower limits of detection in using carbon nanotubes as thermoluminescentdosimeters of beta radiation
Abdulaziz Alanazia,b, Izabela Jurewicza, Amani I. Alalawic, Amjad Alyahyawia,d,Abdullah Alsubaiea,e, Steven Hinderf, Jorge Bañuls-Ciscarf, Mohammed Alkhorayefa,g,D.A. Bradleya,h
a Centre for Nuclear and Radiation Physics, Department of Physics, University of Surrey, Guildford, Surrey GU2 7XH, UKb Medical Physics Department, Cancer Centre, Prince Mohammed Medical City, P.O. Box 2254, Sakaka Aljouf 42421, Saudi Arabiac Physics Department, Faculty of Applied Sciences, Umm AL-Qura University, Makkah, P.O. Box 175, Saudi Arabiad Department of Diagnostic Radiology, University of Hail, Hail, Saudi Arabiae Physics Department, Taif University, Al-Taif, PO Box 888, Saudi Arabiaf The Surface Analysis Laboratory, Department of Mechanical Engineering Sciences, University of Surrey, Guildford, Surrey GU2 7XH, UKg Department of Radiological Sciences, King Saud University, P.O. Box 10219, Riyadh 11433, Saudi Arabiah Sunway University, Institute for Health Care Development, Jalan Universiti, 46150 PJ, Malaysia
A R T I C L E I N F O
Keywords:ThermoluminescenceCarbon NanotubesRadiation therapySP3/SP2 hybridization
A B S T R A C T
World-wide, on-going intensive research is being seen in adaptation of carbon nanotubes (CNTs) for a widevariety of applications, particular interest herein being in the thermoluminescent (TL) properties of CNTs andtheir sensitivity towards energetic radiations. Using beta radiation delivering dose levels of a few Gy it has beenobserved in previous study that strain and impurity defects in CNTs give rise to significant TL yields, providingan initial measure of the extent to which electron trapping centres exist in various qualities of CNT, from super-pure to raw. This in turn points to the possibility that there may be considerable advantage in using such mediafor radiation dosimetry applications, including for in vivo dosimetry. CNTs also have an effective atomicnumber similar to that of adipose tissue, making them suitable for soft tissue dosimetry. In presentinvestigations various single-wall carbon nanotubes (SWCNT) samples in the form of buckypaper have beenirradiated to doses in the range 35–1.3 Gy, use being made of a 90Sr beta source, the response of the CNTsbuckypaper with dose showing a trend towards linearity. It is shown for present production methodology forbuckypaper samples that the raw SWCNT buckypaper offer the greatest sensitivity, detecting doses down tosome few tens of mGy.
1. Introduction
Since the discovery of CNTs by Iijima (Iijima, 1991), the potentialfor their applications has encouraged a large numbers of studies, bothacross the underpinning sciences as well as across the technologies thatenjoy associations with these, investigations of CNT being in terms ofproperties and their utilisation. In regard to the advantageous proper-ties of CNTs, among these one can mention their unusually largeelectrical- and thermal-conductivities (Hone et al., 2000) as well astheir very large tensile strengths (Yu et al., 2000). Concerning the latteraspect, it is to be further appreciated that the microscopic network ofthin samples formed from the CNTs in the creation of buckypaper(Fig. 1) gives rise to considerable flexibility, allowing large damage-freeshape change. These particular properties point in part to the
possibility of CNTs being candidate media for thermoluminescencedosimetry of energetic radiations, not least for in vivo applications. Afurther fundamental aspect for CNTs to be potential TLD media is theneed for trapping centres, forming one particular focus of presentinvestigation. Among the alternative forms of dosimetry are alsoincluded active devices such as semiconductor diodes and graphiteion chambers, these representing electrical risks, particularly for invivo work, also passive TLD systems based on phosphors, such as LiF,that due to their inherent hygroscopic nature also have limitedprospects for in vivo applications. CNTs also have an effective atomicnumber similar to that of adipose tissue, making it suitable for softtissue dosimetry.
In previous work by this group (Alanazi et al., 2016) the thermo-luminescence signal was measured from samples of Single-Wall
http://dx.doi.org/10.1016/j.radphyschem.2016.12.004Received 30 October 2016; Accepted 14 December 2016
E-mail address: [email protected] (A. Alanazi).
Radiation Physics and Chemistry 140 (2017) 87–91
Available online 15 December 20160969-806X/ © 2016 Elsevier Ltd. All rights reserved.
MARK
Appendix E
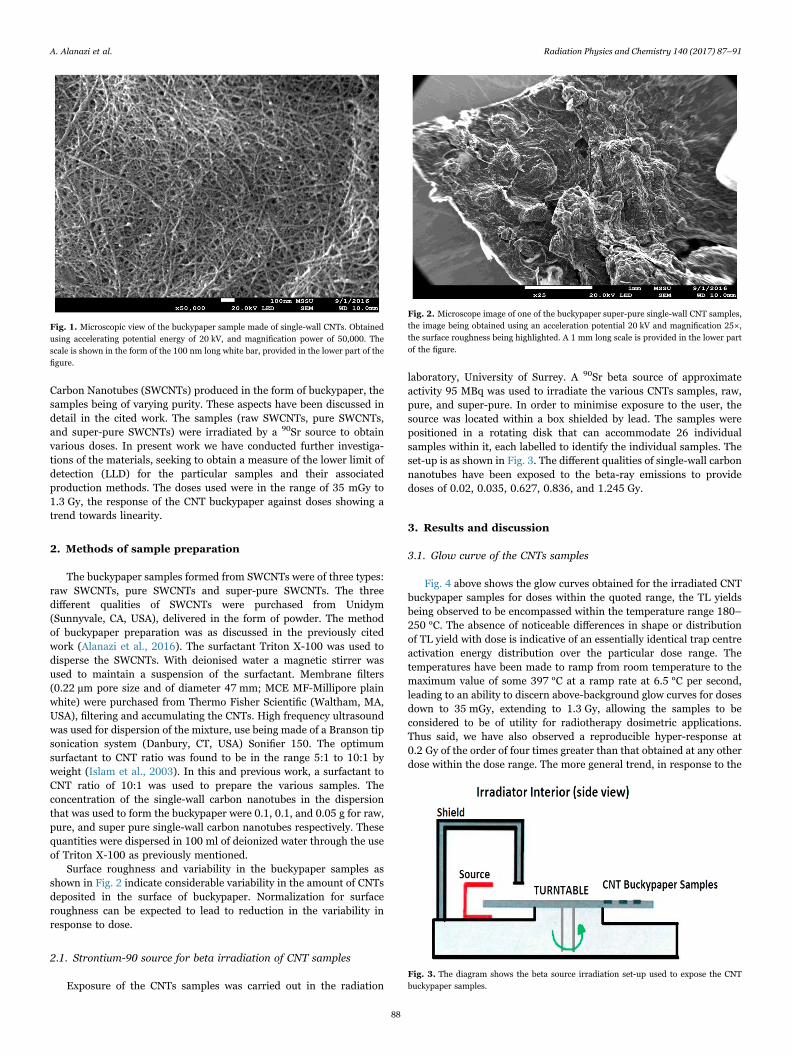
Carbon Nanotubes (SWCNTs) produced in the form of buckypaper, thesamples being of varying purity. These aspects have been discussed indetail in the cited work. The samples (raw SWCNTs, pure SWCNTs,and super-pure SWCNTs) were irradiated by a 90Sr source to obtainvarious doses. In present work we have conducted further investiga-tions of the materials, seeking to obtain a measure of the lower limit ofdetection (LLD) for the particular samples and their associatedproduction methods. The doses used were in the range of 35 mGy to1.3 Gy, the response of the CNT buckypaper against doses showing atrend towards linearity.
2. Methods of sample preparation
The buckypaper samples formed from SWCNTs were of three types:raw SWCNTs, pure SWCNTs and super-pure SWCNTs. The threedifferent qualities of SWCNTs were purchased from Unidym(Sunnyvale, CA, USA), delivered in the form of powder. The methodof buckypaper preparation was as discussed in the previously citedwork (Alanazi et al., 2016). The surfactant Triton X-100 was used todisperse the SWCNTs. With deionised water a magnetic stirrer wasused to maintain a suspension of the surfactant. Membrane filters(0.22 µm pore size and of diameter 47 mm; MCE MF-Millipore plainwhite) were purchased from Thermo Fisher Scientific (Waltham, MA,USA), filtering and accumulating the CNTs. High frequency ultrasoundwas used for dispersion of the mixture, use being made of a Branson tipsonication system (Danbury, CT, USA) Sonifier 150. The optimumsurfactant to CNT ratio was found to be in the range 5:1 to 10:1 byweight (Islam et al., 2003). In this and previous work, a surfactant toCNT ratio of 10:1 was used to prepare the various samples. Theconcentration of the single-wall carbon nanotubes in the dispersionthat was used to form the buckypaper were 0.1, 0.1, and 0.05 g for raw,pure, and super pure single-wall carbon nanotubes respectively. Thesequantities were dispersed in 100 ml of deionized water through the useof Triton X-100 as previously mentioned.
Surface roughness and variability in the buckypaper samples asshown in Fig. 2 indicate considerable variability in the amount of CNTsdeposited in the surface of buckypaper. Normalization for surfaceroughness can be expected to lead to reduction in the variability inresponse to dose.
2.1. Strontium-90 source for beta irradiation of CNT samples
Exposure of the CNTs samples was carried out in the radiation
laboratory, University of Surrey. A 90Sr beta source of approximateactivity 95 MBq was used to irradiate the various CNTs samples, raw,pure, and super-pure. In order to minimise exposure to the user, thesource was located within a box shielded by lead. The samples werepositioned in a rotating disk that can accommodate 26 individualsamples within it, each labelled to identify the individual samples. Theset-up is as shown in Fig. 3. The different qualities of single-wall carbonnanotubes have been exposed to the beta-ray emissions to providedoses of 0.02, 0.035, 0.627, 0.836, and 1.245 Gy.
3. Results and discussion
3.1. Glow curve of the CNTs samples
Fig. 4 above shows the glow curves obtained for the irradiated CNTbuckypaper samples for doses within the quoted range, the TL yieldsbeing observed to be encompassed within the temperature range 180–250 °C. The absence of noticeable differences in shape or distributionof TL yield with dose is indicative of an essentially identical trap centreactivation energy distribution over the particular dose range. Thetemperatures have been made to ramp from room temperature to themaximum value of some 397 °C at a ramp rate at 6.5 °C per second,leading to an ability to discern above-background glow curves for dosesdown to 35 mGy, extending to 1.3 Gy, allowing the samples to beconsidered to be of utility for radiotherapy dosimetric applications.Thus said, we have also observed a reproducible hyper-response at0.2 Gy of the order of four times greater than that obtained at any otherdose within the dose range. The more general trend, in response to the
Fig. 1. Microscopic view of the buckypaper sample made of single-wall CNTs. Obtainedusing accelerating potential energy of 20 kV, and magnification power of 50,000. Thescale is shown in the form of the 100 nm long white bar, provided in the lower part of thefigure.
Fig. 2. Microscope image of one of the buckypaper super-pure single-wall CNT samples,the image being obtained using an acceleration potential 20 kV and magnification 25×,the surface roughness being highlighted. A 1 mm long scale is provided in the lower partof the figure.
Fig. 3. The diagram shows the beta source irradiation set-up used to expose the CNTbuckypaper samples.
A. Alanazi et al. Radiation Physics and Chemistry 140 (2017) 87–91
88
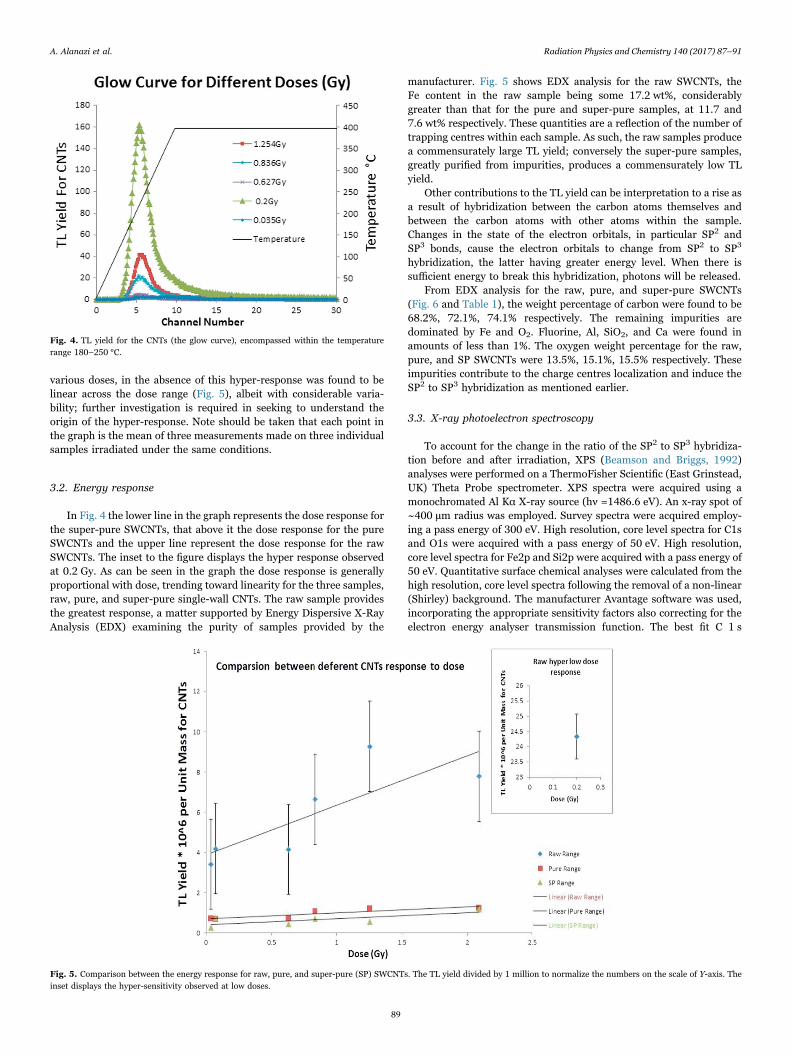
various doses, in the absence of this hyper-response was found to belinear across the dose range (Fig. 5), albeit with considerable varia-bility; further investigation is required in seeking to understand theorigin of the hyper-response. Note should be taken that each point inthe graph is the mean of three measurements made on three individualsamples irradiated under the same conditions.
3.2. Energy response
In Fig. 4 the lower line in the graph represents the dose response forthe super-pure SWCNTs, that above it the dose response for the pureSWCNTs and the upper line represent the dose response for the rawSWCNTs. The inset to the figure displays the hyper response observedat 0.2 Gy. As can be seen in the graph the dose response is generallyproportional with dose, trending toward linearity for the three samples,raw, pure, and super-pure single-wall CNTs. The raw sample providesthe greatest response, a matter supported by Energy Dispersive X-RayAnalysis (EDX) examining the purity of samples provided by the
manufacturer. Fig. 5 shows EDX analysis for the raw SWCNTs, theFe content in the raw sample being some 17.2 wt%, considerablygreater than that for the pure and super-pure samples, at 11.7 and7.6 wt% respectively. These quantities are a reflection of the number oftrapping centres within each sample. As such, the raw samples producea commensurately large TL yield; conversely the super-pure samples,greatly purified from impurities, produces a commensurately low TLyield.
Other contributions to the TL yield can be interpretation to a rise asa result of hybridization between the carbon atoms themselves andbetween the carbon atoms with other atoms within the sample.Changes in the state of the electron orbitals, in particular SP2 andSP3 bonds, cause the electron orbitals to change from SP2 to SP3
hybridization, the latter having greater energy level. When there issufficient energy to break this hybridization, photons will be released.
From EDX analysis for the raw, pure, and super-pure SWCNTs(Fig. 6 and Table 1), the weight percentage of carbon were found to be68.2%, 72.1%, 74.1% respectively. The remaining impurities aredominated by Fe and O2. Fluorine, Al, SiO2, and Ca were found inamounts of less than 1%. The oxygen weight percentage for the raw,pure, and SP SWCNTs were 13.5%, 15.1%, 15.5% respectively. Theseimpurities contribute to the charge centres localization and induce theSP2 to SP3 hybridization as mentioned earlier.
3.3. X-ray photoelectron spectroscopy
To account for the change in the ratio of the SP2 to SP3 hybridiza-tion before and after irradiation, XPS (Beamson and Briggs, 1992)analyses were performed on a ThermoFisher Scientific (East Grinstead,UK) Theta Probe spectrometer. XPS spectra were acquired using amonochromated Al Kα X-ray source (hν =1486.6 eV). An x-ray spot of~400 µm radius was employed. Survey spectra were acquired employ-ing a pass energy of 300 eV. High resolution, core level spectra for C1sand O1s were acquired with a pass energy of 50 eV. High resolution,core level spectra for Fe2p and Si2p were acquired with a pass energy of50 eV. Quantitative surface chemical analyses were calculated from thehigh resolution, core level spectra following the removal of a non-linear(Shirley) background. The manufacturer Avantage software was used,incorporating the appropriate sensitivity factors also correcting for theelectron energy analyser transmission function. The best fit C 1 s
Fig. 4. TL yield for the CNTs (the glow curve), encompassed within the temperaturerange 180–250 °C.
Fig. 5. Comparison between the energy response for raw, pure, and super-pure (SP) SWCNTs. The TL yield divided by 1 million to normalize the numbers on the scale of Y-axis. Theinset displays the hyper-sensitivity observed at low doses.
A. Alanazi et al. Radiation Physics and Chemistry 140 (2017) 87–91
89
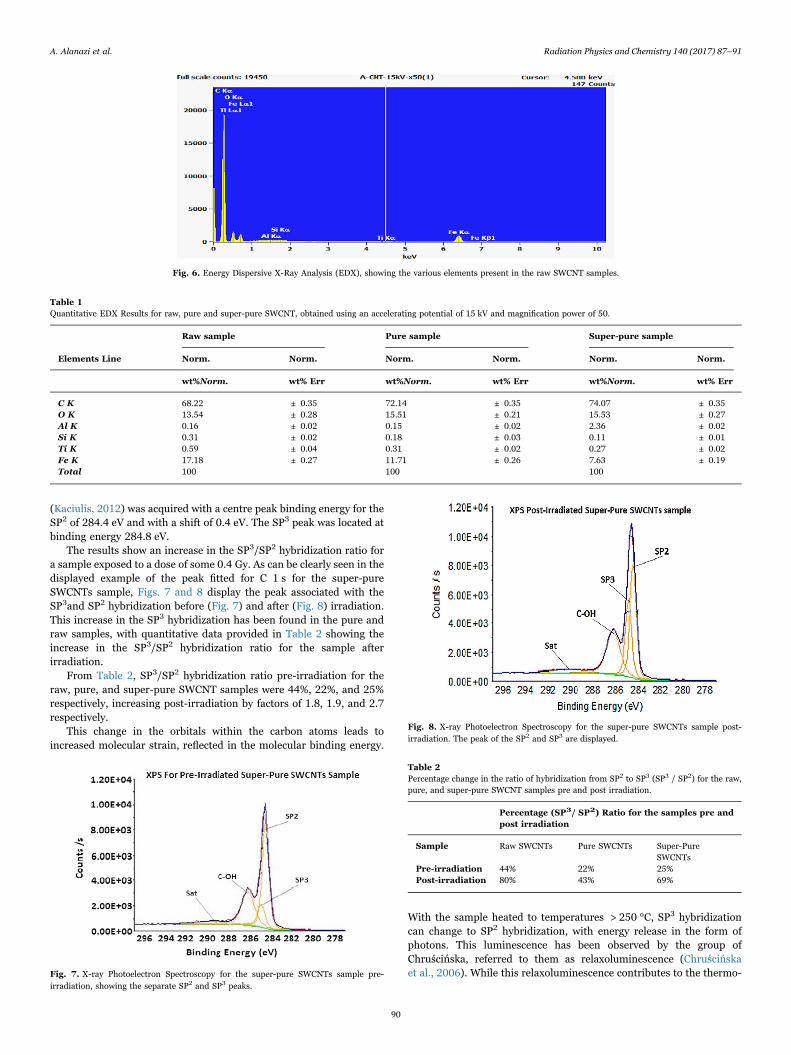
(Kaciulis, 2012) was acquired with a centre peak binding energy for theSP2 of 284.4 eV and with a shift of 0.4 eV. The SP3 peak was located atbinding energy 284.8 eV.
The results show an increase in the SP3/SP2 hybridization ratio fora sample exposed to a dose of some 0.4 Gy. As can be clearly seen in thedisplayed example of the peak fitted for C 1 s for the super-pureSWCNTs sample, Figs. 7 and 8 display the peak associated with theSP3and SP2 hybridization before (Fig. 7) and after (Fig. 8) irradiation.This increase in the SP3 hybridization has been found in the pure andraw samples, with quantitative data provided in Table 2 showing theincrease in the SP3/SP2 hybridization ratio for the sample afterirradiation.
From Table 2, SP3/SP2 hybridization ratio pre-irradiation for theraw, pure, and super-pure SWCNT samples were 44%, 22%, and 25%respectively, increasing post-irradiation by factors of 1.8, 1.9, and 2.7respectively.
This change in the orbitals within the carbon atoms leads toincreased molecular strain, reflected in the molecular binding energy.
With the sample heated to temperatures > 250 °C, SP3 hybridizationcan change to SP2 hybridization, with energy release in the form ofphotons. This luminescence has been observed by the group ofChruścińska, referred to them as relaxoluminescence (Chruścińskaet al., 2006). While this relaxoluminescence contributes to the thermo-
Fig. 6. Energy Dispersive X-Ray Analysis (EDX), showing the various elements present in the raw SWCNT samples.
Table 1Quantitative EDX Results for raw, pure and super-pure SWCNT, obtained using an accelerating potential of 15 kV and magnification power of 50.
Raw sample Pure sample Super-pure sample
Elements Line Norm. Norm. Norm. Norm. Norm. Norm.
wt%Norm. wt% Err wt%Norm. wt% Err wt%Norm. wt% Err
C K 68.22 ± 0.35 72.14 ± 0.35 74.07 ± 0.35O K 13.54 ± 0.28 15.51 ± 0.21 15.53 ± 0.27Al K 0.16 ± 0.02 0.15 ± 0.02 2.36 ± 0.02Si K 0.31 ± 0.02 0.18 ± 0.03 0.11 ± 0.01Ti K 0.59 ± 0.04 0.31 ± 0.02 0.27 ± 0.02Fe K 17.18 ± 0.27 11.71 ± 0.26 7.63 ± 0.19Total 100 100 100
Fig. 7. X-ray Photoelectron Spectroscopy for the super-pure SWCNTs sample pre-irradiation, showing the separate SP2 and SP3 peaks.
Fig. 8. X-ray Photoelectron Spectroscopy for the super-pure SWCNTs sample post-irradiation. The peak of the SP2 and SP3 are displayed.
Table 2Percentage change in the ratio of hybridization from SP2 to SP3 (SP3 / SP2) for the raw,pure, and super-pure SWCNT samples pre and post irradiation.
Percentage (SP3/ SP2) Ratio for the samples pre andpost irradiation
Sample Raw SWCNTs Pure SWCNTs Super-PureSWCNTs
Pre-irradiation 44% 22% 25%Post-irradiation 80% 43% 69%
A. Alanazi et al. Radiation Physics and Chemistry 140 (2017) 87–91
90
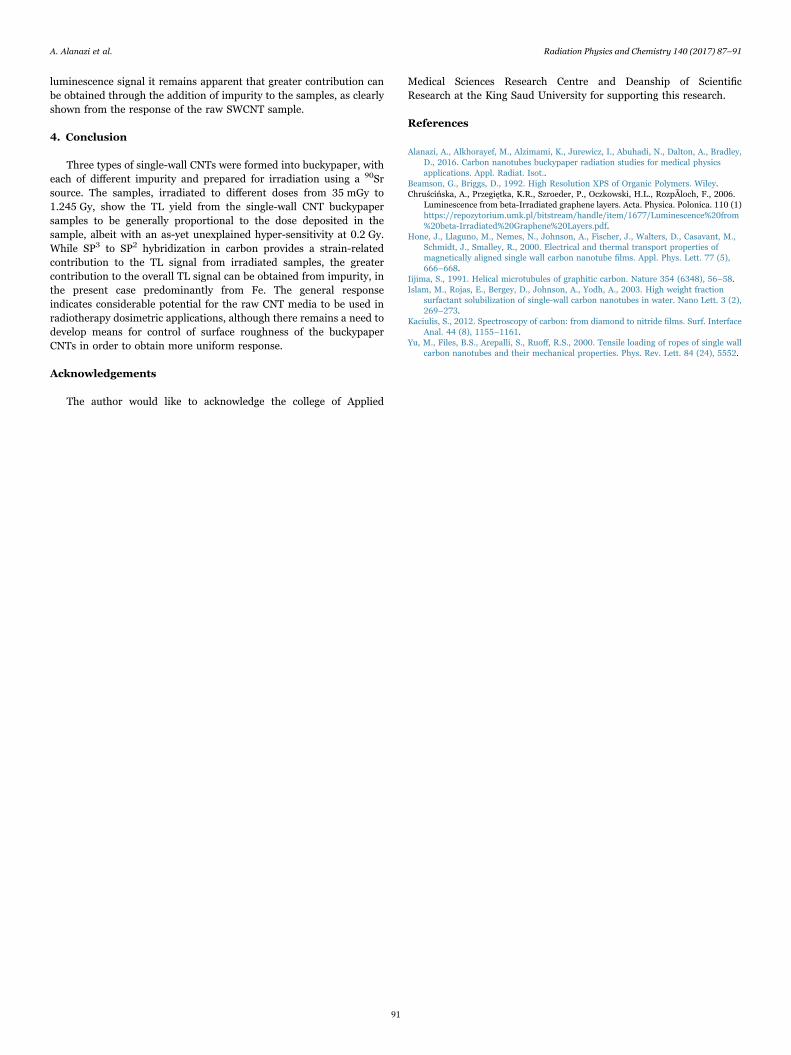
luminescence signal it remains apparent that greater contribution canbe obtained through the addition of impurity to the samples, as clearlyshown from the response of the raw SWCNT sample.
4. Conclusion
Three types of single-wall CNTs were formed into buckypaper, witheach of different impurity and prepared for irradiation using a 90Srsource. The samples, irradiated to different doses from 35 mGy to1.245 Gy, show the TL yield from the single-wall CNT buckypapersamples to be generally proportional to the dose deposited in thesample, albeit with an as-yet unexplained hyper-sensitivity at 0.2 Gy.While SP3 to SP2 hybridization in carbon provides a strain-relatedcontribution to the TL signal from irradiated samples, the greatercontribution to the overall TL signal can be obtained from impurity, inthe present case predominantly from Fe. The general responseindicates considerable potential for the raw CNT media to be used inradiotherapy dosimetric applications, although there remains a need todevelop means for control of surface roughness of the buckypaperCNTs in order to obtain more uniform response.
Acknowledgements
The author would like to acknowledge the college of Applied
Medical Sciences Research Centre and Deanship of ScientificResearch at the King Saud University for supporting this research.
References
Alanazi, A., Alkhorayef, M., Alzimami, K., Jurewicz, I., Abuhadi, N., Dalton, A., Bradley,D., 2016. Carbon nanotubes buckypaper radiation studies for medical physicsapplications. Appl. Radiat. Isot..
Beamson, G., Briggs, D., 1992. High Resolution XPS of Organic Polymers. Wiley.Chruścińska, A., Przegiętka, K.R., Szroeder, P., Oczkowski, H.L., RozpÃloch, F., 2006.
Luminescence from beta-Irradiated graphene layers. Acta. Physica. Polonica. 110 (1)https://repozytorium.umk.pl/bitstream/handle/item/1677/Luminescence%20from%20beta-Irradiated%20Graphene%20Layers.pdf.
Hone, J., Llaguno, M., Nemes, N., Johnson, A., Fischer, J., Walters, D., Casavant, M.,Schmidt, J., Smalley, R., 2000. Electrical and thermal transport properties ofmagnetically aligned single wall carbon nanotube films. Appl. Phys. Lett. 77 (5),666–668.
Iijima, S., 1991. Helical microtubules of graphitic carbon. Nature 354 (6348), 56–58.Islam, M., Rojas, E., Bergey, D., Johnson, A., Yodh, A., 2003. High weight fraction
surfactant solubilization of single-wall carbon nanotubes in water. Nano Lett. 3 (2),269–273.
Kaciulis, S., 2012. Spectroscopy of carbon: from diamond to nitride films. Surf. InterfaceAnal. 44 (8), 1155–1161.
Yu, M., Files, B.S., Arepalli, S., Ruoff, R.S., 2000. Tensile loading of ropes of single wallcarbon nanotubes and their mechanical properties. Phys. Rev. Lett. 84 (24), 5552.
A. Alanazi et al. Radiation Physics and Chemistry 140 (2017) 87–91
91
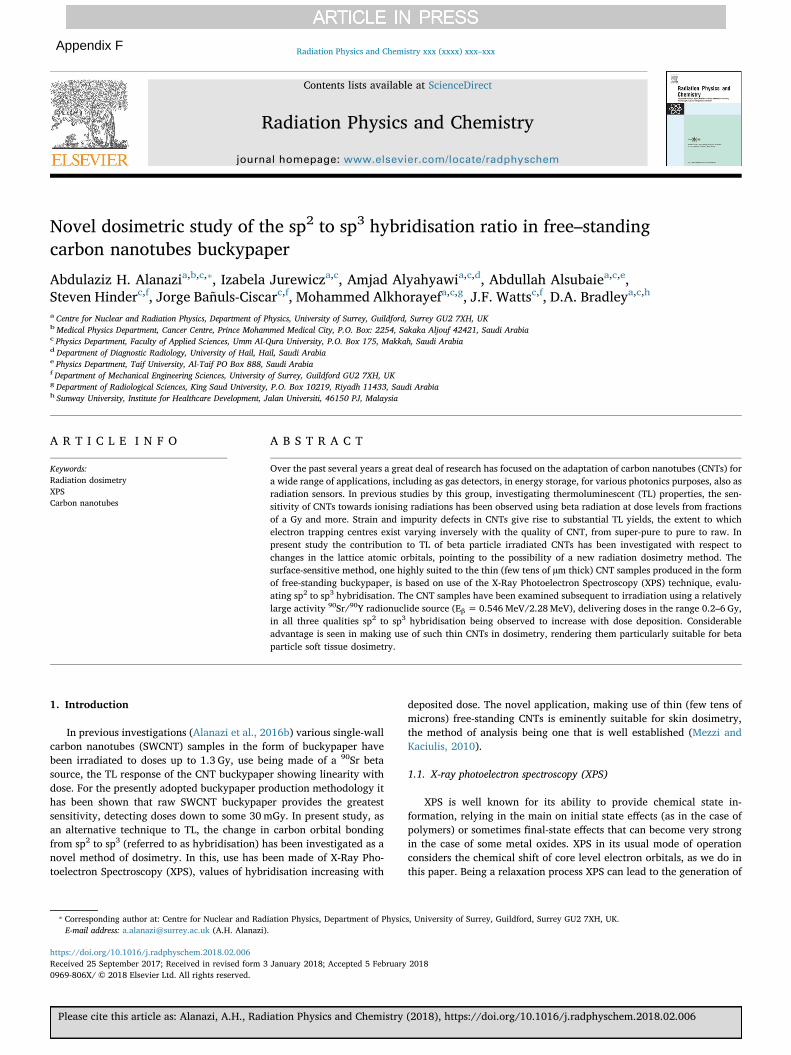
Contents lists available at ScienceDirect
Radiation Physics and Chemistry
journal homepage: www.elsevier.com/locate/radphyschem
Novel dosimetric study of the sp2 to sp3 hybridisation ratio in free–standingcarbon nanotubes buckypaper
Abdulaziz H. Alanazia,b,c,⁎, Izabela Jurewicza,c, Amjad Alyahyawia,c,d, Abdullah Alsubaiea,c,e,Steven Hinderc,f, Jorge Bañuls-Ciscarc,f, Mohammed Alkhorayefa,c,g, J.F. Wattsc,f, D.A. Bradleya,c,h
a Centre for Nuclear and Radiation Physics, Department of Physics, University of Surrey, Guildford, Surrey GU2 7XH, UKbMedical Physics Department, Cancer Centre, Prince Mohammed Medical City, P.O. Box: 2254, Sakaka Aljouf 42421, Saudi Arabiac Physics Department, Faculty of Applied Sciences, Umm Al-Qura University, P.O. Box 175, Makkah, Saudi Arabiad Department of Diagnostic Radiology, University of Hail, Hail, Saudi Arabiae Physics Department, Taif University, Al-Taif PO Box 888, Saudi ArabiafDepartment of Mechanical Engineering Sciences, University of Surrey, Guildford GU2 7XH, UKg Department of Radiological Sciences, King Saud University, P.O. Box 10219, Riyadh 11433, Saudi Arabiah Sunway University, Institute for Healthcare Development, Jalan Universiti, 46150 PJ, Malaysia
A R T I C L E I N F O
Keywords:Radiation dosimetryXPSCarbon nanotubes
A B S T R A C T
Over the past several years a great deal of research has focused on the adaptation of carbon nanotubes (CNTs) fora wide range of applications, including as gas detectors, in energy storage, for various photonics purposes, also asradiation sensors. In previous studies by this group, investigating thermoluminescent (TL) properties, the sen-sitivity of CNTs towards ionising radiations has been observed using beta radiation at dose levels from fractionsof a Gy and more. Strain and impurity defects in CNTs give rise to substantial TL yields, the extent to whichelectron trapping centres exist varying inversely with the quality of CNT, from super-pure to pure to raw. Inpresent study the contribution to TL of beta particle irradiated CNTs has been investigated with respect tochanges in the lattice atomic orbitals, pointing to the possibility of a new radiation dosimetry method. Thesurface-sensitive method, one highly suited to the thin (few tens of µm thick) CNT samples produced in the formof free-standing buckypaper, is based on use of the X-Ray Photoelectron Spectroscopy (XPS) technique, evalu-ating sp2 to sp3 hybridisation. The CNT samples have been examined subsequent to irradiation using a relativelylarge activity 90Sr/90Y radionuclide source (Eβ =0.546MeV/2.28MeV), delivering doses in the range 0.2–6 Gy,in all three qualities sp2 to sp3 hybridisation being observed to increase with dose deposition. Considerableadvantage is seen in making use of such thin CNTs in dosimetry, rendering them particularly suitable for betaparticle soft tissue dosimetry.
1. Introduction
In previous investigations (Alanazi et al., 2016b) various single-wallcarbon nanotubes (SWCNT) samples in the form of buckypaper havebeen irradiated to doses up to 1.3 Gy, use being made of a 90Sr betasource, the TL response of the CNT buckypaper showing linearity withdose. For the presently adopted buckypaper production methodology ithas been shown that raw SWCNT buckypaper provides the greatestsensitivity, detecting doses down to some 30mGy. In present study, asan alternative technique to TL, the change in carbon orbital bondingfrom sp2 to sp3 (referred to as hybridisation) has been investigated as anovel method of dosimetry. In this, use has been made of X-Ray Pho-toelectron Spectroscopy (XPS), values of hybridisation increasing with
deposited dose. The novel application, making use of thin (few tens ofmicrons) free-standing CNTs is eminently suitable for skin dosimetry,the method of analysis being one that is well established (Mezzi andKaciulis, 2010).
1.1. X-ray photoelectron spectroscopy (XPS)
XPS is well known for its ability to provide chemical state in-formation, relying in the main on initial state effects (as in the case ofpolymers) or sometimes final-state effects that can become very strongin the case of some metal oxides. XPS in its usual mode of operationconsiders the chemical shift of core level electron orbitals, as we do inthis paper. Being a relaxation process XPS can lead to the generation of
https://doi.org/10.1016/j.radphyschem.2018.02.006Received 25 September 2017; Received in revised form 3 January 2018; Accepted 5 February 2018
⁎ Corresponding author at: Centre for Nuclear and Radiation Physics, Department of Physics, University of Surrey, Guildford, Surrey GU2 7XH, UK.E-mail address: [email protected] (A.H. Alanazi).
Radiation Physics and Chemistry xxx (xxxx) xxx–xxx
0969-806X/ © 2018 Elsevier Ltd. All rights reserved.
Please cite this article as: Alanazi, A.H., Radiation Physics and Chemistry (2018), https://doi.org/10.1016/j.radphyschem.2018.02.006
Appendix F
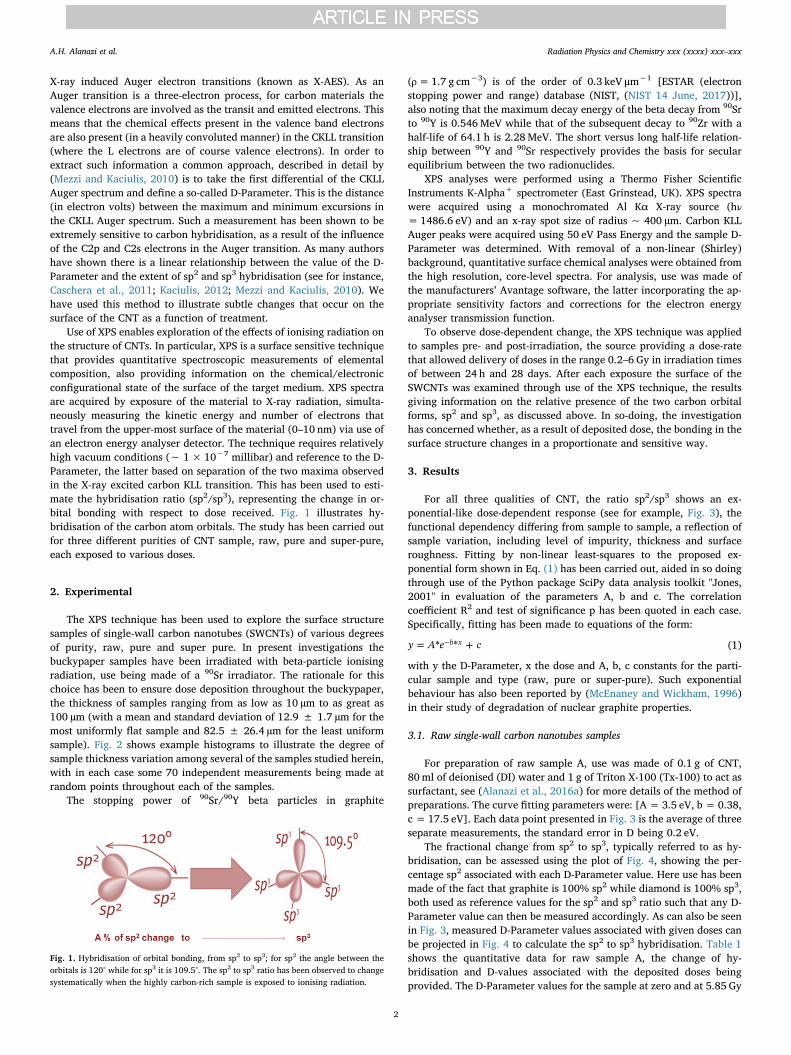
X-ray induced Auger electron transitions (known as X-AES). As anAuger transition is a three-electron process, for carbon materials thevalence electrons are involved as the transit and emitted electrons. Thismeans that the chemical effects present in the valence band electronsare also present (in a heavily convoluted manner) in the CKLL transition(where the L electrons are of course valence electrons). In order toextract such information a common approach, described in detail by(Mezzi and Kaciulis, 2010) is to take the first differential of the CKLLAuger spectrum and define a so-called D-Parameter. This is the distance(in electron volts) between the maximum and minimum excursions inthe CKLL Auger spectrum. Such a measurement has been shown to beextremely sensitive to carbon hybridisation, as a result of the influenceof the C2p and C2s electrons in the Auger transition. As many authorshave shown there is a linear relationship between the value of the D-Parameter and the extent of sp2 and sp3 hybridisation (see for instance,Caschera et al., 2011; Kaciulis, 2012; Mezzi and Kaciulis, 2010). Wehave used this method to illustrate subtle changes that occur on thesurface of the CNT as a function of treatment.
Use of XPS enables exploration of the effects of ionising radiation onthe structure of CNTs. In particular, XPS is a surface sensitive techniquethat provides quantitative spectroscopic measurements of elementalcomposition, also providing information on the chemical/electronicconfigurational state of the surface of the target medium. XPS spectraare acquired by exposure of the material to X-ray radiation, simulta-neously measuring the kinetic energy and number of electrons thattravel from the upper-most surface of the material (0–10 nm) via use ofan electron energy analyser detector. The technique requires relativelyhigh vacuum conditions (∼ 1×10⁻⁷ millibar) and reference to the D-Parameter, the latter based on separation of the two maxima observedin the X-ray excited carbon KLL transition. This has been used to esti-mate the hybridisation ratio (sp2/sp3), representing the change in or-bital bonding with respect to dose received. Fig. 1 illustrates hy-bridisation of the carbon atom orbitals. The study has been carried outfor three different purities of CNT sample, raw, pure and super-pure,each exposed to various doses.
2. Experimental
The XPS technique has been used to explore the surface structuresamples of single-wall carbon nanotubes (SWCNTs) of various degreesof purity, raw, pure and super pure. In present investigations thebuckypaper samples have been irradiated with beta-particle ionisingradiation, use being made of a 90Sr irradiator. The rationale for thischoice has been to ensure dose deposition throughout the buckypaper,the thickness of samples ranging from as low as 10 µm to as great as100 µm (with a mean and standard deviation of 12.9 ± 1.7 µm for themost uniformly flat sample and 82.5 ± 26.4 µm for the least uniformsample). Fig. 2 shows example histograms to illustrate the degree ofsample thickness variation among several of the samples studied herein,with in each case some 70 independent measurements being made atrandom points throughout each of the samples.
The stopping power of 90Sr/90Y beta particles in graphite
(ρ=1.7 g cm−3) is of the order of 0.3 keV μm−1 [ESTAR (electronstopping power and range) database (NIST, (NIST 14 June, 2017))],also noting that the maximum decay energy of the beta decay from 90Srto 90Y is 0.546MeV while that of the subsequent decay to 90Zr with ahalf-life of 64.1 h is 2.28MeV. The short versus long half-life relation-ship between 90Y and 90Sr respectively provides the basis for secularequilibrium between the two radionuclides.
XPS analyses were performed using a Thermo Fisher ScientificInstruments K-Alpha+ spectrometer (East Grinstead, UK). XPS spectrawere acquired using a monochromated Al Kα X-ray source (hν=1486.6 eV) and an x-ray spot size of radius ~ 400 µm. Carbon KLLAuger peaks were acquired using 50 eV Pass Energy and the sample D-Parameter was determined. With removal of a non-linear (Shirley)background, quantitative surface chemical analyses were obtained fromthe high resolution, core-level spectra. For analysis, use was made ofthe manufacturers’ Avantage software, the latter incorporating the ap-propriate sensitivity factors and corrections for the electron energyanalyser transmission function.
To observe dose-dependent change, the XPS technique was appliedto samples pre- and post-irradiation, the source providing a dose-ratethat allowed delivery of doses in the range 0.2–6 Gy in irradiation timesof between 24 h and 28 days. After each exposure the surface of theSWCNTs was examined through use of the XPS technique, the resultsgiving information on the relative presence of the two carbon orbitalforms, sp2 and sp3, as discussed above. In so-doing, the investigationhas concerned whether, as a result of deposited dose, the bonding in thesurface structure changes in a proportionate and sensitive way.
3. Results
For all three qualities of CNT, the ratio sp2/sp3 shows an ex-ponential-like dose-dependent response (see for example, Fig. 3), thefunctional dependency differing from sample to sample, a reflection ofsample variation, including level of impurity, thickness and surfaceroughness. Fitting by non-linear least-squares to the proposed ex-ponential form shown in Eq. (1) has been carried out, aided in so doingthrough use of the Python package SciPy data analysis toolkit "Jones,2001" in evaluation of the parameters A, b and c. The correlationcoefficient R2 and test of significance p has been quoted in each case.Specifically, fitting has been made to equations of the form:
= +−y A e c* *b x (1)
with y the D-Parameter, x the dose and A, b, c constants for the parti-cular sample and type (raw, pure or super-pure). Such exponentialbehaviour has also been reported by (McEnaney and Wickham, 1996)in their study of degradation of nuclear graphite properties.
3.1. Raw single-wall carbon nanotubes samples
For preparation of raw sample A, use was made of 0.1 g of CNT,80ml of deionised (DI) water and 1 g of Triton X-100 (Tx-100) to act assurfactant, see (Alanazi et al., 2016a) for more details of the method ofpreparations. The curve fitting parameters were: [A =3.5 eV, b =0.38,c = 17.5 eV]. Each data point presented in Fig. 3 is the average of threeseparate measurements, the standard error in D being 0.2 eV.
The fractional change from sp2 to sp3, typically referred to as hy-bridisation, can be assessed using the plot of Fig. 4, showing the per-centage sp2 associated with each D-Parameter value. Here use has beenmade of the fact that graphite is 100% sp2 while diamond is 100% sp3,both used as reference values for the sp2 and sp3 ratio such that any D-Parameter value can then be measured accordingly. As can also be seenin Fig. 3, measured D-Parameter values associated with given doses canbe projected in Fig. 4 to calculate the sp2 to sp3 hybridisation. Table 1shows the quantitative data for raw sample A, the change of hy-bridisation and D-values associated with the deposited doses beingprovided. The D-Parameter values for the sample at zero and at 5.85 Gy
Fig. 1. Hybridisation of orbital bonding, from sp2 to sp3; for sp2 the angle between theorbitals is 120° while for sp3 it is 109.5°. The sp2 to sp3 ratio has been observed to changesystematically when the highly carbon-rich sample is exposed to ionising radiation.
A.H. Alanazi et al. Radiation Physics and Chemistry xxx (xxxx) xxx–xxx
2
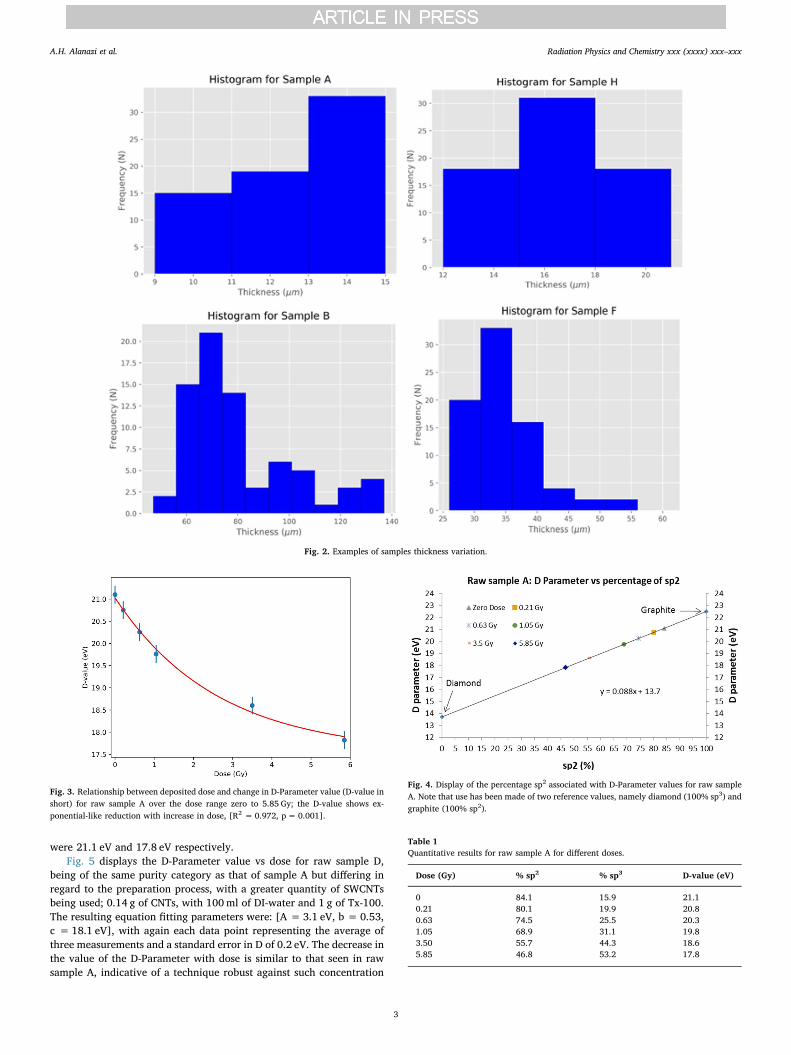
were 21.1 eV and 17.8 eV respectively.Fig. 5 displays the D-Parameter value vs dose for raw sample D,
being of the same purity category as that of sample A but differing inregard to the preparation process, with a greater quantity of SWCNTsbeing used; 0.14 g of CNTs, with 100ml of DI-water and 1 g of Tx-100.The resulting equation fitting parameters were: [A =3.1 eV, b = 0.53,c = 18.1 eV], with again each data point representing the average ofthree measurements and a standard error in D of 0.2 eV. The decrease inthe value of the D-Parameter with dose is similar to that seen in rawsample A, indicative of a technique robust against such concentration
Fig. 2. Examples of samples thickness variation.
Fig. 3. Relationship between deposited dose and change in D-Parameter value (D-value inshort) for raw sample A over the dose range zero to 5.85 Gy; the D-value shows ex-ponential-like reduction with increase in dose, [R2 = 0.972, p= 0.001].
Fig. 4. Display of the percentage sp2 associated with D-Parameter values for raw sampleA. Note that use has been made of two reference values, namely diamond (100% sp3) andgraphite (100% sp2).
Table 1Quantitative results for raw sample A for different doses.
Dose (Gy) % sp2 % sp3 D-value (eV)
0 84.1 15.9 21.10.21 80.1 19.9 20.80.63 74.5 25.5 20.31.05 68.9 31.1 19.83.50 55.7 44.3 18.65.85 46.8 53.2 17.8
A.H. Alanazi et al. Radiation Physics and Chemistry xxx (xxxx) xxx–xxx
3
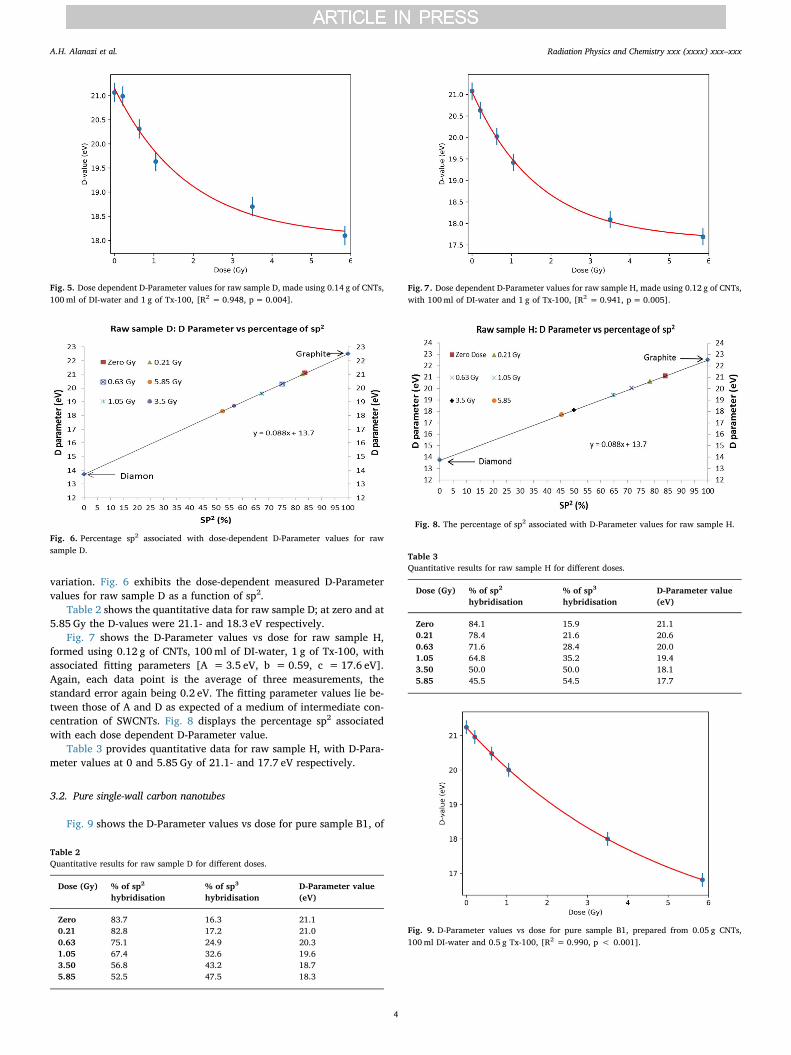
variation. Fig. 6 exhibits the dose-dependent measured D-Parametervalues for raw sample D as a function of sp2.
Table 2 shows the quantitative data for raw sample D; at zero and at5.85 Gy the D-values were 21.1- and 18.3 eV respectively.
Fig. 7 shows the D-Parameter values vs dose for raw sample H,formed using 0.12 g of CNTs, 100ml of DI-water, 1 g of Tx-100, withassociated fitting parameters [A =3.5 eV, b = 0.59, c = 17.6 eV].Again, each data point is the average of three measurements, thestandard error again being 0.2 eV. The fitting parameter values lie be-tween those of A and D as expected of a medium of intermediate con-centration of SWCNTs. Fig. 8 displays the percentage sp2 associatedwith each dose dependent D-Parameter value.
Table 3 provides quantitative data for raw sample H, with D-Para-meter values at 0 and 5.85 Gy of 21.1- and 17.7 eV respectively.
3.2. Pure single-wall carbon nanotubes
Fig. 9 shows the D-Parameter values vs dose for pure sample B1, of
Fig. 5. Dose dependent D-Parameter values for raw sample D, made using 0.14 g of CNTs,100ml of DI-water and 1 g of Tx-100, [R2 = 0.948, p= 0.004].
Fig. 6. Percentage sp2 associated with dose-dependent D-Parameter values for rawsample D.
Table 2Quantitative results for raw sample D for different doses.
Dose (Gy) % of sp2
hybridisation% of sp3
hybridisationD-Parameter value(eV)
Zero 83.7 16.3 21.10.21 82.8 17.2 21.00.63 75.1 24.9 20.31.05 67.4 32.6 19.63.50 56.8 43.2 18.75.85 52.5 47.5 18.3
Fig. 7. Dose dependent D-Parameter values for raw sample H, made using 0.12 g of CNTs,with 100ml of DI-water and 1 g of Tx-100, [R2 = 0.941, p= 0.005].
Fig. 8. The percentage of sp2 associated with D-Parameter values for raw sample H.
Table 3Quantitative results for raw sample H for different doses.
Dose (Gy) % of sp2
hybridisation% of sp3
hybridisationD-Parameter value(eV)
Zero 84.1 15.9 21.10.21 78.4 21.6 20.60.63 71.6 28.4 20.01.05 64.8 35.2 19.43.50 50.0 50.0 18.15.85 45.5 54.5 17.7
Fig. 9. D-Parameter values vs dose for pure sample B1, prepared from 0.05 g CNTs,100ml DI-water and 0.5 g Tx-100, [R2 = 0.990, p < 0.001].
A.H. Alanazi et al. Radiation Physics and Chemistry xxx (xxxx) xxx–xxx
4
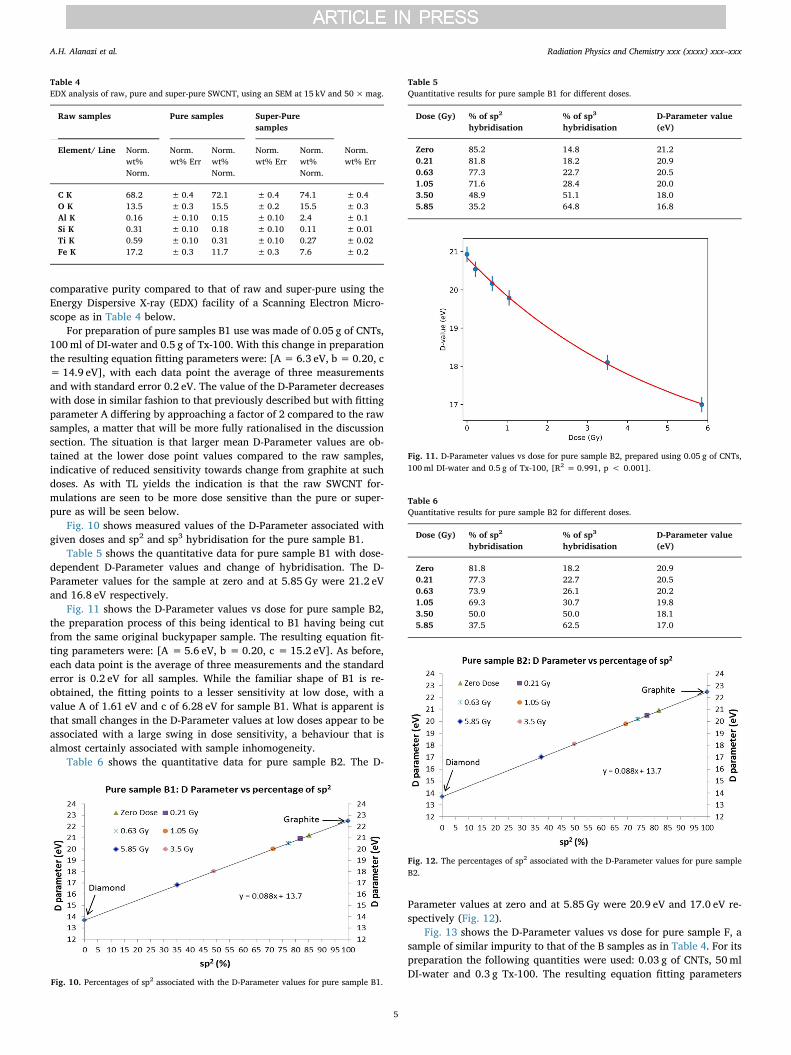
comparative purity compared to that of raw and super-pure using theEnergy Dispersive X-ray (EDX) facility of a Scanning Electron Micro-scope as in Table 4 below.
For preparation of pure samples B1 use was made of 0.05 g of CNTs,100ml of DI-water and 0.5 g of Tx-100. With this change in preparationthe resulting equation fitting parameters were: [A = 6.3 eV, b =0.20, c= 14.9 eV], with each data point the average of three measurementsand with standard error 0.2 eV. The value of the D-Parameter decreaseswith dose in similar fashion to that previously described but with fittingparameter A differing by approaching a factor of 2 compared to the rawsamples, a matter that will be more fully rationalised in the discussionsection. The situation is that larger mean D-Parameter values are ob-tained at the lower dose point values compared to the raw samples,indicative of reduced sensitivity towards change from graphite at suchdoses. As with TL yields the indication is that the raw SWCNT for-mulations are seen to be more dose sensitive than the pure or super-pure as will be seen below.
Fig. 10 shows measured values of the D-Parameter associated withgiven doses and sp2 and sp3 hybridisation for the pure sample B1.
Table 5 shows the quantitative data for pure sample B1 with dose-dependent D-Parameter values and change of hybridisation. The D-Parameter values for the sample at zero and at 5.85 Gy were 21.2 eVand 16.8 eV respectively.
Fig. 11 shows the D-Parameter values vs dose for pure sample B2,the preparation process of this being identical to B1 having being cutfrom the same original buckypaper sample. The resulting equation fit-ting parameters were: [A =5.6 eV, b =0.20, c = 15.2 eV]. As before,each data point is the average of three measurements and the standarderror is 0.2 eV for all samples. While the familiar shape of B1 is re-obtained, the fitting points to a lesser sensitivity at low dose, with avalue A of 1.61 eV and c of 6.28 eV for sample B1. What is apparent isthat small changes in the D-Parameter values at low doses appear to beassociated with a large swing in dose sensitivity, a behaviour that isalmost certainly associated with sample inhomogeneity.
Table 6 shows the quantitative data for pure sample B2. The D-
Parameter values at zero and at 5.85 Gy were 20.9 eV and 17.0 eV re-spectively (Fig. 12).
Fig. 13 shows the D-Parameter values vs dose for pure sample F, asample of similar impurity to that of the B samples as in Table 4. For itspreparation the following quantities were used: 0.03 g of CNTs, 50mlDI-water and 0.3 g Tx-100. The resulting equation fitting parameters
Table 4EDX analysis of raw, pure and super-pure SWCNT, using an SEM at 15 kV and 50×mag.
Raw samples Pure samples Super-Puresamples
Element/ Line Norm. Norm. Norm. Norm. Norm. Norm.wt%Norm.
wt% Err wt%Norm.
wt% Err wt%Norm.
wt% Err
C K 68.2 ± 0.4 72.1 ± 0.4 74.1 ±0.4O K 13.5 ± 0.3 15.5 ± 0.2 15.5 ±0.3Al K 0.16 ± 0.10 0.15 ± 0.10 2.4 ±0.1Si K 0.31 ± 0.10 0.18 ± 0.10 0.11 ±0.01Ti K 0.59 ± 0.10 0.31 ± 0.10 0.27 ±0.02Fe K 17.2 ± 0.3 11.7 ± 0.3 7.6 ±0.2
Fig. 10. Percentages of sp2 associated with the D-Parameter values for pure sample B1.
Table 5Quantitative results for pure sample B1 for different doses.
Dose (Gy) % of sp2
hybridisation% of sp3
hybridisationD-Parameter value(eV)
Zero 85.2 14.8 21.20.21 81.8 18.2 20.90.63 77.3 22.7 20.51.05 71.6 28.4 20.03.50 48.9 51.1 18.05.85 35.2 64.8 16.8
Fig. 11. D-Parameter values vs dose for pure sample B2, prepared using 0.05 g of CNTs,100ml DI-water and 0.5 g of Tx-100, [R2 = 0.991, p < 0.001].
Table 6Quantitative results for pure sample B2 for different doses.
Dose (Gy) % of sp2
hybridisation% of sp3
hybridisationD-Parameter value(eV)
Zero 81.8 18.2 20.90.21 77.3 22.7 20.50.63 73.9 26.1 20.21.05 69.3 30.7 19.83.50 50.0 50.0 18.15.85 37.5 62.5 17.0
Fig. 12. The percentages of sp2 associated with the D-Parameter values for pure sampleB2.
A.H. Alanazi et al. Radiation Physics and Chemistry xxx (xxxx) xxx–xxx
5
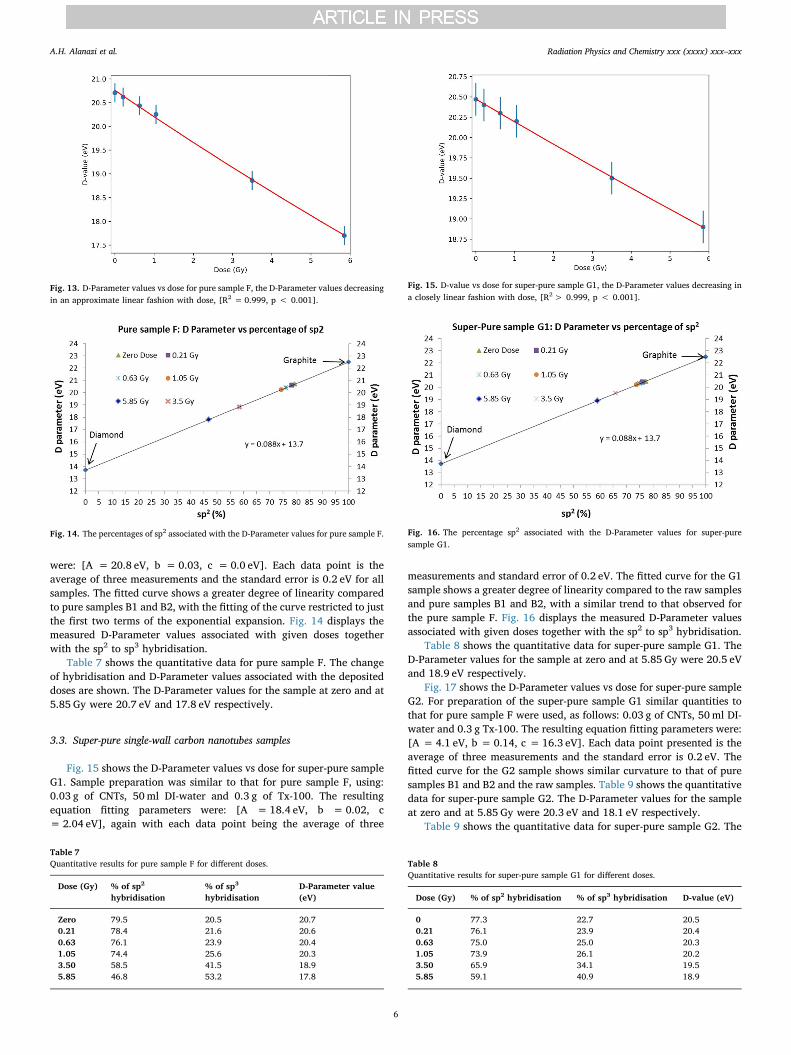
were: [A = 20.8 eV, b = 0.03, c = 0.0 eV]. Each data point is theaverage of three measurements and the standard error is 0.2 eV for allsamples. The fitted curve shows a greater degree of linearity comparedto pure samples B1 and B2, with the fitting of the curve restricted to justthe first two terms of the exponential expansion. Fig. 14 displays themeasured D-Parameter values associated with given doses togetherwith the sp2 to sp3 hybridisation.
Table 7 shows the quantitative data for pure sample F. The changeof hybridisation and D-Parameter values associated with the depositeddoses are shown. The D-Parameter values for the sample at zero and at5.85 Gy were 20.7 eV and 17.8 eV respectively.
3.3. Super-pure single-wall carbon nanotubes samples
Fig. 15 shows the D-Parameter values vs dose for super-pure sampleG1. Sample preparation was similar to that for pure sample F, using:0.03 g of CNTs, 50ml DI-water and 0.3 g of Tx-100. The resultingequation fitting parameters were: [A = 18.4 eV, b = 0.02, c= 2.04 eV], again with each data point being the average of three
measurements and standard error of 0.2 eV. The fitted curve for the G1sample shows a greater degree of linearity compared to the raw samplesand pure samples B1 and B2, with a similar trend to that observed forthe pure sample F. Fig. 16 displays the measured D-Parameter valuesassociated with given doses together with the sp2 to sp3 hybridisation.
Table 8 shows the quantitative data for super-pure sample G1. TheD-Parameter values for the sample at zero and at 5.85 Gy were 20.5 eVand 18.9 eV respectively.
Fig. 17 shows the D-Parameter values vs dose for super-pure sampleG2. For preparation of the super-pure sample G1 similar quantities tothat for pure sample F were used, as follows: 0.03 g of CNTs, 50ml DI-water and 0.3 g Tx-100. The resulting equation fitting parameters were:[A =4.1 eV, b = 0.14, c = 16.3 eV]. Each data point presented is theaverage of three measurements and the standard error is 0.2 eV. Thefitted curve for the G2 sample shows similar curvature to that of puresamples B1 and B2 and the raw samples. Table 9 shows the quantitativedata for super-pure sample G2. The D-Parameter values for the sampleat zero and at 5.85 Gy were 20.3 eV and 18.1 eV respectively.
Table 9 shows the quantitative data for super-pure sample G2. The
Fig. 13. D-Parameter values vs dose for pure sample F, the D-Parameter values decreasingin an approximate linear fashion with dose, [R2 =0.999, p < 0.001].
Fig. 14. The percentages of sp2 associated with the D-Parameter values for pure sample F.
Table 7Quantitative results for pure sample F for different doses.
Dose (Gy) % of sp2
hybridisation% of sp3
hybridisationD-Parameter value(eV)
Zero 79.5 20.5 20.70.21 78.4 21.6 20.60.63 76.1 23.9 20.41.05 74.4 25.6 20.33.50 58.5 41.5 18.95.85 46.8 53.2 17.8
Fig. 15. D-value vs dose for super-pure sample G1, the D-Parameter values decreasing ina closely linear fashion with dose, [R2> 0.999, p < 0.001].
Fig. 16. The percentage sp2 associated with the D-Parameter values for super-puresample G1.
Table 8Quantitative results for super-pure sample G1 for different doses.
Dose (Gy) % of sp2 hybridisation % of sp3 hybridisation D-value (eV)
0 77.3 22.7 20.50.21 76.1 23.9 20.40.63 75.0 25.0 20.31.05 73.9 26.1 20.23.50 65.9 34.1 19.55.85 59.1 40.9 18.9
A.H. Alanazi et al. Radiation Physics and Chemistry xxx (xxxx) xxx–xxx
6
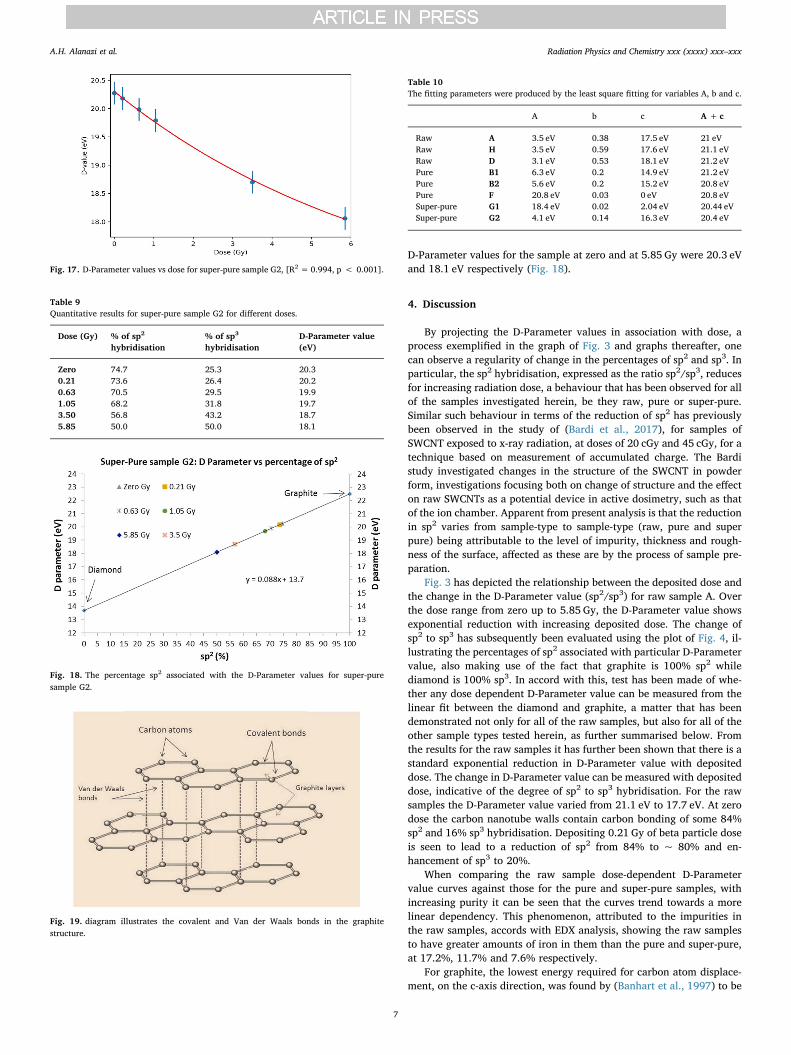
D-Parameter values for the sample at zero and at 5.85 Gy were 20.3 eVand 18.1 eV respectively (Fig. 18).
4. Discussion
By projecting the D-Parameter values in association with dose, aprocess exemplified in the graph of Fig. 3 and graphs thereafter, onecan observe a regularity of change in the percentages of sp2 and sp3. Inparticular, the sp2 hybridisation, expressed as the ratio sp2/sp3, reducesfor increasing radiation dose, a behaviour that has been observed for allof the samples investigated herein, be they raw, pure or super-pure.Similar such behaviour in terms of the reduction of sp2 has previouslybeen observed in the study of (Bardi et al., 2017), for samples ofSWCNT exposed to x-ray radiation, at doses of 20 cGy and 45 cGy, for atechnique based on measurement of accumulated charge. The Bardistudy investigated changes in the structure of the SWCNT in powderform, investigations focusing both on change of structure and the effecton raw SWCNTs as a potential device in active dosimetry, such as thatof the ion chamber. Apparent from present analysis is that the reductionin sp2 varies from sample-type to sample-type (raw, pure and superpure) being attributable to the level of impurity, thickness and rough-ness of the surface, affected as these are by the process of sample pre-paration.
Fig. 3 has depicted the relationship between the deposited dose andthe change in the D-Parameter value (sp2/sp3) for raw sample A. Overthe dose range from zero up to 5.85 Gy, the D-Parameter value showsexponential reduction with increasing deposited dose. The change ofsp2 to sp3 has subsequently been evaluated using the plot of Fig. 4, il-lustrating the percentages of sp2 associated with particular D-Parametervalue, also making use of the fact that graphite is 100% sp2 whilediamond is 100% sp3. In accord with this, test has been made of whe-ther any dose dependent D-Parameter value can be measured from thelinear fit between the diamond and graphite, a matter that has beendemonstrated not only for all of the raw samples, but also for all of theother sample types tested herein, as further summarised below. Fromthe results for the raw samples it has further been shown that there is astandard exponential reduction in D-Parameter value with depositeddose. The change in D-Parameter value can be measured with depositeddose, indicative of the degree of sp2 to sp3 hybridisation. For the rawsamples the D-Parameter value varied from 21.1 eV to 17.7 eV. At zerodose the carbon nanotube walls contain carbon bonding of some 84%sp2 and 16% sp3 hybridisation. Depositing 0.21 Gy of beta particle doseis seen to lead to a reduction of sp2 from 84% to ~ 80% and en-hancement of sp3 to 20%.
When comparing the raw sample dose-dependent D-Parametervalue curves against those for the pure and super-pure samples, withincreasing purity it can be seen that the curves trend towards a morelinear dependency. This phenomenon, attributed to the impurities inthe raw samples, accords with EDX analysis, showing the raw samplesto have greater amounts of iron in them than the pure and super-pure,at 17.2%, 11.7% and 7.6% respectively.
For graphite, the lowest energy required for carbon atom displace-ment, on the c-axis direction, was found by (Banhart et al., 1997) to be
Fig. 17. D-Parameter values vs dose for super-pure sample G2, [R2 = 0.994, p < 0.001].
Table 9Quantitative results for super-pure sample G2 for different doses.
Dose (Gy) % of sp2
hybridisation% of sp3
hybridisationD-Parameter value(eV)
Zero 74.7 25.3 20.30.21 73.6 26.4 20.20.63 70.5 29.5 19.91.05 68.2 31.8 19.73.50 56.8 43.2 18.75.85 50.0 50.0 18.1
Fig. 18. The percentage sp2 associated with the D-Parameter values for super-puresample G2.
Fig. 19. diagram illustrates the covalent and Van der Waals bonds in the graphitestructure.
Table 10The fitting parameters were produced by the least square fitting for variables A, b and c.
A b c A +c
Raw A 3.5 eV 0.38 17.5 eV 21 eVRaw H 3.5 eV 0.59 17.6 eV 21.1 eVRaw D 3.1 eV 0.53 18.1 eV 21.2 eVPure B1 6.3 eV 0.2 14.9 eV 21.2 eVPure B2 5.6 eV 0.2 15.2 eV 20.8 eVPure F 20.8 eV 0.03 0 eV 20.8 eVSuper-pure G1 18.4 eV 0.02 2.04 eV 20.44 eVSuper-pure G2 4.1 eV 0.14 16.3 eV 20.4 eV
A.H. Alanazi et al. Radiation Physics and Chemistry xxx (xxxx) xxx–xxx
7
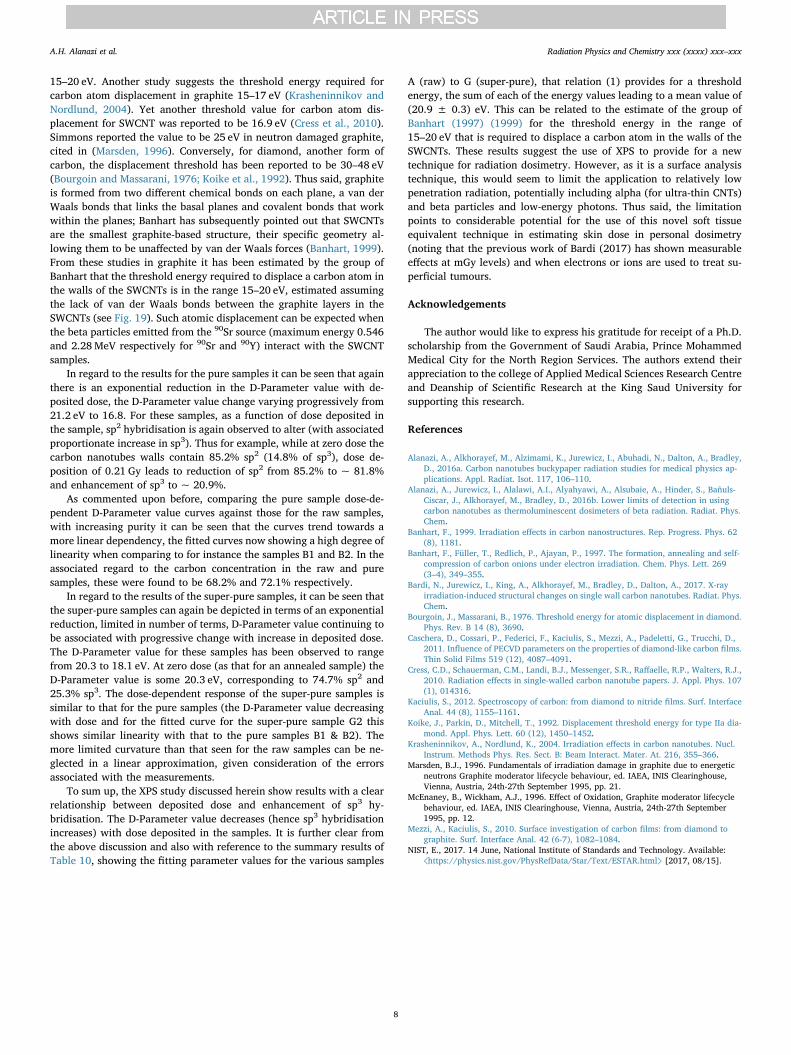
15–20 eV. Another study suggests the threshold energy required forcarbon atom displacement in graphite 15–17 eV (Krasheninnikov andNordlund, 2004). Yet another threshold value for carbon atom dis-placement for SWCNT was reported to be 16.9 eV (Cress et al., 2010).Simmons reported the value to be 25 eV in neutron damaged graphite,cited in (Marsden, 1996). Conversely, for diamond, another form ofcarbon, the displacement threshold has been reported to be 30–48 eV(Bourgoin and Massarani, 1976; Koike et al., 1992). Thus said, graphiteis formed from two different chemical bonds on each plane, a van derWaals bonds that links the basal planes and covalent bonds that workwithin the planes; Banhart has subsequently pointed out that SWCNTsare the smallest graphite-based structure, their specific geometry al-lowing them to be unaffected by van der Waals forces (Banhart, 1999).From these studies in graphite it has been estimated by the group ofBanhart that the threshold energy required to displace a carbon atom inthe walls of the SWCNTs is in the range 15–20 eV, estimated assumingthe lack of van der Waals bonds between the graphite layers in theSWCNTs (see Fig. 19). Such atomic displacement can be expected whenthe beta particles emitted from the 90Sr source (maximum energy 0.546and 2.28MeV respectively for 90Sr and 90Y) interact with the SWCNTsamples.
In regard to the results for the pure samples it can be seen that againthere is an exponential reduction in the D-Parameter value with de-posited dose, the D-Parameter value change varying progressively from21.2 eV to 16.8. For these samples, as a function of dose deposited inthe sample, sp2 hybridisation is again observed to alter (with associatedproportionate increase in sp3). Thus for example, while at zero dose thecarbon nanotubes walls contain 85.2% sp2 (14.8% of sp3), dose de-position of 0.21 Gy leads to reduction of sp2 from 85.2% to ~ 81.8%and enhancement of sp3 to ~ 20.9%.
As commented upon before, comparing the pure sample dose-de-pendent D-Parameter value curves against those for the raw samples,with increasing purity it can be seen that the curves trend towards amore linear dependency, the fitted curves now showing a high degree oflinearity when comparing to for instance the samples B1 and B2. In theassociated regard to the carbon concentration in the raw and puresamples, these were found to be 68.2% and 72.1% respectively.
In regard to the results of the super-pure samples, it can be seen thatthe super-pure samples can again be depicted in terms of an exponentialreduction, limited in number of terms, D-Parameter value continuing tobe associated with progressive change with increase in deposited dose.The D-Parameter value for these samples has been observed to rangefrom 20.3 to 18.1 eV. At zero dose (as that for an annealed sample) theD-Parameter value is some 20.3 eV, corresponding to 74.7% sp2 and25.3% sp3. The dose-dependent response of the super-pure samples issimilar to that for the pure samples (the D-Parameter value decreasingwith dose and for the fitted curve for the super-pure sample G2 thisshows similar linearity with that to the pure samples B1 & B2). Themore limited curvature than that seen for the raw samples can be ne-glected in a linear approximation, given consideration of the errorsassociated with the measurements.
To sum up, the XPS study discussed herein show results with a clearrelationship between deposited dose and enhancement of sp3 hy-bridisation. The D-Parameter value decreases (hence sp3 hybridisationincreases) with dose deposited in the samples. It is further clear fromthe above discussion and also with reference to the summary results ofTable 10, showing the fitting parameter values for the various samples
A (raw) to G (super-pure), that relation (1) provides for a thresholdenergy, the sum of each of the energy values leading to a mean value of(20.9 ± 0.3) eV. This can be related to the estimate of the group ofBanhart (1997) (1999) for the threshold energy in the range of15–20 eV that is required to displace a carbon atom in the walls of theSWCNTs. These results suggest the use of XPS to provide for a newtechnique for radiation dosimetry. However, as it is a surface analysistechnique, this would seem to limit the application to relatively lowpenetration radiation, potentially including alpha (for ultra-thin CNTs)and beta particles and low-energy photons. Thus said, the limitationpoints to considerable potential for the use of this novel soft tissueequivalent technique in estimating skin dose in personal dosimetry(noting that the previous work of Bardi (2017) has shown measurableeffects at mGy levels) and when electrons or ions are used to treat su-perficial tumours.
Acknowledgements
The author would like to express his gratitude for receipt of a Ph.D.scholarship from the Government of Saudi Arabia, Prince MohammedMedical City for the North Region Services. The authors extend theirappreciation to the college of Applied Medical Sciences Research Centreand Deanship of Scientific Research at the King Saud University forsupporting this research.
References
Alanazi, A., Alkhorayef, M., Alzimami, K., Jurewicz, I., Abuhadi, N., Dalton, A., Bradley,D., 2016a. Carbon nanotubes buckypaper radiation studies for medical physics ap-plications. Appl. Radiat. Isot. 117, 106–110.
Alanazi, A., Jurewicz, I., Alalawi, A.I., Alyahyawi, A., Alsubaie, A., Hinder, S., Bañuls-Ciscar, J., Alkhorayef, M., Bradley, D., 2016b. Lower limits of detection in usingcarbon nanotubes as thermoluminescent dosimeters of beta radiation. Radiat. Phys.Chem.
Banhart, F., 1999. Irradiation effects in carbon nanostructures. Rep. Progress. Phys. 62(8), 1181.
Banhart, F., Füller, T., Redlich, P., Ajayan, P., 1997. The formation, annealing and self-compression of carbon onions under electron irradiation. Chem. Phys. Lett. 269(3–4), 349–355.
Bardi, N., Jurewicz, I., King, A., Alkhorayef, M., Bradley, D., Dalton, A., 2017. X-rayirradiation-induced structural changes on single wall carbon nanotubes. Radiat. Phys.Chem.
Bourgoin, J., Massarani, B., 1976. Threshold energy for atomic displacement in diamond.Phys. Rev. B 14 (8), 3690.
Caschera, D., Cossari, P., Federici, F., Kaciulis, S., Mezzi, A., Padeletti, G., Trucchi, D.,2011. Influence of PECVD parameters on the properties of diamond-like carbon films.Thin Solid Films 519 (12), 4087–4091.
Cress, C.D., Schauerman, C.M., Landi, B.J., Messenger, S.R., Raffaelle, R.P., Walters, R.J.,2010. Radiation effects in single-walled carbon nanotube papers. J. Appl. Phys. 107(1), 014316.
Kaciulis, S., 2012. Spectroscopy of carbon: from diamond to nitride films. Surf. InterfaceAnal. 44 (8), 1155–1161.
Koike, J., Parkin, D., Mitchell, T., 1992. Displacement threshold energy for type IIa dia-mond. Appl. Phys. Lett. 60 (12), 1450–1452.
Krasheninnikov, A., Nordlund, K., 2004. Irradiation effects in carbon nanotubes. Nucl.Instrum. Methods Phys. Res. Sect. B: Beam Interact. Mater. At. 216, 355–366.
Marsden, B.J., 1996. Fundamentals of irradiation damage in graphite due to energeticneutrons Graphite moderator lifecycle behaviour, ed. IAEA, INIS Clearinghouse,Vienna, Austria, 24th-27th September 1995, pp. 21.
McEnaney, B., Wickham, A.J., 1996. Effect of Oxidation, Graphite moderator lifecyclebehaviour, ed. IAEA, INIS Clearinghouse, Vienna, Austria, 24th-27th September1995, pp. 12.
Mezzi, A., Kaciulis, S., 2010. Surface investigation of carbon films: from diamond tographite. Surf. Interface Anal. 42 (6‐7), 1082–1084.
NIST, E., 2017. 14 June, National Institute of Standards and Technology. Available:⟨https://physics.nist.gov/PhysRefData/Star/Text/ESTAR.html⟩ [2017, 08/15].
A.H. Alanazi et al. Radiation Physics and Chemistry xxx (xxxx) xxx–xxx
8