thesis spectral gamma ray characterization of
TRANSCRIPT
THESIS
SPECTRAL GAMMA RAY CHARACTERIZATION OF THE ELKO FORMATION,
NEVADA—A CASE STUDY FOR A SMALL LACUSTRINE BASIN
Submitted by
Erin M. McGowan
Department of Geosciences
In partial fulfillment of the requirements
For the Degree of Master of Science
Colorado State University
Fort Collins, Colorado
Summer 2015
Master’s Committee:
Advisor: Sven O. Egenhoff
Derek Schutt
Gamze Cavdar
Robert Amerman

Copyright by Erin M. McGowan 2015
All Rights Reserved
ii
ABSTRACT
SPECTRAL GAMMA RAY CHARACTERIZATION OF THE ELKO FORMATION,
NEVADA—A CASE STUDY FOR A SMALL LACUSTRINE BASIN
Handheld gamma ray spectrometry is a cost-effective and time-efficient means of
furthering understanding of lake facies and small-scale lake systems. Spectral and total gamma ray
data were recorded every foot vertically through a succession in situ at four outcrops along a NNW-
to-SSE transect representing the lower to middle Eocene Elko Formation in northeast Nevada,
USA. The lacustrine Elko Formation consists of, from oldest to youngest, four major units: 1) a
basal conglomerate, 2) an overlying carbonate, 3) a fine-grained organic-rich mudstone with
intercalated carbonate mudstones, and 4) volcaniclastics. These units comprise fourteen
sedimentological facies identifiable in outcrop. In this study, these fourteen facies have been
reduced to eight that are discernable by spectral gamma ray (SGR) signals. Each recorded interval
in the Elko Formation succession was assigned to one of these eight facies. These eight facies
comprise five siliciclastic (plant-bearing mudstone, clay-dominated mudstone, microbial-mat-
bearing mudstone, ash-bearing mudstone, and conglomerate) facies, two carbonate (calcareous
mudstone and fossiliferous mudstone-wackestone) facies, and one volcanic tuff facies.
In conjunction with SGR, outcrop observation, X-ray diffraction (XRD), thin section
observation, and total organic carbon (TOC) analyses allowed a thorough understanding of facies
composition and its SGR signal. The primary controls of SGR components [potassium (K),
uranium (U), and thorium (Th)] reflect K-bearing volcanic minerals (feldspars and micas), U-
enriched organic material, and clay abundance (illite and montmorillonite; potentially derived
iii
from volcanic ash), respectively. High radioactivity, with signals above 120 American Petroleum
Institute (API) units, was demonstrated for five facies (plant-bearing mudstone, clay-dominated
mudstone, microbial-mat-bearing mudstone, ash-bearing mudstone, and volcanic tuff) in contrast
to the remaining three facies (calcareous mudstone, fossiliferous mudstone-packstone, and
conglomerate) exhibiting low radioactivity of less than or equal to 120 API. Distribution of
radioactive minerals across the outcrops was largely found to be not only a function of general
lithologic composition, but also the paleogeographic locations of the outcrops within the lake
basin, due to the differing contributions of organic debris and volcanic constituents. This
distribution of radioactive minerals across each outcrop supports a recent depositional model of
north-to-south diachronous deposition of the Elko Formation (Horner, 2015).
The microbial-mat-bearing mudstone facies was a traceable, deep-lake sediment
throughout the basin by which outcrops could be assigned to more proximal or more distal
positions within the paleo-lake by applying Th/U ratios. The proximal outcrop data show a low
Th/U ratio (below 2.5), as opposed to the distal outcrop data that have a high Th/U ratio (2.5–4).
These data confirm that most likely Th/U ratios reflect the increase in the amount of clay with
distance from the proximal outcrops.
Thin section microscopy and scanning electron microscope (SEM) analyses allowed for
recognition of eight diagenetic cements reflecting a strongly varying diagenetic history in the Elko
Formation sedimentary rocks. One calcite, four stages of dolomite, two types of silica, and one
zeolite cement were identified. The calcite, dolomite, and silica cements were typically formed
sequentially as listed above, whereas the zeolites formed independently. Intraparticle,
interparticle, matrix, shelter, and fracture porosity types are also present, each forming post-
deposition, except for interparticle and matrix porosity within volcaniclastics. Calcite, dolomite,
iv
and silica cements were found succeeding shelter and fracture porosity, whereas the timing of
zeolite cement in matrix porosity was unclear. Overall, cement phases and porosity were found to
be minimal, and therefore, probably had only a minor influence on the overall gamma ray signal
of the Elko Formation sedimentary rocks.
SGR characterization of each of the eight facies across a proximal-to-distal transect of the
Elko continental-lacustrine sedimentary basin reflects the strong influence that climate and
tectonics have on depositional changes in a small-scale lake. Applying gamma ray techniques to
the small-scale lake system of the Elko Formation was found to be a useful tool and provides a
framework to apply to lacustrine studies as a predictive tool in future exploration.
v
ACKNOWLEDGEMENTS
I’m thankful to my advisor, Dr. Sven Egenhoff for the many hours of editing, reviewing,
and feedback on this study, as well as helping to improve my writing.
I’m incredibly grateful to Noble Energy for providing financial support to carry out this
research over the past two years —as well as the feedback and genuine interest in the project:
Thank you Rob Amerman, Morgan Hocker, Donald Burch, Rick Stucker, and Wendell Bond.
From the last field season, thanks to Jon Bowman for arranging a track-hoe for field excavations.
I would also like further thank Donald Burch for the time he spent to helping guide this project
and giving me insightful suggestions.
Many thanks to Heather Lowers at the USGS for her assistance with the SEM and EDS
analyses as well as Joe Taglieri from Atoka Geochemical for his XRD services. Each greatly
enhanced this work and are much appreciated.
I’m also thankful to the Tomera family for allowing us to study the Elko succession on
their property and even to excavate the outcrop. Will Horner, Sven Egenhoff, and Rob Amerman,
thank you for the enthusiasm and help in the field.
I would also like to express my gratitude to my committee members, Dr. Sven Egenhoff,
Dr. Gamze Cavdar, and Dr. Rob Amerman for their comments and suggestions to improve the
quality of my thesis. CSU sedimentology group, thank you for your support and laughs to make
this a great place to work.
Finally, a big thank you to my family and Travis Moss for their love, continuous support,
and patience.
vi
TABLE OF CONTENTS
ABSTRACT .................................................................................................................................... ii
ACKNOWLEDGEMENTS ............................................................................................................ v
1.0 INTRODUCTION .................................................................................................................... 1
2.0 GEOLOGICAL SETTING ....................................................................................................... 5
2.1 Regional Tectonism and Volcanism ..................................................................................... 5
2.2 Paleogeography and Paleontology ........................................................................................ 7
2.3 Basin Extents and Shape ....................................................................................................... 7
2.4 Stratigraphy ........................................................................................................................... 8
3.0 REVIEW OF PREVIOUS LITERATURE ............................................................................. 12
3.1 Elko Formation ................................................................................................................... 12
3.2 Gamma Radiation and Spectral Gamma Ray: Potassium, Thorium, and Uranium ............ 21
3.3 Gamma Ray Spectrometer Measurements .......................................................................... 23
4.0 METHODOLOGY ................................................................................................................. 25
4.1 Study Area .......................................................................................................................... 25
4.2 Gamma Ray Spectrometer Tool.......................................................................................... 26
4.3 Field Methods ..................................................................................................................... 27
4.4 Thin section, Total Organic Carbon, X-Ray Diffraction/Fluorescence .............................. 30
5.0 RESULTS ............................................................................................................................... 32
5.1 Total Gamma Ray Data ...................................................................................................... 32
5.2 Spectral Gamma Ray Measurements .................................................................................. 36
5.2.1 Facies 1/2: Plant-Bearing Mudstone (Fig. 13A) .......................................................... 39
5.2.2 Facies 3: Clay-Dominated Mudstone (Fig. 13B) ......................................................... 39
5.2.3 Facies 4: Calcareous Mudstone (Fig. 13C) .................................................................. 39
5.2.4 Facies 5: Microbial-Mat-Bearing-Mudstone (Fig. 13D) ............................................. 39
5.2.5 Facies 6: Ash-Bearing Mudstone (Fig. 13E) ............................................................... 40
5.2.6 Facies 8/13: Fossiliferous mudstone-packstone (Fig. 13F) ......................................... 40
5.2.7 Facies 10–12: Volcanic Tuff (Fig. 13G) ...................................................................... 40
5.2.8 Facies 14: Conglomerate (Fig. 13H) ............................................................................ 41
5.2.9 Cumulative Data (Fig. 13I) .......................................................................................... 41
vii
5.3 Th/U by Outcrop ................................................................................................................. 46
5.4 X-Ray Diffraction and Total Organic Carbon .................................................................... 47
6.0 INTERPRETATION............................................................................................................... 50
6.1 Gamma Ray Log Signature ................................................................................................. 50
6.2 Spectral Gamma Ray (SGR) Signature ............................................................................... 50
6.2.1 Outcrop Trends ............................................................................................................ 53
6.2.2 Facies 1/2: Plant-Bearing Mudstone ............................................................................ 54
6.2.3 Facies 3: Clay-Dominated Mudstone........................................................................... 55
6.2.4 Facies 4: Calcareous Mudstone ................................................................................... 56
6.2.5 Facies 5: Microbial-Mat-Bearing Mudstone ................................................................ 56
6.2.6 Facies 6: Ash-Bearing Mudstone ................................................................................. 57
6.2.7 Facies 8/13: Fossiliferous mudstone-packstone........................................................... 58
6.2.8 Facies 10-12: Volcanic Tuff ........................................................................................ 59
6.2.9 Facies 14: Conglomerate.............................................................................................. 59
6.3 Th/U Trends and Basin Application ................................................................................... 60
6.4 X-Ray Diffraction and Total Organic Carbon .................................................................... 61
7.0 DIAGENESIS ......................................................................................................................... 63
7.1 Carbonate ............................................................................................................................ 63
7.1.1 Calcite .......................................................................................................................... 63
7.1.2 Dolomite ...................................................................................................................... 63
7.2 Quartz .................................................................................................................................. 64
7.3 Zeolites ................................................................................................................................ 65
7.4 Porosity ............................................................................................................................... 67
7.4.1 Interparticle Porosity .................................................................................................... 67
7.4.2 Intraparticle Porosity .................................................................................................... 67
7.4.3 Shelter Porosity ............................................................................................................ 68
7.4.4 Matrix Porosity ............................................................................................................ 68
7.4.5 Fracture Porosity .......................................................................................................... 68
7.5 Relative Timing .................................................................................................................. 70
7.5.1 Calcite .......................................................................................................................... 70
7.5.2 Dolomite ...................................................................................................................... 70
viii
7.5.3 Quartz ........................................................................................................................... 70
7.5.4 Zeolite .......................................................................................................................... 71
7.5.5 Porosity ........................................................................................................................ 72
8.0 DISCUSSION ......................................................................................................................... 74
8.1 Pitfalls of gamma ray spectrometry .................................................................................... 74
8.2 Comparison of gamma ray readings with similar previous studies .................................... 75
8.3 Diagenetic effect on gamma ray readings ........................................................................... 76
8.4 Application of Th/U ratios to analyze lacustrine basin extents .......................................... 78
8.5 Assigned facies ................................................................................................................... 79
8.6 Interpretation of SGR data .................................................................................................. 80
8.7 Comparison to Noble Energy EOS-3 core SGR data ......................................................... 81
9.0 CONCLUSIONS..................................................................................................................... 84
REFERENCES ............................................................................................................................. 88
APPENDICES .............................................................................................................................. 96
APPENDIX 1: OUTCROP GAMMA RAY DATA ..................................................................... 97
APPENDIX 2: GAMMA RAY DATA SUMMARY STATISTICS ......................................... 122
APPENDIX 3: GAMMA RAY MEASUREMENT ACCURACY EXPERIMENTS ............... 133
APPENDIX 4: TOC ANALYSES .............................................................................................. 137
APPENDIX 5: X-RAY DIFFRACTION ANALYSES .............................................................. 138
APPENDIX 6: FREQUENCY DISTRIBUTION CHARTS ...................................................... 139
APPENDIX 7: SCANNING ELECTRON MICROSCOPE ANALYSES ................................. 147
APPENDIX 8: GAMMA RAY CURVES .................................................................................. 172
APPENDIX 9: CROSS-PLOTS (K, U, & TH VS. TOTAL GAMMA RAY) ........................... 181
1
1.0 INTRODUCTION
With increasing interest in unconventional resources aided by new technologies, it is
becoming apparent how little is known about lacustrine facies aside from the Green River
Formation of Colorado, Utah, and Wyoming (Burton et al., 2014; Carroll and Bohacs, 2001;
Fischer and Roberts, 1991; Surdam and Stanley, 1979 and others). Emphasis thus far has been
focused on black shale marine systems, but organic-rich lake basins are gaining popularity as
exploration targets not only in China, Indonesia, and Brazil (Carroll and Bohacs, 2001; Hanson et
al., 2001; Katz and Lin, 2014). As the attractiveness of these unconventional reservoirs intensifies,
the necessity of characterizing lacustrine black shale facies, understanding their depositional
environments, and predicting their varying gamma ray signatures for non-cored wells becomes
equally important.
For the past several decades, initial exploration in potential hydrocarbon reservoirs
consisted of measuring natural gamma radiation to differentiate between shale and non-shale
intervals, while the spectral gamma ray (SGR) technique was used to subdivide the homogenous
marine black shale intervals by fine-scale changes in potassium (K), uranium (U), and thorium
(Th) distribution that reflected minute mineralogic differences (Fertl and Chilingarian, 1990; Blum
et al., 1997; IAEA, 2003). Gamma ray curves have been a valuable tool used to correlate exposures
in outcrop to the subsurface (Aigner et al., 1995). Handheld gamma ray spectrometry has been
conducted in several outcrop studies with varying objectives such as sequence stratigraphic
analysis and reservoir characterization in seemingly homogeneous lithologies (i.e. black shales)
(Aigner et al., 1995), optimizing stratigraphic mapping and correlating stratigraphic sections
within a basin (Chamberlain, 1984; Slatt et al., 1992), and applying integrated geochemical
2
analyses and mineralogy to better understand the gamma ray log signature and related facies
(Wignall and Myers, 1988; Krystyniak, 2003; Aufill, 2007; Guagliardi et al., 2013).
Thorium-to-uranium (Th/U) ratios within marine basins have proved exceptionally useful
in determining sediment provenance, sequence stratigraphic surfaces, facies descriptions, and
basin analysis, but remain uninvestigated in lacustrine settings (Adams and Weaver, 1958; Bohacs,
1998; Ehrenberg and Svånå, 2001). With the lack of SGR research in lacustrine systems,
examining the log character for non-marine systems in greater detail provides the necessary step
to furthering knowledge of less explored unconventional hydrocarbon reservoirs containing vast
reserves such as those found in East Asia and South America (Katz and Lin, 2014).
This study aims at providing a detailed description of the mineralogical composition and
its influence on the log signature using the Elko Formation of northeastern Nevada, USA, as an
example for a small lacustrine basin. This investigation is also intended to guide future studies,
especially for relatively small lacustrine systems and the heterogenetic distribution of facies. The
objectives of this research are: 1) assess the utility of SGR as a predictive exploration tool for a
small lacustrine basin 2) quantifying a range for cumulative API units, and as K, Th, and U spectra
for the eight main facies described for the upper Elko Formation, 3) assess the contribution of
diagenetic phases, and its overall effect on the gamma ray signal, 4) analyzing proximal versus
distal microbial-mat-bearing mudstone facies of the lake basin by quantifying the amount of
terrigenous material and sediment influx through Th/U ratios, and 5) evaluate the previous
depositional model by Horner (2015) constructed for the Elko Formation. In order to conduct this
research, a portable, handheld gamma ray spectrometer was used to directly measure gamma
radiation in situ at all four available outcrops: Coal Mine Canyon, Elko Hills A, Elko Hills B, and
Tomera Ranch (Fig. 1). These outcrops represent the upper Elko Formation in northeastern,

3
Nevada from NNW to SSE, respectively, and provide a proximal-to-distal transect necessary to
improve understanding of the distribution of facies within small-lake systems.
4
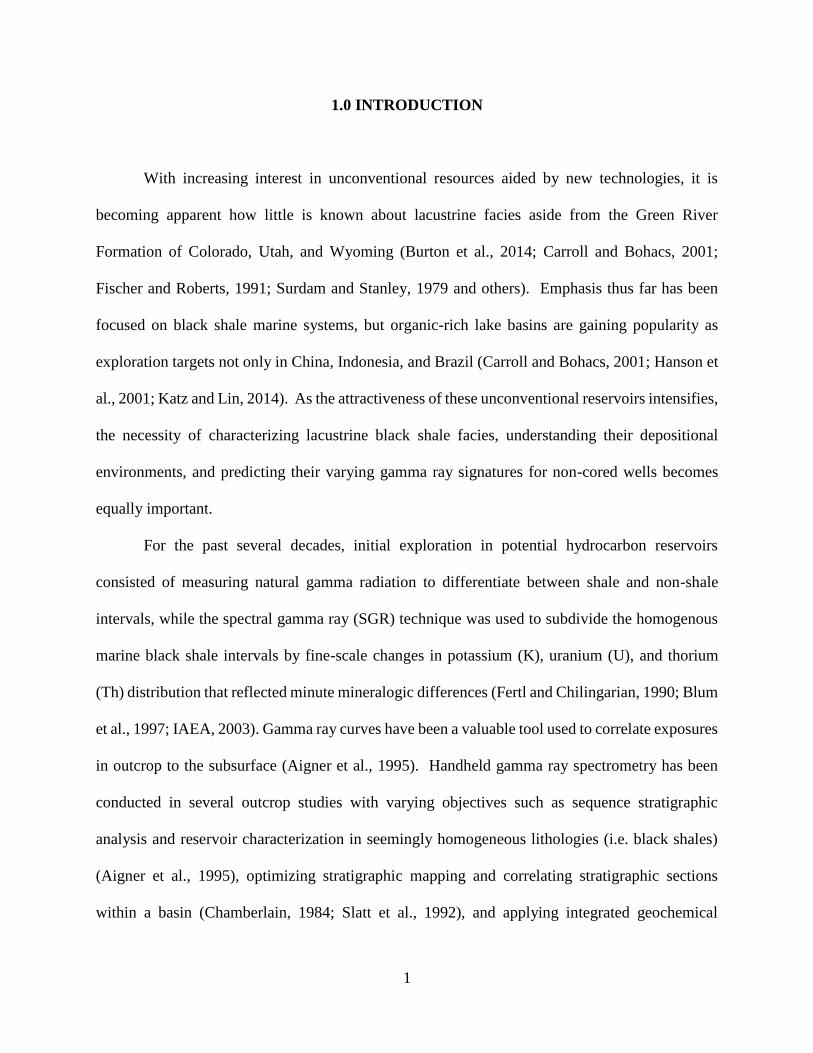
Figure 1: Figure A: Highlights the state of Nevada in black and gray within the western U.S.; Figure B: Inset
map illustrates the state of Nevada with Elko County highlighted in red, stars show outcrops selected, and
black circles represent major cities for reference, satellite imagery modified from Google Earth (2015); Figure
C: Simplified geologic map modified from Henry (2008) of Northeastern NV, Elko County highlighted in red
as well as each outcrop labeled and indicated with stars. Eocene-age strata includes the Indian Well Formation,
Elko Formation, and Humboldt Formation.
5
2.0 GEOLOGICAL SETTING
2.1 Regional Tectonism and Volcanism
In the late Paleozoic and early Mesozoic, northeastern Nevada experienced compressional
tectonic movements as a result of oceanic plate subduction under the North American craton
during a ~100 Ma time-span, creating the Antler orogen prominent in present-day Idaho,
California, and Nevada (DeCelles, 2004; Henry, 2008). In northeastern Nevada, the Antler
Orogeny formed the Roberts Mountains thrust where deep-water siliciclastics were pushed over
shelf and slope rocks west of the present-day location of the thrust (Johnson and Pendergast, 1981).
In the late Cretaceous, northeastern Nevada underwent compression from the Sevier Orogeny until
~66 Ma (DeCelles, 2004) resulting in crustal thickening (50–60 km thick) by the early Cenozoic
(Coney and Harms, 1984).
By the mid to late Cenozoic, tectonism was predominately extensional in northeastern
Nevada and these tectonic movements affected the hinterland of the Sevier orogenic belt, which
stretched from present-day Canada to Mexico (Coney and Harms, 1984; DeCelles, 2004). The
low-relief hinterland region was believed to be an eroding highland composed of largely
metamorphic rocks (Fouch et al., 1979). There is some evidence of lacustrine deposition in the
area as early as the Aptian during the Late Cretaceous (Vandervoort and Schmitt, 1990).
Extension occurred during the exhumation of the RMEH metamorphic core complex
beginning at ~55 Ma, resulting in Eocene-age sedimentary basins, including the lacustrine Elko
Basin (Satarugsa and Johnson, 2000; Henry, 2008). Isostatic uplift formed and rotated a new
system of normal and listric faults within the hanging wall, subsequently forming the Elko Basin
as an intermontane asymmetric depression in the system of half grabens of the Ruby Mountains
6
detachment fault (Solomon et al., 1979; McGrew and Snee, 1994; Haynes, 2003; Henry, 2008).
The lacustrine Elko Basin began to subside and diachronous clastic sedimentation of the Elko
Formation progressively filled this paleo-lake from north to south as subsidence increased.
Magmatism initiated in the present-day state of Washington and successively moved southward to
the Challis volcanic field in Idaho beginning at 45 Ma (Christiansen and Yeats, 1992) followed by
production of rhyolitic ash-flow tuffs from the Tuscarora field near Elko, initiating at 39 Ma
(Henry and John, 2013). In northeast Nevada, compression and coeval magmatism is assumed to
have increased elevations by ~2 km in the middle Eocene-early Oligocene, then decreasing by the
middle Miocene, although both their timing and the resulting elevations are debated (Horton et al.,
2004).
With nearby volcanism continuing in the Tuscarora field, clastic deposition declined in the
Elko Basin and normal faulting tilted the basin by less than 15 degrees into east and separated the
basin into southeast-dipping fault blocks (Henry and Faulds, 1999; Haynes, 2003). Evidence of
volcanic activity is recognized throughout the late stages of the Elko Basin and overlying strata by
air-fall tuff and ash, specifically plagioclase from andesite dated by 40Ar/39Ar methods at 38.1 +
2.5 Ma, and dacite lava from local domal sources (Haynes, 2003; Henrici and Haynes, 2006).
However, a hiatus from volcanism lasted from the late Eocene (35 Ma) until the middle Miocene
(~16.5 Ma; Coats, 1964). During the early Miocene, disruption and extension of the Elko Basin
resulted in widespread normal faulting as exhibited by the horst-and-graben systems of the Basin
and Range region today (Solomon, 1981). As a result of continued extension during the middle to
late Miocene, the upper crust was stretched by ~10%.
7
2.2 Paleogeography and Paleontology
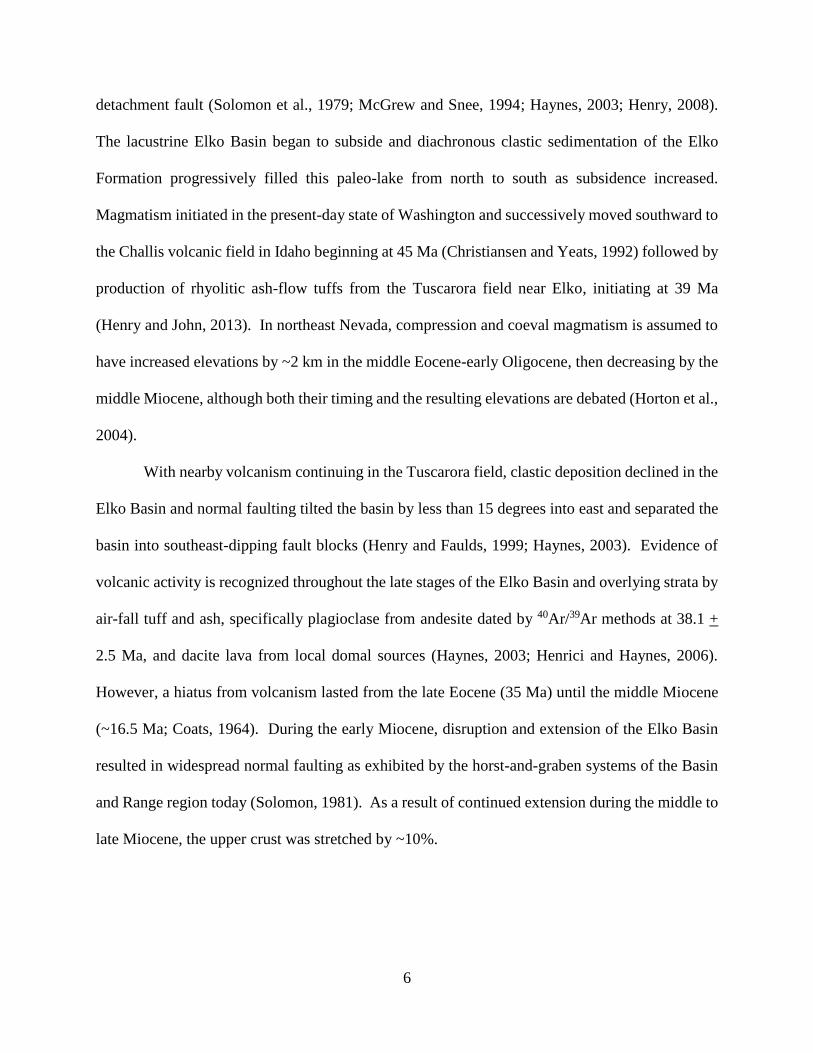
Paleogeographic reconstructions and paleontologic data characterize the Eocene climate as
temperate with seasonal cold periods, and basin development at elevations akin to the present
(Axelrod and Bailey, 1969; Wingate, 1983; Haynes, 2003; Henrici and Haynes, 2006) (Fig. 2).
Botryoococcus algal matter discovered in the Coal Mine Canyon section throughout the microbial-
mat-bearing mudstones suggesting fresh to slightly saline lacustrine conditions (Wingate, 1983).
Abundant plant fossils (conifers, alders, elms) provide evidence of the swampy vegetation and
forests that likely outlined the lake basin with particularly high fossil abundance in the Coal Mine
Canyon and Elko Hills outcrops (Wingate, 1983; Haynes, 2003).
Figure 2: Paleogeographic reconstruction of Western North America during the Eocene Epoch 50 Ma (48-52 Ma).
(Modified from R. Blakey’s website: http://cpgeosystems.com/images/SWNA_50Ma-sm.jpg (2014). The
approximate position of the Elko Basin in present-day northeastern NV is indicated by a red box.
2.3 Basin Extents and Shape
Although outcrops of the Elko Formation have been found in an area encompassing at least
28,000 km2, there is an unresolved debate regarding the possibilities that the Elko Formation was
deposited in multiple, smaller, discontinuous lake basins (Smith et al., 1976; Solomon, 1992;
Christiansen and Yeats, 1992; Wallace et al., 2008), one large lake basin with similar lake facies
throughout (Smith et al., 1976; Solomon, 1992, Henry, 2008; Horner, 2015), or one large basin
8
separated by paleotopographic highs that created sub-basins each containing differing lake facies
(Haynes, 2003; Henrici and Haynes, 2006). With the precise boundary of the basin undetermined,
the shape of the Elko Basin is also debated.
Geographic landforms and exposures of lacustrine shale were used to estimate rough
constraints on the extent of the basin. Smith et al. (1976) and Solomon and Moore (1982a and b)
believe that the lake was bounded by the Ruby Mountains to the east, and by the Adobe Range to
the west. However, Henry and Faulds (1999) and Haynes (2003) suggest that the western boundary
is farther to the west within the Tuscarora Mountains, where age-equivalent strata was found, but
not confirmed, as part of the Elko Formation. Elko Formation outcrops scattered throughout the
region suggest an east–west extent of ~100 km, and a north–south extent of~190 km (Solomon,
1992; Haynes, 2003; Henrici and Haynes, 2006) (Fig. 3). The original lake was likely narrower
than the present distribution of the outcrops, but have been stretched due to the impact of Miocene
Basin and Range extension (Solomon, 1981).
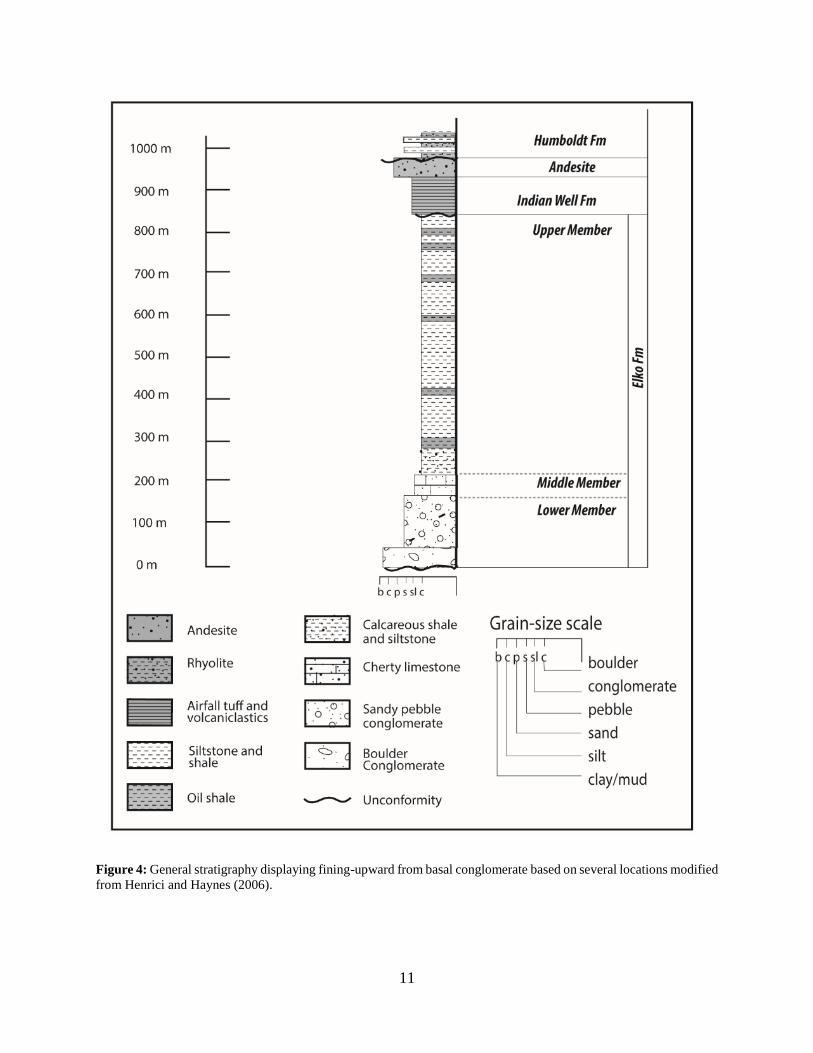
2.4 Stratigraphy
Following Smith et al. (1976) and Solomon et al. (1979), the Elko Formation consists of
conglomerate, sandstone, limestone, black shale, mudstone, siltstone, and volcanic tuff (Fig. 4).
Intervals of cherty limestone and conglomerate underlie these rocks (Smith et al., 1976). Coats
(1987) named these the “Tertiary cherty limestone” located exclusively in the Pinon Range and
Elko Hills, and the “Tertiary conglomerate” present across the entire basin. Smith et al. (1976),
Solomon and Moore (1982a and b), and Moore et al. (1983) do not define either the “Tertiary
cherty limestone” or the “Tertiary conglomerate” as part of the Elko Formation, whereas Jaeger
(1987), Solomon et al. (1979), Ketner and Alpha (1992), and Haynes (2003) do include these units
as the basal part of the Elko Formation.
9
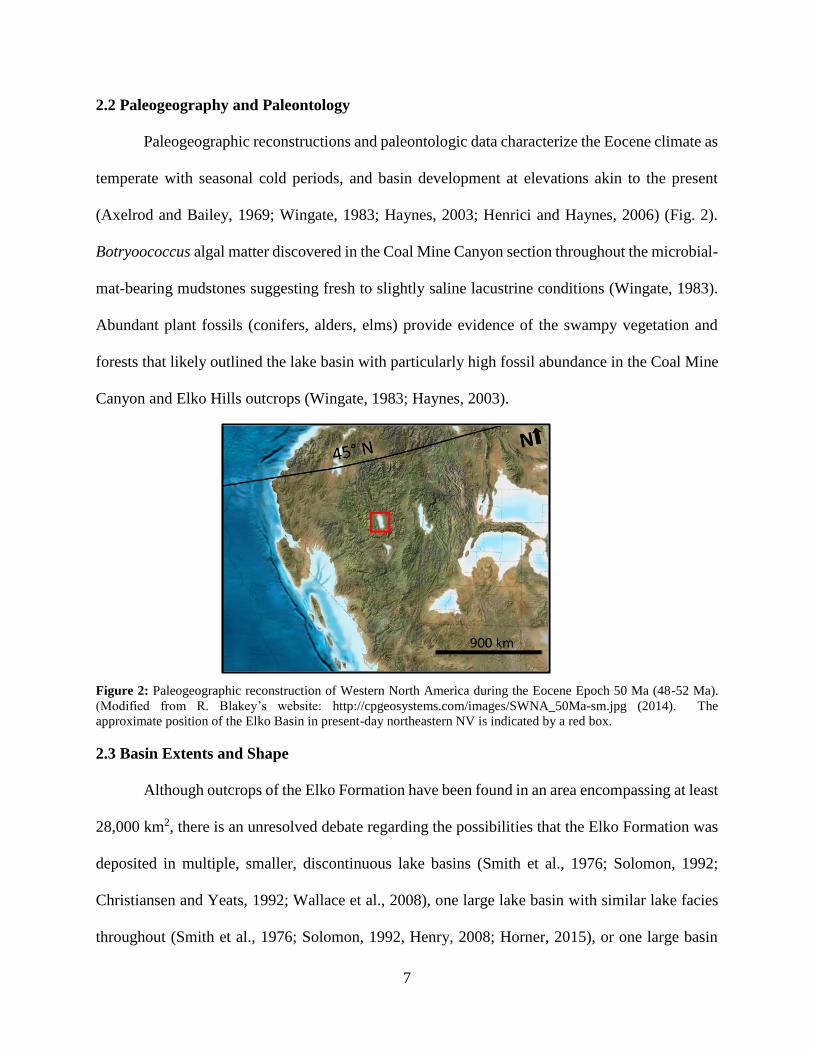
According to Haynes (2003), basal sandy pebble conglomerates overlying Paleozoic rock
comprise the lower member of the Elko Formation and are interpreted as alluvial fan and braided
stream deposits due to their range in clast size and lack of mud. Overlying the sandy pebble
conglomerate, the succession fines upwards into the middle and upper members composed of
cherty limestone and fine-grained, deep-lake sediment, respectively, assumed to reflect the lake
level deepening from initial basin extension and subsidence between the Adobe Range and East
Humboldt Range (Haynes, 2003). With regional subsidence outpacing sedimentation, the
initiation of an open-lacustrine system is reflected by the subsequent succession of black shale and
siltstone deposition overlying the limestone and interbedded shale (Haynes, 2003).
10
Figure 3 (previous page): Map modified from Henrici and Haynes (2006) showing known outcrops of the Elko
Formation, age-equivalent rocks, and opposing views of the Elko Basin extents. Henry and Faulds (1999) and Haynes
(2003) believe the Elko Basin encompasses the area highlighted in orange, contradicting Smith et al. (1976) and
Solomon and Moore (1982a and b) that claim the Elko Basin is the region highlighted in blue. The area of overlap is
highlighted in gray-green and represents the basin extents agreed upon by both Henry and Faulds (1999), Haynes
(2003), Smith et al. (1976), and Solomon and Moore (1982a and 1982b).
The fine-grained lacustrine sediment became less predominant with an increase in
volcanism from the Challis field in southern Idaho at 45 Ma (Henry, 2008) and with additional
volcaniclastic input thought to originate from the Tuscarora Volcanic Field located northwest of
Elko. Continued volcanism associated with the intrusion of local rhyolite domes beginning at 38.6
+ 0.1 Ma, based on U-Pb Zircon dates (Haynes, 2003; Henry and John, 2013) and contributed to
the final phase of the filling of the lake basin, with clastic deposition of the Elko Formation
declining around 38.9 + 0.3 Ma, indicated by U-Pb Zircon dates from an andesite (Haynes, 2003;
Coats, 1987). The volcaniclastic Indian Well Formation dated at 37.6 + 1.3 Ma, based on 40Ar/39Ar
dating of biotite, to 33.2 + 0.7 Ma determined by sanidine dating (Smith and Ketner, 1976), directly
overlies the Elko Formation, separated by a low-angle unconformity (Solomon et al., 1979;
Haynes, 2003). Dark brown to black blocky andesite followed the deposition of the Indian Well
Formation composed of plagioclase, orthopyroxene, and clinopyroxene phenocrysts within a glass
matrix, interpreted to be a brecciated flow deposit (Haynes, 2003). Unconformably overlying the
andesite interval, is the Humboldt Formation consisting of fine-grained lacustrine sediment
including silt, shale, claystone, and volcanic tuff, found deposited only in present-day valleys
formed by Basin and Range extension during the Miocene (Haynes, 2003). Most recently,
Quaternary-age sediment has been deposited overlying the Humboldt Formation and is
predominantly fine- to coarse-grained siliciclastics interpreted as alluvium and fluvial deposits.
11
Figure 4: General stratigraphy displaying fining-upward from basal conglomerate based on several locations modified
from Henrici and Haynes (2006).
12
3.0 REVIEW OF PREVIOUS LITERATURE
3.1 Elko Formation
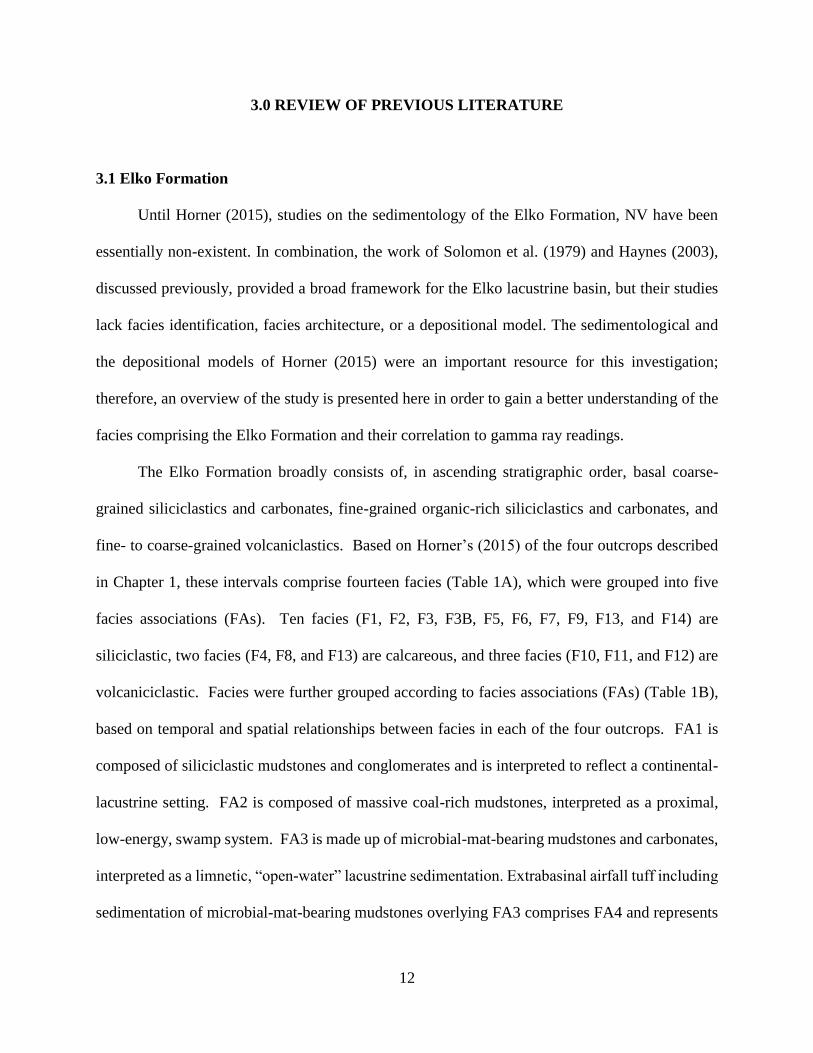
Until Horner (2015), studies on the sedimentology of the Elko Formation, NV have been
essentially non-existent. In combination, the work of Solomon et al. (1979) and Haynes (2003),
discussed previously, provided a broad framework for the Elko lacustrine basin, but their studies
lack facies identification, facies architecture, or a depositional model. The sedimentological and
the depositional models of Horner (2015) were an important resource for this investigation;
therefore, an overview of the study is presented here in order to gain a better understanding of the
facies comprising the Elko Formation and their correlation to gamma ray readings.
The Elko Formation broadly consists of, in ascending stratigraphic order, basal coarse-
grained siliciclastics and carbonates, fine-grained organic-rich siliciclastics and carbonates, and
fine- to coarse-grained volcaniclastics. Based on Horner’s (2015) of the four outcrops described
in Chapter 1, these intervals comprise fourteen facies (Table 1A), which were grouped into five
facies associations (FAs). Ten facies (F1, F2, F3, F3B, F5, F6, F7, F9, F13, and F14) are
siliciclastic, two facies (F4, F8, and F13) are calcareous, and three facies (F10, F11, and F12) are
volcaniciclastic. Facies were further grouped according to facies associations (FAs) (Table 1B),
based on temporal and spatial relationships between facies in each of the four outcrops. FA1 is
composed of siliciclastic mudstones and conglomerates and is interpreted to reflect a continental-
lacustrine setting. FA2 is composed of massive coal-rich mudstones, interpreted as a proximal,
low-energy, swamp system. FA3 is made up of microbial-mat-bearing mudstones and carbonates,
interpreted as a limnetic, “open-water” lacustrine sedimentation. Extrabasinal airfall tuff including
sedimentation of microbial-mat-bearing mudstones overlying FA3 comprises FA4 and represents

13
the initiation of airborne sedimentation in the limnetic portion of the lake. FA5 consists of
carbonates and volcaniclastics. FA5 represents an increase in volcanism outpacing lake
subsidence, terminating lacustrine sedimentation by removing any available accommodation
space, essentially filling the lake.
14
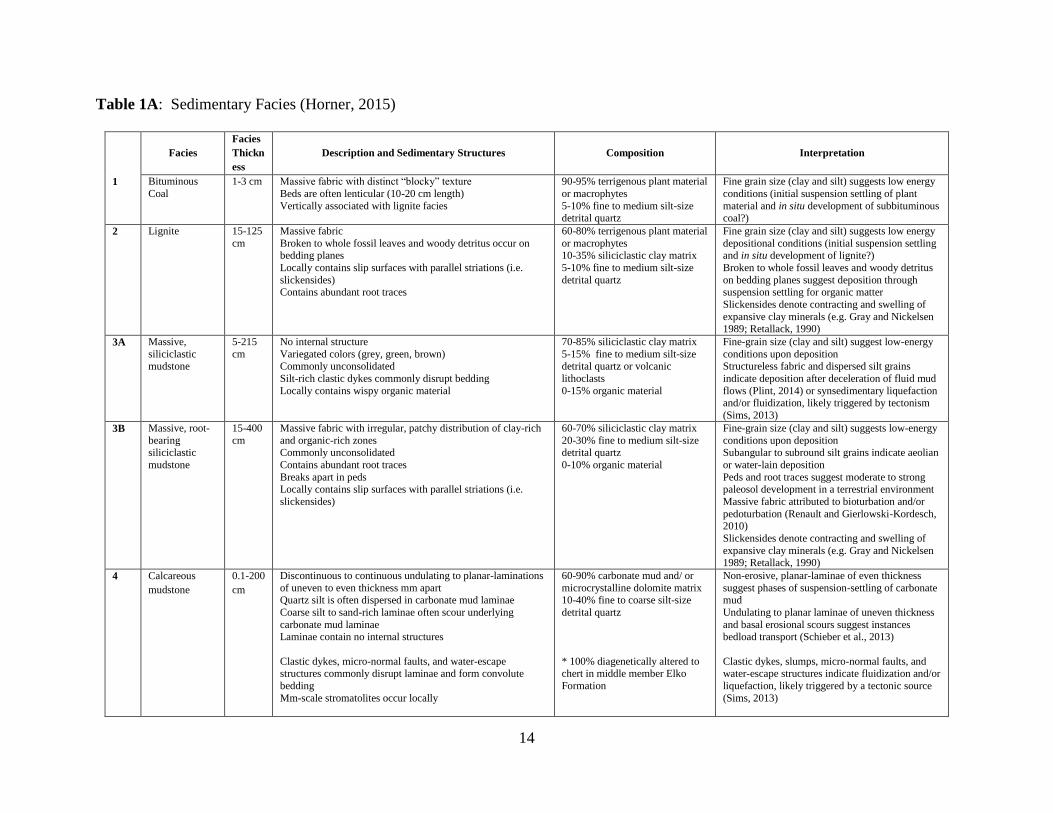
Table 1A: Sedimentary Facies (Horner, 2015)
Facies
Facies
Thickn
ess
Description and Sedimentary Structures
Composition
Interpretation
1 Bituminous
Coal
1-3 cm Massive fabric with distinct “blocky” texture
Beds are often lenticular (10-20 cm length)
Vertically associated with lignite facies
90-95% terrigenous plant material
or macrophytes
5-10% fine to medium silt-size
detrital quartz
Fine grain size (clay and silt) suggests low energy
conditions (initial suspension settling of plant
material and in situ development of subbituminous
coal?)
2 Lignite 15-125
cm
Massive fabric
Broken to whole fossil leaves and woody detritus occur on bedding planes
Locally contains slip surfaces with parallel striations (i.e.
slickensides) Contains abundant root traces
60-80% terrigenous plant material
or macrophytes 10-35% siliciclastic clay matrix
5-10% fine to medium silt-size
detrital quartz
Fine grain size (clay and silt) suggests low energy
depositional conditions (initial suspension settling and in situ development of lignite?)
Broken to whole fossil leaves and woody detritus
on bedding planes suggest deposition through suspension settling for organic matter
Slickensides denote contracting and swelling of
expansive clay minerals (e.g. Gray and Nickelsen 1989; Retallack, 1990)
3A Massive,
siliciclastic
mudstone
5-215
cm
No internal structure
Variegated colors (grey, green, brown)
Commonly unconsolidated
Silt-rich clastic dykes commonly disrupt bedding
Locally contains wispy organic material
70-85% siliciclastic clay matrix
5-15% fine to medium silt-size
detrital quartz or volcanic
lithoclasts
0-15% organic material
Fine-grain size (clay and silt) suggest low-energy
conditions upon deposition
Structureless fabric and dispersed silt grains
indicate deposition after deceleration of fluid mud
flows (Plint, 2014) or synsedimentary liquefaction and/or fluidization, likely triggered by tectonism
(Sims, 2013)
3B Massive, root-
bearing siliciclastic
mudstone
15-400
cm
Massive fabric with irregular, patchy distribution of clay-rich
and organic-rich zones Commonly unconsolidated
Contains abundant root traces
Breaks apart in peds Locally contains slip surfaces with parallel striations (i.e.
slickensides)
60-70% siliciclastic clay matrix
20-30% fine to medium silt-size detrital quartz
0-10% organic material
Fine-grain size (clay and silt) suggests low-energy
conditions upon deposition Subangular to subround silt grains indicate aeolian
or water-lain deposition
Peds and root traces suggest moderate to strong paleosol development in a terrestrial environment
Massive fabric attributed to bioturbation and/or
pedoturbation (Renault and Gierlowski-Kordesch, 2010)
Slickensides denote contracting and swelling of
expansive clay minerals (e.g. Gray and Nickelsen 1989; Retallack, 1990)
4 Calcareous
mudstone
0.1-200
cm
Discontinuous to continuous undulating to planar-laminations
of uneven to even thickness mm apart Quartz silt is often dispersed in carbonate mud laminae
Coarse silt to sand-rich laminae often scour underlying
carbonate mud laminae Laminae contain no internal structures
Clastic dykes, micro-normal faults, and water-escape structures commonly disrupt laminae and form convolute
bedding
Mm-scale stromatolites occur locally
60-90% carbonate mud and/ or
microcrystalline dolomite matrix 10-40% fine to coarse silt-size
detrital quartz
* 100% diagenetically altered to chert in middle member Elko
Formation
Non-erosive, planar-laminae of even thickness
suggest phases of suspension-settling of carbonate mud
Undulating to planar laminae of uneven thickness
and basal erosional scours suggest instances bedload transport (Schieber et al., 2013)
Clastic dykes, slumps, micro-normal faults, and water-escape structures indicate fluidization and/or
liquefaction, likely triggered by a tectonic source
(Sims, 2013)
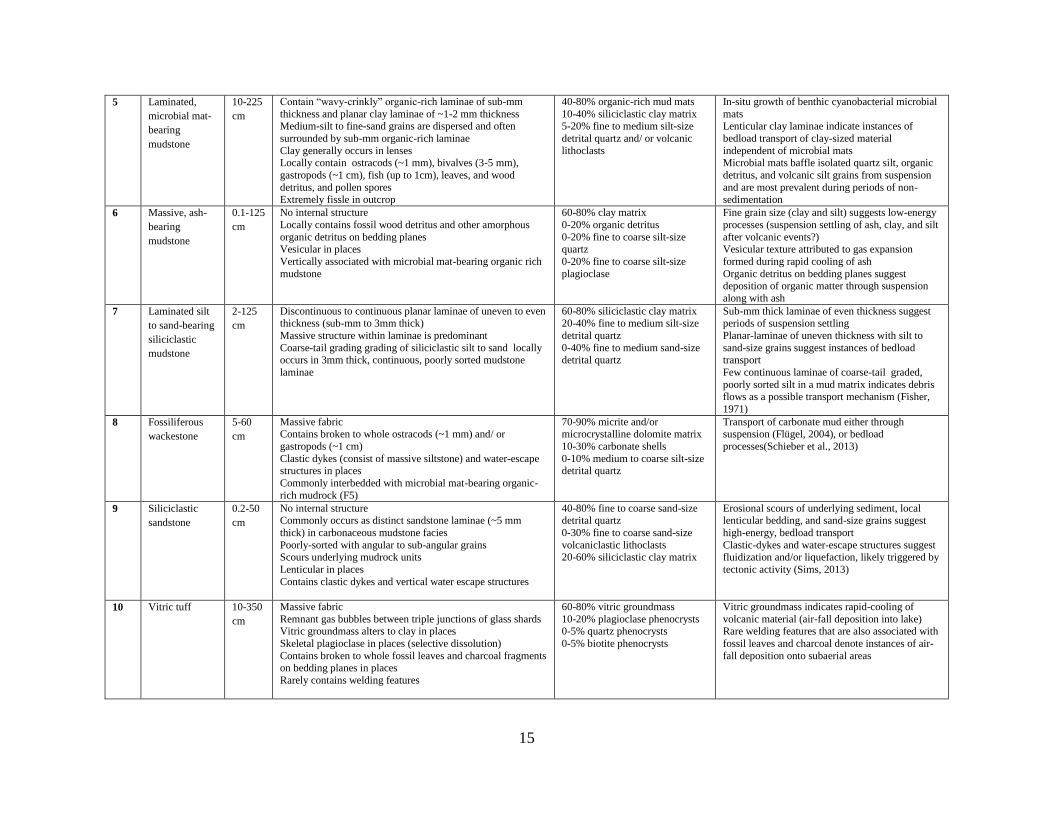
15
5 Laminated,
microbial mat-
bearing
mudstone
10-225
cm
Contain “wavy-crinkly” organic-rich laminae of sub-mm
thickness and planar clay laminae of ~1-2 mm thickness Medium-silt to fine-sand grains are dispersed and often
surrounded by sub-mm organic-rich laminae
Clay generally occurs in lenses Locally contain ostracods (~1 mm), bivalves (3-5 mm),
gastropods (~1 cm), fish (up to 1cm), leaves, and wood
detritus, and pollen spores Extremely fissle in outcrop
40-80% organic-rich mud mats
10-40% siliciclastic clay matrix 5-20% fine to medium silt-size
detrital quartz and/ or volcanic
lithoclasts
In-situ growth of benthic cyanobacterial microbial
mats Lenticular clay laminae indicate instances of
bedload transport of clay-sized material
independent of microbial mats Microbial mats baffle isolated quartz silt, organic
detritus, and volcanic silt grains from suspension
and are most prevalent during periods of non-sedimentation
6 Massive, ash-
bearing
mudstone
0.1-125
cm
No internal structure
Locally contains fossil wood detritus and other amorphous
organic detritus on bedding planes Vesicular in places
Vertically associated with microbial mat-bearing organic rich
mudstone
60-80% clay matrix
0-20% organic detritus
0-20% fine to coarse silt-size quartz
0-20% fine to coarse silt-size
plagioclase
Fine grain size (clay and silt) suggests low-energy
processes (suspension settling of ash, clay, and silt
after volcanic events?) Vesicular texture attributed to gas expansion
formed during rapid cooling of ash
Organic detritus on bedding planes suggest deposition of organic matter through suspension
along with ash
7 Laminated silt
to sand-bearing
siliciclastic
mudstone
2-125
cm
Discontinuous to continuous planar laminae of uneven to even thickness (sub-mm to 3mm thick)
Massive structure within laminae is predominant
Coarse-tail grading grading of siliciclastic silt to sand locally
occurs in 3mm thick, continuous, poorly sorted mudstone
laminae
60-80% siliciclastic clay matrix 20-40% fine to medium silt-size
detrital quartz
0-40% fine to medium sand-size
detrital quartz
Sub-mm thick laminae of even thickness suggest periods of suspension settling
Planar-laminae of uneven thickness with silt to
sand-size grains suggest instances of bedload
transport
Few continuous laminae of coarse-tail graded,
poorly sorted silt in a mud matrix indicates debris flows as a possible transport mechanism (Fisher,
1971)
8 Fossiliferous
wackestone
5-60
cm
Massive fabric Contains broken to whole ostracods (~1 mm) and/ or
gastropods (~1 cm)
Clastic dykes (consist of massive siltstone) and water-escape structures in places
Commonly interbedded with microbial mat-bearing organic-
rich mudrock (F5)
70-90% micrite and/or microcrystalline dolomite matrix
10-30% carbonate shells
0-10% medium to coarse silt-size detrital quartz
Transport of carbonate mud either through suspension (Flügel, 2004), or bedload
processes(Schieber et al., 2013)
9 Siliciclastic
sandstone
0.2-50
cm
No internal structure Commonly occurs as distinct sandstone laminae (~5 mm
thick) in carbonaceous mudstone facies
Poorly-sorted with angular to sub-angular grains Scours underlying mudrock units
Lenticular in places
Contains clastic dykes and vertical water escape structures
40-80% fine to coarse sand-size detrital quartz
0-30% fine to coarse sand-size
volcaniclastic lithoclasts 20-60% siliciclastic clay matrix
Erosional scours of underlying sediment, local lenticular bedding, and sand-size grains suggest
high-energy, bedload transport
Clastic-dykes and water-escape structures suggest fluidization and/or liquefaction, likely triggered by
tectonic activity (Sims, 2013)
10 Vitric tuff 10-350
cm
Massive fabric
Remnant gas bubbles between triple junctions of glass shards Vitric groundmass alters to clay in places
Skeletal plagioclase in places (selective dissolution)
Contains broken to whole fossil leaves and charcoal fragments on bedding planes in places
Rarely contains welding features
60-80% vitric groundmass
10-20% plagioclase phenocrysts 0-5% quartz phenocrysts
0-5% biotite phenocrysts
Vitric groundmass indicates rapid-cooling of
volcanic material (air-fall deposition into lake) Rare welding features that are also associated with
fossil leaves and charcoal denote instances of air-
fall deposition onto subaerial areas

16
11 Crystal tuff 1-225
cm
No internal structure
Vitric groundmass often partly altered to clay Skeletal plagioclase in places (selective dissolution)
Rarely contains siliceous spherulite crystals (~1mm)
30-50% vitric to bentonite
groundmass 30-40% plagioclase phenocrysts
15-25% quartz phenocrysts
0-5% biotite phenocrysts 0-5% sand-size lithoclasts
Initial air-fall transport and rapid deposition from
suspension as indicated by massive fabric Spherulites likely formed from devitrification of
volcanic glass (Lofgren, 1971)
12 Lithic tuff 25-300
cm
Massive fabric
Groundmass almost entirely altered to clay Skeletal plagioclase in places (selective dissolution)
Locally contains gravel-size lithoclasts
50-80% bentonite matrix
20-40% lithoclasts 0-10% plagioclase phenocrysts
0-5% biotite phenocrysts
0-5% charcoal and organic detritus
Initial air-fall transport and rapid deposition from
suspension as indicated by massive fabric Charcoal fragments and local gravel-size
lithoclasts indicate instances of reworking of
sediments
13 Clast-bearing
packstone
10-50
cm
Massive fabric
Contains clasts of massive to well-laminated carbonate
mudstone in places (1-2 cm) Contains shell-debris and lithoclasts in places
Commonly heavily dolomitized
20-50% carbonate mud and/ or
microcrystalline dolomite matrix
0-40% indistinguishable, round, dolomitized grains with dark rims
0-10% bioclasts (broken
ostacods) 0-10% silt to sand-size detrital
quartz
Overall coarse grain size suggests high-energy
conditions
Massive to well-laminated carbonate mudrock clasts represent rip-up clasts
Poorly sorted bioclasts and rip-up clasts suspended
in matrix suggest high-energy, erosive currents, likely storm or tectonically driven, as possible
modes of transport
Lack of internal structure indicates rapid deposition and/or liquefaction
14 Siliciclastic
conglomerate
50-90
cm
Poorly-sorted angular to sub-rounded grains
Unconsolidated in outcrop No internal structure
No matrix or cement
40-60% pebble-size lithoclasts
20-40% sand-size detrital quartz 10-30% sand to pebble-size chert
*Clasts are boulder-sized in lower
Elko Member
Sand to pebble-size grains suggests high energy,
bedload transport
17
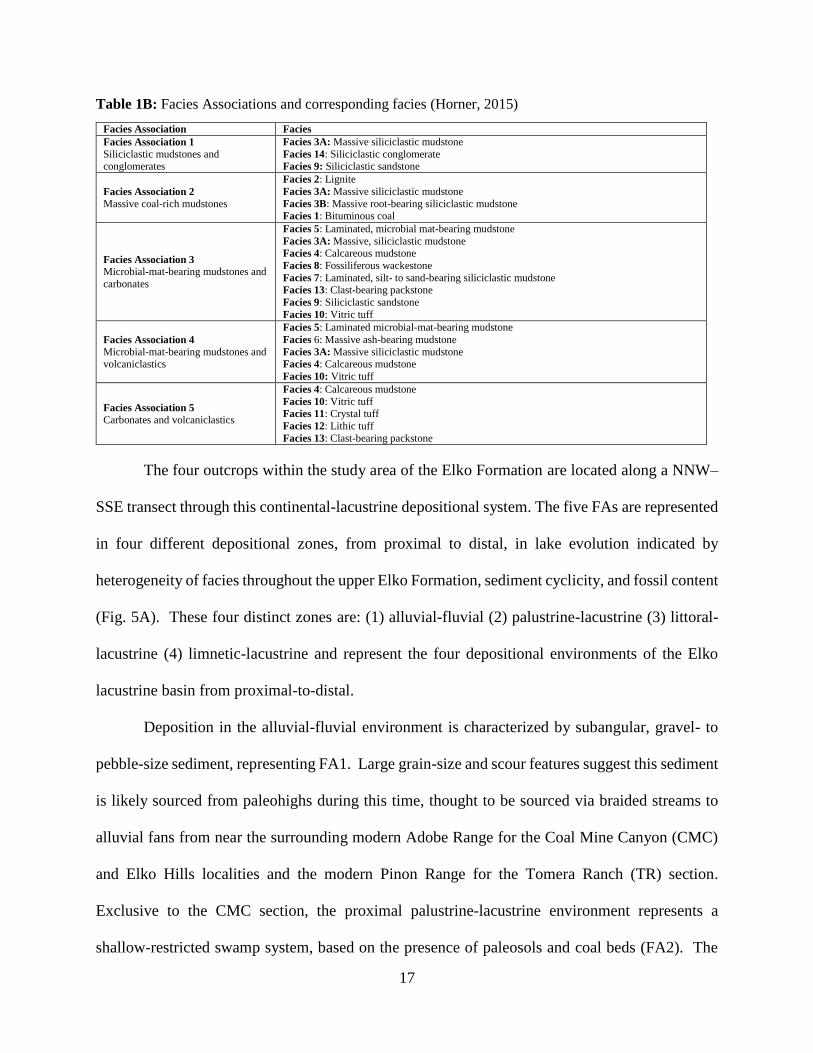
Table 1B: Facies Associations and corresponding facies (Horner, 2015)
The four outcrops within the study area of the Elko Formation are located along a NNW–
SSE transect through this continental-lacustrine depositional system. The five FAs are represented
in four different depositional zones, from proximal to distal, in lake evolution indicated by
heterogeneity of facies throughout the upper Elko Formation, sediment cyclicity, and fossil content
(Fig. 5A). These four distinct zones are: (1) alluvial-fluvial (2) palustrine-lacustrine (3) littoral-
lacustrine (4) limnetic-lacustrine and represent the four depositional environments of the Elko
lacustrine basin from proximal-to-distal.
Deposition in the alluvial-fluvial environment is characterized by subangular, gravel- to
pebble-size sediment, representing FA1. Large grain-size and scour features suggest this sediment
is likely sourced from paleohighs during this time, thought to be sourced via braided streams to
alluvial fans from near the surrounding modern Adobe Range for the Coal Mine Canyon (CMC)
and Elko Hills localities and the modern Pinon Range for the Tomera Ranch (TR) section.
Exclusive to the CMC section, the proximal palustrine-lacustrine environment represents a
shallow-restricted swamp system, based on the presence of paleosols and coal beds (FA2). The
Facies Association Facies
Facies Association 1
Siliciclastic mudstones and conglomerates
Facies 3A: Massive siliciclastic mudstone
Facies 14: Siliciclastic conglomerate Facies 9: Siliciclastic sandstone
Facies Association 2
Massive coal-rich mudstones
Facies 2: Lignite
Facies 3A: Massive siliciclastic mudstone
Facies 3B: Massive root-bearing siliciclastic mudstone Facies 1: Bituminous coal
Facies Association 3
Microbial-mat-bearing mudstones and
carbonates
Facies 5: Laminated, microbial mat-bearing mudstone
Facies 3A: Massive, siliciclastic mudstone Facies 4: Calcareous mudstone
Facies 8: Fossiliferous wackestone
Facies 7: Laminated, silt- to sand-bearing siliciclastic mudstone Facies 13: Clast-bearing packstone
Facies 9: Siliciclastic sandstone
Facies 10: Vitric tuff
Facies Association 4
Microbial-mat-bearing mudstones and volcaniclastics
Facies 5: Laminated microbial-mat-bearing mudstone
Facies 6: Massive ash-bearing mudstone
Facies 3A: Massive siliciclastic mudstone Facies 4: Calcareous mudstone
Facies 10: Vitric tuff
Facies Association 5
Carbonates and volcaniclastics
Facies 4: Calcareous mudstone
Facies 10: Vitric tuff Facies 11: Crystal tuff
Facies 12: Lithic tuff
Facies 13: Clast-bearing packstone
18
littoral-lacustrine carbonate depozone is recognized by the presence of cherty limestone (FA3) and
was located only on margins during early to middle lake development as well as during late lake
stages that show interbedded volcaniclastics and carbonates. The most distal depositional zone is
represented by a limnetic-lacustrine environment (FA4). During deposition in the limnetic-
lacustrine environment, the proximal outcrops of the CMC and TR sections exhibit the laminated
microbial-mat-bearing mudstone interbedded with carbonates, suggesting cyclicity of fluctuating
lake level likely as a result of climate and tectonics. In contrast, the Elko Hills outcrops record the
thickest microbial-mat-bearing mudstone (F5) and lack of carbonate intervals, suggesting that this
was the deep, central portion of the lake basin and less affected by variation in lake-level. Rare
beds of siliciclastic sandstone (F10) and clast-bearing packstone (F13) occur within this limnetic-
lacustrine environment, reflecting storm events inferred from erosional scours and rip-up clasts.
Massive fabrics of calcareous mudstone (F4) also contain evidence of soft-sediment deformation
and normal micro-faults, implying active extensional tectonism during the formation of the Elko
lake.
Horner (2015) combined new (Ar40/Ar39) dates with previously acquired radiometric age
dates (40K/40Ar and 235U/ 207Pb; Solomon et al., 1979; Haynes, 2003) to divide the Elko Formation
into four chronostratigraphic intervals and develop a facies architecture. The age dates indicated
that the succession represents a continental-lacustrine sedimentary system with a depocenter
shifting from north to south, recording significant lateral changes in accommodation space and
distinct facies trends. The northernmost outcrop (Coal Mine Canyon) has an age of 48.24 + 0.02
Ma, based on K-Ar radiometric dating (Horner, 2015) of a biotite-rich tuff near the base of the
measured tuff (rocks stratigraphically lower, but still considered part of the Elko Formation do not
19
contain volcanic rocks that can be dated radiometrically, but are assumed to be older). In contrast,
the biotite-rich tuff previously thought to be a similar chronostratigraphic interval at the TR
section, was dated at 43.5 Ma + 0.02 Ma, based on K-Ar radiometric dating (Horner, 2015). Airfall
tuff toward the top of the central section (Elko Hills) was dated at ~38.9 + 0.3 Ma, based on U/Pb
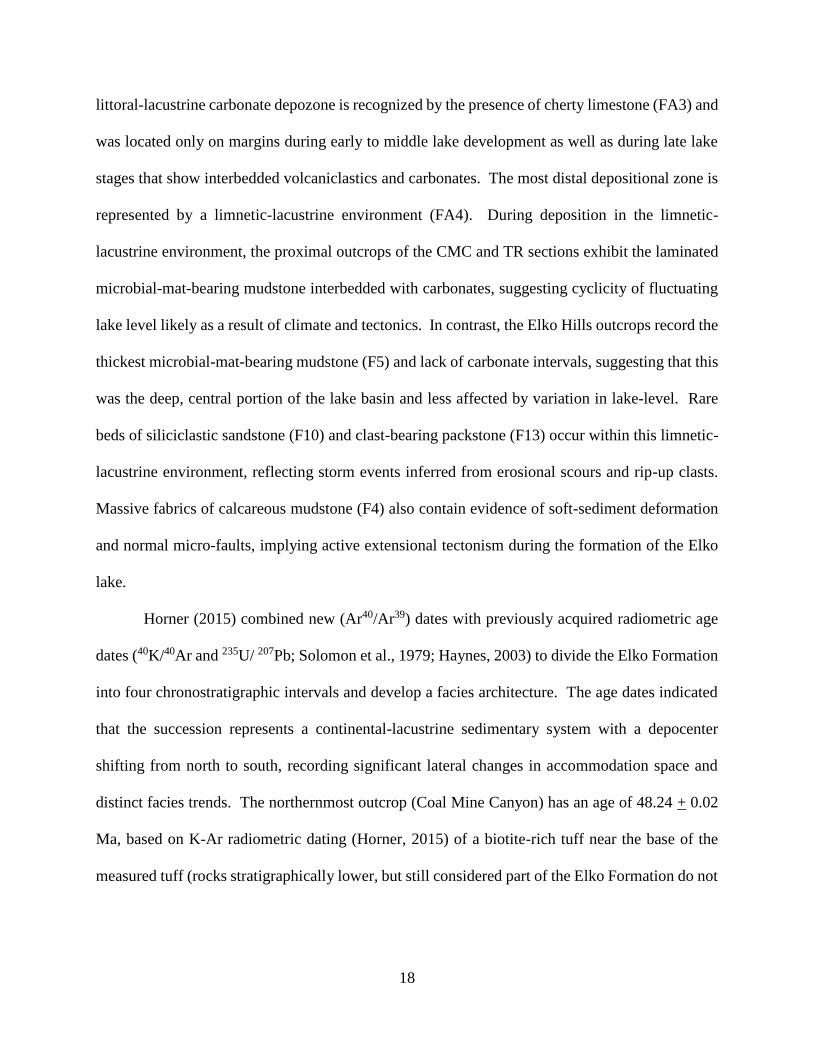
of Haynes (2003).
Figure 5A: Sedimentologic sketch of the depositional model of the Elko Formation based on Horner (2015).
Given that these radiometric ages are younger from north–south for these similar lake
facies and lateral organic-rich microbial-mat-bearing mudstone (F5) thickness also changes from
north–south, Horner (2015) interpreted that is depocenter is shifted from north–south. This is
schematically shown in four time intervals reflecting the entire lake evolution (Fig. 5B). Time 1
exhibits northernmost deposition of alluvial-fluvial and palustrine-lacustrine sediment (FA1 and
FA2, respectively) during ~53.0–50.0 Ma. Time 2 (~50.0–48.5 Ma) represents an increase in
subsidence in the northernmost outcrop and the initial deposition of littoral-lacustrine (FA3) and
limnetic-lacustrine sedimentation (FA4) in the CMC section evidenced by deep-lake fine-grained
A
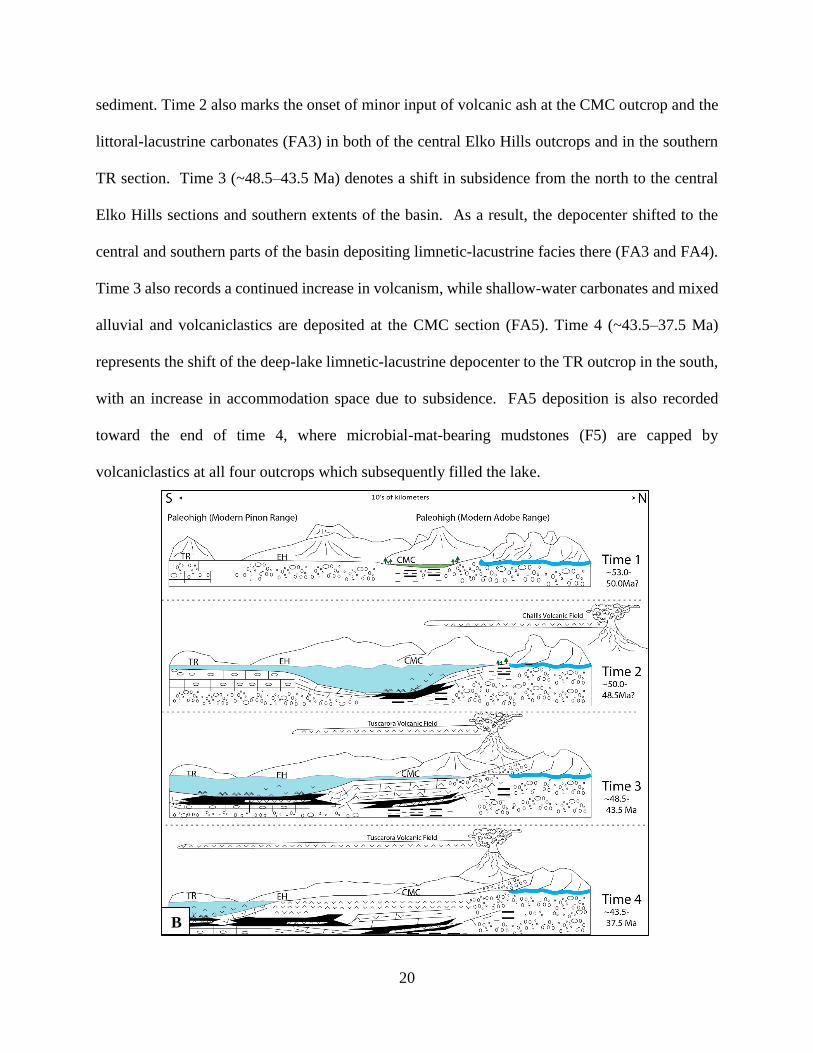
20
sediment. Time 2 also marks the onset of minor input of volcanic ash at the CMC outcrop and the
littoral-lacustrine carbonates (FA3) in both of the central Elko Hills outcrops and in the southern
TR section. Time 3 (~48.5–43.5 Ma) denotes a shift in subsidence from the north to the central
Elko Hills sections and southern extents of the basin. As a result, the depocenter shifted to the
central and southern parts of the basin depositing limnetic-lacustrine facies there (FA3 and FA4).
Time 3 also records a continued increase in volcanism, while shallow-water carbonates and mixed
alluvial and volcaniclastics are deposited at the CMC section (FA5). Time 4 (~43.5–37.5 Ma)
represents the shift of the deep-lake limnetic-lacustrine depocenter to the TR outcrop in the south,
with an increase in accommodation space due to subsidence. FA5 deposition is also recorded
toward the end of time 4, where microbial-mat-bearing mudstones (F5) are capped by
volcaniclastics at all four outcrops which subsequently filled the lake.
B
21
Figure 5B (previous page): Sedimentologic sketch of the Elko Formation based on Horner (2015), displaying a
shifting depocenter of the Elko Formation in four time intervals from 53–32.5 Ma.
3.2 Gamma Radiation and Spectral Gamma Ray: Potassium, Thorium, and Uranium
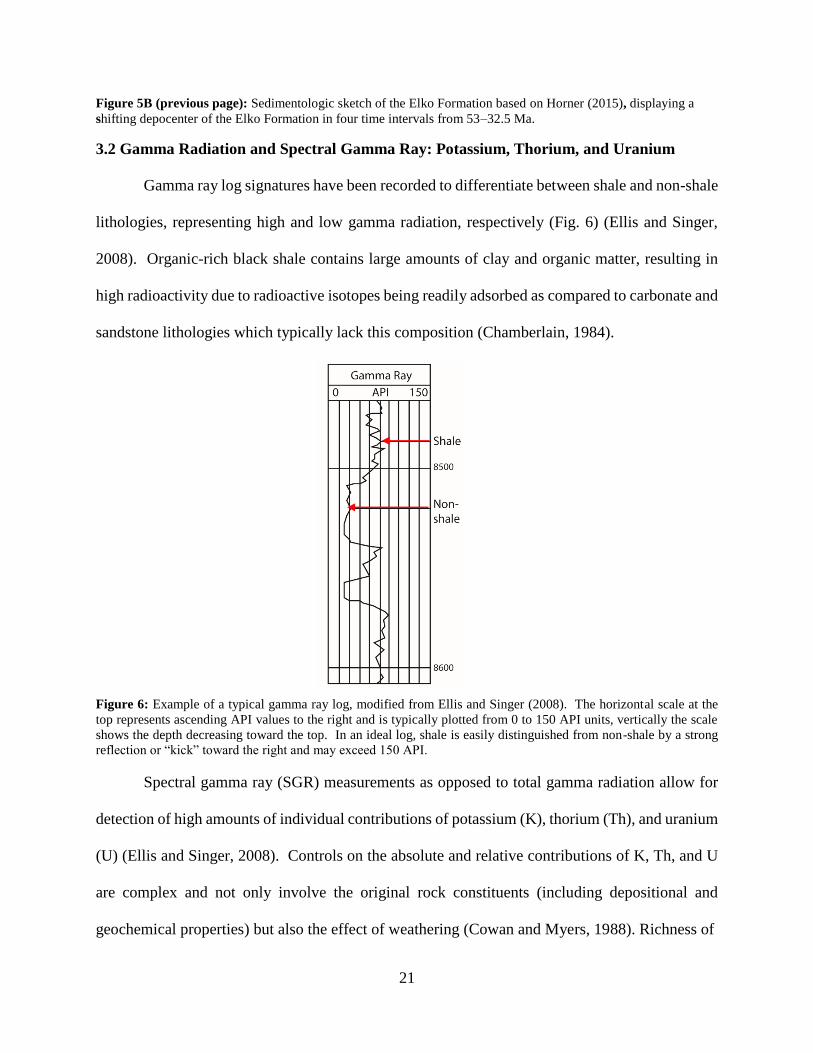
Gamma ray log signatures have been recorded to differentiate between shale and non-shale
lithologies, representing high and low gamma radiation, respectively (Fig. 6) (Ellis and Singer,
2008). Organic-rich black shale contains large amounts of clay and organic matter, resulting in
high radioactivity due to radioactive isotopes being readily adsorbed as compared to carbonate and
sandstone lithologies which typically lack this composition (Chamberlain, 1984).
Figure 6: Example of a typical gamma ray log, modified from Ellis and Singer (2008). The horizontal scale at the
top represents ascending API values to the right and is typically plotted from 0 to 150 API units, vertically the scale
shows the depth decreasing toward the top. In an ideal log, shale is easily distinguished from non-shale by a strong
reflection or “kick” toward the right and may exceed 150 API.
Spectral gamma ray (SGR) measurements as opposed to total gamma radiation allow for
detection of high amounts of individual contributions of potassium (K), thorium (Th), and uranium
(U) (Ellis and Singer, 2008). Controls on the absolute and relative contributions of K, Th, and U
are complex and not only involve the original rock constituents (including depositional and
geochemical properties) but also the effect of weathering (Cowan and Myers, 1988). Richness of
22
K, U, and Th are a direct product of the mineral composition of the Earth’s crust and
average abundances of K, U, and Th are estimated to be 2–2.5 wt. %, 2–3 ppm, and 8–12 ppm,
respectively. These are only elements with radioactive isotopes that show sufficient gamma ray
emission to be adequately measured (IAEA, 2003; Guagliardi et al., 2013). As each of these
isotopes decay, the energy released contributes to the total gamma ray log and SGR allows for
differentiating the contributions individually (Ehrenberg and Svånå, 2001).
Radioactive decay of potassium is measured directly through the breakdown of its isotope
40K and is found in greater abundance in comparison to thorium and uranium, therefore, is
represented in weight percent (wt. %) (Ellis and Singer, 2008). Typically, K is found to be
abundant in orthoclase (K-feldspar), mica (biotite), illite, as well as glauconite with minor amounts
found in kaolinite (Fabricius et al., 2003). As K-bearing minerals do not weather easily, K can be
transported without changes to its chemical composition, however, leaching through soil in a
highly weathered regolith may result in low K readings (Guagliardi et al., 2013).
Thorium isotope 232Th is a common trace element estimated by its daughter products, 208Tl
and 228Ac. Due to its low natural abundance it is therefore recorded in parts per million (ppm)
(Blum et al., 1997; IAEA, 2003). Commonly, Th is found in heavy minerals, such as monazite,
zircon, and rutile, and is also found to be related to clay minerals, although the reason remains
unclear (Hassan et al., 1976). Following Adams and Weaver (1958) and Fabricius et al. (2003),
Th is assumed to be fixed to clays by adsorption and is practically insoluble.
Uranium is estimated by the daughter products of the isotope 238U, such as 214Bi, and
similar to Th, recorded in ppm due to its naturally low average abundance (IAEA, 2003). U has a
soluble uranyl ion form which allows it to have greater mobility and transport than K and Th, and
is known to precipitate under reducing conditions (Fabricius et al., 2003). This radioactive element
23
is thought to be precipitated as uranium salts, which readily adsorb to the clay or organic material
components in marine shale (Swanson, 1961; Ellis and Singer, 2008). Following Svendsen and
Hartley (2001), intervals of rocks with high carbonate content can have greater concentrations of
U from U substitution. It has also been found to be abundant in volcanic rocks (Dickson and Scott,
1997); accessory minerals such as zircon, zenotime, and monazite; and as Fe-oxide or hydroxide
coatings on mineral grains (Dickson and Scott, 1997; Fabricius et al., 2003). Swanson (1961) and
Ehrenberg and Svånå (2001) describe the amount of U found in carbonaceous shale as having a
positive correlation to the amount of organic matter, whereas for noncarbonaceous shale the
uranium is contained in heavy minerals such as zircon and monzanite.
Generally, relationships between Th and U are used to determine basin trends and
differences in lateral extent from the margins toward the central, distal basin with the assumption
that the distal basin exhibits a greater abundance of U-bearing organic-rich marine mudstones
(Adams and Weaver, 1958; Bohacs, 1998). In marine systems, Th/U has been used to assess 1)
rock type and mineralogy 2) effects of oxidation and weathering and 3) the position in the basin,
based on the amount of terrigenous influence and relationship between clay and organic-matter
content (Adams and Weaver, 1958).
3.3 Gamma Ray Spectrometer Measurements
Gamma radiation from potassium (40K), thorium (208Tl), and uranium (238U and 235U) is
measured by Bismuth Germanate oxide (BGO) scintillation crystals. These crystals within the
detector absorb gamma rays from the sediment, resulting as a light flash. The intensity of the flash
corresponds to the energy within the crystal and gets converted by a Photo-Multiplier Tube into a
voltage pulse. From the voltage pulse, the amplitude correlates to the amount of energy absorbed
from the gamma radiation, and as a result equates to a single reading composed of individual
24
contribution of radioactivity from K, Th, and U. The total energy absorbed is subdivided into K,
U, and Th based upon each isotope’s characteristic energy emissions set by the IAEA: 1360–1560
keV, 1660–1860 keV, and 2420–2820 keV, respectively (RSI Technical Note, 2009). This
instrument also internally auto-stabilizes spectrum channels as well as takes into account the
surrounding background radiation, eliminating the need for outside test sources for calibration.
Auto-stabilizing differs from calibrating in that auto-stabilizing refers to tuning the K, Th, and U
channels to measure energy emissions from each, which can shift from change of temperature or
significant gamma ray emissions change. Calibrating uses stripping ratios (interference between
K, Th, and U isotopes) to ensure that the correct proportions of each are recorded, and conducts
internal computations to convert raw data to assay readings (units from counts to voltage of energy)
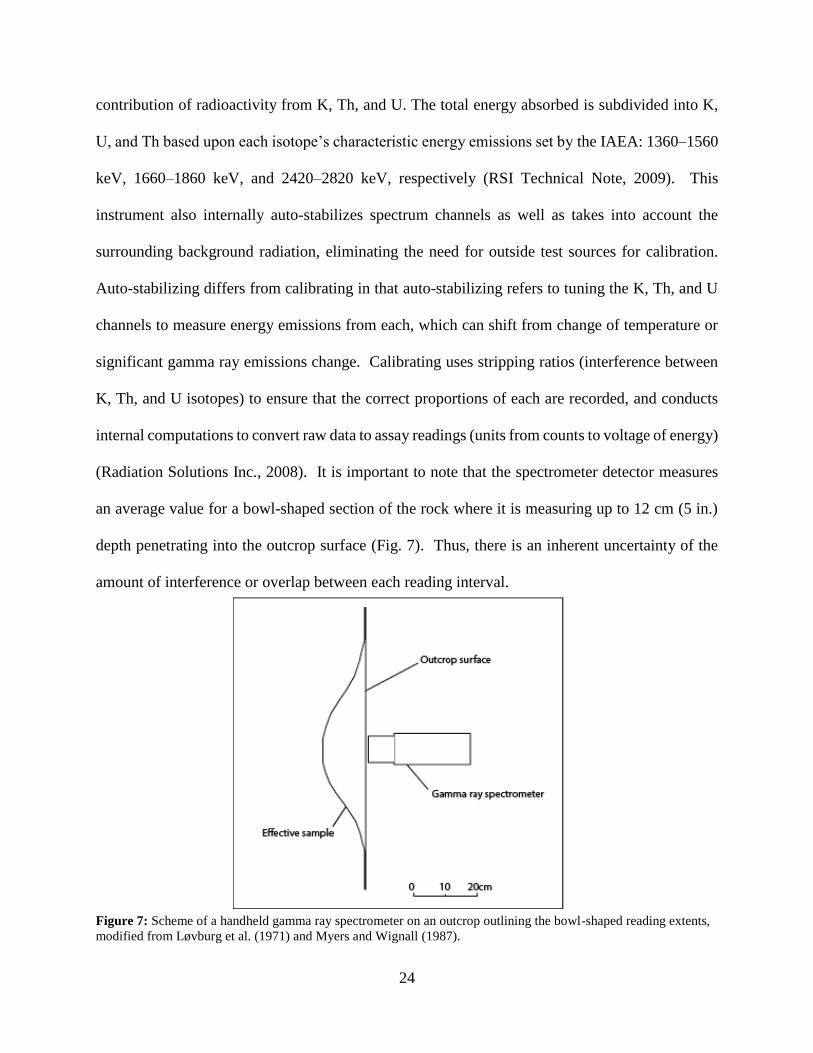
(Radiation Solutions Inc., 2008). It is important to note that the spectrometer detector measures
an average value for a bowl-shaped section of the rock where it is measuring up to 12 cm (5 in.)
depth penetrating into the outcrop surface (Fig. 7). Thus, there is an inherent uncertainty of the
amount of interference or overlap between each reading interval.
Figure 7: Scheme of a handheld gamma ray spectrometer on an outcrop outlining the bowl-shaped reading extents,
modified from Løvburg et al. (1971) and Myers and Wignall (1987).
25
4.0 METHODOLOGY
4.1 Study Area
SGR measurements were acquired at four outcrops within a ~100-km radius of Elko,
Nevada. The four outcrops will be referred to as Coal Mine Canyon (CMC), Elko Hills A (EHA),
Elko Hills B (EHB), and Tomera Ranch (TR) in this study and form a NNW–SSE transect (Fig.
1). The Elko Formation naturally forms very poorly exposed outcrops and although other outcrops
of the Elko Formation have been identified in an area greater than 28,000 km2, each of the four
investigated outcrops were formerly trenched by the USGS in the 1970s, providing the best
exposures and were therefore chosen for this study (Smith et al., 1976; Moore et al., 1983;
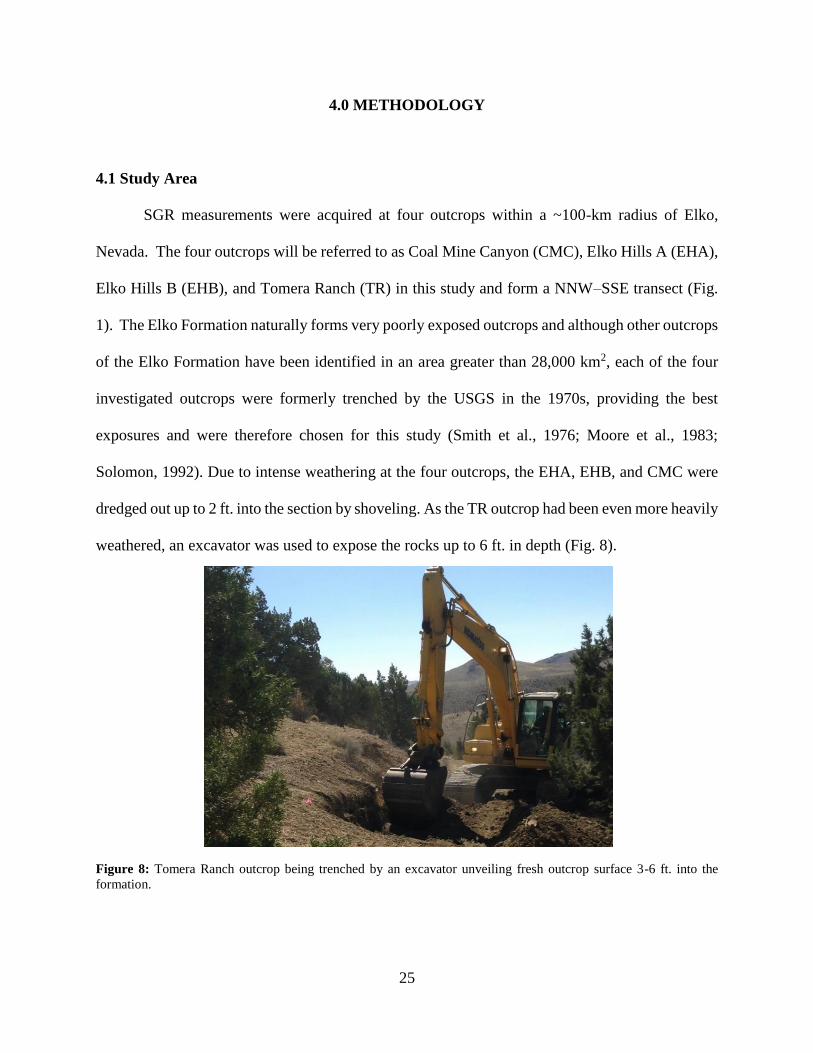
Solomon, 1992). Due to intense weathering at the four outcrops, the EHA, EHB, and CMC were
dredged out up to 2 ft. into the section by shoveling. As the TR outcrop had been even more heavily
weathered, an excavator was used to expose the rocks up to 6 ft. in depth (Fig. 8).
Figure 8: Tomera Ranch outcrop being trenched by an excavator unveiling fresh outcrop surface 3-6 ft. into the
formation.
26
4.2 Gamma Ray Spectrometer Tool
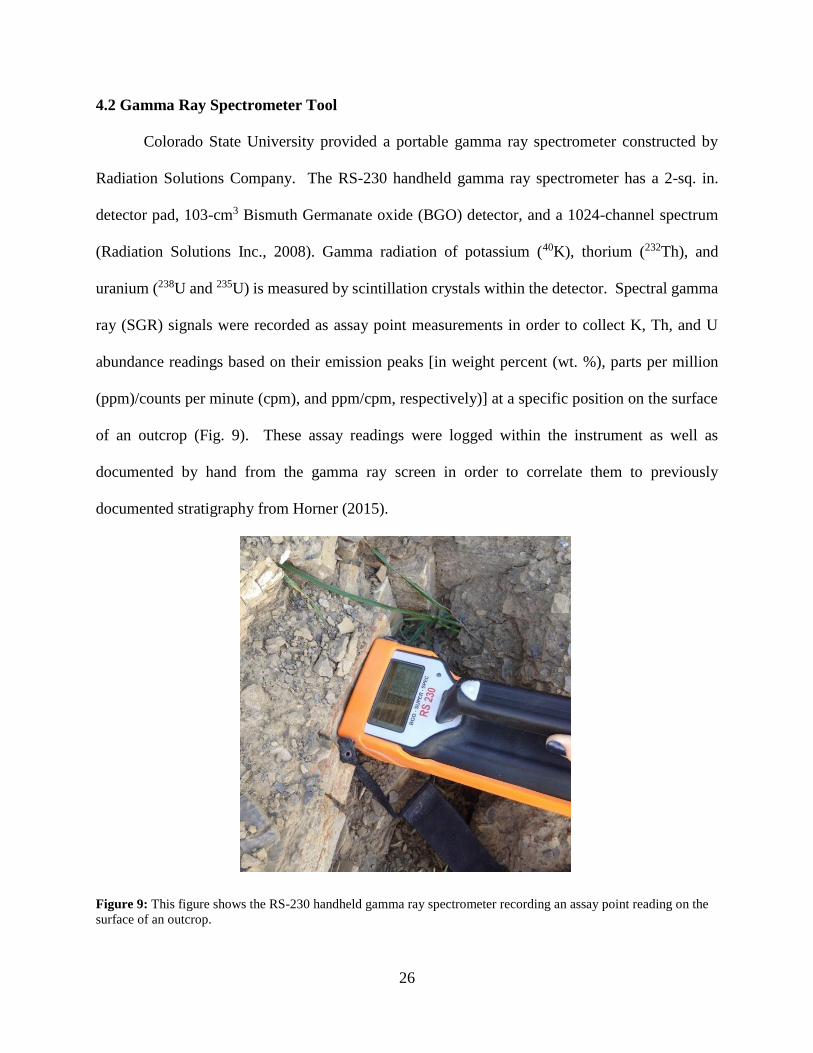
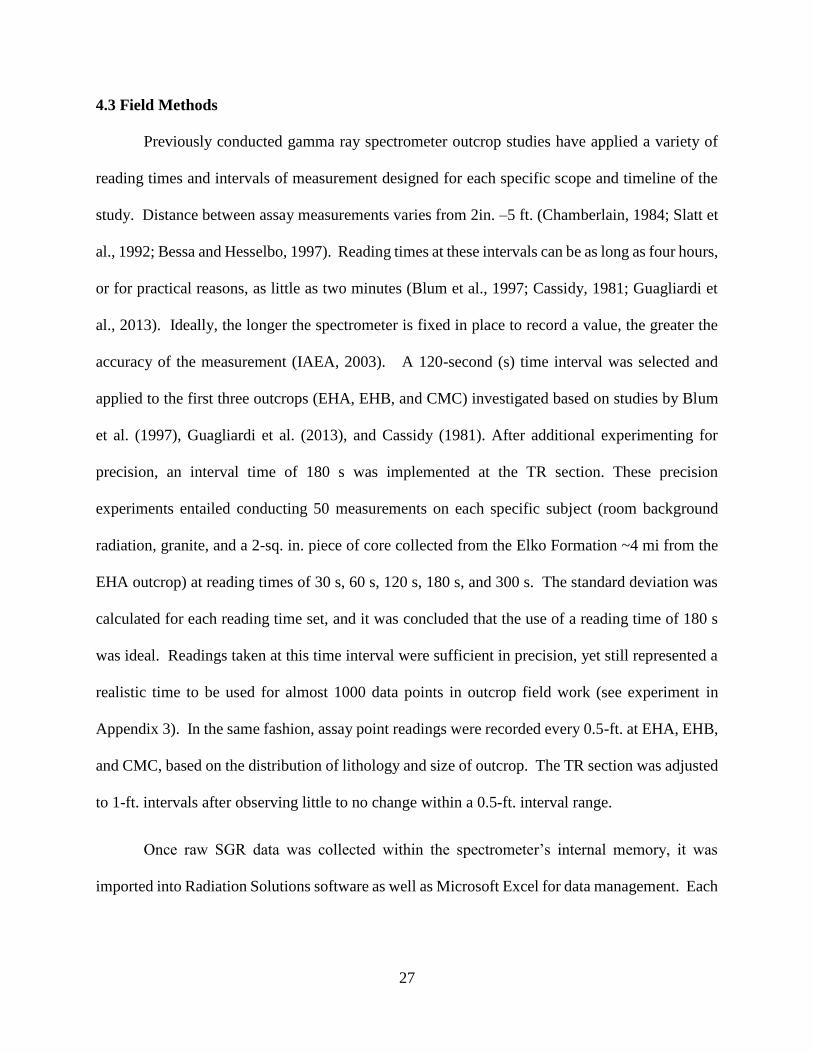
Colorado State University provided a portable gamma ray spectrometer constructed by
Radiation Solutions Company. The RS-230 handheld gamma ray spectrometer has a 2-sq. in.
detector pad, 103-cm3 Bismuth Germanate oxide (BGO) detector, and a 1024-channel spectrum
(Radiation Solutions Inc., 2008). Gamma radiation of potassium (40K), thorium (232Th), and
uranium (238U and 235U) is measured by scintillation crystals within the detector. Spectral gamma
ray (SGR) signals were recorded as assay point measurements in order to collect K, Th, and U
abundance readings based on their emission peaks [in weight percent (wt. %), parts per million
(ppm)/counts per minute (cpm), and ppm/cpm, respectively)] at a specific position on the surface
of an outcrop (Fig. 9). These assay readings were logged within the instrument as well as
documented by hand from the gamma ray screen in order to correlate them to previously
documented stratigraphy from Horner (2015).
Figure 9: This figure shows the RS-230 handheld gamma ray spectrometer recording an assay point reading on the
surface of an outcrop.
27
4.3 Field Methods
Previously conducted gamma ray spectrometer outcrop studies have applied a variety of
reading times and intervals of measurement designed for each specific scope and timeline of the
study. Distance between assay measurements varies from 2in. –5 ft. (Chamberlain, 1984; Slatt et
al., 1992; Bessa and Hesselbo, 1997). Reading times at these intervals can be as long as four hours,
or for practical reasons, as little as two minutes (Blum et al., 1997; Cassidy, 1981; Guagliardi et
al., 2013). Ideally, the longer the spectrometer is fixed in place to record a value, the greater the
accuracy of the measurement (IAEA, 2003). A 120-second (s) time interval was selected and
applied to the first three outcrops (EHA, EHB, and CMC) investigated based on studies by Blum
et al. (1997), Guagliardi et al. (2013), and Cassidy (1981). After additional experimenting for
precision, an interval time of 180 s was implemented at the TR section. These precision
experiments entailed conducting 50 measurements on each specific subject (room background
radiation, granite, and a 2-sq. in. piece of core collected from the Elko Formation ~4 mi from the
EHA outcrop) at reading times of 30 s, 60 s, 120 s, 180 s, and 300 s. The standard deviation was
calculated for each reading time set, and it was concluded that the use of a reading time of 180 s
was ideal. Readings taken at this time interval were sufficient in precision, yet still represented a
realistic time to be used for almost 1000 data points in outcrop field work (see experiment in
Appendix 3). In the same fashion, assay point readings were recorded every 0.5-ft. at EHA, EHB,
and CMC, based on the distribution of lithology and size of outcrop. The TR section was adjusted
to 1-ft. intervals after observing little to no change within a 0.5-ft. interval range.
Once raw SGR data was collected within the spectrometer’s internal memory, it was
imported into Radiation Solutions software as well as Microsoft Excel for data management. Each
28
individual assay point was broken down into K wt.%, Th (ppm), and U (ppm) and was used to
estimate API units by applying Equation 1 (Doveton and Merriam, 2004; Ellis and Singer, 2008).
𝛾 𝐴𝑃𝐼 = 4 𝑇ℎ + 8 𝑈 + 16 𝐾 (𝐸𝑞. 1)
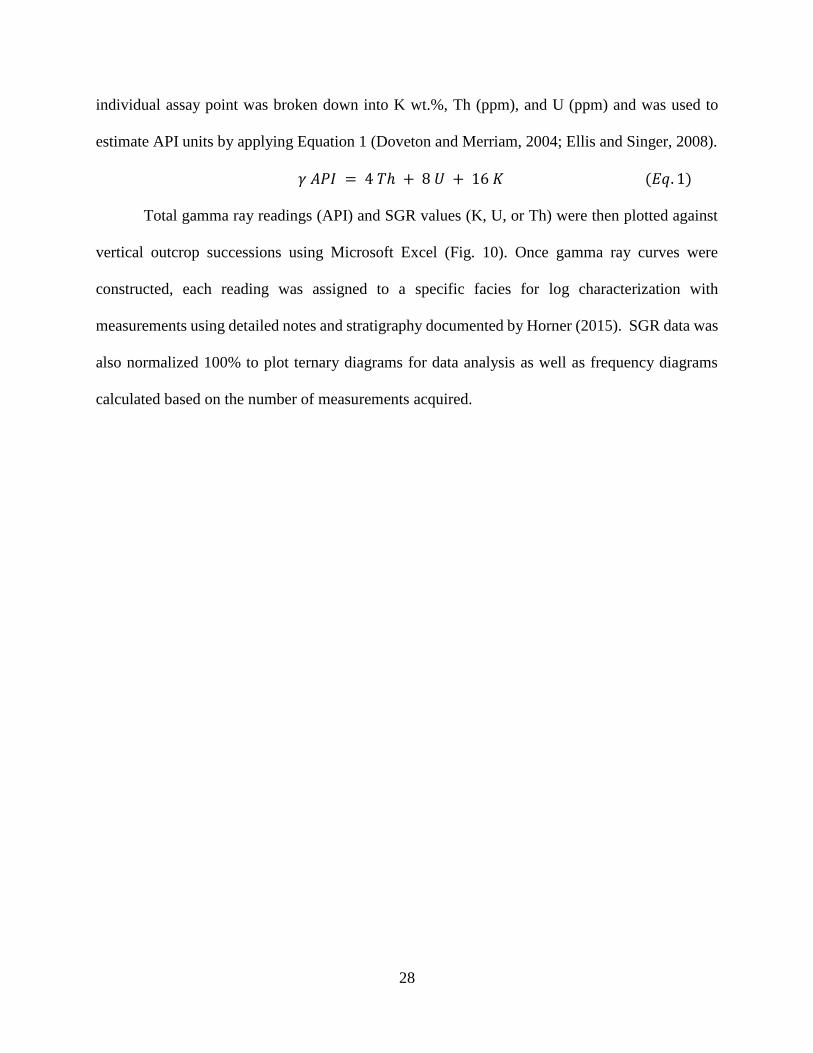
Total gamma ray readings (API) and SGR values (K, U, or Th) were then plotted against
vertical outcrop successions using Microsoft Excel (Fig. 10). Once gamma ray curves were
constructed, each reading was assigned to a specific facies for log characterization with
measurements using detailed notes and stratigraphy documented by Horner (2015). SGR data was
also normalized 100% to plot ternary diagrams for data analysis as well as frequency diagrams
calculated based on the number of measurements acquired.
29
Figure 10: Example of a gamma ray curve constructed from gamma ray spectrometer data gathered at the Elko Hills B section. Stratigraphic section is plotted on
the y-axis from 0 to 58 ft., while API values are plotted on the x-axis from 0 to 250, right to left.
Interval (ft.)
30
4.4 Thin section, Total Organic Carbon, X-Ray Diffraction/Fluorescence
80 thin sections were prepared for this study. Mudstone samples were sent to Wagner
Petrographics, in Lindon, Utah, polished to 20 μm thickness, and infused with red fluorescent
epoxy. Coarse-grained siliciclastic, volcanic, and carbonate samples were sent to Spectrum
Petrographics in Vancouver, Washington. Preparation of the coarse-grained samples involved
polishing to 30-μm (siliciclastic and volcanic) or 40-μm thickness (carbonate), and both were
impregnated with blue epoxy to allow for porosity to be easily distinguished. Visual observation
and thin section photos were carried out using a Nikon Eclipse Ci-L petrographic microscope with
Nikon DS-Fi2 camera provided at Colorado State University and applying both plane polarized
and cross polarized light. This step in analysis proved crucial in identification of fine-scale
components (organic matter, sedimentary structures), distinguishing and estimating mineral
constituents, and categorizing detrital or diagenetic features. Thin sections were also used to
document micron-scale diagenetic cements using a JEOL 5800V scanning electron microscope
(SEM) equipped with an energy dispersive spectrometer (EDS) at the USGS in Denver, CO. Rock
cements were documented based on the Flügel (2004) scheme of classifying of carbonate cements,
whereas the Choquette and Pray (1970) scheme was applied to classify types of porosity.
A total of ten samples were used in total organic carbon (TOC) analyses provided by
Weatherford Laboratories in Houston, Texas. Sample preparation included acidization to remove
carbonate minerals. The remaining dried sediment could then be oxidized, and TOC determined
by measuring the amount of oxidized carbon released from the dried sediment as CO2, using a
LECO Carbon Analyzer. TOC analysis provided an estimate of organic content within the sample
to be compared to the amount of uranium influence indicated by the SGR log.

31
X-Ray diffraction (XRD) was conducted at Atoka Geochemical in Centennial, CO, using
an Olympus BTX profiler and Delta Professional Geochemical Analyzer. The purpose of XRD
analysis was to quantify the inorganic mineral content (recorded as wt. %), including relative
abundance of clay and non-clay types.
32
5.0 RESULTS
5.1 Total Gamma Ray Data
Organic-rich marine mudstones typically are easily identified in gamma ray logs as high-
API values and are commonly referred to as “hot shales” (Dypvik and Eriksen, 1983). The gamma
ray signature of the lacustrine Elko Formation is less straightforward, due to its heterogenetic
lithologies and depositional influences. The Elko Formation gamma ray measurement results and
gamma ray log signature will be described for each of the four outcrops (CMC, EHA, EHB, and
TR) separately.
Although eight of the 14 facies were identified by Horner (2015) in the Elko Formation,
only eight facies are considered in this study (Figs. 11A–L). These eight facies, some of which
comprise two or more of Horner’s (2015) facies, were selected based on an adequate number of
samples gathered from outcrop as well as by facies that were discernable from a gamma ray signal.
Horner (2015) described bituminous coal (F1) and lignite (F2) separately, based on their
differing lithological characteristics, however, in this study, these two facies were jointly classified
as plant-bearing mudstone (F1/2) due to the fact that the intervals of coal were never thicker than
12 cm and occurred infrequently throughout the succession.
Horner (2015) also identified massive, siliciclastic mudstone (F3A) and massive, root-
bearing siliciclastic mudstone (F3B), but are combined into one facies, clay-dominated mudstone
(F3), for the purpose of this study, as only two F3B samples were collected. Laminated, silt-to-
sand-bearing siliciclastic mudstone (F7) and siliciclastic sandstone (F9) were not included in this
study, due to these facies only occurring in laminae up to 5 millimeters thick and were, therefore,
too small to be read by the gamma ray spectrometer without interference from the adjacent
33
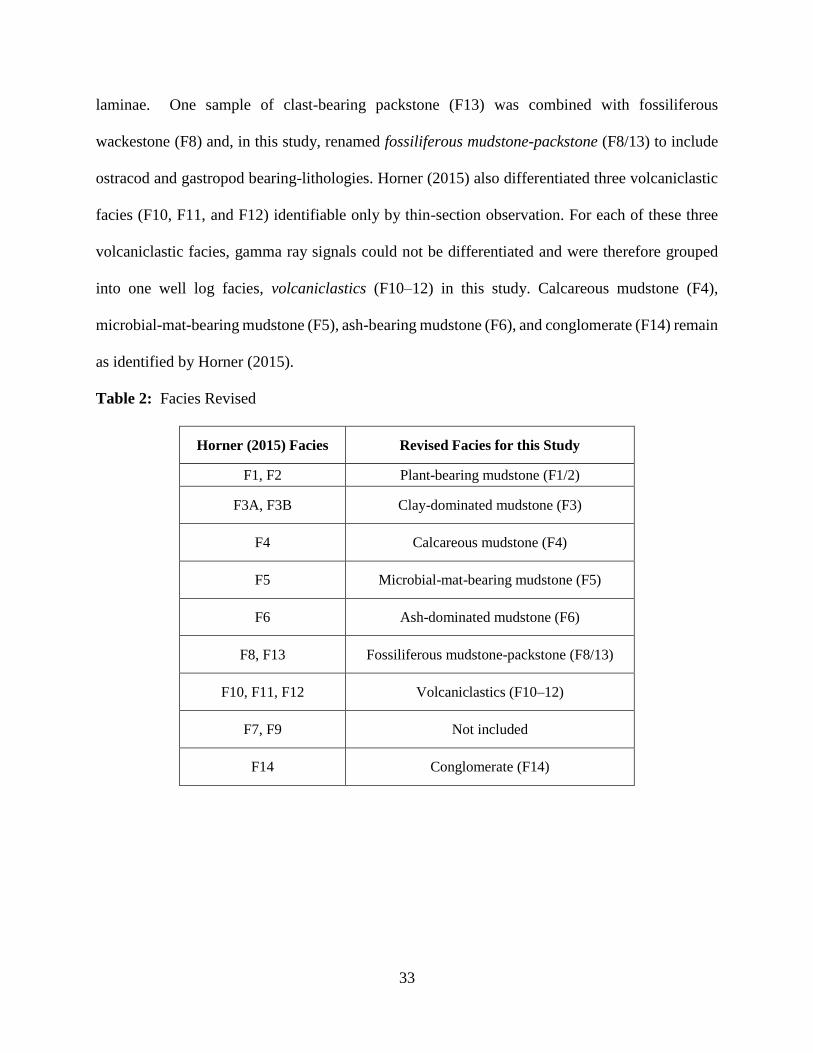
laminae. One sample of clast-bearing packstone (F13) was combined with fossiliferous
wackestone (F8) and, in this study, renamed fossiliferous mudstone-packstone (F8/13) to include
ostracod and gastropod bearing-lithologies. Horner (2015) also differentiated three volcaniclastic
facies (F10, F11, and F12) identifiable only by thin-section observation. For each of these three
volcaniclastic facies, gamma ray signals could not be differentiated and were therefore grouped
into one well log facies, volcaniclastics (F10–12) in this study. Calcareous mudstone (F4),
microbial-mat-bearing mudstone (F5), ash-bearing mudstone (F6), and conglomerate (F14) remain
as identified by Horner (2015).
Table 2: Facies Revised
Horner (2015) Facies Revised Facies for this Study
F1, F2 Plant-bearing mudstone (F1/2)
F3A, F3B Clay-dominated mudstone (F3)
F4 Calcareous mudstone (F4)
F5 Microbial-mat-bearing mudstone (F5)
F6 Ash-dominated mudstone (F6)
F8, F13 Fossiliferous mudstone-packstone (F8/13)
F10, F11, F12 Volcaniclastics (F10–12)
F7, F9 Not included
F14 Conglomerate (F14)
34
A
25
cm
B
50
cm
C
50
cm
E
25
cm
G
25
cm
H
50
cm
F
25
cm
2
5 c
m
D
35
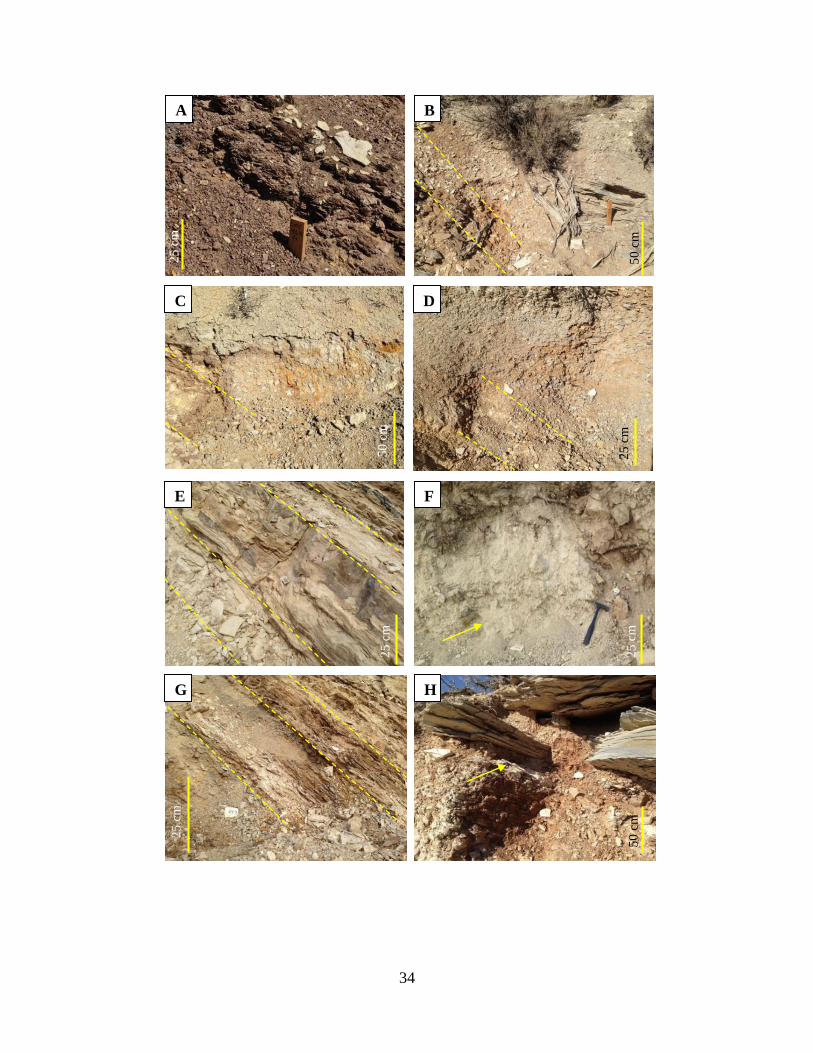
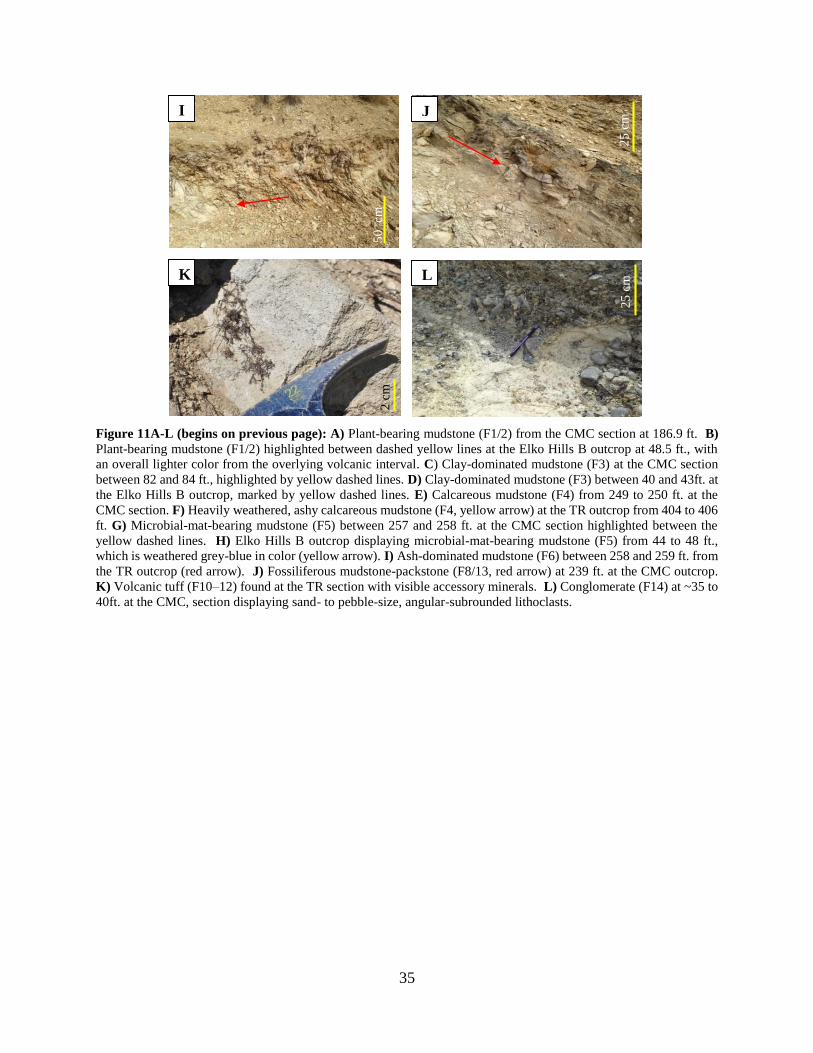
Figure 11A-L (begins on previous page): A) Plant-bearing mudstone (F1/2) from the CMC section at 186.9 ft. B)
Plant-bearing mudstone (F1/2) highlighted between dashed yellow lines at the Elko Hills B outcrop at 48.5 ft., with
an overall lighter color from the overlying volcanic interval. C) Clay-dominated mudstone (F3) at the CMC section
between 82 and 84 ft., highlighted by yellow dashed lines. D) Clay-dominated mudstone (F3) between 40 and 43ft. at
the Elko Hills B outcrop, marked by yellow dashed lines. E) Calcareous mudstone (F4) from 249 to 250 ft. at the
CMC section. F) Heavily weathered, ashy calcareous mudstone (F4, yellow arrow) at the TR outcrop from 404 to 406
ft. G) Microbial-mat-bearing mudstone (F5) between 257 and 258 ft. at the CMC section highlighted between the
yellow dashed lines. H) Elko Hills B outcrop displaying microbial-mat-bearing mudstone (F5) from 44 to 48 ft.,
which is weathered grey-blue in color (yellow arrow). I) Ash-dominated mudstone (F6) between 258 and 259 ft. from
the TR outcrop (red arrow). J) Fossiliferous mudstone-packstone (F8/13, red arrow) at 239 ft. at the CMC outcrop.
K) Volcanic tuff (F10–12) found at the TR section with visible accessory minerals. L) Conglomerate (F14) at ~35 to
40ft. at the CMC, section displaying sand- to pebble-size, angular-subrounded lithoclasts.
I
50
cm
K
2 c
m
L
25
cm
J
25
cm
36
5.2 Spectral Gamma Ray Measurements
Fig. 12 displays 10–15 ft. sections as an overview of the gamma ray signature within and
between outcrops, including an example of each of the eight facies that could be
defined/differentiated by both outcrop and well-log analyses. Complete gamma ray logs, each
spectral curve (K, U, and Th), and total API for each outcrop are included in Appendix 8. Ranges
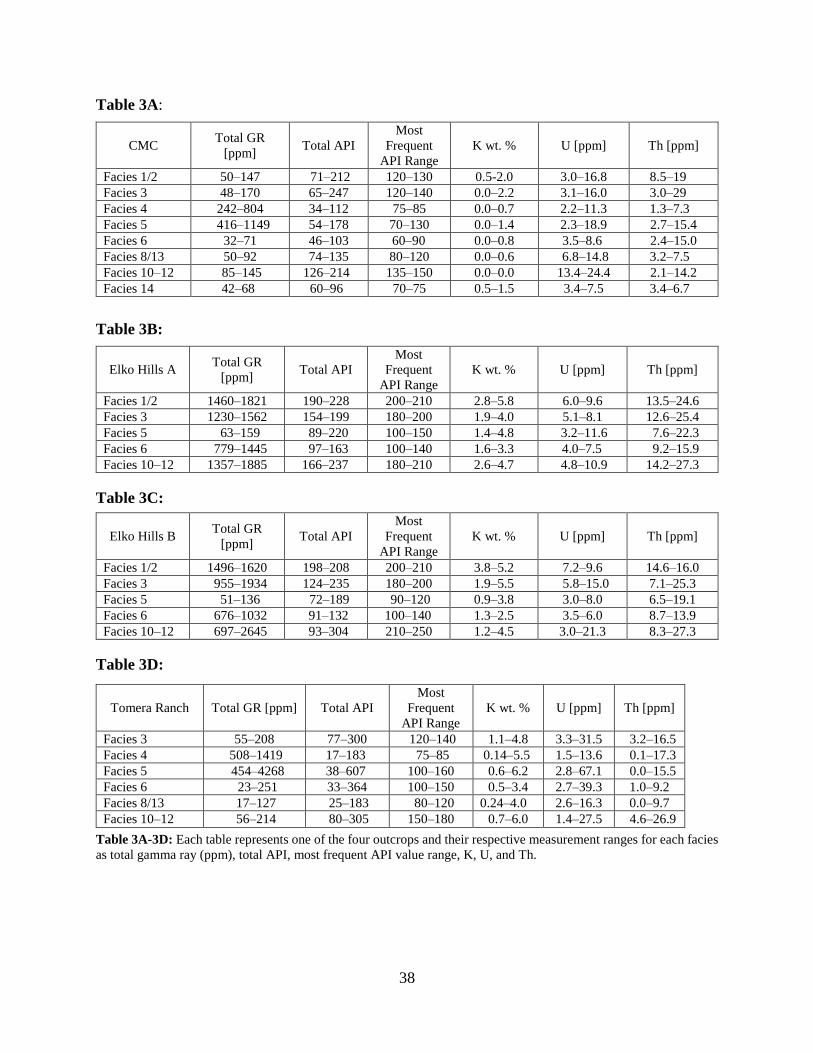
for the total gamma ray (ppm), total API, most frequent API value range, K wt. %, U (ppm), and
Th (ppm) measurements are summarized in Tables 2–5. All raw data recorded, calculated summary
statistics, and frequency distribution charts (calculated per measurement) for all four outcrops
including the measurements mentioned above can be found in Appendices 1, 2, and 6, respectively.
Gamma ray measurements herein are shown in ternary diagrams with each point representative of
one measurement of the total gamma ray (ppm) that can be subdivided into the percentage of K
wt. %, U (ppm), and Th (ppm) and have been normalized to 100%. (Figs. 13A–I). Introducing
the range of data as well as identifying SGR contributions for each facies within each outcrop
allows for a better context for understanding the mineralogical and geochemical signal controlling
the gamma ray signature.
412 measurements were acquired every 0.5–2 ft. at the CMC outcrop, along the 210 ft. of
measured section that comprises the eight facies applicable to this study. The EHA and EHB
sections exhibit lack F4 and F8/13. 120 SGR readings were acquired every 0.5 ft. in outcrop A
and 88 in outcrop B, along 58.5 and 44 ft. of section, respectively. 357 readings at the TR outcrop
along 425 ft. of section every 1–2 ft. comprised all eight facies.
37
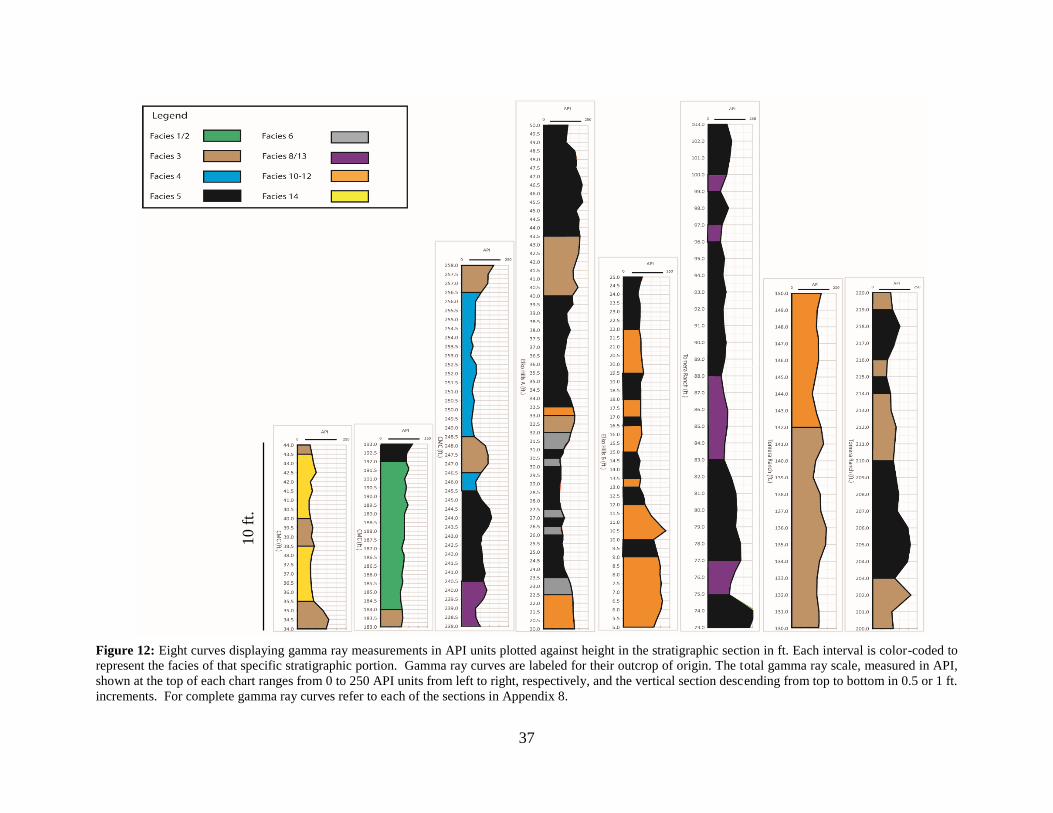
Figure 12: Eight curves displaying gamma ray measurements in API units plotted against height in the stratigraphic section in ft. Each interval is color-coded to
represent the facies of that specific stratigraphic portion. Gamma ray curves are labeled for their outcrop of origin. The total gamma ray scale, measured in API,
shown at the top of each chart ranges from 0 to 250 API units from left to right, respectively, and the vertical section descending from top to bottom in 0.5 or 1 ft.
increments. For complete gamma ray curves refer to each of the sections in Appendix 8.
10 f
t.
38
Table 3A:
CMC Total GR
[ppm] Total API
Most
Frequent
API Range
K wt. % U [ppm] Th [ppm]
Facies 1/2 50–147 71–212 120–130 0.5-2.0 3.0–16.8 8.5–19
Facies 3 48–170 65–247 120–140 0.0–2.2 3.1–16.0 3.0–29
Facies 4 242–804 34–112 75–85 0.0–0.7 2.2–11.3 1.3–7.3
Facies 5 416–1149 54–178 70–130 0.0–1.4 2.3–18.9 2.7–15.4
Facies 6 32–71 46–103 60–90 0.0–0.8 3.5–8.6 2.4–15.0
Facies 8/13 50–92 74–135 80–120 0.0–0.6 6.8–14.8 3.2–7.5
Facies 10–12 85–145 126–214 135–150 0.0–0.0 13.4–24.4 2.1–14.2
Facies 14 42–68 60–96 70–75 0.5–1.5 3.4–7.5 3.4–6.7
Table 3B:
Elko Hills A Total GR
[ppm] Total API
Most
Frequent
API Range
K wt. % U [ppm] Th [ppm]
Facies 1/2 1460–1821 190–228 200–210 2.8–5.8 6.0–9.6 13.5–24.6
Facies 3 1230–1562 154–199 180–200 1.9–4.0 5.1–8.1 12.6–25.4
Facies 5 63–159 89–220 100–150 1.4–4.8 3.2–11.6 7.6–22.3
Facies 6 779–1445 97–163 100–140 1.6–3.3 4.0–7.5 9.2–15.9
Facies 10–12 1357–1885 166–237 180–210 2.6–4.7 4.8–10.9 14.2–27.3
Table 3C:
Table 3D:
Table 3A-3D: Each table represents one of the four outcrops and their respective measurement ranges for each facies
as total gamma ray (ppm), total API, most frequent API value range, K, U, and Th.
Elko Hills B Total GR
[ppm] Total API
Most
Frequent
API Range
K wt. % U [ppm] Th [ppm]
Facies 1/2 1496–1620 198–208 200–210 3.8–5.2 7.2–9.6 14.6–16.0
Facies 3 955–1934 124–235 180–200 1.9–5.5 5.8–15.0 7.1–25.3
Facies 5 51–136 72–189 90–120 0.9–3.8 3.0–8.0 6.5–19.1
Facies 6 676–1032 91–132 100–140 1.3–2.5 3.5–6.0 8.7–13.9
Facies 10–12 697–2645 93–304 210–250 1.2–4.5 3.0–21.3 8.3–27.3
Tomera Ranch Total GR [ppm] Total API
Most
Frequent
API Range
K wt. % U [ppm] Th [ppm]
Facies 3 55–208 77–300 120–140 1.1–4.8 3.3–31.5 3.2–16.5
Facies 4 508–1419 17–183 75–85 0.14–5.5 1.5–13.6 0.1–17.3
Facies 5 454–4268 38–607 100–160 0.6–6.2 2.8–67.1 0.0–15.5
Facies 6 23–251 33–364 100–150 0.5–3.4 2.7–39.3 1.0–9.2
Facies 8/13 17–127 25–183 80–120 0.24–4.0 2.6–16.3 0.0–9.7
Facies 10–12 56–214 80–305 150–180 0.7–6.0 1.4–27.5 4.6–26.9
39
5.2.1 Facies 1/2: Plant-Bearing Mudstone (Fig. 13A)
Plant-bearing mudstone (F1/2) gamma ray readings range most frequently from 120–130
API units at CMC and 200–210 API units at the Elko Hills outcrops (Tables 3A–3D). F1/2 values
are typically <10% K for CMC, and values for EHA and EHB range between 10 and 20% K. CMC,
EHA, and EHB values range between 30 and 50% U (there are several data points with higher
values at CMC and EHA than at EHB), and between 50–70% Th. SGR ranges for each facies
generally cluster by outcrop and are highlighted by polygons in Fig. 13A–G.
5.2.2 Facies 3: Clay-Dominated Mudstone (Fig. 13B)
API values for the clay-dominated mudstone (F3) at the CMC and TR outcrop most
frequently range from 120–140 units, while the Elko Hills sections show values between 180 and
200 units (Tables 3A–3D). F3 values are typically from 0–20% K for each of the CMC and TR
sections range with the CMC outcrop providing the lowest values. The EHA and EHB sections
display readings ranging from 10–20% K, 35–70% U (with five samples above 50%), and between
50–75% Th. Both the CMC and TR sections also exhibit U and Th values predominantly ranging
from 30–70%.
5.2.3 Facies 4: Calcareous Mudstone (Fig. 13C)
Calcareous mudstone (F4) has a frequent API range from 75–85 units. The CMC and TR
sections show a wide range of values for F4 (Table 3A and 3D). The CMC outcrop has <10% K,
between 40 and 70% U, and between 40 and 60% Th. The TR section shows F4 data between 10
and 40% K, 40 and 60% U, and 40–60% Th.
5.2.4 Facies 5: Microbial-Mat-Bearing-Mudstone (Fig. 13D)
Microbial-mat-bearing mudstone (F5) has most frequent API values for the CMC section
readings are typically between 70 and 130 units, while EHA and EHB outcrops are between 100
40
and 150 units, and 90 and 120 units, respectively (Tables 3A–3D). The TR locality shows API
values between 100 and 160 units. The CMC and TR sections show K values ranging from 0–
30% with the CMC outcrop displaying low to zero values, and the TR section displaying data
points predominantly from 5–30%. The CMC and TR sections also show similar U and Th values
with a majority of the data ranging from 30–70%. High U values, though, are exclusively found in
the TR section. The EHA and EHB sections show readings from 10–20% K, 35–65% U (with five
readings above 50%), and between 50 and 75% Th.
5.2.5 Facies 6: Ash-Bearing Mudstone (Fig. 13E)
Ash-bearing mudstone (F6) gamma ray values for the CMC outcrop are between 60 and
90 units, EHA and EHB are both between 100 and 140 units, while the TR section ranges from
100 to 150 units (Table 3A–3D). Ash-bearing mudstone (F6) data as two separate clusters
distinguishing the Elko Hills’ outcrops into one group and CMC and TR outcrops into another.
Both of the Elko Hills sections show 10–20% K, 30–50% U, and 50–70% Th. CMC and TR show
values of <10% K, >50% U, and <50% Th.
5.2.6 Facies 8/13: Fossiliferous mudstone-packstone (Fig. 13F)
Fossiliferous mudstone-packstone (F8/13) data is similar for both of the CMC and TR
outcrops despite a few outliers. Commonly, API values are frequently between 80 and 120 units
(Table 3A and 3D). K values are typically <10%, U shows readings between 50 and 95%, and Th
<50%. Less than five outliers for each the TR and CMC sections show U values higher than 80%
and K values at 0%, respectively.
5.2.7 Facies 10–12: Volcanic Tuff (Fig. 13G)
Volcanic tuff (F10–12) API ranges between 135 and 150 units, 180 and 210 units, 210–
250 units, and 150-180 units at the CMC, EHA, EHB, and TR sections, respectively (Tables 3A–
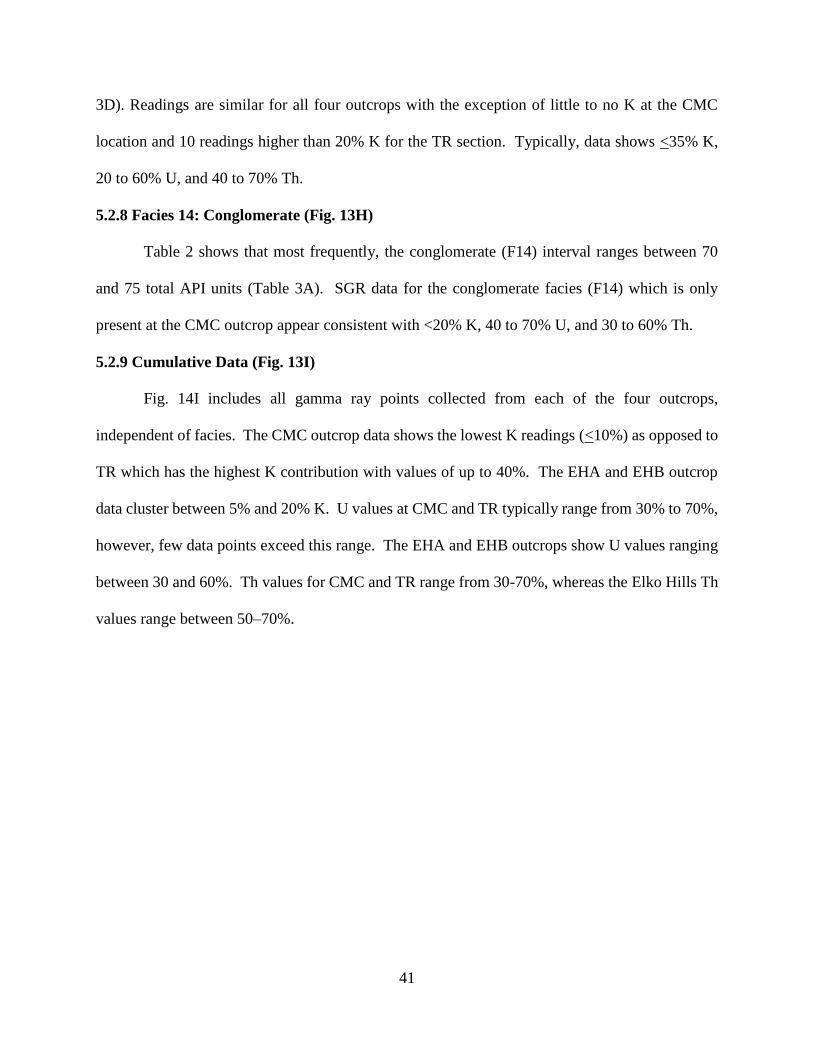
41
3D). Readings are similar for all four outcrops with the exception of little to no K at the CMC
location and 10 readings higher than 20% K for the TR section. Typically, data shows <35% K,
20 to 60% U, and 40 to 70% Th.
5.2.8 Facies 14: Conglomerate (Fig. 13H)
Table 2 shows that most frequently, the conglomerate (F14) interval ranges between 70
and 75 total API units (Table 3A). SGR data for the conglomerate facies (F14) which is only
present at the CMC outcrop appear consistent with <20% K, 40 to 70% U, and 30 to 60% Th.
5.2.9 Cumulative Data (Fig. 13I)
Fig. 14I includes all gamma ray points collected from each of the four outcrops,
independent of facies. The CMC outcrop data shows the lowest K readings (<10%) as opposed to
TR which has the highest K contribution with values of up to 40%. The EHA and EHB outcrop
data cluster between 5% and 20% K. U values at CMC and TR typically range from 30% to 70%,
however, few data points exceed this range. The EHA and EHB outcrops show U values ranging
between 30 and 60%. Th values for CMC and TR range from 30-70%, whereas the Elko Hills Th
values range between 50–70%.
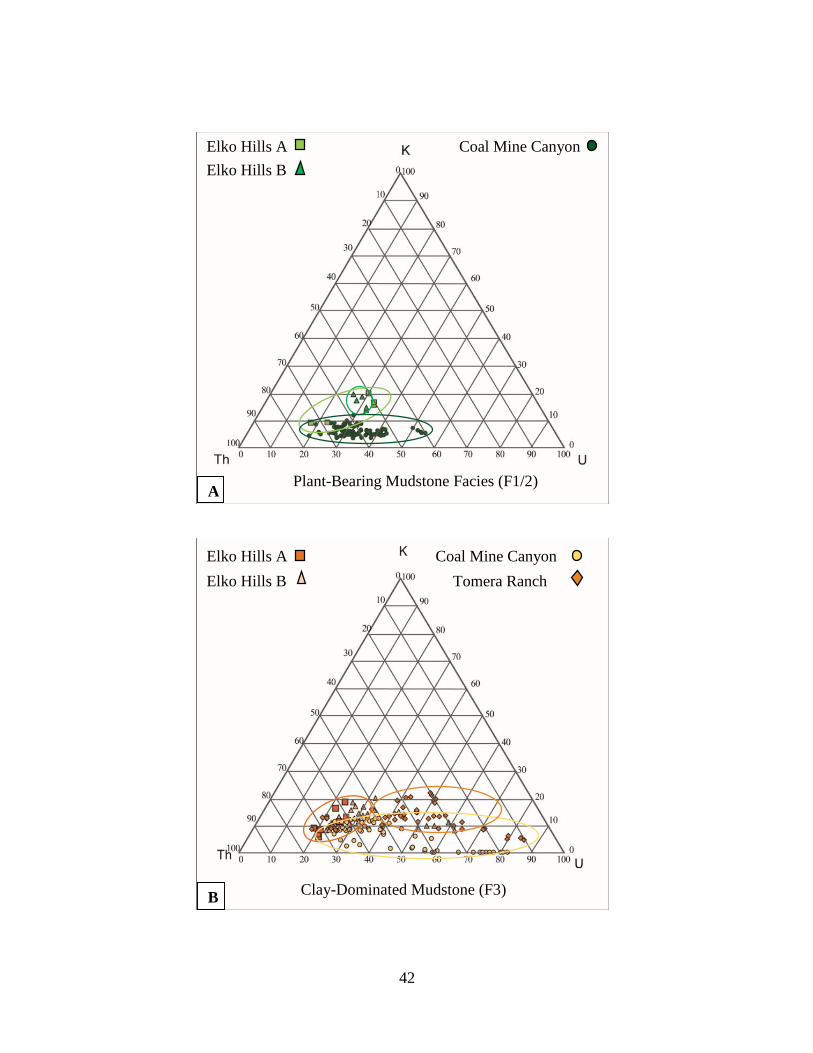
42
Plant-Bearing Mudstone Facies (F1/2) A
Elko Hills B
Elko Hills A
Coal Mine Canyon
Coal Mine Canyon
Tomera Ranch
Elko Hills A
Elko Hills B
Clay-Dominated Mudstone (F3)
Facies B
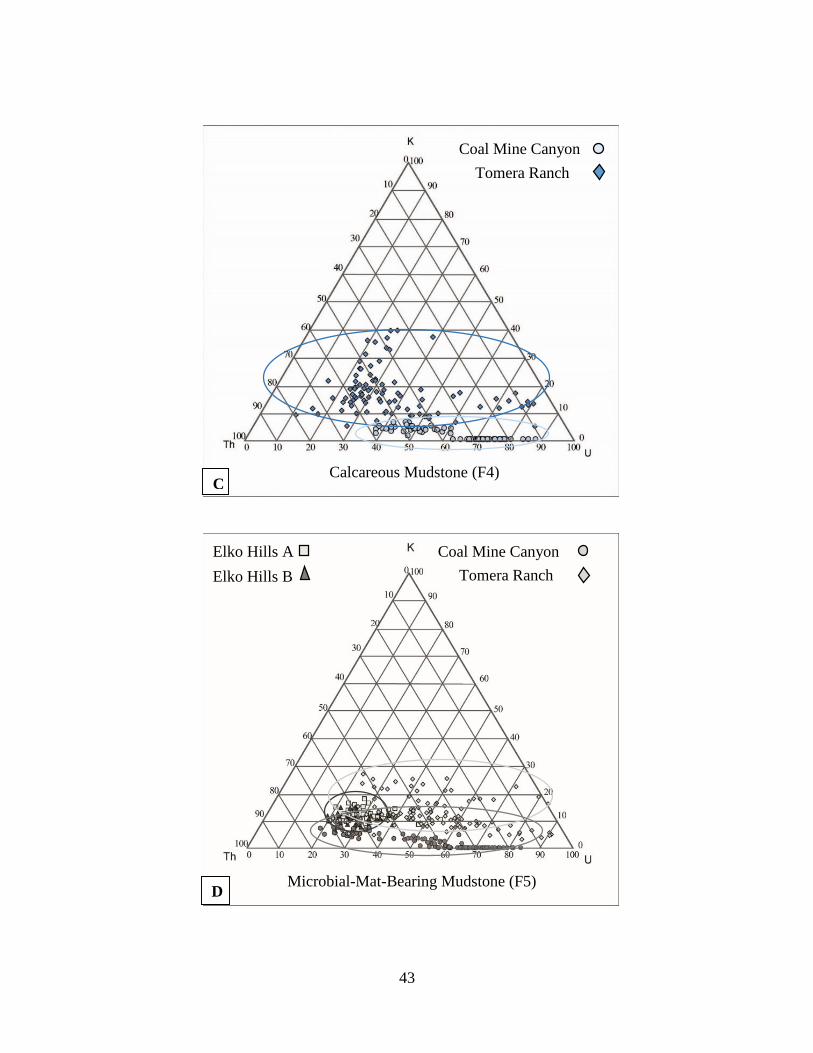
43
Coal Mine Canyon
Tomera Ranch
Calcareous Mudstone (F4)
Facies C
Coal Mine Canyon
Tomera Ranch Elko Hills B
Elko Hills A
Microbial-Mat-Bearing Mudstone (F5)
(F5) Facies D
44
Coal Mine Canyon
Tomera Ranch Elko Hills B
Elko Hills A
Ash-Bearing Mudstone (F6)
Facies E
Coal Mine Canyon
Tomera Ranch
F Fossiliferous Mudstone-Packstone Facies (F8/13)
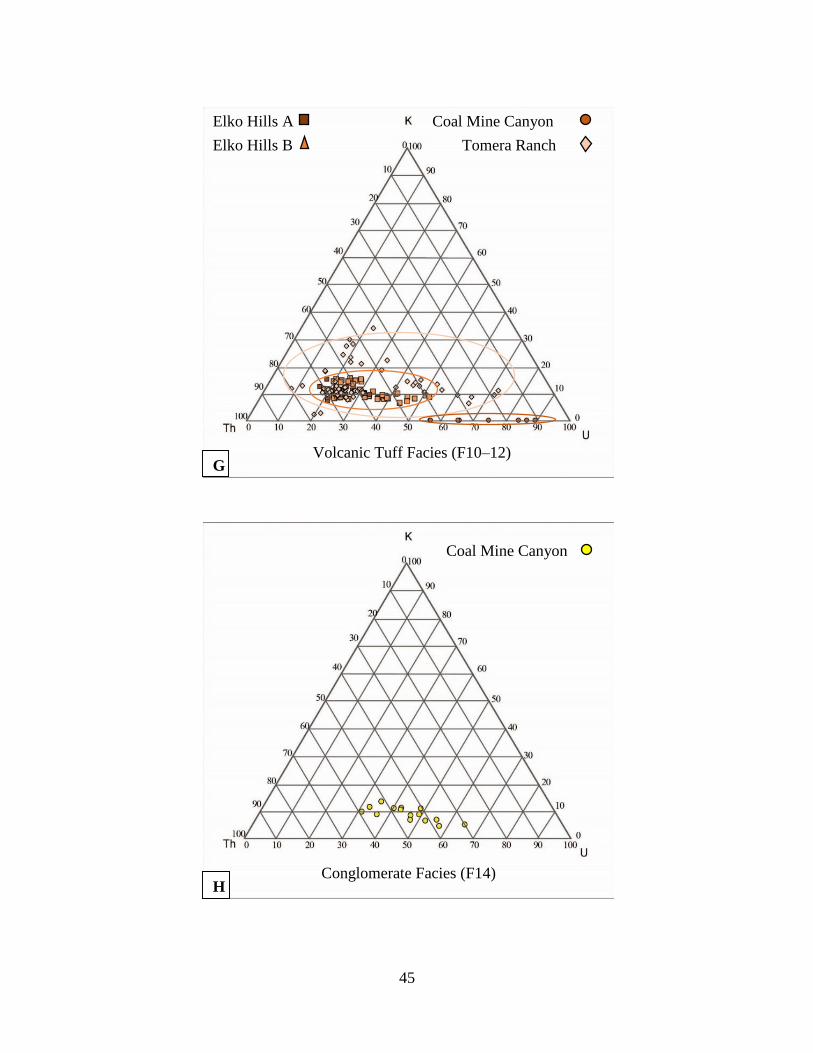
45
Coal Mine Canyon
Conglomerate Facies (F14) H
Coal Mine Canyon
Tomera Ranch Elko Hills B
Elko Hills A
Volcanic Tuff Facies (F10–12) G
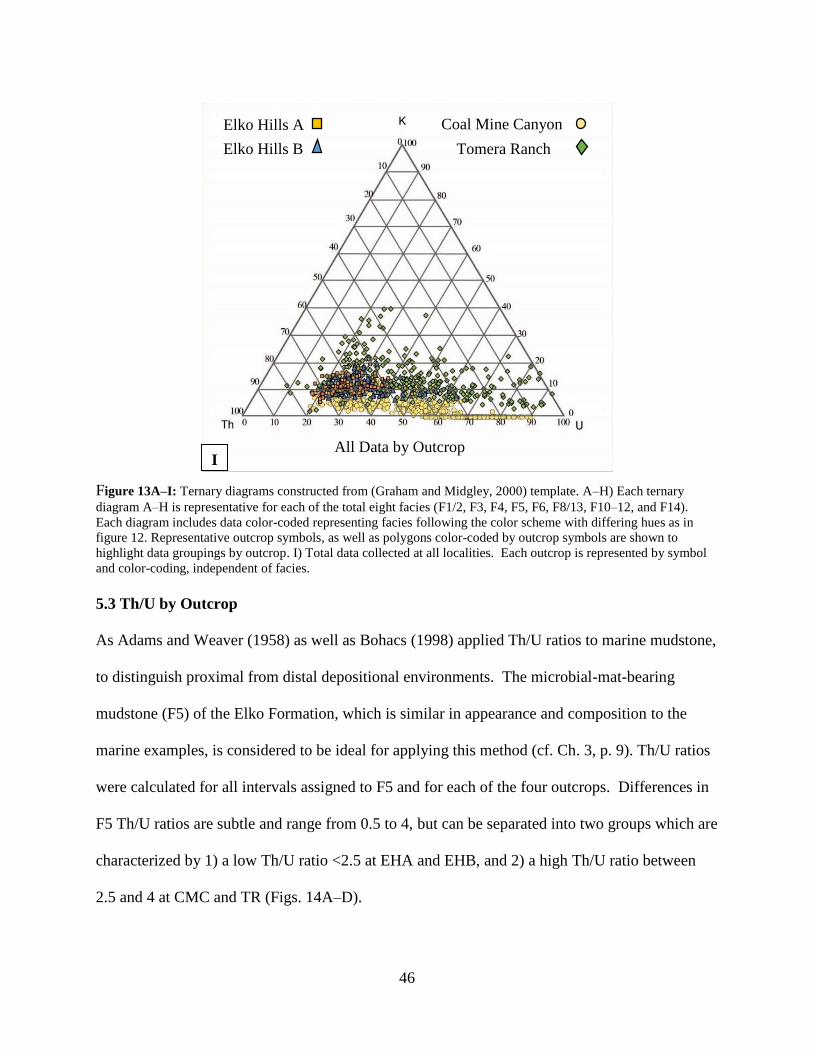
46
Figure 13A–I: Ternary diagrams constructed from (Graham and Midgley, 2000) template. A–H) Each ternary
diagram A–H is representative for each of the total eight facies (F1/2, F3, F4, F5, F6, F8/13, F10–12, and F14).
Each diagram includes data color-coded representing facies following the color scheme with differing hues as in
figure 12. Representative outcrop symbols, as well as polygons color-coded by outcrop symbols are shown to
highlight data groupings by outcrop. I) Total data collected at all localities. Each outcrop is represented by symbol
and color-coding, independent of facies.
5.3 Th/U by Outcrop
As Adams and Weaver (1958) as well as Bohacs (1998) applied Th/U ratios to marine mudstone,
to distinguish proximal from distal depositional environments. The microbial-mat-bearing
mudstone (F5) of the Elko Formation, which is similar in appearance and composition to the
marine examples, is considered to be ideal for applying this method (cf. Ch. 3, p. 9). Th/U ratios
were calculated for all intervals assigned to F5 and for each of the four outcrops. Differences in
F5 Th/U ratios are subtle and range from 0.5 to 4, but can be separated into two groups which are
characterized by 1) a low Th/U ratio <2.5 at EHA and EHB, and 2) a high Th/U ratio between
2.5 and 4 at CMC and TR (Figs. 14A–D).
Coal Mine Canyon
Tomera Ranch Elko Hills B
Elko Hills A
I All Data by Outcrop
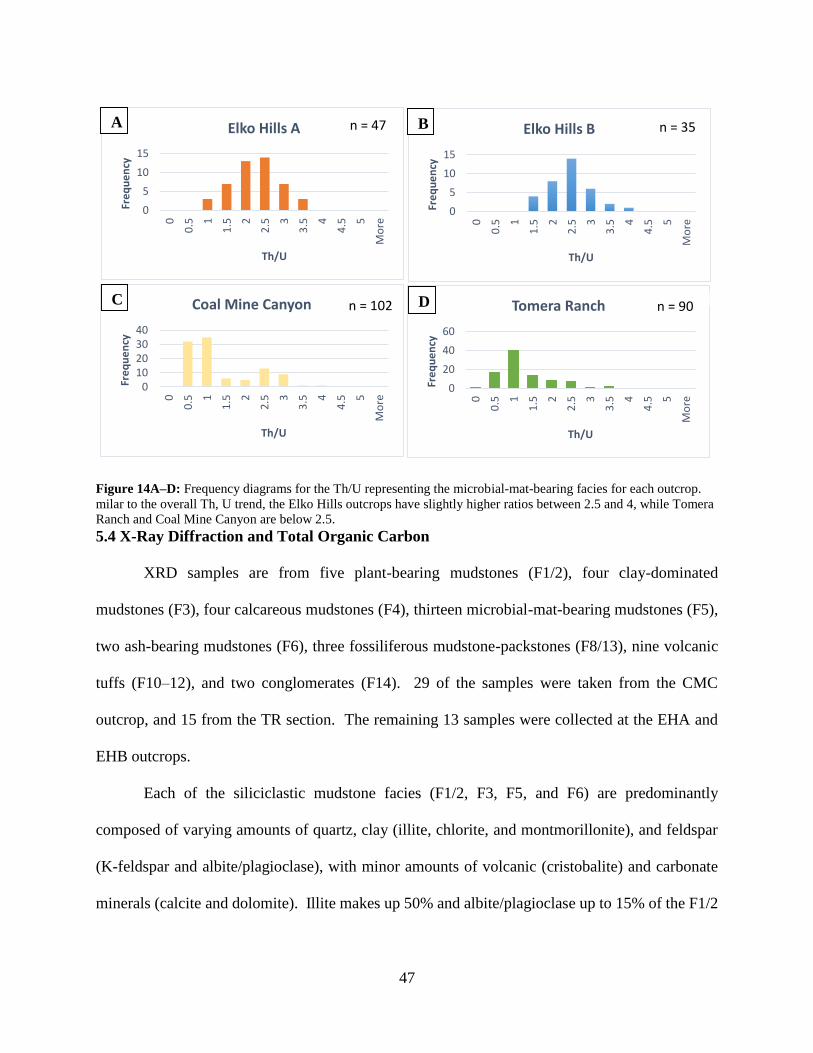
47
Figure 14A–D: Frequency diagrams for the Th/U representing the microbial-mat-bearing facies for each outcrop.
milar to the overall Th, U trend, the Elko Hills outcrops have slightly higher ratios between 2.5 and 4, while Tomera
Ranch and Coal Mine Canyon are below 2.5. 5.4 X-Ray Diffraction and Total Organic Carbon
XRD samples are from five plant-bearing mudstones (F1/2), four clay-dominated
mudstones (F3), four calcareous mudstones (F4), thirteen microbial-mat-bearing mudstones (F5),
two ash-bearing mudstones (F6), three fossiliferous mudstone-packstones (F8/13), nine volcanic
tuffs (F10–12), and two conglomerates (F14). 29 of the samples were taken from the CMC
outcrop, and 15 from the TR section. The remaining 13 samples were collected at the EHA and
EHB outcrops.
Each of the siliciclastic mudstone facies (F1/2, F3, F5, and F6) are predominantly
composed of varying amounts of quartz, clay (illite, chlorite, and montmorillonite), and feldspar
(K-feldspar and albite/plagioclase), with minor amounts of volcanic (cristobalite) and carbonate
minerals (calcite and dolomite). Illite makes up 50% and albite/plagioclase up to 15% of the F1/2
0
5
10
15
0
0.5 1
1.5 2
2.5 3
3.5 4
4.5 5
Mo
re
Fre
qu
en
cy
Th/U
Elko Hills B n = 35
0
5
10
15
0
0.5 1
1.5 2
2.5 3
3.5 4
4.5 5
Mo
re
Fre
qu
en
cy
Th/U
Elko Hills A n = 47A B
010203040
0
0.5 1
1.5 2
2.5 3
3.5 4
4.5 5
Mo
re
Fre
qu
en
cy
Th/U
Coal Mine Canyon n = 102
0
20
40
60
0
0.5 1
1.5 2
2.5 3
3.5 4
4.5 5
Mo
re
Fre
qu
en
cyTh/U
Tomera Ranch n = 90C D
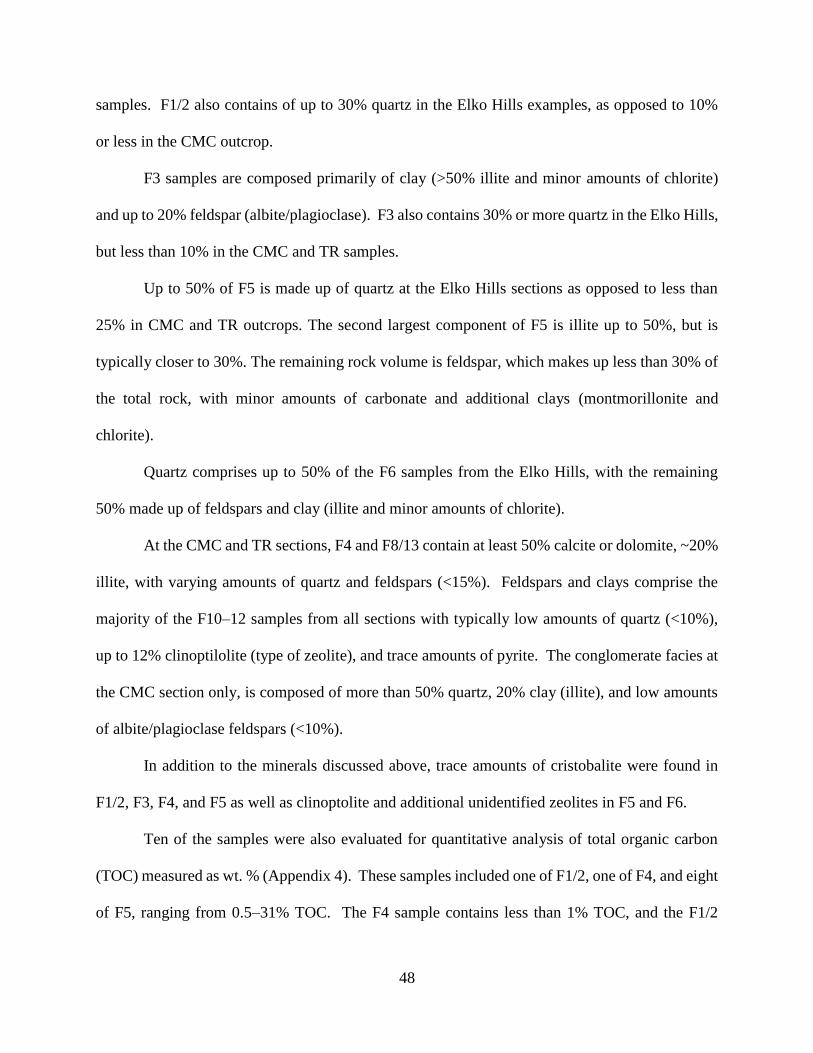
48
samples. F1/2 also contains of up to 30% quartz in the Elko Hills examples, as opposed to 10%
or less in the CMC outcrop.
F3 samples are composed primarily of clay (>50% illite and minor amounts of chlorite)
and up to 20% feldspar (albite/plagioclase). F3 also contains 30% or more quartz in the Elko Hills,
but less than 10% in the CMC and TR samples.
Up to 50% of F5 is made up of quartz at the Elko Hills sections as opposed to less than
25% in CMC and TR outcrops. The second largest component of F5 is illite up to 50%, but is
typically closer to 30%. The remaining rock volume is feldspar, which makes up less than 30% of
the total rock, with minor amounts of carbonate and additional clays (montmorillonite and
chlorite).
Quartz comprises up to 50% of the F6 samples from the Elko Hills, with the remaining
50% made up of feldspars and clay (illite and minor amounts of chlorite).
At the CMC and TR sections, F4 and F8/13 contain at least 50% calcite or dolomite, ~20%
illite, with varying amounts of quartz and feldspars (<15%). Feldspars and clays comprise the
majority of the F10–12 samples from all sections with typically low amounts of quartz (<10%),
up to 12% clinoptilolite (type of zeolite), and trace amounts of pyrite. The conglomerate facies at
the CMC section only, is composed of more than 50% quartz, 20% clay (illite), and low amounts
of albite/plagioclase feldspars (<10%).
In addition to the minerals discussed above, trace amounts of cristobalite were found in
F1/2, F3, F4, and F5 as well as clinoptolite and additional unidentified zeolites in F5 and F6.
Ten of the samples were also evaluated for quantitative analysis of total organic carbon
(TOC) measured as wt. % (Appendix 4). These samples included one of F1/2, one of F4, and eight
of F5, ranging from 0.5–31% TOC. The F4 sample contains less than 1% TOC, and the F1/2

49
measures greater than 25% TOC. The remaining eight F5 samples range from 0.48–31.4%, with
3/4 of them greater than 4.
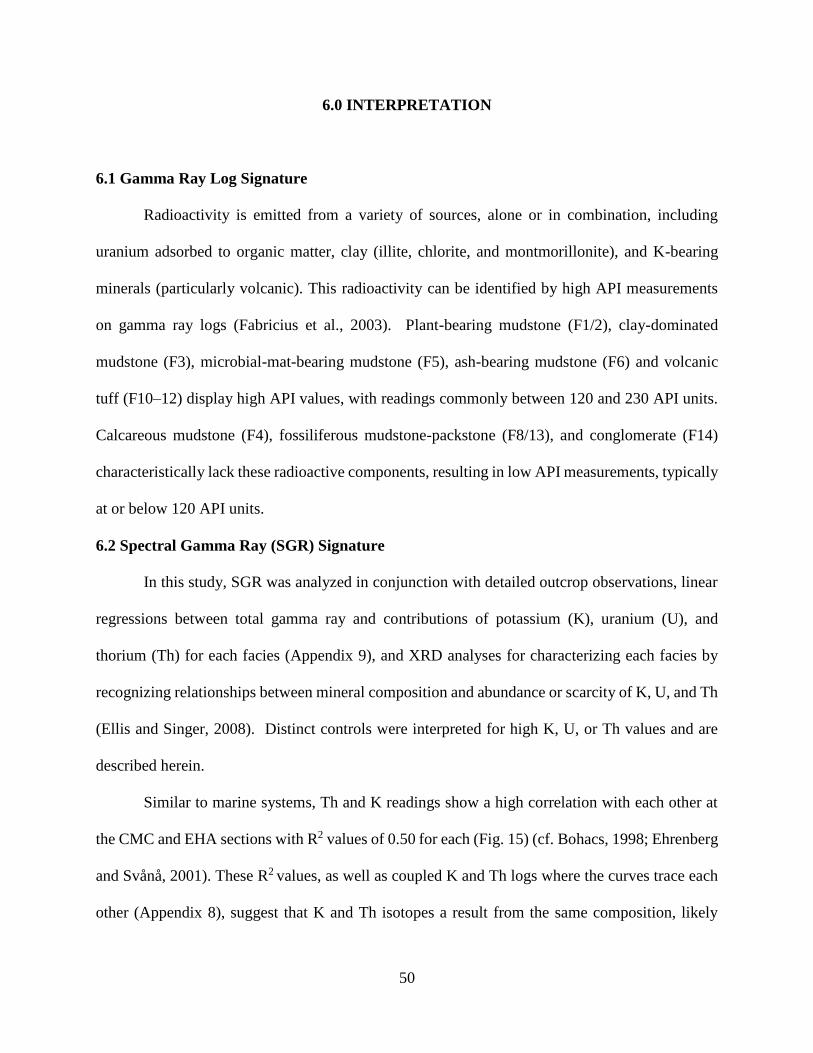
50
6.0 INTERPRETATION
6.1 Gamma Ray Log Signature
Radioactivity is emitted from a variety of sources, alone or in combination, including
uranium adsorbed to organic matter, clay (illite, chlorite, and montmorillonite), and K-bearing
minerals (particularly volcanic). This radioactivity can be identified by high API measurements
on gamma ray logs (Fabricius et al., 2003). Plant-bearing mudstone (F1/2), clay-dominated
mudstone (F3), microbial-mat-bearing mudstone (F5), ash-bearing mudstone (F6) and volcanic
tuff (F10–12) display high API values, with readings commonly between 120 and 230 API units.
Calcareous mudstone (F4), fossiliferous mudstone-packstone (F8/13), and conglomerate (F14)
characteristically lack these radioactive components, resulting in low API measurements, typically
at or below 120 API units.
6.2 Spectral Gamma Ray (SGR) Signature
In this study, SGR was analyzed in conjunction with detailed outcrop observations, linear
regressions between total gamma ray and contributions of potassium (K), uranium (U), and
thorium (Th) for each facies (Appendix 9), and XRD analyses for characterizing each facies by
recognizing relationships between mineral composition and abundance or scarcity of K, U, and Th
(Ellis and Singer, 2008). Distinct controls were interpreted for high K, U, or Th values and are
described herein.
Similar to marine systems, Th and K readings show a high correlation with each other at
the CMC and EHA sections with R2 values of 0.50 for each (Fig. 15) (cf. Bohacs, 1998; Ehrenberg
and Svånå, 2001). These R2 values, as well as coupled K and Th logs where the curves trace each
other (Appendix 8), suggest that K and Th isotopes a result from the same composition, likely
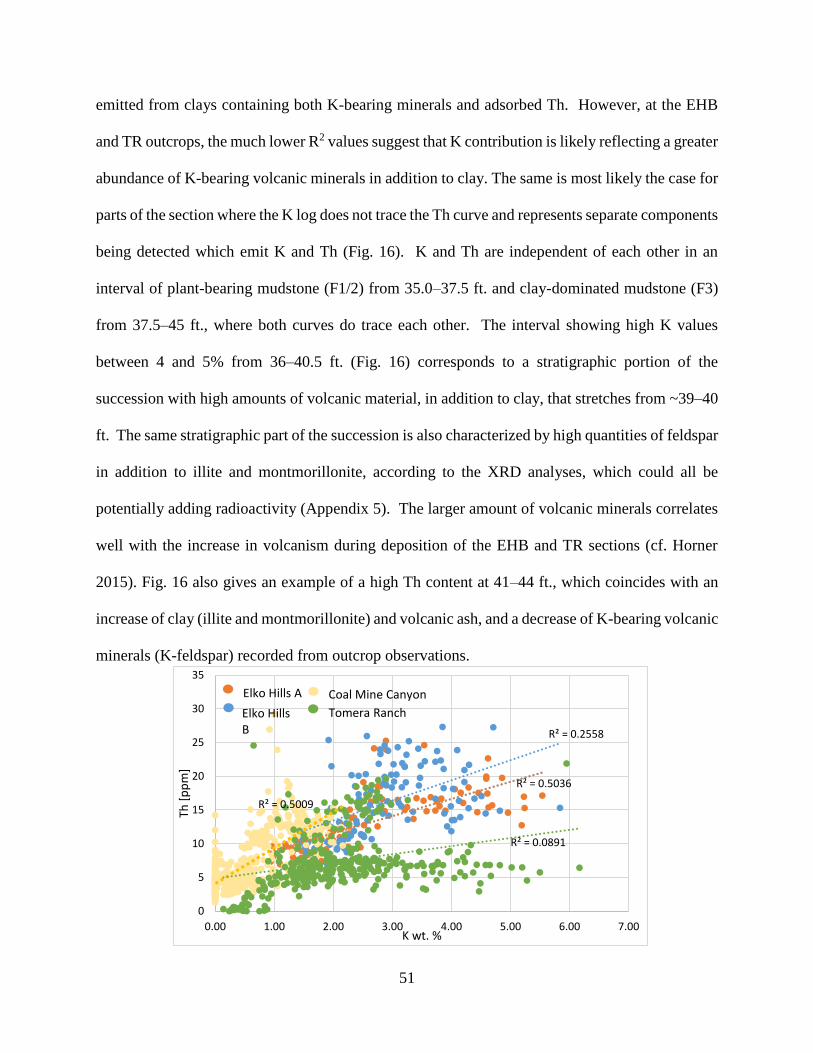
51
emitted from clays containing both K-bearing minerals and adsorbed Th. However, at the EHB
and TR outcrops, the much lower R2 values suggest that K contribution is likely reflecting a greater
abundance of K-bearing volcanic minerals in addition to clay. The same is most likely the case for
parts of the section where the K log does not trace the Th curve and represents separate components
being detected which emit K and Th (Fig. 16). K and Th are independent of each other in an
interval of plant-bearing mudstone (F1/2) from 35.0–37.5 ft. and clay-dominated mudstone (F3)
from 37.5–45 ft., where both curves do trace each other. The interval showing high K values
between 4 and 5% from 36–40.5 ft. (Fig. 16) corresponds to a stratigraphic portion of the
succession with high amounts of volcanic material, in addition to clay, that stretches from ~39–40
ft. The same stratigraphic part of the succession is also characterized by high quantities of feldspar
in addition to illite and montmorillonite, according to the XRD analyses, which could all be
potentially adding radioactivity (Appendix 5). The larger amount of volcanic minerals correlates
well with the increase in volcanism during deposition of the EHB and TR sections (cf. Horner
2015). Fig. 16 also gives an example of a high Th content at 41–44 ft., which coincides with an
increase of clay (illite and montmorillonite) and volcanic ash, and a decrease of K-bearing volcanic
minerals (K-feldspar) recorded from outcrop observations.
R² = 0.5036
R² = 0.2558
R² = 0.5009
R² = 0.0891
0
5
10
15
20
25
30
35
0.00 1.00 2.00 3.00 4.00 5.00 6.00 7.00
Th [
pp
m]
K wt. %
Elko Hills B
Elko Hills A Coal Mine Canyon
Tomera Ranch
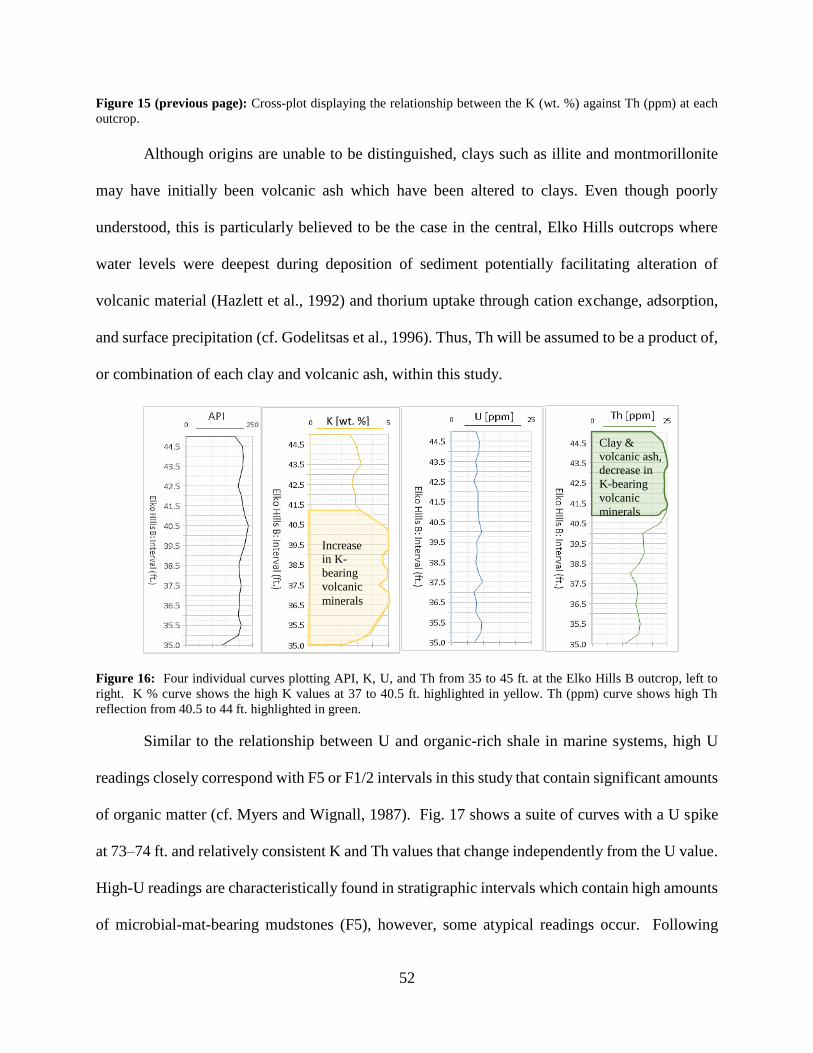
52
Figure 15 (previous page): Cross-plot displaying the relationship between the K (wt. %) against Th (ppm) at each
outcrop.
Although origins are unable to be distinguished, clays such as illite and montmorillonite
may have initially been volcanic ash which have been altered to clays. Even though poorly
understood, this is particularly believed to be the case in the central, Elko Hills outcrops where
water levels were deepest during deposition of sediment potentially facilitating alteration of
volcanic material (Hazlett et al., 1992) and thorium uptake through cation exchange, adsorption,
and surface precipitation (cf. Godelitsas et al., 1996). Thus, Th will be assumed to be a product of,
or combination of each clay and volcanic ash, within this study.
Figure 16: Four individual curves plotting API, K, U, and Th from 35 to 45 ft. at the Elko Hills B outcrop, left to
right. K % curve shows the high K values at 37 to 40.5 ft. highlighted in yellow. Th (ppm) curve shows high Th
reflection from 40.5 to 44 ft. highlighted in green.
Similar to the relationship between U and organic-rich shale in marine systems, high U
readings closely correspond with F5 or F1/2 intervals in this study that contain significant amounts
of organic matter (cf. Myers and Wignall, 1987). Fig. 17 shows a suite of curves with a U spike
at 73–74 ft. and relatively consistent K and Th values that change independently from the U value.
High-U readings are characteristically found in stratigraphic intervals which contain high amounts
of microbial-mat-bearing mudstones (F5), however, some atypical readings occur. Following
K [wt. %]
Increase
in K-
bearing
volcanic
minerals
Clay &
volcanic ash,
decrease in
K-bearing
volcanic
minerals
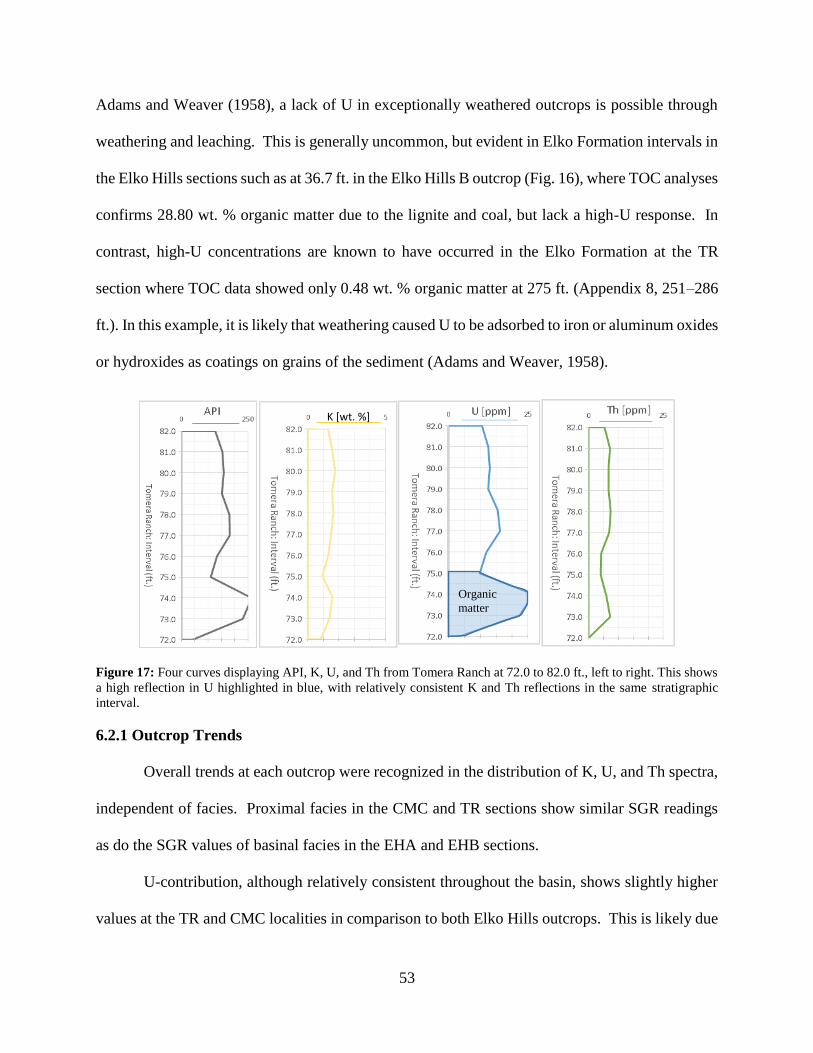
53
Adams and Weaver (1958), a lack of U in exceptionally weathered outcrops is possible through
weathering and leaching. This is generally uncommon, but evident in Elko Formation intervals in
the Elko Hills sections such as at 36.7 ft. in the Elko Hills B outcrop (Fig. 16), where TOC analyses
confirms 28.80 wt. % organic matter due to the lignite and coal, but lack a high-U response. In
contrast, high-U concentrations are known to have occurred in the Elko Formation at the TR
section where TOC data showed only 0.48 wt. % organic matter at 275 ft. (Appendix 8, 251–286
ft.). In this example, it is likely that weathering caused U to be adsorbed to iron or aluminum oxides
or hydroxides as coatings on grains of the sediment (Adams and Weaver, 1958).
Figure 17: Four curves displaying API, K, U, and Th from Tomera Ranch at 72.0 to 82.0 ft., left to right. This shows
a high reflection in U highlighted in blue, with relatively consistent K and Th reflections in the same stratigraphic
interval.
6.2.1 Outcrop Trends
Overall trends at each outcrop were recognized in the distribution of K, U, and Th spectra,
independent of facies. Proximal facies in the CMC and TR sections show similar SGR readings
as do the SGR values of basinal facies in the EHA and EHB sections.
U-contribution, although relatively consistent throughout the basin, shows slightly higher
values at the TR and CMC localities in comparison to both Elko Hills outcrops. This is likely due
Organic
matter
K [wt. %]
54
to U-enrichment within calcareous mudstone (F4) and fossiliferous mudstone-packstone (F8/13)
at CMC and heavy minerals and organic content at the TR section. The abundant, U-enriched
organic and woody debris in contact with lake water resulted in high U values and influenced most
of the facies at CMC, especially fossiliferous mudstone-packstone (F8/13) and calcareous
mudstones (F4). This is likely due to the mobile uranyl ion form of U, which allows transport and
precipitates as uranium salts under reducing conditions (Ch. 3).
Th values were higher in the EHA and EHB outcrops in comparison to the CMC and TR
localities, probably indicating an abundance of weathered clay from volcanic ash, as well as
suggesting the influence of lake water facilitating the subaqueous alteration of the sediment.
K values were low or zero at CMC, but were similar between both the Elko Hills and the
TR outcrops. As K values were attributed to feldspars and K-bearing volcaniclastic minerals, these
values fit well to the depositional model by Horner (2015) where CMC is the oldest of the four
outcrops and volcanism may have only occurred in short pulses toward the later stages of CMC
outcrop deposition and as a result did not influence high-K values as it did for the EHA, EHB, and
TR sections. It should also be noted that K-bearing volcanic minerals within the minimal
volcaniclastic facies (F10–12) samples at the CMC outcrop also exhibit partial to complete
dissolution of these minerals, which could also attribute to the lack in high-K readings (Ch. 7.0).
These outcrop trends are apparent and effect the eight facies described below.
6.2.2 Facies 1/2: Plant-Bearing Mudstone
High K and Th readings (3.5–5.5 wt. % and 14–16 ppm, correspondingly) are likely due to
reworked volcanic tuff (F10–12) stratigraphically overlying the F1/2 intervals at both Elko Hills
outcrops, introducing an abundance of volcanic minerals and volcanic ash (Appendix 6; Figs. 23B
and 23D). As a result, the Elko Hills sections show nearly two times the API values (200–210 API
55
units) of the CMC section (120–130 API units) (Appendix 6, Figs. 23A and 23E). The CMC
outcrop has similar U values as the Elko Hills sections, and they range between 6 and 10 ppm with
several values up to 18 ppm, likely due to the close proximity to the restricted paleo-swamp system
active during the time of deposition of F1/2 (Appendix 6; Figs. 23C and 23G). This paleo-swamp
system is likely contributing abundant plant debris and, therefore, organic material, adding to
higher-U values at the CMC outcrop (cf. Horner, 2015). Following Swanson (1961), peat, lignite,
and wood debris all readily extract and fix U from solution, which is consistent with the
characteristic abundant plant debris for this facies at CMC.
6.2.3 Facies 3: Clay-Dominated Mudstone
SGR measurements for clay-dominated mudstone (F3) show a lateral trend, where values
from both the CMC and TR localities located close to the basin margin are between 120–140 API
units, and values from the two Elko Hills outcrops, thought to represent the basin center are
between 180–200 API units (Appendix 6, Figs. 23H and 23M). The CMC section shows low to
zero K signals, likely due to short pulses of, or at times total lack of, volcanism during deposition,
whereas Elko Hills and TR show similar K values between 2 and 3.5 wt. % (Appendix 6, Figs. 23J
and 23N). The contribution of the K signal is likely a product of volcanic minerals (K-feldspar,
mica), at Elko Hills and TR, as indicated by XRD analyses (Appendix 5). U responses, typically
between 10 and 12 ppm, are likely due to higher amount of organic material deposited in the basin
center by interbedded microbial-mat-bearing mudstone (F5) intervals between the clay-dominated
mudstone (F3), whereas the CMC and TR location responses are between 6 and 8 ppm, suggesting
a lack in U-enriched organic material (Appendix 6, Figs. 23K and 23O). Larger Th values (16–22
ppm) in EHA and EHB suggest greater amounts of volcanic ash and clay than the CMC and TR
sections displaying 6–8 ppm (Appendix 6, Figs. 23L and 23P).
56
6.2.4 Facies 4: Calcareous Mudstone
Due to an overall lack of clay, volcanic minerals, and organic matter, calcareous mudstone
(F4) displays API values commonly within 75–85 API units (Appendix 6, Fig. 23Q). Frequency
diagrams show that the CMC readings reflect little to no K-bearing minerals, whereas TR has at
least 2 wt. % K (Appendix 6, Fig. 23R), indicating that the TR outcrop was most likely affected
by synsedimentary volcanism. Very low-K values in the CMC section can be attributed to the
short pulses of volcanism during the deposition of F4, as previously mentioned in Ch. 6.2.1. The
small amount of K-bearing minerals that were deposited were interpreted as preferentially
dissolved as evidenced by the intraparticle porosity formed by partial to complete dissolution of
feldspar grains observed in thin section (see Ch. 7.0). U values are almost double at CMC in
comparison to TR, which could be due to the close proximity of the source of organic debris
facilitating U-enrichment near the CMC section as opposed to TR (Appendix 6, Fig. 23S) (cf.
Ehrenberg and Svånå, 2001; Horner, 2015). Th concentrations are also slightly higher at the TR
section than at the CMC locality (4–6 ppm versus 6–8 ppm, respectively), most likely indicating
higher amounts of clay and volcanic ash at TR versus the CMC section (Appendix 6, Fig. 23T).
6.2.5 Facies 5: Microbial-Mat-Bearing Mudstone
Microbial-mat-bearing mudstone (F5) is present in each outcrop with a high variability in
API ranges due to localized differences in deposition and weathering and the effect on U
abundance. The Elko Hills’ sections exhibit the thickest microbial-mat-bearing mudstone intervals
and the highest API values, ranging between 100 and 150 units at the EHA location, and 90–120
units at the EHB outcrop, likely due to the great amount of organic matter produced from the
thickest microbial-mats in the center of the basin (Appendix 6, Fig. 23U). The CMC outcrop and
TR recorded values from 70–130 API units, which is an uncharacteristically low value for this
57
facies. This is likely due to the fact that microbial-mats are interbedded with limestone in this
CMC locality and influences the gamma ray readings (see Ch. 3.0). The TR outcrop exhibits a
similarly uncharacteristic minimum of SGR readings as well as an atypical maximum value of 606
API units in these rocks, but values most frequently range from 100–160 API units (Appendix 6,
Fig. 23Y). These extremely high values at the TR section are a result of a 17-ft. section which
underwent intense oxidation exhibiting iron-oxide and hydroxide coatings on grains to which U
isotopes readily adsorb (Adams and Weaver, 1958) (Appendix 8, 251–286 ft.). The Elko Hills
sections show high Th readings (12–14 ppm), suggesting a great abundance of clay (or clay derived
from volcanic ash), which correlates with the increase in volcanism during the time of deposition
of this facies (Appendix 6, Figs. 23X and 23BB). U values are most frequently between 4 and 8
ppm for all four outcrops. Weathering and leaching may have played a role in the few U values
greater than 8 ppm in the Elko Hills (Appendix 6, Figs. 23W and 23AA). Consistent K values
between the Elko Hills and TR localities range from 2–3 wt. % and also confirm an active volcanic
influence during deposition (Appendix 6, Figs. 23V and 23Z).
6.2.6 Facies 6: Ash-Bearing Mudstone
At the CMC location, frequency diagrams show that API values range from 60–90 units,
whereas they show readings between 100 and 140 units at EHA and EHB, and between 100 and
150 units at the TR outcrop. Each outcrop’s API value range is a function of fluctuating amounts
of plant material, volcanic minerals, and clay components (Appendix 6, Figs. 23CC and 23GG)
(cf. Horner, 2015). Both the CMC and TR locations show low amounts of K and Th, which most
likely reflects the minimum overall gamma ray values that F6 shows at these outcrops, suggesting
that weathering leached and removed these elements (Appendix 6, Figs. 23HH and 23JJ). In
contrast, XRD data shows feldspar and zeolites from volcanic glass are present in the Elko Hills
58
outcrops, most likely contributing to their elevated K and Th values (Appendix 5; Appendix 6,
Fig. 23DD). U values decrease from north to south (6–8 ppm at CMC and EHA and EHB, and 4–
6 ppm at TR), suggesting that the organics in this facies are mainly from the paleo-swamp system
near the CMC outcrop. This could be due to the mobile U ions from organic debris and woody
material abundant in the paleo-swamp, decreasing as distance from the CMC section increases
(Appendix 6, Figs. 23EE and 23II). U shows a wider range of data at TR than at the other three
sections, likely due to the iron-oxide and hydroxide oxidation coatings covering the grains. These
coatings most likely adsorbed U in some stratigraphic intervals similar to F5 (cf. Adams and
Weaver, 1958).
6.2.7 Facies 8/13: Fossiliferous mudstone-packstone
Fossiliferous mudstone-packstone (F8/13) is present in the TR and CMC sections,
commonly interbedded with F5, which likely provides U-bearing organic matter mainly
contributing to total values between 80 and 120 API units (Appendix 6, Fig. 23KK). The
significant SGR contrast between these outcrops is the lack of a K signal (<1% in the CMC section
as opposed to 1.5% in the TR section), but strong U signal (8–10 ppm versus 6–8 ppm) at the CMC
outcrop (Appendix 6, Figs. 23LL–23NN). This coupled U-enrichment and K-depletion suggests
diagenetic alteration, in addition to volcanism being a very minor influence of K at this location.
The notably high amounts of U could be due to the amount of time the rock was in contact with
mobile uranyl ions in groundwater (Adams and Weaver, 1958), evidenced by the heavily
diagenetically-altered samples as well as close proximity to the source of wood debris and organics
at the CMC locality. Similar U-enrichment of wackestones were also reported in Ehrenberg and
Svånå (2001) and were found to be a result of diagenesis.
59
6.2.8 Facies 10-12: Volcanic Tuff
F10–12 combines lithic, crystal, and vitric tuffs, all three facies showing consistently high
API values (> 120 API units) due to the overall quantity of radioactive K-bearing minerals (illite,
feldspars, and biotite), reworked clays, volcanic ash, and other accessory minerals from volcanism
(Appendix 6, Figs. 23OO and 23SS). Both Elko Hills outcrops show higher values for Th readings
compared to the readings at the CMC and TR sections (22–26 ppm for both of the Elko Hills
sections and 20–22 ppm for both of the CMC and TR sections, respectively), which suggest
deposition of volcanic glass in deep water may play a role in facilitating volcanic glass and ash
alteration to clays, increasing the Th contribution (Appendix 6, Figs. 23RR and 23VV). As a
product of volcanic glass, zeolite crystals in aqueous solution facilitate the adsorption of Th
through a process of ion-exchange, adsorption, and surface precipitation (Godelitsas et al., 1996),
which could be the case for the Elko Hills sections in the central, “deep” water portion of the lake.
The K signal from F10–12 at the CMC section is very low due to weathering of K-minerals
evidenced by thin section observation and therefore most likely does not contribute much to the
low API values at that locality (Appendix 6, Figs. 23PP and 23TT).
6.2.9 Facies 14: Conglomerate
Conglomerate (F14) API readings at the CMC locality, the only place where this facies
outcrops, most frequently range between 70 and 75 API units (Appendix 6, Fig. 23WW). These
low API readings are here interpreted as a result of the lack of clay or volcanic minerals. K and
Th readings range between 1 and 1.5 % and 4 and 6 ppm, respectively, and are likely the result of
plagioclase and illite contents, respectively, based on XRD analyses (Appendix 6, Figs. 23XX and
23ZZ, Appendix 5). The U-contribution to the F14 rocks likely resulted from the contact with
60
groundwater and the re-distribution of U from U-bearing plant debris which is directly overlying
the alluvial and fluvial conglomerate (Appendix 6, Fig. 23YY) (cf. Horner, 2015).
6.3 Th/U Trends and Basin Application
Although this technique has not been previously applied to a lacustrine basin, general
trends of Th and U distribution could be interpreted and applied in a similar manner as in marine
systems to gain a better understanding of basin extent by lateral changes in Th/U. As clay and
clay derived from volcanic ash are identified as the main control for Th values, and the U signal
closely corresponds to the amount of U-bearing organic matter, Th/U allows for interpreting
central portions of the lake by the amount of clay and organic matter distribution. Ideally, high
amounts of Th indicate large quantities of clay in the central portion of the lake (as well as volcanic
ash altered to clay) and less detrital and carbonate material in contrast to the lake margins. High
abundance of fine-grained sediment such as clay is typically associated with the low-energy,
“deep” portion of a basin (Bohacs, 1998). Consequently, in the Elko Basin, as the distance from
the margin increases, the Th/U ratio increases as well. Low ratio values (<2.5) are indicative of
proximal lake environments, while high ratios (2.5–4) suggest more central, basinward portions of
the lake. XRD data confirm that compositional differences are in fact responsible for these lateral
changes in Th/U in the microbial-mat-bearing mudstones (F5), as the EHA and EHB sections are
composed of higher percentages of quartz and clay (chlorite and illite) in contrast to the CMC and
the TR sections. The CMC and the TR outcrops instead display higher amounts of calcite,
dolomite, and feldspars in comparison to the Elko Hills sections. The central, basinward portion
of the lacustrine Elko Basin represented by the Elko Hills localities may, therefore, reflect the
higher abundance of clay from water-lain ash and tuff, which may have been altered to clays
(Hazlett et al., 1992). Th/U can be used to quantify and differentiate microbial-mat-bearing
61
mudstones (F5) between proximal and “distal” lake outcrops which would be valuable in
recognizing unknown basin localities. Th/U ratios would be useful, for example, if applied to the
Elko basin when drilling exploratory wells as well as a potentially applicable to future small-scale
lake basins.
6.4 X-Ray Diffraction and Total Organic Carbon
XRD analyses show similar clay (illite) contents within plant-bearing mudstone (F1/2) and
clay-dominated mudstone (F3) across all outcrops, but a high quartz and feldspar content only
within the Elko Hills sections. Due to the stratigraphic position of the mudstones, deposited
intermittently between times of volcanism, the source of quartz is likely from the overlying and
interbedded volcanic tuff (F10–12) intervals. Four microbial-mat-bearing mudstone (F5) samples
from the Elko Hills outcrops and eight F5 samples from CMC and TR sections contain traces of
calcite and dolomite. The carbonate content in the TR and the CMC sections is due to being
interbedded with carbonate [calcareous mudstones (F4) or fossiliferous mudstone-packstone
(F8/13)], whereas the carbonate content in the Elko Hills sections likely was brought in from the
margins during a change in lake level or during a storm event.
Illite is the most dominant clay mineral throughout all Elko Formation sections with low
amounts of montmorillonite and kaolinite, which could be a result of weathering from volcanic
glass or K-feldspar. Montmorillonite and kaolinite contents throughout the Elko Formation suggest
that alteration from volcanic glass to bentonite occurred (Compton et al., 1999). Clinoptolite and
unidentified zeolites were also prevalent in the Elko Hills and TR outcrops, but was not found in
examples from the CMC section. These types of zeolites could indicate a different volcanic source
with varying mineral composition or represent a product of alteration with burial depth and
increase in temperature (Ogihara, 2000). Another volcanic mineral, cristobalite, was found
62
primarily in the TR and CMC sections, but not in the Elko Hills localities, which could represent
a volcanic interval that did not outcrop in the Elko Hills sections or had never been deposited at
those locations. XRD analyses contributed evidence to SGR curves, but independently would not
be suffice in interpreting position of the Elko Basin based on examining inorganic content within
facies.
TOC analyses confirmed that abundant organic matter typically correlated with high U
values for seven out of the ten samples. Seven samples (F5 as well as F1/2) analyzed for TOC with
characteristic U values show high amounts of organic content (Appendix 4, Elko Hills 24, 48.5;
CMC 214; TR 73, 122, 204, and 209.5). The other three samples also showed high U readings, yet
coupled with very low TOC contents confirmed by XRD analyses. These samples were a product
of weathering, U-enrichment, or masked by clay. One example of F5 from the TR section at 275
ft. showed the highest U values out of all collected assay data, but showed very low organic matter
content (0.48% TOC), confirming U values as a product of U-bearing iron oxides or hydroxides
for this example. Another example analyzed was from calcareous mudstone (F4) (CMC 252 ft.),
which had <1% TOC, despite its high U signal, concluding this carbonate interval experienced U-
enrichment from U-rich groundwater. A Microbial-mat-bearing mudstone (F5) example from the
Elko Hills B section at 36.7 ft. (refer to Ch. 6.2) had high organic content, however, it did not show
a high U reading. It is therefore likely that the K and Th values were high enough to mask the U
value of the rock or that U was leached from the outcrop exposure due to the soluble and mobile
form of U (Adams and Weaver, 1958).
63
7.0 DIAGENESIS
The facies of the Elko Formation exhibit a plethora of diagenetic phases and evidence of
alteration, especially at the Coal Mine Canyon (CMC) and Tomera Ranch (TR) localities. All
sediments contain authigenic cements, several of them independent of primary lithofacies. Thin
section observation, X-ray diffraction (XRD) analyses, and scanning electron microscope analysis
including investigations with an attached energy dispersive spectrometer (SEM-EDS) were
conducted in order to identify cement phases and porosity types (see Ch. 4 Methodology).
Diagenetic phases and porosity types are described below.
7.1 Carbonate
7.1.1 Calcite
XRD analyses show that calcite cement is sparse, being present in <5% of the rock volume,
typically within the clay-dominated mudstone (F3), calcareous mudstone (F4), fossiliferous
mudstone-packstone (F8/13), and microbial-mat-bearing mudstone (F5). One type of sparry
calcite cement is recognized and is present only at the CMC outcrop. This sparry calcite generally
fills voids between crinkly and wavy mud laminae in F3 and is recognized by equigranular crystals,
~0.08 mm in width (Fig. 18C). Calcite crystals are white to off-white in plane light and high
birefringence pastel colors in cross-polarized light.
7.1.2 Dolomite
A total of four generations (I–IV) of dolomite cement were found, three microcrystalline
and one bladed cement, and each of the four generations is best distinguished from the other
dolomites both under plane and cross-polarized light (Fig. 18B). Dolomite cement is typically
found within fossiliferous mudstone-packstone (F8/13) in the internal void of ostracod skeletal
64
grains, associated with chalcedonic quartz and found within calcareous mudstone (F4), which were
both observed in the CMC and TR sections. Dolomite also occurs within the microbial-mat-
bearing mudstone (F5) and the clay-dominated mudstone (F3) that are found at all localities. Based
on XRD analyses (Appendix 5), the calcareous mudstone (F4) and fossiliferous mudstone-
packstone (F8/13) contain dolomite up to 60% in some cases, however, most samples contain less
than 30% dolomite and the clay-dominated mudstone (F3) and microbial-mat-bearing mudstone
(F5) contain <5% dolomite. SEM-EDS analyses (Appendix 7) confirm that the four types of
dolomite show an increase in the amount of magnesium from dolomite I to III, with dolomite IV
values being similar to dolomite III. Dolomite I–III are microcrystalline dolomite, displaying each
a similar inclusion-poor crystal fabric, but each of them also has a specific, identifying coloring in
addition to the successive increase in magnesium. Dolomite I is irregularly shaped, cloudy and
relatively colorless to light brown with an average of 7.73 wt. % Mg. Dolomite II forms an
isopachous rim up to 0.10 mm in width and is light brown with yellow undertones with an average
of 7.99 wt. % Mg. Dolomite III also forms an isopachous rim, up to 0.02 mm in width displaying
a light tan color with yellow undertones and the highest average wt. % Mg of 17.81. Dolomite IV
exhibits colorless subhedral to euhedral bladed crystals up to 0.05 mm in length and 0.02 mm
wide, and contains a similar average Mg wt. % as dolomite III of 17.00.
7.2 Quartz
Quartz is found primarily within the fossiliferous mudstone-packstone (F8/13) and
calcareous mudstone (F4) at the CMC and TR sections. Based on XRD analysis, F8/13 samples
from CMC and TR typically contain up to 5% quartz, with the exception of almost 50% in one F4
sample from the CMC section. Two generations of chalcedonic quartz cement have been
identified: radial and cryptocrystalline (Fig. 18A). Both types of chalcedony fill shelter porosity
65
within F8/13 and, less commonly, fractures. The first generation forms cryptocrystalline
chalcedonic cement, in places present as an isopachous rim that can be up to 0.003 mm thick.
Cryptocrystalline chalcedonic fabric is recognized by its radial habit under cross-polarized light
(Fig. 18A). The more predominant second generation (present with or without the first
generation), radial chalcedony, exhibits a well-defined radial habit identifiable under cross-
polarization and reaches up to 0.01 mm in both length and width (Figs. 18A and 18B).
7.3 Zeolites
White or off-white acicular zeolite crystals are typically 0.01 mm wide and up to 0.05 mm
long occurring on the outer margin of roundish voids in a volcanic glass matrix in volcanic tuff
(F10–12) exclusively at the Elko Hills and TR localities, and in two microbial-mat-bearing
mudstone samples, according to XRD analyses (Figs. 18D and 18E). Zeolite cements including
clinoptolite comprise up to 10–15% of F10–12 and ~2–8 % of F5 based on XRD data (Appendix
5).
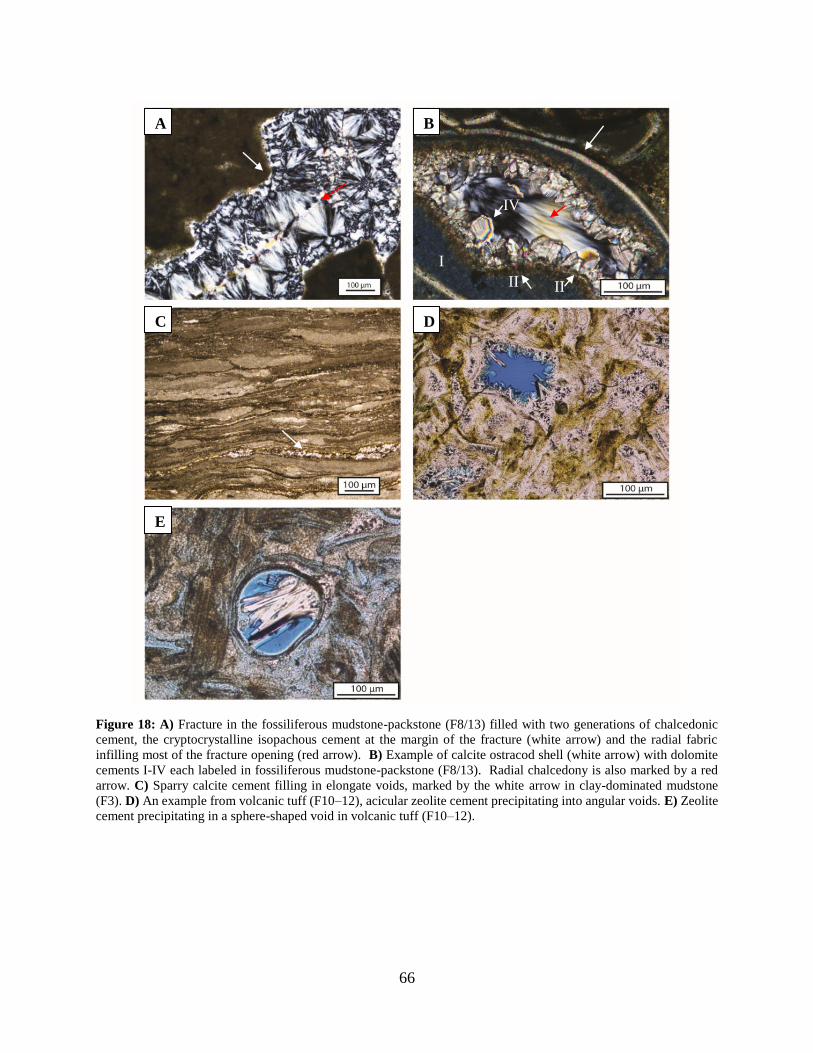
66
Figure 18: A) Fracture in the fossiliferous mudstone-packstone (F8/13) filled with two generations of chalcedonic
cement, the cryptocrystalline isopachous cement at the margin of the fracture (white arrow) and the radial fabric
infilling most of the fracture opening (red arrow). B) Example of calcite ostracod shell (white arrow) with dolomite
cements I-IV each labeled in fossiliferous mudstone-packstone (F8/13). Radial chalcedony is also marked by a red
arrow. C) Sparry calcite cement filling in elongate voids, marked by the white arrow in clay-dominated mudstone
(F3). D) An example from volcanic tuff (F10–12), acicular zeolite cement precipitating into angular voids. E) Zeolite
cement precipitating in a sphere-shaped void in volcanic tuff (F10–12).
I
II II
IV
A B
C D
E
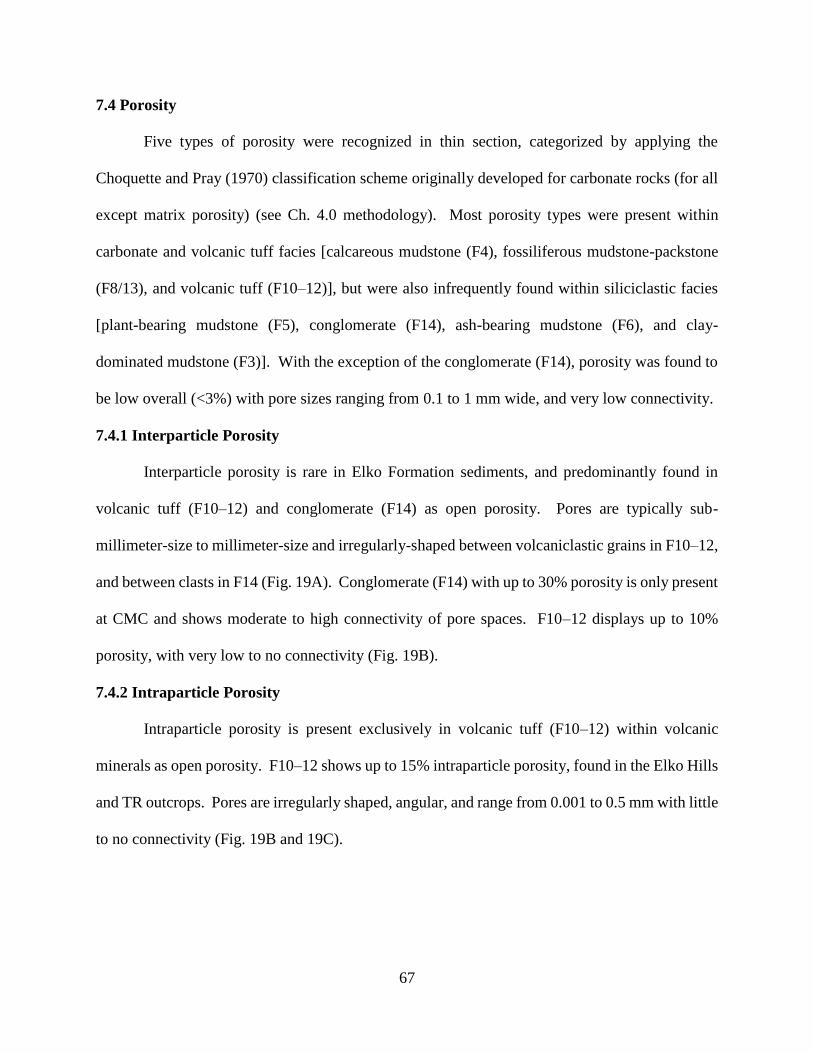
67
7.4 Porosity
Five types of porosity were recognized in thin section, categorized by applying the
Choquette and Pray (1970) classification scheme originally developed for carbonate rocks (for all
except matrix porosity) (see Ch. 4.0 methodology). Most porosity types were present within
carbonate and volcanic tuff facies [calcareous mudstone (F4), fossiliferous mudstone-packstone
(F8/13), and volcanic tuff (F10–12)], but were also infrequently found within siliciclastic facies
[plant-bearing mudstone (F5), conglomerate (F14), ash-bearing mudstone (F6), and clay-
dominated mudstone (F3)]. With the exception of the conglomerate (F14), porosity was found to
be low overall (<3%) with pore sizes ranging from 0.1 to 1 mm wide, and very low connectivity.
7.4.1 Interparticle Porosity
Interparticle porosity is rare in Elko Formation sediments, and predominantly found in
volcanic tuff (F10–12) and conglomerate (F14) as open porosity. Pores are typically sub-
millimeter-size to millimeter-size and irregularly-shaped between volcaniclastic grains in F10–12,
and between clasts in F14 (Fig. 19A). Conglomerate (F14) with up to 30% porosity is only present
at CMC and shows moderate to high connectivity of pore spaces. F10–12 displays up to 10%
porosity, with very low to no connectivity (Fig. 19B).
7.4.2 Intraparticle Porosity
Intraparticle porosity is present exclusively in volcanic tuff (F10–12) within volcanic
minerals as open porosity. F10–12 shows up to 15% intraparticle porosity, found in the Elko Hills
and TR outcrops. Pores are irregularly shaped, angular, and range from 0.001 to 0.5 mm with little
to no connectivity (Fig. 19B and 19C).
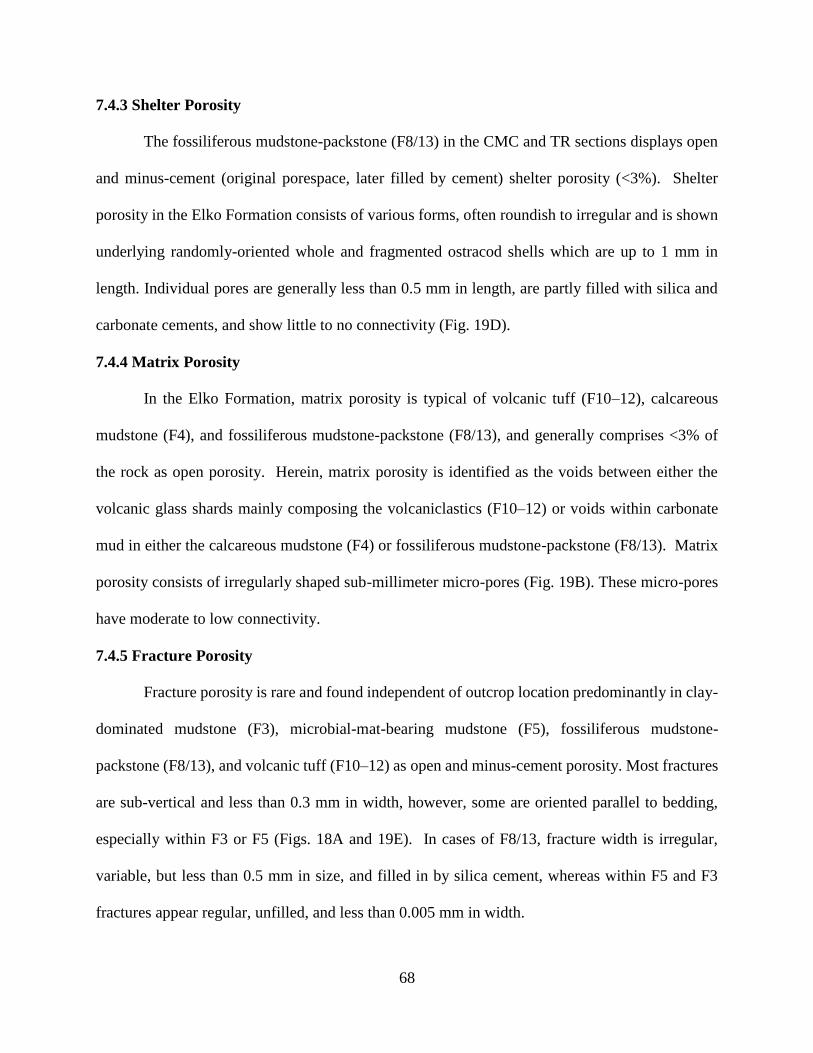
68
7.4.3 Shelter Porosity
The fossiliferous mudstone-packstone (F8/13) in the CMC and TR sections displays open
and minus-cement (original porespace, later filled by cement) shelter porosity (<3%). Shelter
porosity in the Elko Formation consists of various forms, often roundish to irregular and is shown
underlying randomly-oriented whole and fragmented ostracod shells which are up to 1 mm in
length. Individual pores are generally less than 0.5 mm in length, are partly filled with silica and
carbonate cements, and show little to no connectivity (Fig. 19D).
7.4.4 Matrix Porosity
In the Elko Formation, matrix porosity is typical of volcanic tuff (F10–12), calcareous
mudstone (F4), and fossiliferous mudstone-packstone (F8/13), and generally comprises <3% of
the rock as open porosity. Herein, matrix porosity is identified as the voids between either the
volcanic glass shards mainly composing the volcaniclastics (F10–12) or voids within carbonate
mud in either the calcareous mudstone (F4) or fossiliferous mudstone-packstone (F8/13). Matrix
porosity consists of irregularly shaped sub-millimeter micro-pores (Fig. 19B). These micro-pores
have moderate to low connectivity.
7.4.5 Fracture Porosity
Fracture porosity is rare and found independent of outcrop location predominantly in clay-
dominated mudstone (F3), microbial-mat-bearing mudstone (F5), fossiliferous mudstone-
packstone (F8/13), and volcanic tuff (F10–12) as open and minus-cement porosity. Most fractures
are sub-vertical and less than 0.3 mm in width, however, some are oriented parallel to bedding,
especially within F3 or F5 (Figs. 18A and 19E). In cases of F8/13, fracture width is irregular,
variable, but less than 0.5 mm in size, and filled in by silica cement, whereas within F5 and F3
fractures appear regular, unfilled, and less than 0.005 mm in width.
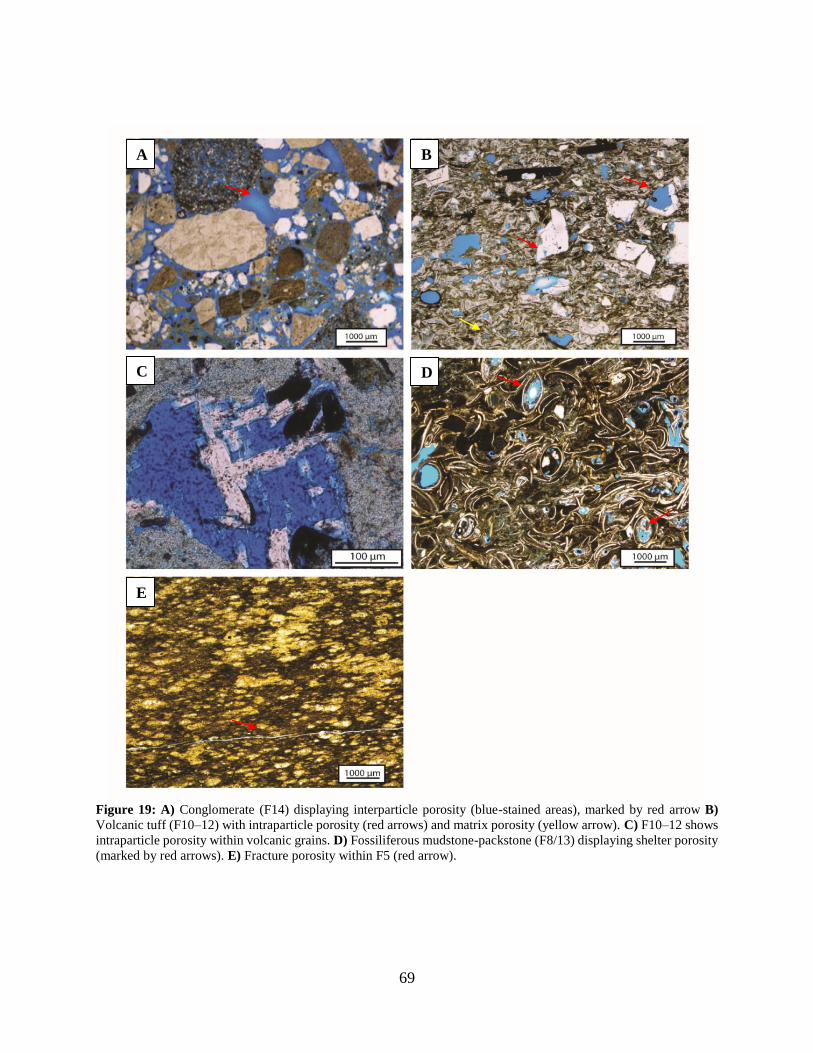
69
Figure 19: A) Conglomerate (F14) displaying interparticle porosity (blue-stained areas), marked by red arrow B)
Volcanic tuff (F10–12) with intraparticle porosity (red arrows) and matrix porosity (yellow arrow). C) F10–12 shows
intraparticle porosity within volcanic grains. D) Fossiliferous mudstone-packstone (F8/13) displaying shelter porosity
(marked by red arrows). E) Fracture porosity within F5 (red arrow).
A B
C D
E
70
7.5 Relative Timing
Textural relationships and overgrowth of diagenetic components can be used to determine
their relative timing within the Elko Formation (Fig. 20). Based on this method, the interpretation
and succession of the diagenetic cements and porosities within this Tertiary unit are described
below.
7.5.1 Calcite
It is likely that the calcite present in the Elko Formation precipitated as a result of an
introduction of calcite-rich waters in this meteoric environment (cf. Moore, 2001). Because
microcracks likely formed by dewatering of sediment (cf. Flügel, 2004), calcite is also assumed to
be a product of post-deposition and burial, although the timing of its formation is unclear.
7.5.2 Dolomite
Each of the four types of dolomite cement is considered post-depositional in origin,
generally found succeeding one another, precipitating into shelter porosity in fossiliferous
mudstone-packstone (Fig. 18B). Based on overgrowth relationships and SEM analyses (Appendix
7), dolomite I reflects the first generation, typically found precipitating directly on microcrystalline
calcite ostracod shells. Dolomite II, III, and IV followed sequentially by overgrowth and represent
the second, third, and fourth generation of dolomite cement, respectively.
7.5.3 Quartz
Both generations of chalcedonic quartz, cryptocrystalline and radial, are authigenic and
most likely reflect two generations of silica-enriched fluids that migrated through the rocks during
burial. Following microcrystalline dolomite I–IV, chalcedonic quartz cement precipitated into
shelter or fracture porosity. It is likely that the rock was lithified in order to be fractured, so the
precipitation of silica cements most likely occurred at significant depth during burial. In the Elko
71
Formation sediment, cryptocrystalline chalcedony cement is typically found as a precursor to
radial chalcedony. Cryptocrystalline and radial chalcedony likely represent length-fast and length-
slow chalcedony, respectively. Length-slow (or “quartzine”) indicates a slower polarized light
component produced by the fibers parallel to crystal length formed by replacement of carbonate
minerals, whereas length-fast indicates fibers perpendicular to the c-axis of the crystals (Folk and
Pittman, 1971). Silica precipitation probably originated from silica-enriched groundwater where
sources of silica were most likely dissolved quartz or feldspar grains (cf. Yang et al., 2015), or
volcanic minerals (i.e. cristobalite) (cf. Schubel and Simonson, 1990; Heaney, 1993).
7.5.4 Zeolite
Acicular zeolite cement predominantly occurs in the volcanic tuffs (F10–12) as well as two
microbial-mat-bearing mudstones (F5) based on XRD analyses, and represents a product of post-
deposition and burial, infilling primary matrix porespace and vesicles. Vesicles appear as unfilled
spheres sub-millimeter in size, forming between volcanic grains, likely as a product of
devitrification (cf. Gondé et al., 2011). XRD analyses (Appendix 5) identifies clinoptolite as well
as other unidentifiable zeolites within the Elko Hills and TR sections, reflecting the increase in
volcanism during the time of sediment deposition. Following Ogihara (2000), burial diagenesis
allows clinoptolite to form from volcanic glass via cation exchange of K, Na, or Ca. In lake
systems, volcanic glass is assumed to increase the pH of neutral water creating an alkaline-rich
system. When volcanic glass shards react with highly alkaline water, they produce a gel, which
over time crystallizes as zeolite cement (Leggo et al., 2001). Burial diagenesis alters clinoptolite
further to analcime and/or heulandite (Utada, 2001) which most likely comprises the unidentified
zeolites found in both the Elko Hills and TR sections. As acicular zeolite cement precipitates
72
mainly into the matrix porosity and vesicles within F10–12, the timing of the zeolite cements
remains unclear within the sediments of the Elko Formation.
7.5.5 Porosity
Two of the five types of porosity are primary, shelter and interparticle, i.e., porosity formed
during deposition (cf. Choquette and Pray, 1970). Although matrix porosity is typically found as
secondary porosity in the Elko Formation, it is too considered primary in the volcanic tuff (F10–
12), occurring only within welded to poorly welded glass shards and ash formed during deposition.
Interparticle porosity is mainly present within conglomerate (F14) as a product of deposition of
gravel-size clasts, while the shelter porosity in the Elko Formation formed in fossiliferous
mudstone-packstone (F8/13) from ostracod and skeletal grains shielding infill of sediment during
burial. Intraparticle, matrix [in calcareous mudstone (F4), ash-bearing mudstone (F6), and
fossiliferous mudstone-packstone (F8/13)], and fracture porosity were most likely created after
deposition and are herein considered secondary that may have formed at any time throughout the
diagenetic history of the Elko Formation.
In the volcanic tuffs (F10–12), the amount of intraparticle porosity varies as a result of
partial or complete dissolution of feldspar grains. Preferential dissolution of feldspar grains can
be facilitated through acidic waters at low temperatures, altering the feldspar to kaolinite, and
eventually smectite so that secondary porosity can develop (Yang et al., 2015). Secondary matrix
porosity appears to be a product of dissolution from mixing of meteoric and acidic waters common
in vadose or phreatic environments (Moore, 2001). In the Elko Formation, it is likely that these
two types of water were saturated either with volcanic minerals within calcareous mudstone (F4)
on the one hand, and from fossiliferous mudstone-packstone (F8/13) on the other hand. Fracture
porosity in microbial-mat-bearing mudstone (F5), clay-dominated mudstone (F3), fossiliferous
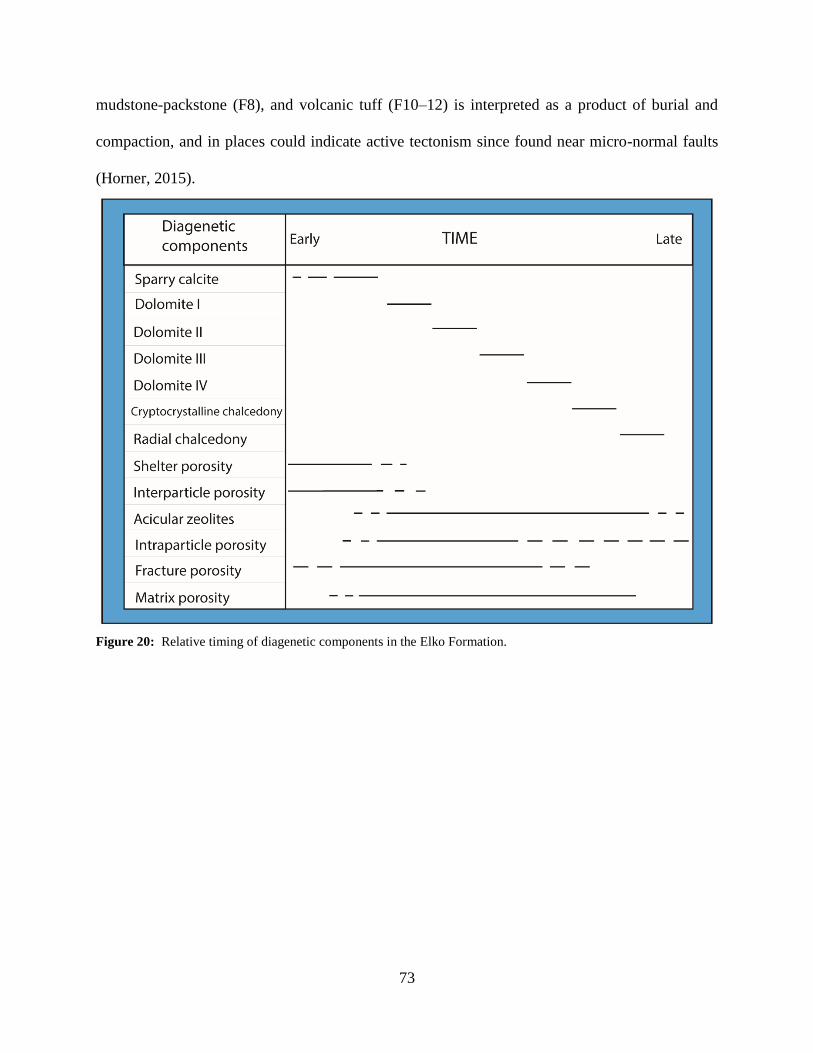
73
mudstone-packstone (F8), and volcanic tuff (F10–12) is interpreted as a product of burial and
compaction, and in places could indicate active tectonism since found near micro-normal faults
(Horner, 2015).
Figure 20: Relative timing of diagenetic components in the Elko Formation.
74
8.0 DISCUSSION
8.1 Pitfalls of gamma ray spectrometry
One of the purposes of compiling 979 spectral gamma ray (SGR) readings with a portable
spectrometer was to evaluate the effectiveness of this methodology as an in-situ, time-efficient,
and cost-effective means of characterizing the gamma ray signal of the upper Elko Formation. In
accordance with Serra (1984) and Blum et al. (1997), collected SGR data proved useful to further
understand sediment composition, diagenesis, and origin, by understanding the inorganic or
organic constituents which were the source of radioactive elements (K, U, and Th). SGR data
represents a direct method to characterize the gamma ray signature of facies based on their
potassium (K), thorium (Th), and uranium (U) abundance derived from their geochemical and
radiometric attributes (Slatt et al., 1992; Ehrenberg and Svånå, 2001; Guagliardi et al., 2013).
Although the gamma ray spectrometer was useful in characterizing the eight facies of the Elko
Formation, issues arose, specifically that data is missing from covered intervals and there was
inherent uncertainty of reading interference between facies in close proximity.
For SGR data collection, an ideal situation would be a planar, unweathered outcrop surface,
as it presents the least amount of disruption for the most accurate readings (Myers and Wignall,
1987). Most of the time, artifacts of weathering were avoided, except at the TR section where most
likely uranium adsorbed onto iron oxides on the sediment surface greatly affected the data and
gave anomalous high U readings in a 35-ft. interval (cf. Adams and Weaver, 1958; Dickson and
Scott, 1997) (Appendix 8, TR at 251–286 ft.). Intervals covered by vegetation, or modern soil that
could not be excavated, resulted in intervals of missing data. Lastly, interference between facies
is a potential source of error, due to the radius in which the gamma ray spectrometer detector takes
75
readings. This could result in false facies readings to be influenced by radioactivity from an over-
or underlying facies in close proximity to the target facies. This interference was often unavoidable
due to the nature of the detector and the stratigraphic interval thickness in some places. Due to
these variables, frequency distribution diagrams were useful to narrow down the range of values
for an assigned facies, eliminating uncommon and likely anomalous values (Appendix 6).
Nevertheless, of these potential and actual reading errors, only the U adsorption would potentially
lead to unexpectedly high SGR readings. As weathering crusts are generally obvious and oxidation
visibly alters the rock in outcrop and would be noted during fieldwork, it is speculated that most
of the measured and documented values are too low rather than too high. This should be taken into
account when recovering core from an oil well, which may in places show higher readings than
the outcrops because of the lack of weathering.
8.2 Comparison of gamma ray readings with similar previous studies
In the present study of Elko Formation strata, SGR detects K, U, and Th that predominantly
reflects the amount of K-bearing volcanic minerals (feldspars, mica, and illite), organic material,
and clay abundance, respectively. Previous studies (Adams and Weaver, 1958; Ehrenberg and
Svånå, 2001; Svendsen and Hartley, 2001; Fabricius et al., 2003; Guagliardi et al., 2013) reported
similar findings despite their research being based on marine successions. In these studies, K and
Th are typically associated with clays, and K with feldspar, while U abundance is driven by the
amount of organic matter and phosphate in the rocks. One of the few lacustrine examples (Bohacs,
1998) showed similarities between controls of K and Th, but did contrast with what components
of the rock affected the U readings. Although his results were not based on a specific alkaline lake
system, he determined that detrital volcaniclastic sands, heavy minerals, and volcanic ash
controlled K, U, and Th contributions, respectively (Bohacs, 1998). Following Bohacs (1998), the
76
composition of the lacustrine Elko Formation suggests that volcanic minerals, including feldspars,
did contribute to the majority of the K readings, especially within the Elko Hills and TR outcrops.
As the water-lain ash was likely altered to clays (cf. Hazlett et al., 1992), the contribution of the
Th values could potentially be considered from volcanic ash as well (cf. Bohacs, 1998). In contrast
to Bohacs (1998), the Elko Formation is rich in organic matter, and variations in the amount of
organic matter corresponds to the U readings. Bohacs (1998) found that heavy minerals influenced
the U readings at least as much as the organic content of the sediment based on the assumption
that freshwater systems exhibit a low concentration of organic material. The palustrine-lacustrine
environment and microbial-mats of the Elko Formation provided substantial amounts of organic
material which allowed for mobile U isotopes to be fixed (cf. Fabricius et al., 2003). Therefore, a
low concentration of U in lake systems may generally explain low SGR U-readings, but these may
not apply to all facies within a lake, especially in small-lake systems.
8.3 Diagenetic effect on gamma ray readings
It was expected that the various types of diagenesis may strongly influence SGR readings,
even of the same facies, because the signal may have been heavily altered by calcite-filled fractures
e.g in clay-dominated mudstone (F3) or microbial-mat-bearing mudstone (F5). Such calcite-filled
fractures in great amounts could lower an otherwise high gamma ray reading as carbonate typically
shows low SGR signals. Nevertheless, in this study, significant volumes of highly-altered rock
were absent and suggests that diagenesis did not change the gamma ray signature of the Elko
Formation strata significantly. As diagenetic phases make up a maximum of <10% of the rock
volume at most, it was not found in enough abundance to interfere with or give false low gamma
ray readings for facies with typically high radioactivity. Most alteration occurred within the
carbonate facies [calcareous mudstones (F4) and fossiliferous mudstone-packstone (F8/13)].
77
Some alteration occurred in the microbial-mat-bearing mudstone (F5) and clay-dominated
mudstone (F3), where dolomite replaces calcite; however, this replacement would not affect the
gamma ray signal as the readings would remain relatively low. However, 17 ft. of carbonate facies
(F4 and F8/13) interbedded with microbial-mat-bearing mudstone (F5) at the CMC outcrop
(Appendix 8, 229–246 ft.) exhibit higher than typical U readings. The 17-ft. interval of the CMC
section was likely subject to U-enrichment due to its close proximity to the palustrine-lacustrine
swamp source likely providing abundant readily available U adsorbed to organic material, whereas
the proximal TR section furthest from the swamp source did not show any similarly U-enriched
intervals. Diagenetic transfer of U from overlying organic matter-rich material is most likely the
cause of high U values coinciding with low K values in this part of the CMC succession (in
comparison to the same facies at the TR section). Low K readings in this stratigraphic interval,
only in the CMC section, are likely from K-depletion in which feldspars have been dissolved partly
or completely in early stages of weathering (Yang et al., 2015). K-depletion supports heavy
alteration throughout this carbonate facies interval in addition to the minor volcaniclastic input
during deposition. A similar pattern reflecting enrichment of U in a carbonate interval was reported
from Ehrenberg and Svånå (2001) in a study focusing on spectral gamma ray signatures of
stratigraphic surfaces in a shallow-water carbonate environment. Ehrenberg and Svånå (2001)
found that a carbonate interval that likely experienced subaerial exposure during a sea level
lowstand also showed high U readings. In their model, mobile, oxidized U from U-enriched
groundwater became fixed to the argillaceous strata deposited during the sea-level lowstand.
Although, the carbonate facies in this CMC section could have been subaerially exposed, there is
no direct evidence to support this.
78
8.4 Application of Th/U ratios to analyze lacustrine basin extents
As shown in this study, as distance from margins increases, the Th/U ratio increases as well
for the Elko Formation microbial-mat-bearing mudstone (F5), ranging between 0 and 4. In
contrast, previous studies conducted on marine environments show that the Th/U ratio decreases
as distance from the basin margins increases and displays larger extremes of Th/U ratios, ranging
from less than 0.02 to greater than 21 (Koczy, 1949; Adams and Weaver, 1958; Bohacs, 1998;
Doveton and Merriam, 2004). These studies have shown that for mudstones in a marine basin, U
values are high in the central part of the basin where low-energy, less-oxygenated conditions exist
as opposed to the basin margins which would not have the same concentration of organic matter.
In contrast, Th values of mudstones are low in the central part of the basin, where little clastic,
terrigenous material would be transported (Adams and Weaver, 1958; Bohacs, 1998).
The Elko Formation is a small-lake system with an unknown, but likely shallow depth
within the photic zone, based on the presence of microbial mats (Horner, 2015). The concept
behind the Th/U ratios is to understand the basin extent of the Elko Formation by distribution of
organic and inorganic sediment composition. The usage of the Th/U ratio, though, differs from its
marine counterparts. Although average values for Th and U vary slightly between vertical
stratigraphic intervals of microbial-mat-bearing mudstones (F5), each individual outcrop exhibits
similar Th/U ratios overall with regards to their proximal or distal position in the basin. Th values,
rather than U as in marine systems, are the greater control of the Th/U ratios in the Elko Formation
due to the alteration of volcanic ash to clay in the central portions of the basin, as well as Th not
having a soluble and mobile form equivalent to U. The central Elko Hills locations show Th/U
ratios that are consistently higher (> 2.5–4) than Th/U ratios at the more proximal CMC and TR
sections (<2.5; Fig. 14A–D in Ch. 5). Although the Th/U ratio is not as dramatically different as
79
for cases described by Adams and Weaver (1958) and is typically <4, low magnitude ratios are
likely directly linked to the size of the lake, water depth, and relatively low U values of organic-
rich microbial mats, and lacustrine mudstones in general, as opposed to marine mudstones, which
in some examples exceed a ratio of 20. The influence of water depth in the central portions of the
lake may play an integral part in the volcanic ash altering into clay, thereby increasing the amount
of Th adsorption, whereas in the shallow-water margins, this would be less likely (cf. Godelitsas
et al., 1996) (refer to Ch. 6.2).
8.5 Assigned facies
Earlier studies applied handheld gamma ray spectrometers to outcrops exclusively in
marine systems focusing on economic black shale, resulting in readings which could be easily
discerned from other lithologies due to their overall high radioactivity (greater than 200 API).
(Krystinak, 2003; Aufill, 2007). In contrast, handheld gamma ray spectrometer application to the
Elko Formation lacustrine strata focused on the economically important microbial-mat-bearing
mudstone (F5) as well as on seven additional facies. General composition of these eight facies
were at times complicated by small amounts of radioactive materials, specifically K-bearing
volcanic minerals or U-bearing wood debris, which recorded values outlying the most commonly
recorded ranges. Frequency distribution charts (Appendix 6) enabled distinction between SGR
readings of these facies, and also emphasized the outcrop position in the basin and the influence
that lake position had on the distribution of these radioactive materials.
Based on thin section and XRD analyses, facies of the Elko Hills and TR sections and
intervals in close proximity to the volcanic tuff (F10–12) were found to likely have been influenced
by K-bearing and heavy minerals, such as these present in the microbial-mat-bearing mudstone
(F5), clay-dominated mudstone (F3), and plant-bearing mudstone (F1/2). Another significant
80
constituent of the rock that could also have influenced facies by U-enrichment was the woody
debris. The ash-bearing mudstone (F6), clay-dominated mudstone (F3), fossiliferous mudstone-
packstone (F8/13), and calcareous mudstone (F4) that were deposited in close proximity to the
palustrine-lacustrine depozone all showed elevated SGR signals due to the organic-rich paleo-
swamp near the CMC section which was probably the source of the organic matter. The influence
of the position of the outcrop within the lake basin is likely due to the fact that the Elko Basin is a
small-lake system as opposed to a large lake or marine environment. Small lakes exhibit
depositional environments strongly affected by small-scale changes from climate and tectonics,
especially its influence on subsidence and accommodation. Therefore, variations in climate and
tectonics have a strong effect on gamma ray readings in lacustrine strata as opposed to marine
systems which are generally more static and are controlled by eustatic processes (Bohacs et al.,
2000).
8.6 Interpretation of SGR data
Interpretation of SGR data suggests that K, U, and Th were primarily sourced from K-
bearing volcanic minerals (K-feldspar and mica), U-enriched organic material, and clays (illite and
montmorillonite), respectively. This information provides a guide to analyzing subsurface SGR
curves of the Elko Formation with a relatively low level of uncertainty, by constraining the causes
of high-K, high-K combined with high-Th, and high-U values.
High-K values independent of high-Th values, strongly suggest heavy K-bearing minerals
associated with volcanism. When high-K values are recorded at the same interval as high-Th
values, this indicates a greater probability that both high-K and high-Th are associated with non-
volcanic clays. High-U values, regardless of high-K or high-Th values being present, is most likely
81
an indication of U-enriched organic matter. It typically, but not always, occurs with high-Th
values.
8.7 Comparison to Noble Energy EOS-3 core SGR data
Noble Energy core data, including TOC and XRD analyses, was available for comparison
in this study. Facies were assigned to core SGR measurements based on core descriptions
previously recorded, as well as available XRD analysis data.
SGR data acquired by wireline logging was found to be difficult to compare to the outcrop
data, due to the higher resolution of the wireline tool versus as compared to the handheld gamma
ray spectrometer. In general, values in API units were found to be slightly lower for the core, in
contrast to outcrop measurements.
However, more detailed analysis was found to be inconclusive. For example: similarities
between K and Th values between the core and EHA and EHB data for F5 were found (Figs. 21A–
C; Appendix 6, Figs. 23U-23BB, respectively), however, U values in the core data were much
lower. SGR data for F4 showed similarities between K and U values in comparison to the TR
section, but Th was much lower in core (Figs. 22A–C). This could be due to a number of issues:
the effect of deposition where the core was acquired, the difference between tools utilized to collect
data, or the difference between fresh, unaltered core versus exposed outcrop section.
Although quantitative comparisons between overall total gamma radiation and SGR values
were not able to be made between the core and outcrop, similar trends between the XRD analyses
data and high-K, high-U, and high-Th values recorded on the core SGR curves did to correlate
with K-bearing minerals (K-feldspar, mica), TOC-rich intervals, and total clays (illite,
montmorillonite), respectively, and these trends can still be applied to better understanding the
core log of the Elko Formation or future SGR data gathered.
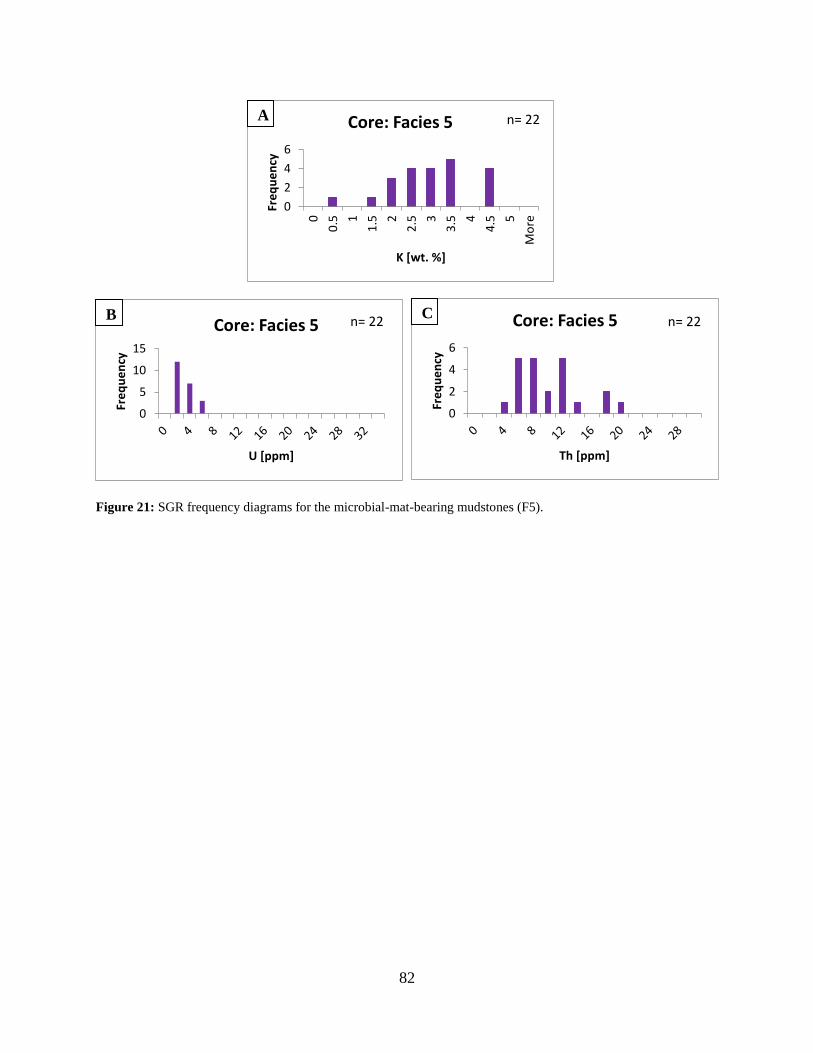
82
Figure 21: SGR frequency diagrams for the microbial-mat-bearing mudstones (F5).
0
5
10
15
Fre
qu
en
cy
U [ppm]
Core: Facies 5 n= 22
0
2
4
6
Fre
qu
en
cy
Th [ppm]
Core: Facies 5 n= 22
0
2
4
6
0
0.5 1
1.5 2
2.5 3
3.5 4
4.5 5
Mo
re
Fre
qu
en
cyK [wt. %]
Core: Facies 5 n= 22
B C
A
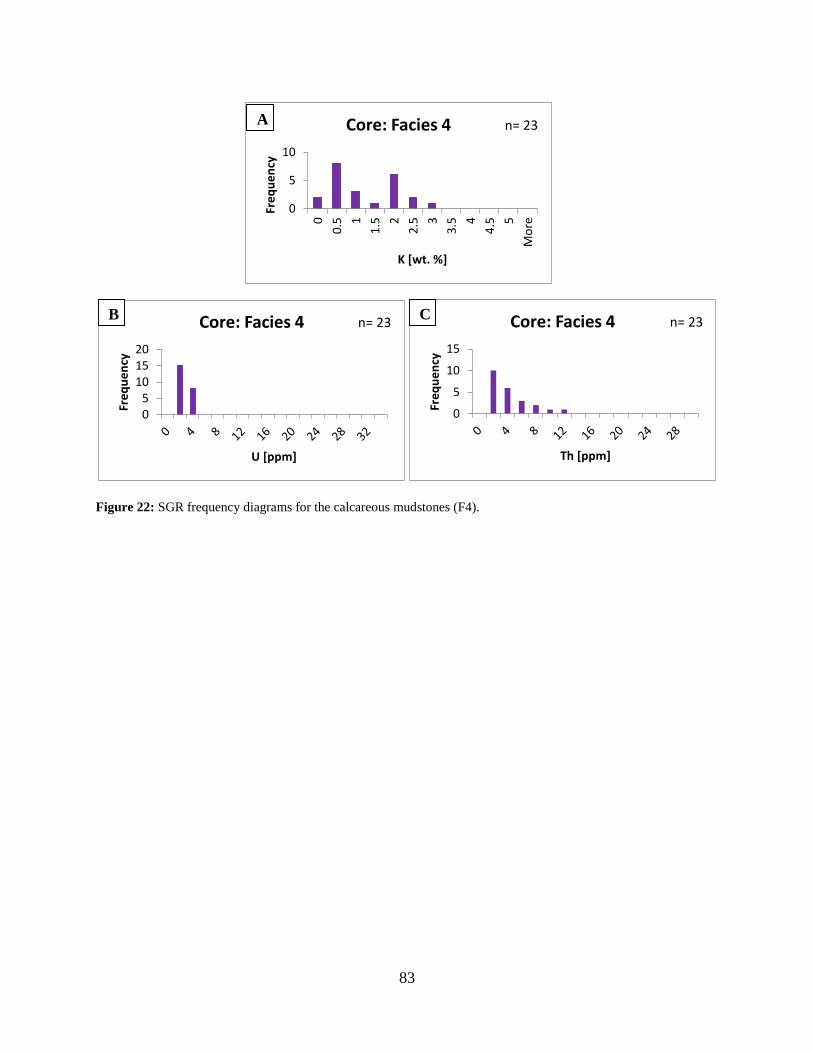
83
Figure 22: SGR frequency diagrams for the calcareous mudstones (F4).
05
101520
Fre
qu
en
cy
U [ppm]
Core: Facies 4 n= 23
0
5
10
15
Fre
qu
en
cy
Th [ppm]
Core: Facies 4 n= 23B C
0
5
10
0
0.5 1
1.5 2
2.5 3
3.5 4
4.5 5
Mo
re
Fre
qu
en
cyK [wt. %]
Core: Facies 4 n= 23A
84
9.0 CONCLUSIONS
1. Handheld, gamma ray spectrometry was found to overall be useful in application to
studying the Elko Formation lake facies. Nine-hundred and seventy-nine gamma ray
measurements were taken over ~700 ft. of stratigraphic sections measured by Horner
(2015) from four Elko Formation outcrops forming a NNW-to-SSE transect in northeastern
Nevada. At the northernmost outcrop, Coal Mine Canyon (CMC), 412 measurements were
acquired every 0.5 to 2 ft. along 210-ft. of section at 2-minute reading intervals. At the two
central outcrops, Elko Hills A (EHA) and Elko Hills B (EHB), 120 and 88 readings were
acquired, respectively, every 0.5 ft. along 58.5 and 44 ft. of section, respectively, at 2-
minute reading intervals. At the southernmost outcrop, Tomera Ranch (TR) 357
measurements were acquired, along 425-ft. of section, every 1 to 2 ft. at 3-minute reading
intervals.
2. From fourteen sedimentological facies identified for the Elko Formation by Horner (2015),
eight facies (most of which were combinations of the original fourteen facies) were
discernable from a spectral gamma ray signature. These eight facies were assigned to each
gamma ray reading, based on an interval thickness of at least 0.5 ft. and an adequate number
of measurements. Five of the eight facies used in this study were siliciclastic, including:
plant-bearing mudstone, clay-dominated mudstone, microbial-mat-bearing mudstone, ash-
bearing mudstone, and conglomerate. The remaining three facies were comprised of two
carbonate facies (calcareous mudstone and fossiliferous mudstone-packstone), and one
volcanic tuff facies. Facies associations from Horner (2015) could be applied to predict
85
SGR readings, since facies trends were largely dependent on the specific outcrop being
analyzed and its basin position (see conclusion #5).
3. Five out of eight Elko Formation facies [(plant-bearing mudstone (F1/2), clay-dominated
mudstone (F3), microbial-mat-bearing mudstone (F5), ash-bearing mudstone (F6), and
volcanic tuff (F10–12)] demonstrated high API values above 120 API units. The remaining
three facies of the Elko Formation [(calcareous mudstone (F4), fossiliferous mudstone-
packstone (F8/13), and conglomerate (F14)] represent low API readings at, or lower than
120 API units.
4. The relative contributions of potassium (K), uranium (U), and thorium (Th) within Elko
Formation strata, independent of facies, were found to reflect K-bearing volcanic minerals
(feldspars, mica, illite), U-enriched organic matter, and volcanic ash/clay abundance (illite,
montmorillonite, chlorite), respectively. This was found to be especially useful for this
study, as well as for any future SGR data gathered.
5. Spectral gamma ray readings for the microbial-mat-bearing mudstone (F5) were used to
identify basin trends to be identified between all four outcrops studied. The CMC section
and the TR outcrop were recognized as proximal and EHA and EHB sections were
interpreted as central, basinward outcrops. Within the microbial-mat bearing mudstone
(F5), the CMC outcrop data exhibited low K values (<1.5 %), due to the lack of active
volcanism during deposition. The TR and Elko Hills sections both had K values from 1–
5%. Overall, the range of K values increased from north to south across the four outcrops,
which is thought to be linked to the increase in volcanism during the NNW-to-SSE,
diachronous deposition of the Elko Formation. The CMC and TR microbial-mat-bearing
mudstone outcrop data had low values for Th, commonly between 6 and 8 ppm. The Elko
86
Hills sections had high Th values, which suggests alteration to clay of water-lain, ash-fall
tuff in the central parts of the basin, typically between 10 and 12 ppm. The CMC and TR
outcrop data showed similar values for U as the Elko Hills and here generally between 6
and 8 ppm.
6. Th/U ratios of the microbial-mat-bearing mudstone (F5) at each outcrop of the Elko
Formation were used to interpret proximal versus distal environments within the deep-lake
facies. Low Th/U ratios (<2.5) at the CMC and TR sections represent lake strata deposited
relatively close to the basin margins, while high Th/U ratios (2.5–4) at the Elko Hills
sections, represent the “distal” part of the basin. As distance from the margins increases,
the Th/U ratio increases in contrast to marine environments.
7. SGR values used to identify basin trends, as well as application of Th/U, supports the
depositional model by Horner (2015), which interprets the CMC and TR outcrops as
representing proximal parts of the basin and the Elko Hills sections representing the central
basin. This study also supports Horner’s (2015) model of the Elko Formation sediments
as diachronous, NNW–SSE deposition across the basin.
8. Eight diagenetic cements in the Elko Formation are were identified: one calcite cement,
four phases of dolomite cement, two silica cements, and one zeolite cement. Open and
occluded pores found include intraparticle, interparticle, matrix, shelter, and fracture
porosity. Calcite, dolomite, and silica cements were formed sequentially and fill in shelter
and fracture porosity. Zeolite cement timing is unclear throughout the diagenetic history
of the Elko Formation.
87
9. The eight cements identified in the Elko Formation comprise <10 vol% and it is, therefore,
unlikely that they heavily influence the gamma ray signal of Elko Formation sedimentary
strata.
10. Comparison between core log data and SGR data acquired by the handheld, gamma ray
spectrometer proved inconclusive due to either a difference in tool resolution, variability
in deposition between the core and outcrop locations, or contrast between SGR readings
from unaltered core versus potentially weathered and altered outcrop exposures.
11. Similar, non-quantitative trends were observed in the core log and the outcrop SGR logs,
suggesting similar sources of high-K, high-U, and high-Th values from K-bearing minerals
(K-feldspar and mica), U-enriched organic matter, and clays (illite and montmorillonite),
respectively.
12. Following Horner (2015), the central Elko Hills sections represent the deep-lake setting
and would likely be the most economic source of oil within the basin, unless they prove
not brittle enough for hydraulic fracturing, versus to the proximal CMC and TR sections.
As these Elko Hills outcrops were deposited during the lake stage with the highest water-
level, and with the best preservation of organic matter and thickest microbial-mat-bearing
mudstones, facies in the subsurface most similar to these outcrops would be an ideal target
for drilling.
88
REFERENCES
Adams, J.A.S., and Weaver, C.E., 1958, Thorium-To-Uranium Ratios as indicators of sedimentary
processes: example of concept of geochemical facies: American Association of Petroleum
Geologists Bulletin, v. 42, p. 387-430.
Aigner, T., Schauer, M., Junghans, W.-D., and Reinhardt, L., 1995, Outcrop gamma-ray logging
and its applications: examples from the German Triassic: Sedimentary Geology, v. 100, p.
47-61, doi: 10.1016/0037-0738(95)00102-6.
Aufill, M.G., 2007, Outcrop-Based Correlation Of Magnetic Susceptibility With Spectral Gamma-
Ray Spectrometry In The Woodford Shale of South-Central Oklahoma, Master’s thesis,
Oklahoma State University, Stillwater, Oklahoma, 255 p.
Axelrod, D. I., and Bailey, H.P., 1969, Paleotemperature analysis of tertiary floras:
Palaeogeography, Palaeoclimatology, Palaeoecology, v. 6, p. 163–195, doi:10.1016/0031-
0182(69)90013-3.
Blum, P., Rabaute, A., Gaudon, P., and Allan, J.F., 1997. Analysis of natural gamma-ray spectra
obtained from sediment cores with the shipboard scintillation detector of the Ocean
Drilling Program: example from Leg 156 in Shipley, T.H., Ogawa, Y., Blum, P., and Bahr,
J.M. (eds.), Proc. ODP, Sci. Results, 156: College Station, TX (Ocean Drilling Program),
p.183–195, doi:10.2973/odp.proc.sr.156.024.1997.
Bessa, J.L., and Hesselbo, S.P., 1997, Gamma-ray character and correlation of the Lower Lias,
SW Britain: Proceedings of the Geologists’ Association, v. 108, p. 113-129,
doi:10.1016/S0016-7878(97)80034-X.
Blakey, R., 2014, Paleogeographic reconstruction of Western North America during the Eocene
Epoch (48-52 Ma), map: http://cpgeosystems.com/images/SWNA_50Ma -sm.jpg,
accessed 1/2014.
Bohacs, K.M., 1998, Contrasting Expressions of Depositional Sequences in Mudrocks from
Marine to non Marine Environs: Contrasting Expressions in Schieber J., Zimmerle W.,
Sethi, P.S., Eds., Shales and Mudstones I, Schweizerbart’sche Verlagsbuchhandlung,
Stuttgart, p. 33–78.
Bohacs, K. M., Carroll, A. R., Neal, J. E., and Mankiewicz, P. J., 2000, Lake-basin type, source
potential, and hydrocarbon character: an integrated-sequence-stratigraphic geochemical
framework in E. H. Gierlowski-Kordesch and Kelts, K. R. (eds.), Lake basins through
space and time: AAPG Studies in Geology v. 46, p. 3-34.
Burton, D., Woolf, K., and Sullivan, B., 2014, Lacustrine depositional environments in the Green
River Formation, Uinta Basin: Expression in outcrop and wireline logs: American
89
Association of Petroleum Geologists Bulletin, v. 98, no. 9, p. 1699-1715, doi:
10.1306/03201413187
Carroll, A.R., and Bohacs, K.M., 2001, Lake-type controls on petroleum source rock potential in
nonmarine basins: American Association of Petroleum Geologists, v. 85, no. 6, p.1033-
1053, doi: 10.1306/8626CA5F-173B-11D7-8645000102C1865D.
Cassidy, J., 1981, Techniques of field gamma-ray spectrometry: Mineralogical Magazine, v. 44,
p. 391-398.
Chamberlain, A.K., 1984, Surface Gamma-Ray Logs: A Correlation Tool for Frontier Areas:
American Association of Petroleum Geologists Bulletin, v. 68, no. 8, p. 1040-1043.
Choquette, P.W., and Pray, L.C., 1970, Geologic nomenclature and classification of porosity in
sedimentary carbonates: American Association of Petroleum Geologists Bulletin, v. 54, p.
207-250.
Christiansen, R.L., and Yeats, R.S., 1992, Post-Laramide geology of the U.S. Cordilleran region
in Geological Society of America Special Publication, The geology of North America: The
Cordilleran Orogen; conterminous U.S., Burchfiel, B.C., Lipman, P.W., and Zoback, M.L.
(eds.), p. 261-406.
Coats, R.R., 1964, Geology of the Jarbidge quadrangle, Nevada-Idaho: U.S. Geological Survey
Bulletin 1141-M, 24 p.
Coats, R.R., 1987, Geology of Elko County, Nevada: Nevada Bureau of Mines and Geology
Bulletin, v. 101, 112 p.
Compton, J.S., Conrad, M.E., and Vennemann, T.W., 1999, Stable isotope evolution of volcanic
ash layers during diagenesis of the Miocene Monterey Formation, California: Clay and
Minerals, v. 47, no. 2, p. 84-95.
Coney, P.J., and Harms, T.A., 1984, Cordilleran metamorphic core complexes: Cenozoic
extensional relics of Mesozoic compression, Geology, v. 12, p. 550-554, doi:
10.1130/0091-7613(1984).
Cowan, D.R., and Myers, K.J., 1988, Surface Gamma Ray Logs: A Correlation Tool for Frontier
Areas: Discussion: American Association of Petroleum Geologists Bulletin, v. 72, no. 5,
p. 634-636.
DeCelles, P.G., 2004, Late Jurassic to Eocene Evolution of the Cordilleran Thrust Belt and
Foreland Basin System, Western U.S.A.: American Journal of Science, v. 304, p. 105-168,
doi: 10.2475/ajs.304.2.105.
Dickson, B.L., and Scott, K.M., 1997, Interpretation of aerial gamma-ray surveys-adding the
geochemical factors: Journal of Australian Geology and Geophysics, v. 17 (2), p. 187-200.
90
Doveton, J.H., and Merriam, D.F., 2004, Borehole petrophysical chemostratigraphy of
Pennsylvanian black shales in the Kansas subsurface: Chemical Geology, v. 206, p.249-
258, doi: 10.1016/j.chemgeo.2003.12.027.
Dypvik, H., and Eriksen, D.O., 1983, Natural radioactivity of clastic sediments and the
contributions of U, Th and K: Journal of Petroleum Geology, v. 5, no. 4, p. 409-416, doi:
10.1111/j.1747-5457.1983.tb00592.x.
Ehrenberg, S.N., and Svånå, T. A., 2001, Use of spectral gamma-ray signature to interpret
stratigraphic surfaces in carbonate strata: an example from the Finnmark carbonate
platform (Carboniferous-Permian), Barents Sea: American Association of Petroleum
Geologists, v. 85, p. 295-308.
Ellis, D.V., and Singer, J.M., 2008, Well Logging for Earth Scientists, New York, Springer, 699
p.
Fabricius, I.L., Fazladic, L.D., Steinholm, A., and Korsbech, U, 2003, The use of spectral natural-
gamma ray analysis in reservoir evaluation of siliciclastic sediments: a case study from the
Middle Jurassic of the Harald Field, Danish Central Graben: Geological Survey of
Denmark and Greenland Bulletin, v. 1, p. 349-366.
Fertl, W.H., and Chilingarian, G.V., 1990, Hydrocarbon resource evaluation in the Woodford
Shale using well logs, Journal of Petroleum Science and Engineering, v. 4, p. 347-357.
Fisher, R. V., 1971, Features of Coarse-Grained, High-Concentration Fluids and Their Deposits:
Journal of Sedimentary Research, v. 41, no. 4, p. 916-927, doi: 10.1306/74D723B5-2B21-
11D7-8648000102C1865D.
Fischer, A.G., and Roberts, L.T., 1991, Cyclicity of the Green River Formation (Lacustrine
Eocene) of Wyoming: Journal of Sedimentary Petrology, v. 61, no. 7, p.1146-1154, doi:
10.1306/D4267852-2B26-11D7-8648000102C1865D.
Flügel, E., 2004, Microfacies of Carbonate Rocks: Analysis, Interpretation and Application:
Springer – Verlag Berlin Heidelberg, 1006 p.
Folk, R.L., and Pittman, J.S., 1971, Length-slow chalcedony: A new testament for vanished
evaporites: Journal of Sedimentary petrology, v. 41, no. 4, p. 1045-1058.
Fouch, T.D., Hanley, J.H., and Forester, R.M., 1979, Preliminary correlation of Cretaceous and
Paleogene lacustrine and related nonmarine sedimentary and volcanic rocks in parts of the
eastern Great Basin of Nevada and Utah: Rocky Mountain Association of Geologists Basin
and Range Symposium and Great Basin field conference, p. 305-312.
Godelitsas, A., Misaelides, P., Charistos, D., and Filippidis, A., 1996, Interaction of HEU-type
Zeolite Crystals with Thorium Aqueous Solutions: Chemie der Erde, v. 56, p. 143-156.
91
Gondé, C., Martel, C., Pichavant, M., and Bureau, H., 2011, In situ bubble vesiculation in silicic
magmas: American Mineralogist, v. 96, p. 111-124, doi: 10.2138/am.2011.3546.
Google Earth 7.1, 2015, state of Nevada, 40°49’16.73” N 115° 45’46.63” W, elevation 1970 m.
Image Landsat layer.
Graham, D.J., and Midgley, N.G., 2000, Graphical representation of particle shape using triangular
diagrams: an excel spreadsheet method: Earth Surface Processes and Landforms, v. 25, n.
13, p. 1473-1477.
Gray, M.B., and Nickelsen, R.P., 1989, Pedogenic slickensides, indicators of strain and
deformation processes in redbed sequences of the Appalachian foreland: Geology, v. 17,
no. 1, p. 72–75, doi: 10.1130/0091-7613(1989)017<0072:PSIOSA>2.3.CO;2.
Guagliardi, I., Buttafuoco, G., Apollaro, C., Bloise, A., De Rosa, R., and Cicchella, D., 2013,
Using gamma-ray Spectrometry and Geostatistics for Assessing Geochemical Behavior of
Radioactive Elements in the Lese Catchment (southern Italy), International Journal of
Environmental Research, v. 7(3), p. 645-658.
Hanson, A.D., Ritts, B.D., Zinniker, D., Moldowan, J.M, and Biffi, U., 2001, Upper Oligocene
lacustrine source rocks and petroleum systems of the northern Qaidam basin, northwest
China: American Association of Petroleum Geologists Bulletin, v. 85, no. 4, p. 601-619,
doi: 10.1306/8626C95B-173B-11D7-8645000102C1865D.
Hassan, M., Hossin, A., and Combaz, A., 1976, Fundamentals of the differential gamma ray log:
SPWLA seventeenth annual logging symposium, p. 1-18.
Haynes, S. R., 2003, Development of the Eocene Elko Basin, Northeastern Nevada : implications
for paleogeography and regional tectonism, Unpublished Master’s Thesis, The University
of British Columbia, Vancouver, Canada, 159 p.
Hazlett, D.P., Bregar, J.E., and Hersch, J.B., 1992, Petroleum potential of southern Huntingdon
Valley and results of the Anadarko Cherry Spring Federal in Trexler, J.H, Jr, and others
(eds.), Structural Geology and Petroleum Potential of Southwest Elko County, Nevada:
1992 Fieldtrip Guidebook, Nevada Petroleum Society, Inc., Reno, Nevada, p. 25-38.
Heaney, P.J., 1993, A proposed mechanism for the growth of chalcedony: Contributions of
Mineralogy and Petrology, v. 115, no. 1, p. 66-74, doi: 10.1007/BF00712979.
Henrici, A.C., and Haynes, S.R., 2006, Elkobatrachus Brocki, A new Pelobatid (amphibian: anura)
from the Eocene Elko Formation of Nevada: Annals of Carnegie Museum, v. 75. no. 1, p.
11-35, doi:10.2992/0097-4463(2006)75[11:EBANPA]2.0.CO;2.
Henry, C.D., and Faulds, J. E., 1999, Geologic map of the Emigrant Pass quadrangle, Eureka
County, Nevada: Nevada Bureau of Mines and Geology, Open File Report 99-9, scale
1:24,000.
92
Henry, C.D., 2008, Ash-flow tuffs and paleovalleys in northeastern Nevada: Implications for
Eocene paleogeography and extension in the Sevier hinterland, northern Great Basin:
Geosphere, v. 4, no. 1, p. 1–35, doi:10.1130/GES00122.1.
Henry, C.D., and John, D.A., 2013, Magmatism, ash-flow tuffs, and calderas of the ignimbrite
flareup in the western Nevada volcanic field, Great Basin, USA: Geosphere, v. 9, no. 4, p.
951-1008, doi: 10.1130/GES00867.1.
Horner, W.H., 2015, Tertiary Lake Sedimentation in the Elko Formation, Nevada-The Evolution
of a Small Lake System in an Extensional Setting: Unpublished Master’s thesis, Colorado
State University, Fort Collins, 99 p.
Horton, T.W., Sjostrom, D.J., Abruzzese, M.J., Poage, M.A., Waldbauer, J.R., Hren, M., Wooden,
J., and Chamberlain, C.P., 2004, Spatial and temporal variation of Cenozoic surface
elevation in the Great Basin and Sierra Nevada, American Journal of Science, v. 304, p.
862-888, doi: 10.2475/ajs.304.10.862.
International Atomic Energy Agency (IAEA), 2003, Guidelines for radioelement mapping using
gamma ray spectrometry data, 179 p.
Jaeger, K. B., 1987, Structural geology and stratigraphy of the Elko Hills, Elko County, Nevada.
Unpublished Master’s thesis, University of Wyoming, Laramie. 70 p.
Johnson, J.G., and Pendergast, A.,1981, Timing and mode of emplacement of the Roberts
Mountains allochthon, Antler orogeny, Geological Society of America Bulletin, v. 92, no.
9, p. 1648-1658, doi: 10.1130/0016-7606(1981)92<648:TAMOEO>2.0.CO;2.
Katz, B., and Lin F., 2014, Lacustrine basin unconventional resource plays: key differences:
Marine and Petroleum Geology, v. 56, p. 255-265, doi:10.1016/j.marpetgeo.2014.02.013.
Ketner, K. B., and Alpha, A. G., 1992, Mesozoic and Tertiary rocks near Elko, Nevada--evidence
for Jurassic to Eocene folding and low-angle faulting, U.S. Geological Survey Bulletin,
1988-C, 24 p.
Koczy, F.F., 1949, The Thorium content of Cambrian Alum Shales of Sweden: Sveriges Geology
Undersokning, Ser. C, Avhandl. och Uppoat. no. 509, Arsbok, v. 43, no. 7, 12 p.
Krystyniak, A.M., 2003, Outcrop-Based Gamma-Ray Characterization of the Woodford Shale of
South Central Oklahoma, Master’s thesis, Lake Superior State University, Sault Sainte
Marie, Michigan, 160 p.
Leggo, P.J., Choeme, J.J., Demant, A., and Lee, W.T., 2001, The role of argillic alteration in the
zeolitization of volcanic glass: Mineralogical Magazine, v. 65, no. 5, p. 653-663.
Lofgren, G., 1971, Spherulitic textures in glassy and crystalline rocks: Journal of Geophysical
Research, 76(23), p. 5635-5648, doi: 10.1029/JB076i023p05635.
93
Løvburg, L., Wollenberg, H., Sørensen, P., and Hansen, J., 1971, Field Determination of Uranium
and Thorium by Gamma-Ray Spectrometry, Exemplified by Measurements in the
Ilímeaussag Alkaline Intrusion, South Greenland: Economic Geology, v. 66, p. 368-384.
McGrew, A.J., and Snee, L.W., 1994, 40Ar/39Ar thermochronologic constraints on the
tectonothermal evolution of the northern East Humboldt Range metamorphic core
complex, Nevada: Tectonophysics v. 238, p. 425-450.
Moore, S.W., Madrid, H.B., and Server, T.G., 1983, Results of Oil-Shale Investigations in
Northeastern Nevada: United States Department of the Interior Geological Survey Open
File Report 83-586, 111 p.
Moore, C.H. (ed.), 2001, Carbonate Reservoirs—Porosity Evolution and Diagenesis in a Sequence
Stratigraphic Framework: Developments in Sedimentology, Elservier, p. 185-244.
Muntean, J. L., Tarnocai, C. A., Coward, M., Rouby, D., and Jackson A., 2001, Styles and
restorations of Tertiary extension in north-central Nevada in Shaddrick, D. R., Zbinden, E.
A., Mathewson, D. C., and Prenn, C. (eds.), Regional tectonics and structural control of
ore: the major gold trends of northern Nevada, Geological Society of Nevada Special
Publication no. 33, p. 55-69.
Myers, K.J., and Wignall, P.B., 1987, Understanding Jurassic Organic-rich mudrocks—new
concepts using gamma ray spectrometry and palaeoecology: examples from the
Kimmerage Clay of Dorset and the Jet Rock of Yorkshire in Leggett, J.K., and Zuffa, G.G.
(eds.), Marine Clastic Sedimentology, p. 172-189, doi: 10.1007/978-94-009-3241-8_9.
Ogihara, S., 2000, Composition of clinoptilolite formed from volcanic glass during burial
diagenesis; Clays and Clay Minerals, v. 48, no. 1, p. 106-110.
Plint, A., 2014, Mud dispersal across a Cretaceous prodelta: Storm-generated, wave-enhanced
sediment gravity flows inferred from mudstone microtexture and microfacies:
Sedimentology, v. 61, no. 3, p. 609–647, DOI: 10.1111/sed.12068.
Radiation Solutions Inc., 2008, User’s manual for RS-125 Super-spec and RS-230 BGO super-
spec gamma ray spectrometer, rev. 1.7: Radiation Solutions, Inc., Ontario, Canada, 35 p.
Radiation Solutions Inc. (RSI), 2009, Spectrum Stabilization and Calibration for the RSI RS-125
and RS-230 Handheld Spectrometers: RSI Technical Note #-RSG-703, Radiation
Solutions Inc., 6 p.
Renault, R.W., and Gierlowski-Kordesch, E.H., 2010, Lakes in Dalrymple, R. and James, N.
(eds.), Facies Models, 4th Edition, Geological Association of Canada, Toronto, p. 541-575.
Retallack, G. J., 1990, Soils of the Past: An Introduction to Paleopedology: Boston, Unwin Hyman,
548 p.
94
Satarugsa, P., and Johnson, R.A., 2000, Cenozoic tectonic evolution of the Ruby Mountains
metamorphic core complex and adjacent valleys, northeastern Nevada, Rocky Mountain
Geology, v. 35, no. 2, p. 205-230, doi: 10.2113/35.2.205.
Serra, O., 1984, Fundamentals of Well-Log Interpretation: 2. The interpretation of Logging Data:
Developments in Petroleum Science, 15B: Amsterdam, Elsevier, p. 684.
Schieber, J., Southard, J.B., Kissling, P., Rossman, B., and Ginsburg, R., 2013, Experimental
deposition of carbonate mud from moving suspensions: Importance of flocculation and
implications for modern and ancient carbonate mud deposition, Journal of Sedimentary
Research, v. 83, p. 1026-1032, doi: 10.2110/jsr.2013.77.
Schubel, K.A., and Simonson, B.M.,1990, Petrography and diagenesis of cherts from Lake
Magadi, Kenya, Journal of Sedimentary Petrology, v. 60, no. 5, p. 761-776.
Sims, J. D., 2013, Earthquake-induced load casts, pseudonodules, ball-and-pillow structures, and
convolute lamination: Additional deformation structures for paleoseismic studies, GSA
Special Papers 2013, v. 493, p. 191-201, doi: 10.1130/2012.2493(09).
Slatt, R.M., Jordan, D.W., D'Agostino, A.E., and Gillespie, R.H., 1992, Outcrop gamma-ray
logging to improve understanding of subsurface well log correlations: Geological Society,
London, Special Publications, v. 95, p. 3-19, doi: 10.1144/GSL.SP.1992.065.01.02.
Smith, J.F. Jr, Ketner, K.B., and Mabey, D.R., 1976, Stratigraphy of post-Paleozoic rocks and
summary of resources in the Carlin-Pinon Range area, Nevada: United States Geological
Survey PP 867-B, 53 p.
Solomon, B. J., McKee, E. H., and Andersen, D. W., 1979, Stratigraphy and Depositional
Environments of Paleogene Rocks Near Elko, Nevada in Armentroue, J.M., Cole, M.R.,
and TerBest, H. (eds.), Cenozoic paleogeography of the western United States: Society of
Economic Paleontologists and Mineralogists, Pacific Section, p. 75–88.
Solomon, B.J., 1981, Geology and Oil Shale Resources near Elko, Nevada: United States of the
Interior Geological Survery Open-File Report 81-709, 154 p.
Solomon, B.J., and Moore, S. W., 1982a, Geologic map and oil shale deposits of the Elko West
quadrangle, Elko County Nevada. U. S. Geological Survey Miscellaneous Field Studies
Map MF-1420, scale 1:24,000.
Solomon, B.J., and Moore, S. W., 1982b, Geologic map and oil shale deposits of the Elko East
quadrangle, Elko County Nevada. U.S. Geological Survey Miscellaneous Field Studies
Map MF-1421, scale 1:24,000.
Solomon, B.J., 1992, The Elko Formation of Eocene and Oligocene (?) age—source rocks and
petroleum potential in Trexler, J.H, Jr, and others (eds.), 1992, Structural Geology and
95
Petroleum Potential of Southwest Elko County, Nevada: 1992 Fieldtrip Guidebook,
Nevada Petroleum Society, Inc., Reno, Nevada, p. 25-38.
Svendsen, J.B., and Hartley, N.R., 2001, Comparison between outcrop-spectral gamma ray
logging and whole rock geochemistry: implications for quantitative reservoir
characterization in continental sequences: Marine and Petroleum Geology, v. 18, p. 657-
670, doi: 10.1016/S0264-8172(01)00022-8.
Surdam, R.C., and Stanley, K.O., 1979, Lacustrine sedimentation during the culminating phase of
Eocene Lake Gosiute, Wyoming (Green River Formation): Geological Society of America
Bulletin, v. 90, p. 93-110.
Swanson, V.E., 1961, Geology and Geochemistry of Uranium in Marine Black Shales A Review:
United States Department of the Interior Geological Survey PP 356-C, 51 p.
Utada, M., 2001, Zeolites in burial diagenesis and low-grade metamorphic rocks in Bish, D.L.,
and Ming, D.W. (eds.), Natural Zeolites: Occurrence, Properties, Applications, Reviews in
Mineralology and Geochemistry, Mineralogical Society of America, v. 45, p. 277-304, doi:
10.2138/rmg.2001.45.9.
Vandervoort, D.S., and Schmitt, J.G., 1990, Cretaceous to early Tertiary paleogeography in the
hinterland of the Sevier thrust belt, east-central Nevada: Geology, v. 18, no. 6, p. 567-570,
doi: 10.1130/0091-7613(1990)018<0567:CTETPI>2.3.CO;2.
Wignall, P.B., and Myers, K.J., 1988, Interpreting benthic oxygen levels in mudrocks: A new
approach: Geology, v. 6, p. 452-455, doi: 10.1130/0091-
7613(1988)016<0452:IBOLIM>2.3.CO;2.
Wingate, F.H., 1983, Palynology and age of the Elko Formation Eocene near Elko, Nevada:
Palynology, v. 7, p.93-132.
Yang, L., Xu, T., Wei, M., Feng, G., Wang, F., and Wang, K., 2015, Dissolution of arkose in dilute
acetic acid solution under conditions relevant to burial diagenesis, Applied Geochemistry,
v. 54, p. 65-73, doi: 10.1016/j.apgeochem.2015.01.007.

96
APPENDICES
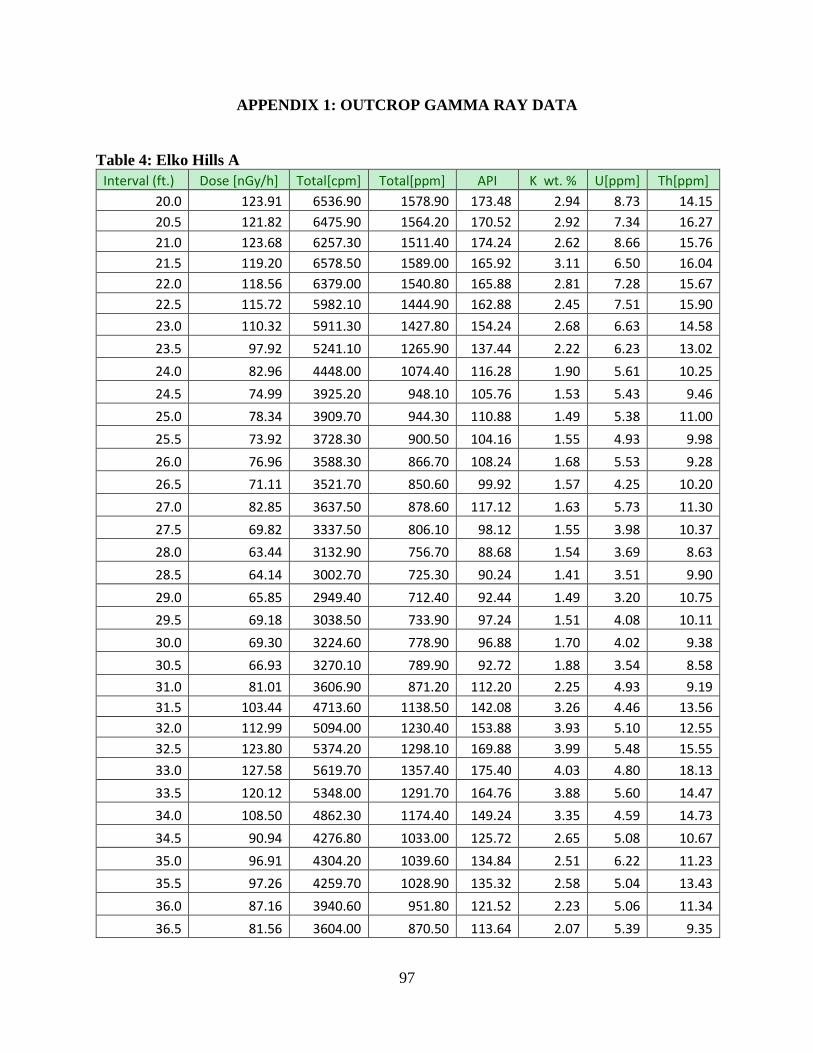
97
APPENDIX 1: OUTCROP GAMMA RAY DATA
Table 4: Elko Hills A
Interval (ft.) Dose [nGy/h] Total[cpm] Total[ppm] API K wt. % U[ppm] Th[ppm]
20.0 123.91 6536.90 1578.90 173.48 2.94 8.73 14.15
20.5 121.82 6475.90 1564.20 170.52 2.92 7.34 16.27
21.0 123.68 6257.30 1511.40 174.24 2.62 8.66 15.76
21.5 119.20 6578.50 1589.00 165.92 3.11 6.50 16.04
22.0 118.56 6379.00 1540.80 165.88 2.81 7.28 15.67
22.5 115.72 5982.10 1444.90 162.88 2.45 7.51 15.90
23.0 110.32 5911.30 1427.80 154.24 2.68 6.63 14.58
23.5 97.92 5241.10 1265.90 137.44 2.22 6.23 13.02
24.0 82.96 4448.00 1074.40 116.28 1.90 5.61 10.25
24.5 74.99 3925.20 948.10 105.76 1.53 5.43 9.46
25.0 78.34 3909.70 944.30 110.88 1.49 5.38 11.00
25.5 73.92 3728.30 900.50 104.16 1.55 4.93 9.98
26.0 76.96 3588.30 866.70 108.24 1.68 5.53 9.28
26.5 71.11 3521.70 850.60 99.92 1.57 4.25 10.20
27.0 82.85 3637.50 878.60 117.12 1.63 5.73 11.30
27.5 69.82 3337.50 806.10 98.12 1.55 3.98 10.37
28.0 63.44 3132.90 756.70 88.68 1.54 3.69 8.63
28.5 64.14 3002.70 725.30 90.24 1.41 3.51 9.90
29.0 65.85 2949.40 712.40 92.44 1.49 3.20 10.75
29.5 69.18 3038.50 733.90 97.24 1.51 4.08 10.11
30.0 69.30 3224.60 778.90 96.88 1.70 4.02 9.38
30.5 66.93 3270.10 789.90 92.72 1.88 3.54 8.58
31.0 81.01 3606.90 871.20 112.20 2.25 4.93 9.19
31.5 103.44 4713.60 1138.50 142.08 3.26 4.46 13.56
32.0 112.99 5094.00 1230.40 153.88 3.93 5.10 12.55
32.5 123.80 5374.20 1298.10 169.88 3.99 5.48 15.55
33.0 127.58 5619.70 1357.40 175.40 4.03 4.80 18.13
33.5 120.12 5348.00 1291.70 164.76 3.88 5.60 14.47
34.0 108.50 4862.30 1174.40 149.24 3.35 4.59 14.73
34.5 90.94 4276.80 1033.00 125.72 2.65 5.08 10.67
35.0 96.91 4304.20 1039.60 134.84 2.51 6.22 11.23
35.5 97.26 4259.70 1028.90 135.32 2.58 5.04 13.43
36.0 87.16 3940.60 951.80 121.52 2.23 5.06 11.34
36.5 81.56 3604.00 870.50 113.64 2.07 5.39 9.35
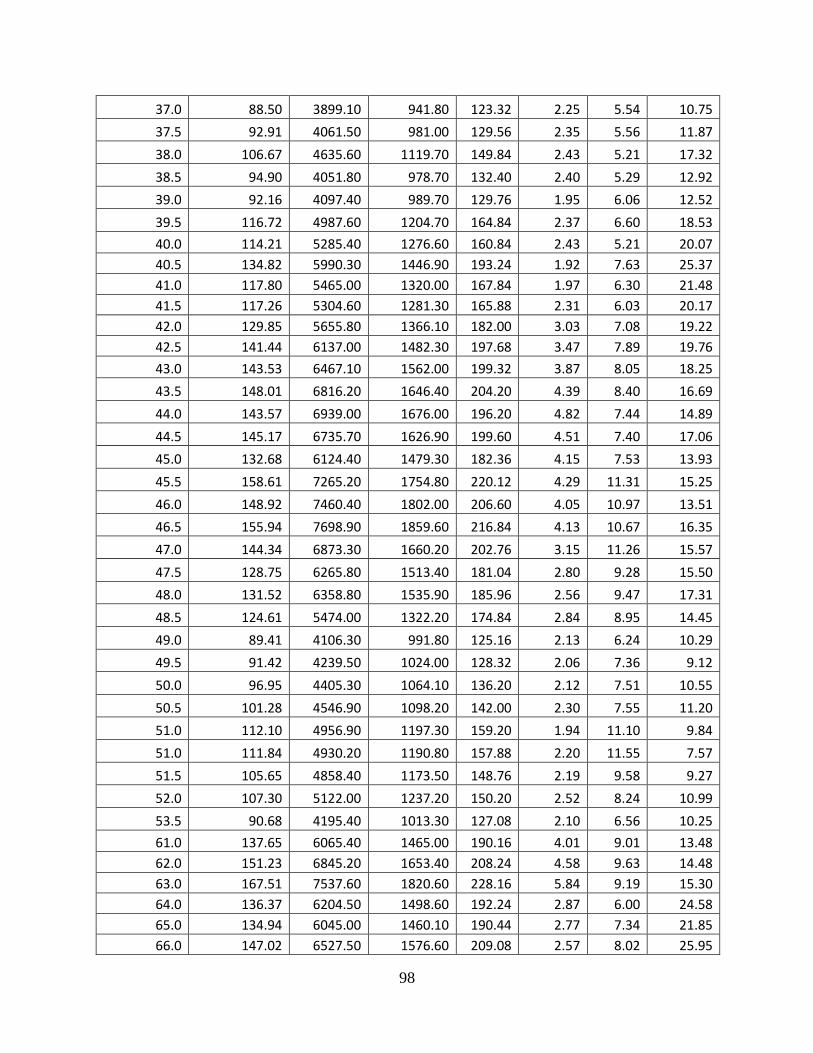
98
37.0 88.50 3899.10 941.80 123.32 2.25 5.54 10.75
37.5 92.91 4061.50 981.00 129.56 2.35 5.56 11.87
38.0 106.67 4635.60 1119.70 149.84 2.43 5.21 17.32
38.5 94.90 4051.80 978.70 132.40 2.40 5.29 12.92
39.0 92.16 4097.40 989.70 129.76 1.95 6.06 12.52
39.5 116.72 4987.60 1204.70 164.84 2.37 6.60 18.53
40.0 114.21 5285.40 1276.60 160.84 2.43 5.21 20.07
40.5 134.82 5990.30 1446.90 193.24 1.92 7.63 25.37
41.0 117.80 5465.00 1320.00 167.84 1.97 6.30 21.48
41.5 117.26 5304.60 1281.30 165.88 2.31 6.03 20.17
42.0 129.85 5655.80 1366.10 182.00 3.03 7.08 19.22
42.5 141.44 6137.00 1482.30 197.68 3.47 7.89 19.76
43.0 143.53 6467.10 1562.00 199.32 3.87 8.05 18.25
43.5 148.01 6816.20 1646.40 204.20 4.39 8.40 16.69
44.0 143.57 6939.00 1676.00 196.20 4.82 7.44 14.89
44.5 145.17 6735.70 1626.90 199.60 4.51 7.40 17.06
45.0 132.68 6124.40 1479.30 182.36 4.15 7.53 13.93
45.5 158.61 7265.20 1754.80 220.12 4.29 11.31 15.25
46.0 148.92 7460.40 1802.00 206.60 4.05 10.97 13.51
46.5 155.94 7698.90 1859.60 216.84 4.13 10.67 16.35
47.0 144.34 6873.30 1660.20 202.76 3.15 11.26 15.57
47.5 128.75 6265.80 1513.40 181.04 2.80 9.28 15.50
48.0 131.52 6358.80 1535.90 185.96 2.56 9.47 17.31
48.5 124.61 5474.00 1322.20 174.84 2.84 8.95 14.45
49.0 89.41 4106.30 991.80 125.16 2.13 6.24 10.29
49.5 91.42 4239.50 1024.00 128.32 2.06 7.36 9.12
50.0 96.95 4405.30 1064.10 136.20 2.12 7.51 10.55
50.5 101.28 4546.90 1098.20 142.00 2.30 7.55 11.20
51.0 112.10 4956.90 1197.30 159.20 1.94 11.10 9.84
51.0 111.84 4930.20 1190.80 157.88 2.20 11.55 7.57
51.5 105.65 4858.40 1173.50 148.76 2.19 9.58 9.27
52.0 107.30 5122.00 1237.20 150.20 2.52 8.24 10.99
53.5 90.68 4195.40 1013.30 127.08 2.10 6.56 10.25
61.0 137.65 6065.40 1465.00 190.16 4.01 9.01 13.48
62.0 151.23 6845.20 1653.40 208.24 4.58 9.63 14.48
63.0 167.51 7537.60 1820.60 228.16 5.84 9.19 15.30
64.0 136.37 6204.50 1498.60 192.24 2.87 6.00 24.58
65.0 134.94 6045.00 1460.10 190.44 2.77 7.34 21.85
66.0 147.02 6527.50 1576.60 209.08 2.57 8.02 25.95
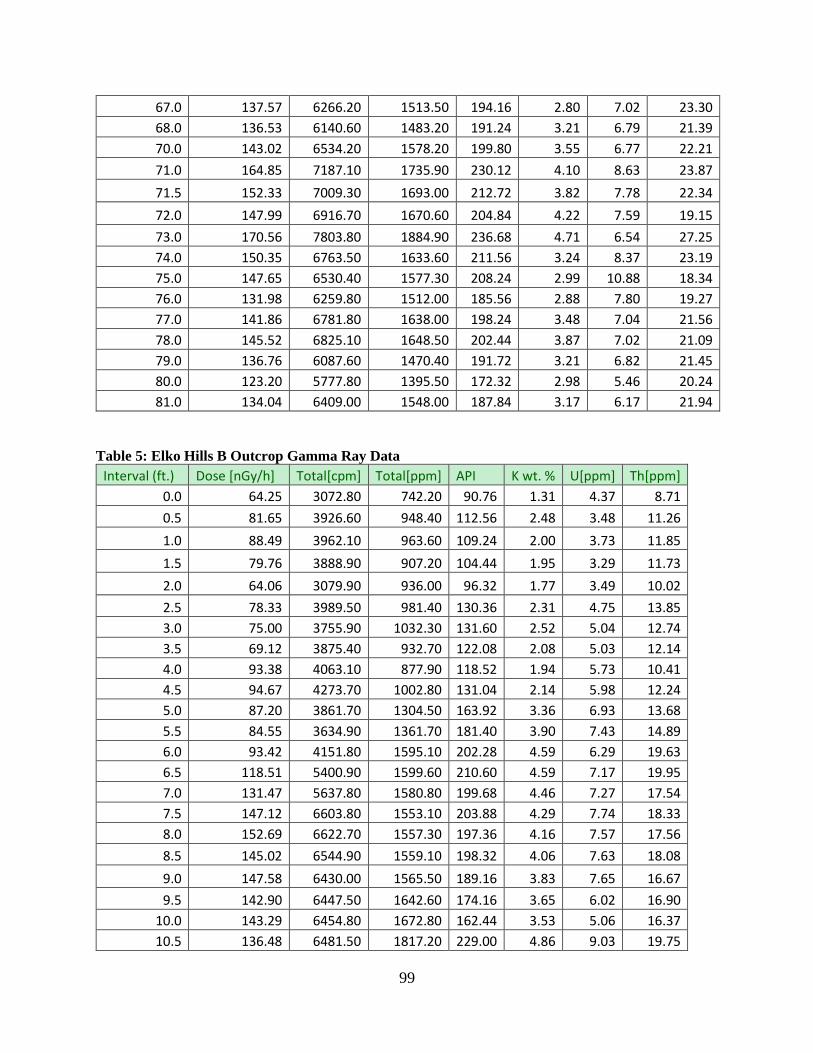
99
67.0 137.57 6266.20 1513.50 194.16 2.80 7.02 23.30
68.0 136.53 6140.60 1483.20 191.24 3.21 6.79 21.39
70.0 143.02 6534.20 1578.20 199.80 3.55 6.77 22.21
71.0 164.85 7187.10 1735.90 230.12 4.10 8.63 23.87
71.5 152.33 7009.30 1693.00 212.72 3.82 7.78 22.34
72.0 147.99 6916.70 1670.60 204.84 4.22 7.59 19.15
73.0 170.56 7803.80 1884.90 236.68 4.71 6.54 27.25
74.0 150.35 6763.50 1633.60 211.56 3.24 8.37 23.19
75.0 147.65 6530.40 1577.30 208.24 2.99 10.88 18.34
76.0 131.98 6259.80 1512.00 185.56 2.88 7.80 19.27
77.0 141.86 6781.80 1638.00 198.24 3.48 7.04 21.56
78.0 145.52 6825.10 1648.50 202.44 3.87 7.02 21.09
79.0 136.76 6087.60 1470.40 191.72 3.21 6.82 21.45
80.0 123.20 5777.80 1395.50 172.32 2.98 5.46 20.24
81.0 134.04 6409.00 1548.00 187.84 3.17 6.17 21.94
Table 5: Elko Hills B Outcrop Gamma Ray Data
Interval (ft.) Dose [nGy/h] Total[cpm] Total[ppm] API K wt. % U[ppm] Th[ppm]
0.0 64.25 3072.80 742.20 90.76 1.31 4.37 8.71
0.5 81.65 3926.60 948.40 112.56 2.48 3.48 11.26
1.0 88.49 3962.10 963.60 109.24 2.00 3.73 11.85
1.5 79.76 3888.90 907.20 104.44 1.95 3.29 11.73
2.0 64.06 3079.90 936.00 96.32 1.77 3.49 10.02
2.5 78.33 3989.50 981.40 130.36 2.31 4.75 13.85
3.0 75.00 3755.90 1032.30 131.60 2.52 5.04 12.74
3.5 69.12 3875.40 932.70 122.08 2.08 5.03 12.14
4.0 93.38 4063.10 877.90 118.52 1.94 5.73 10.41
4.5 94.67 4273.70 1002.80 131.04 2.14 5.98 12.24
5.0 87.20 3861.70 1304.50 163.92 3.36 6.93 13.68
5.5 84.55 3634.90 1361.70 181.40 3.90 7.43 14.89
6.0 93.42 4151.80 1595.10 202.28 4.59 6.29 19.63
6.5 118.51 5400.90 1599.60 210.60 4.59 7.17 19.95
7.0 131.47 5637.80 1580.80 199.68 4.46 7.27 17.54
7.5 147.12 6603.80 1553.10 203.88 4.29 7.74 18.33
8.0 152.69 6622.70 1557.30 197.36 4.16 7.57 17.56
8.5 145.02 6544.90 1559.10 198.32 4.06 7.63 18.08
9.0 147.58 6430.00 1565.50 189.16 3.83 7.65 16.67
9.5 142.90 6447.50 1642.60 174.16 3.65 6.02 16.90
10.0 143.29 6454.80 1672.80 162.44 3.53 5.06 16.37
10.5 136.48 6481.50 1817.20 229.00 4.86 9.03 19.75
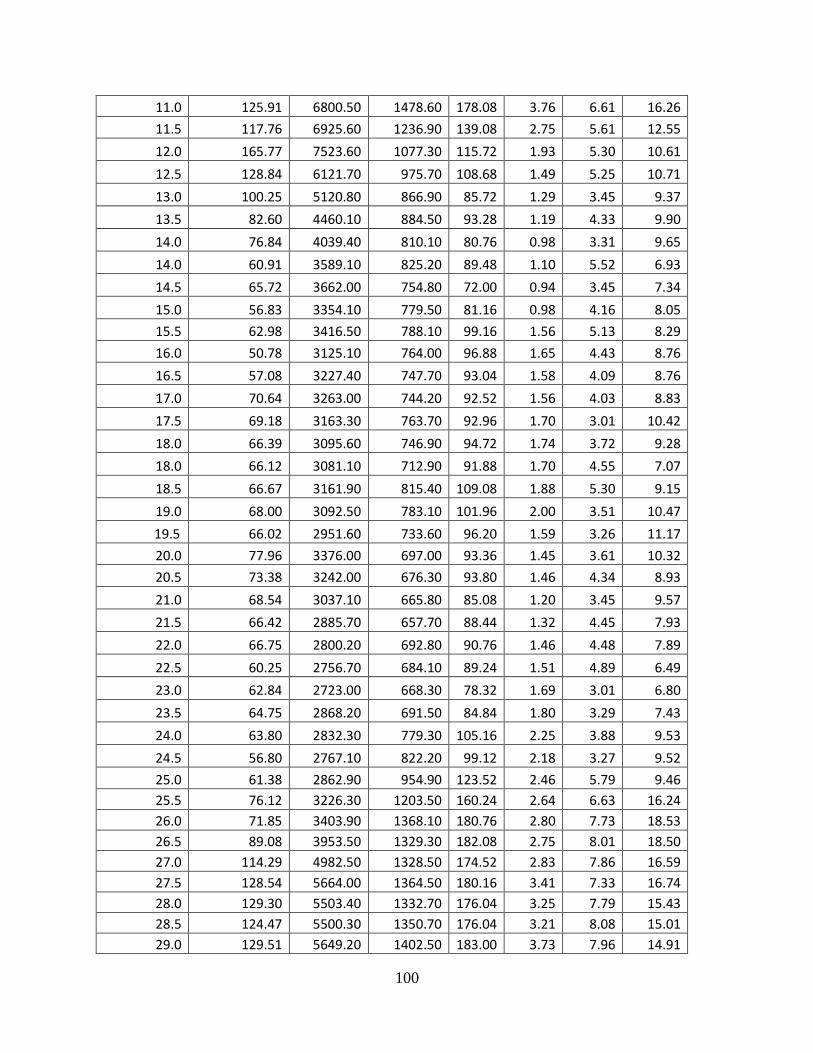
100
11.0 125.91 6800.50 1478.60 178.08 3.76 6.61 16.26
11.5 117.76 6925.60 1236.90 139.08 2.75 5.61 12.55
12.0 165.77 7523.60 1077.30 115.72 1.93 5.30 10.61
12.5 128.84 6121.70 975.70 108.68 1.49 5.25 10.71
13.0 100.25 5120.80 866.90 85.72 1.29 3.45 9.37
13.5 82.60 4460.10 884.50 93.28 1.19 4.33 9.90
14.0 76.84 4039.40 810.10 80.76 0.98 3.31 9.65
14.0 60.91 3589.10 825.20 89.48 1.10 5.52 6.93
14.5 65.72 3662.00 754.80 72.00 0.94 3.45 7.34
15.0 56.83 3354.10 779.50 81.16 0.98 4.16 8.05
15.5 62.98 3416.50 788.10 99.16 1.56 5.13 8.29
16.0 50.78 3125.10 764.00 96.88 1.65 4.43 8.76
16.5 57.08 3227.40 747.70 93.04 1.58 4.09 8.76
17.0 70.64 3263.00 744.20 92.52 1.56 4.03 8.83
17.5 69.18 3163.30 763.70 92.96 1.70 3.01 10.42
18.0 66.39 3095.60 746.90 94.72 1.74 3.72 9.28
18.0 66.12 3081.10 712.90 91.88 1.70 4.55 7.07
18.5 66.67 3161.90 815.40 109.08 1.88 5.30 9.15
19.0 68.00 3092.50 783.10 101.96 2.00 3.51 10.47
19.5 66.02 2951.60 733.60 96.20 1.59 3.26 11.17
20.0 77.96 3376.00 697.00 93.36 1.45 3.61 10.32
20.5 73.38 3242.00 676.30 93.80 1.46 4.34 8.93
21.0 68.54 3037.10 665.80 85.08 1.20 3.45 9.57
21.5 66.42 2885.70 657.70 88.44 1.32 4.45 7.93
22.0 66.75 2800.20 692.80 90.76 1.46 4.48 7.89
22.5 60.25 2756.70 684.10 89.24 1.51 4.89 6.49
23.0 62.84 2723.00 668.30 78.32 1.69 3.01 6.80
23.5 64.75 2868.20 691.50 84.84 1.80 3.29 7.43
24.0 63.80 2832.30 779.30 105.16 2.25 3.88 9.53
24.5 56.80 2767.10 822.20 99.12 2.18 3.27 9.52
25.0 61.38 2862.90 954.90 123.52 2.46 5.79 9.46
25.5 76.12 3226.30 1203.50 160.24 2.64 6.63 16.24
26.0 71.85 3403.90 1368.10 180.76 2.80 7.73 18.53
26.5 89.08 3953.50 1329.30 182.08 2.75 8.01 18.50
27.0 114.29 4982.50 1328.50 174.52 2.83 7.86 16.59
27.5 128.54 5664.00 1364.50 180.16 3.41 7.33 16.74
28.0 129.30 5503.40 1332.70 176.04 3.25 7.79 15.43
28.5 124.47 5500.30 1350.70 176.04 3.21 8.08 15.01
29.0 129.51 5649.20 1402.50 183.00 3.73 7.96 14.91
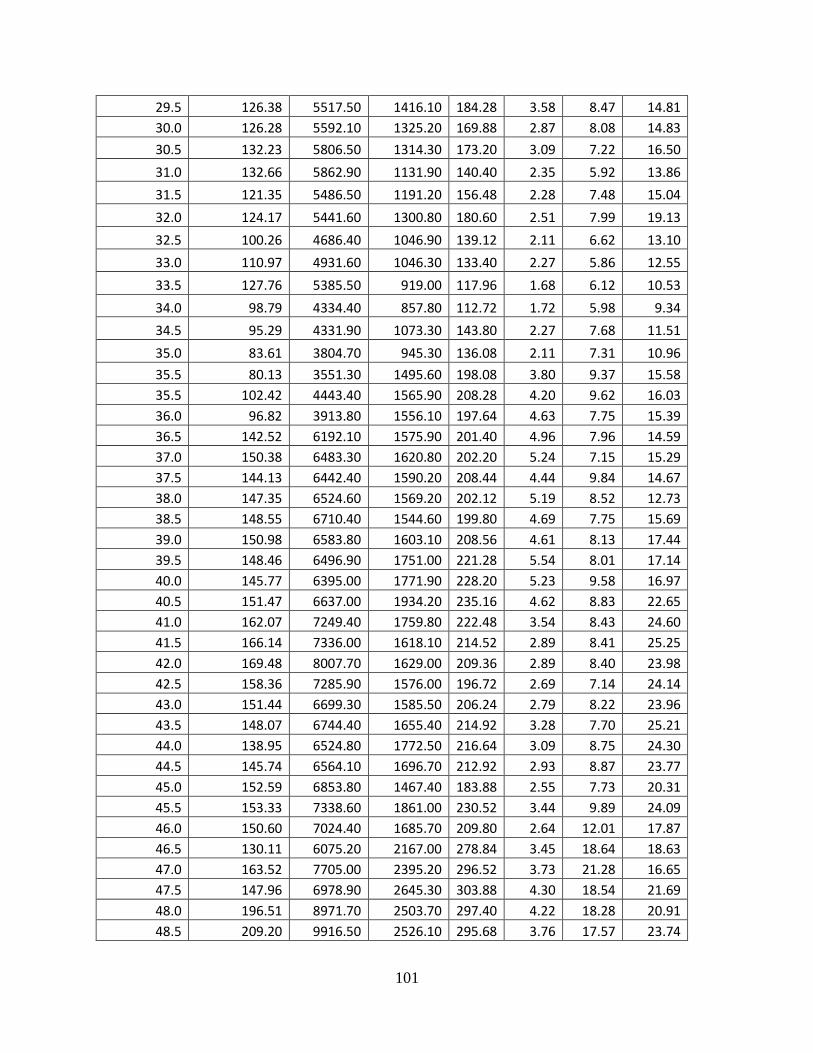
101
29.5 126.38 5517.50 1416.10 184.28 3.58 8.47 14.81
30.0 126.28 5592.10 1325.20 169.88 2.87 8.08 14.83
30.5 132.23 5806.50 1314.30 173.20 3.09 7.22 16.50
31.0 132.66 5862.90 1131.90 140.40 2.35 5.92 13.86
31.5 121.35 5486.50 1191.20 156.48 2.28 7.48 15.04
32.0 124.17 5441.60 1300.80 180.60 2.51 7.99 19.13
32.5 100.26 4686.40 1046.90 139.12 2.11 6.62 13.10
33.0 110.97 4931.60 1046.30 133.40 2.27 5.86 12.55
33.5 127.76 5385.50 919.00 117.96 1.68 6.12 10.53
34.0 98.79 4334.40 857.80 112.72 1.72 5.98 9.34
34.5 95.29 4331.90 1073.30 143.80 2.27 7.68 11.51
35.0 83.61 3804.70 945.30 136.08 2.11 7.31 10.96
35.5 80.13 3551.30 1495.60 198.08 3.80 9.37 15.58
35.5 102.42 4443.40 1565.90 208.28 4.20 9.62 16.03
36.0 96.82 3913.80 1556.10 197.64 4.63 7.75 15.39
36.5 142.52 6192.10 1575.90 201.40 4.96 7.96 14.59
37.0 150.38 6483.30 1620.80 202.20 5.24 7.15 15.29
37.5 144.13 6442.40 1590.20 208.44 4.44 9.84 14.67
38.0 147.35 6524.60 1569.20 202.12 5.19 8.52 12.73
38.5 148.55 6710.40 1544.60 199.80 4.69 7.75 15.69
39.0 150.98 6583.80 1603.10 208.56 4.61 8.13 17.44
39.5 148.46 6496.90 1751.00 221.28 5.54 8.01 17.14
40.0 145.77 6395.00 1771.90 228.20 5.23 9.58 16.97
40.5 151.47 6637.00 1934.20 235.16 4.62 8.83 22.65
41.0 162.07 7249.40 1759.80 222.48 3.54 8.43 24.60
41.5 166.14 7336.00 1618.10 214.52 2.89 8.41 25.25
42.0 169.48 8007.70 1629.00 209.36 2.89 8.40 23.98
42.5 158.36 7285.90 1576.00 196.72 2.69 7.14 24.14
43.0 151.44 6699.30 1585.50 206.24 2.79 8.22 23.96
43.5 148.07 6744.40 1655.40 214.92 3.28 7.70 25.21
44.0 138.95 6524.80 1772.50 216.64 3.09 8.75 24.30
44.5 145.74 6564.10 1696.70 212.92 2.93 8.87 23.77
45.0 152.59 6853.80 1467.40 183.88 2.55 7.73 20.31
45.5 153.33 7338.60 1861.00 230.52 3.44 9.89 24.09
46.0 150.60 7024.40 1685.70 209.80 2.64 12.01 17.87
46.5 130.11 6075.20 2167.00 278.84 3.45 18.64 18.63
47.0 163.52 7705.00 2395.20 296.52 3.73 21.28 16.65
47.5 147.96 6978.90 2645.30 303.88 4.30 18.54 21.69
48.0 196.51 8971.70 2503.70 297.40 4.22 18.28 20.91
48.5 209.20 9916.50 2526.10 295.68 3.76 17.57 23.74
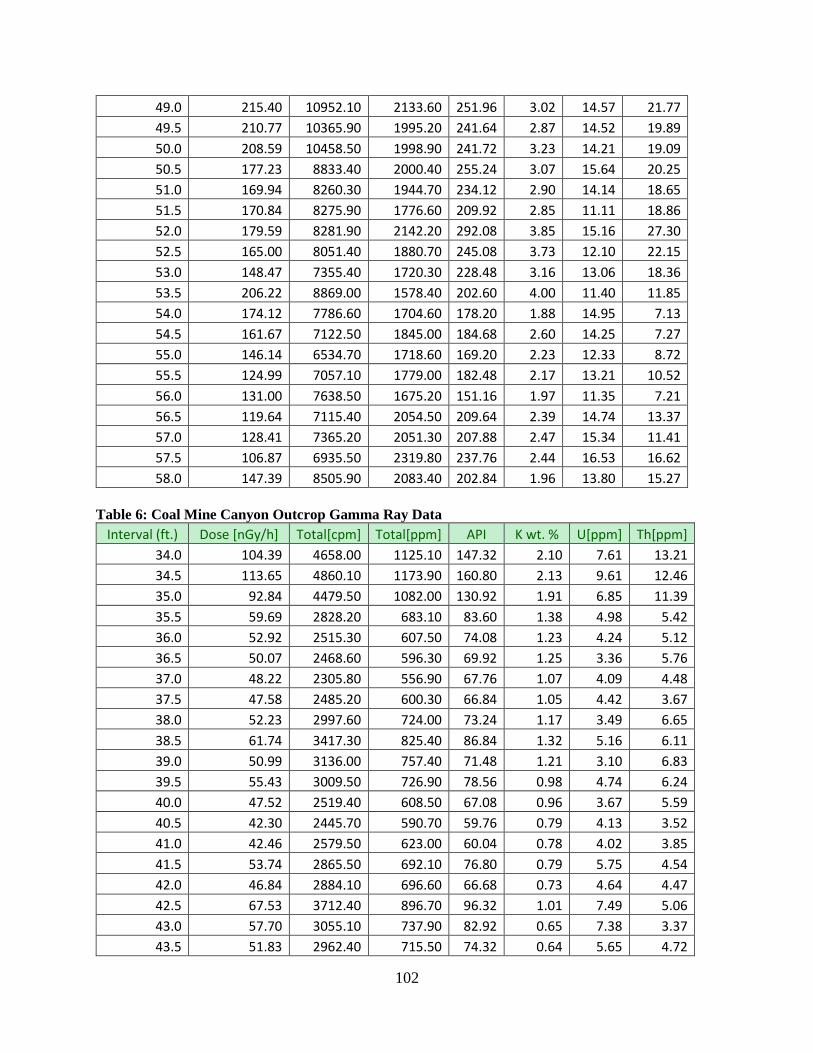
102
49.0 215.40 10952.10 2133.60 251.96 3.02 14.57 21.77
49.5 210.77 10365.90 1995.20 241.64 2.87 14.52 19.89
50.0 208.59 10458.50 1998.90 241.72 3.23 14.21 19.09
50.5 177.23 8833.40 2000.40 255.24 3.07 15.64 20.25
51.0 169.94 8260.30 1944.70 234.12 2.90 14.14 18.65
51.5 170.84 8275.90 1776.60 209.92 2.85 11.11 18.86
52.0 179.59 8281.90 2142.20 292.08 3.85 15.16 27.30
52.5 165.00 8051.40 1880.70 245.08 3.73 12.10 22.15
53.0 148.47 7355.40 1720.30 228.48 3.16 13.06 18.36
53.5 206.22 8869.00 1578.40 202.60 4.00 11.40 11.85
54.0 174.12 7786.60 1704.60 178.20 1.88 14.95 7.13
54.5 161.67 7122.50 1845.00 184.68 2.60 14.25 7.27
55.0 146.14 6534.70 1718.60 169.20 2.23 12.33 8.72
55.5 124.99 7057.10 1779.00 182.48 2.17 13.21 10.52
56.0 131.00 7638.50 1675.20 151.16 1.97 11.35 7.21
56.5 119.64 7115.40 2054.50 209.64 2.39 14.74 13.37
57.0 128.41 7365.20 2051.30 207.88 2.47 15.34 11.41
57.5 106.87 6935.50 2319.80 237.76 2.44 16.53 16.62
58.0 147.39 8505.90 2083.40 202.84 1.96 13.80 15.27
Table 6: Coal Mine Canyon Outcrop Gamma Ray Data
Interval (ft.) Dose [nGy/h] Total[cpm] Total[ppm] API K wt. % U[ppm] Th[ppm]
34.0 104.39 4658.00 1125.10 147.32 2.10 7.61 13.21
34.5 113.65 4860.10 1173.90 160.80 2.13 9.61 12.46
35.0 92.84 4479.50 1082.00 130.92 1.91 6.85 11.39
35.5 59.69 2828.20 683.10 83.60 1.38 4.98 5.42
36.0 52.92 2515.30 607.50 74.08 1.23 4.24 5.12
36.5 50.07 2468.60 596.30 69.92 1.25 3.36 5.76
37.0 48.22 2305.80 556.90 67.76 1.07 4.09 4.48
37.5 47.58 2485.20 600.30 66.84 1.05 4.42 3.67
38.0 52.23 2997.60 724.00 73.24 1.17 3.49 6.65
38.5 61.74 3417.30 825.40 86.84 1.32 5.16 6.11
39.0 50.99 3136.00 757.40 71.48 1.21 3.10 6.83
39.5 55.43 3009.50 726.90 78.56 0.98 4.74 6.24
40.0 47.52 2519.40 608.50 67.08 0.96 3.67 5.59
40.5 42.30 2445.70 590.70 59.76 0.79 4.13 3.52
41.0 42.46 2579.50 623.00 60.04 0.78 4.02 3.85
41.5 53.74 2865.50 692.10 76.80 0.79 5.75 4.54
42.0 46.84 2884.10 696.60 66.68 0.73 4.64 4.47
42.5 67.53 3712.40 896.70 96.32 1.01 7.49 5.06
43.0 57.70 3055.10 737.90 82.92 0.65 7.38 3.37
43.5 51.83 2962.40 715.50 74.32 0.64 5.65 4.72
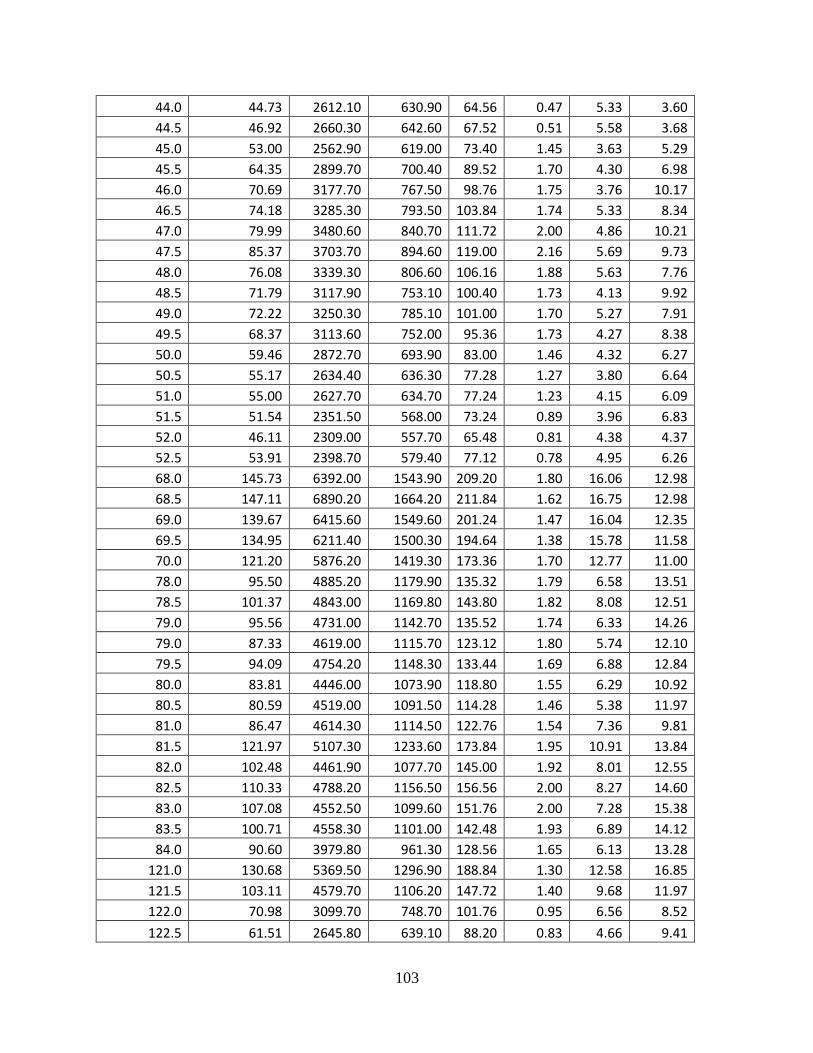
103
44.0 44.73 2612.10 630.90 64.56 0.47 5.33 3.60
44.5 46.92 2660.30 642.60 67.52 0.51 5.58 3.68
45.0 53.00 2562.90 619.00 73.40 1.45 3.63 5.29
45.5 64.35 2899.70 700.40 89.52 1.70 4.30 6.98
46.0 70.69 3177.70 767.50 98.76 1.75 3.76 10.17
46.5 74.18 3285.30 793.50 103.84 1.74 5.33 8.34
47.0 79.99 3480.60 840.70 111.72 2.00 4.86 10.21
47.5 85.37 3703.70 894.60 119.00 2.16 5.69 9.73
48.0 76.08 3339.30 806.60 106.16 1.88 5.63 7.76
48.5 71.79 3117.90 753.10 100.40 1.73 4.13 9.92
49.0 72.22 3250.30 785.10 101.00 1.70 5.27 7.91
49.5 68.37 3113.60 752.00 95.36 1.73 4.27 8.38
50.0 59.46 2872.70 693.90 83.00 1.46 4.32 6.27
50.5 55.17 2634.40 636.30 77.28 1.27 3.80 6.64
51.0 55.00 2627.70 634.70 77.24 1.23 4.15 6.09
51.5 51.54 2351.50 568.00 73.24 0.89 3.96 6.83
52.0 46.11 2309.00 557.70 65.48 0.81 4.38 4.37
52.5 53.91 2398.70 579.40 77.12 0.78 4.95 6.26
68.0 145.73 6392.00 1543.90 209.20 1.80 16.06 12.98
68.5 147.11 6890.20 1664.20 211.84 1.62 16.75 12.98
69.0 139.67 6415.60 1549.60 201.24 1.47 16.04 12.35
69.5 134.95 6211.40 1500.30 194.64 1.38 15.78 11.58
70.0 121.20 5876.20 1419.30 173.36 1.70 12.77 11.00
78.0 95.50 4885.20 1179.90 135.32 1.79 6.58 13.51
78.5 101.37 4843.00 1169.80 143.80 1.82 8.08 12.51
79.0 95.56 4731.00 1142.70 135.52 1.74 6.33 14.26
79.0 87.33 4619.00 1115.70 123.12 1.80 5.74 12.10
79.5 94.09 4754.20 1148.30 133.44 1.69 6.88 12.84
80.0 83.81 4446.00 1073.90 118.80 1.55 6.29 10.92
80.5 80.59 4519.00 1091.50 114.28 1.46 5.38 11.97
81.0 86.47 4614.30 1114.50 122.76 1.54 7.36 9.81
81.5 121.97 5107.30 1233.60 173.84 1.95 10.91 13.84
82.0 102.48 4461.90 1077.70 145.00 1.92 8.01 12.55
82.5 110.33 4788.20 1156.50 156.56 2.00 8.27 14.60
83.0 107.08 4552.50 1099.60 151.76 2.00 7.28 15.38
83.5 100.71 4558.30 1101.00 142.48 1.93 6.89 14.12
84.0 90.60 3979.80 961.30 128.56 1.65 6.13 13.28
121.0 130.68 5369.50 1296.90 188.84 1.30 12.58 16.85
121.5 103.11 4579.70 1106.20 147.72 1.40 9.68 11.97
122.0 70.98 3099.70 748.70 101.76 0.95 6.56 8.52
122.5 61.51 2645.80 639.10 88.20 0.83 4.66 9.41
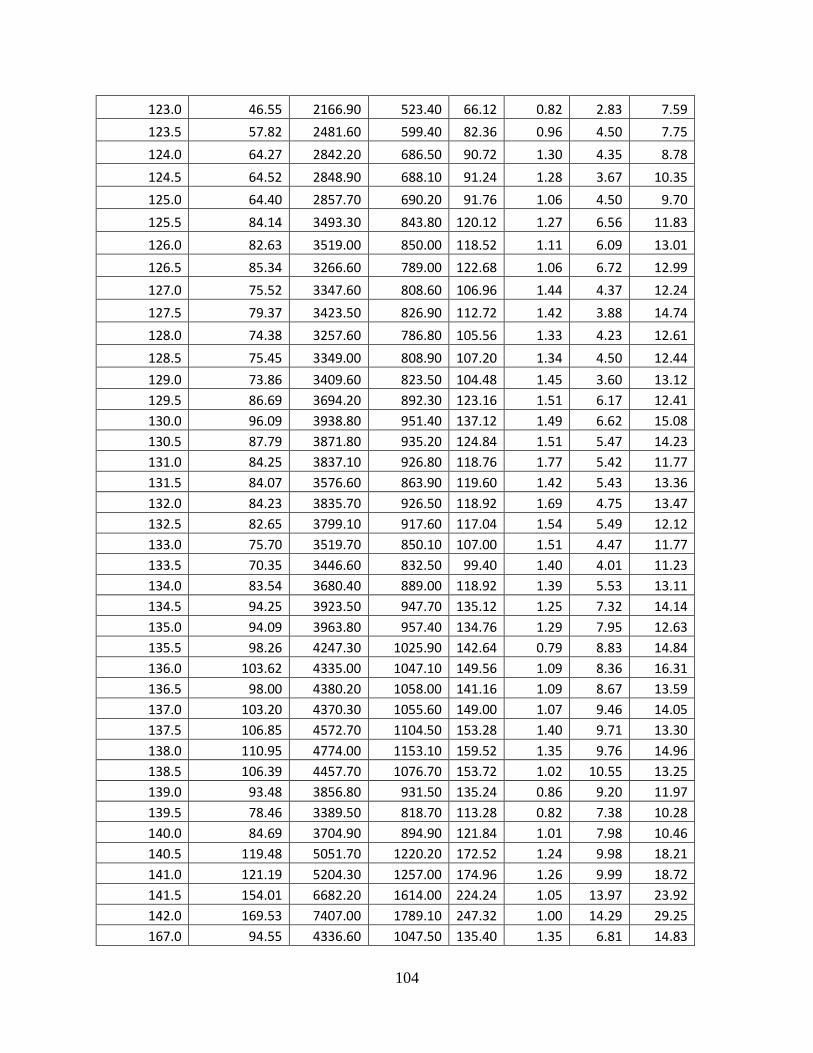
104
123.0 46.55 2166.90 523.40 66.12 0.82 2.83 7.59
123.5 57.82 2481.60 599.40 82.36 0.96 4.50 7.75
124.0 64.27 2842.20 686.50 90.72 1.30 4.35 8.78
124.5 64.52 2848.90 688.10 91.24 1.28 3.67 10.35
125.0 64.40 2857.70 690.20 91.76 1.06 4.50 9.70
125.5 84.14 3493.30 843.80 120.12 1.27 6.56 11.83
126.0 82.63 3519.00 850.00 118.52 1.11 6.09 13.01
126.5 85.34 3266.60 789.00 122.68 1.06 6.72 12.99
127.0 75.52 3347.60 808.60 106.96 1.44 4.37 12.24
127.5 79.37 3423.50 826.90 112.72 1.42 3.88 14.74
128.0 74.38 3257.60 786.80 105.56 1.33 4.23 12.61
128.5 75.45 3349.00 808.90 107.20 1.34 4.50 12.44
129.0 73.86 3409.60 823.50 104.48 1.45 3.60 13.12
129.5 86.69 3694.20 892.30 123.16 1.51 6.17 12.41
130.0 96.09 3938.80 951.40 137.12 1.49 6.62 15.08
130.5 87.79 3871.80 935.20 124.84 1.51 5.47 14.23
131.0 84.25 3837.10 926.80 118.76 1.77 5.42 11.77
131.5 84.07 3576.60 863.90 119.60 1.42 5.43 13.36
132.0 84.23 3835.70 926.50 118.92 1.69 4.75 13.47
132.5 82.65 3799.10 917.60 117.04 1.54 5.49 12.12
133.0 75.70 3519.70 850.10 107.00 1.51 4.47 11.77
133.5 70.35 3446.60 832.50 99.40 1.40 4.01 11.23
134.0 83.54 3680.40 889.00 118.92 1.39 5.53 13.11
134.5 94.25 3923.50 947.70 135.12 1.25 7.32 14.14
135.0 94.09 3963.80 957.40 134.76 1.29 7.95 12.63
135.5 98.26 4247.30 1025.90 142.64 0.79 8.83 14.84
136.0 103.62 4335.00 1047.10 149.56 1.09 8.36 16.31
136.5 98.00 4380.20 1058.00 141.16 1.09 8.67 13.59
137.0 103.20 4370.30 1055.60 149.00 1.07 9.46 14.05
137.5 106.85 4572.70 1104.50 153.28 1.40 9.71 13.30
138.0 110.95 4774.00 1153.10 159.52 1.35 9.76 14.96
138.5 106.39 4457.70 1076.70 153.72 1.02 10.55 13.25
139.0 93.48 3856.80 931.50 135.24 0.86 9.20 11.97
139.5 78.46 3389.50 818.70 113.28 0.82 7.38 10.28
140.0 84.69 3704.90 894.90 121.84 1.01 7.98 10.46
140.5 119.48 5051.70 1220.20 172.52 1.24 9.98 18.21
141.0 121.19 5204.30 1257.00 174.96 1.26 9.99 18.72
141.5 154.01 6682.20 1614.00 224.24 1.05 13.97 23.92
142.0 169.53 7407.00 1789.10 247.32 1.00 14.29 29.25
167.0 94.55 4336.60 1047.50 135.40 1.35 6.81 14.83
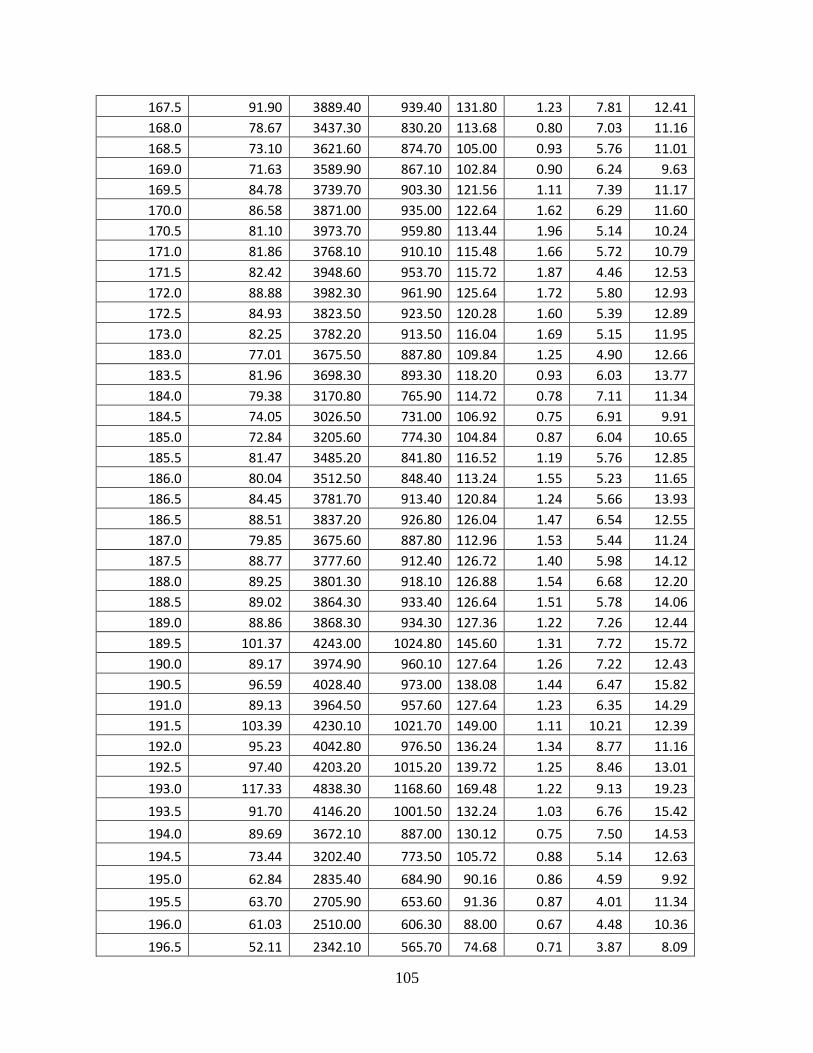
105
167.5 91.90 3889.40 939.40 131.80 1.23 7.81 12.41
168.0 78.67 3437.30 830.20 113.68 0.80 7.03 11.16
168.5 73.10 3621.60 874.70 105.00 0.93 5.76 11.01
169.0 71.63 3589.90 867.10 102.84 0.90 6.24 9.63
169.5 84.78 3739.70 903.30 121.56 1.11 7.39 11.17
170.0 86.58 3871.00 935.00 122.64 1.62 6.29 11.60
170.5 81.10 3973.70 959.80 113.44 1.96 5.14 10.24
171.0 81.86 3768.10 910.10 115.48 1.66 5.72 10.79
171.5 82.42 3948.60 953.70 115.72 1.87 4.46 12.53
172.0 88.88 3982.30 961.90 125.64 1.72 5.80 12.93
172.5 84.93 3823.50 923.50 120.28 1.60 5.39 12.89
173.0 82.25 3782.20 913.50 116.04 1.69 5.15 11.95
183.0 77.01 3675.50 887.80 109.84 1.25 4.90 12.66
183.5 81.96 3698.30 893.30 118.20 0.93 6.03 13.77
184.0 79.38 3170.80 765.90 114.72 0.78 7.11 11.34
184.5 74.05 3026.50 731.00 106.92 0.75 6.91 9.91
185.0 72.84 3205.60 774.30 104.84 0.87 6.04 10.65
185.5 81.47 3485.20 841.80 116.52 1.19 5.76 12.85
186.0 80.04 3512.50 848.40 113.24 1.55 5.23 11.65
186.5 84.45 3781.70 913.40 120.84 1.24 5.66 13.93
186.5 88.51 3837.20 926.80 126.04 1.47 6.54 12.55
187.0 79.85 3675.60 887.80 112.96 1.53 5.44 11.24
187.5 88.77 3777.60 912.40 126.72 1.40 5.98 14.12
188.0 89.25 3801.30 918.10 126.88 1.54 6.68 12.20
188.5 89.02 3864.30 933.40 126.64 1.51 5.78 14.06
189.0 88.86 3868.30 934.30 127.36 1.22 7.26 12.44
189.5 101.37 4243.00 1024.80 145.60 1.31 7.72 15.72
190.0 89.17 3974.90 960.10 127.64 1.26 7.22 12.43
190.5 96.59 4028.40 973.00 138.08 1.44 6.47 15.82
191.0 89.13 3964.50 957.60 127.64 1.23 6.35 14.29
191.5 103.39 4230.10 1021.70 149.00 1.11 10.21 12.39
192.0 95.23 4042.80 976.50 136.24 1.34 8.77 11.16
192.5 97.40 4203.20 1015.20 139.72 1.25 8.46 13.01
193.0 117.33 4838.30 1168.60 169.48 1.22 9.13 19.23
193.5 91.70 4146.20 1001.50 132.24 1.03 6.76 15.42
194.0 89.69 3672.10 887.00 130.12 0.75 7.50 14.53
194.5 73.44 3202.40 773.50 105.72 0.88 5.14 12.63
195.0 62.84 2835.40 684.90 90.16 0.86 4.59 9.92
195.5 63.70 2705.90 653.60 91.36 0.87 4.01 11.34
196.0 61.03 2510.00 606.30 88.00 0.67 4.48 10.36
196.5 52.11 2342.10 565.70 74.68 0.71 3.87 8.09
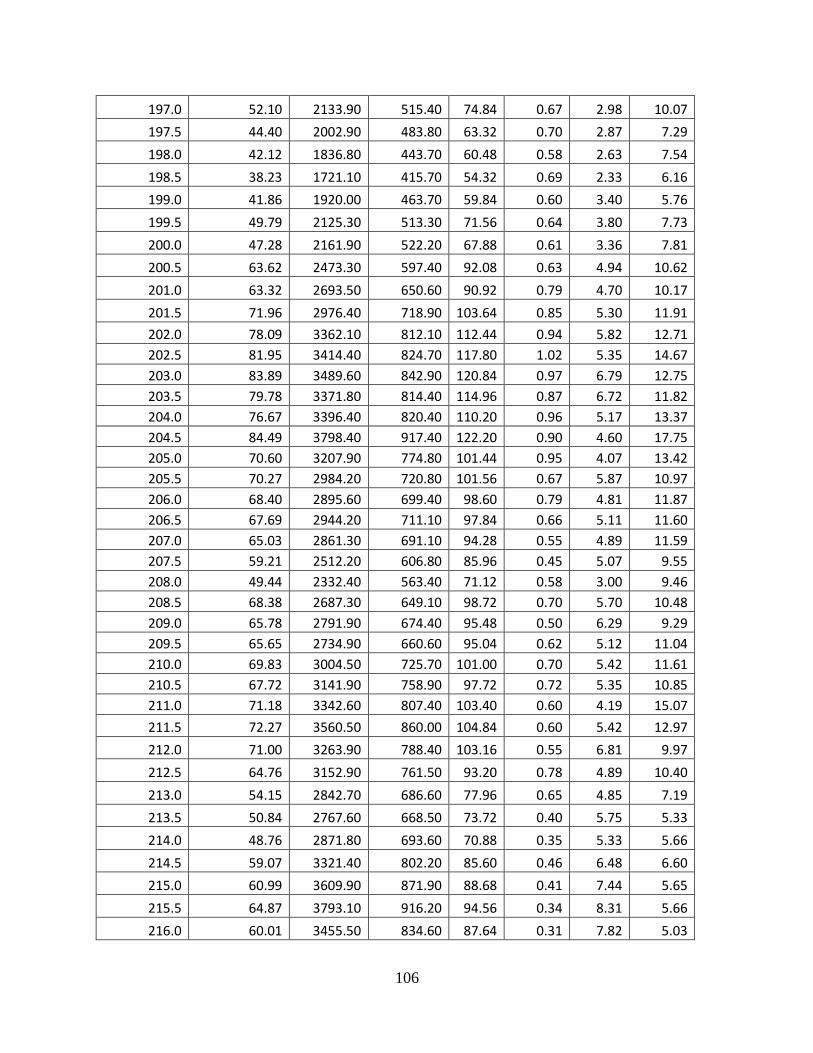
106
197.0 52.10 2133.90 515.40 74.84 0.67 2.98 10.07
197.5 44.40 2002.90 483.80 63.32 0.70 2.87 7.29
198.0 42.12 1836.80 443.70 60.48 0.58 2.63 7.54
198.5 38.23 1721.10 415.70 54.32 0.69 2.33 6.16
199.0 41.86 1920.00 463.70 59.84 0.60 3.40 5.76
199.5 49.79 2125.30 513.30 71.56 0.64 3.80 7.73
200.0 47.28 2161.90 522.20 67.88 0.61 3.36 7.81
200.5 63.62 2473.30 597.40 92.08 0.63 4.94 10.62
201.0 63.32 2693.50 650.60 90.92 0.79 4.70 10.17
201.5 71.96 2976.40 718.90 103.64 0.85 5.30 11.91
202.0 78.09 3362.10 812.10 112.44 0.94 5.82 12.71
202.5 81.95 3414.40 824.70 117.80 1.02 5.35 14.67
203.0 83.89 3489.60 842.90 120.84 0.97 6.79 12.75
203.5 79.78 3371.80 814.40 114.96 0.87 6.72 11.82
204.0 76.67 3396.40 820.40 110.20 0.96 5.17 13.37
204.5 84.49 3798.40 917.40 122.20 0.90 4.60 17.75
205.0 70.60 3207.90 774.80 101.44 0.95 4.07 13.42
205.5 70.27 2984.20 720.80 101.56 0.67 5.87 10.97
206.0 68.40 2895.60 699.40 98.60 0.79 4.81 11.87
206.5 67.69 2944.20 711.10 97.84 0.66 5.11 11.60
207.0 65.03 2861.30 691.10 94.28 0.55 4.89 11.59
207.5 59.21 2512.20 606.80 85.96 0.45 5.07 9.55
208.0 49.44 2332.40 563.40 71.12 0.58 3.00 9.46
208.5 68.38 2687.30 649.10 98.72 0.70 5.70 10.48
209.0 65.78 2791.90 674.40 95.48 0.50 6.29 9.29
209.5 65.65 2734.90 660.60 95.04 0.62 5.12 11.04
210.0 69.83 3004.50 725.70 101.00 0.70 5.42 11.61
210.5 67.72 3141.90 758.90 97.72 0.72 5.35 10.85
211.0 71.18 3342.60 807.40 103.40 0.60 4.19 15.07
211.5 72.27 3560.50 860.00 104.84 0.60 5.42 12.97
212.0 71.00 3263.90 788.40 103.16 0.55 6.81 9.97
212.5 64.76 3152.90 761.50 93.20 0.78 4.89 10.40
213.0 54.15 2842.70 686.60 77.96 0.65 4.85 7.19
213.5 50.84 2767.60 668.50 73.72 0.40 5.75 5.33
214.0 48.76 2871.80 693.60 70.88 0.35 5.33 5.66
214.5 59.07 3321.40 802.20 85.60 0.46 6.48 6.60
215.0 60.99 3609.90 871.90 88.68 0.41 7.44 5.65
215.5 64.87 3793.10 916.20 94.56 0.34 8.31 5.66
216.0 60.01 3455.50 834.60 87.64 0.31 7.82 5.03
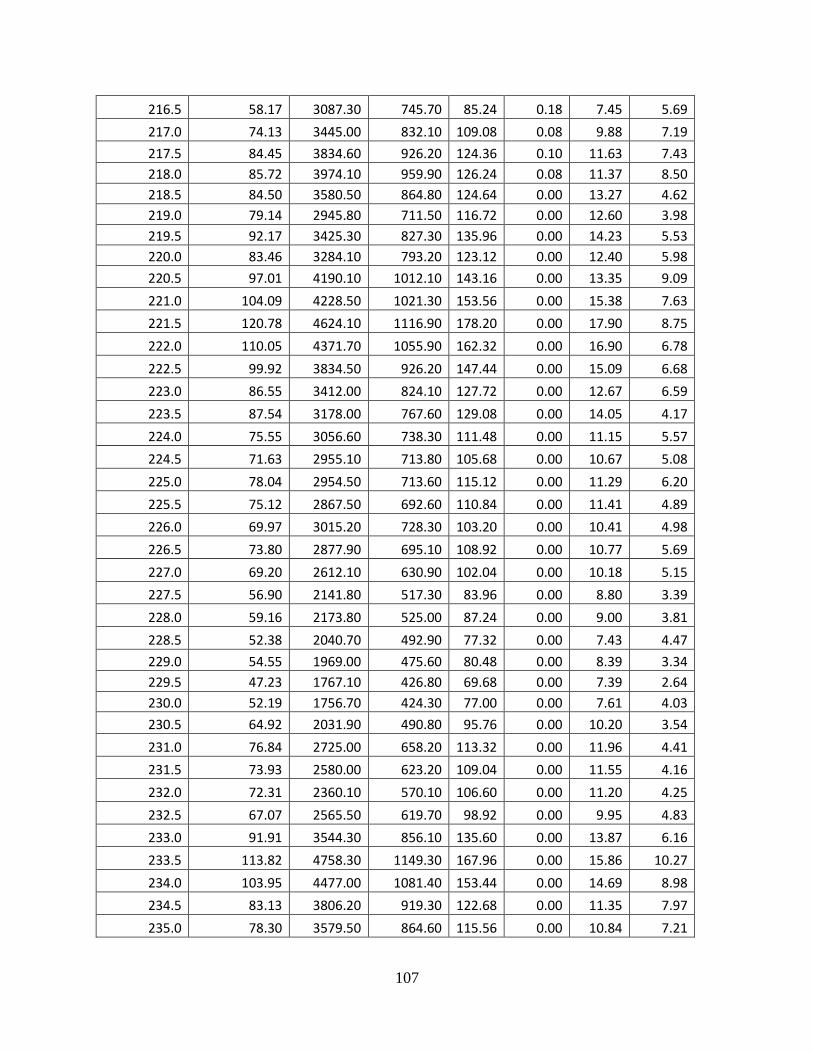
107
216.5 58.17 3087.30 745.70 85.24 0.18 7.45 5.69
217.0 74.13 3445.00 832.10 109.08 0.08 9.88 7.19
217.5 84.45 3834.60 926.20 124.36 0.10 11.63 7.43
218.0 85.72 3974.10 959.90 126.24 0.08 11.37 8.50
218.5 84.50 3580.50 864.80 124.64 0.00 13.27 4.62
219.0 79.14 2945.80 711.50 116.72 0.00 12.60 3.98
219.5 92.17 3425.30 827.30 135.96 0.00 14.23 5.53
220.0 83.46 3284.10 793.20 123.12 0.00 12.40 5.98
220.5 97.01 4190.10 1012.10 143.16 0.00 13.35 9.09
221.0 104.09 4228.50 1021.30 153.56 0.00 15.38 7.63
221.5 120.78 4624.10 1116.90 178.20 0.00 17.90 8.75
222.0 110.05 4371.70 1055.90 162.32 0.00 16.90 6.78
222.5 99.92 3834.50 926.20 147.44 0.00 15.09 6.68
223.0 86.55 3412.00 824.10 127.72 0.00 12.67 6.59
223.5 87.54 3178.00 767.60 129.08 0.00 14.05 4.17
224.0 75.55 3056.60 738.30 111.48 0.00 11.15 5.57
224.5 71.63 2955.10 713.80 105.68 0.00 10.67 5.08
225.0 78.04 2954.50 713.60 115.12 0.00 11.29 6.20
225.5 75.12 2867.50 692.60 110.84 0.00 11.41 4.89
226.0 69.97 3015.20 728.30 103.20 0.00 10.41 4.98
226.5 73.80 2877.90 695.10 108.92 0.00 10.77 5.69
227.0 69.20 2612.10 630.90 102.04 0.00 10.18 5.15
227.5 56.90 2141.80 517.30 83.96 0.00 8.80 3.39
228.0 59.16 2173.80 525.00 87.24 0.00 9.00 3.81
228.5 52.38 2040.70 492.90 77.32 0.00 7.43 4.47
229.0 54.55 1969.00 475.60 80.48 0.00 8.39 3.34
229.5 47.23 1767.10 426.80 69.68 0.00 7.39 2.64
230.0 52.19 1756.70 424.30 77.00 0.00 7.61 4.03
230.5 64.92 2031.90 490.80 95.76 0.00 10.20 3.54
231.0 76.84 2725.00 658.20 113.32 0.00 11.96 4.41
231.5 73.93 2580.00 623.20 109.04 0.00 11.55 4.16
232.0 72.31 2360.10 570.10 106.60 0.00 11.20 4.25
232.5 67.07 2565.50 619.70 98.92 0.00 9.95 4.83
233.0 91.91 3544.30 856.10 135.60 0.00 13.87 6.16
233.5 113.82 4758.30 1149.30 167.96 0.00 15.86 10.27
234.0 103.95 4477.00 1081.40 153.44 0.00 14.69 8.98
234.5 83.13 3806.20 919.30 122.68 0.00 11.35 7.97
235.0 78.30 3579.50 864.60 115.56 0.00 10.84 7.21
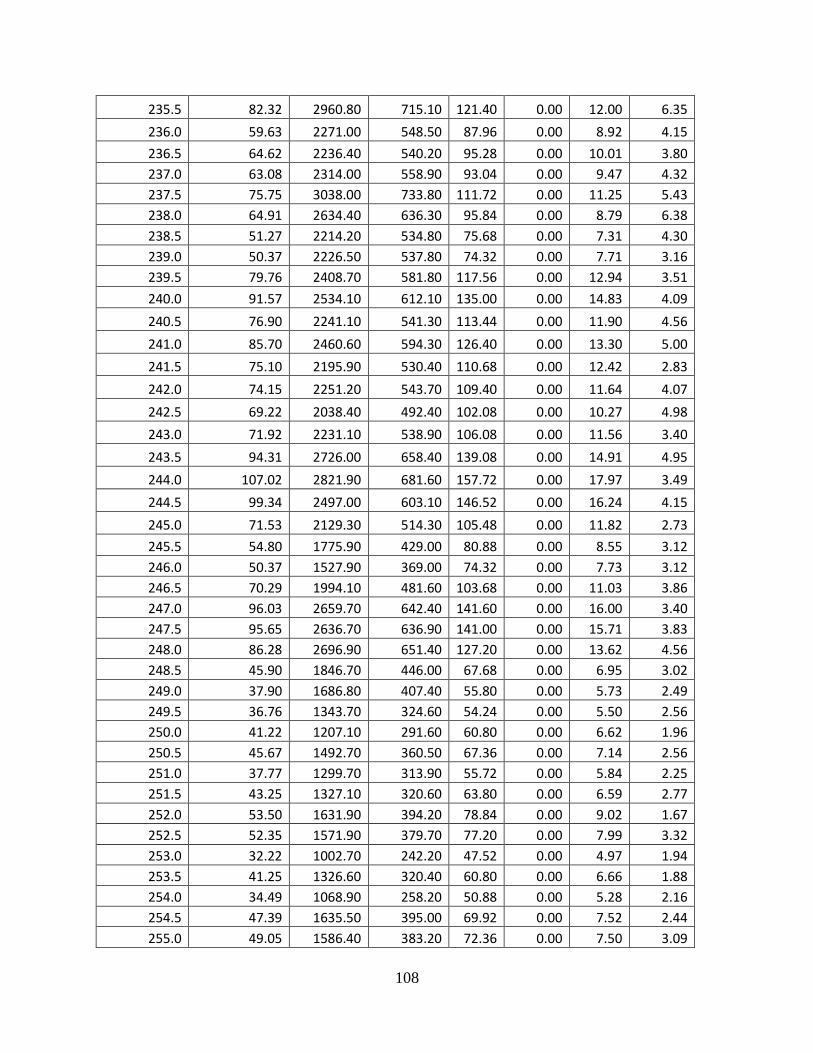
108
235.5 82.32 2960.80 715.10 121.40 0.00 12.00 6.35
236.0 59.63 2271.00 548.50 87.96 0.00 8.92 4.15
236.5 64.62 2236.40 540.20 95.28 0.00 10.01 3.80
237.0 63.08 2314.00 558.90 93.04 0.00 9.47 4.32
237.5 75.75 3038.00 733.80 111.72 0.00 11.25 5.43
238.0 64.91 2634.40 636.30 95.84 0.00 8.79 6.38
238.5 51.27 2214.20 534.80 75.68 0.00 7.31 4.30
239.0 50.37 2226.50 537.80 74.32 0.00 7.71 3.16
239.5 79.76 2408.70 581.80 117.56 0.00 12.94 3.51
240.0 91.57 2534.10 612.10 135.00 0.00 14.83 4.09
240.5 76.90 2241.10 541.30 113.44 0.00 11.90 4.56
241.0 85.70 2460.60 594.30 126.40 0.00 13.30 5.00
241.5 75.10 2195.90 530.40 110.68 0.00 12.42 2.83
242.0 74.15 2251.20 543.70 109.40 0.00 11.64 4.07
242.5 69.22 2038.40 492.40 102.08 0.00 10.27 4.98
243.0 71.92 2231.10 538.90 106.08 0.00 11.56 3.40
243.5 94.31 2726.00 658.40 139.08 0.00 14.91 4.95
244.0 107.02 2821.90 681.60 157.72 0.00 17.97 3.49
244.5 99.34 2497.00 603.10 146.52 0.00 16.24 4.15
245.0 71.53 2129.30 514.30 105.48 0.00 11.82 2.73
245.5 54.80 1775.90 429.00 80.88 0.00 8.55 3.12
246.0 50.37 1527.90 369.00 74.32 0.00 7.73 3.12
246.5 70.29 1994.10 481.60 103.68 0.00 11.03 3.86
247.0 96.03 2659.70 642.40 141.60 0.00 16.00 3.40
247.5 95.65 2636.70 636.90 141.00 0.00 15.71 3.83
248.0 86.28 2696.90 651.40 127.20 0.00 13.62 4.56
248.5 45.90 1846.70 446.00 67.68 0.00 6.95 3.02
249.0 37.90 1686.80 407.40 55.80 0.00 5.73 2.49
249.5 36.76 1343.70 324.60 54.24 0.00 5.50 2.56
250.0 41.22 1207.10 291.60 60.80 0.00 6.62 1.96
250.5 45.67 1492.70 360.50 67.36 0.00 7.14 2.56
251.0 37.77 1299.70 313.90 55.72 0.00 5.84 2.25
251.5 43.25 1327.10 320.60 63.80 0.00 6.59 2.77
252.0 53.50 1631.90 394.20 78.84 0.00 9.02 1.67
252.5 52.35 1571.90 379.70 77.20 0.00 7.99 3.32
253.0 32.22 1002.70 242.20 47.52 0.00 4.97 1.94
253.5 41.25 1326.60 320.40 60.80 0.00 6.66 1.88
254.0 34.49 1068.90 258.20 50.88 0.00 5.28 2.16
254.5 47.39 1635.50 395.00 69.92 0.00 7.52 2.44
255.0 49.05 1586.40 383.20 72.36 0.00 7.50 3.09
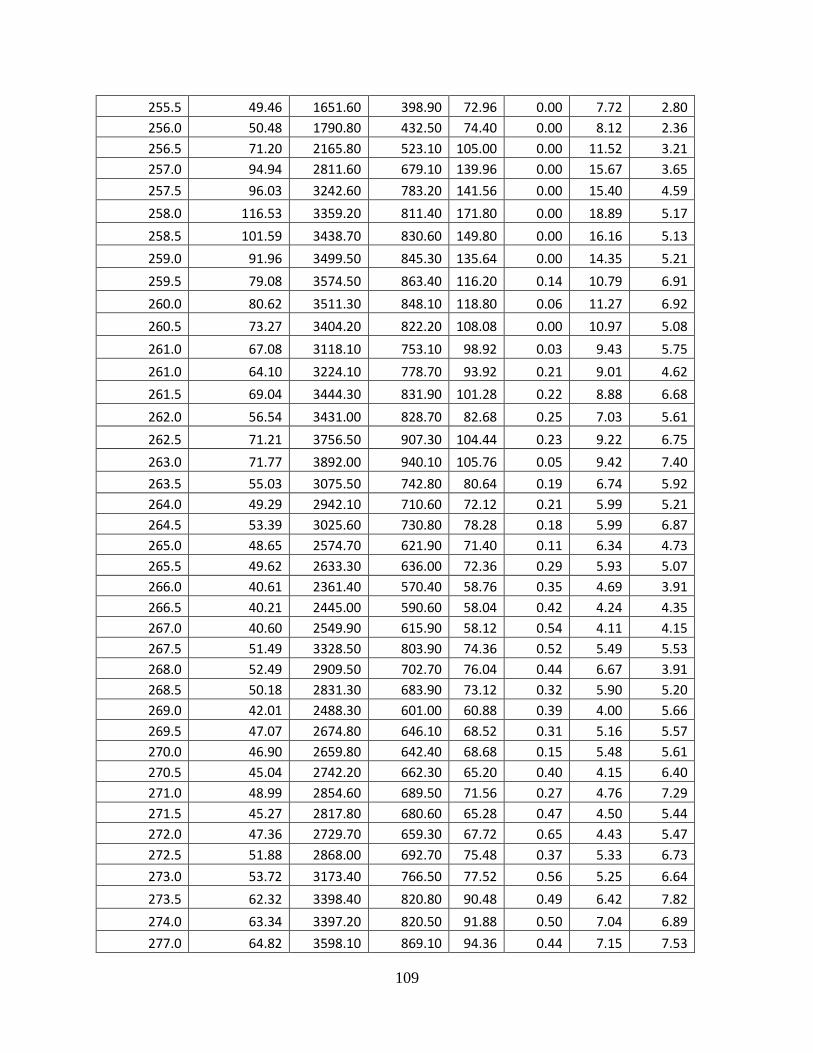
109
255.5 49.46 1651.60 398.90 72.96 0.00 7.72 2.80
256.0 50.48 1790.80 432.50 74.40 0.00 8.12 2.36
256.5 71.20 2165.80 523.10 105.00 0.00 11.52 3.21
257.0 94.94 2811.60 679.10 139.96 0.00 15.67 3.65
257.5 96.03 3242.60 783.20 141.56 0.00 15.40 4.59
258.0 116.53 3359.20 811.40 171.80 0.00 18.89 5.17
258.5 101.59 3438.70 830.60 149.80 0.00 16.16 5.13
259.0 91.96 3499.50 845.30 135.64 0.00 14.35 5.21
259.5 79.08 3574.50 863.40 116.20 0.14 10.79 6.91
260.0 80.62 3511.30 848.10 118.80 0.06 11.27 6.92
260.5 73.27 3404.20 822.20 108.08 0.00 10.97 5.08
261.0 67.08 3118.10 753.10 98.92 0.03 9.43 5.75
261.0 64.10 3224.10 778.70 93.92 0.21 9.01 4.62
261.5 69.04 3444.30 831.90 101.28 0.22 8.88 6.68
262.0 56.54 3431.00 828.70 82.68 0.25 7.03 5.61
262.5 71.21 3756.50 907.30 104.44 0.23 9.22 6.75
263.0 71.77 3892.00 940.10 105.76 0.05 9.42 7.40
263.5 55.03 3075.50 742.80 80.64 0.19 6.74 5.92
264.0 49.29 2942.10 710.60 72.12 0.21 5.99 5.21
264.5 53.39 3025.60 730.80 78.28 0.18 5.99 6.87
265.0 48.65 2574.70 621.90 71.40 0.11 6.34 4.73
265.5 49.62 2633.30 636.00 72.36 0.29 5.93 5.07
266.0 40.61 2361.40 570.40 58.76 0.35 4.69 3.91
266.5 40.21 2445.00 590.60 58.04 0.42 4.24 4.35
267.0 40.60 2549.90 615.90 58.12 0.54 4.11 4.15
267.5 51.49 3328.50 803.90 74.36 0.52 5.49 5.53
268.0 52.49 2909.50 702.70 76.04 0.44 6.67 3.91
268.5 50.18 2831.30 683.90 73.12 0.32 5.90 5.20
269.0 42.01 2488.30 601.00 60.88 0.39 4.00 5.66
269.5 47.07 2674.80 646.10 68.52 0.31 5.16 5.57
270.0 46.90 2659.80 642.40 68.68 0.15 5.48 5.61
270.5 45.04 2742.20 662.30 65.20 0.40 4.15 6.40
271.0 48.99 2854.60 689.50 71.56 0.27 4.76 7.29
271.5 45.27 2817.80 680.60 65.28 0.47 4.50 5.44
272.0 47.36 2729.70 659.30 67.72 0.65 4.43 5.47
272.5 51.88 2868.00 692.70 75.48 0.37 5.33 6.73
273.0 53.72 3173.40 766.50 77.52 0.56 5.25 6.64
273.5 62.32 3398.40 820.80 90.48 0.49 6.42 7.82
274.0 63.34 3397.20 820.50 91.88 0.50 7.04 6.89
277.0 64.82 3598.10 869.10 94.36 0.44 7.15 7.53
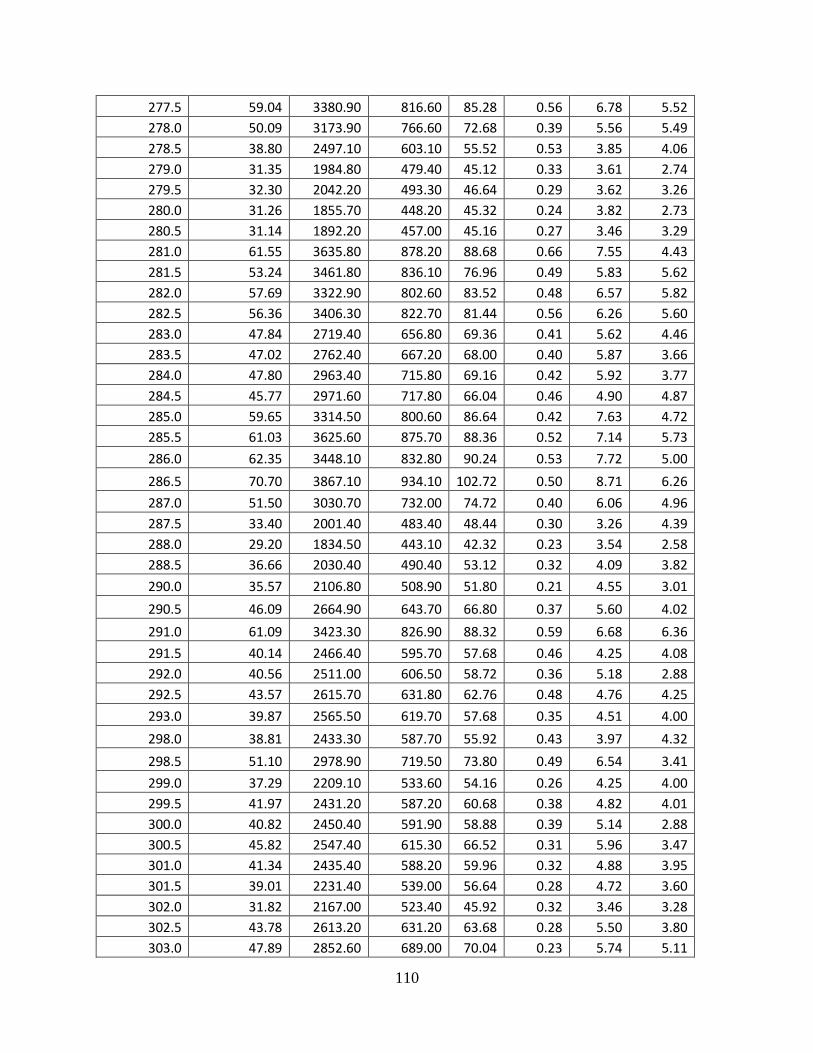
110
277.5 59.04 3380.90 816.60 85.28 0.56 6.78 5.52
278.0 50.09 3173.90 766.60 72.68 0.39 5.56 5.49
278.5 38.80 2497.10 603.10 55.52 0.53 3.85 4.06
279.0 31.35 1984.80 479.40 45.12 0.33 3.61 2.74
279.5 32.30 2042.20 493.30 46.64 0.29 3.62 3.26
280.0 31.26 1855.70 448.20 45.32 0.24 3.82 2.73
280.5 31.14 1892.20 457.00 45.16 0.27 3.46 3.29
281.0 61.55 3635.80 878.20 88.68 0.66 7.55 4.43
281.5 53.24 3461.80 836.10 76.96 0.49 5.83 5.62
282.0 57.69 3322.90 802.60 83.52 0.48 6.57 5.82
282.5 56.36 3406.30 822.70 81.44 0.56 6.26 5.60
283.0 47.84 2719.40 656.80 69.36 0.41 5.62 4.46
283.5 47.02 2762.40 667.20 68.00 0.40 5.87 3.66
284.0 47.80 2963.40 715.80 69.16 0.42 5.92 3.77
284.5 45.77 2971.60 717.80 66.04 0.46 4.90 4.87
285.0 59.65 3314.50 800.60 86.64 0.42 7.63 4.72
285.5 61.03 3625.60 875.70 88.36 0.52 7.14 5.73
286.0 62.35 3448.10 832.80 90.24 0.53 7.72 5.00
286.5 70.70 3867.10 934.10 102.72 0.50 8.71 6.26
287.0 51.50 3030.70 732.00 74.72 0.40 6.06 4.96
287.5 33.40 2001.40 483.40 48.44 0.30 3.26 4.39
288.0 29.20 1834.50 443.10 42.32 0.23 3.54 2.58
288.5 36.66 2030.40 490.40 53.12 0.32 4.09 3.82
290.0 35.57 2106.80 508.90 51.80 0.21 4.55 3.01
290.5 46.09 2664.90 643.70 66.80 0.37 5.60 4.02
291.0 61.09 3423.30 826.90 88.32 0.59 6.68 6.36
291.5 40.14 2466.40 595.70 57.68 0.46 4.25 4.08
292.0 40.56 2511.00 606.50 58.72 0.36 5.18 2.88
292.5 43.57 2615.70 631.80 62.76 0.48 4.76 4.25
293.0 39.87 2565.50 619.70 57.68 0.35 4.51 4.00
298.0 38.81 2433.30 587.70 55.92 0.43 3.97 4.32
298.5 51.10 2978.90 719.50 73.80 0.49 6.54 3.41
299.0 37.29 2209.10 533.60 54.16 0.26 4.25 4.00
299.5 41.97 2431.20 587.20 60.68 0.38 4.82 4.01
300.0 40.82 2450.40 591.90 58.88 0.39 5.14 2.88
300.5 45.82 2547.40 615.30 66.52 0.31 5.96 3.47
301.0 41.34 2435.40 588.20 59.96 0.32 4.88 3.95
301.5 39.01 2231.40 539.00 56.64 0.28 4.72 3.60
302.0 31.82 2167.00 523.40 45.92 0.32 3.46 3.28
302.5 43.78 2613.20 631.20 63.68 0.28 5.50 3.80
303.0 47.89 2852.60 689.00 70.04 0.23 5.74 5.11
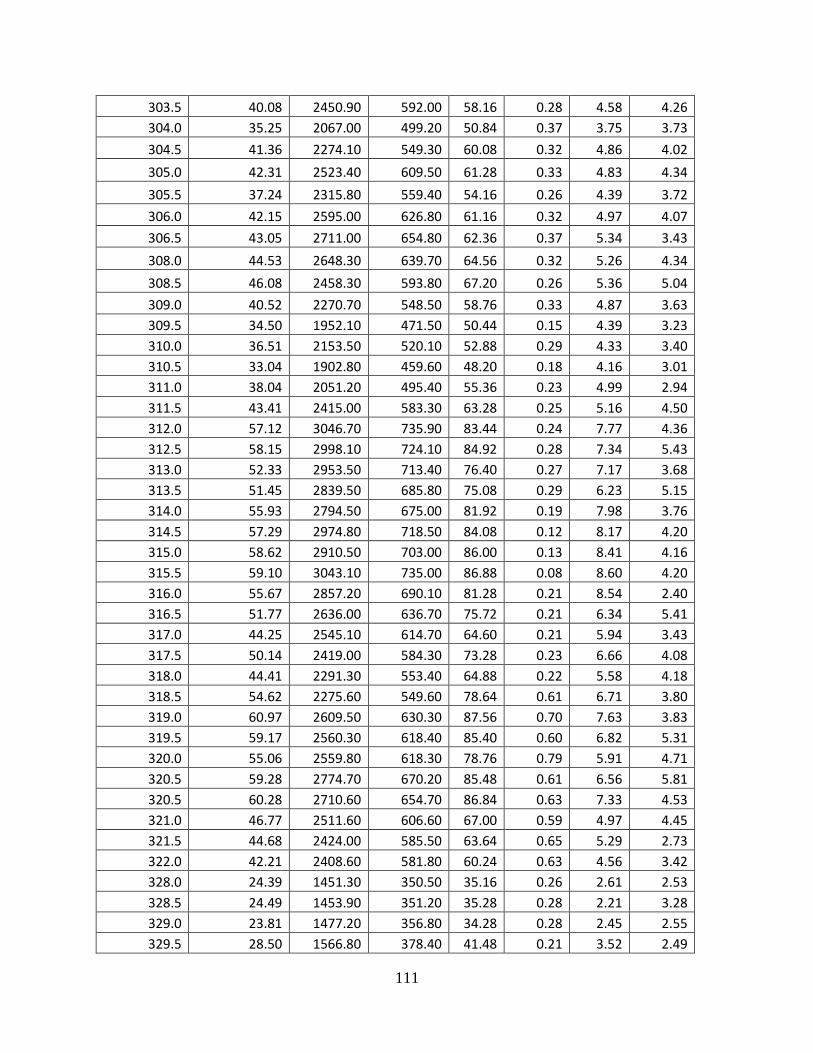
111
303.5 40.08 2450.90 592.00 58.16 0.28 4.58 4.26
304.0 35.25 2067.00 499.20 50.84 0.37 3.75 3.73
304.5 41.36 2274.10 549.30 60.08 0.32 4.86 4.02
305.0 42.31 2523.40 609.50 61.28 0.33 4.83 4.34
305.5 37.24 2315.80 559.40 54.16 0.26 4.39 3.72
306.0 42.15 2595.00 626.80 61.16 0.32 4.97 4.07
306.5 43.05 2711.00 654.80 62.36 0.37 5.34 3.43
308.0 44.53 2648.30 639.70 64.56 0.32 5.26 4.34
308.5 46.08 2458.30 593.80 67.20 0.26 5.36 5.04
309.0 40.52 2270.70 548.50 58.76 0.33 4.87 3.63
309.5 34.50 1952.10 471.50 50.44 0.15 4.39 3.23
310.0 36.51 2153.50 520.10 52.88 0.29 4.33 3.40
310.5 33.04 1902.80 459.60 48.20 0.18 4.16 3.01
311.0 38.04 2051.20 495.40 55.36 0.23 4.99 2.94
311.5 43.41 2415.00 583.30 63.28 0.25 5.16 4.50
312.0 57.12 3046.70 735.90 83.44 0.24 7.77 4.36
312.5 58.15 2998.10 724.10 84.92 0.28 7.34 5.43
313.0 52.33 2953.50 713.40 76.40 0.27 7.17 3.68
313.5 51.45 2839.50 685.80 75.08 0.29 6.23 5.15
314.0 55.93 2794.50 675.00 81.92 0.19 7.98 3.76
314.5 57.29 2974.80 718.50 84.08 0.12 8.17 4.20
315.0 58.62 2910.50 703.00 86.00 0.13 8.41 4.16
315.5 59.10 3043.10 735.00 86.88 0.08 8.60 4.20
316.0 55.67 2857.20 690.10 81.28 0.21 8.54 2.40
316.5 51.77 2636.00 636.70 75.72 0.21 6.34 5.41
317.0 44.25 2545.10 614.70 64.60 0.21 5.94 3.43
317.5 50.14 2419.00 584.30 73.28 0.23 6.66 4.08
318.0 44.41 2291.30 553.40 64.88 0.22 5.58 4.18
318.5 54.62 2275.60 549.60 78.64 0.61 6.71 3.80
319.0 60.97 2609.50 630.30 87.56 0.70 7.63 3.83
319.5 59.17 2560.30 618.40 85.40 0.60 6.82 5.31
320.0 55.06 2559.80 618.30 78.76 0.79 5.91 4.71
320.5 59.28 2774.70 670.20 85.48 0.61 6.56 5.81
320.5 60.28 2710.60 654.70 86.84 0.63 7.33 4.53
321.0 46.77 2511.60 606.60 67.00 0.59 4.97 4.45
321.5 44.68 2424.00 585.50 63.64 0.65 5.29 2.73
322.0 42.21 2408.60 581.80 60.24 0.63 4.56 3.42
328.0 24.39 1451.30 350.50 35.16 0.26 2.61 2.53
328.5 24.49 1453.90 351.20 35.28 0.28 2.21 3.28
329.0 23.81 1477.20 356.80 34.28 0.28 2.45 2.55
329.5 28.50 1566.80 378.40 41.48 0.21 3.52 2.49
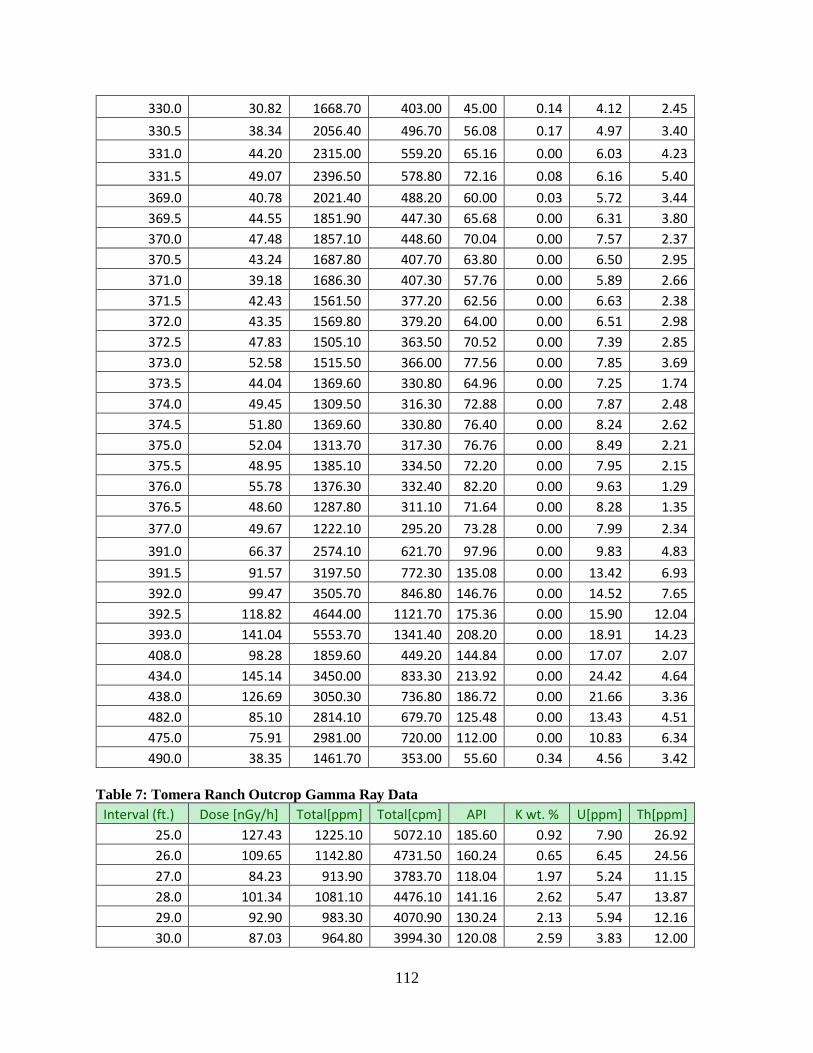
112
330.0 30.82 1668.70 403.00 45.00 0.14 4.12 2.45
330.5 38.34 2056.40 496.70 56.08 0.17 4.97 3.40
331.0 44.20 2315.00 559.20 65.16 0.00 6.03 4.23
331.5 49.07 2396.50 578.80 72.16 0.08 6.16 5.40
369.0 40.78 2021.40 488.20 60.00 0.03 5.72 3.44
369.5 44.55 1851.90 447.30 65.68 0.00 6.31 3.80
370.0 47.48 1857.10 448.60 70.04 0.00 7.57 2.37
370.5 43.24 1687.80 407.70 63.80 0.00 6.50 2.95
371.0 39.18 1686.30 407.30 57.76 0.00 5.89 2.66
371.5 42.43 1561.50 377.20 62.56 0.00 6.63 2.38
372.0 43.35 1569.80 379.20 64.00 0.00 6.51 2.98
372.5 47.83 1505.10 363.50 70.52 0.00 7.39 2.85
373.0 52.58 1515.50 366.00 77.56 0.00 7.85 3.69
373.5 44.04 1369.60 330.80 64.96 0.00 7.25 1.74
374.0 49.45 1309.50 316.30 72.88 0.00 7.87 2.48
374.5 51.80 1369.60 330.80 76.40 0.00 8.24 2.62
375.0 52.04 1313.70 317.30 76.76 0.00 8.49 2.21
375.5 48.95 1385.10 334.50 72.20 0.00 7.95 2.15
376.0 55.78 1376.30 332.40 82.20 0.00 9.63 1.29
376.5 48.60 1287.80 311.10 71.64 0.00 8.28 1.35
377.0 49.67 1222.10 295.20 73.28 0.00 7.99 2.34
391.0 66.37 2574.10 621.70 97.96 0.00 9.83 4.83
391.5 91.57 3197.50 772.30 135.08 0.00 13.42 6.93
392.0 99.47 3505.70 846.80 146.76 0.00 14.52 7.65
392.5 118.82 4644.00 1121.70 175.36 0.00 15.90 12.04
393.0 141.04 5553.70 1341.40 208.20 0.00 18.91 14.23
408.0 98.28 1859.60 449.20 144.84 0.00 17.07 2.07
434.0 145.14 3450.00 833.30 213.92 0.00 24.42 4.64
438.0 126.69 3050.30 736.80 186.72 0.00 21.66 3.36
482.0 85.10 2814.10 679.70 125.48 0.00 13.43 4.51
475.0 75.91 2981.00 720.00 112.00 0.00 10.83 6.34
490.0 38.35 1461.70 353.00 55.60 0.34 4.56 3.42
Table 7: Tomera Ranch Outcrop Gamma Ray Data
Interval (ft.) Dose [nGy/h] Total[ppm] Total[cpm] API K wt. % U[ppm] Th[ppm]
25.0 127.43 1225.10 5072.10 185.60 0.92 7.90 26.92
26.0 109.65 1142.80 4731.50 160.24 0.65 6.45 24.56
27.0 84.23 913.90 3783.70 118.04 1.97 5.24 11.15
28.0 101.34 1081.10 4476.10 141.16 2.62 5.47 13.87
29.0 92.90 983.30 4070.90 130.24 2.13 5.94 12.16
30.0 87.03 964.80 3994.30 120.08 2.59 3.83 12.00
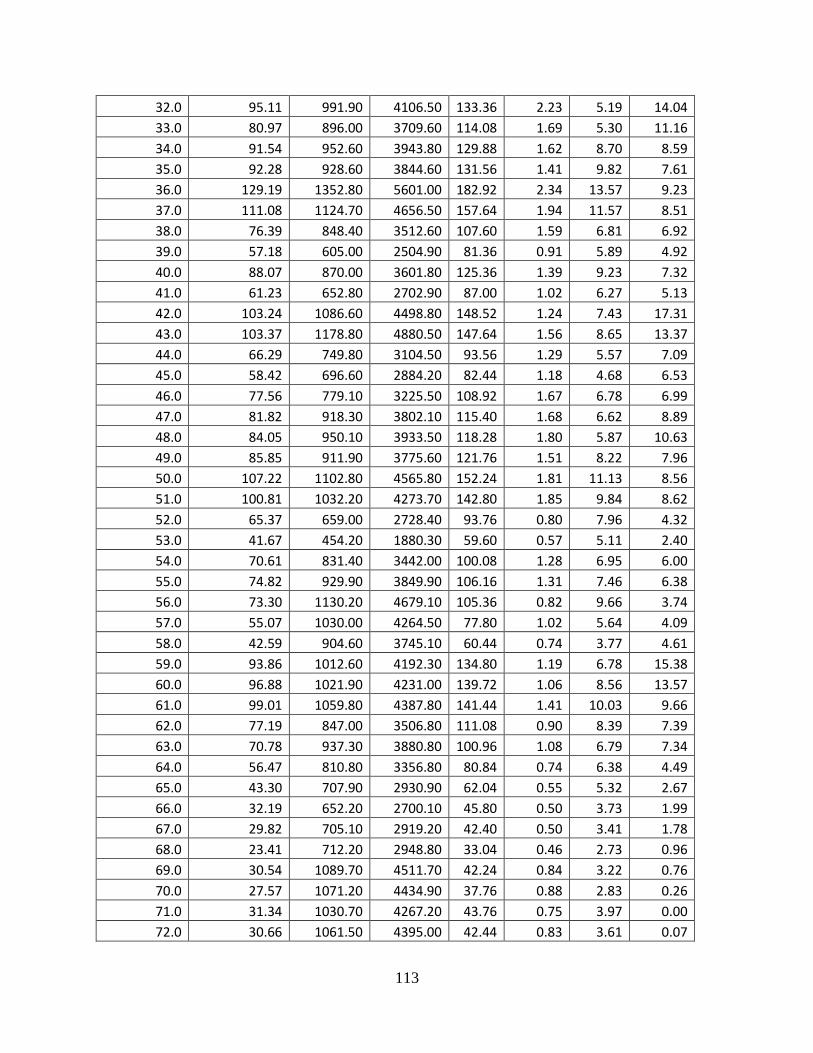
113
32.0 95.11 991.90 4106.50 133.36 2.23 5.19 14.04
33.0 80.97 896.00 3709.60 114.08 1.69 5.30 11.16
34.0 91.54 952.60 3943.80 129.88 1.62 8.70 8.59
35.0 92.28 928.60 3844.60 131.56 1.41 9.82 7.61
36.0 129.19 1352.80 5601.00 182.92 2.34 13.57 9.23
37.0 111.08 1124.70 4656.50 157.64 1.94 11.57 8.51
38.0 76.39 848.40 3512.60 107.60 1.59 6.81 6.92
39.0 57.18 605.00 2504.90 81.36 0.91 5.89 4.92
40.0 88.07 870.00 3601.80 125.36 1.39 9.23 7.32
41.0 61.23 652.80 2702.90 87.00 1.02 6.27 5.13
42.0 103.24 1086.60 4498.80 148.52 1.24 7.43 17.31
43.0 103.37 1178.80 4880.50 147.64 1.56 8.65 13.37
44.0 66.29 749.80 3104.50 93.56 1.29 5.57 7.09
45.0 58.42 696.60 2884.20 82.44 1.18 4.68 6.53
46.0 77.56 779.10 3225.50 108.92 1.67 6.78 6.99
47.0 81.82 918.30 3802.10 115.40 1.68 6.62 8.89
48.0 84.05 950.10 3933.50 118.28 1.80 5.87 10.63
49.0 85.85 911.90 3775.60 121.76 1.51 8.22 7.96
50.0 107.22 1102.80 4565.80 152.24 1.81 11.13 8.56
51.0 100.81 1032.20 4273.70 142.80 1.85 9.84 8.62
52.0 65.37 659.00 2728.40 93.76 0.80 7.96 4.32
53.0 41.67 454.20 1880.30 59.60 0.57 5.11 2.40
54.0 70.61 831.40 3442.00 100.08 1.28 6.95 6.00
55.0 74.82 929.90 3849.90 106.16 1.31 7.46 6.38
56.0 73.30 1130.20 4679.10 105.36 0.82 9.66 3.74
57.0 55.07 1030.00 4264.50 77.80 1.02 5.64 4.09
58.0 42.59 904.60 3745.10 60.44 0.74 3.77 4.61
59.0 93.86 1012.60 4192.30 134.80 1.19 6.78 15.38
60.0 96.88 1021.90 4231.00 139.72 1.06 8.56 13.57
61.0 99.01 1059.80 4387.80 141.44 1.41 10.03 9.66
62.0 77.19 847.00 3506.80 111.08 0.90 8.39 7.39
63.0 70.78 937.30 3880.80 100.96 1.08 6.79 7.34
64.0 56.47 810.80 3356.80 80.84 0.74 6.38 4.49
65.0 43.30 707.90 2930.90 62.04 0.55 5.32 2.67
66.0 32.19 652.20 2700.10 45.80 0.50 3.73 1.99
67.0 29.82 705.10 2919.20 42.40 0.50 3.41 1.78
68.0 23.41 712.20 2948.80 33.04 0.46 2.73 0.96
69.0 30.54 1089.70 4511.70 42.24 0.84 3.22 0.76
70.0 27.57 1071.20 4434.90 37.76 0.88 2.83 0.26
71.0 31.34 1030.70 4267.20 43.76 0.75 3.97 0.00
72.0 30.66 1061.50 4395.00 42.44 0.83 3.61 0.07
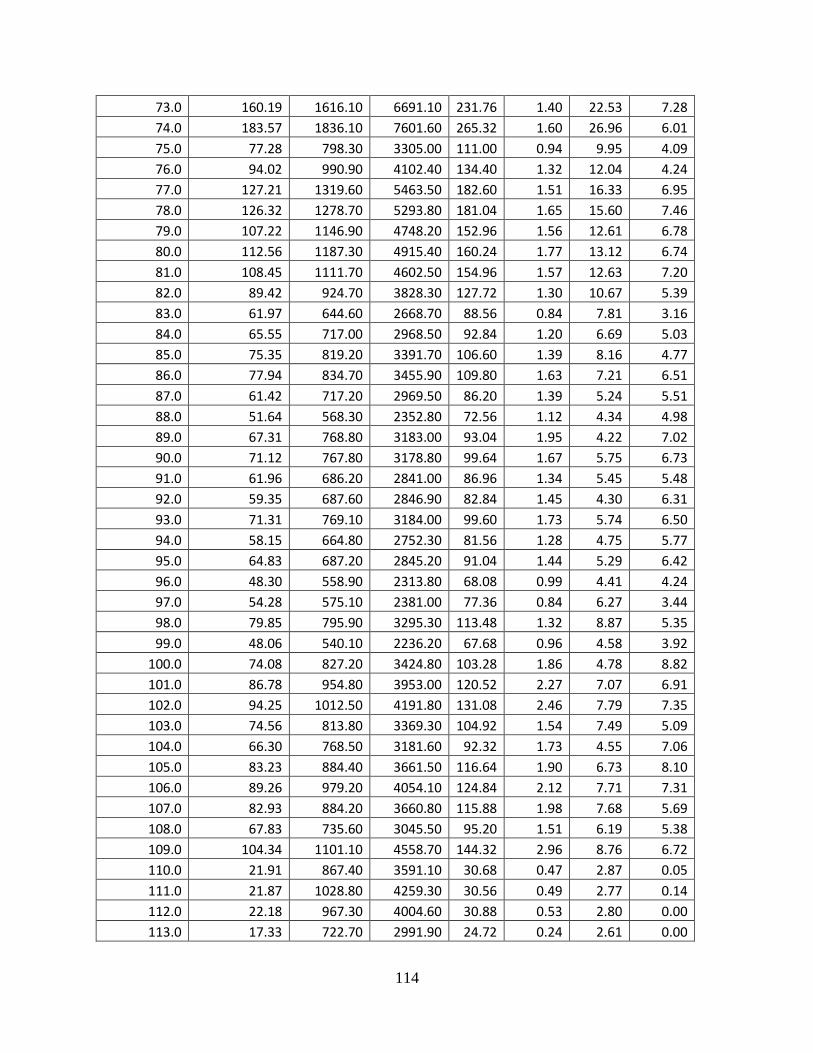
114
73.0 160.19 1616.10 6691.10 231.76 1.40 22.53 7.28
74.0 183.57 1836.10 7601.60 265.32 1.60 26.96 6.01
75.0 77.28 798.30 3305.00 111.00 0.94 9.95 4.09
76.0 94.02 990.90 4102.40 134.40 1.32 12.04 4.24
77.0 127.21 1319.60 5463.50 182.60 1.51 16.33 6.95
78.0 126.32 1278.70 5293.80 181.04 1.65 15.60 7.46
79.0 107.22 1146.90 4748.20 152.96 1.56 12.61 6.78
80.0 112.56 1187.30 4915.40 160.24 1.77 13.12 6.74
81.0 108.45 1111.70 4602.50 154.96 1.57 12.63 7.20
82.0 89.42 924.70 3828.30 127.72 1.30 10.67 5.39
83.0 61.97 644.60 2668.70 88.56 0.84 7.81 3.16
84.0 65.55 717.00 2968.50 92.84 1.20 6.69 5.03
85.0 75.35 819.20 3391.70 106.60 1.39 8.16 4.77
86.0 77.94 834.70 3455.90 109.80 1.63 7.21 6.51
87.0 61.42 717.20 2969.50 86.20 1.39 5.24 5.51
88.0 51.64 568.30 2352.80 72.56 1.12 4.34 4.98
89.0 67.31 768.80 3183.00 93.04 1.95 4.22 7.02
90.0 71.12 767.80 3178.80 99.64 1.67 5.75 6.73
91.0 61.96 686.20 2841.00 86.96 1.34 5.45 5.48
92.0 59.35 687.60 2846.90 82.84 1.45 4.30 6.31
93.0 71.31 769.10 3184.00 99.60 1.73 5.74 6.50
94.0 58.15 664.80 2752.30 81.56 1.28 4.75 5.77
95.0 64.83 687.20 2845.20 91.04 1.44 5.29 6.42
96.0 48.30 558.90 2313.80 68.08 0.99 4.41 4.24
97.0 54.28 575.10 2381.00 77.36 0.84 6.27 3.44
98.0 79.85 795.90 3295.30 113.48 1.32 8.87 5.35
99.0 48.06 540.10 2236.20 67.68 0.96 4.58 3.92
100.0 74.08 827.20 3424.80 103.28 1.86 4.78 8.82
101.0 86.78 954.80 3953.00 120.52 2.27 7.07 6.91
102.0 94.25 1012.50 4191.80 131.08 2.46 7.79 7.35
103.0 74.56 813.80 3369.30 104.92 1.54 7.49 5.09
104.0 66.30 768.50 3181.60 92.32 1.73 4.55 7.06
105.0 83.23 884.40 3661.50 116.64 1.90 6.73 8.10
106.0 89.26 979.20 4054.10 124.84 2.12 7.71 7.31
107.0 82.93 884.20 3660.80 115.88 1.98 7.68 5.69
108.0 67.83 735.60 3045.50 95.20 1.51 6.19 5.38
109.0 104.34 1101.10 4558.70 144.32 2.96 8.76 6.72
110.0 21.91 867.40 3591.10 30.68 0.47 2.87 0.05
111.0 21.87 1028.80 4259.30 30.56 0.49 2.77 0.14
112.0 22.18 967.30 4004.60 30.88 0.53 2.80 0.00
113.0 17.33 722.70 2991.90 24.72 0.24 2.61 0.00
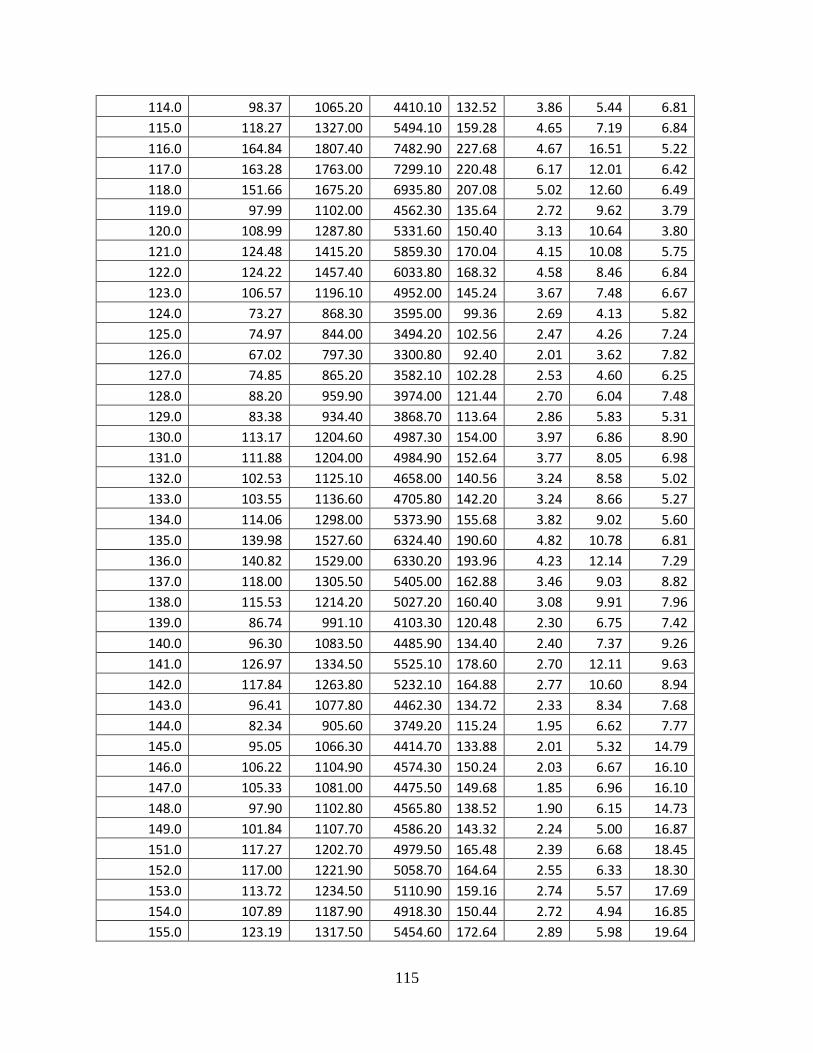
115
114.0 98.37 1065.20 4410.10 132.52 3.86 5.44 6.81
115.0 118.27 1327.00 5494.10 159.28 4.65 7.19 6.84
116.0 164.84 1807.40 7482.90 227.68 4.67 16.51 5.22
117.0 163.28 1763.00 7299.10 220.48 6.17 12.01 6.42
118.0 151.66 1675.20 6935.80 207.08 5.02 12.60 6.49
119.0 97.99 1102.00 4562.30 135.64 2.72 9.62 3.79
120.0 108.99 1287.80 5331.60 150.40 3.13 10.64 3.80
121.0 124.48 1415.20 5859.30 170.04 4.15 10.08 5.75
122.0 124.22 1457.40 6033.80 168.32 4.58 8.46 6.84
123.0 106.57 1196.10 4952.00 145.24 3.67 7.48 6.67
124.0 73.27 868.30 3595.00 99.36 2.69 4.13 5.82
125.0 74.97 844.00 3494.20 102.56 2.47 4.26 7.24
126.0 67.02 797.30 3300.80 92.40 2.01 3.62 7.82
127.0 74.85 865.20 3582.10 102.28 2.53 4.60 6.25
128.0 88.20 959.90 3974.00 121.44 2.70 6.04 7.48
129.0 83.38 934.40 3868.70 113.64 2.86 5.83 5.31
130.0 113.17 1204.60 4987.30 154.00 3.97 6.86 8.90
131.0 111.88 1204.00 4984.90 152.64 3.77 8.05 6.98
132.0 102.53 1125.10 4658.00 140.56 3.24 8.58 5.02
133.0 103.55 1136.60 4705.80 142.20 3.24 8.66 5.27
134.0 114.06 1298.00 5373.90 155.68 3.82 9.02 5.60
135.0 139.98 1527.60 6324.40 190.60 4.82 10.78 6.81
136.0 140.82 1529.00 6330.20 193.96 4.23 12.14 7.29
137.0 118.00 1305.50 5405.00 162.88 3.46 9.03 8.82
138.0 115.53 1214.20 5027.20 160.40 3.08 9.91 7.96
139.0 86.74 991.10 4103.30 120.48 2.30 6.75 7.42
140.0 96.30 1083.50 4485.90 134.40 2.40 7.37 9.26
141.0 126.97 1334.50 5525.10 178.60 2.70 12.11 9.63
142.0 117.84 1263.80 5232.10 164.88 2.77 10.60 8.94
143.0 96.41 1077.80 4462.30 134.72 2.33 8.34 7.68
144.0 82.34 905.60 3749.20 115.24 1.95 6.62 7.77
145.0 95.05 1066.30 4414.70 133.88 2.01 5.32 14.79
146.0 106.22 1104.90 4574.30 150.24 2.03 6.67 16.10
147.0 105.33 1081.00 4475.50 149.68 1.85 6.96 16.10
148.0 97.90 1102.80 4565.80 138.52 1.90 6.15 14.73
149.0 101.84 1107.70 4586.20 143.32 2.24 5.00 16.87
151.0 117.27 1202.70 4979.50 165.48 2.39 6.68 18.45
152.0 117.00 1221.90 5058.70 164.64 2.55 6.33 18.30
153.0 113.72 1234.50 5110.90 159.16 2.74 5.57 17.69
154.0 107.89 1187.90 4918.30 150.44 2.72 4.94 16.85
155.0 123.19 1317.50 5454.60 172.64 2.89 5.98 19.64
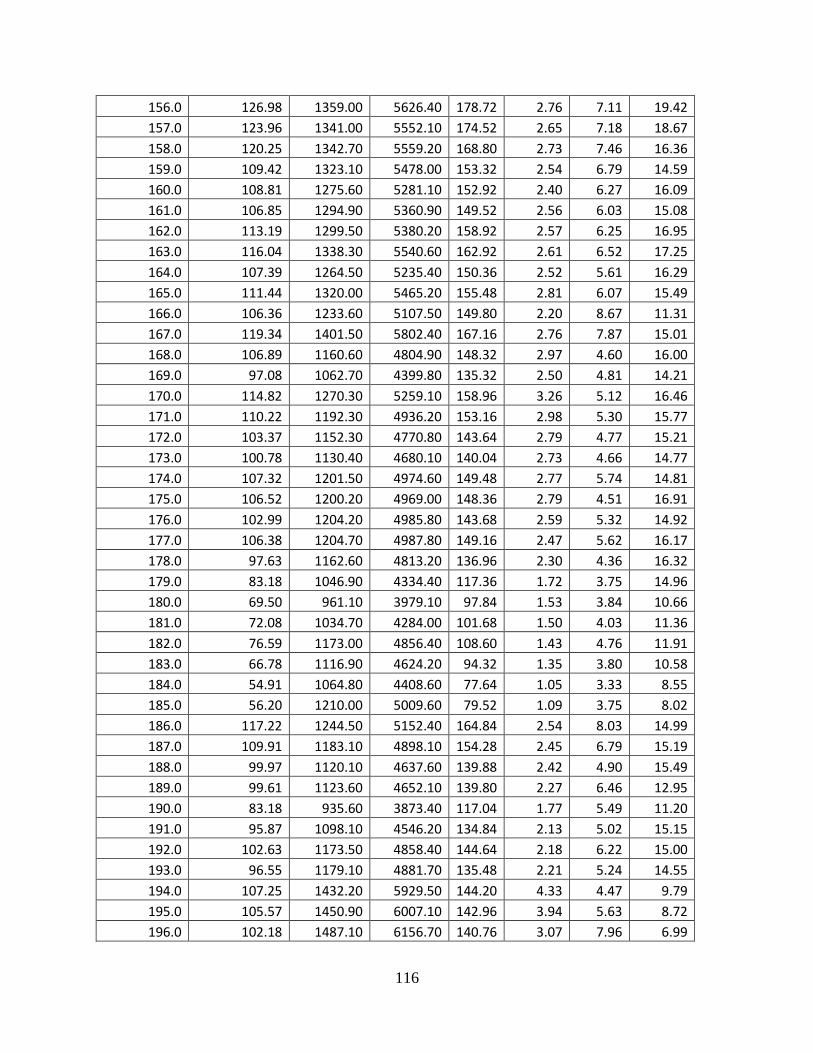
116
156.0 126.98 1359.00 5626.40 178.72 2.76 7.11 19.42
157.0 123.96 1341.00 5552.10 174.52 2.65 7.18 18.67
158.0 120.25 1342.70 5559.20 168.80 2.73 7.46 16.36
159.0 109.42 1323.10 5478.00 153.32 2.54 6.79 14.59
160.0 108.81 1275.60 5281.10 152.92 2.40 6.27 16.09
161.0 106.85 1294.90 5360.90 149.52 2.56 6.03 15.08
162.0 113.19 1299.50 5380.20 158.92 2.57 6.25 16.95
163.0 116.04 1338.30 5540.60 162.92 2.61 6.52 17.25
164.0 107.39 1264.50 5235.40 150.36 2.52 5.61 16.29
165.0 111.44 1320.00 5465.20 155.48 2.81 6.07 15.49
166.0 106.36 1233.60 5107.50 149.80 2.20 8.67 11.31
167.0 119.34 1401.50 5802.40 167.16 2.76 7.87 15.01
168.0 106.89 1160.60 4804.90 148.32 2.97 4.60 16.00
169.0 97.08 1062.70 4399.80 135.32 2.50 4.81 14.21
170.0 114.82 1270.30 5259.10 158.96 3.26 5.12 16.46
171.0 110.22 1192.30 4936.20 153.16 2.98 5.30 15.77
172.0 103.37 1152.30 4770.80 143.64 2.79 4.77 15.21
173.0 100.78 1130.40 4680.10 140.04 2.73 4.66 14.77
174.0 107.32 1201.50 4974.60 149.48 2.77 5.74 14.81
175.0 106.52 1200.20 4969.00 148.36 2.79 4.51 16.91
176.0 102.99 1204.20 4985.80 143.68 2.59 5.32 14.92
177.0 106.38 1204.70 4987.80 149.16 2.47 5.62 16.17
178.0 97.63 1162.60 4813.20 136.96 2.30 4.36 16.32
179.0 83.18 1046.90 4334.40 117.36 1.72 3.75 14.96
180.0 69.50 961.10 3979.10 97.84 1.53 3.84 10.66
181.0 72.08 1034.70 4284.00 101.68 1.50 4.03 11.36
182.0 76.59 1173.00 4856.40 108.60 1.43 4.76 11.91
183.0 66.78 1116.90 4624.20 94.32 1.35 3.80 10.58
184.0 54.91 1064.80 4408.60 77.64 1.05 3.33 8.55
185.0 56.20 1210.00 5009.60 79.52 1.09 3.75 8.02
186.0 117.22 1244.50 5152.40 164.84 2.54 8.03 14.99
187.0 109.91 1183.10 4898.10 154.28 2.45 6.79 15.19
188.0 99.97 1120.10 4637.60 139.88 2.42 4.90 15.49
189.0 99.61 1123.60 4652.10 139.80 2.27 6.46 12.95
190.0 83.18 935.60 3873.40 117.04 1.77 5.49 11.20
191.0 95.87 1098.10 4546.20 134.84 2.13 5.02 15.15
192.0 102.63 1173.50 4858.40 144.64 2.18 6.22 15.00
193.0 96.55 1179.10 4881.70 135.48 2.21 5.24 14.55
194.0 107.25 1432.20 5929.50 144.20 4.33 4.47 9.79
195.0 105.57 1450.90 6007.10 142.96 3.94 5.63 8.72
196.0 102.18 1487.10 6156.70 140.76 3.07 7.96 6.99
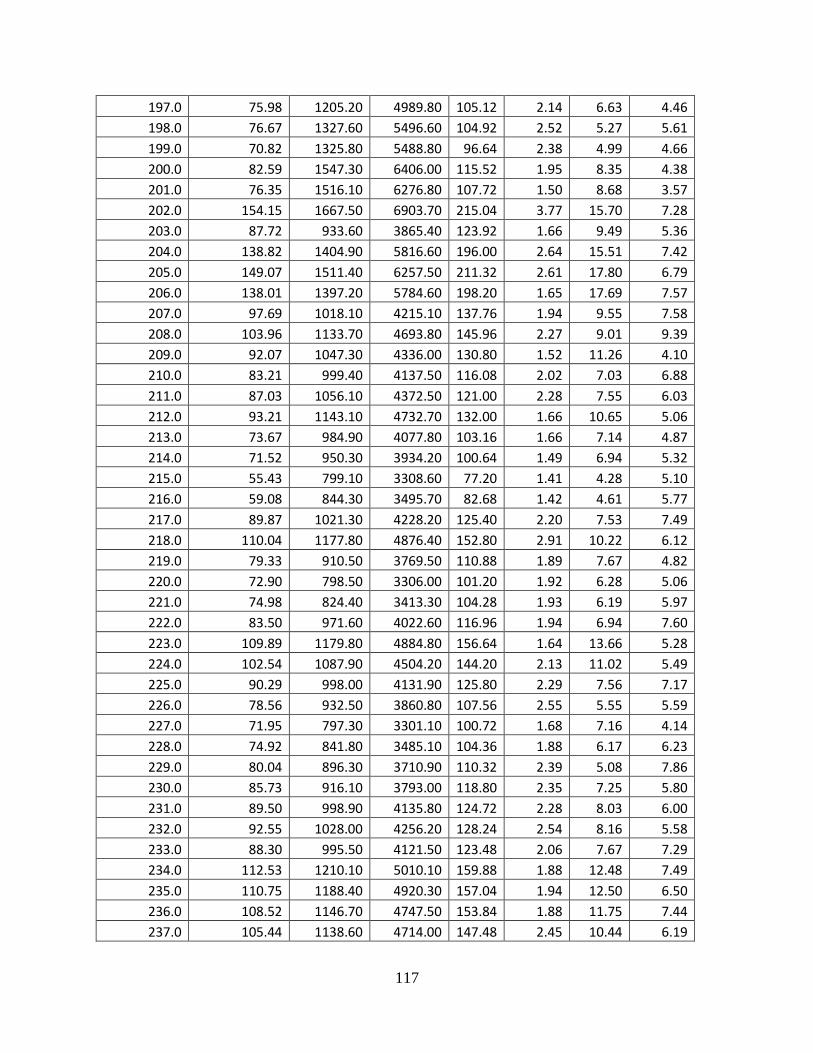
117
197.0 75.98 1205.20 4989.80 105.12 2.14 6.63 4.46
198.0 76.67 1327.60 5496.60 104.92 2.52 5.27 5.61
199.0 70.82 1325.80 5488.80 96.64 2.38 4.99 4.66
200.0 82.59 1547.30 6406.00 115.52 1.95 8.35 4.38
201.0 76.35 1516.10 6276.80 107.72 1.50 8.68 3.57
202.0 154.15 1667.50 6903.70 215.04 3.77 15.70 7.28
203.0 87.72 933.60 3865.40 123.92 1.66 9.49 5.36
204.0 138.82 1404.90 5816.60 196.00 2.64 15.51 7.42
205.0 149.07 1511.40 6257.50 211.32 2.61 17.80 6.79
206.0 138.01 1397.20 5784.60 198.20 1.65 17.69 7.57
207.0 97.69 1018.10 4215.10 137.76 1.94 9.55 7.58
208.0 103.96 1133.70 4693.80 145.96 2.27 9.01 9.39
209.0 92.07 1047.30 4336.00 130.80 1.52 11.26 4.10
210.0 83.21 999.40 4137.50 116.08 2.02 7.03 6.88
211.0 87.03 1056.10 4372.50 121.00 2.28 7.55 6.03
212.0 93.21 1143.10 4732.70 132.00 1.66 10.65 5.06
213.0 73.67 984.90 4077.80 103.16 1.66 7.14 4.87
214.0 71.52 950.30 3934.20 100.64 1.49 6.94 5.32
215.0 55.43 799.10 3308.60 77.20 1.41 4.28 5.10
216.0 59.08 844.30 3495.70 82.68 1.42 4.61 5.77
217.0 89.87 1021.30 4228.20 125.40 2.20 7.53 7.49
218.0 110.04 1177.80 4876.40 152.80 2.91 10.22 6.12
219.0 79.33 910.50 3769.50 110.88 1.89 7.67 4.82
220.0 72.90 798.50 3306.00 101.20 1.92 6.28 5.06
221.0 74.98 824.40 3413.30 104.28 1.93 6.19 5.97
222.0 83.50 971.60 4022.60 116.96 1.94 6.94 7.60
223.0 109.89 1179.80 4884.80 156.64 1.64 13.66 5.28
224.0 102.54 1087.90 4504.20 144.20 2.13 11.02 5.49
225.0 90.29 998.00 4131.90 125.80 2.29 7.56 7.17
226.0 78.56 932.50 3860.80 107.56 2.55 5.55 5.59
227.0 71.95 797.30 3301.10 100.72 1.68 7.16 4.14
228.0 74.92 841.80 3485.10 104.36 1.88 6.17 6.23
229.0 80.04 896.30 3710.90 110.32 2.39 5.08 7.86
230.0 85.73 916.10 3793.00 118.80 2.35 7.25 5.80
231.0 89.50 998.90 4135.80 124.72 2.28 8.03 6.00
232.0 92.55 1028.00 4256.20 128.24 2.54 8.16 5.58
233.0 88.30 995.50 4121.50 123.48 2.06 7.67 7.29
234.0 112.53 1210.10 5010.10 159.88 1.88 12.48 7.49
235.0 110.75 1188.40 4920.30 157.04 1.94 12.50 6.50
236.0 108.52 1146.70 4747.50 153.84 1.88 11.75 7.44
237.0 105.44 1138.60 4714.00 147.48 2.45 10.44 6.19
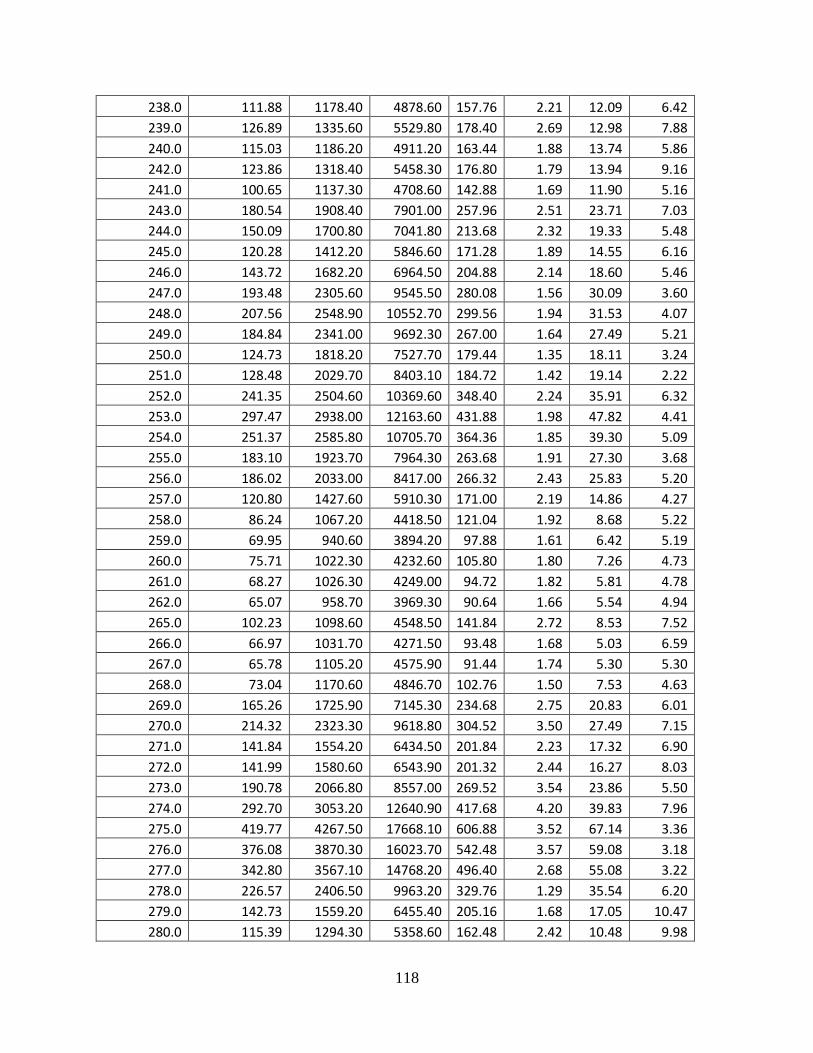
118
238.0 111.88 1178.40 4878.60 157.76 2.21 12.09 6.42
239.0 126.89 1335.60 5529.80 178.40 2.69 12.98 7.88
240.0 115.03 1186.20 4911.20 163.44 1.88 13.74 5.86
242.0 123.86 1318.40 5458.30 176.80 1.79 13.94 9.16
241.0 100.65 1137.30 4708.60 142.88 1.69 11.90 5.16
243.0 180.54 1908.40 7901.00 257.96 2.51 23.71 7.03
244.0 150.09 1700.80 7041.80 213.68 2.32 19.33 5.48
245.0 120.28 1412.20 5846.60 171.28 1.89 14.55 6.16
246.0 143.72 1682.20 6964.50 204.88 2.14 18.60 5.46
247.0 193.48 2305.60 9545.50 280.08 1.56 30.09 3.60
248.0 207.56 2548.90 10552.70 299.56 1.94 31.53 4.07
249.0 184.84 2341.00 9692.30 267.00 1.64 27.49 5.21
250.0 124.73 1818.20 7527.70 179.44 1.35 18.11 3.24
251.0 128.48 2029.70 8403.10 184.72 1.42 19.14 2.22
252.0 241.35 2504.60 10369.60 348.40 2.24 35.91 6.32
253.0 297.47 2938.00 12163.60 431.88 1.98 47.82 4.41
254.0 251.37 2585.80 10705.70 364.36 1.85 39.30 5.09
255.0 183.10 1923.70 7964.30 263.68 1.91 27.30 3.68
256.0 186.02 2033.00 8417.00 266.32 2.43 25.83 5.20
257.0 120.80 1427.60 5910.30 171.00 2.19 14.86 4.27
258.0 86.24 1067.20 4418.50 121.04 1.92 8.68 5.22
259.0 69.95 940.60 3894.20 97.88 1.61 6.42 5.19
260.0 75.71 1022.30 4232.60 105.80 1.80 7.26 4.73
261.0 68.27 1026.30 4249.00 94.72 1.82 5.81 4.78
262.0 65.07 958.70 3969.30 90.64 1.66 5.54 4.94
265.0 102.23 1098.60 4548.50 141.84 2.72 8.53 7.52
266.0 66.97 1031.70 4271.50 93.48 1.68 5.03 6.59
267.0 65.78 1105.20 4575.90 91.44 1.74 5.30 5.30
268.0 73.04 1170.60 4846.70 102.76 1.50 7.53 4.63
269.0 165.26 1725.90 7145.30 234.68 2.75 20.83 6.01
270.0 214.32 2323.30 9618.80 304.52 3.50 27.49 7.15
271.0 141.84 1554.20 6434.50 201.84 2.23 17.32 6.90
272.0 141.99 1580.60 6543.90 201.32 2.44 16.27 8.03
273.0 190.78 2066.80 8557.00 269.52 3.54 23.86 5.50
274.0 292.70 3053.20 12640.90 417.68 4.20 39.83 7.96
275.0 419.77 4267.50 17668.10 606.88 3.52 67.14 3.36
276.0 376.08 3870.30 16023.70 542.48 3.57 59.08 3.18
277.0 342.80 3567.10 14768.20 496.40 2.68 55.08 3.22
278.0 226.57 2406.50 9963.20 329.76 1.29 35.54 6.20
279.0 142.73 1559.20 6455.40 205.16 1.68 17.05 10.47
280.0 115.39 1294.30 5358.60 162.48 2.42 10.48 9.98
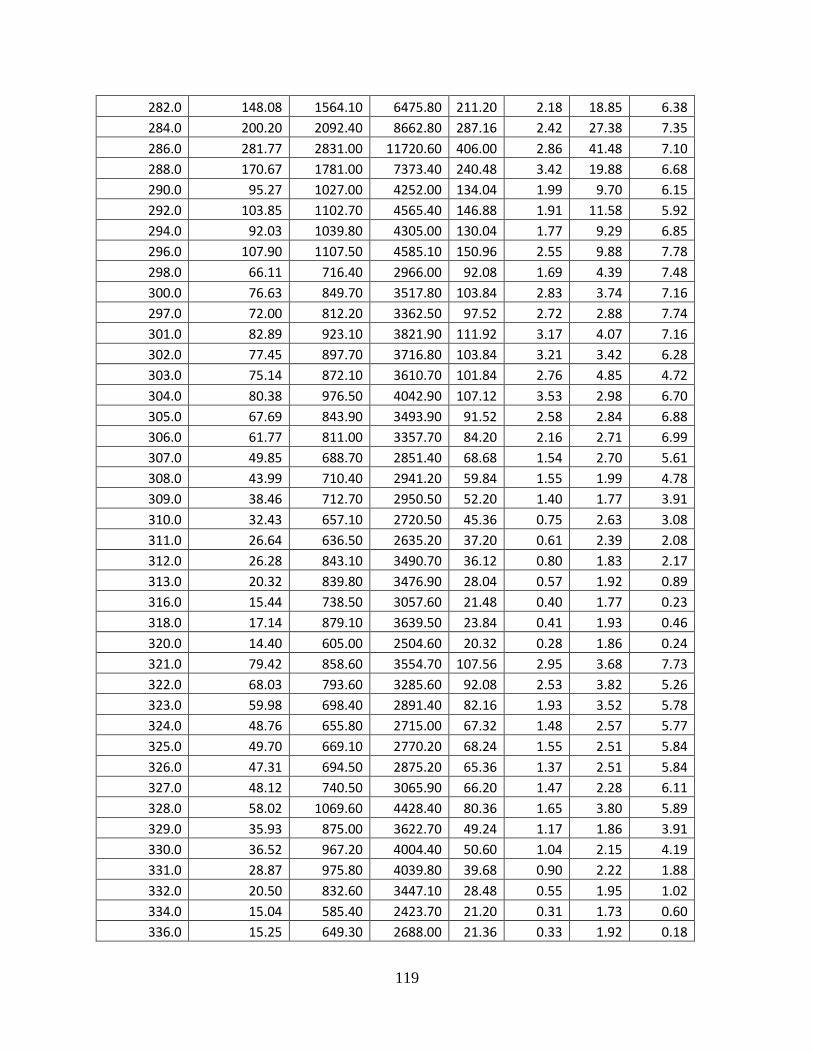
119
282.0 148.08 1564.10 6475.80 211.20 2.18 18.85 6.38
284.0 200.20 2092.40 8662.80 287.16 2.42 27.38 7.35
286.0 281.77 2831.00 11720.60 406.00 2.86 41.48 7.10
288.0 170.67 1781.00 7373.40 240.48 3.42 19.88 6.68
290.0 95.27 1027.00 4252.00 134.04 1.99 9.70 6.15
292.0 103.85 1102.70 4565.40 146.88 1.91 11.58 5.92
294.0 92.03 1039.80 4305.00 130.04 1.77 9.29 6.85
296.0 107.90 1107.50 4585.10 150.96 2.55 9.88 7.78
298.0 66.11 716.40 2966.00 92.08 1.69 4.39 7.48
300.0 76.63 849.70 3517.80 103.84 2.83 3.74 7.16
297.0 72.00 812.20 3362.50 97.52 2.72 2.88 7.74
301.0 82.89 923.10 3821.90 111.92 3.17 4.07 7.16
302.0 77.45 897.70 3716.80 103.84 3.21 3.42 6.28
303.0 75.14 872.10 3610.70 101.84 2.76 4.85 4.72
304.0 80.38 976.50 4042.90 107.12 3.53 2.98 6.70
305.0 67.69 843.90 3493.90 91.52 2.58 2.84 6.88
306.0 61.77 811.00 3357.70 84.20 2.16 2.71 6.99
307.0 49.85 688.70 2851.40 68.68 1.54 2.70 5.61
308.0 43.99 710.40 2941.20 59.84 1.55 1.99 4.78
309.0 38.46 712.70 2950.50 52.20 1.40 1.77 3.91
310.0 32.43 657.10 2720.50 45.36 0.75 2.63 3.08
311.0 26.64 636.50 2635.20 37.20 0.61 2.39 2.08
312.0 26.28 843.10 3490.70 36.12 0.80 1.83 2.17
313.0 20.32 839.80 3476.90 28.04 0.57 1.92 0.89
316.0 15.44 738.50 3057.60 21.48 0.40 1.77 0.23
318.0 17.14 879.10 3639.50 23.84 0.41 1.93 0.46
320.0 14.40 605.00 2504.60 20.32 0.28 1.86 0.24
321.0 79.42 858.60 3554.70 107.56 2.95 3.68 7.73
322.0 68.03 793.60 3285.60 92.08 2.53 3.82 5.26
323.0 59.98 698.40 2891.40 82.16 1.93 3.52 5.78
324.0 48.76 655.80 2715.00 67.32 1.48 2.57 5.77
325.0 49.70 669.10 2770.20 68.24 1.55 2.51 5.84
326.0 47.31 694.50 2875.20 65.36 1.37 2.51 5.84
327.0 48.12 740.50 3065.90 66.20 1.47 2.28 6.11
328.0 58.02 1069.60 4428.40 80.36 1.65 3.80 5.89
329.0 35.93 875.00 3622.70 49.24 1.17 1.86 3.91
330.0 36.52 967.20 4004.40 50.60 1.04 2.15 4.19
331.0 28.87 975.80 4039.80 39.68 0.90 2.22 1.88
332.0 20.50 832.60 3447.10 28.48 0.55 1.95 1.02
334.0 15.04 585.40 2423.70 21.20 0.31 1.73 0.60
336.0 15.25 649.30 2688.00 21.36 0.33 1.92 0.18
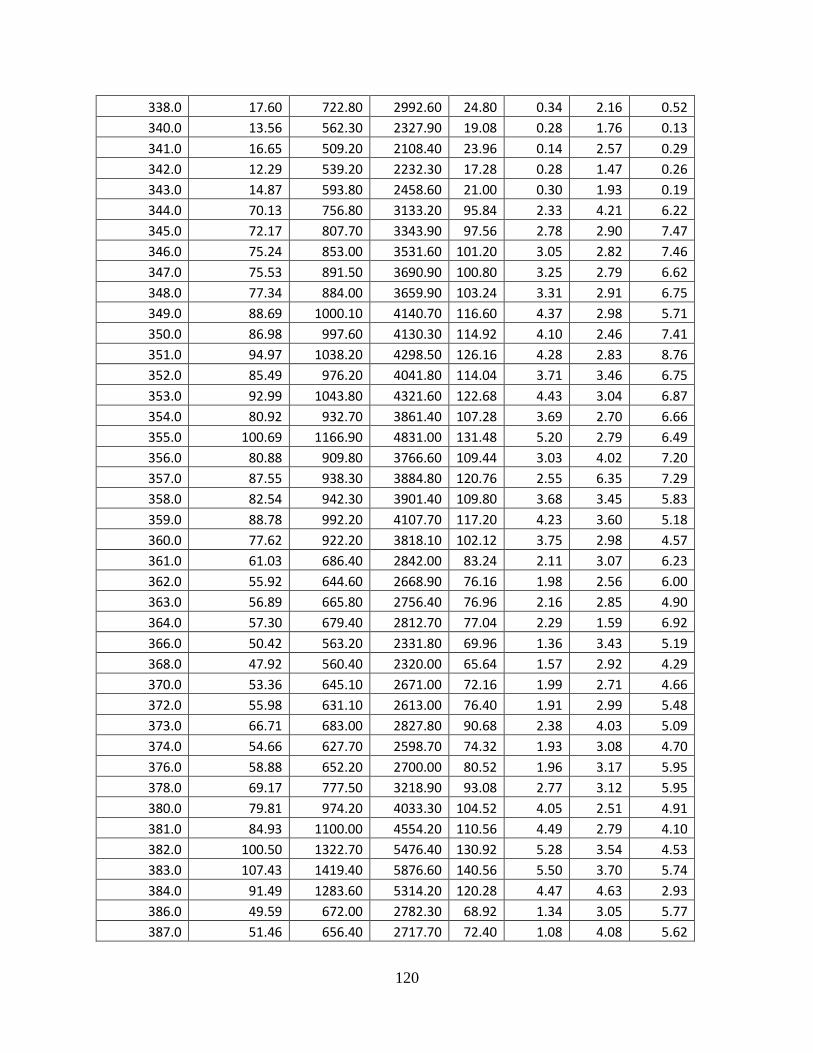
120
338.0 17.60 722.80 2992.60 24.80 0.34 2.16 0.52
340.0 13.56 562.30 2327.90 19.08 0.28 1.76 0.13
341.0 16.65 509.20 2108.40 23.96 0.14 2.57 0.29
342.0 12.29 539.20 2232.30 17.28 0.28 1.47 0.26
343.0 14.87 593.80 2458.60 21.00 0.30 1.93 0.19
344.0 70.13 756.80 3133.20 95.84 2.33 4.21 6.22
345.0 72.17 807.70 3343.90 97.56 2.78 2.90 7.47
346.0 75.24 853.00 3531.60 101.20 3.05 2.82 7.46
347.0 75.53 891.50 3690.90 100.80 3.25 2.79 6.62
348.0 77.34 884.00 3659.90 103.24 3.31 2.91 6.75
349.0 88.69 1000.10 4140.70 116.60 4.37 2.98 5.71
350.0 86.98 997.60 4130.30 114.92 4.10 2.46 7.41
351.0 94.97 1038.20 4298.50 126.16 4.28 2.83 8.76
352.0 85.49 976.20 4041.80 114.04 3.71 3.46 6.75
353.0 92.99 1043.80 4321.60 122.68 4.43 3.04 6.87
354.0 80.92 932.70 3861.40 107.28 3.69 2.70 6.66
355.0 100.69 1166.90 4831.00 131.48 5.20 2.79 6.49
356.0 80.88 909.80 3766.60 109.44 3.03 4.02 7.20
357.0 87.55 938.30 3884.80 120.76 2.55 6.35 7.29
358.0 82.54 942.30 3901.40 109.80 3.68 3.45 5.83
359.0 88.78 992.20 4107.70 117.20 4.23 3.60 5.18
360.0 77.62 922.20 3818.10 102.12 3.75 2.98 4.57
361.0 61.03 686.40 2842.00 83.24 2.11 3.07 6.23
362.0 55.92 644.60 2668.90 76.16 1.98 2.56 6.00
363.0 56.89 665.80 2756.40 76.96 2.16 2.85 4.90
364.0 57.30 679.40 2812.70 77.04 2.29 1.59 6.92
366.0 50.42 563.20 2331.80 69.96 1.36 3.43 5.19
368.0 47.92 560.40 2320.00 65.64 1.57 2.92 4.29
370.0 53.36 645.10 2671.00 72.16 1.99 2.71 4.66
372.0 55.98 631.10 2613.00 76.40 1.91 2.99 5.48
373.0 66.71 683.00 2827.80 90.68 2.38 4.03 5.09
374.0 54.66 627.70 2598.70 74.32 1.93 3.08 4.70
376.0 58.88 652.20 2700.00 80.52 1.96 3.17 5.95
378.0 69.17 777.50 3218.90 93.08 2.77 3.12 5.95
380.0 79.81 974.20 4033.30 104.52 4.05 2.51 4.91
381.0 84.93 1100.00 4554.20 110.56 4.49 2.79 4.10
382.0 100.50 1322.70 5476.40 130.92 5.28 3.54 4.53
383.0 107.43 1419.40 5876.60 140.56 5.50 3.70 5.74
384.0 91.49 1283.60 5314.20 120.28 4.47 4.63 2.93
386.0 49.59 672.00 2782.30 68.92 1.34 3.05 5.77
387.0 51.46 656.40 2717.70 72.40 1.08 4.08 5.62
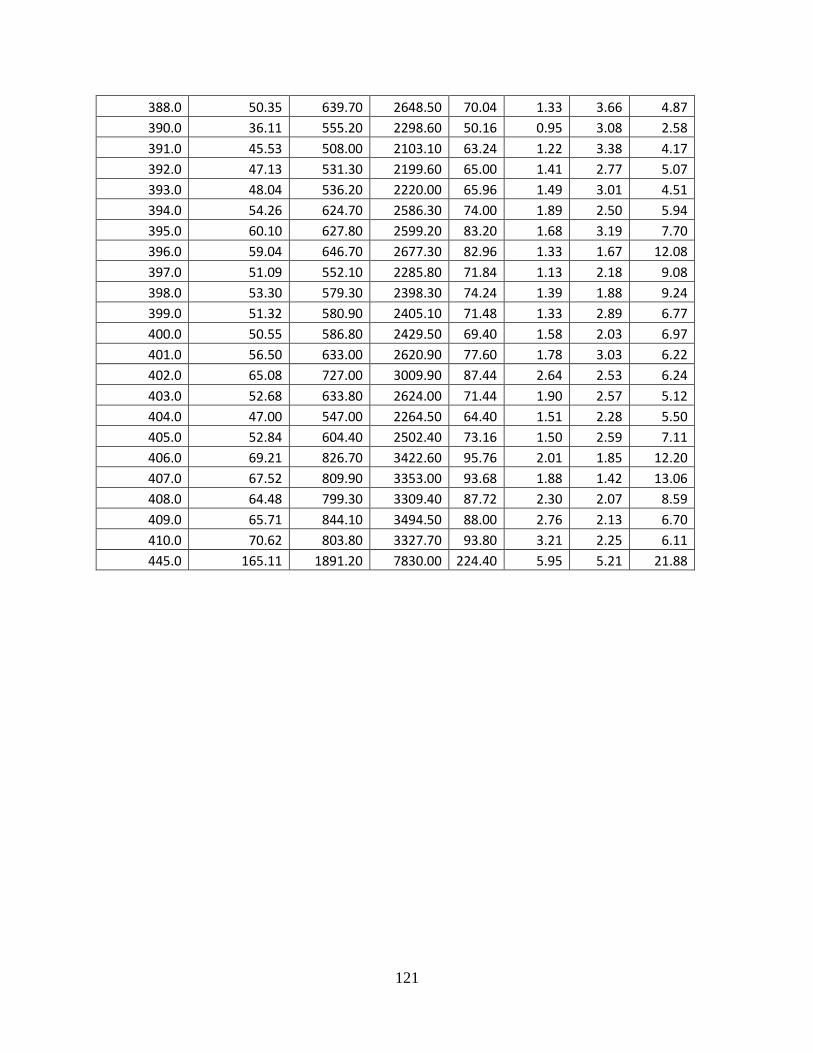
121
388.0 50.35 639.70 2648.50 70.04 1.33 3.66 4.87
390.0 36.11 555.20 2298.60 50.16 0.95 3.08 2.58
391.0 45.53 508.00 2103.10 63.24 1.22 3.38 4.17
392.0 47.13 531.30 2199.60 65.00 1.41 2.77 5.07
393.0 48.04 536.20 2220.00 65.96 1.49 3.01 4.51
394.0 54.26 624.70 2586.30 74.00 1.89 2.50 5.94
395.0 60.10 627.80 2599.20 83.20 1.68 3.19 7.70
396.0 59.04 646.70 2677.30 82.96 1.33 1.67 12.08
397.0 51.09 552.10 2285.80 71.84 1.13 2.18 9.08
398.0 53.30 579.30 2398.30 74.24 1.39 1.88 9.24
399.0 51.32 580.90 2405.10 71.48 1.33 2.89 6.77
400.0 50.55 586.80 2429.50 69.40 1.58 2.03 6.97
401.0 56.50 633.00 2620.90 77.60 1.78 3.03 6.22
402.0 65.08 727.00 3009.90 87.44 2.64 2.53 6.24
403.0 52.68 633.80 2624.00 71.44 1.90 2.57 5.12
404.0 47.00 547.00 2264.50 64.40 1.51 2.28 5.50
405.0 52.84 604.40 2502.40 73.16 1.50 2.59 7.11
406.0 69.21 826.70 3422.60 95.76 2.01 1.85 12.20
407.0 67.52 809.90 3353.00 93.68 1.88 1.42 13.06
408.0 64.48 799.30 3309.40 87.72 2.30 2.07 8.59
409.0 65.71 844.10 3494.50 88.00 2.76 2.13 6.70
410.0 70.62 803.80 3327.70 93.80 3.21 2.25 6.11
445.0 165.11 1891.20 7830.00 224.40 5.95 5.21 21.88
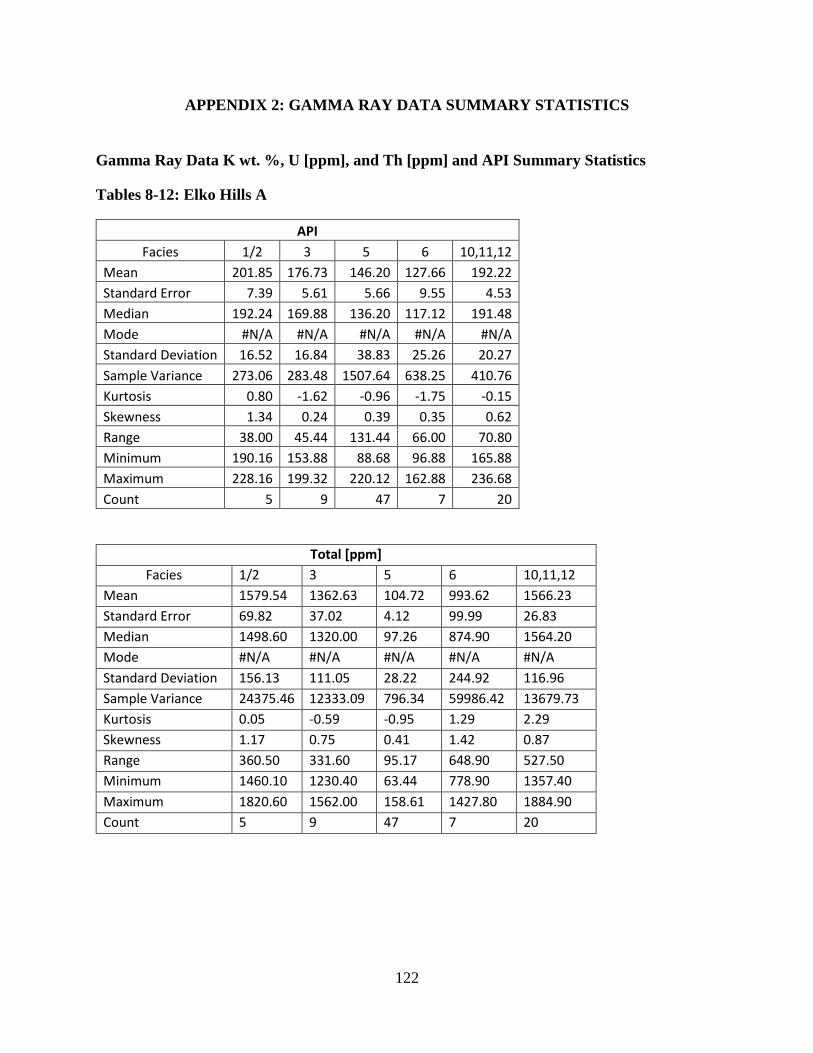
122
APPENDIX 2: GAMMA RAY DATA SUMMARY STATISTICS
Gamma Ray Data K wt. %, U [ppm], and Th [ppm] and API Summary Statistics
Tables 8-12: Elko Hills A
API
Facies 1/2 3 5 6 10,11,12
Mean 201.85 176.73 146.20 127.66 192.22
Standard Error 7.39 5.61 5.66 9.55 4.53
Median 192.24 169.88 136.20 117.12 191.48
Mode #N/A #N/A #N/A #N/A #N/A
Standard Deviation 16.52 16.84 38.83 25.26 20.27
Sample Variance 273.06 283.48 1507.64 638.25 410.76
Kurtosis 0.80 -1.62 -0.96 -1.75 -0.15
Skewness 1.34 0.24 0.39 0.35 0.62
Range 38.00 45.44 131.44 66.00 70.80
Minimum 190.16 153.88 88.68 96.88 165.88
Maximum 228.16 199.32 220.12 162.88 236.68
Count 5 9 47 7 20
Total [ppm]
Facies 1/2 3 5 6 10,11,12
Mean 1579.54 1362.63 104.72 993.62 1566.23
Standard Error 69.82 37.02 4.12 99.99 26.83
Median 1498.60 1320.00 97.26 874.90 1564.20
Mode #N/A #N/A #N/A #N/A #N/A
Standard Deviation 156.13 111.05 28.22 244.92 116.96
Sample Variance 24375.46 12333.09 796.34 59986.42 13679.73
Kurtosis 0.05 -0.59 -0.95 1.29 2.29
Skewness 1.17 0.75 0.41 1.42 0.87
Range 360.50 331.60 95.17 648.90 527.50
Minimum 1460.10 1230.40 63.44 778.90 1357.40
Maximum 1820.60 1562.00 158.61 1427.80 1884.90
Count 5 9 47 7 20
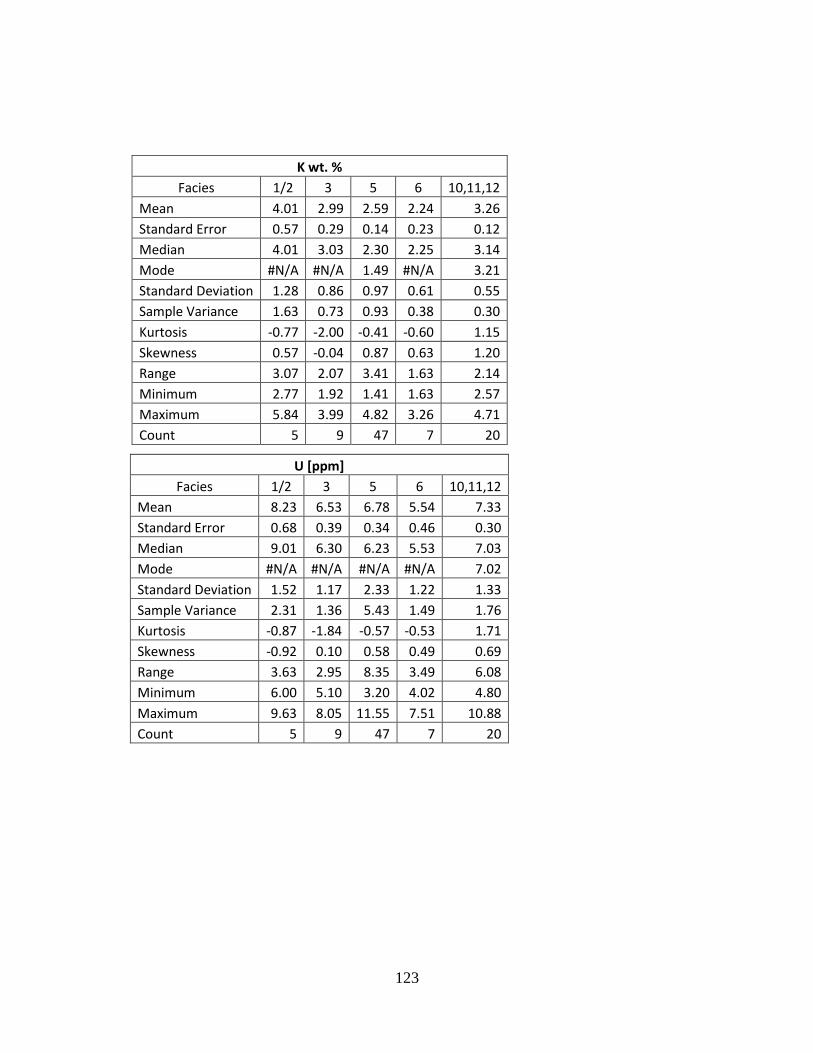
123
K wt. %
Facies 1/2 3 5 6 10,11,12
Mean 4.01 2.99 2.59 2.24 3.26
Standard Error 0.57 0.29 0.14 0.23 0.12
Median 4.01 3.03 2.30 2.25 3.14
Mode #N/A #N/A 1.49 #N/A 3.21
Standard Deviation 1.28 0.86 0.97 0.61 0.55
Sample Variance 1.63 0.73 0.93 0.38 0.30
Kurtosis -0.77 -2.00 -0.41 -0.60 1.15
Skewness 0.57 -0.04 0.87 0.63 1.20
Range 3.07 2.07 3.41 1.63 2.14
Minimum 2.77 1.92 1.41 1.63 2.57
Maximum 5.84 3.99 4.82 3.26 4.71
Count 5 9 47 7 20
U [ppm]
Facies 1/2 3 5 6 10,11,12
Mean 8.23 6.53 6.78 5.54 7.33
Standard Error 0.68 0.39 0.34 0.46 0.30
Median 9.01 6.30 6.23 5.53 7.03
Mode #N/A #N/A #N/A #N/A 7.02
Standard Deviation 1.52 1.17 2.33 1.22 1.33
Sample Variance 2.31 1.36 5.43 1.49 1.76
Kurtosis -0.87 -1.84 -0.57 -0.53 1.71
Skewness -0.92 0.10 0.58 0.49 0.69
Range 3.63 2.95 8.35 3.49 6.08
Minimum 6.00 5.10 3.20 4.02 4.80
Maximum 9.63 8.05 11.55 7.51 10.88
Count 5 9 47 7 20
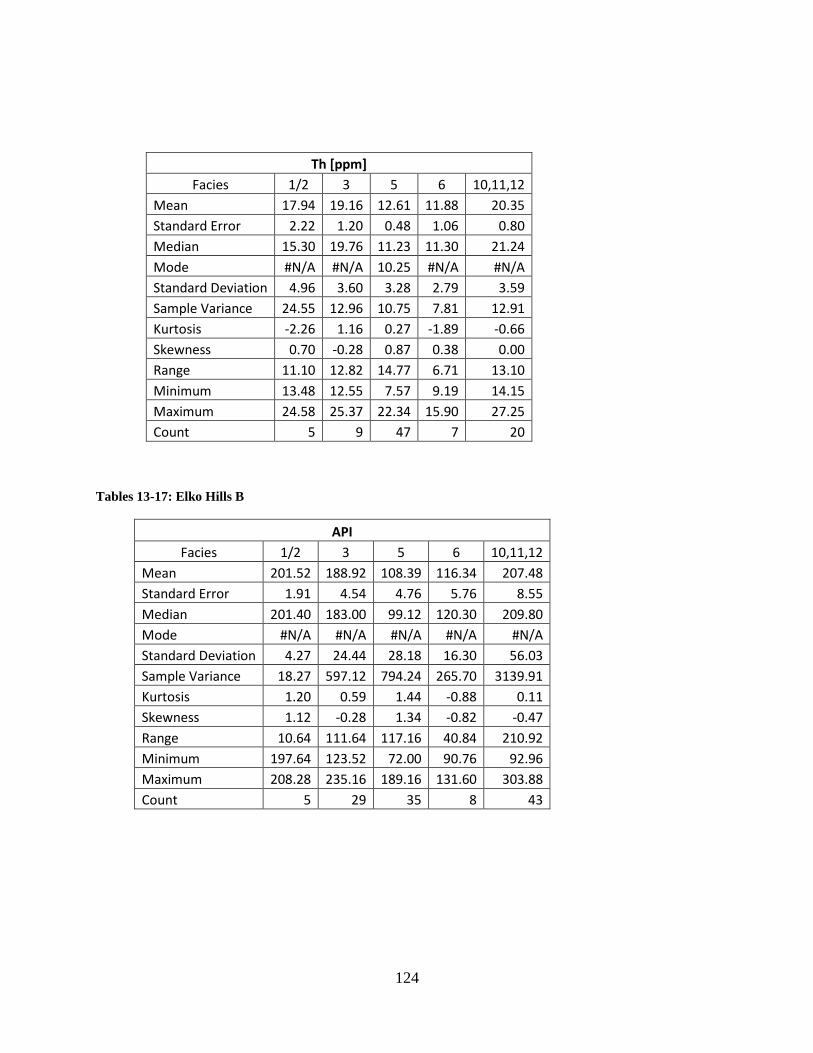
124
Tables 13-17: Elko Hills B
API
Facies 1/2 3 5 6 10,11,12
Mean 201.52 188.92 108.39 116.34 207.48
Standard Error 1.91 4.54 4.76 5.76 8.55
Median 201.40 183.00 99.12 120.30 209.80
Mode #N/A #N/A #N/A #N/A #N/A
Standard Deviation 4.27 24.44 28.18 16.30 56.03
Sample Variance 18.27 597.12 794.24 265.70 3139.91
Kurtosis 1.20 0.59 1.44 -0.88 0.11
Skewness 1.12 -0.28 1.34 -0.82 -0.47
Range 10.64 111.64 117.16 40.84 210.92
Minimum 197.64 123.52 72.00 90.76 92.96
Maximum 208.28 235.16 189.16 131.60 303.88
Count 5 29 35 8 43
Th [ppm]
Facies 1/2 3 5 6 10,11,12
Mean 17.94 19.16 12.61 11.88 20.35
Standard Error 2.22 1.20 0.48 1.06 0.80
Median 15.30 19.76 11.23 11.30 21.24
Mode #N/A #N/A 10.25 #N/A #N/A
Standard Deviation 4.96 3.60 3.28 2.79 3.59
Sample Variance 24.55 12.96 10.75 7.81 12.91
Kurtosis -2.26 1.16 0.27 -1.89 -0.66
Skewness 0.70 -0.28 0.87 0.38 0.00
Range 11.10 12.82 14.77 6.71 13.10
Minimum 13.48 12.55 7.57 9.19 14.15
Maximum 24.58 25.37 22.34 15.90 27.25
Count 5 9 47 7 20
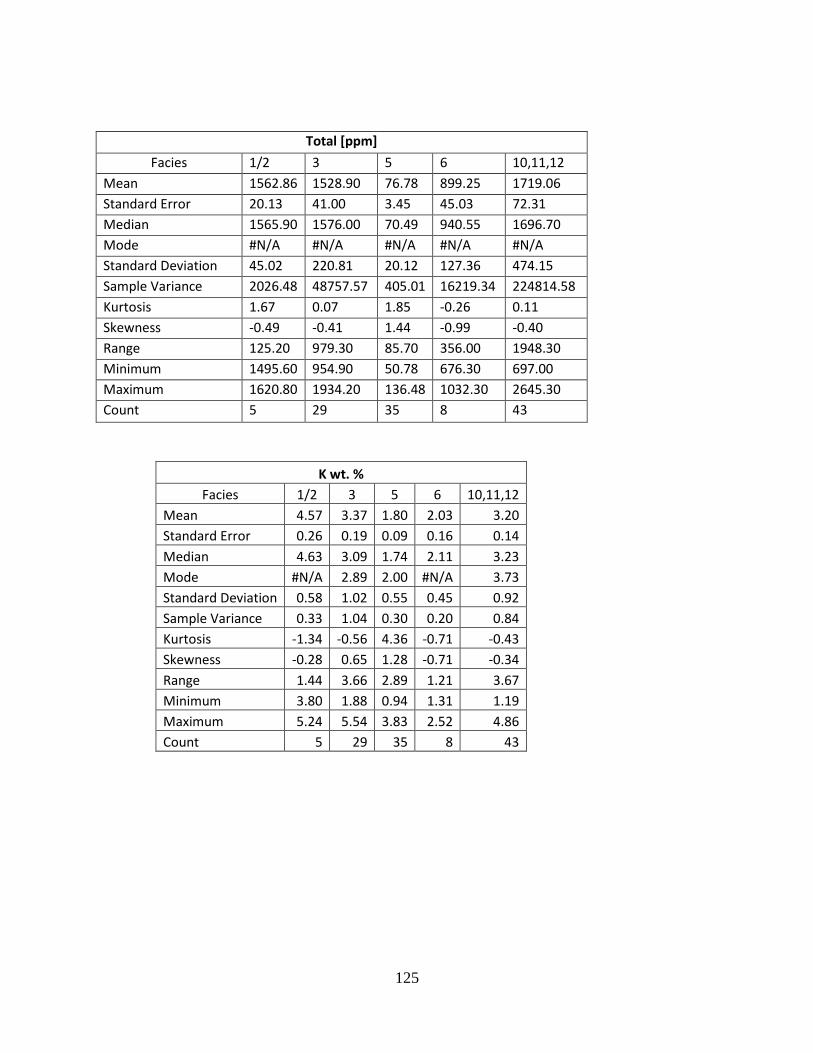
125
Total [ppm]
Facies 1/2 3 5 6 10,11,12
Mean 1562.86 1528.90 76.78 899.25 1719.06
Standard Error 20.13 41.00 3.45 45.03 72.31
Median 1565.90 1576.00 70.49 940.55 1696.70
Mode #N/A #N/A #N/A #N/A #N/A
Standard Deviation 45.02 220.81 20.12 127.36 474.15
Sample Variance 2026.48 48757.57 405.01 16219.34 224814.58
Kurtosis 1.67 0.07 1.85 -0.26 0.11
Skewness -0.49 -0.41 1.44 -0.99 -0.40
Range 125.20 979.30 85.70 356.00 1948.30
Minimum 1495.60 954.90 50.78 676.30 697.00
Maximum 1620.80 1934.20 136.48 1032.30 2645.30
Count 5 29 35 8 43
K wt. %
Facies 1/2 3 5 6 10,11,12
Mean 4.57 3.37 1.80 2.03 3.20
Standard Error 0.26 0.19 0.09 0.16 0.14
Median 4.63 3.09 1.74 2.11 3.23
Mode #N/A 2.89 2.00 #N/A 3.73
Standard Deviation 0.58 1.02 0.55 0.45 0.92
Sample Variance 0.33 1.04 0.30 0.20 0.84
Kurtosis -1.34 -0.56 4.36 -0.71 -0.43
Skewness -0.28 0.65 1.28 -0.71 -0.34
Range 1.44 3.66 2.89 1.21 3.67
Minimum 3.80 1.88 0.94 1.31 1.19
Maximum 5.24 5.54 3.83 2.52 4.86
Count 5 29 35 8 43
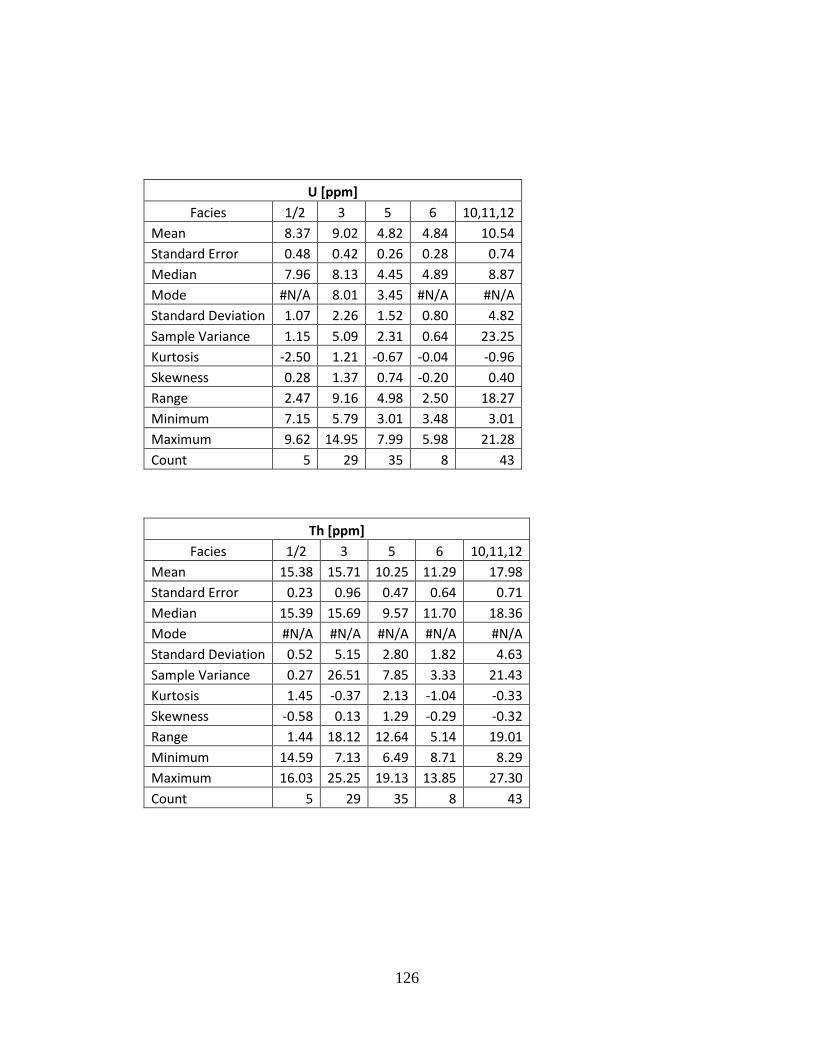
126
U [ppm]
Facies 1/2 3 5 6 10,11,12
Mean 8.37 9.02 4.82 4.84 10.54
Standard Error 0.48 0.42 0.26 0.28 0.74
Median 7.96 8.13 4.45 4.89 8.87
Mode #N/A 8.01 3.45 #N/A #N/A
Standard Deviation 1.07 2.26 1.52 0.80 4.82
Sample Variance 1.15 5.09 2.31 0.64 23.25
Kurtosis -2.50 1.21 -0.67 -0.04 -0.96
Skewness 0.28 1.37 0.74 -0.20 0.40
Range 2.47 9.16 4.98 2.50 18.27
Minimum 7.15 5.79 3.01 3.48 3.01
Maximum 9.62 14.95 7.99 5.98 21.28
Count 5 29 35 8 43
Th [ppm]
Facies 1/2 3 5 6 10,11,12
Mean 15.38 15.71 10.25 11.29 17.98
Standard Error 0.23 0.96 0.47 0.64 0.71
Median 15.39 15.69 9.57 11.70 18.36
Mode #N/A #N/A #N/A #N/A #N/A
Standard Deviation 0.52 5.15 2.80 1.82 4.63
Sample Variance 0.27 26.51 7.85 3.33 21.43
Kurtosis 1.45 -0.37 2.13 -1.04 -0.33
Skewness -0.58 0.13 1.29 -0.29 -0.32
Range 1.44 18.12 12.64 5.14 19.01
Minimum 14.59 7.13 6.49 8.71 8.29
Maximum 16.03 25.25 19.13 13.85 27.30
Count 5 29 35 8 43
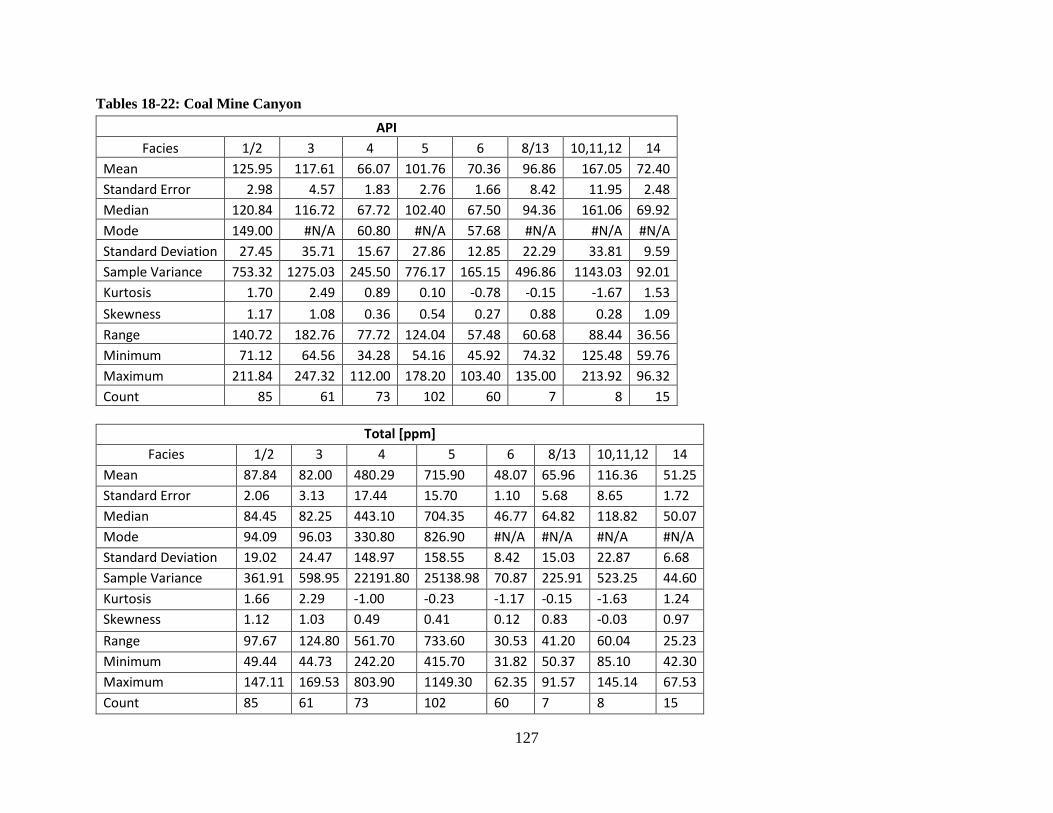
127
Tables 18-22: Coal Mine Canyon
API
Facies 1/2 3 4 5 6 8/13 10,11,12 14
Mean 125.95 117.61 66.07 101.76 70.36 96.86 167.05 72.40
Standard Error 2.98 4.57 1.83 2.76 1.66 8.42 11.95 2.48
Median 120.84 116.72 67.72 102.40 67.50 94.36 161.06 69.92
Mode 149.00 #N/A 60.80 #N/A 57.68 #N/A #N/A #N/A
Standard Deviation 27.45 35.71 15.67 27.86 12.85 22.29 33.81 9.59
Sample Variance 753.32 1275.03 245.50 776.17 165.15 496.86 1143.03 92.01
Kurtosis 1.70 2.49 0.89 0.10 -0.78 -0.15 -1.67 1.53
Skewness 1.17 1.08 0.36 0.54 0.27 0.88 0.28 1.09
Range 140.72 182.76 77.72 124.04 57.48 60.68 88.44 36.56
Minimum 71.12 64.56 34.28 54.16 45.92 74.32 125.48 59.76
Maximum 211.84 247.32 112.00 178.20 103.40 135.00 213.92 96.32
Count 85 61 73 102 60 7 8 15
Total [ppm]
Facies 1/2 3 4 5 6 8/13 10,11,12 14
Mean 87.84 82.00 480.29 715.90 48.07 65.96 116.36 51.25
Standard Error 2.06 3.13 17.44 15.70 1.10 5.68 8.65 1.72
Median 84.45 82.25 443.10 704.35 46.77 64.82 118.82 50.07
Mode 94.09 96.03 330.80 826.90 #N/A #N/A #N/A #N/A
Standard Deviation 19.02 24.47 148.97 158.55 8.42 15.03 22.87 6.68
Sample Variance 361.91 598.95 22191.80 25138.98 70.87 225.91 523.25 44.60
Kurtosis 1.66 2.29 -1.00 -0.23 -1.17 -0.15 -1.63 1.24
Skewness 1.12 1.03 0.49 0.41 0.12 0.83 -0.03 0.97
Range 97.67 124.80 561.70 733.60 30.53 41.20 60.04 25.23
Minimum 49.44 44.73 242.20 415.70 31.82 50.37 85.10 42.30
Maximum 147.11 169.53 803.90 1149.30 62.35 91.57 145.14 67.53
Count 85 61 73 102 60 7 8 15
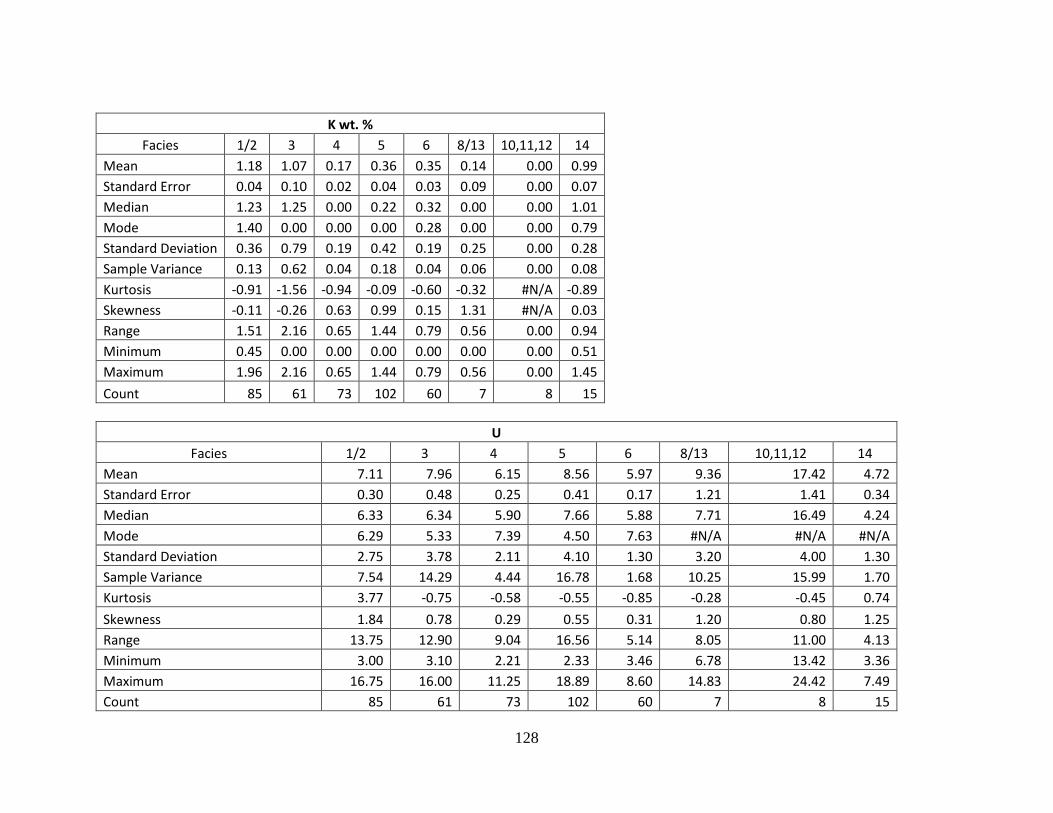
128
K wt. %
Facies 1/2 3 4 5 6 8/13 10,11,12 14
Mean 1.18 1.07 0.17 0.36 0.35 0.14 0.00 0.99
Standard Error 0.04 0.10 0.02 0.04 0.03 0.09 0.00 0.07
Median 1.23 1.25 0.00 0.22 0.32 0.00 0.00 1.01
Mode 1.40 0.00 0.00 0.00 0.28 0.00 0.00 0.79
Standard Deviation 0.36 0.79 0.19 0.42 0.19 0.25 0.00 0.28
Sample Variance 0.13 0.62 0.04 0.18 0.04 0.06 0.00 0.08
Kurtosis -0.91 -1.56 -0.94 -0.09 -0.60 -0.32 #N/A -0.89
Skewness -0.11 -0.26 0.63 0.99 0.15 1.31 #N/A 0.03
Range 1.51 2.16 0.65 1.44 0.79 0.56 0.00 0.94
Minimum 0.45 0.00 0.00 0.00 0.00 0.00 0.00 0.51
Maximum 1.96 2.16 0.65 1.44 0.79 0.56 0.00 1.45
Count 85 61 73 102 60 7 8 15
U
Facies 1/2 3 4 5 6 8/13 10,11,12 14
Mean 7.11 7.96 6.15 8.56 5.97 9.36 17.42 4.72
Standard Error 0.30 0.48 0.25 0.41 0.17 1.21 1.41 0.34
Median 6.33 6.34 5.90 7.66 5.88 7.71 16.49 4.24
Mode 6.29 5.33 7.39 4.50 7.63 #N/A #N/A #N/A
Standard Deviation 2.75 3.78 2.11 4.10 1.30 3.20 4.00 1.30
Sample Variance 7.54 14.29 4.44 16.78 1.68 10.25 15.99 1.70
Kurtosis 3.77 -0.75 -0.58 -0.55 -0.85 -0.28 -0.45 0.74
Skewness 1.84 0.78 0.29 0.55 0.31 1.20 0.80 1.25
Range 13.75 12.90 9.04 16.56 5.14 8.05 11.00 4.13
Minimum 3.00 3.10 2.21 2.33 3.46 6.78 13.42 3.36
Maximum 16.75 16.00 11.25 18.89 8.60 14.83 24.42 7.49
Count 85 61 73 102 60 7 8 15
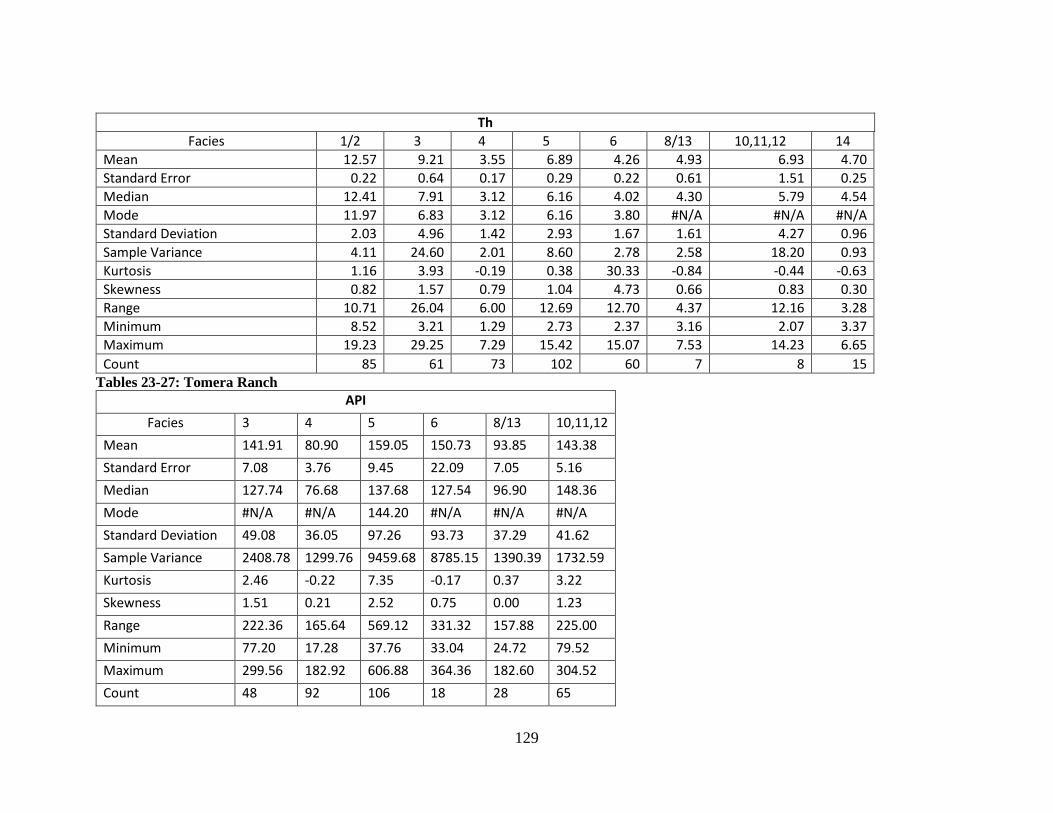
129
Th
Facies 1/2 3 4 5 6 8/13 10,11,12 14
Mean 12.57 9.21 3.55 6.89 4.26 4.93 6.93 4.70
Standard Error 0.22 0.64 0.17 0.29 0.22 0.61 1.51 0.25
Median 12.41 7.91 3.12 6.16 4.02 4.30 5.79 4.54
Mode 11.97 6.83 3.12 6.16 3.80 #N/A #N/A #N/A
Standard Deviation 2.03 4.96 1.42 2.93 1.67 1.61 4.27 0.96
Sample Variance 4.11 24.60 2.01 8.60 2.78 2.58 18.20 0.93
Kurtosis 1.16 3.93 -0.19 0.38 30.33 -0.84 -0.44 -0.63
Skewness 0.82 1.57 0.79 1.04 4.73 0.66 0.83 0.30
Range 10.71 26.04 6.00 12.69 12.70 4.37 12.16 3.28
Minimum 8.52 3.21 1.29 2.73 2.37 3.16 2.07 3.37
Maximum 19.23 29.25 7.29 15.42 15.07 7.53 14.23 6.65
Count 85 61 73 102 60 7 8 15
Tables 23-27: Tomera Ranch
API
Facies 3 4 5 6 8/13 10,11,12
Mean 141.91 80.90 159.05 150.73 93.85 143.38
Standard Error 7.08 3.76 9.45 22.09 7.05 5.16
Median 127.74 76.68 137.68 127.54 96.90 148.36
Mode #N/A #N/A 144.20 #N/A #N/A #N/A
Standard Deviation 49.08 36.05 97.26 93.73 37.29 41.62
Sample Variance 2408.78 1299.76 9459.68 8785.15 1390.39 1732.59
Kurtosis 2.46 -0.22 7.35 -0.17 0.37 3.22
Skewness 1.51 0.21 2.52 0.75 0.00 1.23
Range 222.36 165.64 569.12 331.32 157.88 225.00
Minimum 77.20 17.28 37.76 33.04 24.72 79.52
Maximum 299.56 182.92 606.88 364.36 182.60 304.52
Count 48 92 106 18 28 65
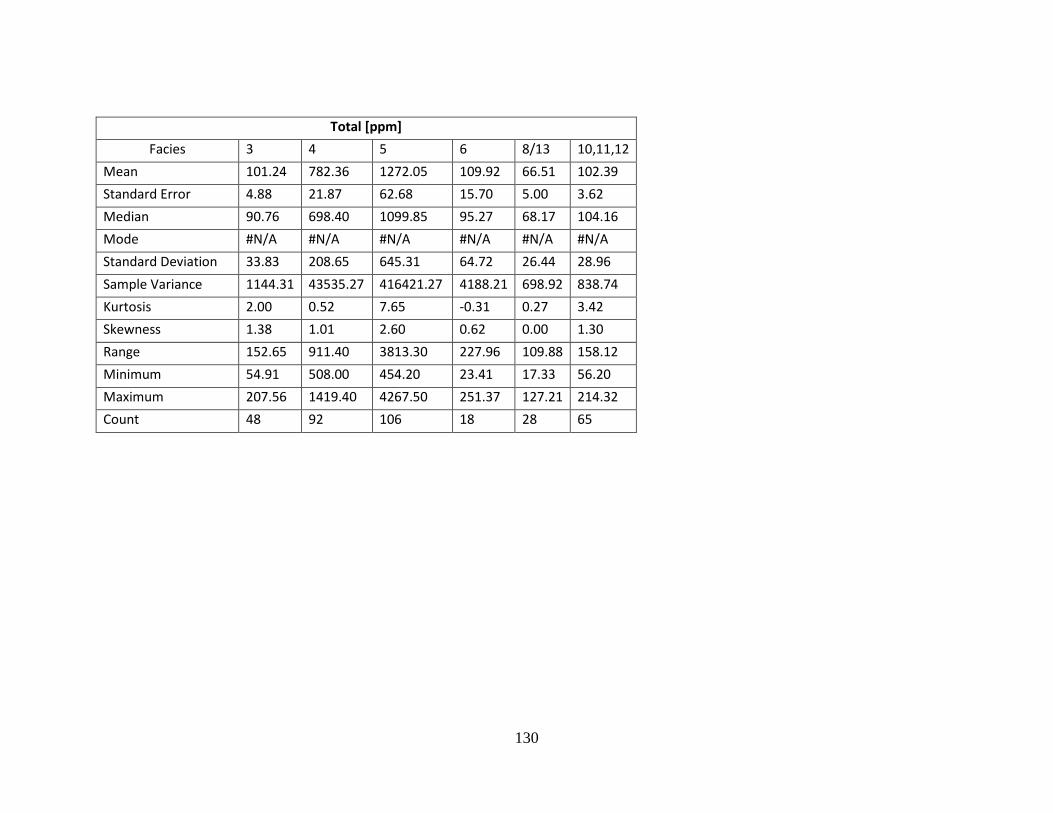
130
Total [ppm]
Facies 3 4 5 6 8/13 10,11,12
Mean 101.24 782.36 1272.05 109.92 66.51 102.39
Standard Error 4.88 21.87 62.68 15.70 5.00 3.62
Median 90.76 698.40 1099.85 95.27 68.17 104.16
Mode #N/A #N/A #N/A #N/A #N/A #N/A
Standard Deviation 33.83 208.65 645.31 64.72 26.44 28.96
Sample Variance 1144.31 43535.27 416421.27 4188.21 698.92 838.74
Kurtosis 2.00 0.52 7.65 -0.31 0.27 3.42
Skewness 1.38 1.01 2.60 0.62 0.00 1.30
Range 152.65 911.40 3813.30 227.96 109.88 158.12
Minimum 54.91 508.00 454.20 23.41 17.33 56.20
Maximum 207.56 1419.40 4267.50 251.37 127.21 214.32
Count 48 92 106 18 28 65
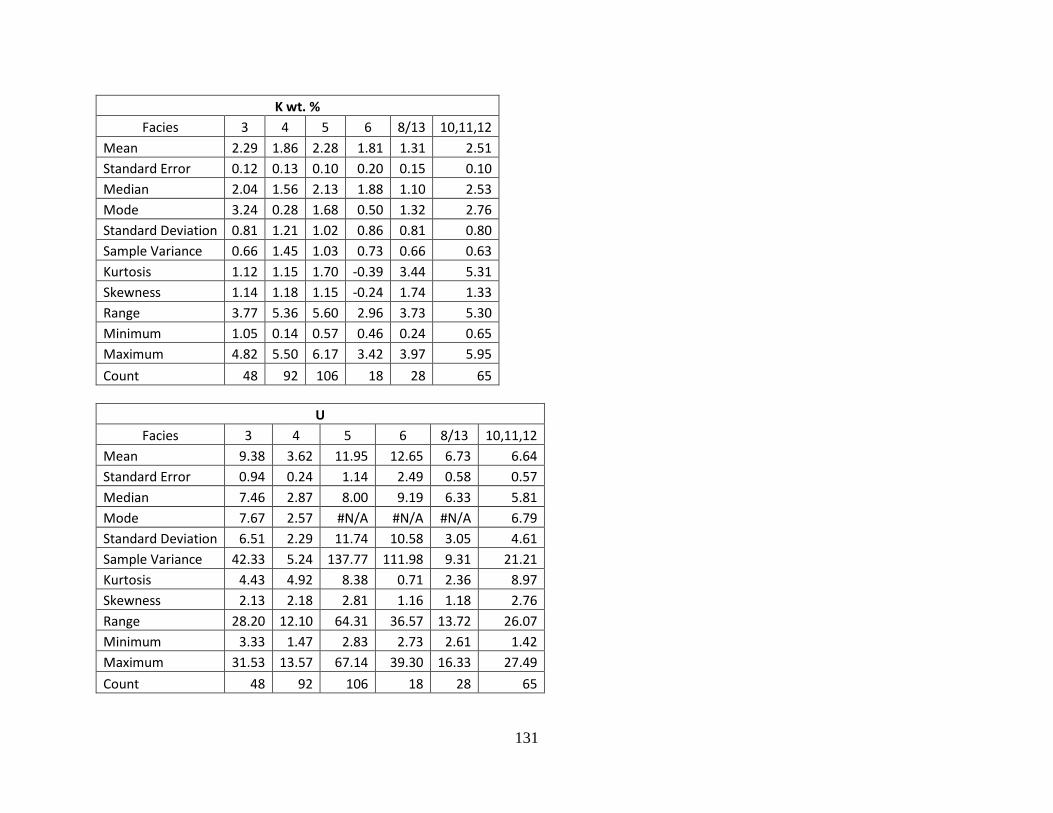
131
K wt. %
Facies 3 4 5 6 8/13 10,11,12
Mean 2.29 1.86 2.28 1.81 1.31 2.51
Standard Error 0.12 0.13 0.10 0.20 0.15 0.10
Median 2.04 1.56 2.13 1.88 1.10 2.53
Mode 3.24 0.28 1.68 0.50 1.32 2.76
Standard Deviation 0.81 1.21 1.02 0.86 0.81 0.80
Sample Variance 0.66 1.45 1.03 0.73 0.66 0.63
Kurtosis 1.12 1.15 1.70 -0.39 3.44 5.31
Skewness 1.14 1.18 1.15 -0.24 1.74 1.33
Range 3.77 5.36 5.60 2.96 3.73 5.30
Minimum 1.05 0.14 0.57 0.46 0.24 0.65
Maximum 4.82 5.50 6.17 3.42 3.97 5.95
Count 48 92 106 18 28 65
U
Facies 3 4 5 6 8/13 10,11,12
Mean 9.38 3.62 11.95 12.65 6.73 6.64
Standard Error 0.94 0.24 1.14 2.49 0.58 0.57
Median 7.46 2.87 8.00 9.19 6.33 5.81
Mode 7.67 2.57 #N/A #N/A #N/A 6.79
Standard Deviation 6.51 2.29 11.74 10.58 3.05 4.61
Sample Variance 42.33 5.24 137.77 111.98 9.31 21.21
Kurtosis 4.43 4.92 8.38 0.71 2.36 8.97
Skewness 2.13 2.18 2.81 1.16 1.18 2.76
Range 28.20 12.10 64.31 36.57 13.72 26.07
Minimum 3.33 1.47 2.83 2.73 2.61 1.42
Maximum 31.53 13.57 67.14 39.30 16.33 27.49
Count 48 92 106 18 28 65
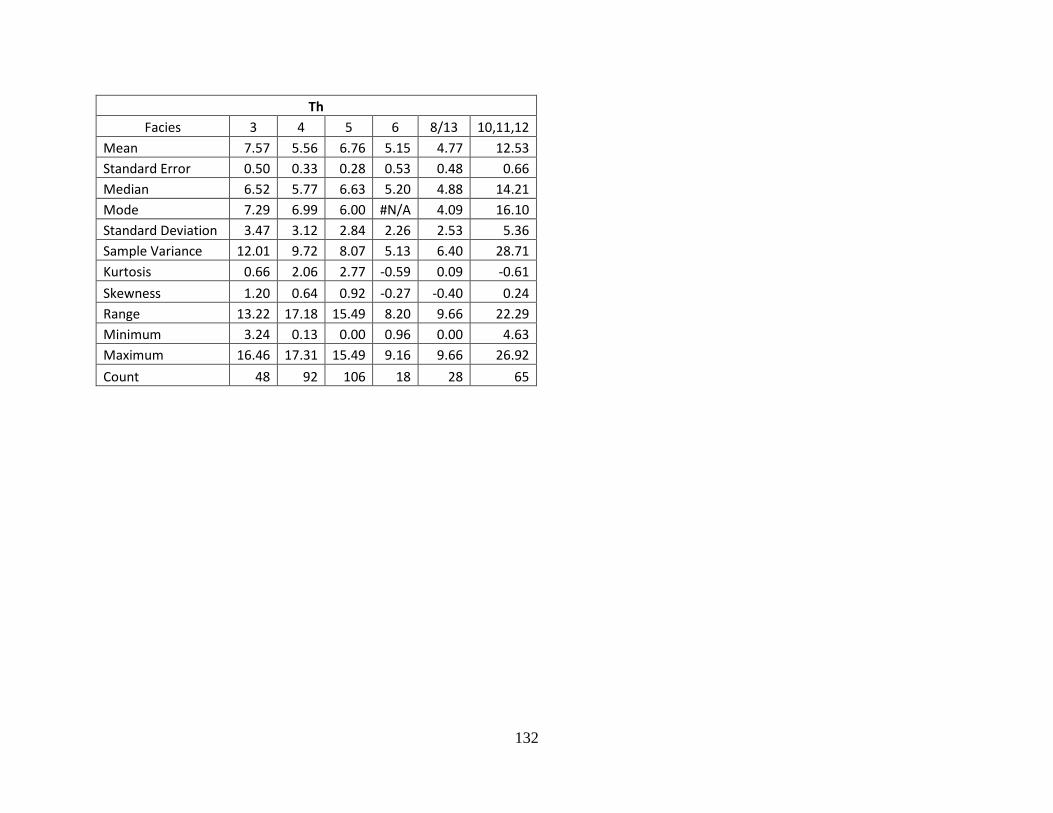
132
Th
Facies 3 4 5 6 8/13 10,11,12
Mean 7.57 5.56 6.76 5.15 4.77 12.53
Standard Error 0.50 0.33 0.28 0.53 0.48 0.66
Median 6.52 5.77 6.63 5.20 4.88 14.21
Mode 7.29 6.99 6.00 #N/A 4.09 16.10
Standard Deviation 3.47 3.12 2.84 2.26 2.53 5.36
Sample Variance 12.01 9.72 8.07 5.13 6.40 28.71
Kurtosis 0.66 2.06 2.77 -0.59 0.09 -0.61
Skewness 1.20 0.64 0.92 -0.27 -0.40 0.24
Range 13.22 17.18 15.49 8.20 9.66 22.29
Minimum 3.24 0.13 0.00 0.96 0.00 4.63
Maximum 16.46 17.31 15.49 9.16 9.66 26.92
Count 48 92 106 18 28 65
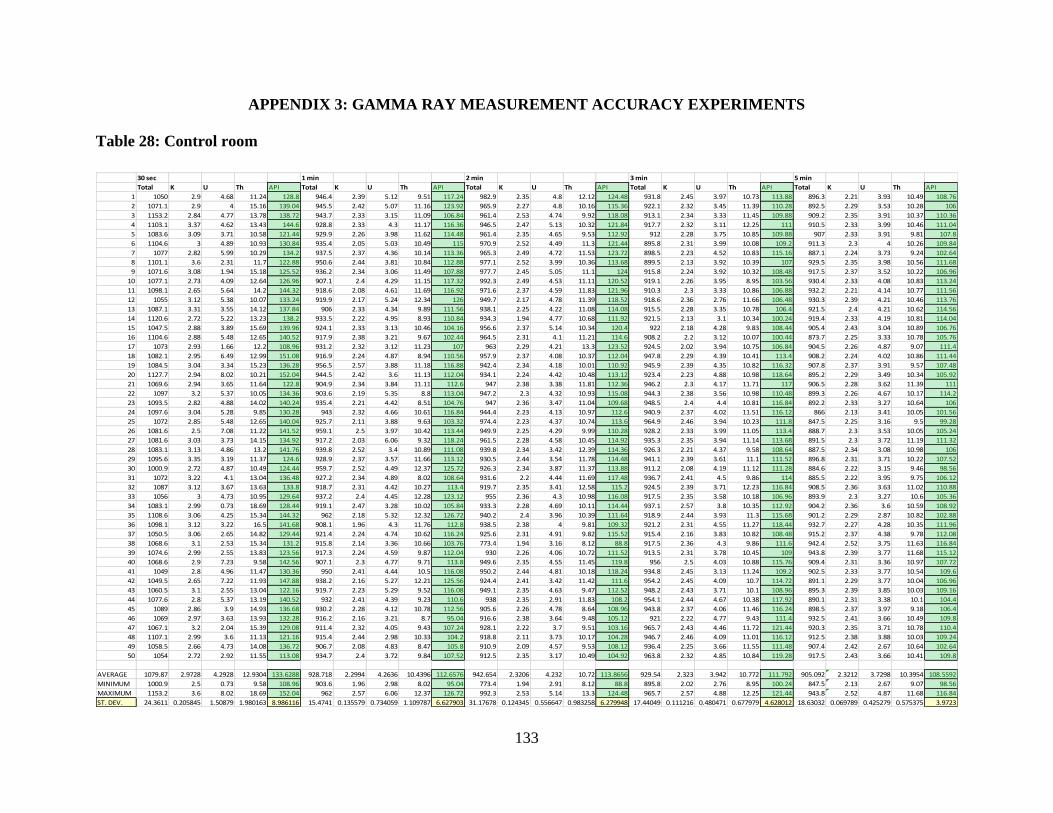
133
APPENDIX 3: GAMMA RAY MEASUREMENT ACCURACY EXPERIMENTS
Table 28: Control room
30 sec 1 min 2 min 3 min 5 min
Total K U Th API Total K U Th API Total K U Th API Total K U Th API Total K U Th API
1 1050 2.9 4.68 11.24 128.8 946.4 2.39 5.12 9.51 117.24 982.9 2.35 4.8 12.12 124.48 931.8 2.45 3.97 10.73 113.88 896.3 2.21 3.93 10.49 108.76
2 1071.1 2.9 4 15.16 139.04 945.5 2.42 5.07 11.16 123.92 965.9 2.27 4.8 10.16 115.36 922.1 2.32 3.45 11.39 110.28 892.5 2.29 3.53 10.28 106
3 1153.2 2.84 4.77 13.78 138.72 943.7 2.33 3.15 11.09 106.84 961.4 2.53 4.74 9.92 118.08 913.1 2.34 3.33 11.45 109.88 909.2 2.35 3.91 10.37 110.36
4 1103.1 3.37 4.62 13.43 144.6 928.8 2.33 4.3 11.17 116.36 946.5 2.47 5.13 10.32 121.84 917.7 2.32 3.11 12.25 111 910.5 2.33 3.99 10.46 111.04
5 1083.6 3.09 3.71 10.58 121.44 929.9 2.26 3.98 11.62 114.48 961.4 2.35 4.65 9.53 112.92 912 2.28 3.75 10.85 109.88 907 2.33 3.91 9.81 107.8
6 1104.6 3 4.89 10.93 130.84 935.4 2.05 5.03 10.49 115 970.9 2.52 4.49 11.3 121.44 895.8 2.31 3.99 10.08 109.2 911.3 2.3 4 10.26 109.84
7 1077 2.82 5.99 10.29 134.2 937.5 2.37 4.36 10.14 113.36 965.3 2.49 4.72 11.53 123.72 898.5 2.23 4.52 10.83 115.16 887.1 2.24 3.73 9.24 102.64
8 1101.1 3.6 2.31 11.7 122.88 950.6 2.44 3.81 10.84 112.88 977.1 2.52 3.99 10.36 113.68 899.5 2.13 3.92 10.39 107 929.5 2.35 3.98 10.56 111.68
9 1071.6 3.08 1.94 15.18 125.52 936.2 2.34 3.06 11.49 107.88 977.7 2.45 5.05 11.1 124 915.8 2.24 3.92 10.32 108.48 917.5 2.37 3.52 10.22 106.96
10 1077.1 2.73 4.09 12.64 126.96 907.1 2.4 4.29 11.15 117.32 992.3 2.49 4.53 11.11 120.52 919.1 2.26 3.95 8.95 103.56 930.4 2.33 4.08 10.83 113.24
11 1098.1 2.65 5.64 14.2 144.32 918.6 2.08 4.61 11.69 116.92 971.6 2.37 4.59 11.83 121.96 910.3 2.3 3.33 10.86 106.88 932.2 2.21 4.14 10.77 111.56
12 1055 3.12 5.38 10.07 133.24 919.9 2.17 5.24 12.34 126 949.7 2.17 4.78 11.39 118.52 918.6 2.36 2.76 11.66 106.48 930.3 2.39 4.21 10.46 113.76
13 1087.1 3.31 3.55 14.12 137.84 906 2.33 4.34 9.89 111.56 938.1 2.25 4.22 11.08 114.08 915.5 2.28 3.35 10.78 106.4 921.5 2.4 4.21 10.62 114.56
14 1120.6 2.72 5.22 13.23 138.2 933.5 2.22 4.95 8.93 110.84 934.3 1.94 4.77 10.68 111.92 921.5 2.13 3.1 10.34 100.24 919.4 2.33 4.19 10.81 114.04
15 1047.5 2.88 3.89 15.69 139.96 924.1 2.33 3.13 10.46 104.16 956.6 2.37 5.14 10.34 120.4 922 2.18 4.28 9.83 108.44 905.4 2.43 3.04 10.89 106.76
16 1104.6 2.88 5.48 12.65 140.52 917.9 2.38 3.21 9.67 102.44 964.5 2.31 4.1 11.21 114.6 908.2 2.2 3.12 10.07 100.44 873.7 2.25 3.33 10.78 105.76
17 1073 2.93 1.66 12.2 108.96 931.2 2.32 3.12 11.23 107 963 2.29 4.21 13.3 123.52 924.5 2.02 3.94 10.75 106.84 904.5 2.26 4.87 9.07 111.4
18 1082.1 2.95 6.49 12.99 151.08 916.9 2.24 4.87 8.94 110.56 957.9 2.37 4.08 10.37 112.04 947.8 2.29 4.39 10.41 113.4 908.2 2.24 4.02 10.86 111.44
19 1084.5 3.04 3.34 15.23 136.28 956.5 2.57 3.88 11.18 116.88 942.4 2.34 4.18 10.01 110.92 945.9 2.39 4.35 10.82 116.32 907.8 2.37 3.91 9.57 107.48
20 1127.7 2.94 8.02 10.21 152.04 944.5 2.42 3.6 11.13 112.04 934.1 2.24 4.42 10.48 113.12 923.4 2.23 4.88 10.98 118.64 895.2 2.29 3.49 10.34 105.92
21 1069.6 2.94 3.65 11.64 122.8 904.9 2.34 3.84 11.11 112.6 947 2.38 3.38 11.81 112.36 946.2 2.3 4.17 11.71 117 906.5 2.28 3.62 11.39 111
22 1097 3.2 5.37 10.05 134.36 903.6 2.19 5.35 8.8 113.04 947.2 2.3 4.32 10.93 115.08 944.3 2.38 3.56 10.98 110.48 899.3 2.26 4.67 10.17 114.2
23 1093.5 2.82 4.88 14.02 140.24 935.4 2.21 4.42 8.51 104.76 947 2.36 3.47 11.04 109.68 948.5 2.4 4.4 10.81 116.84 892.2 2.33 3.27 10.64 106
24 1097.6 3.04 5.28 9.85 130.28 943 2.32 4.66 10.61 116.84 944.4 2.23 4.13 10.97 112.6 940.9 2.37 4.02 11.51 116.12 866 2.13 3.41 10.05 101.56
25 1072 2.85 5.48 12.65 140.04 925.7 2.11 3.88 9.63 103.32 974.4 2.23 4.37 10.74 113.6 964.9 2.46 3.94 10.23 111.8 847.5 2.25 3.16 9.5 99.28
26 1081.6 2.5 7.08 11.22 141.52 959.1 2.5 3.97 10.42 113.44 949.9 2.25 4.29 9.99 110.28 928.2 2.33 3.99 11.05 113.4 888.7 2.3 3.53 10.05 105.24
27 1081.6 3.03 3.73 14.15 134.92 917.2 2.03 6.06 9.32 118.24 961.5 2.28 4.58 10.45 114.92 935.3 2.35 3.94 11.14 113.68 891.5 2.3 3.72 11.19 111.32
28 1083.1 3.13 4.86 13.2 141.76 939.8 2.52 3.4 10.89 111.08 939.8 2.34 3.42 12.39 114.36 926.3 2.21 4.37 9.58 108.64 887.5 2.34 3.08 10.98 106
29 1095.6 3.35 3.19 11.37 124.6 928.9 2.37 3.57 11.66 113.12 930.5 2.44 3.54 11.78 114.48 941.1 2.39 3.61 11.1 111.52 896.8 2.31 3.71 10.22 107.52
30 1000.9 2.72 4.87 10.49 124.44 959.7 2.52 4.49 12.37 125.72 926.3 2.34 3.87 11.37 113.88 911.2 2.08 4.19 11.12 111.28 884.6 2.22 3.15 9.46 98.56
31 1072 3.22 4.1 13.04 136.48 927.2 2.34 4.89 8.02 108.64 931.6 2.2 4.44 11.69 117.48 936.7 2.41 4.5 9.86 114 885.5 2.22 3.95 9.75 106.12
32 1087 3.12 3.67 13.63 133.8 918.7 2.31 4.42 10.27 113.4 919.7 2.35 3.41 12.58 115.2 924.5 2.39 3.71 12.23 116.84 908.5 2.36 3.63 11.02 110.88
33 1056 3 4.73 10.95 129.64 937.2 2.4 4.45 12.28 123.12 955 2.36 4.3 10.98 116.08 917.5 2.35 3.58 10.18 106.96 893.9 2.3 3.27 10.6 105.36
34 1083.1 2.99 0.73 18.69 128.44 919.1 2.47 3.28 10.02 105.84 933.3 2.28 4.69 10.11 114.44 937.1 2.57 3.8 10.35 112.92 904.2 2.36 3.6 10.59 108.92
35 1108.6 3.06 4.25 15.34 144.32 962 2.18 5.32 12.32 126.72 940.2 2.4 3.96 10.39 111.64 918.9 2.44 3.93 11.3 115.68 901.2 2.29 2.87 10.82 102.88
36 1098.1 3.12 3.22 16.5 141.68 908.1 1.96 4.3 11.76 112.8 938.5 2.38 4 9.81 109.32 921.2 2.31 4.55 11.27 118.44 932.7 2.27 4.28 10.35 111.96
37 1050.5 3.06 2.65 14.82 129.44 921.4 2.24 4.74 10.62 116.24 925.6 2.31 4.91 9.82 115.52 915.4 2.16 3.83 10.82 108.48 915.2 2.37 4.38 9.78 112.08
38 1068.6 3.1 2.53 15.34 131.2 915.8 2.14 3.36 10.66 103.76 773.4 1.94 3.16 8.12 88.8 917.5 2.36 4.3 9.86 111.6 942.4 2.52 3.75 11.63 116.84
39 1074.6 2.99 2.55 13.83 123.56 917.3 2.24 4.59 9.87 112.04 930 2.26 4.06 10.72 111.52 913.5 2.31 3.78 10.45 109 943.8 2.39 3.77 11.68 115.12
40 1068.6 2.9 7.23 9.58 142.56 907.1 2.3 4.77 9.71 113.8 949.6 2.35 4.55 11.45 119.8 956 2.5 4.03 10.88 115.76 909.4 2.31 3.36 10.97 107.72
41 1049 2.8 4.96 11.47 130.36 950 2.41 4.44 10.5 116.08 950.2 2.44 4.81 10.18 118.24 934.8 2.45 3.13 11.24 109.2 902.5 2.33 3.77 10.54 109.6
42 1049.5 2.65 7.22 11.93 147.88 938.2 2.16 5.27 12.21 125.56 924.4 2.41 3.42 11.42 111.6 954.2 2.45 4.09 10.7 114.72 891.1 2.29 3.77 10.04 106.96
43 1060.5 3.1 2.55 13.04 122.16 919.7 2.23 5.29 9.52 116.08 949.1 2.35 4.63 9.47 112.52 948.2 2.43 3.71 10.1 108.96 895.3 2.39 3.85 10.03 109.16
44 1077.6 2.8 5.37 13.19 140.52 932 2.41 4.39 9.23 110.6 938 2.35 2.91 11.83 108.2 954.1 2.44 4.67 10.38 117.92 890.1 2.31 3.38 10.1 104.4
45 1089 2.86 3.9 14.93 136.68 930.2 2.28 4.12 10.78 112.56 905.6 2.26 4.78 8.64 108.96 943.8 2.37 4.06 11.46 116.24 898.5 2.37 3.97 9.18 106.4
46 1069 2.97 3.63 13.93 132.28 916.2 2.16 3.21 8.7 95.04 916.6 2.38 3.64 9.48 105.12 921 2.22 4.77 9.43 111.4 932.5 2.41 3.66 10.49 109.8
47 1067.1 3.2 2.04 15.39 129.08 911.4 2.32 4.05 9.43 107.24 928.1 2.22 3.7 9.51 103.16 965.7 2.43 4.46 11.72 121.44 920.3 2.35 3.71 10.78 110.4
48 1107.1 2.99 3.6 11.13 121.16 915.4 2.44 2.98 10.33 104.2 918.8 2.11 3.73 10.17 104.28 946.7 2.46 4.09 11.01 116.12 912.5 2.38 3.88 10.03 109.24
49 1058.5 2.66 4.73 14.08 136.72 906.7 2.08 4.83 8.47 105.8 910.9 2.09 4.57 9.53 108.12 936.4 2.25 3.66 11.55 111.48 907.4 2.42 2.67 10.64 102.64
50 1054 2.72 2.92 11.55 113.08 934.7 2.4 3.72 9.84 107.52 912.5 2.35 3.17 10.49 104.92 963.8 2.32 4.85 10.84 119.28 917.5 2.43 3.66 10.41 109.8
AVERAGE 1079.87 2.9728 4.2928 12.9304 133.6288 928.718 2.2994 4.2636 10.4396 112.6576 942.654 2.3206 4.232 10.72 113.8656 929.54 2.323 3.942 10.772 111.792 905.092 2.3212 3.7298 10.3954 108.5592
MINIMUM 1000.9 2.5 0.73 9.58 108.96 903.6 1.96 2.98 8.02 95.04 773.4 1.94 2.91 8.12 88.8 895.8 2.02 2.76 8.95 100.24 847.5 2.13 2.67 9.07 98.56
MAXIMUM 1153.2 3.6 8.02 18.69 152.04 962 2.57 6.06 12.37 126.72 992.3 2.53 5.14 13.3 124.48 965.7 2.57 4.88 12.25 121.44 943.8 2.52 4.87 11.68 116.84
ST. DEV. 24.3611 0.205845 1.50879 1.980163 8.986116 15.4741 0.135579 0.734059 1.109787 6.627903 31.17678 0.124345 0.556647 0.983258 6.279948 17.44049 0.111216 0.480471 0.677979 4.628012 18.63032 0.069789 0.425279 0.575375 3.9723
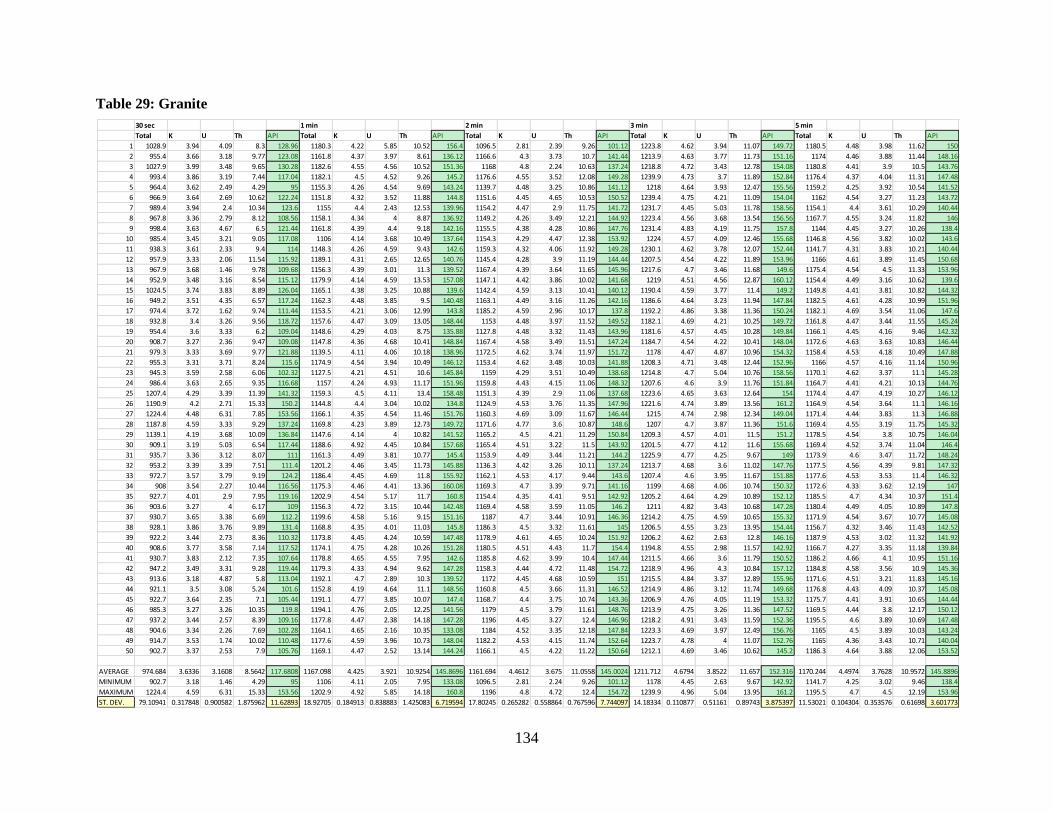
134
Table 29: Granite
30 sec 1 min 2 min 3 min 5 min
Total K U Th API Total K U Th API Total K U Th API Total K U Th API Total K U Th API
1 1028.9 3.94 4.09 8.3 128.96 1180.3 4.22 5.85 10.52 156.4 1096.5 2.81 2.39 9.26 101.12 1223.8 4.62 3.94 11.07 149.72 1180.5 4.48 3.98 11.62 150
2 955.4 3.66 3.18 9.77 123.08 1161.8 4.37 3.97 8.61 136.12 1166.6 4.3 3.73 10.7 141.44 1213.9 4.63 3.77 11.73 151.16 1174 4.46 3.88 11.44 148.16
3 1027.9 3.99 3.48 9.65 130.28 1182.6 4.55 4.56 10.52 151.36 1168 4.8 2.24 10.63 137.24 1218.8 4.72 3.43 12.78 154.08 1180.8 4.41 3.9 10.5 143.76
4 993.4 3.86 3.19 7.44 117.04 1182.1 4.5 4.52 9.26 145.2 1176.6 4.55 3.52 12.08 149.28 1239.9 4.73 3.7 11.89 152.84 1176.4 4.37 4.04 11.31 147.48
5 964.4 3.62 2.49 4.29 95 1155.3 4.26 4.54 9.69 143.24 1139.7 4.48 3.25 10.86 141.12 1218 4.64 3.93 12.47 155.56 1159.2 4.25 3.92 10.54 141.52
6 966.9 3.64 2.69 10.62 122.24 1151.8 4.32 3.52 11.88 144.8 1151.6 4.45 4.65 10.53 150.52 1239.4 4.75 4.21 11.09 154.04 1162 4.54 3.27 11.23 143.72
7 989.4 3.94 2.4 10.34 123.6 1155 4.4 2.43 12.53 139.96 1154.2 4.47 2.9 11.75 141.72 1231.7 4.45 5.03 11.78 158.56 1154.1 4.4 3.61 10.29 140.44
8 967.8 3.36 2.79 8.12 108.56 1158.1 4.34 4 8.87 136.92 1149.2 4.26 3.49 12.21 144.92 1223.4 4.56 3.68 13.54 156.56 1167.7 4.55 3.24 11.82 146
9 998.4 3.63 4.67 6.5 121.44 1161.8 4.39 4.4 9.18 142.16 1155.5 4.38 4.28 10.86 147.76 1231.4 4.83 4.19 11.75 157.8 1144 4.45 3.27 10.26 138.4
10 985.4 3.45 3.21 9.05 117.08 1106 4.14 3.68 10.49 137.64 1154.3 4.29 4.47 12.38 153.92 1224 4.57 4.09 12.46 155.68 1146.8 4.56 3.82 10.02 143.6
11 938.3 3.61 2.33 9.4 114 1148.3 4.26 4.59 9.43 142.6 1159.3 4.32 4.06 11.92 149.28 1230.1 4.62 3.78 12.07 152.44 1141.7 4.31 3.83 10.21 140.44
12 957.9 3.33 2.06 11.54 115.92 1189.1 4.31 2.65 12.65 140.76 1145.4 4.28 3.9 11.19 144.44 1207.5 4.54 4.22 11.89 153.96 1166 4.61 3.89 11.45 150.68
13 967.9 3.68 1.46 9.78 109.68 1156.3 4.39 3.01 11.3 139.52 1167.4 4.39 3.64 11.65 145.96 1217.6 4.7 3.46 11.68 149.6 1175.4 4.54 4.5 11.33 153.96
14 952.9 3.48 3.16 8.54 115.12 1179.9 4.14 4.59 13.53 157.08 1147.1 4.42 3.86 10.02 141.68 1219 4.51 4.56 12.87 160.12 1154.4 4.49 3.16 10.62 139.6
15 1024.5 3.74 3.83 8.89 126.04 1165.1 4.38 3.25 10.88 139.6 1142.4 4.59 3.13 10.41 140.12 1190.4 4.59 3.77 11.4 149.2 1149.8 4.41 3.81 10.82 144.32
16 949.2 3.51 4.35 6.57 117.24 1162.3 4.48 3.85 9.5 140.48 1163.1 4.49 3.16 11.26 142.16 1186.6 4.64 3.23 11.94 147.84 1182.5 4.61 4.28 10.99 151.96
17 974.4 3.72 1.62 9.74 111.44 1153.5 4.21 3.06 12.99 143.8 1185.2 4.59 2.96 10.17 137.8 1192.2 4.86 3.38 11.36 150.24 1182.1 4.69 3.54 11.06 147.6
18 932.8 3.4 3.26 9.56 118.72 1157.6 4.47 3.09 13.05 148.44 1153 4.48 3.97 11.52 149.52 1182.1 4.69 4.21 10.25 149.72 1161.8 4.47 3.44 11.55 145.24
19 954.4 3.6 3.33 6.2 109.04 1148.6 4.29 4.03 8.75 135.88 1127.8 4.48 3.32 11.43 143.96 1181.6 4.57 4.45 10.28 149.84 1166.1 4.45 4.16 9.46 142.32
20 908.7 3.27 2.36 9.47 109.08 1147.8 4.36 4.68 10.41 148.84 1167.4 4.58 3.49 11.51 147.24 1184.7 4.54 4.22 10.41 148.04 1172.6 4.63 3.63 10.83 146.44
21 979.3 3.33 3.69 9.77 121.88 1139.5 4.11 4.06 10.18 138.96 1172.5 4.62 3.74 11.97 151.72 1178 4.47 4.87 10.96 154.32 1158.4 4.53 4.18 10.49 147.88
22 955.3 3.31 3.71 8.24 115.6 1174.9 4.54 3.94 10.49 146.12 1153.4 4.62 3.48 10.03 141.88 1208.3 4.71 3.48 12.44 152.96 1166 4.57 4.16 11.14 150.96
23 945.3 3.59 2.58 6.06 102.32 1127.5 4.21 4.51 10.6 145.84 1159 4.29 3.51 10.49 138.68 1214.8 4.7 5.04 10.76 158.56 1170.1 4.62 3.37 11.1 145.28
24 986.4 3.63 2.65 9.35 116.68 1157 4.24 4.93 11.17 151.96 1159.8 4.43 4.15 11.06 148.32 1207.6 4.6 3.9 11.76 151.84 1164.7 4.41 4.21 10.13 144.76
25 1207.4 4.29 3.39 11.39 141.32 1159.3 4.5 4.11 13.4 158.48 1151.3 4.39 2.9 11.06 137.68 1223.6 4.65 3.63 12.64 154 1174.4 4.47 4.19 10.27 146.12
26 1190.9 4.2 2.71 15.33 150.2 1144.8 4.4 3.04 10.02 134.8 1124.9 4.53 3.76 11.35 147.96 1221.6 4.74 3.89 13.56 161.2 1164.9 4.54 3.64 11.1 146.16
27 1224.4 4.48 6.31 7.85 153.56 1166.1 4.35 4.54 11.46 151.76 1160.3 4.69 3.09 11.67 146.44 1215 4.74 2.98 12.34 149.04 1171.4 4.44 3.83 11.3 146.88
28 1187.8 4.59 3.33 9.29 137.24 1169.8 4.23 3.89 12.73 149.72 1171.6 4.77 3.6 10.87 148.6 1207 4.7 3.87 11.36 151.6 1169.4 4.55 3.19 11.75 145.32
29 1139.1 4.19 3.68 10.09 136.84 1147.6 4.14 4 10.82 141.52 1165.2 4.5 4.21 11.29 150.84 1209.3 4.57 4.01 11.5 151.2 1178.5 4.54 3.8 10.75 146.04
30 909.1 3.19 5.03 6.54 117.44 1188.6 4.92 4.45 10.84 157.68 1165.4 4.51 3.22 11.5 143.92 1201.5 4.77 4.12 11.6 155.68 1169.4 4.52 3.74 11.04 146.4
31 935.7 3.36 3.12 8.07 111 1161.3 4.49 3.81 10.77 145.4 1153.9 4.49 3.44 11.21 144.2 1225.9 4.77 4.25 9.67 149 1173.9 4.6 3.47 11.72 148.24
32 953.2 3.39 3.39 7.51 111.4 1201.2 4.46 3.45 11.73 145.88 1136.3 4.42 3.26 10.11 137.24 1213.7 4.68 3.6 11.02 147.76 1177.5 4.56 4.39 9.81 147.32
33 972.7 3.57 3.79 9.19 124.2 1186.4 4.45 4.69 11.8 155.92 1162.1 4.53 4.17 9.44 143.6 1207.4 4.6 3.95 11.67 151.88 1177.6 4.53 3.53 11.4 146.32
34 908 3.54 2.27 10.44 116.56 1175.3 4.46 4.41 13.36 160.08 1169.3 4.7 3.39 9.71 141.16 1199 4.68 4.06 10.74 150.32 1172.6 4.33 3.62 12.19 147
35 927.7 4.01 2.9 7.95 119.16 1202.9 4.54 5.17 11.7 160.8 1154.4 4.35 4.41 9.51 142.92 1205.2 4.64 4.29 10.89 152.12 1185.5 4.7 4.34 10.37 151.4
36 903.6 3.27 4 6.17 109 1156.3 4.72 3.15 10.44 142.48 1169.4 4.58 3.59 11.05 146.2 1211 4.82 3.43 10.68 147.28 1180.4 4.49 4.05 10.89 147.8
37 930.7 3.65 3.38 6.69 112.2 1199.6 4.58 5.16 9.15 151.16 1187 4.7 3.44 10.91 146.36 1214.2 4.75 4.59 10.65 155.32 1171.9 4.54 3.67 10.77 145.08
38 928.1 3.86 3.76 9.89 131.4 1168.8 4.35 4.01 11.03 145.8 1186.3 4.5 3.32 11.61 145 1206.5 4.55 3.23 13.95 154.44 1156.7 4.32 3.46 11.43 142.52
39 922.2 3.44 2.73 8.36 110.32 1173.8 4.45 4.24 10.59 147.48 1178.9 4.61 4.65 10.24 151.92 1206.2 4.62 2.63 12.8 146.16 1187.9 4.53 3.02 11.32 141.92
40 908.6 3.77 3.58 7.14 117.52 1174.1 4.75 4.28 10.26 151.28 1180.5 4.51 4.43 11.7 154.4 1194.8 4.55 2.98 11.57 142.92 1166.7 4.27 3.35 11.18 139.84
41 930.7 3.83 2.12 7.35 107.64 1178.8 4.65 4.55 7.95 142.6 1185.8 4.62 3.99 10.4 147.44 1211.5 4.66 3.6 11.79 150.52 1186.2 4.66 4.1 10.95 151.16
42 947.2 3.49 3.31 9.28 119.44 1179.3 4.33 4.94 9.62 147.28 1158.3 4.44 4.72 11.48 154.72 1218.9 4.96 4.3 10.84 157.12 1184.8 4.58 3.56 10.9 145.36
43 913.6 3.18 4.87 5.8 113.04 1192.1 4.7 2.89 10.3 139.52 1172 4.45 4.68 10.59 151 1215.5 4.84 3.37 12.89 155.96 1171.6 4.51 3.21 11.83 145.16
44 921.1 3.5 3.08 5.24 101.6 1152.8 4.19 4.64 11.1 148.56 1160.8 4.5 3.66 11.31 146.52 1214.9 4.86 3.12 11.74 149.68 1176.8 4.43 4.09 10.37 145.08
45 922.7 3.64 2.35 7.1 105.44 1191.1 4.77 3.85 10.07 147.4 1168.7 4.4 3.75 10.74 143.36 1206.9 4.76 4.05 11.19 153.32 1175.7 4.41 3.91 10.65 144.44
46 985.3 3.27 3.26 10.35 119.8 1194.1 4.76 2.05 12.25 141.56 1179 4.5 3.79 11.61 148.76 1213.9 4.75 3.26 11.36 147.52 1169.5 4.44 3.8 12.17 150.12
47 937.2 3.44 2.57 8.39 109.16 1177.8 4.47 2.38 14.18 147.28 1196 4.45 3.27 12.4 146.96 1218.2 4.91 3.43 11.59 152.36 1195.5 4.6 3.89 10.69 147.48
48 904.6 3.34 2.26 7.69 102.28 1164.1 4.65 2.16 10.35 133.08 1184 4.52 3.35 12.18 147.84 1223.3 4.69 3.97 12.49 156.76 1165 4.5 3.89 10.03 143.24
49 914.7 3.53 1.74 10.02 110.48 1177.6 4.59 3.96 10.73 148.04 1182.2 4.53 4.15 11.74 152.64 1223.7 4.78 4 11.07 152.76 1165 4.36 3.43 10.71 140.04
50 902.7 3.37 2.53 7.9 105.76 1169.1 4.47 2.52 13.14 144.24 1166.1 4.5 4.22 11.22 150.64 1212.1 4.69 3.46 10.62 145.2 1186.3 4.64 3.88 12.06 153.52
AVERAGE 974.684 3.6336 3.1608 8.5642 117.6808 1167.098 4.425 3.921 10.9254 145.8696 1161.694 4.4612 3.675 11.0558 145.0024 1211.712 4.6794 3.8522 11.657 152.316 1170.244 4.4974 3.7628 10.9572 145.8896
MINIMUM 902.7 3.18 1.46 4.29 95 1106 4.11 2.05 7.95 133.08 1096.5 2.81 2.24 9.26 101.12 1178 4.45 2.63 9.67 142.92 1141.7 4.25 3.02 9.46 138.4
MAXIMUM 1224.4 4.59 6.31 15.33 153.56 1202.9 4.92 5.85 14.18 160.8 1196 4.8 4.72 12.4 154.72 1239.9 4.96 5.04 13.95 161.2 1195.5 4.7 4.5 12.19 153.96
ST. DEV. 79.10941 0.317848 0.900582 1.875962 11.62893 18.92705 0.184913 0.838883 1.425083 6.719594 17.80245 0.265282 0.558864 0.767596 7.744097 14.18334 0.110877 0.51161 0.89743 3.875397 11.53021 0.104304 0.353576 0.61698 3.601773
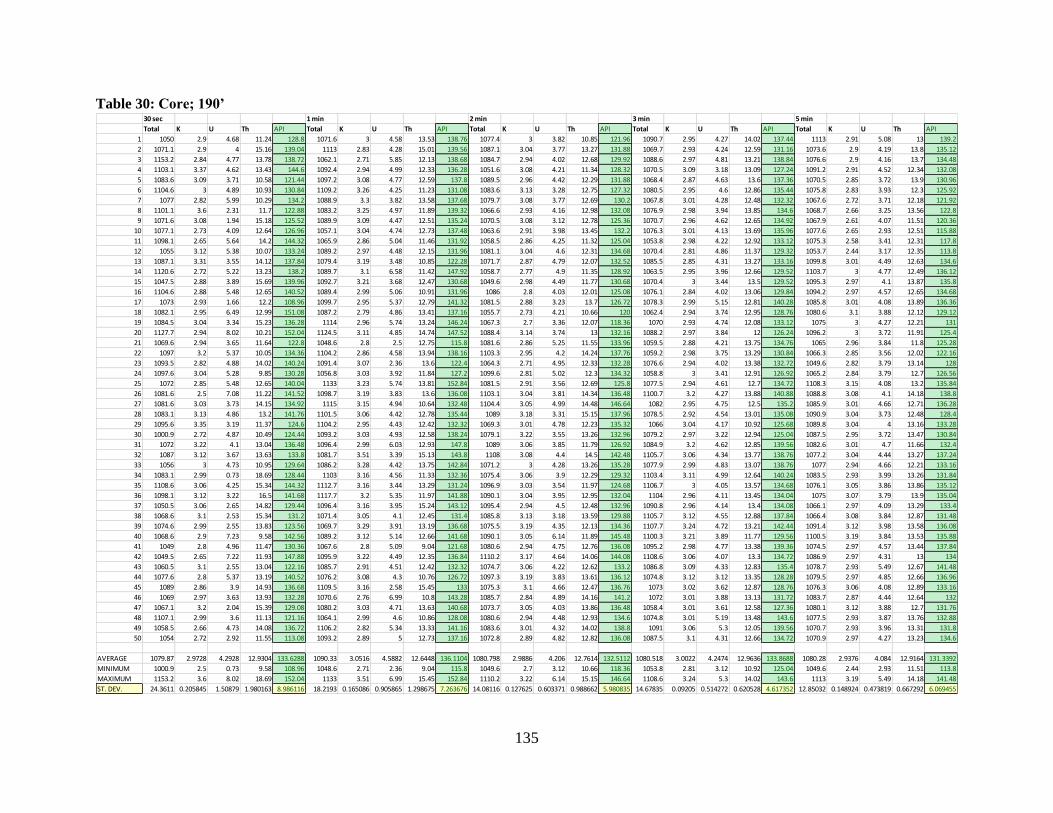
135
Table 30: Core; 190’ 30 sec 1 min 2 min 3 min 5 min
Total K U Th API Total K U Th API Total K U Th API Total K U Th API Total K U Th API
1 1050 2.9 4.68 11.24 128.8 1071.6 3 4.58 13.53 138.76 1077.4 3 3.82 10.85 121.96 1090.7 2.95 4.27 14.02 137.44 1113 2.91 5.08 13 139.2
2 1071.1 2.9 4 15.16 139.04 1113 2.83 4.28 15.01 139.56 1087.1 3.04 3.77 13.27 131.88 1069.7 2.93 4.24 12.59 131.16 1073.6 2.9 4.19 13.8 135.12
3 1153.2 2.84 4.77 13.78 138.72 1062.1 2.71 5.85 12.13 138.68 1084.7 2.94 4.02 12.68 129.92 1088.6 2.97 4.81 13.21 138.84 1076.6 2.9 4.16 13.7 134.48
4 1103.1 3.37 4.62 13.43 144.6 1092.4 2.94 4.99 12.33 136.28 1051.6 3.08 4.21 11.34 128.32 1070.5 3.09 3.18 13.09 127.24 1091.2 2.91 4.52 12.34 132.08
5 1083.6 3.09 3.71 10.58 121.44 1097.2 3.08 4.77 12.59 137.8 1089.5 2.96 4.42 12.29 131.88 1068.4 2.87 4.63 13.6 137.36 1070.5 2.85 3.72 13.9 130.96
6 1104.6 3 4.89 10.93 130.84 1109.2 3.26 4.25 11.23 131.08 1083.6 3.13 3.28 12.75 127.32 1080.5 2.95 4.6 12.86 135.44 1075.8 2.83 3.93 12.3 125.92
7 1077 2.82 5.99 10.29 134.2 1088.9 3.3 3.82 13.58 137.68 1079.7 3.08 3.77 12.69 130.2 1067.8 3.01 4.28 12.48 132.32 1067.6 2.72 3.71 12.18 121.92
8 1101.1 3.6 2.31 11.7 122.88 1083.2 3.25 4.97 11.89 139.32 1066.6 2.93 4.16 12.98 132.08 1076.9 2.98 3.94 13.85 134.6 1068.7 2.66 3.25 13.56 122.8
9 1071.6 3.08 1.94 15.18 125.52 1089.9 3.09 4.47 12.51 135.24 1070.5 3.08 3.12 12.78 125.36 1070.7 2.96 4.62 12.65 134.92 1067.9 2.61 4.07 11.51 120.36
10 1077.1 2.73 4.09 12.64 126.96 1057.1 3.04 4.74 12.73 137.48 1063.6 2.91 3.98 13.45 132.2 1076.3 3.01 4.13 13.69 135.96 1077.6 2.65 2.93 12.51 115.88
11 1098.1 2.65 5.64 14.2 144.32 1065.9 2.86 5.04 11.46 131.92 1058.5 2.86 4.25 11.32 125.04 1053.8 2.98 4.22 12.92 133.12 1075.3 2.58 3.41 12.31 117.8
12 1055 3.12 5.38 10.07 133.24 1089.2 2.97 4.48 12.15 131.96 1081.1 3.04 4.6 12.31 134.68 1070.4 2.81 4.86 11.37 129.32 1053.7 2.44 3.17 12.35 113.8
13 1087.1 3.31 3.55 14.12 137.84 1079.4 3.19 3.48 10.85 122.28 1071.7 2.87 4.79 12.07 132.52 1085.5 2.85 4.31 13.27 133.16 1099.8 3.01 4.49 12.63 134.6
14 1120.6 2.72 5.22 13.23 138.2 1089.7 3.1 6.58 11.42 147.92 1058.7 2.77 4.9 11.35 128.92 1063.5 2.95 3.96 12.66 129.52 1103.7 3 4.77 12.49 136.12
15 1047.5 2.88 3.89 15.69 139.96 1092.7 3.21 3.68 12.47 130.68 1049.6 2.98 4.49 11.77 130.68 1070.4 3 3.44 13.5 129.52 1095.3 2.97 4.1 13.87 135.8
16 1104.6 2.88 5.48 12.65 140.52 1089.4 2.99 5.06 10.91 131.96 1086 2.8 4.03 12.01 125.08 1076.1 2.84 4.02 13.06 129.84 1094.2 2.97 4.57 12.65 134.68
17 1073 2.93 1.66 12.2 108.96 1099.7 2.95 5.37 12.79 141.32 1081.5 2.88 3.23 13.7 126.72 1078.3 2.99 5.15 12.81 140.28 1085.8 3.01 4.08 13.89 136.36
18 1082.1 2.95 6.49 12.99 151.08 1087.2 2.79 4.86 13.41 137.16 1055.7 2.73 4.21 10.66 120 1062.4 2.94 3.74 12.95 128.76 1080.6 3.1 3.88 12.12 129.12
19 1084.5 3.04 3.34 15.23 136.28 1114 2.96 5.74 13.24 146.24 1067.3 2.7 3.36 12.07 118.36 1070 2.93 4.74 12.08 133.12 1075 3 4.27 12.21 131
20 1127.7 2.94 8.02 10.21 152.04 1124.5 3.11 4.85 14.74 147.52 1088.4 3.14 3.74 13 132.16 1088.2 2.97 3.84 12 126.24 1096.2 3 3.72 11.91 125.4
21 1069.6 2.94 3.65 11.64 122.8 1048.6 2.8 2.5 12.75 115.8 1081.6 2.86 5.25 11.55 133.96 1059.5 2.88 4.21 13.75 134.76 1065 2.96 3.84 11.8 125.28
22 1097 3.2 5.37 10.05 134.36 1104.2 2.86 4.58 13.94 138.16 1103.3 2.95 4.2 14.24 137.76 1059.2 2.98 3.75 13.29 130.84 1066.3 2.85 3.56 12.02 122.16
23 1093.5 2.82 4.88 14.02 140.24 1091.4 3.07 2.36 13.6 122.4 1064.3 2.71 4.95 12.33 132.28 1076.6 2.94 4.02 13.38 132.72 1049.6 2.82 3.79 13.14 128
24 1097.6 3.04 5.28 9.85 130.28 1056.8 3.03 3.92 11.84 127.2 1099.6 2.81 5.02 12.3 134.32 1058.8 3 3.41 12.91 126.92 1065.2 2.84 3.79 12.7 126.56
25 1072 2.85 5.48 12.65 140.04 1133 3.23 5.74 13.81 152.84 1081.5 2.91 3.56 12.69 125.8 1077.5 2.94 4.61 12.7 134.72 1108.3 3.15 4.08 13.2 135.84
26 1081.6 2.5 7.08 11.22 141.52 1098.7 3.19 3.83 13.6 136.08 1103.1 3.04 3.81 14.34 136.48 1100.7 3.2 4.27 13.88 140.88 1088.8 3.08 4.1 14.18 138.8
27 1081.6 3.03 3.73 14.15 134.92 1115 3.15 4.94 10.64 132.48 1104.4 3.05 4.99 14.48 146.64 1082 2.95 4.75 12.5 135.2 1085.9 3.01 4.66 12.71 136.28
28 1083.1 3.13 4.86 13.2 141.76 1101.5 3.06 4.42 12.78 135.44 1089 3.18 3.31 15.15 137.96 1078.5 2.92 4.54 13.01 135.08 1090.9 3.04 3.73 12.48 128.4
29 1095.6 3.35 3.19 11.37 124.6 1104.2 2.95 4.43 12.42 132.32 1069.3 3.01 4.78 12.23 135.32 1066 3.04 4.17 10.92 125.68 1089.8 3.04 4 13.16 133.28
30 1000.9 2.72 4.87 10.49 124.44 1093.2 3.03 4.93 12.58 138.24 1079.1 3.22 3.55 13.26 132.96 1079.2 2.97 3.22 12.94 125.04 1087.5 2.95 3.72 13.47 130.84
31 1072 3.22 4.1 13.04 136.48 1096.4 2.99 6.03 12.93 147.8 1089 3.06 3.85 11.79 126.92 1084.9 3.2 4.62 12.85 139.56 1082.6 3.01 4.7 11.66 132.4
32 1087 3.12 3.67 13.63 133.8 1081.7 3.51 3.39 15.13 143.8 1108 3.08 4.4 14.5 142.48 1105.7 3.06 4.34 13.77 138.76 1077.2 3.04 4.44 13.27 137.24
33 1056 3 4.73 10.95 129.64 1086.2 3.28 4.42 13.75 142.84 1071.2 3 4.28 13.26 135.28 1077.9 2.99 4.83 13.07 138.76 1077 2.94 4.66 12.21 133.16
34 1083.1 2.99 0.73 18.69 128.44 1103 3.16 4.56 11.33 132.36 1075.4 3.06 3.9 12.29 129.32 1103.4 3.11 4.99 12.64 140.24 1083.5 2.93 3.99 13.26 131.84
35 1108.6 3.06 4.25 15.34 144.32 1112.7 3.16 3.44 13.29 131.24 1096.9 3.03 3.54 11.97 124.68 1106.7 3 4.05 13.57 134.68 1076.1 3.05 3.86 13.86 135.12
36 1098.1 3.12 3.22 16.5 141.68 1117.7 3.2 5.35 11.97 141.88 1090.1 3.04 3.95 12.95 132.04 1104 2.96 4.11 13.45 134.04 1075 3.07 3.79 13.9 135.04
37 1050.5 3.06 2.65 14.82 129.44 1096.4 3.16 3.95 15.24 143.12 1095.4 2.94 4.5 12.48 132.96 1090.8 2.96 4.14 13.4 134.08 1066.1 2.97 4.09 13.29 133.4
38 1068.6 3.1 2.53 15.34 131.2 1071.4 3.05 4.1 12.45 131.4 1085.8 3.13 3.18 13.59 129.88 1105.7 3.12 4.55 12.88 137.84 1066.4 3.08 3.84 12.87 131.48
39 1074.6 2.99 2.55 13.83 123.56 1069.7 3.29 3.91 13.19 136.68 1075.5 3.19 4.35 12.13 134.36 1107.7 3.24 4.72 13.21 142.44 1091.4 3.12 3.98 13.58 136.08
40 1068.6 2.9 7.23 9.58 142.56 1089.2 3.12 5.14 12.66 141.68 1090.1 3.05 6.14 11.89 145.48 1100.3 3.21 3.89 11.77 129.56 1100.5 3.19 3.84 13.53 135.88
41 1049 2.8 4.96 11.47 130.36 1067.6 2.8 5.09 9.04 121.68 1080.6 2.94 4.75 12.76 136.08 1095.2 2.98 4.77 13.38 139.36 1074.5 2.97 4.57 13.44 137.84
42 1049.5 2.65 7.22 11.93 147.88 1095.9 3.22 4.49 12.35 136.84 1110.2 3.17 4.64 14.06 144.08 1108.6 3.06 4.07 13.3 134.72 1086.9 2.97 4.31 13 134
43 1060.5 3.1 2.55 13.04 122.16 1085.7 2.91 4.51 12.42 132.32 1074.7 3.06 4.22 12.62 133.2 1086.8 3.09 4.33 12.83 135.4 1078.7 2.93 5.49 12.67 141.48
44 1077.6 2.8 5.37 13.19 140.52 1076.2 3.08 4.3 10.76 126.72 1097.3 3.19 3.83 13.61 136.12 1074.8 3.12 3.12 13.35 128.28 1079.5 2.97 4.85 12.66 136.96
45 1089 2.86 3.9 14.93 136.68 1109.5 3.16 2.58 15.45 133 1075.3 3.1 4.66 12.47 136.76 1073 3.02 3.62 12.87 128.76 1076.3 3.06 4.08 12.89 133.16
46 1069 2.97 3.63 13.93 132.28 1070.6 2.76 6.99 10.8 143.28 1085.7 2.84 4.89 14.16 141.2 1072 3.01 3.88 13.13 131.72 1083.7 2.87 4.44 12.64 132
47 1067.1 3.2 2.04 15.39 129.08 1080.2 3.03 4.71 13.63 140.68 1073.7 3.05 4.03 13.86 136.48 1058.4 3.01 3.61 12.58 127.36 1080.1 3.12 3.88 12.7 131.76
48 1107.1 2.99 3.6 11.13 121.16 1064.1 2.99 4.6 10.86 128.08 1080.6 2.94 4.48 12.93 134.6 1074.8 3.01 5.19 13.48 143.6 1077.5 2.93 3.87 13.76 132.88
49 1058.5 2.66 4.73 14.08 136.72 1106.2 2.82 5.34 13.33 141.16 1083.6 3.01 4.32 14.02 138.8 1091 3.06 5.3 12.05 139.56 1070.7 2.93 3.96 13.31 131.8
50 1054 2.72 2.92 11.55 113.08 1093.2 2.89 5 12.73 137.16 1072.8 2.89 4.82 12.82 136.08 1087.5 3.1 4.31 12.66 134.72 1070.9 2.97 4.27 13.23 134.6
AVERAGE 1079.87 2.9728 4.2928 12.9304 133.6288 1090.33 3.0516 4.5882 12.6448 136.1104 1080.798 2.9886 4.206 12.7614 132.5112 1080.518 3.0022 4.2474 12.9636 133.8688 1080.28 2.9376 4.084 12.9164 131.3392
MINIMUM 1000.9 2.5 0.73 9.58 108.96 1048.6 2.71 2.36 9.04 115.8 1049.6 2.7 3.12 10.66 118.36 1053.8 2.81 3.12 10.92 125.04 1049.6 2.44 2.93 11.51 113.8
MAXIMUM 1153.2 3.6 8.02 18.69 152.04 1133 3.51 6.99 15.45 152.84 1110.2 3.22 6.14 15.15 146.64 1108.6 3.24 5.3 14.02 143.6 1113 3.19 5.49 14.18 141.48
ST. DEV. 24.3611 0.205845 1.50879 1.980163 8.986116 18.2193 0.165086 0.905865 1.298675 7.263676 14.08116 0.127625 0.603371 0.988662 5.980835 14.67835 0.09205 0.514272 0.620528 4.617352 12.85032 0.148924 0.473819 0.667292 6.069455
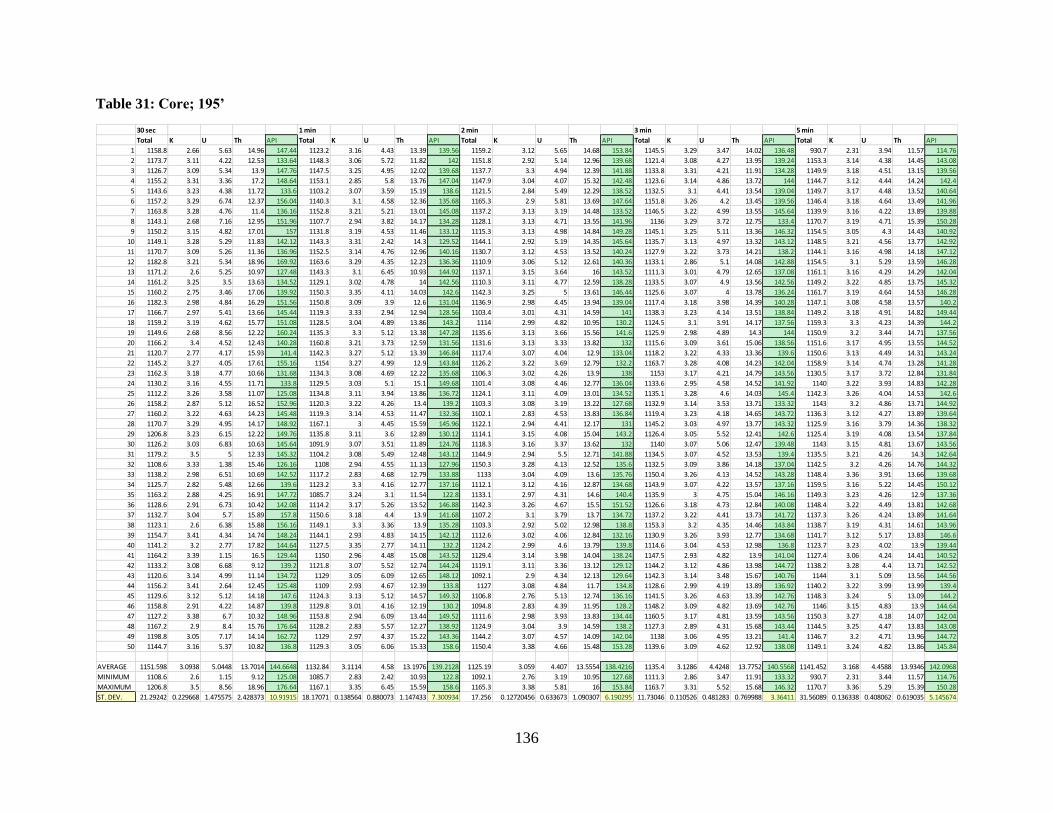
136
Table 31: Core; 195’
30 sec 1 min 2 min 3 min 5 min
Total K U Th API Total K U Th API Total K U Th API Total K U Th API Total K U Th API
1 1158.8 2.66 5.63 14.96 147.44 1123.2 3.16 4.43 13.39 139.56 1159.2 3.12 5.65 14.68 153.84 1145.5 3.29 3.47 14.02 136.48 930.7 2.31 3.94 11.57 114.76
2 1173.7 3.11 4.22 12.53 133.64 1148.3 3.06 5.72 11.82 142 1151.8 2.92 5.14 12.96 139.68 1121.4 3.08 4.27 13.95 139.24 1153.3 3.14 4.38 14.45 143.08
3 1126.7 3.09 5.34 13.9 147.76 1147.5 3.25 4.95 12.02 139.68 1137.7 3.3 4.94 12.39 141.88 1133.8 3.31 4.21 11.91 134.28 1149.9 3.18 4.51 13.15 139.56
4 1155.2 3.31 3.36 17.2 148.64 1153.1 2.85 5.8 13.76 147.04 1147.9 3.04 4.07 15.32 142.48 1123.6 3.14 4.86 13.72 144 1144.7 3.12 4.44 14.24 142.4
5 1143.6 3.23 4.38 11.72 133.6 1103.2 3.07 3.59 15.19 138.6 1121.5 2.84 5.49 12.29 138.52 1132.5 3.1 4.41 13.54 139.04 1149.7 3.17 4.48 13.52 140.64
6 1157.2 3.29 6.74 12.37 156.04 1140.3 3.1 4.58 12.36 135.68 1165.3 2.9 5.81 13.69 147.64 1151.8 3.26 4.2 13.45 139.56 1146.4 3.18 4.64 13.49 141.96
7 1163.8 3.28 4.76 11.4 136.16 1152.8 3.21 5.21 13.01 145.08 1137.2 3.13 3.19 14.48 133.52 1146.5 3.22 4.99 13.55 145.64 1139.9 3.16 4.22 13.89 139.88
8 1143.1 2.68 7.16 12.95 151.96 1107.7 2.94 3.82 14.17 134.28 1128.1 3.13 4.71 13.55 141.96 1136 3.29 3.72 12.75 133.4 1170.7 3.19 4.71 15.39 150.28
9 1150.2 3.15 4.82 17.01 157 1131.8 3.19 4.53 11.46 133.12 1115.3 3.13 4.98 14.84 149.28 1145.1 3.25 5.11 13.36 146.32 1154.5 3.05 4.3 14.43 140.92
10 1149.1 3.28 5.29 11.83 142.12 1143.3 3.31 2.42 14.3 129.52 1144.1 2.92 5.19 14.35 145.64 1135.7 3.13 4.97 13.32 143.12 1148.5 3.21 4.56 13.77 142.92
11 1170.7 3.09 5.26 11.36 136.96 1152.5 3.14 4.76 12.96 140.16 1130.7 3.12 4.53 13.52 140.24 1127.9 3.22 3.73 14.21 138.2 1144.1 3.16 4.98 14.18 147.12
12 1182.8 3.21 5.34 18.96 169.92 1163.6 3.29 4.35 12.23 136.36 1110.9 3.06 5.12 12.61 140.36 1133.1 2.86 5.1 14.08 142.88 1154.5 3.1 5.29 13.59 146.28
13 1171.2 2.6 5.25 10.97 127.48 1143.3 3.1 6.45 10.93 144.92 1137.1 3.15 3.64 16 143.52 1111.3 3.01 4.79 12.65 137.08 1161.1 3.16 4.29 14.29 142.04
14 1161.2 3.25 3.5 13.63 134.52 1129.1 3.02 4.78 14 142.56 1110.3 3.11 4.77 12.59 138.28 1133.5 3.07 4.9 13.56 142.56 1149.2 3.22 4.85 13.75 145.32
15 1160.2 2.75 3.46 17.06 139.92 1150.3 3.35 4.11 14.03 142.6 1142.3 3.25 5 13.61 146.44 1125.6 3.07 4 13.78 136.24 1161.7 3.19 4.64 14.53 146.28
16 1182.3 2.98 4.84 16.29 151.56 1150.8 3.09 3.9 12.6 131.04 1136.9 2.98 4.45 13.94 139.04 1117.4 3.18 3.98 14.39 140.28 1147.1 3.08 4.58 13.57 140.2
17 1166.7 2.97 5.41 13.66 145.44 1119.3 3.33 2.94 12.94 128.56 1103.4 3.01 4.31 14.59 141 1138.3 3.23 4.14 13.51 138.84 1149.2 3.18 4.91 14.82 149.44
18 1159.2 3.19 4.62 15.77 151.08 1128.5 3.04 4.89 13.86 143.2 1114 2.99 4.82 10.95 130.2 1124.5 3.1 3.91 14.17 137.56 1159.3 3.3 4.23 14.39 144.2
19 1149.6 2.68 8.56 12.22 160.24 1135.3 3.3 5.12 13.38 147.28 1135.6 3.13 3.66 15.56 141.6 1125.9 2.98 4.89 14.3 144 1150.9 3.2 3.44 14.71 137.56
20 1166.2 3.4 4.52 12.43 140.28 1160.8 3.21 3.73 12.59 131.56 1131.6 3.13 3.33 13.82 132 1115.6 3.09 3.61 15.06 138.56 1151.6 3.17 4.95 13.55 144.52
21 1120.7 2.77 4.17 15.93 141.4 1142.3 3.27 5.12 13.39 146.84 1117.4 3.07 4.04 12.9 133.04 1118.2 3.22 4.33 13.36 139.6 1150.6 3.13 4.49 14.31 143.24
22 1145.2 3.27 4.05 17.61 155.16 1154 3.27 4.99 12.9 143.84 1126.2 3.22 3.69 12.79 132.2 1163.7 3.28 4.08 14.23 142.04 1158.9 3.14 4.74 13.28 141.28
23 1162.3 3.18 4.77 10.66 131.68 1134.3 3.08 4.69 12.22 135.68 1106.3 3.02 4.26 13.9 138 1153 3.17 4.21 14.79 143.56 1130.5 3.17 3.72 12.84 131.84
24 1130.2 3.16 4.55 11.71 133.8 1129.5 3.03 5.1 15.1 149.68 1101.4 3.08 4.46 12.77 136.04 1133.6 2.95 4.58 14.52 141.92 1140 3.22 3.93 14.83 142.28
25 1112.2 3.26 3.58 11.07 125.08 1134.8 3.11 3.94 13.86 136.72 1124.1 3.11 4.09 13.01 134.52 1135.1 3.28 4.6 14.03 145.4 1142.3 3.26 4.04 14.53 142.6
26 1158.2 2.87 5.12 16.52 152.96 1120.3 3.22 4.26 13.4 139.2 1103.3 3.08 3.19 13.22 127.68 1132.9 3.14 3.53 13.71 133.32 1143 3.2 4.86 13.71 144.92
27 1160.2 3.22 4.63 14.23 145.48 1119.3 3.14 4.53 11.47 132.36 1102.1 2.83 4.53 13.83 136.84 1119.4 3.23 4.18 14.65 143.72 1136.3 3.12 4.27 13.89 139.64
28 1170.7 3.29 4.95 14.17 148.92 1167.1 3 4.45 15.59 145.96 1122.1 2.94 4.41 12.17 131 1145.2 3.03 4.97 13.77 143.32 1125.9 3.16 3.79 14.36 138.32
29 1206.8 3.23 6.15 12.22 149.76 1135.8 3.11 3.6 12.89 130.12 1114.1 3.15 4.08 15.04 143.2 1126.4 3.05 5.52 12.41 142.6 1125.4 3.19 4.08 13.54 137.84
30 1126.2 3.03 6.83 10.63 145.64 1091.9 3.07 3.51 11.89 124.76 1118.3 3.16 3.37 13.62 132 1140 3.07 5.06 12.47 139.48 1143 3.15 4.81 13.67 143.56
31 1179.2 3.5 5 12.33 145.32 1104.2 3.08 5.49 12.48 143.12 1144.9 2.94 5.5 12.71 141.88 1134.5 3.07 4.52 13.53 139.4 1135.5 3.21 4.26 14.3 142.64
32 1108.6 3.33 1.38 15.46 126.16 1108 2.94 4.55 11.13 127.96 1150.3 3.28 4.13 12.52 135.6 1132.5 3.09 3.86 14.18 137.04 1142.5 3.2 4.26 14.76 144.32
33 1138.2 2.98 6.51 10.69 142.52 1117.2 2.83 4.68 12.79 133.88 1133 3.04 4.09 13.6 135.76 1150.4 3.26 4.13 14.52 143.28 1148.4 3.36 3.91 13.66 139.68
34 1125.7 2.82 5.48 12.66 139.6 1123.2 3.3 4.16 12.77 137.16 1112.1 3.12 4.16 12.87 134.68 1143.9 3.07 4.22 13.57 137.16 1159.5 3.16 5.22 14.45 150.12
35 1163.2 2.88 4.25 16.91 147.72 1085.7 3.24 3.1 11.54 122.8 1133.1 2.97 4.31 14.6 140.4 1135.9 3 4.75 15.04 146.16 1149.3 3.23 4.26 12.9 137.36
36 1128.6 2.91 6.73 10.42 142.08 1114.2 3.17 5.26 13.52 146.88 1142.3 3.26 4.67 15.5 151.52 1126.6 3.18 4.73 12.84 140.08 1148.4 3.22 4.49 13.81 142.68
37 1132.7 3.04 5.7 15.89 157.8 1150.6 3.18 4.4 13.9 141.68 1107.2 3.1 3.79 13.7 134.72 1137.2 3.22 4.41 13.73 141.72 1137.3 3.26 4.24 13.89 141.64
38 1123.1 2.6 6.38 15.88 156.16 1149.1 3.3 3.36 13.9 135.28 1103.3 2.92 5.02 12.98 138.8 1153.3 3.2 4.35 14.46 143.84 1138.7 3.19 4.31 14.61 143.96
39 1154.7 3.41 4.34 14.74 148.24 1144.1 2.93 4.83 14.15 142.12 1112.6 3.02 4.06 12.84 132.16 1130.9 3.26 3.93 12.77 134.68 1141.7 3.12 5.17 13.83 146.6
40 1141.2 3.2 2.77 17.82 144.64 1127.5 3.35 2.77 14.11 132.2 1124.2 2.99 4.6 13.79 139.8 1114.6 3.04 4.53 12.98 136.8 1123.7 3.23 4.02 13.9 139.44
41 1164.2 3.39 1.15 16.5 129.44 1150 2.96 4.48 15.08 143.52 1129.4 3.14 3.98 14.04 138.24 1147.5 2.93 4.82 13.9 141.04 1127.4 3.06 4.24 14.41 140.52
42 1133.2 3.08 6.68 9.12 139.2 1121.8 3.07 5.52 12.74 144.24 1119.1 3.11 3.36 13.12 129.12 1144.2 3.12 4.86 13.98 144.72 1138.2 3.28 4.4 13.71 142.52
43 1120.6 3.14 4.99 11.14 134.72 1129 3.05 6.09 12.65 148.12 1092.1 2.9 4.34 12.13 129.64 1142.3 3.14 3.48 15.67 140.76 1144 3.1 5.09 13.56 144.56
44 1156.2 3.41 2.64 12.45 125.48 1109 2.93 4.67 12.39 133.8 1127 3.08 4.84 11.7 134.8 1128.6 2.99 4.19 13.89 136.92 1140.2 3.22 3.99 13.99 139.4
45 1129.6 3.12 5.12 14.18 147.6 1124.3 3.13 5.12 14.57 149.32 1106.8 2.76 5.13 12.74 136.16 1141.5 3.26 4.63 13.39 142.76 1148.3 3.24 5 13.09 144.2
46 1158.8 2.91 4.22 14.87 139.8 1129.8 3.01 4.16 12.19 130.2 1094.8 2.83 4.39 11.95 128.2 1148.2 3.09 4.82 13.69 142.76 1146 3.15 4.83 13.9 144.64
47 1127.2 3.38 6.7 10.32 148.96 1153.8 2.94 6.09 13.44 149.52 1111.6 2.98 3.93 13.83 134.44 1160.5 3.17 4.81 13.59 143.56 1150.3 3.27 4.18 14.07 142.04
48 1167.2 2.9 8.4 15.76 176.64 1128.2 2.83 5.57 12.27 138.92 1124.9 3.04 3.9 14.59 138.2 1127.3 2.89 4.31 15.68 143.44 1144.5 3.25 4.47 13.83 143.08
49 1198.8 3.05 7.17 14.14 162.72 1129 2.97 4.37 15.22 143.36 1144.2 3.07 4.57 14.09 142.04 1138 3.06 4.95 13.21 141.4 1146.7 3.2 4.71 13.96 144.72
50 1144.7 3.16 5.37 10.82 136.8 1129.3 3.05 6.06 15.33 158.6 1150.4 3.38 4.66 15.48 153.28 1139.6 3.09 4.62 12.92 138.08 1149.1 3.24 4.82 13.86 145.84
AVERAGE 1151.598 3.0938 5.0448 13.7014 144.6648 1132.84 3.1114 4.58 13.1976 139.2128 1125.19 3.059 4.407 13.5554 138.4216 1135.4 3.1286 4.4248 13.7752 140.5568 1141.452 3.168 4.4588 13.9346 142.0968
MINIMUM 1108.6 2.6 1.15 9.12 125.08 1085.7 2.83 2.42 10.93 122.8 1092.1 2.76 3.19 10.95 127.68 1111.3 2.86 3.47 11.91 133.32 930.7 2.31 3.44 11.57 114.76
MAXIMUM 1206.8 3.5 8.56 18.96 176.64 1167.1 3.35 6.45 15.59 158.6 1165.3 3.38 5.81 16 153.84 1163.7 3.31 5.52 15.68 146.32 1170.7 3.36 5.29 15.39 150.28
ST. DEV. 21.29242 0.229668 1.475575 2.428373 10.91915 18.17071 0.138564 0.880073 1.147433 7.300934 17.256 0.12720456 0.633673 1.090307 6.190295 11.73046 0.110526 0.481283 0.769988 3.36411 31.56089 0.136338 0.408062 0.619035 5.145674
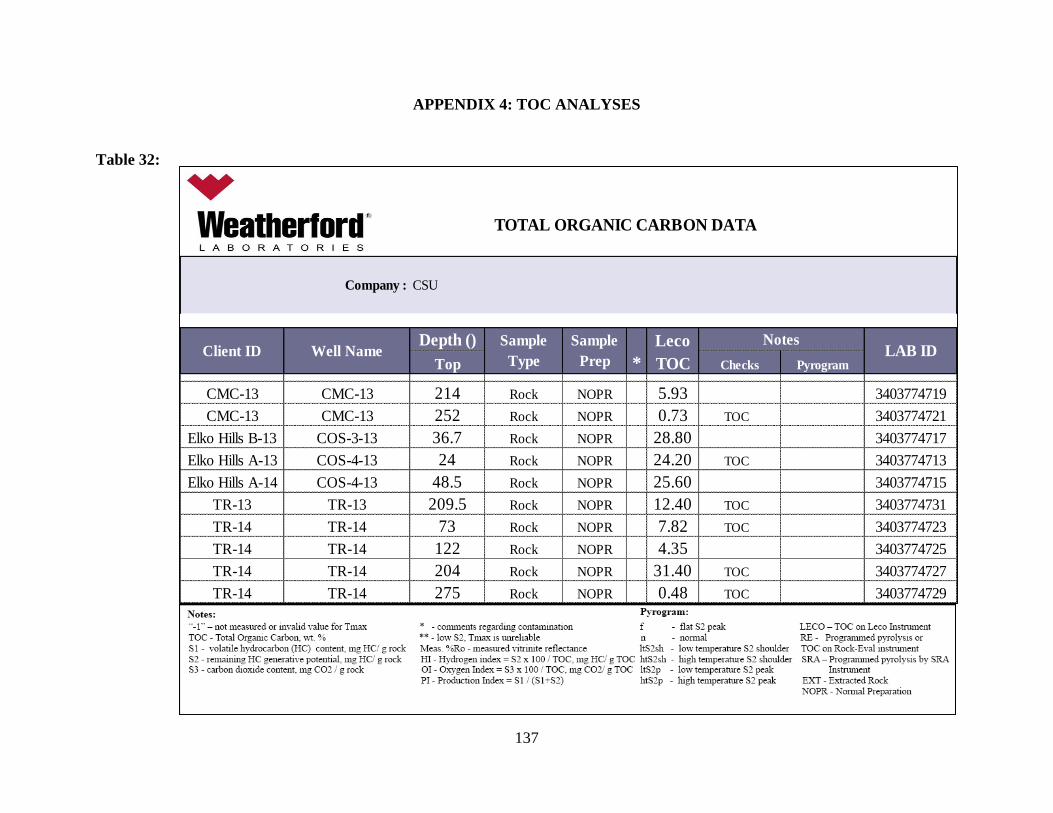
137
APPENDIX 4: TOC ANALYSES
Table 32:
Leco
Top * TOC Checks Pyrogram
CMC-13 CMC-13 214 Rock NOPR 5.93 3403774719
CMC-13 CMC-13 252 Rock NOPR 0.73 TOC 3403774721
Elko Hills B-13 COS-3-13 36.7 Rock NOPR 28.80 3403774717
Elko Hills A-13 COS-4-13 24 Rock NOPR 24.20 TOC 3403774713
Elko Hills A-14 COS-4-13 48.5 Rock NOPR 25.60 3403774715
TR-13 TR-13 209.5 Rock NOPR 12.40 TOC 3403774731
TR-14 TR-14 73 Rock NOPR 7.82 TOC 3403774723
TR-14 TR-14 122 Rock NOPR 4.35 3403774725
TR-14 TR-14 204 Rock NOPR 31.40 TOC 3403774727
TR-14 TR-14 275 Rock NOPR 0.48 TOC 3403774729
Sample
Type
Sample
PrepLAB ID
NotesClient ID Well Name
TOTAL ORGANIC CARBON DATA
Company : CSU
Depth ()
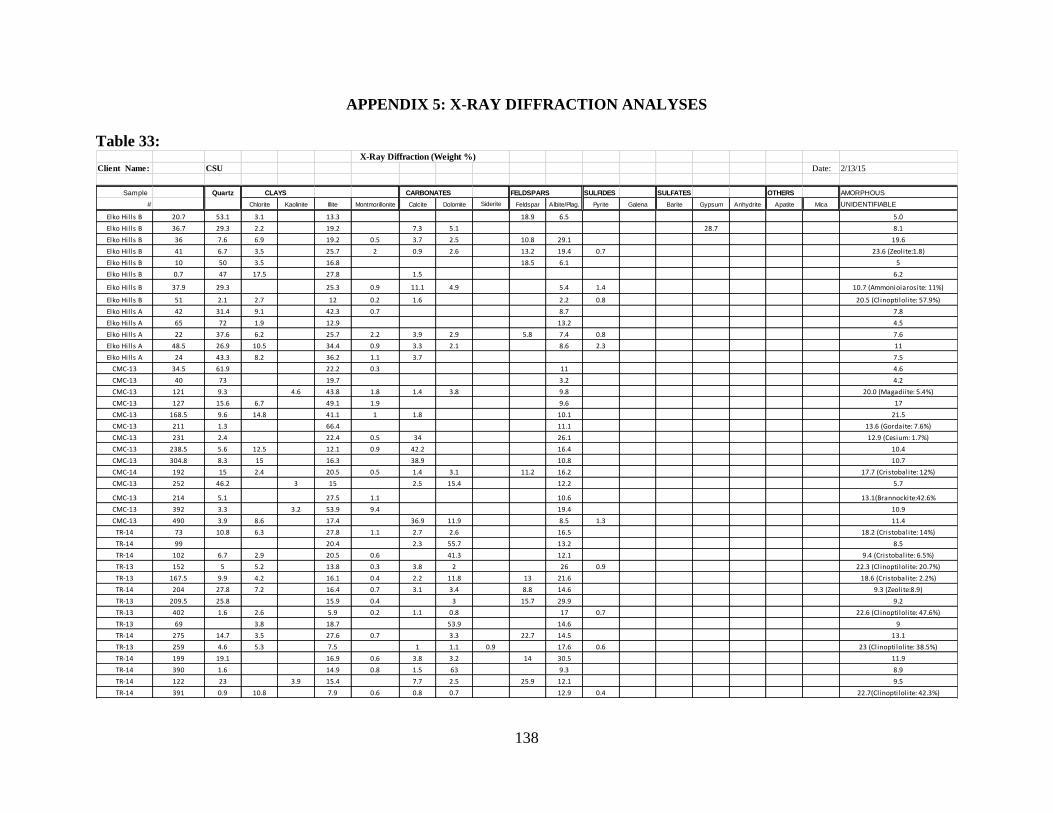
138
APPENDIX 5: X-RAY DIFFRACTION ANALYSES
Table 33:X-Ray Diffraction (Weight %)
Client Name: CSU Date: 2/13/15
Sample Quartz CLAYS CARBONATES FELDSPARS SULFIDES SULFATES OTHERS AMORPHOUS
# Chlorite Kaolinite Illite Montmorillonite Calcite Dolomite Siderite Feldspar Albite/Plag. Pyrite Galena Barite Gypsum Anhydrite Apatite Mica UNIDENTIFIABLE
Elko Hills B 20.7 53.1 3.1 13.3 18.9 6.5 5.0
Elko Hills B 36.7 29.3 2.2 19.2 7.3 5.1 28.7 8.1
Elko Hills B 36 7.6 6.9 19.2 0.5 3.7 2.5 10.8 29.1 19.6
Elko Hills B 41 6.7 3.5 25.7 2 0.9 2.6 13.2 19.4 0.7 23.6 (Zeolite:1.8)
Elko Hills B 10 50 3.5 16.8 18.5 6.1 5
Elko Hills B 0.7 47 17.5 27.8 1.5 6.2
Elko Hills B 37.9 29.3 25.3 0.9 11.1 4.9 5.4 1.4 10.7 (Ammonioiarosite: 11%)
Elko Hills B 51 2.1 2.7 12 0.2 1.6 2.2 0.8 20.5 (Clinoptilolite: 57.9%)
Elko Hills A 42 31.4 9.1 42.3 0.7 8.7 7.8
Elko Hills A 65 72 1.9 12.9 13.2 4.5
Elko Hills A 22 37.6 6.2 25.7 2.2 3.9 2.9 5.8 7.4 0.8 7.6
Elko Hills A 48.5 26.9 10.5 34.4 0.9 3.3 2.1 8.6 2.3 11
Elko Hills A 24 43.3 8.2 36.2 1.1 3.7 7.5
CMC-13 34.5 61.9 22.2 0.3 11 4.6
CMC-13 40 73 19.7 3.2 4.2
CMC-13 121 9.3 4.6 43.8 1.8 1.4 3.8 9.8 20.0 (Magadiite: 5.4%)
CMC-13 127 15.6 6.7 49.1 1.9 9.6 17
CMC-13 168.5 9.6 14.8 41.1 1 1.8 10.1 21.5
CMC-13 211 1.3 66.4 11.1 13.6 (Gordaite: 7.6%)
CMC-13 231 2.4 22.4 0.5 34 26.1 12.9 (Cesium: 1.7%)
CMC-13 238.5 5.6 12.5 12.1 0.9 42.2 16.4 10.4
CMC-13 304.8 8.3 15 16.3 38.9 10.8 10.7
CMC-14 192 15 2.4 20.5 0.5 1.4 3.1 11.2 16.2 17.7 (Cristobalite: 12%)
CMC-13 252 46.2 3 15 2.5 15.4 12.2 5.7
CMC-13 214 5.1 27.5 1.1 10.6 13.1(Brannockite:42.6%
CMC-13 392 3.3 3.2 53.9 9.4 19.4 10.9
CMC-13 490 3.9 8.6 17.4 36.9 11.9 8.5 1.3 11.4
TR-14 73 10.8 6.3 27.8 1.1 2.7 2.6 16.5 18.2 (Cristobalite: 14%)
TR-14 99 20.4 2.3 55.7 13.2 8.5
TR-14 102 6.7 2.9 20.5 0.6 41.3 12.1 9.4 (Cristobalite: 6.5%)
TR-13 152 5 5.2 13.8 0.3 3.8 2 26 0.9 22.3 (Clinoptilolite: 20.7%)
TR-13 167.5 9.9 4.2 16.1 0.4 2.2 11.8 13 21.6 18.6 (Cristobalite: 2.2%)
TR-14 204 27.8 7.2 16.4 0.7 3.1 3.4 8.8 14.6 9.3 (Zeolite:8.9)
TR-13 209.5 25.8 15.9 0.4 3 15.7 29.9 9.2
TR-13 402 1.6 2.6 5.9 0.2 1.1 0.8 17 0.7 22.6 (Clinoptilolite: 47.6%)
TR-13 69 3.8 18.7 53.9 14.6 9
TR-14 275 14.7 3.5 27.6 0.7 3.3 22.7 14.5 13.1
TR-13 259 4.6 5.3 7.5 1 1.1 0.9 17.6 0.6 23 (Clinoptilolite: 38.5%)
TR-14 199 19.1 16.9 0.6 3.8 3.2 14 30.5 11.9
TR-14 390 1.6 14.9 0.8 1.5 63 9.3 8.9
TR-14 122 23 3.9 15.4 7.7 2.5 25.9 12.1 9.5
TR-14 391 0.9 10.8 7.9 0.6 0.8 0.7 12.9 0.4 22.7(Clinoptilolite: 42.3%)
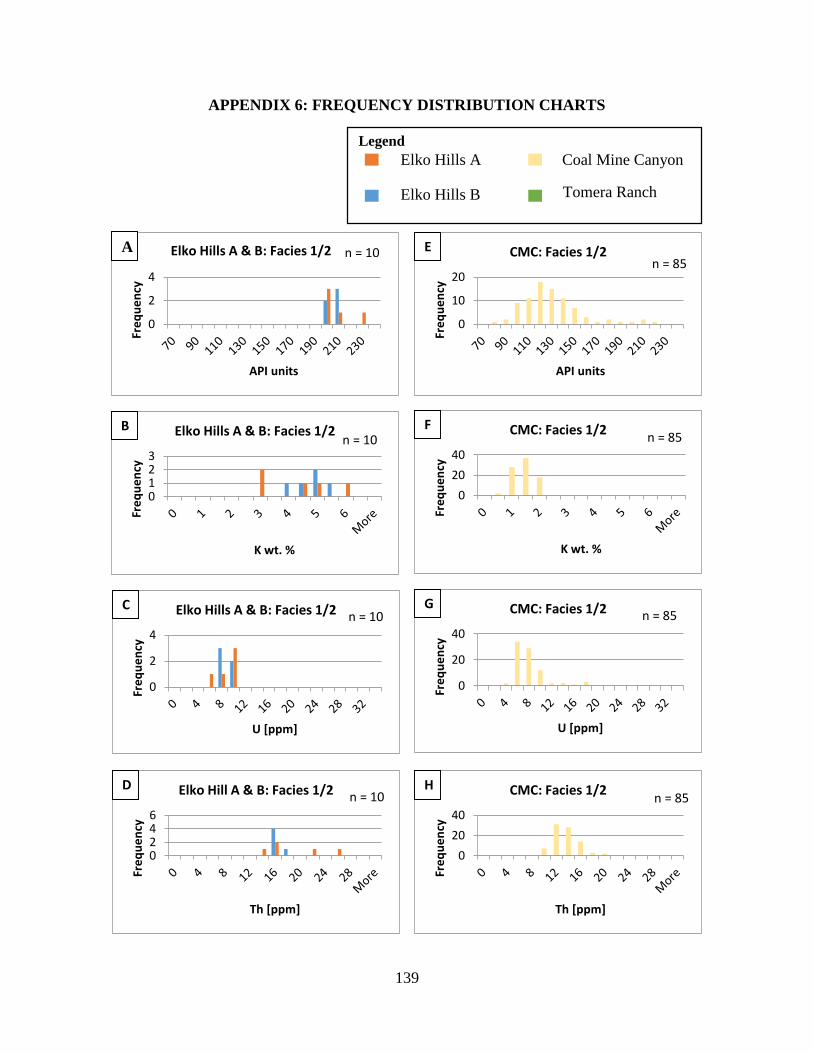
139
APPENDIX 6: FREQUENCY DISTRIBUTION CHARTS
Legend
Elko Hills A Coal Mine Canyon
Tomera Ranch Elko Hills B
0
10
20
Fre
qu
en
cy
API units
CMC: Facies 1/2n = 85
E
0
2
4
Fre
qu
en
cy
API units
Elko Hills A & B: Facies 1/2
0123
Fre
qu
en
cy
K wt. %
Elko Hills A & B: Facies 1/2n = 10
B
0
20
40Fr
eq
ue
ncy
K wt. %
CMC: Facies 1/2n = 85
F
0
2
4
Fre
qu
en
cy
U [ppm]
Elko Hills A & B: Facies 1/2 n = 10C
0
20
40
Fre
qu
en
cy
U [ppm]
CMC: Facies 1/2 n = 85G
0246
Fre
qu
en
cy
Th [ppm]
Elko Hill A & B: Facies 1/2 n = 10D
0
20
40
Fre
qu
en
cy
Th [ppm]
CMC: Facies 1/2n = 85
H
A n = 10
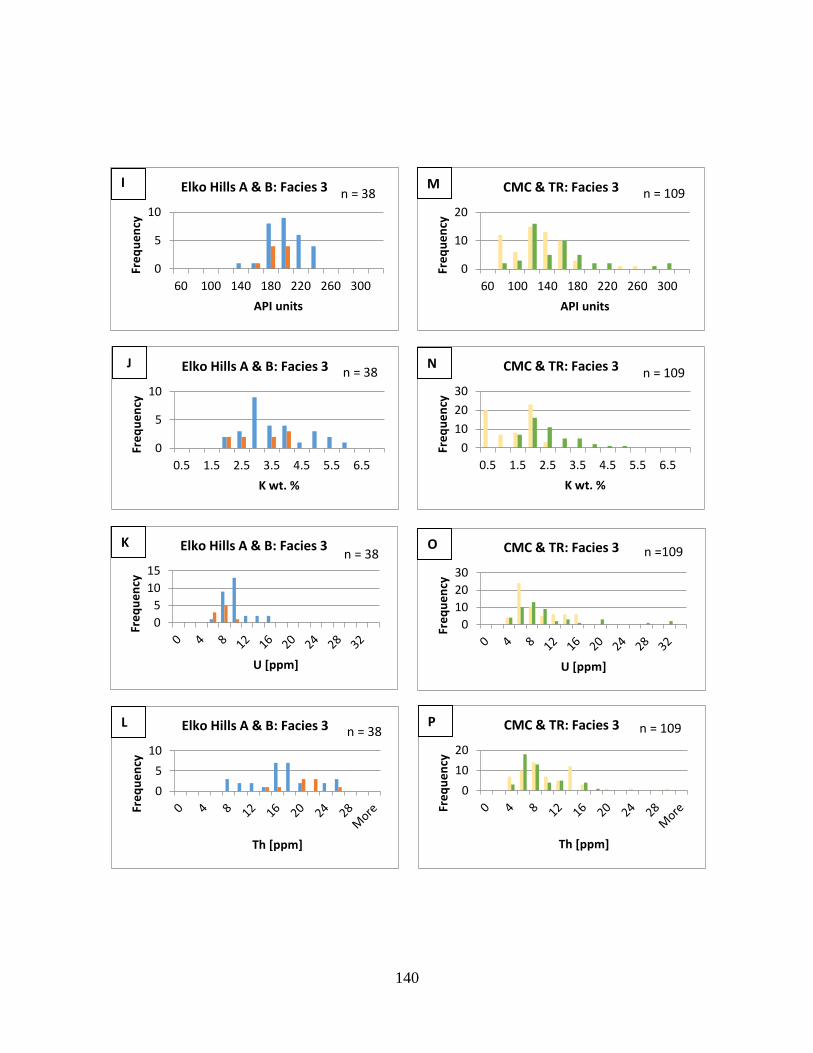
140
0
5
10
60 100 140 180 220 260 300
Fre
qu
en
cy
API units
Elko Hills A & B: Facies 3 n = 38I
0
10
20
60 100 140 180 220 260 300
Fre
qu
en
cy
API units
CMC & TR: Facies 3 n = 109M
0
5
10
0.5 1.5 2.5 3.5 4.5 5.5 6.5
Fre
qu
en
cy
K wt. %
Elko Hills A & B: Facies 3 n = 38J
0
10
20
30
0.5 1.5 2.5 3.5 4.5 5.5 6.5
Fre
qu
en
cy
K wt. %
CMC & TR: Facies 3 n = 109N
0
5
10
15
Fre
qu
en
cy
U [ppm]
Elko Hills A & B: Facies 3n = 38
K
0
10
20
30
Fre
qu
en
cy
U [ppm]
CMC & TR: Facies 3 n =109O
0
5
10
Fre
qu
en
cy
Th [ppm]
Elko Hills A & B: Facies 3 n = 38L
0
10
20
Fre
qu
en
cy
Th [ppm]
CMC & TR: Facies 3 n = 109P
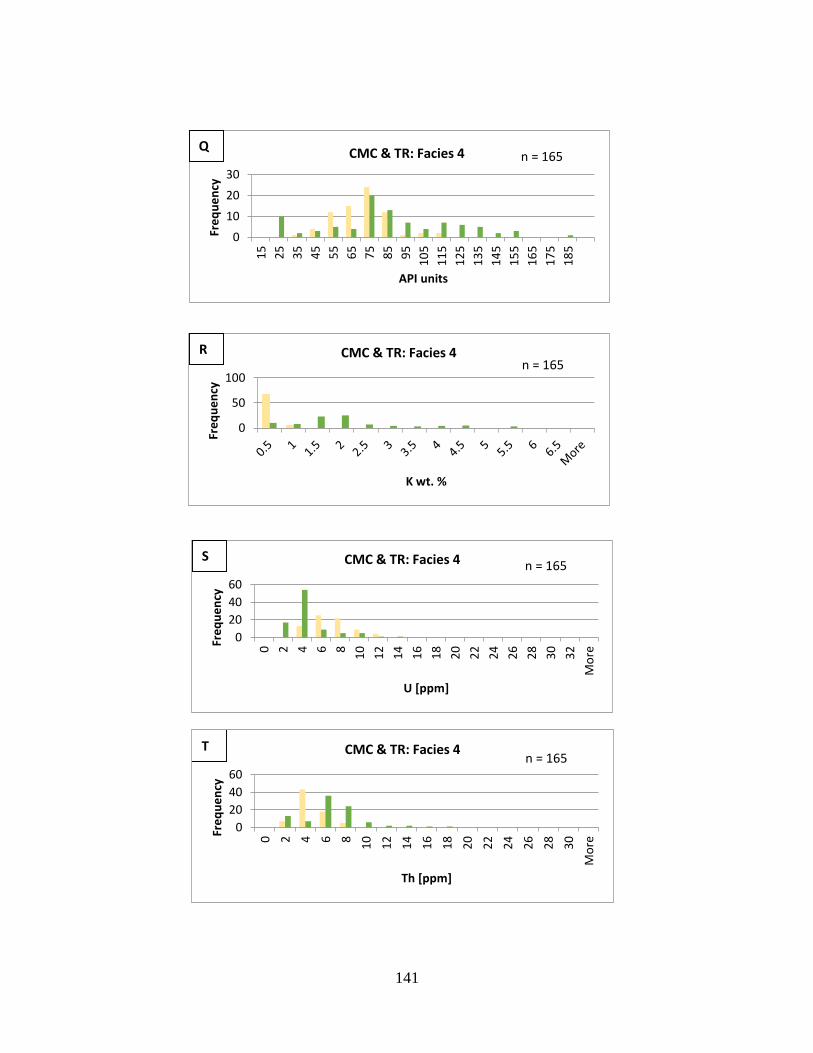
141
0
10
20
30
15
25
35
45
55
65
75
85
95
10
5
11
5
12
5
13
5
14
5
15
5
16
5
17
5
18
5
Fre
qu
en
cy
API units
CMC & TR: Facies 4 n = 165Q
0
50
100
Fre
qu
en
cy
K wt. %
CMC & TR: Facies 4n = 165
R
0
20
40
60
0 2 4 6 8
10
12
14
16
18
20
22
24
26
28
30
32
Mo
re
Fre
qu
en
cy
U [ppm]
CMC & TR: Facies 4 n = 165S
0
20
40
60
0 2 4 6 8
10
12
14
16
18
20
22
24
26
28
30
Mo
re
Fre
qu
en
cy
Th [ppm]
CMC & TR: Facies 4n = 165
T
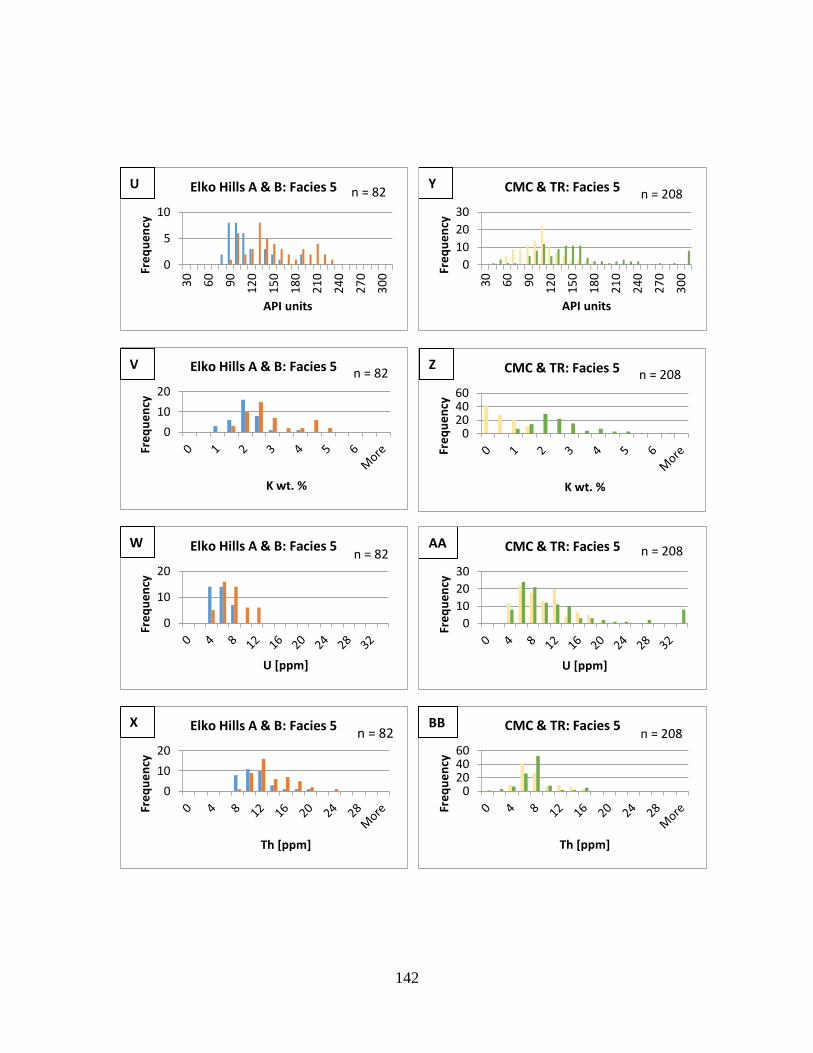
142
0
5
10
30
60
90
12
0
15
0
18
0
21
0
24
0
27
0
30
0Fre
qu
en
cy
API units
Elko Hills A & B: Facies 5 n = 82U
0
10
20
30
30
60
90
12
0
15
0
18
0
21
0
24
0
27
0
30
0Fre
qu
en
cy
API units
CMC & TR: Facies 5n = 208
Y
0
10
20
Fre
qu
en
cy
K wt. %
Elko Hills A & B: Facies 5 n = 82V
0204060
Fre
qu
en
cy
K wt. %
CMC & TR: Facies 5 n = 208Z
0
10
20
Fre
qu
en
cy
U [ppm]
Elko Hills A & B: Facies 5n = 82
W
0
10
20
30
Fre
qu
en
cy
U [ppm]
CMC & TR: Facies 5 n = 208AA
0
10
20
Fre
qu
en
cy
Th [ppm]
Elko Hills A & B: Facies 5n = 82
X
0204060
Fre
qu
en
cy
Th [ppm]
CMC & TR: Facies 5n = 208
BB
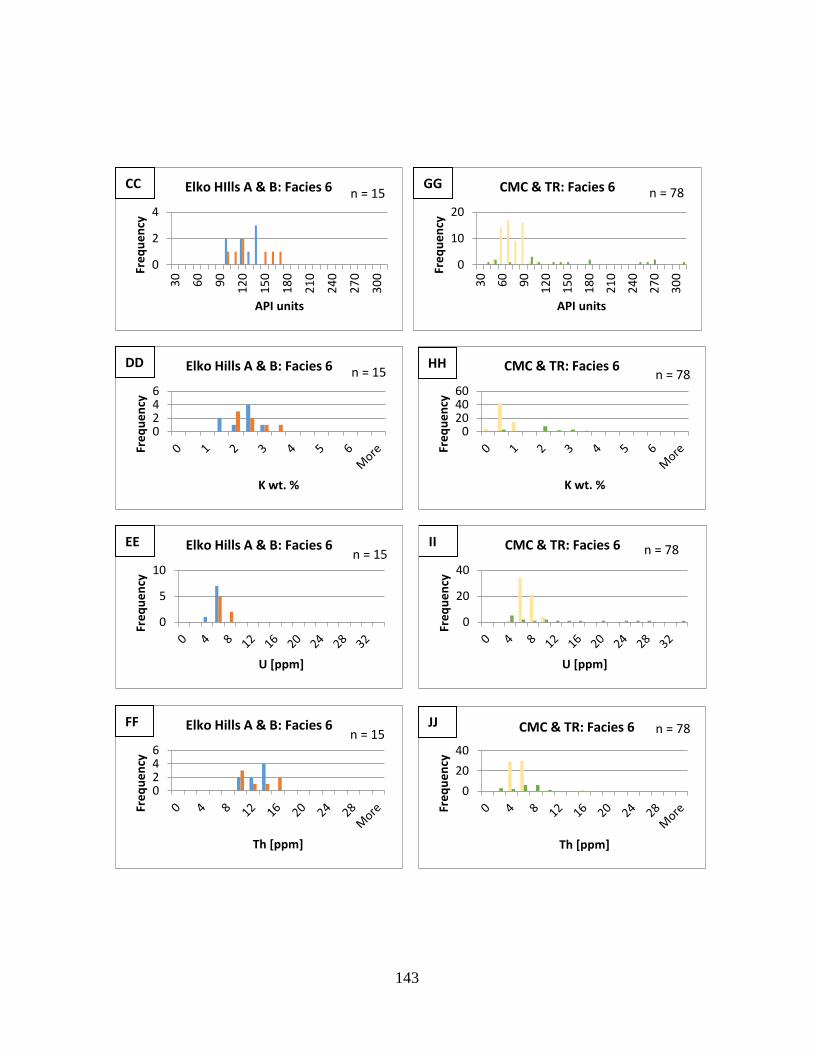
143
0
10
20
30
60
90
12
0
15
0
18
0
21
0
24
0
27
0
30
0Fre
qu
en
cy
API units
CMC & TR: Facies 6 n = 78GG
0
2
4
30
60
90
12
0
15
0
18
0
21
0
24
0
27
0
30
0Fre
qu
en
cy
API units
Elko HIlls A & B: Facies 6 n = 15CC
0246
Fre
qu
en
cy
K wt. %
Elko Hills A & B: Facies 6 n = 15DD
0204060
Fre
qu
en
cy
K wt. %
CMC & TR: Facies 6n = 78
HH
0
5
10
Fre
qu
en
cy
U [ppm]
Elko Hills A & B: Facies 6n = 15
EE
0
20
40
Fre
qu
en
cy
U [ppm]
CMC & TR: Facies 6 n = 78II
0246
Fre
qu
en
cy
Th [ppm]
Elko Hills A & B: Facies 6n = 15
FF
0
20
40
Fre
qu
en
cy
Th [ppm]
CMC & TR: Facies 6 n = 78JJ
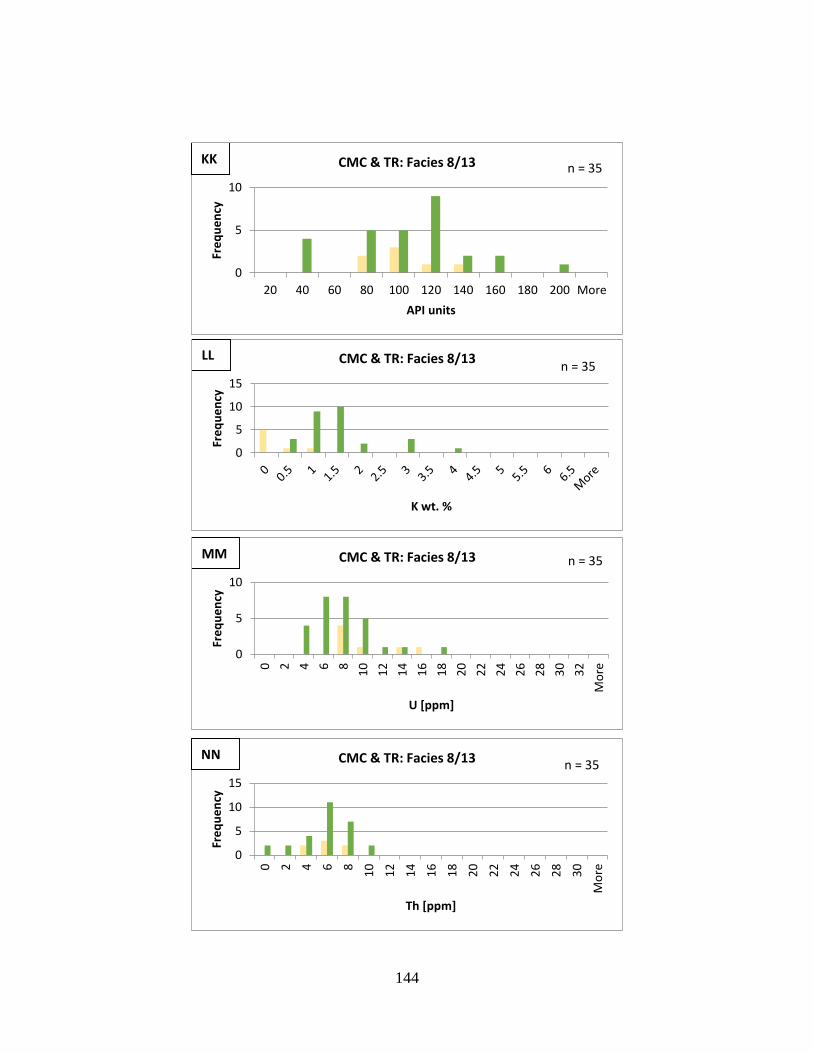
144
0
5
10
15
0 2 4 6 8
10
12
14
16
18
20
22
24
26
28
30
Mo
re
Fre
qu
en
cy
Th [ppm]
CMC & TR: Facies 8/13 n = 35NN
0
5
10
20 40 60 80 100 120 140 160 180 200 More
Fre
qu
en
cy
API units
CMC & TR: Facies 8/13 n = 35KK
0
5
10
15
Fre
qu
en
cy
K wt. %
CMC & TR: Facies 8/13n = 35
LL
0
5
10
0 2 4 6 8
10
12
14
16
18
20
22
24
26
28
30
32
Mo
re
Fre
qu
en
cy
U [ppm]
CMC & TR: Facies 8/13 n = 35MM
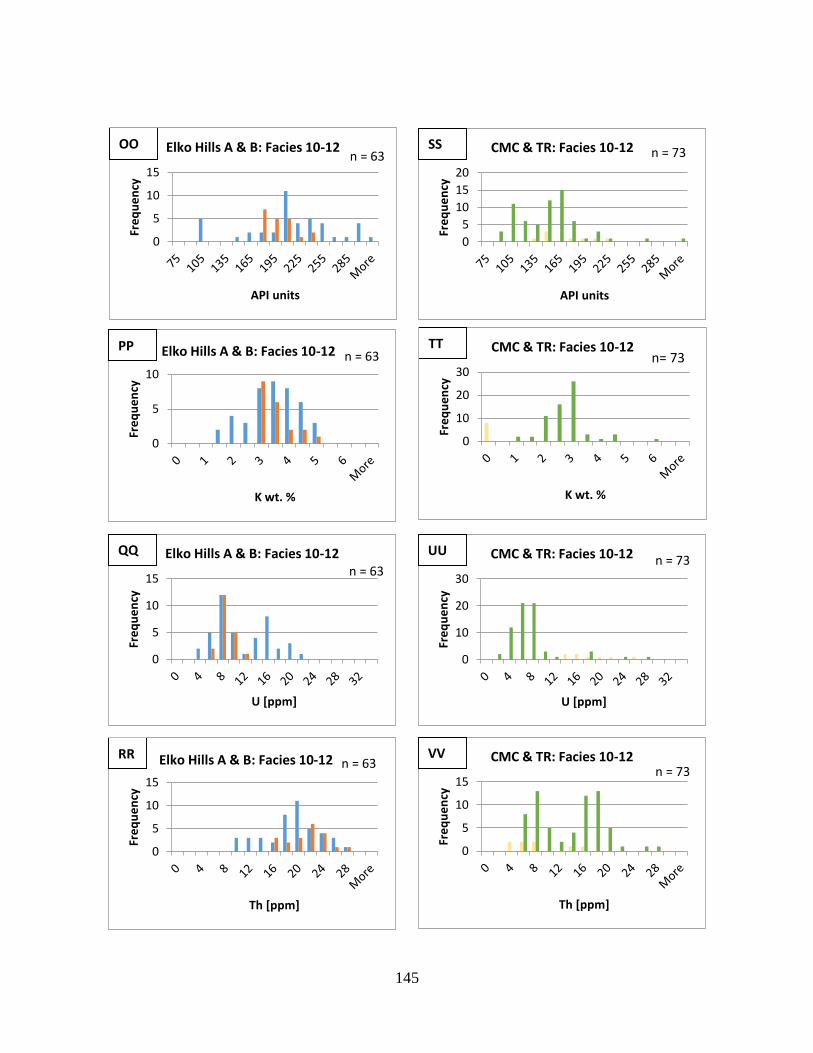
145
0
5
10
15
20
Fre
qu
en
cy
API units
CMC & TR: Facies 10-12 n = 73SS
0
5
10
15
Fre
qu
en
cy
API units
Elko Hills A & B: Facies 10-12n = 63
OO
0
5
10
Fre
qu
en
cy
K wt. %
Elko Hills A & B: Facies 10-12 n = 63PP
0
10
20
30
Fre
qu
en
cy
K wt. %
CMC & TR: Facies 10-12TTn= 73
0
5
10
15
Fre
qu
en
cy
U [ppm]
Elko Hills A & B: Facies 10-12n = 63
0
10
20
30
Fre
qu
en
cy
U [ppm]
CMC & TR: Facies 10-12 n = 73UU
0
5
10
15
Fre
qu
en
cy
Th [ppm]
Elko Hills A & B: Facies 10-12 n = 63RR
0
5
10
15
Fre
qu
en
cy
Th [ppm]
CMC & TR: Facies 10-12n = 73
VV
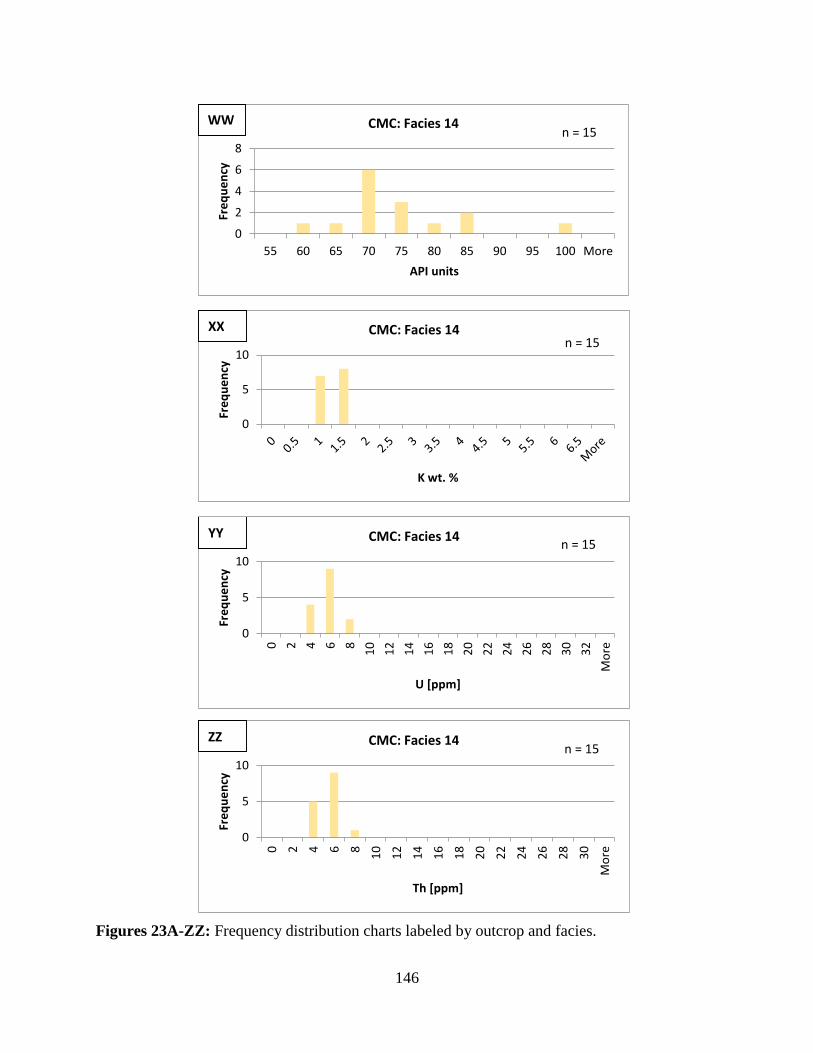
146
Figures 23A-ZZ: Frequency distribution charts labeled by outcrop and facies.
0
2
4
6
8
55 60 65 70 75 80 85 90 95 100 More
Fre
qu
en
cy
API units
CMC: Facies 14n = 15
WW
0
5
10
Fre
qu
en
cy
K wt. %
CMC: Facies 14n = 15
XX
0
5
10
0 2 4 6 8
10
12
14
16
18
20
22
24
26
28
30
32
Mo
re
Fre
qu
en
cy
U [ppm]
CMC: Facies 14n = 15
YY
0
5
10
0 2 4 6 8
10
12
14
16
18
20
22
24
26
28
30
Mo
re
Fre
qu
en
cy
Th [ppm]
CMC: Facies 14n = 15
ZZ
147
APPENDIX 7: SCANNING ELECTRON MICROSCOPE ANALYSES
Elko Hills B at 51ft.:
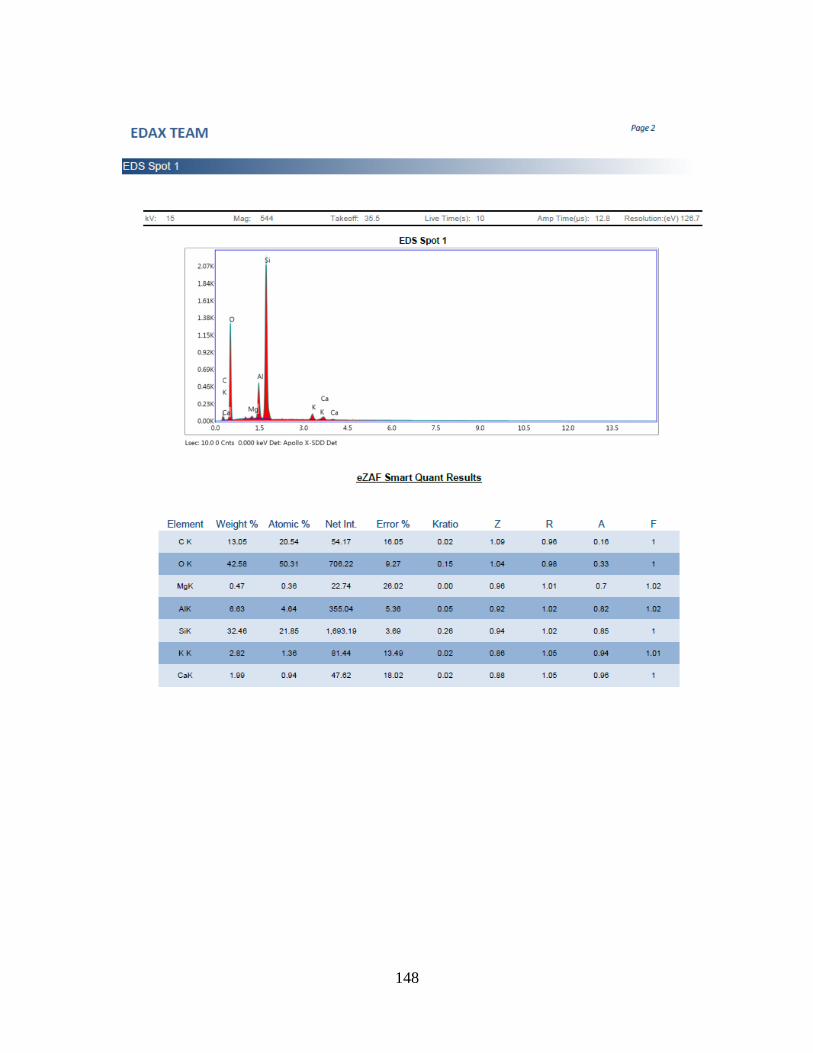
148
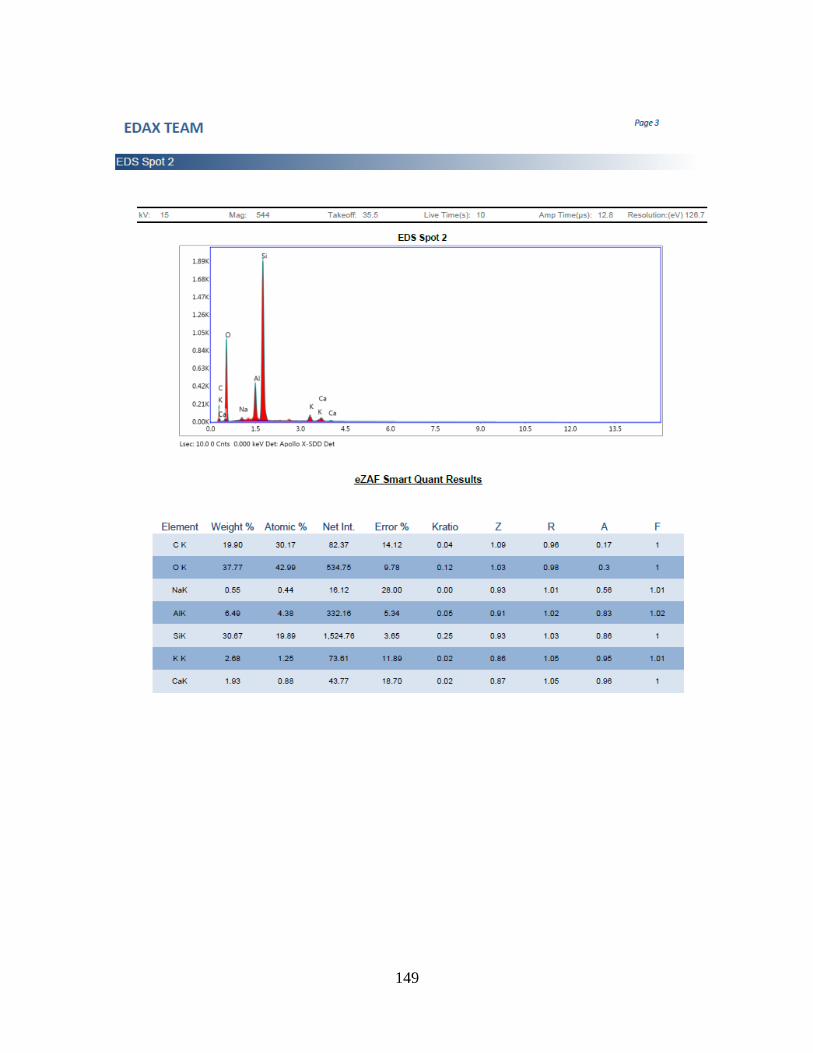
149
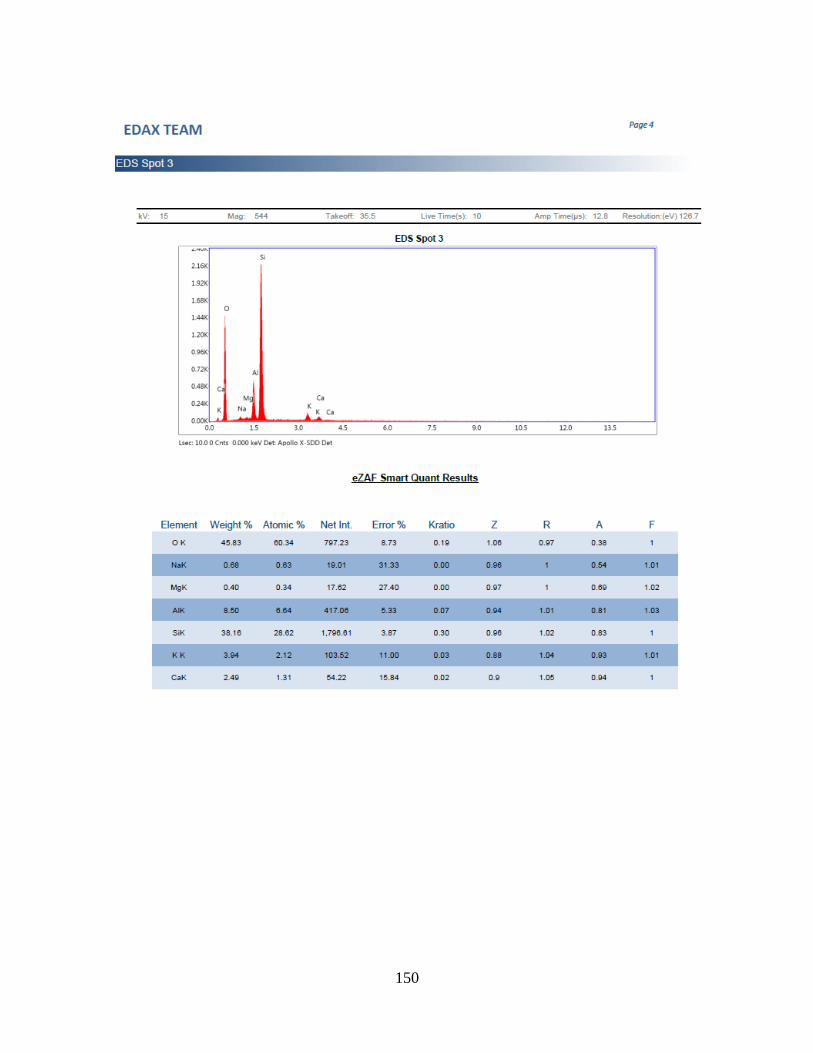
150
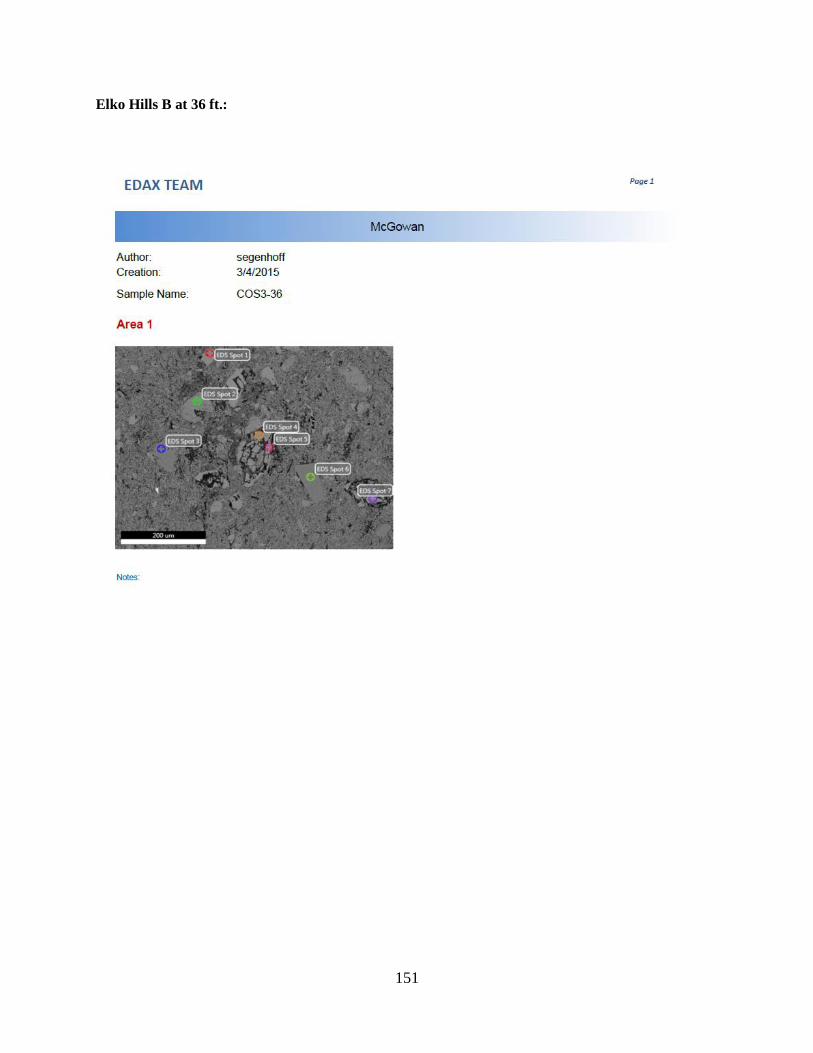
151
Elko Hills B at 36 ft.:
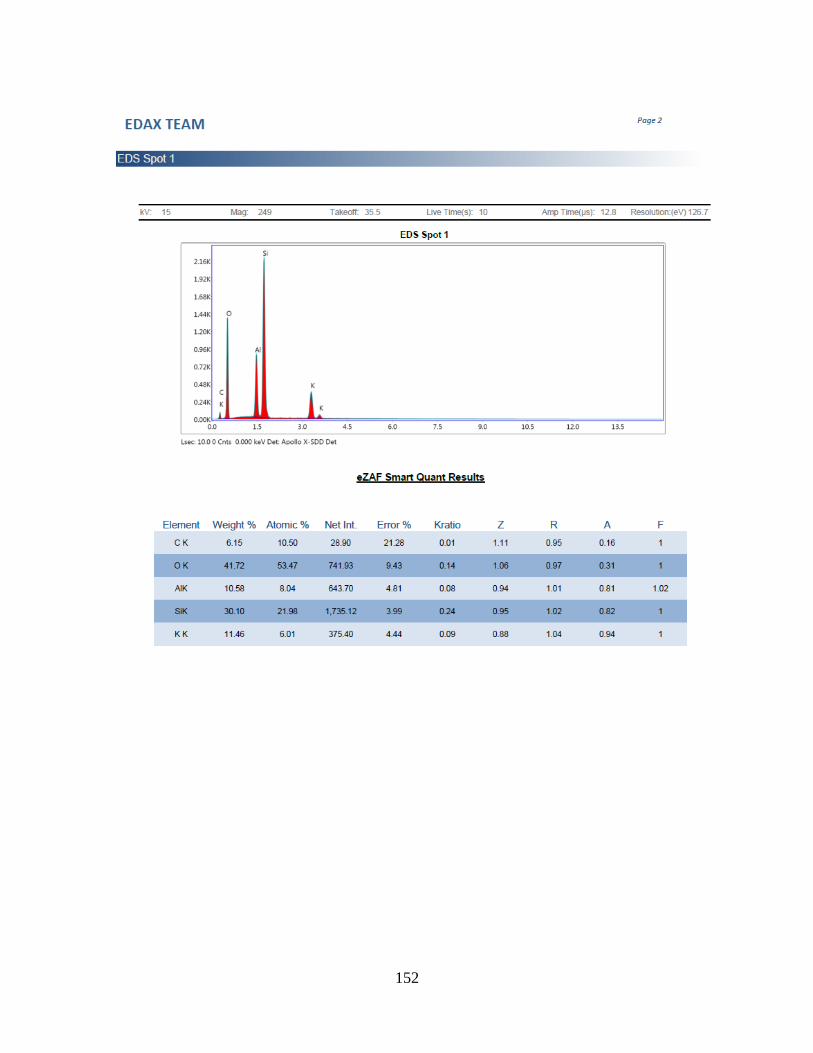
152
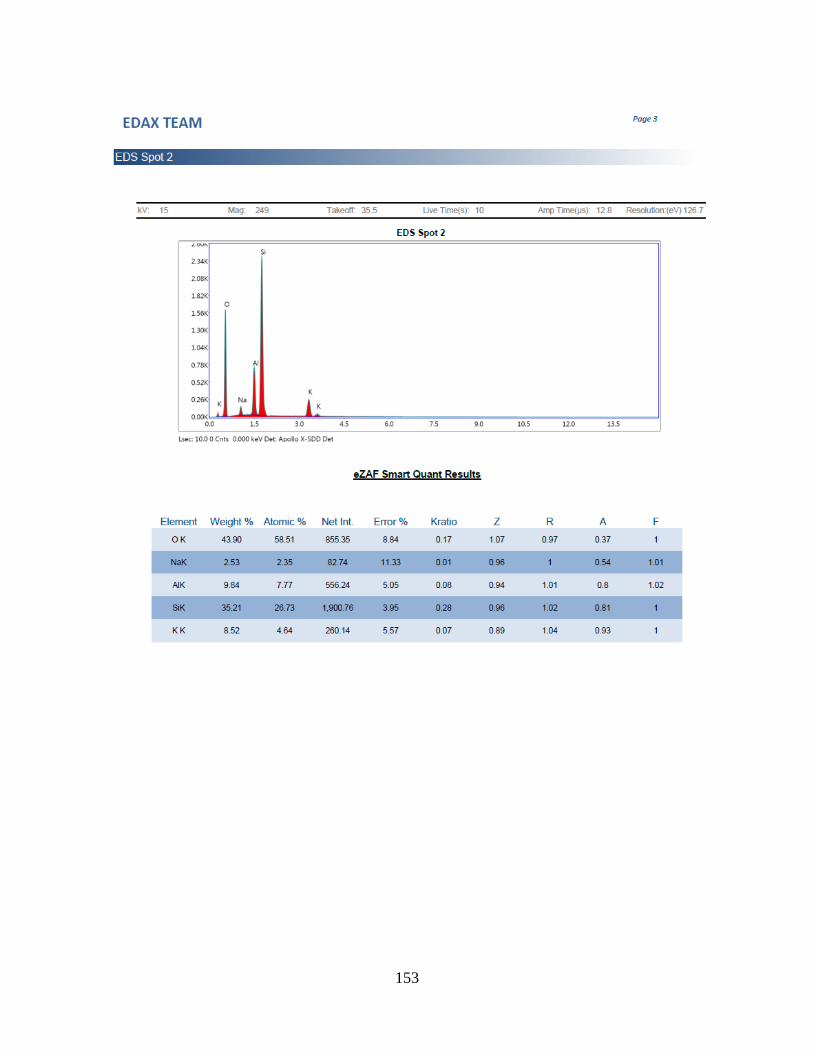
153
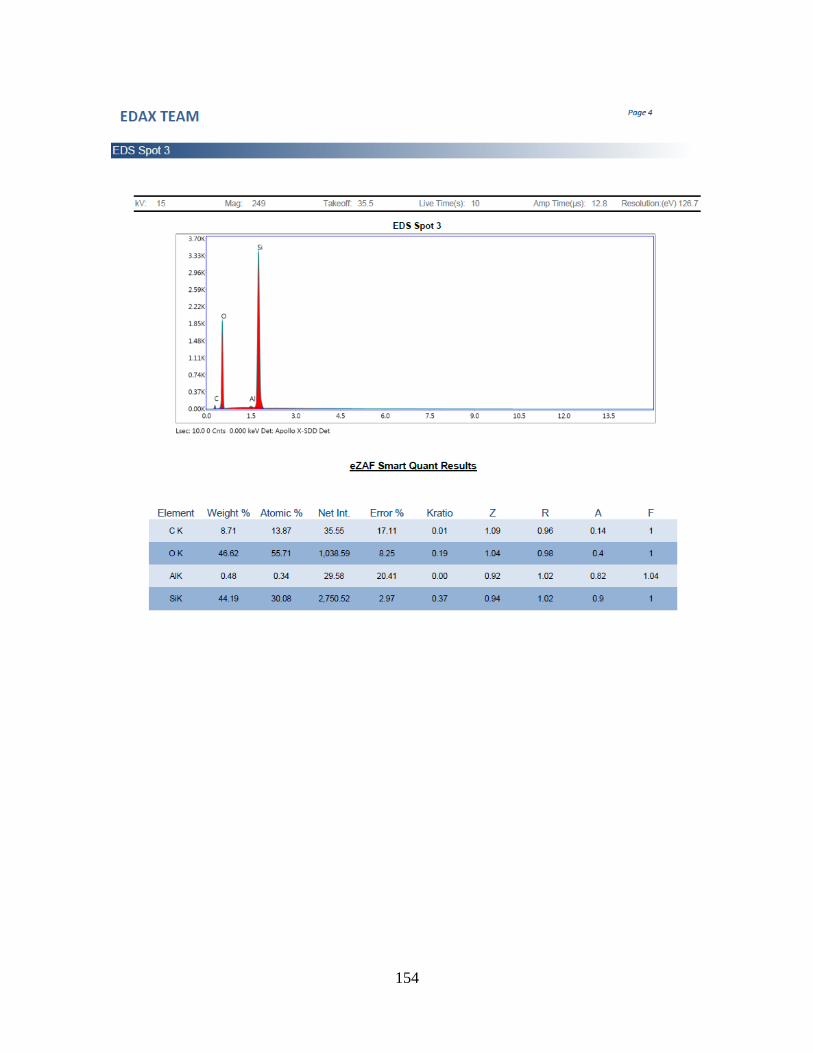
154
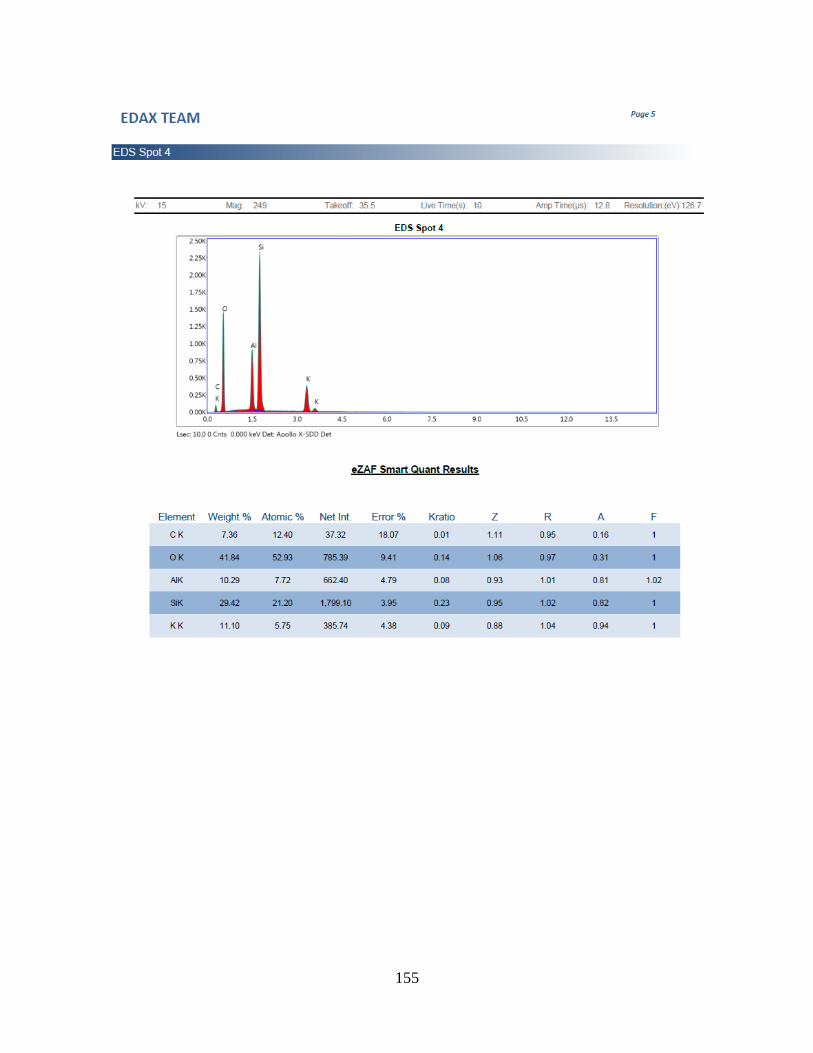
155
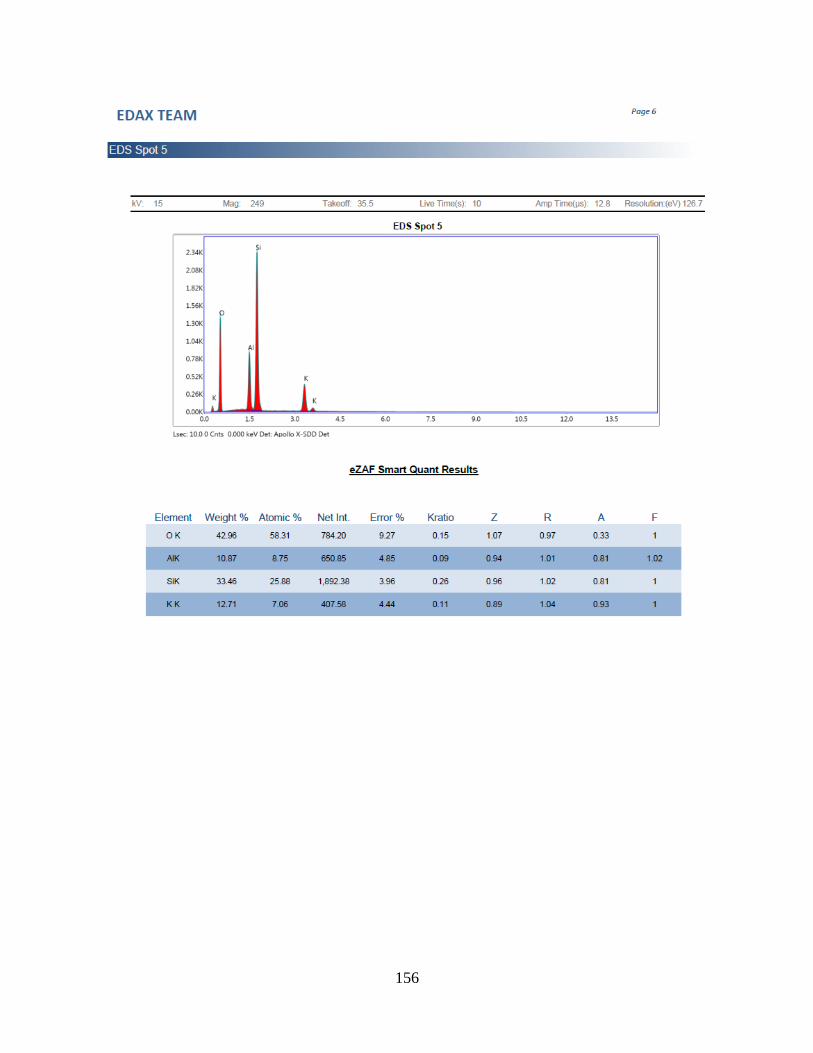
156
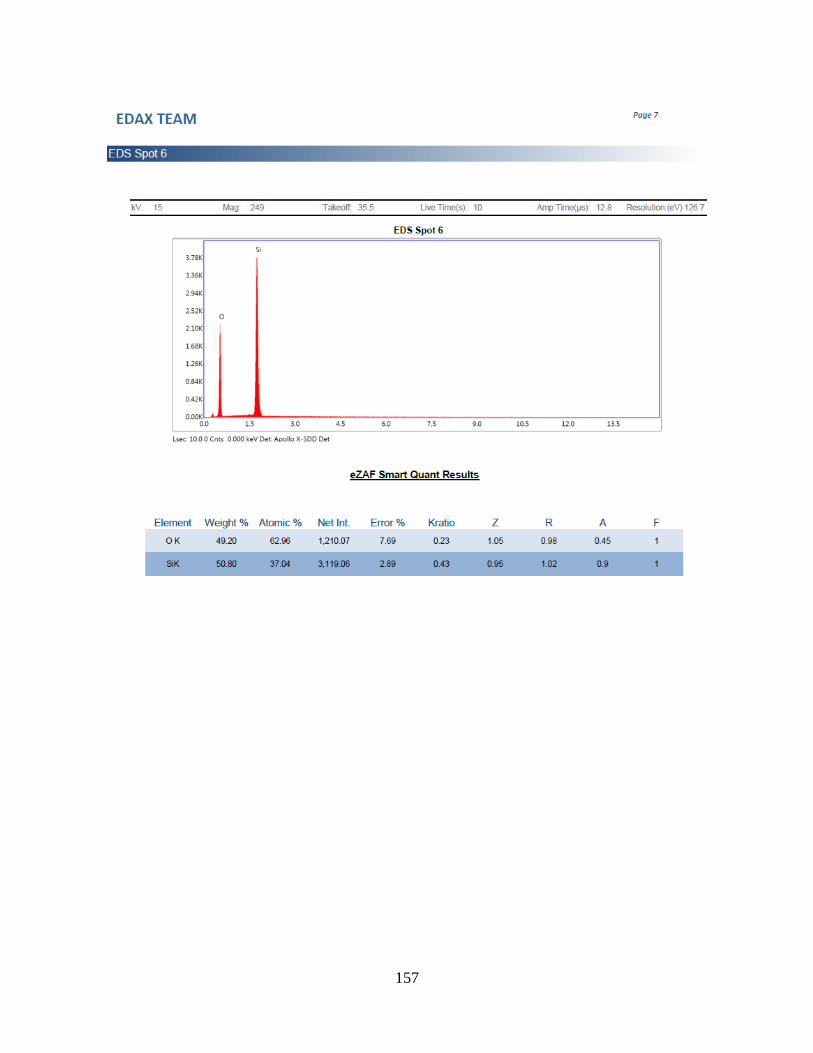
157

158
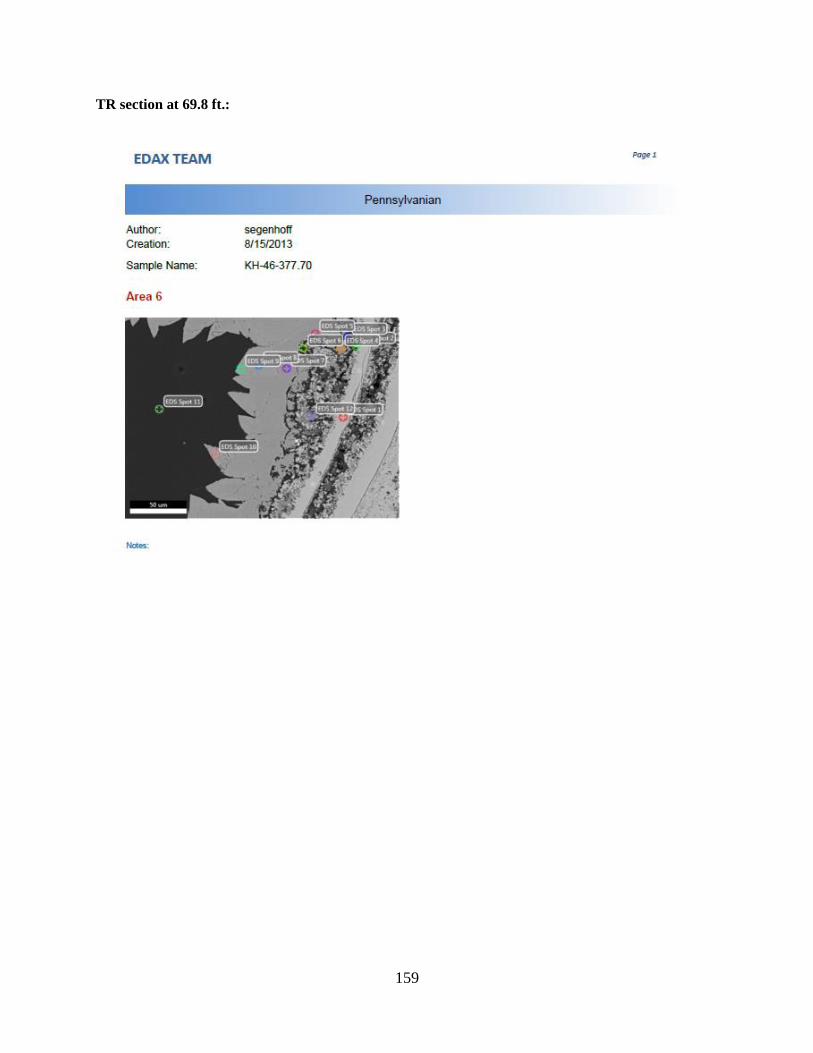
159
TR section at 69.8 ft.:
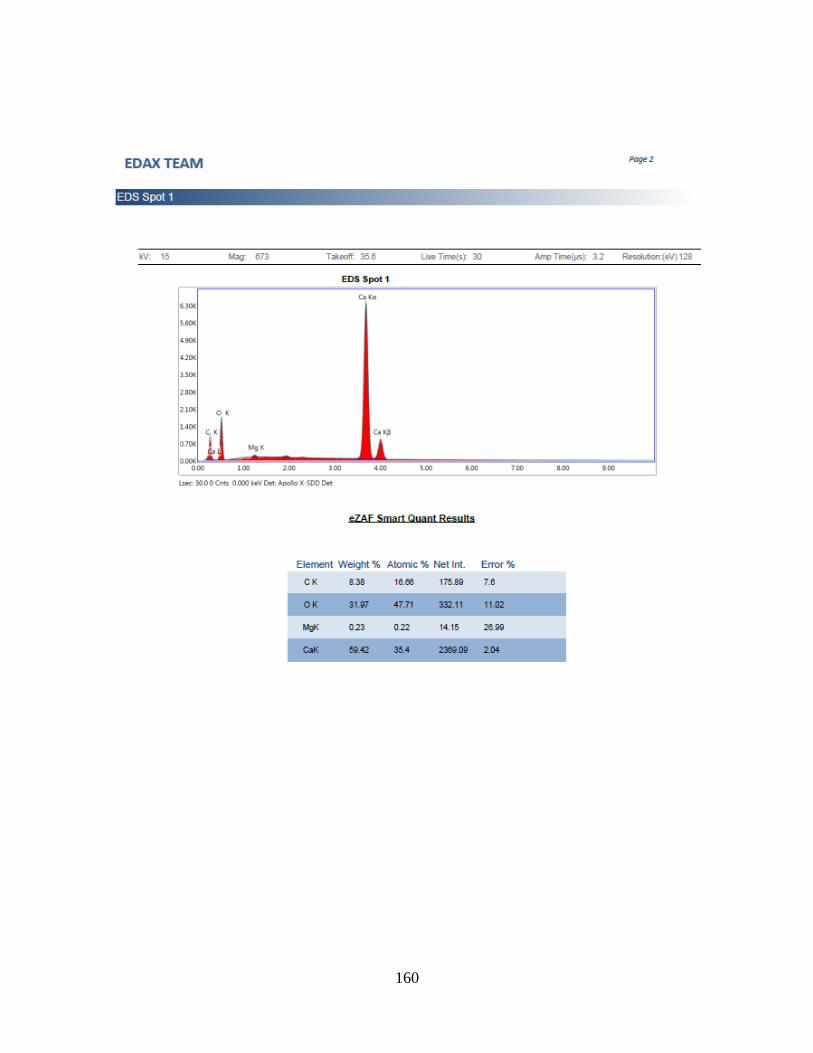
160
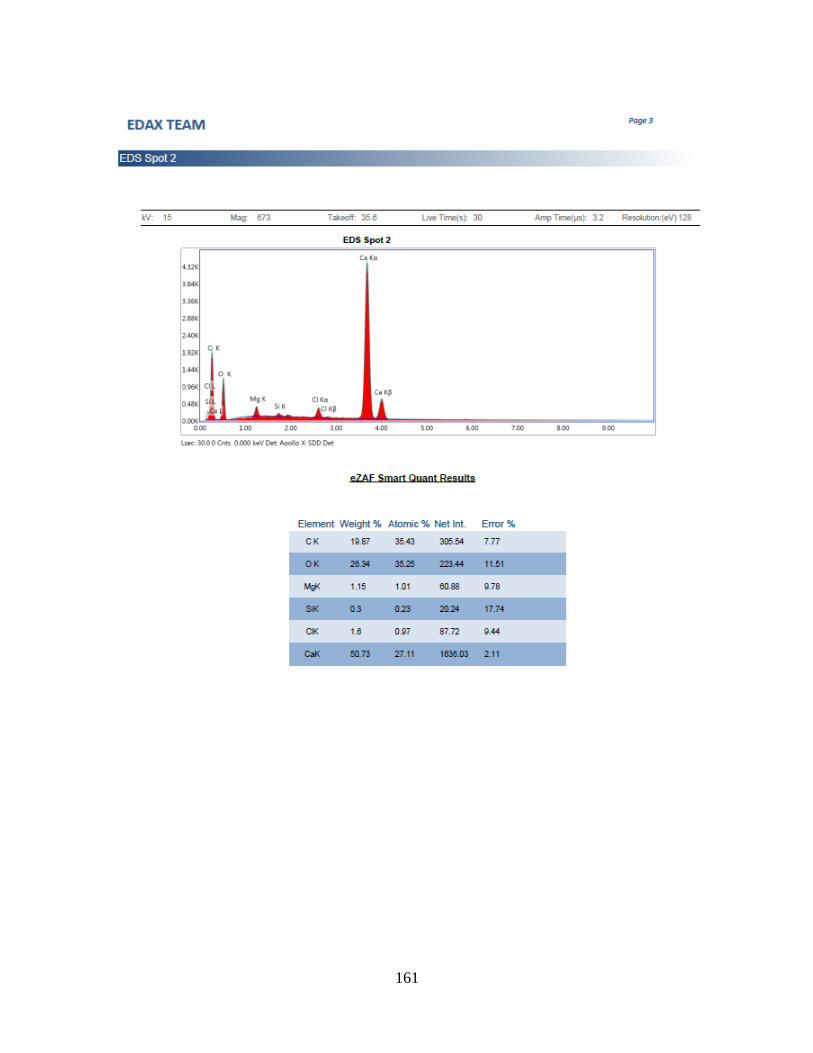
161
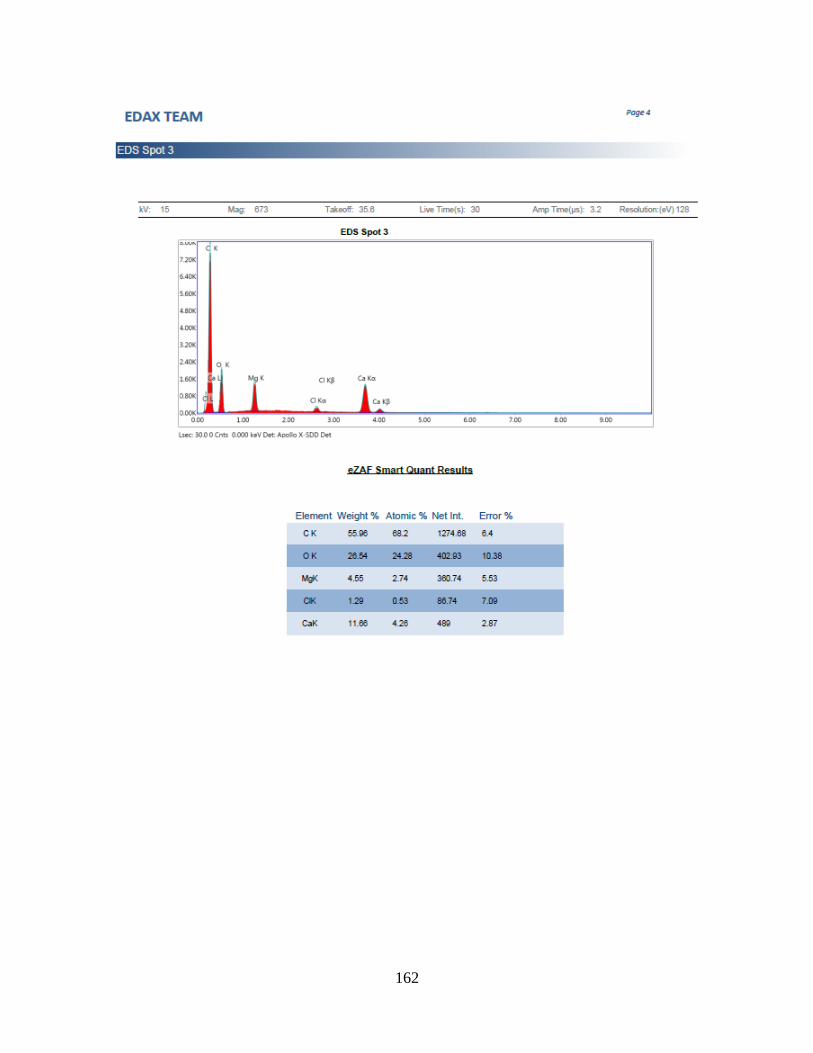
162

163
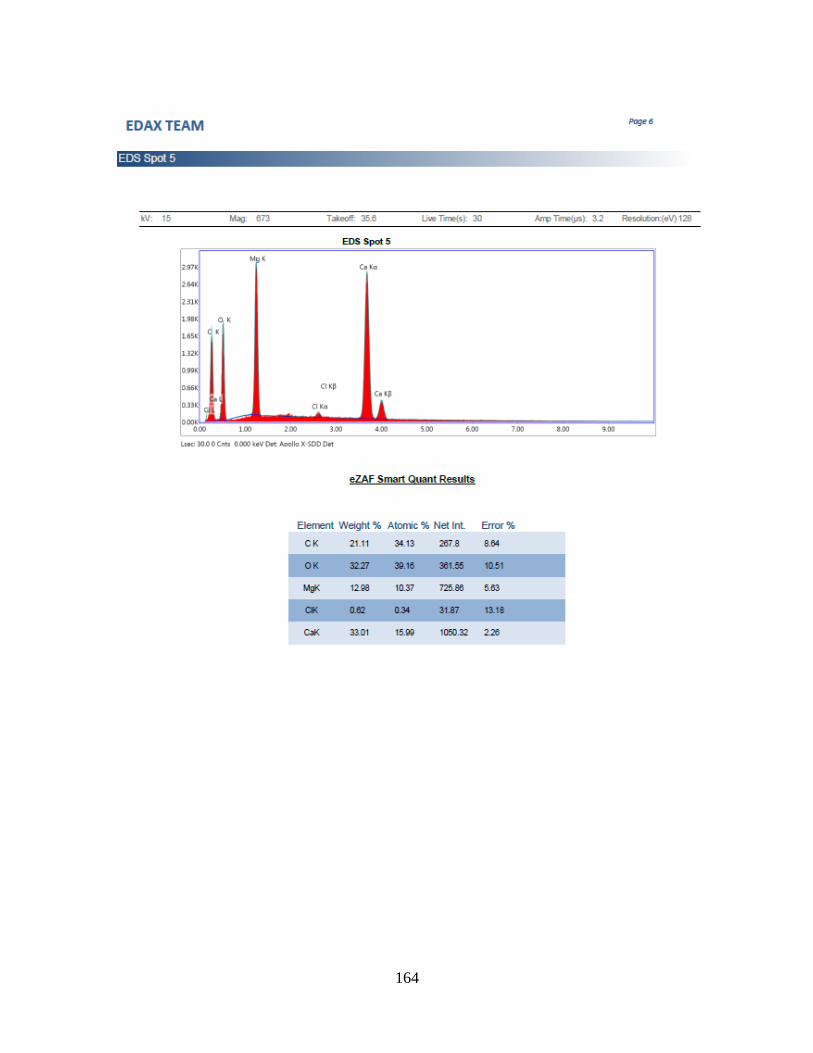
164
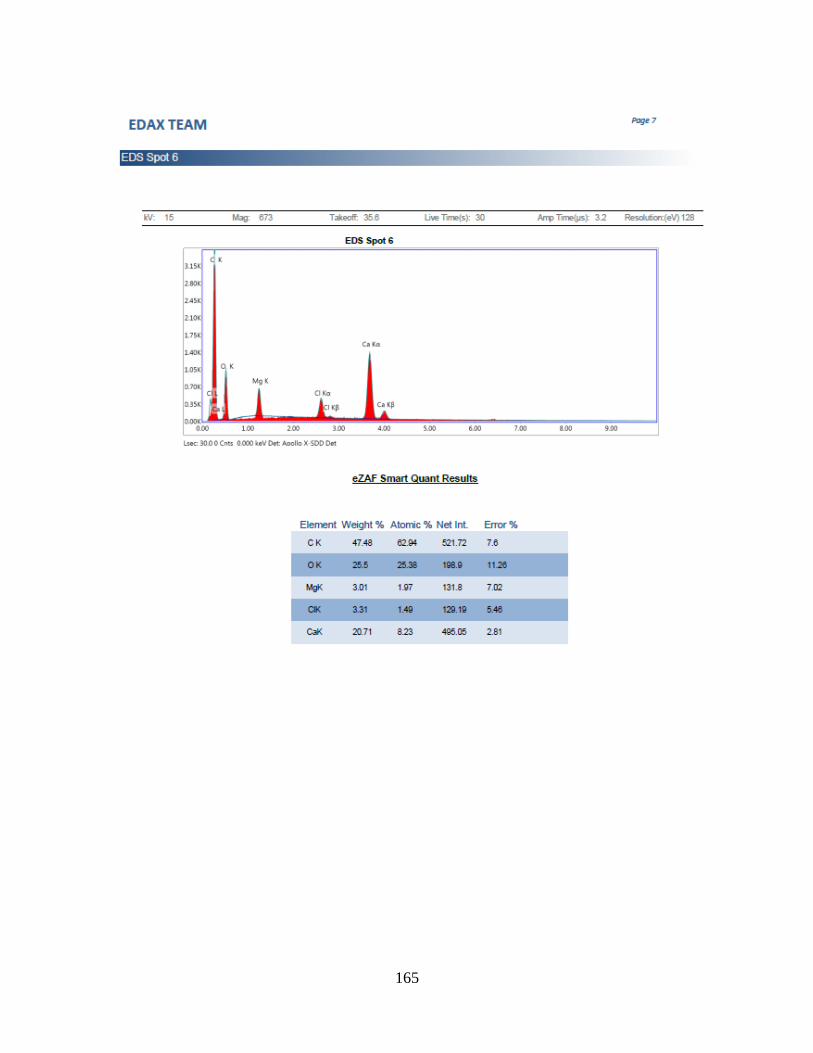
165
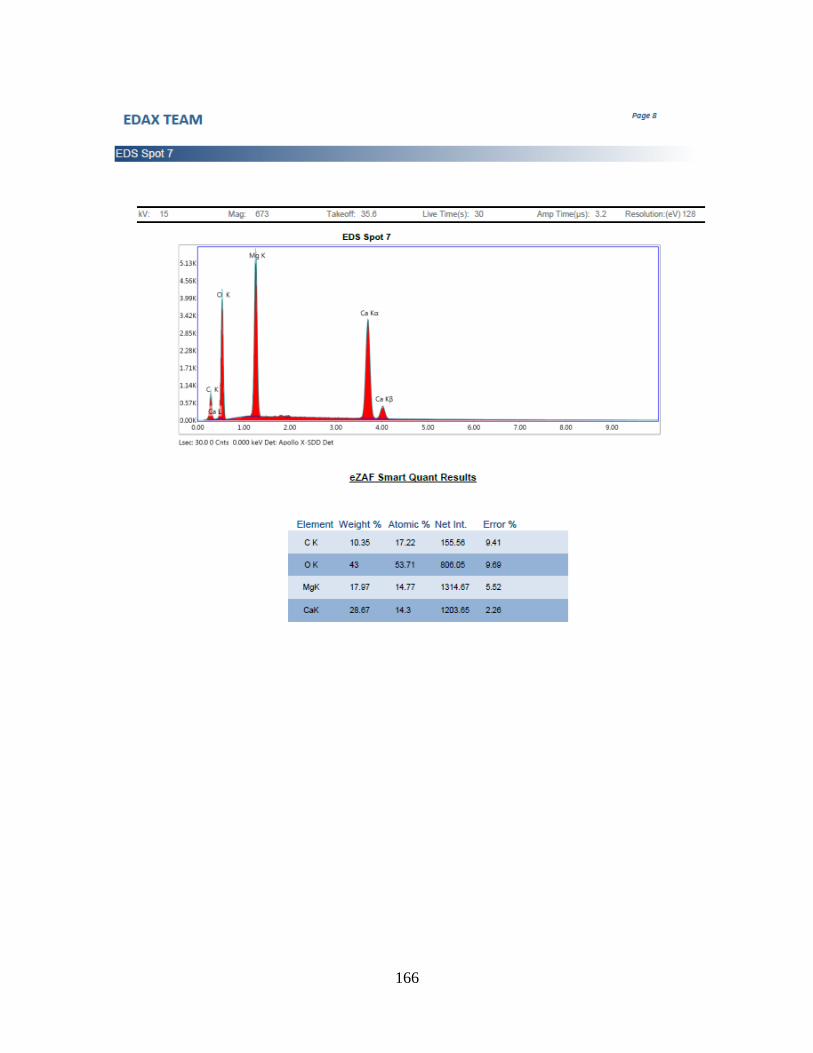
166
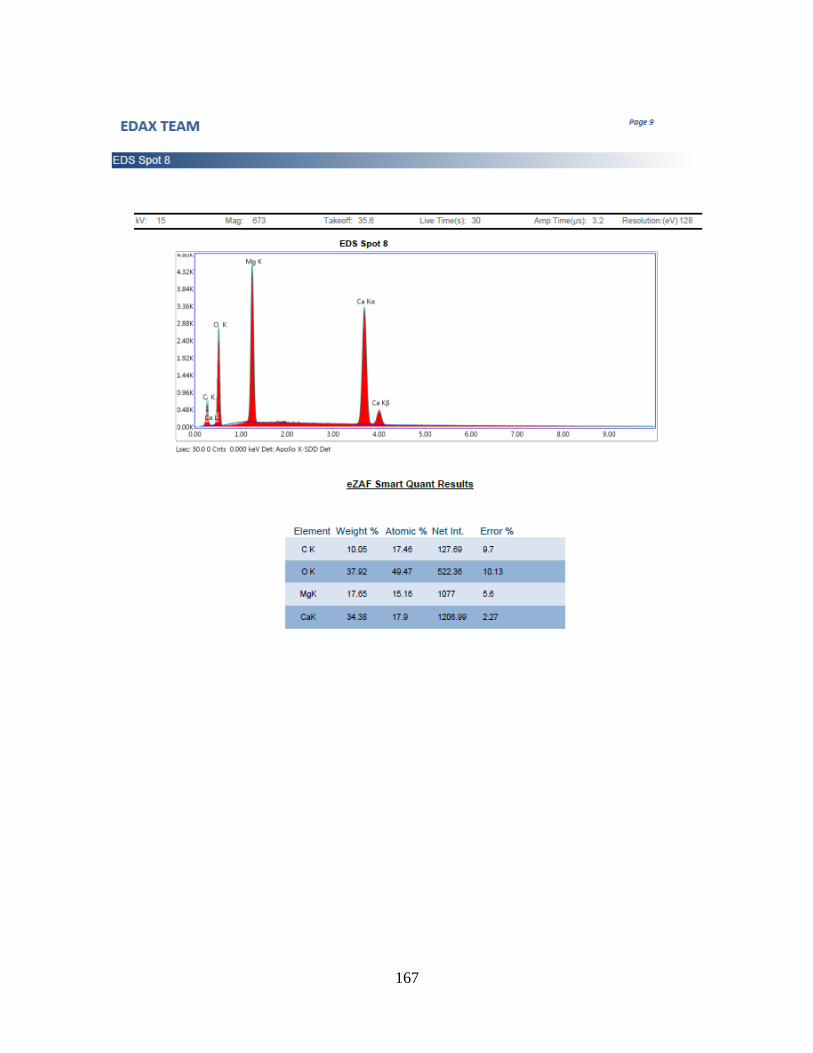
167
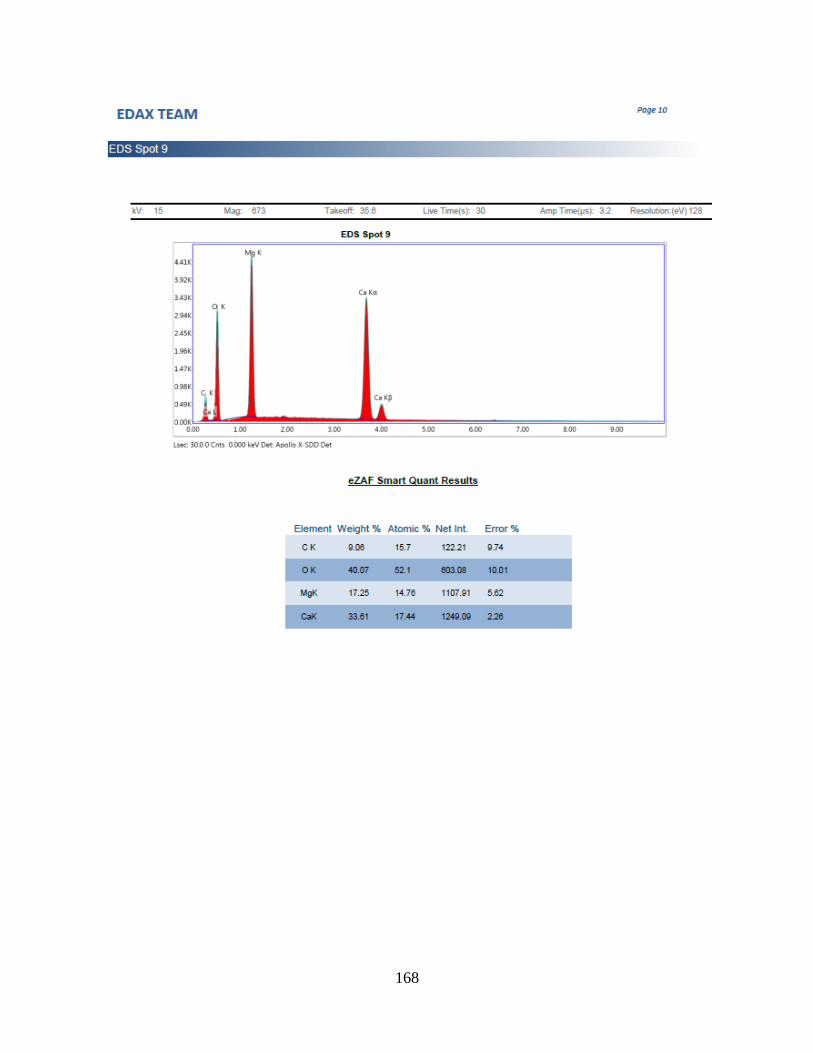
168

169
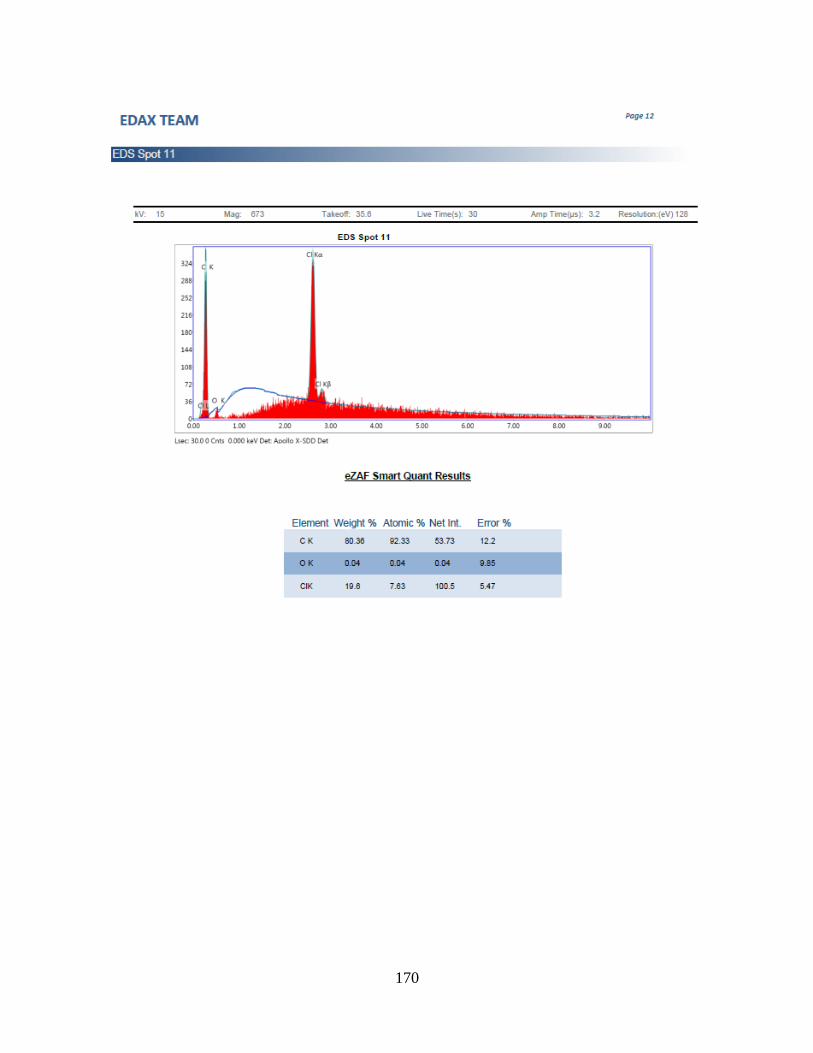
170
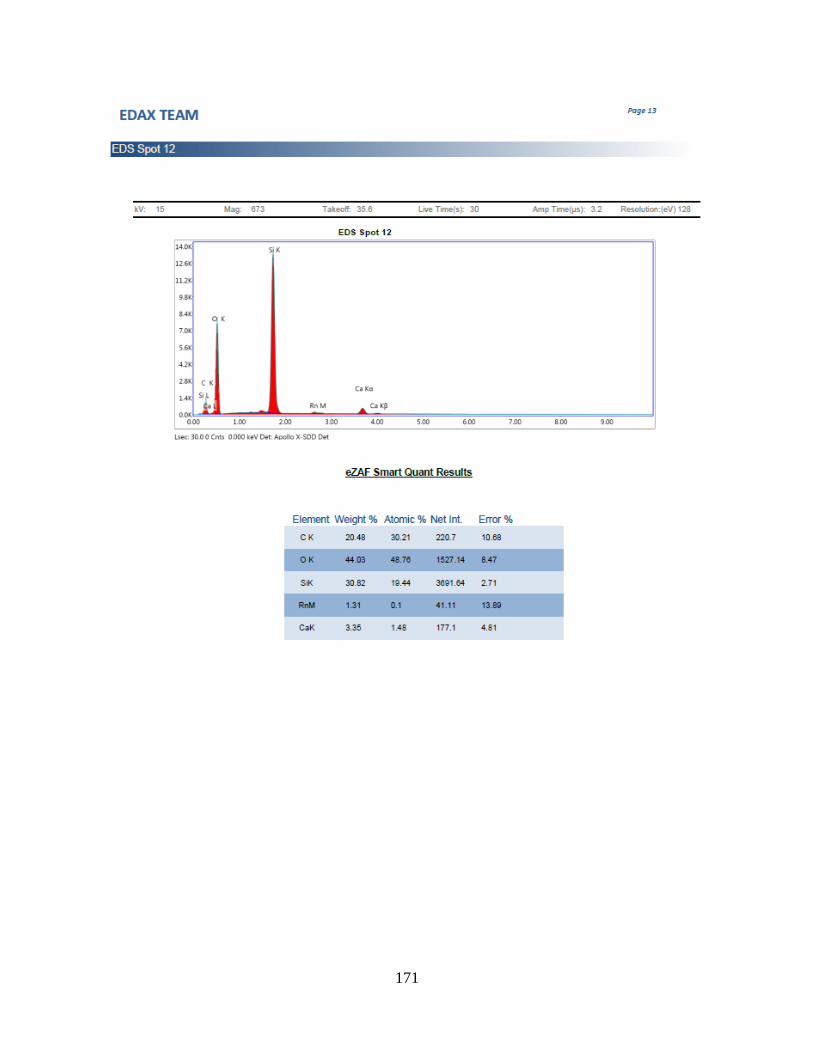
171
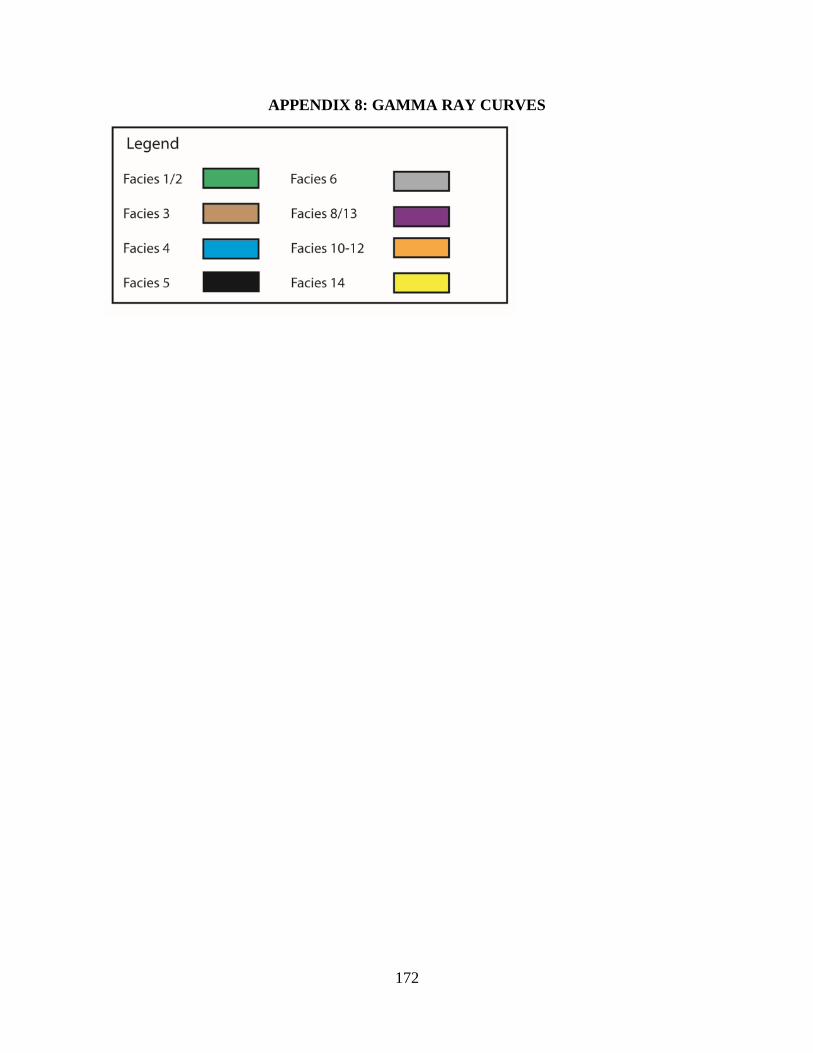
172
APPENDIX 8: GAMMA RAY CURVES
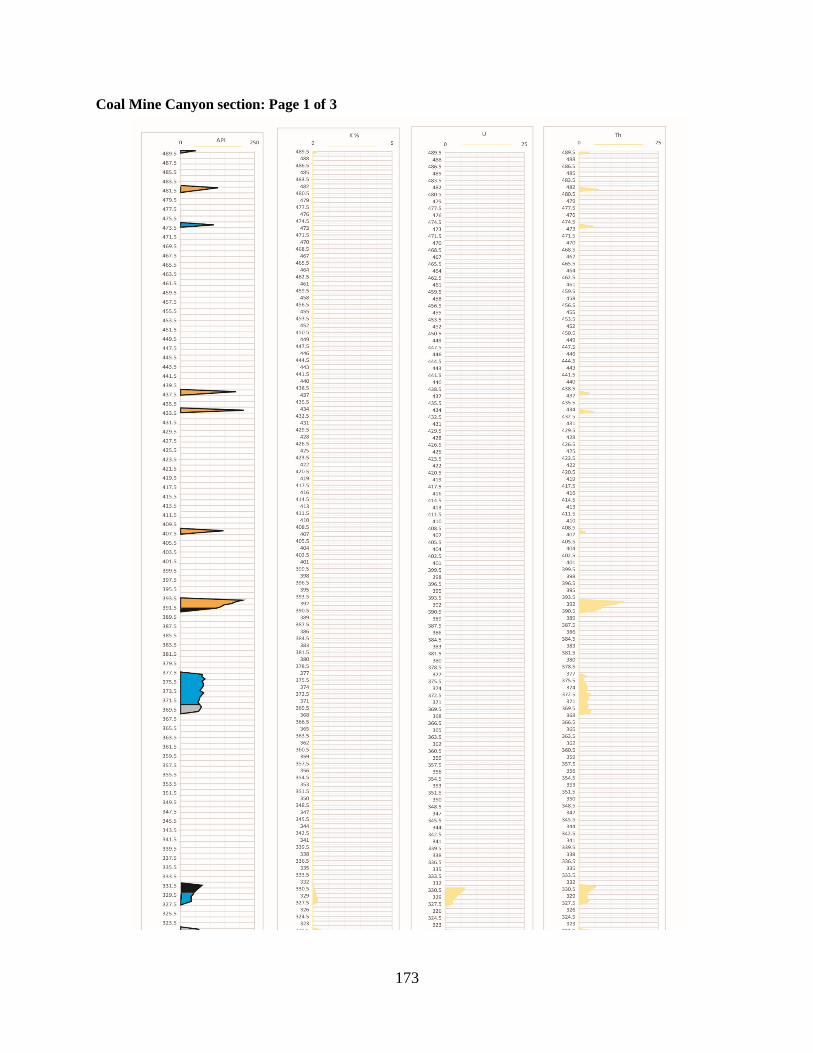
173
Coal Mine Canyon section: Page 1 of 3
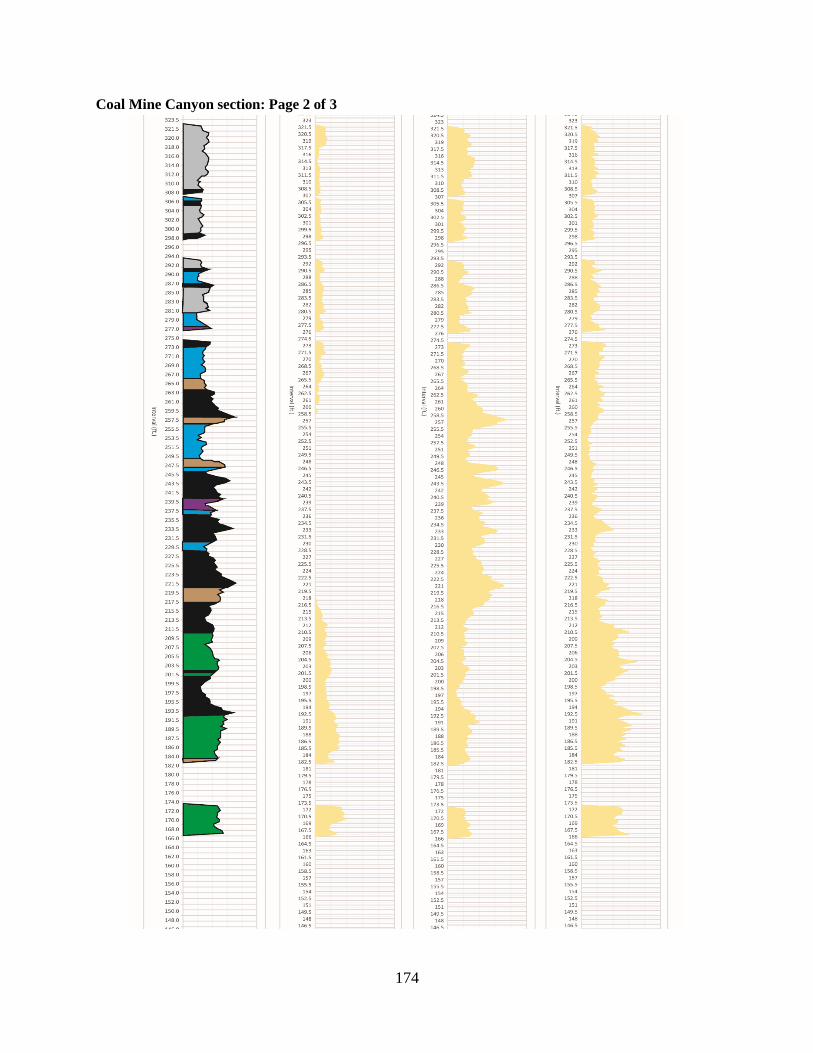
174
Coal Mine Canyon section: Page 2 of 3
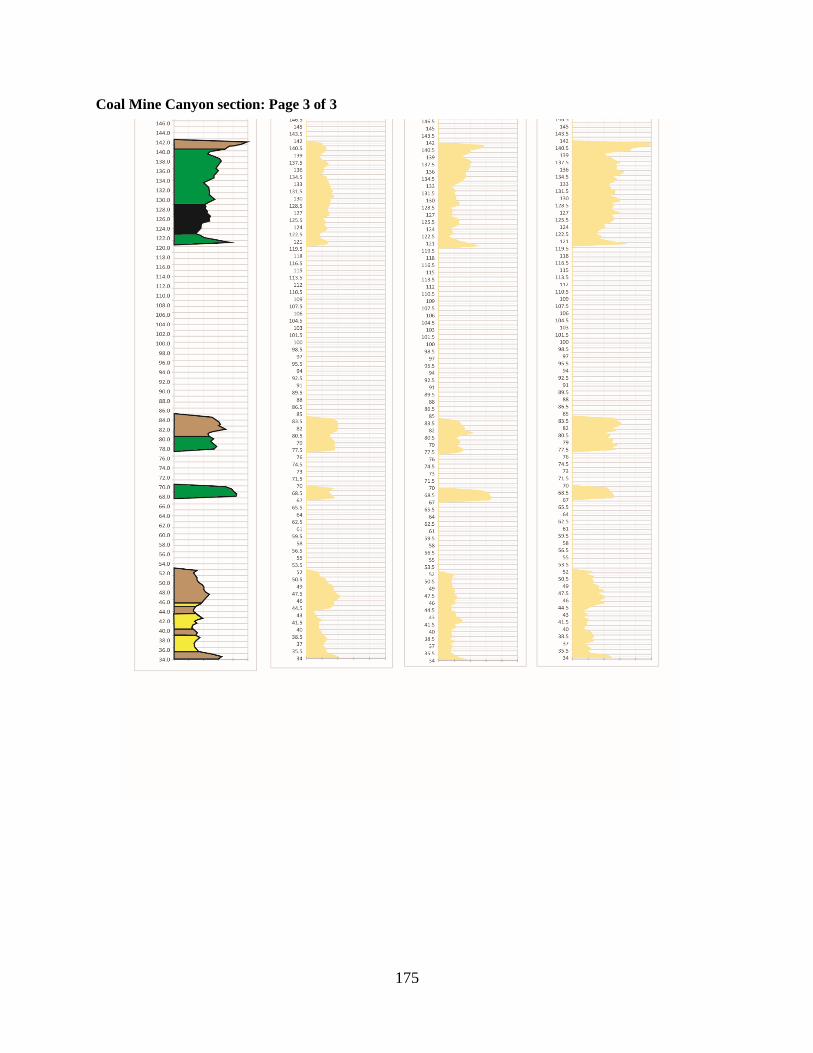
175
Coal Mine Canyon section: Page 3 of 3
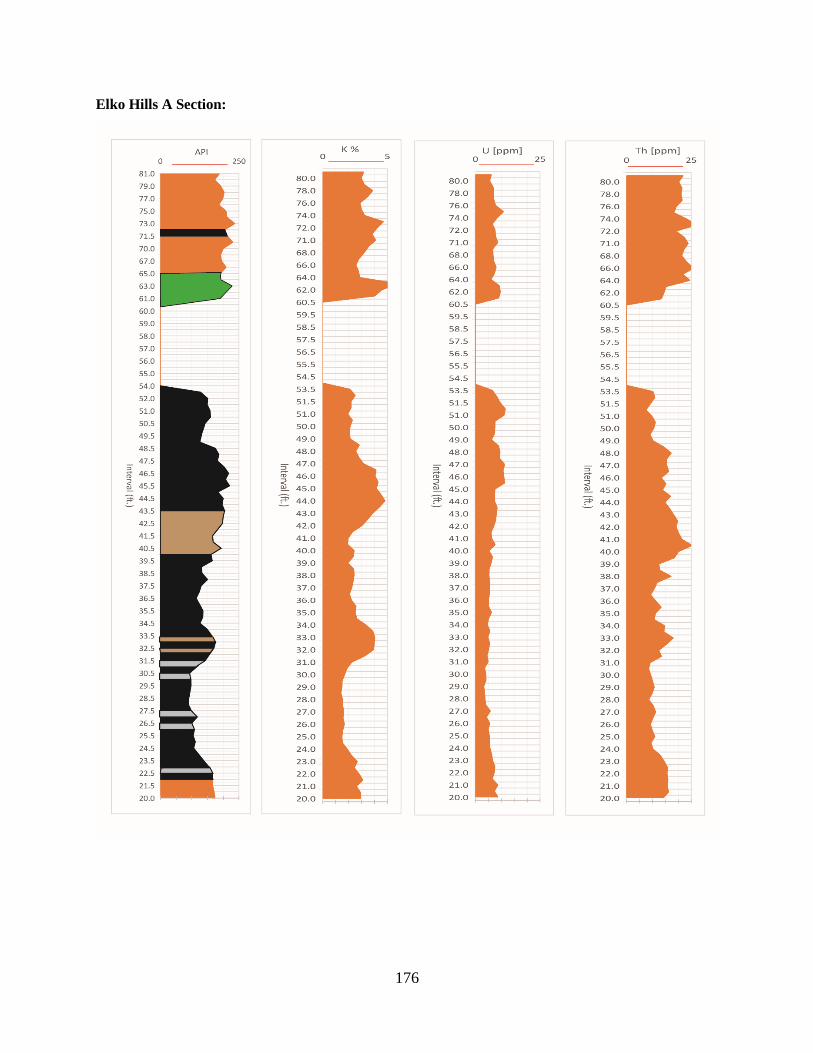
176
Elko Hills A Section:
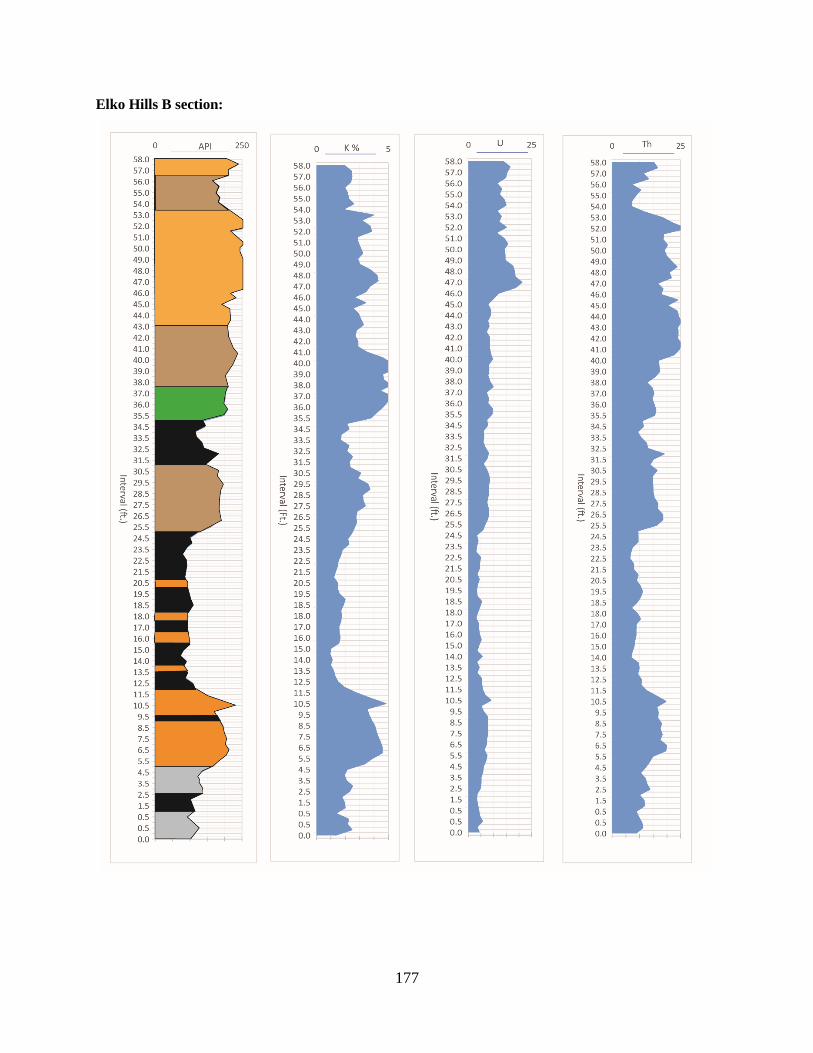
177
Elko Hills B section:
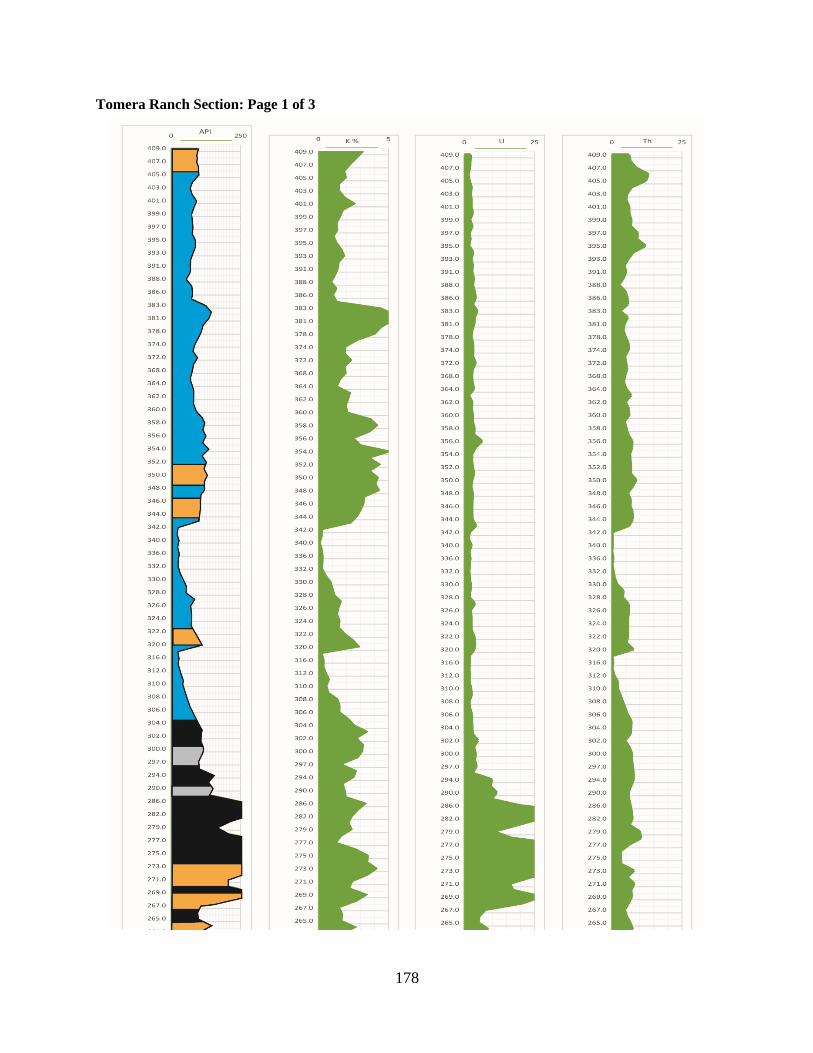
178
Tomera Ranch Section: Page 1 of 3
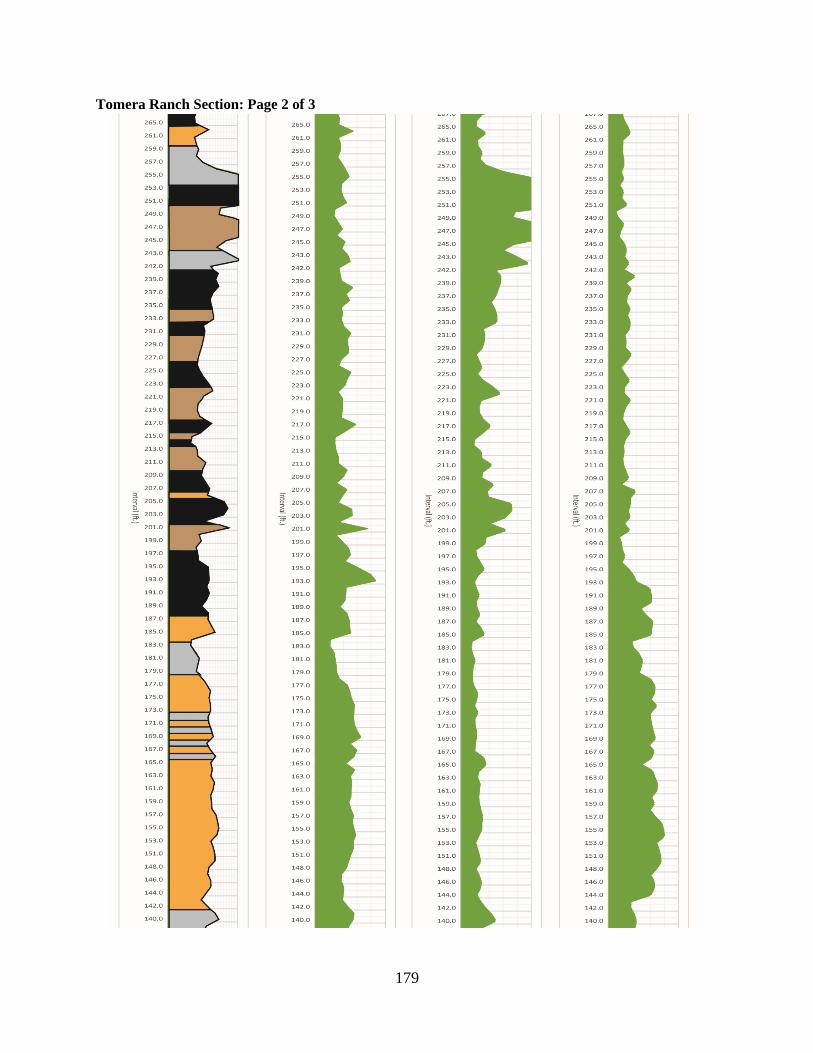
179
Tomera Ranch Section: Page 2 of 3
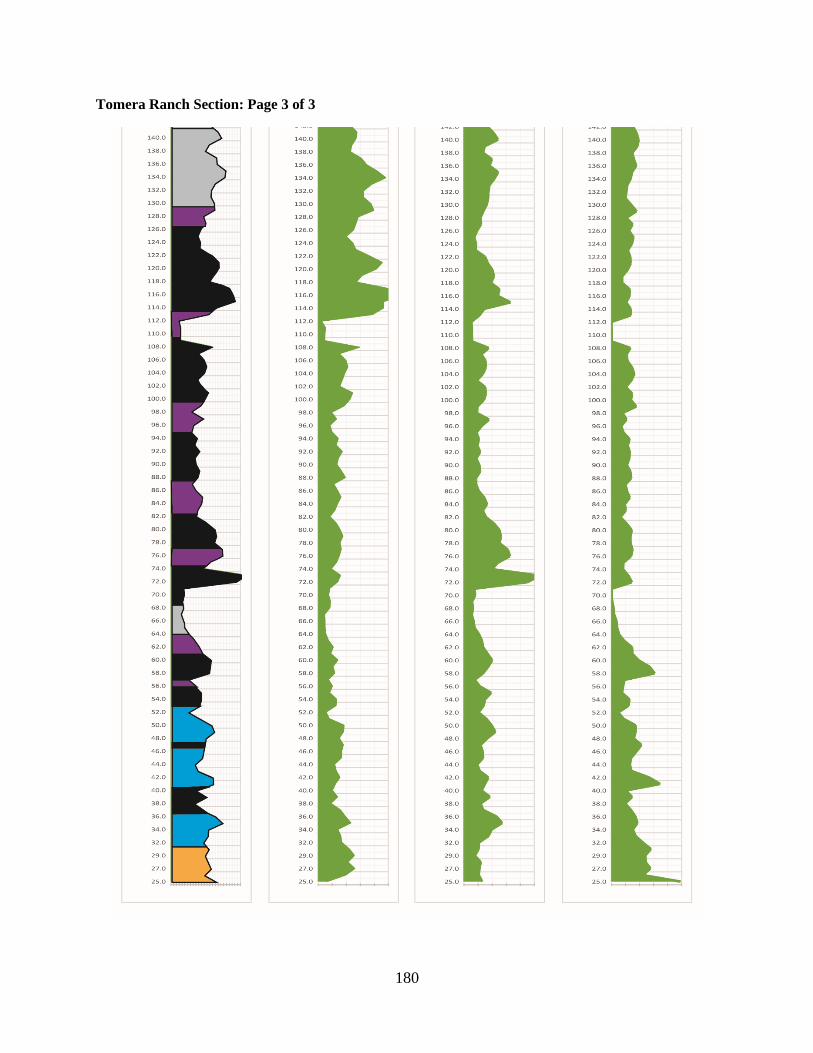
180
Tomera Ranch Section: Page 3 of 3
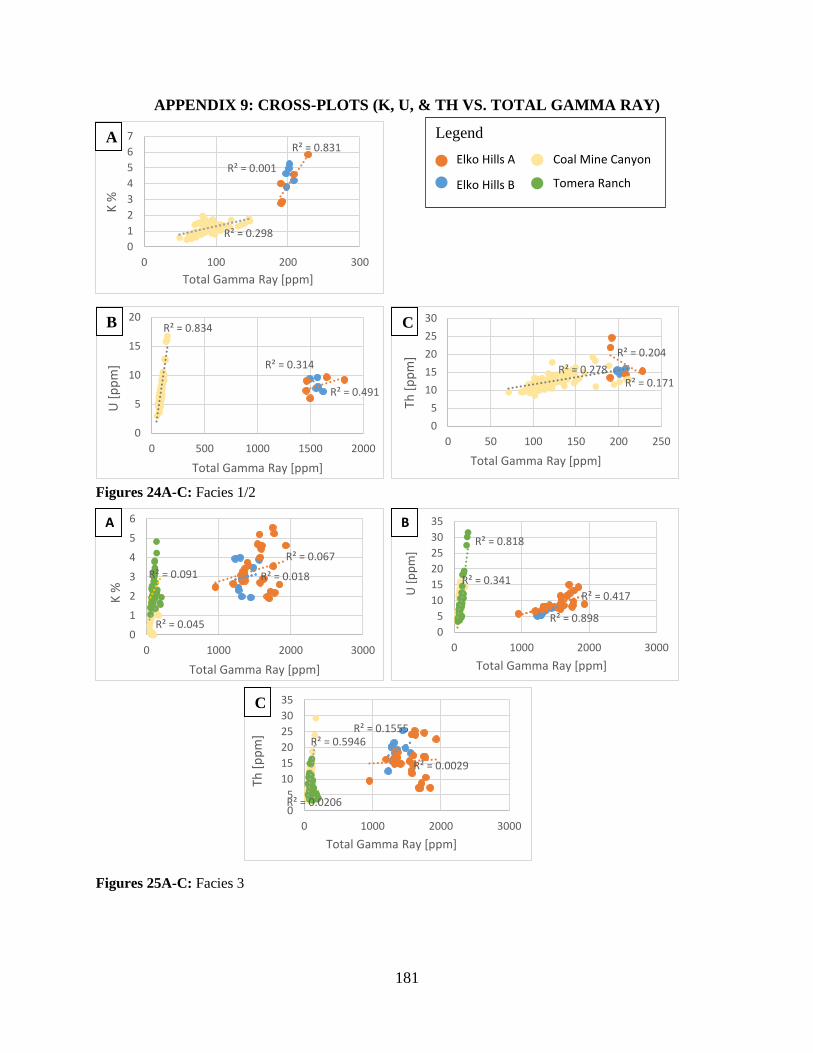
181
APPENDIX 9: CROSS-PLOTS (K, U, & TH VS. TOTAL GAMMA RAY)
Figures 24A-C: Facies 1/2
Figures 25A-C: Facies 3
R² = 0.491
R² = 0.314
R² = 0.834
0
5
10
15
20
0 500 1000 1500 2000
U [
pp
m]
Total Gamma Ray [ppm]
R² = 0.001
R² = 0.831
R² = 0.2980
1
2
3
4
5
6
7
0 100 200 300
K %
Total Gamma Ray [ppm]
B
A
R² = 0.171
R² = 0.204
R² = 0.278
0
5
10
15
20
25
30
0 50 100 150 200 250
Th [
pp
m]
Total Gamma Ray [ppm]
C
R² = 0.898
R² = 0.417
R² = 0.341
R² = 0.818
0
5
10
15
20
25
30
35
0 1000 2000 3000
U [
pp
m]
Total Gamma Ray [ppm]
B
R² = 0.018
R² = 0.067
R² = 0.045
R² = 0.091
0
1
2
3
4
5
6
0 1000 2000 3000
K %
Total Gamma Ray [ppm]
A
R² = 0.1555
R² = 0.0029
R² = 0.5946
R² = 0.02060
5
10
15
20
25
30
35
0 1000 2000 3000
Th [
pp
m]
Total Gamma Ray [ppm]
C
Legend
Elko Hills B
Elko Hills A Coal Mine Canyon
Tomera Ranch
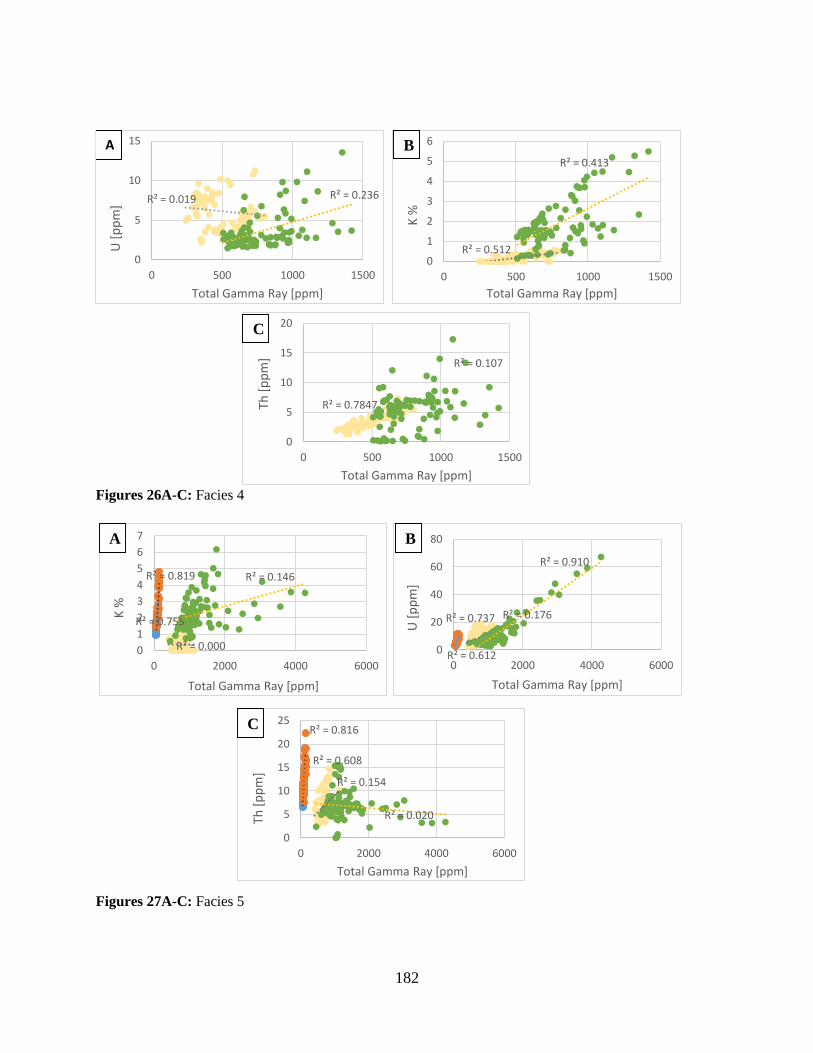
182
Figures 26A-C: Facies 4
Figures 27A-C: Facies 5
R² = 0.019 R² = 0.236
0
5
10
15
0 500 1000 1500
U [
pp
m]
Total Gamma Ray [ppm]
A
R² = 0.512
R² = 0.413
0
1
2
3
4
5
6
0 500 1000 1500
K %
Total Gamma Ray [ppm]
R² = 0.7847
R² = 0.107
0
5
10
15
20
0 500 1000 1500
Th [
pp
m]
Total Gamma Ray [ppm]
B
C
R² = 0.737
R² = 0.612
R² = 0.176
R² = 0.910
0
20
40
60
80
0 2000 4000 6000
U [
pp
m]
Total Gamma Ray [ppm]
R² = 0.755
R² = 0.819
R² = 0.000
R² = 0.146
0
1
2
3
4
5
6
7
0 2000 4000 6000
K %
Total Gamma Ray [ppm]
A B
R² = 0.816
R² = 0.608
R² = 0.154
R² = 0.020
0
5
10
15
20
25
0 2000 4000 6000
Th [
pp
m]
Total Gamma Ray [ppm]
C
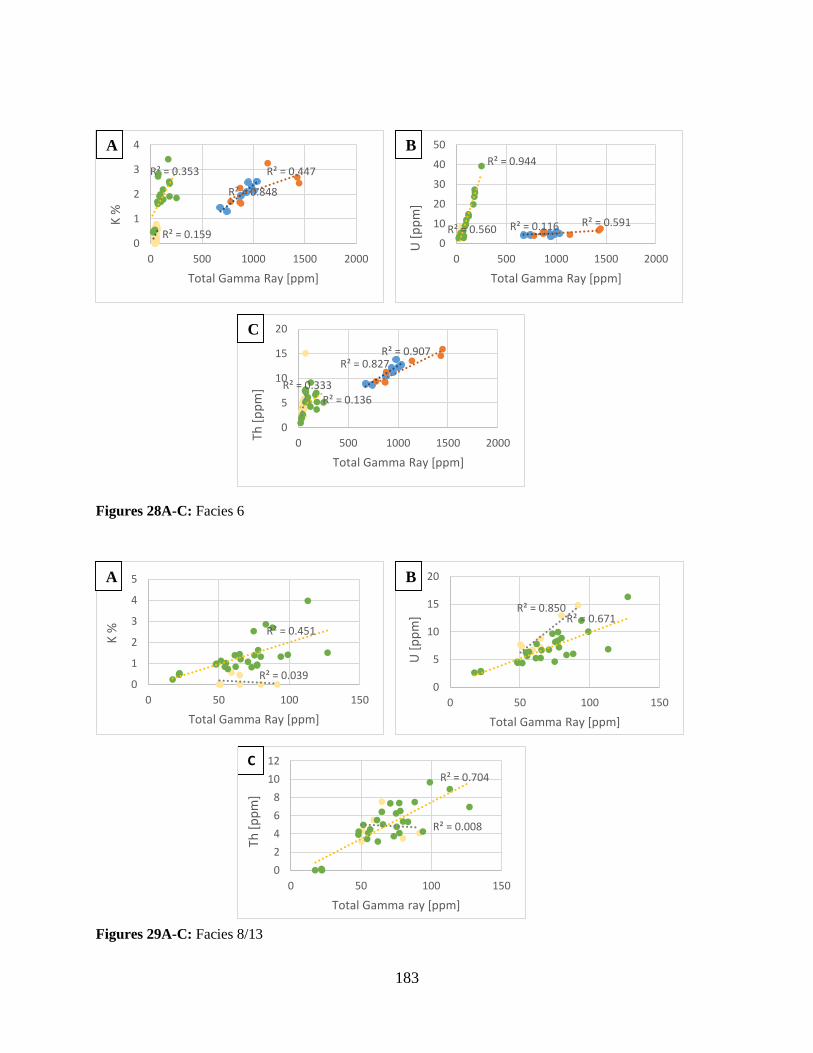
183
Figures 28A-C: Facies 6
Figures 29A-C: Facies 8/13
R² = 0.827R² = 0.907
R² = 0.333R² = 0.136
0
5
10
15
20
0 500 1000 1500 2000
Th [
pp
m]
Total Gamma Ray [ppm]
R² = 0.116 R² = 0.591R² = 0.560
R² = 0.944
0
10
20
30
40
50
0 500 1000 1500 2000
U [
pp
m]
Total Gamma Ray [ppm]
R² = 0.848
R² = 0.447
R² = 0.159
R² = 0.353
0
1
2
3
4
0 500 1000 1500 2000
K %
Total Gamma Ray [ppm]
C
A B
R² = 0.850R² = 0.671
0
5
10
15
20
0 50 100 150
U [
pp
m]
Total Gamma Ray [ppm]
R² = 0.039
R² = 0.451
0
1
2
3
4
5
0 50 100 150
K %
Total Gamma Ray [ppm]
R² = 0.008
R² = 0.704
0
2
4
6
8
10
12
0 50 100 150
Th [
pp
m]
Total Gamma ray [ppm]
C
A B
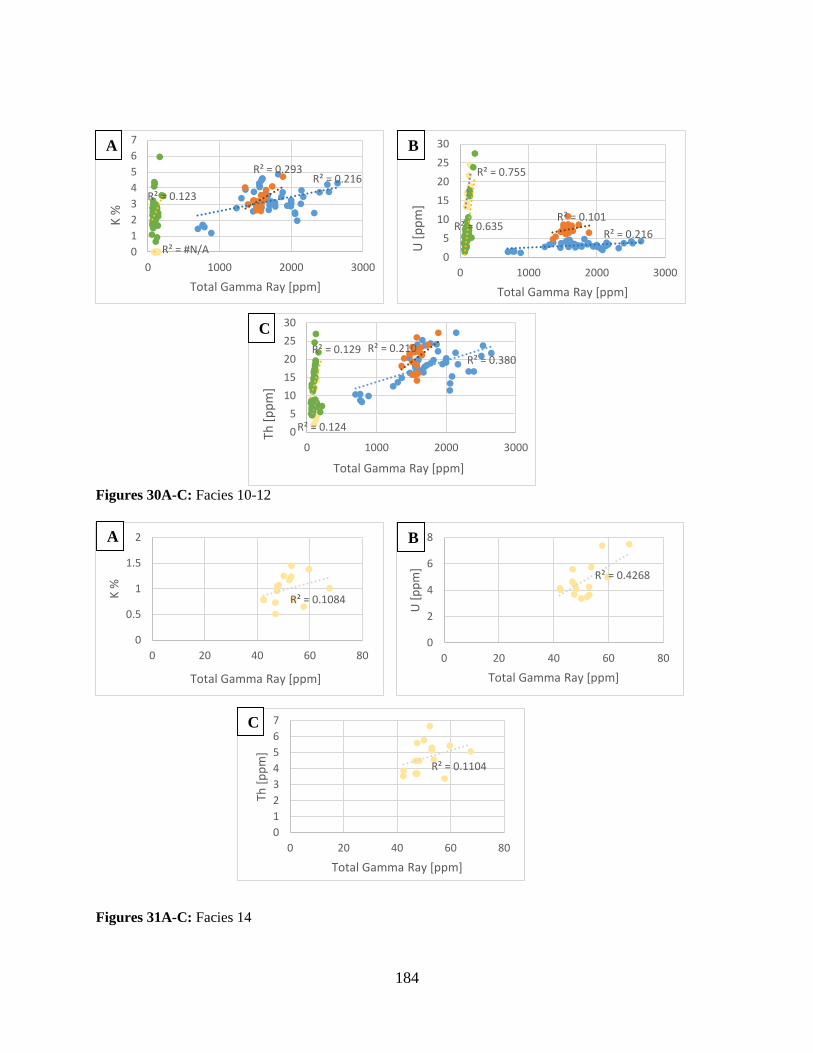
184
Figures 30A-C: Facies 10-12
Figures 31A-C: Facies 14
R² = 0.380R² = 0.210
R² = 0.124
R² = 0.129
0
5
10
15
20
25
30
0 1000 2000 3000
Th [
pp
m]
Total Gamma Ray [ppm]
C
R² = 0.216R² = 0.293
R² = #N/A
R² = 0.123
0
1
2
3
4
5
6
7
0 1000 2000 3000
K %
Total Gamma Ray [ppm]
A
R² = 0.216
R² = 0.101
R² = 0.755
R² = 0.635
0
5
10
15
20
25
30
0 1000 2000 3000
U [
pp
m]
Total Gamma Ray [ppm]
B
R² = 0.4268
0
2
4
6
8
0 20 40 60 80
U [
pp
m]
Total Gamma Ray [ppm]
B
R² = 0.1084
0
0.5
1
1.5
2
0 20 40 60 80
K %
Total Gamma Ray [ppm]
A
R² = 0.1104
0
1
2
3
4
5
6
7
0 20 40 60 80
Th [
pp
m]
Total Gamma Ray [ppm]
C