thermodynamic properties using armfield th3 apparatus
TRANSCRIPT

qwertyuiopasdfghjklzxcvbnmqwertyuiopasdfghjklzxcvbnmqwertyuiopasdfghjklzxcvbnmqwertyuiopasdfghjklzxcvbnmqwertyuiopasdfghjklzxcvbnmqwertyuiopasdfghjklzxcvbnmqwertyuiopasdfghjklzxcvbnmqwertyuiopasdfghjklzxcvbnmqwertyuiopasdfghjklzxcvbnmqwertyuiopasdfghjklzxcvbnmqwertyuiopasdfghjklzxcvbnmqwertyuiopasdfghjklzxcvbnmqwertyuiopasdfghjklzxcvbnmqwertyuiopasdfghjklzxcvbnmqwertyuiopasdfghjklzxcvbnmqwertyuiopasdfghjklzxcvbnmqwertyuiopasdfghjklzxcvbnmqwertyuiopasdfg
Thermodynamic properties using Armfield TH3 apparatus
8/12/2015
Awejok, Tejwok Simon

Table of content
1. Aim……………………………….
2. Introduction……………………..
3. Apparatus………………………..
4. Table and Graph….……………
5. Calculations…………………….
6. Discussions……………………..
7. Conclusion and Recommendation
8. Reference ………………………….

Aim
In this lap experiment we aim to find the relationship between liquid and vapour through observing temperature and pressure of the fluid, water
Procedures1. Half full tank of water2. Heat the water and allow pressure of 700KN m /7 Bar3. The aim is pressure against temperature;
So for every 30 seconds the blowdown valve is open and then close so that the temperature and pressure drop can be recorded
This procedure is done 4 times dissentingly 30 sec ½ the heat flow is drop from 700-600 pressure ¼ (600-300) 1/8 (300-150) then finally every 60 seconds pressure drop recorded (150-20)
Where at the point of (150 to 20) the pressure drop slows the temperature decrease is slow
4. To get the temperature in the below table a resistance thermometer chart is given that has Temperature Y-axis / Resistance X-axis
Introduction

This experiment was conducted to determine Liquids and vapour(Gas) that are states of matter which are indirectly proportion to each other, as temperature is applied the liquid changes to vapour “evaporation”. Increase in temperature increases the vapour pressure; Decrease of temperature reduces vapour pressure that’s liquid.
Gauge pressure –is relatively measure of the atmospheric pressure that (101,309 Atm)Absolute pressure-is an exact pressure at which the object is set on (i.e Vacuum). Pressure values were recorded each time the valve was left open for 30 seconds And the temperature values (Y-axis) could be collected from resistance chart (X-axis).
Apparatus;

Saturation pressure unit
Table and Graphs
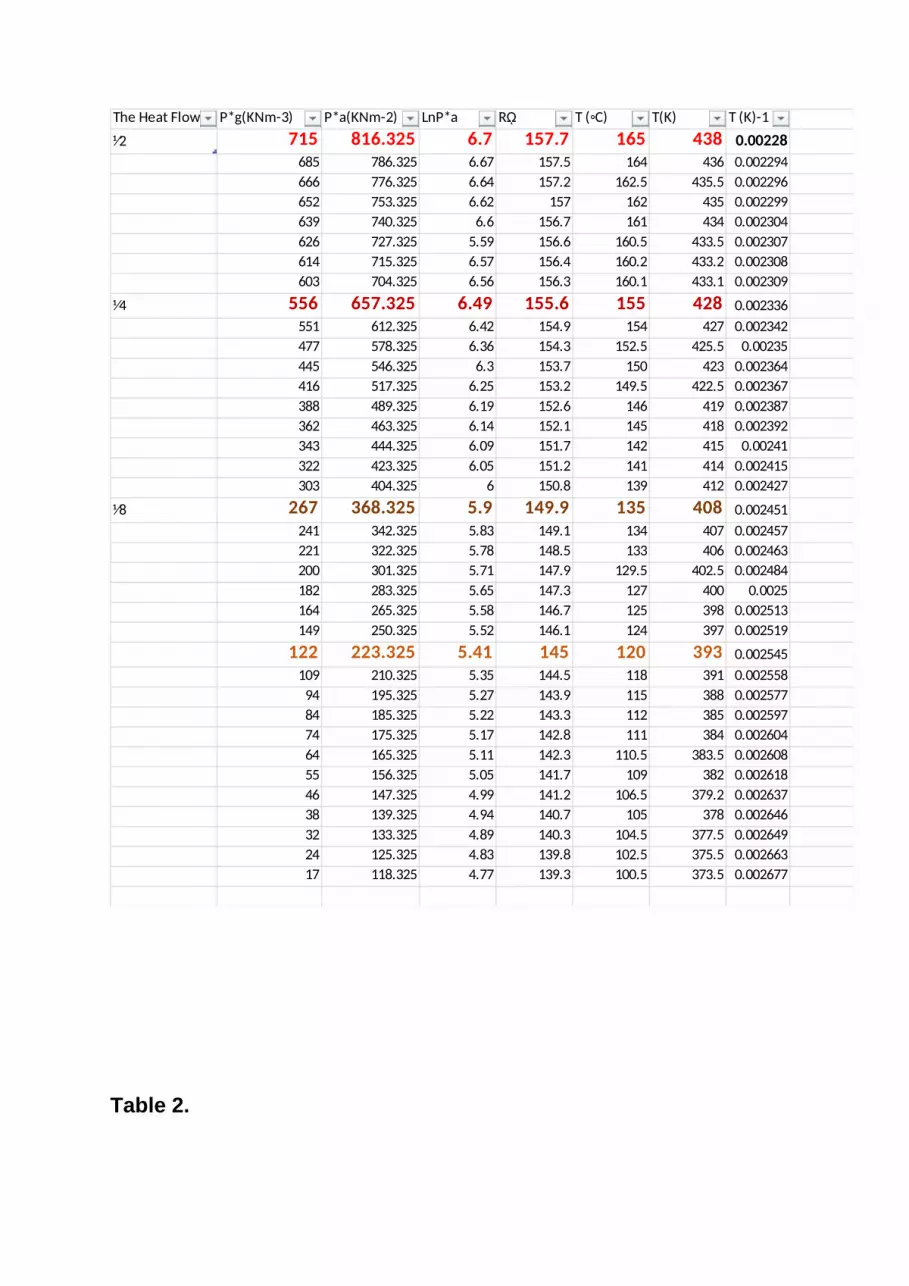
The Heat Flow P*g(KNm-3) P*a(KNm-2) LnP*a Rῼ T (◦C) T(K) T (K)-1
⅟2 715 816.325 6.7 157.7 165 438 0.00228685 786.325 6.67 157.5 164 436 0.002294666 776.325 6.64 157.2 162.5 435.5 0.002296652 753.325 6.62 157 162 435 0.002299639 740.325 6.6 156.7 161 434 0.002304626 727.325 5.59 156.6 160.5 433.5 0.002307614 715.325 6.57 156.4 160.2 433.2 0.002308603 704.325 6.56 156.3 160.1 433.1 0.002309
⅟4 556 657.325 6.49 155.6 155 428 0.002336551 612.325 6.42 154.9 154 427 0.002342477 578.325 6.36 154.3 152.5 425.5 0.00235445 546.325 6.3 153.7 150 423 0.002364416 517.325 6.25 153.2 149.5 422.5 0.002367388 489.325 6.19 152.6 146 419 0.002387362 463.325 6.14 152.1 145 418 0.002392343 444.325 6.09 151.7 142 415 0.00241322 423.325 6.05 151.2 141 414 0.002415303 404.325 6 150.8 139 412 0.002427
⅟8 267 368.325 5.9 149.9 135 408 0.002451241 342.325 5.83 149.1 134 407 0.002457221 322.325 5.78 148.5 133 406 0.002463200 301.325 5.71 147.9 129.5 402.5 0.002484182 283.325 5.65 147.3 127 400 0.0025164 265.325 5.58 146.7 125 398 0.002513149 250.325 5.52 146.1 124 397 0.002519
122 223.325 5.41 145 120 393 0.002545109 210.325 5.35 144.5 118 391 0.002558
94 195.325 5.27 143.9 115 388 0.00257784 185.325 5.22 143.3 112 385 0.00259774 175.325 5.17 142.8 111 384 0.00260464 165.325 5.11 142.3 110.5 383.5 0.00260855 156.325 5.05 141.7 109 382 0.00261846 147.325 4.99 141.2 106.5 379.2 0.00263738 139.325 4.94 140.7 105 378 0.00264632 133.325 4.89 140.3 104.5 377.5 0.00264924 125.325 4.83 139.8 102.5 375.5 0.00266317 118.325 4.77 139.3 100.5 373.5 0.002677
Table 2.

Resistance thermometer chart
Graph

0.0022 0.0023 0.0024 0.0025 0.0026 0.0027 0.00280
1
2
3
4
5
6
7
8
Ln(P*a)Linear (Ln(P*a))Series4Linear (Series4)
Temperature
Ln P
ress
ure
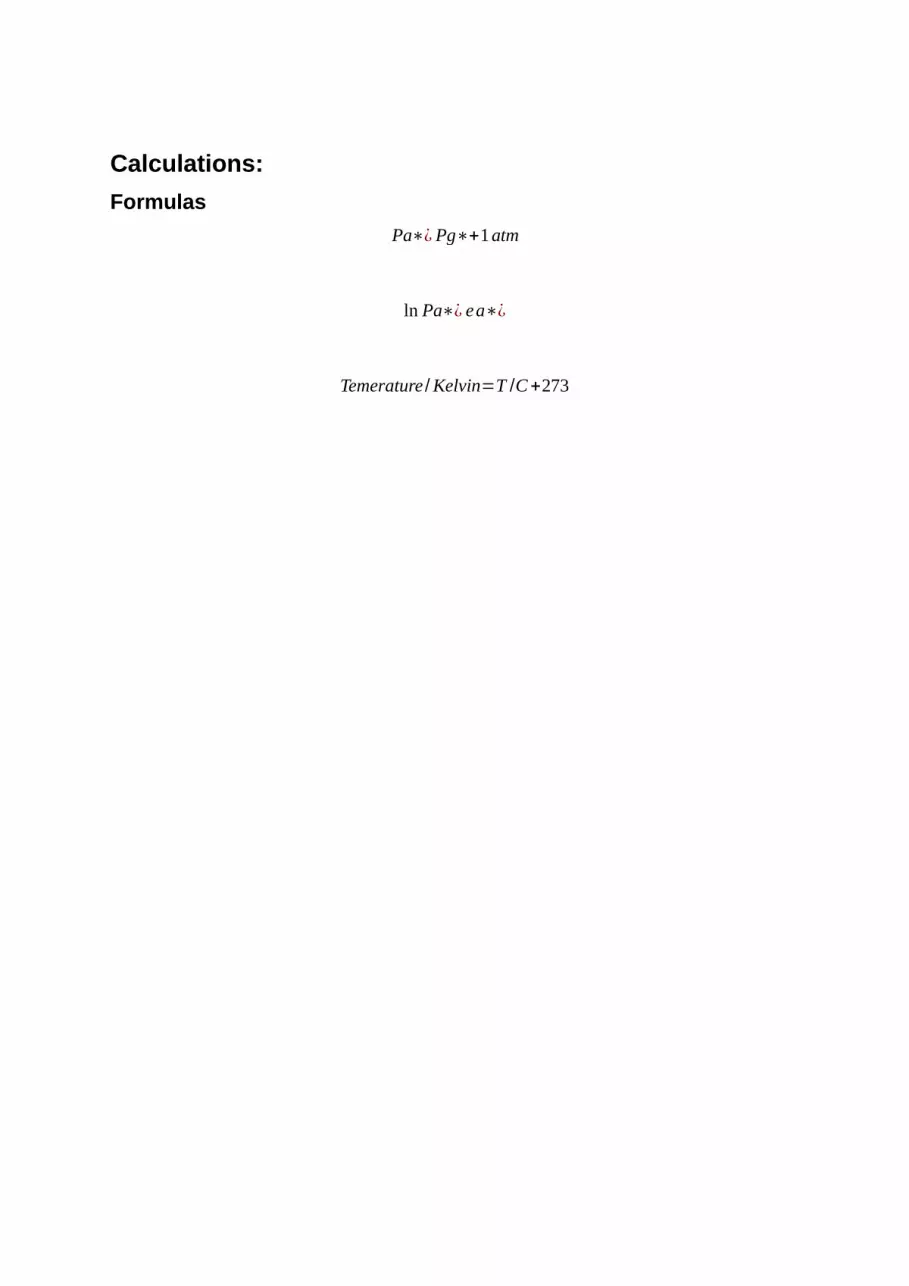
Calculations:Formulas
Pa∗¿ Pg∗+1atm
ln Pa∗¿ ea∗¿
Temerature /Kelvin=T /C+273

Possible Errors, Discussion and Conclusion
The measurement of the gauge pressure wasn’t Absolut 7 bars accurate due to heat input and surrounding temperature that could not be possibly stabled
The conducted experiment has laid out the above graph The pressure is directly proportional to temperature “increase
in temperature increased pressure” The four points was achieved in the graph The Absolut pressure is the gauge pressure plus atmospheric
pressure while the Ln P was the log of absolute pressure Temperature in kelvin was T/0C + 273 and Divided by -1 For every 30 sec the valve was open and close to take reading
and a point the heat could be educe to half or a quota why by inaccuracy of quick reflex could achieved accurate as possible
In conclusion to this experiment its help us learn about understanding the effect of two phase temperature , Reponses of accurate collecting and absolute and gauge pressure.
References
2015. Gauge pressure vs. Absolute pressure. [ONLINE] Available at: http://physics.stackexchange.com/questions/20460/gauge-pressure-vs-absolute-pressure
TH3: Saturation pressure. [ONLINE] Available at: http://discoverarmfield.com/en/products/view/th3/saturation-pressure. [Accessed 15 December 15].
