there is a steady-state transcriptome in exponentially growing yeast cells
TRANSCRIPT

YeastYeast 2010; 27: 413–422.Published online 17 March 2010 in Wiley InterScience(www.interscience.wiley.com) DOI: 10.1002/yea.1768
Research Article
There is a steady-state transcriptome in exponentiallygrowing yeast cells
Vicent Pelechano# and Jose E. Perez-Ortın*Departamento de Bioqu ımica y Biolog ıa Molecular, Facultad de Ciencias Biologicas, Universitat de Valencia, C/Dr. Moliner 50, 46100Burjassot, Spain
*Correspondence to:Jose E. Perez-Ort ın,Departamento de Bioqu ımica yBiolog ıa Molecular, Facultad deCiencias Biologicas, Universitatde Valencia, C/Dr. Moliner 50,46100 Burjassot, Spain.E-mail: [email protected]
#Current address: EMBL,Meyerhofstrasse 1, Heidelberg,Germany.
Received: 29 October 2009Accepted: 10 February 2010
AbstractThe growth of yeast cells in batches in glucose-based media is a standard conditionin most yeast laboratories. Most gene expression experiments are done by taking thiscondition as a reference. Presumably, cells are in a stable physiological conditionthat can be easily reproduced in other laboratories. With this assumption, however,it is necessary to consider that the average amount of the mRNAs per cell formost genes does not change during exponential growth. That is to say, there is asteady-state condition for the transcriptome. However, this has not been rigorouslydemonstrated to date. In this work we take several cell samples during the exponentialphase growth to perform a kinetic study using the genomic run-on (GRO) technique,which allows simultaneous measurement of the amount of mRNA and transcriptionrate variation at the genomic level. We show here that the steady-state conditionis fulfilled for almost all the genes during most exponential growth in yeastextract–peptone–dextrose medium (YPD) and, therefore, that simultaneous measuresof the transcription rates and the amounts of mRNA can be used for indirect mRNAstability calculations. With this kinetic approach, we were also able to determine therelative influence of the transcription rate and the mRNA stability changes for themRNA variation for those genes that deviate from the steady state. Copyright 2010John Wiley & Sons, Ltd.
Keywords: transcription rate; steady state; transcriptome; Saccharomyces cere-visiae; mRNA stability
Introduction
Evaluation of the amount of mRNA (RA) for agiven gene by means of northern blot, qPCR orother techniques is a routine in many molecu-lar biology experimental protocols. Comparisonsbetween different physiological situations or be-tween different cell types or mutants are habitu-ally studied. As a significant number of mRNAscan vary their concentrations, even upon subtlechanges in internal or external conditions, it iscrucial to sample cells in identical situations inorder to guarantee repetitiveness and comparative-ness between experiments. This is especially truefor batch cultures of free-living microorganisms
where the growth rate and environment are con-tinuously changing. This problem can be solved byusing continuous culture conditions, but such con-ditions are more technically demanding. Therefore,most published experiments use batch conditions.For most batch culture analyses, researchers selectexponential growth in a rich medium as the defaultstate for comparison, as it is usually thought to be aphysiologically constant condition in which most,or all, mRNAs remain unchanged in a steady-statecondition. This can facilitate comparisons betweenexperiments done in different laboratories. How-ever, because the emergence of genomic techniqueshas raised the possibility of simultaneously quanti-fying most cellular mRNAs at the same time, the
Copyright 2010 John Wiley & Sons, Ltd.

414 V. Pelechano and J. E. Perez-Ortın
need for a rigorous demonstration of the steady-state condition now extends to thousands of genes.
One of the most studied organisms in func-tional genomics is the yeast Saccharomyces cere-visiae. There are hundreds of experiments onthis yeast using cells growing on YPD (yeastextract–peptone–dextrose) complete medium inthe ‘exponential growth condition’. It is known,however, that many genes vary during exponen-tial growth when cells approach the diauxic shift(DeRisi et al., 1997) or change in a growth rate-dependent manner (Regenberg et al., 2006). Asstated above, the use of chemostats has beendescribed as a more reliable way to avoid such vari-ations because they keep culture conditions stable(Daran-Lapujade et al., 2009; Hayes et al., 2002).However, most yeast researchers have used, andstill use, the exponential growth condition in batchcultures for their experiments.
Although the majority of studies focus only onthe determination of RA, it is becoming increas-ingly clear that gene expression should be stud-ied as a kinetic process in which the amount ofmRNA is controlled not only by transcription butalso by the influence of mRNA stability (RS, alsocalled mRNA half-life; Perez-Ortın et al., 2007). Inexponential growth a dynamic steady state can beassumed for RA, i.e. the transcription and degrada-tion rates (TR and DR, respectively) are equal. TRfollows a zero-order kinetics (does not depend onRA), whereas DR follows first-order kinetics:
DR = kd RA
Therefore, in steady state:
TR = DR = kd RA
where kd is the degradation constant, which isinversely related to RS (kd = ln 2/RS ). Thus, in thissituation, TR can be calculated from experimentallydetermined RA and stability data (Holstege et al.,1998); alternatively, DR can be calculated from RAand TR data (Garcıa-Martınez et al., 2004). Bothapproaches are becoming increasingly popular forTR or DR calculations, although it has not yet beenestablished whether the true steady-state conditionfor gene expression actually applies (Perez-Ortın,2007). A steady state defined for RA does notnecessarily imply steady states for TR and DR. Infact, it would be theoretically possible for TR and
DR to change simultaneously in parallel, keepingRA constant.
In this paper we address the topic of assessingthe steady-state condition for mRNA amounts inS. cerevisiae cells growing in YPD at the expo-nential phase. First we performed an experimentto determine whether the steady state applies foryeast in which we simultaneously measure TR andRA for all the genes. We also studied the kineticbehaviour of any gene that seems to deviate from it.In this way we have demonstrated that the steady-state condition for RA is true for most of the genesstudied, but that there are small but significantchanges in some groups of genes, which changeeither their TR or DR as the culture approachesthe diauxic shift. Because TR also remains almostinvariable, we can say that there is also a steadystate for TR and DR. Finally, we reanalysed pre-viously published data (Radonjic et al., 2005) toexpand the time window of our study and to deter-mine how long the steady-state condition is main-tained. We found that the RA steady state is ful-filled over a long period within the exponentialphase.
Materials and methods
Yeast strain and growth conditions
Yeast strain BQS252 (MAT a, ura3-52 ; derived bysporulation from FY1679) was used. Cells weregrown in YPD (yeast extract 1%, peptone 2%, andglucose 2%) with agitation (190 rpm) at 28 ◦C forthe repeated sampling of exponentially growingyeast cells. Cell cultures were grown overnightuntil they reached the desired OD600. Five timepoints were taken at 0, 10, 20, 30 and 40 minafter the initial sample, which corresponded toOD600 = 0.36 (8 × 10⁶ cells/ml), 0.38, 0.41, 0.44and 0.47, respectively. Three biological replicatesof the whole experiment were done.
Genomic run-on (GRO)
The GRO was done essentially as described inGarcıa-Martınez et al. (2004). Briefly, two aliquotsof ca. 4 × 10⁸ cells were harvested at each timepoint. One aliquot was used directly for the GROprotocol, in order to obtain TR data, while theother one was frozen for subsequent total RNAextraction. The cells of the GRO sample were
Copyright 2010 John Wiley & Sons, Ltd. Yeast 2010; 27: 413–422.DOI: 10.1002/yea

Steady-state transcriptome in exponentially growing yeast cells 415
permeabilized with 0.5% Sarkosyl and incubatedfor 20 min on ice. Then the cells were allowed toextend the nascent RNA in the presence of [α-33P]-UTP. Finally, the radioactively labelled RNA wasextracted and hybridized onto a nylon macroarray(Alberola et al., 2004). After TR determination, thetotal RNA sample was labelled by cDNA synthesiswith random hexamers and hybridized in the samearrays in order to determine the RA.
Image analysis and data normalization
Images were quantified using Array Vision soft-ware, v. 7.0 (Imaging Research Inc.). The signalintensity for each spot was the background sub-tracted ARM (artifact removed median) density.Only values that were 1.35 times over the cor-responding background were taken as valid mea-surements. The reproducibility of the replicateswas checked using Array Stat software (ImagingResearch Inc.). We considered the data to be inde-pendent and used a minimum number of two validreplicates in order to calculate the mean and stan-dard deviation (SD) values for every gene. Nor-malization between conditions was done using theglobal median method.
Data analysis
We used the differential gene expression anal-ysis program from the GEPAS suite (Montaneret al., 2006) to analyse whether there was anysignificantly different slope from 0 for the varia-tion of RA during exponential growth (Radonjicet al., 2005) with regard to a continuous indepen-dent variable (time). Similar results were obtainedwhen the culture OD600 was used as a continuousindependent variable instead of the time (data notshown).
The detailed RA and TR data for exponentialgrowth between OD600 0.36 and 0.47 was cal-culated as previously described (Garcıa-Martınezet al., 2004; for the whole dataset, see Support-ing information, Table S1). Briefly, the intensity ofthe mRNA or GRO hybridization was normalizedusing a genomic DNA hybridization signal and theU-richness (GRO) or C-richness (mRNA) correc-tion. We computed the slope of RA and TR varia-tions on a log2 scale with regard to time by assum-ing that the median TR and RA of the gene popula-tion remained constant during the experiment (see
Supporting information, Table S2). Gene functionalanalyses were done by analysing either individualgenes slopes (using FuncAssociate; Berriz et al.,2003) or gene sets (using Fatiscan from the BABE-LOMICS suite; Al-Shahrour et al., 2006). To anal-yse the changes in RS, we computed a theoreti-cal RA variation dataset for all the genes, usingthe RA amount data obtained for the first timepoint and the experimentally obtained TR datafor the whole experiment. Using these data, it ispossible to calculate a theoretical RA for eachpoint by assuming that the RS calculated the firsttime remains constant during the whole experiment(Perez-Ortın et al., 2007). We compared the dif-ferences between this theoretically computed RAand the actual one, and assumed that the differ-ences found would be due to stability changesduring the experiment (see Figure 1A). To obtaina more robust RA variation, we performed a lin-ear regression analysis of the actual and theoreticalRA data and computed the predicted RA varia-tion for each gene during our experiment, usingall the time points. Finally, we computed the per-centage of actual RA variation and the theoreticalone (TR-dependent RA variation) for each gene.The difference between the actual and the theoret-ical RA directly gives the stability-dependent RAvariation.
Accession numbers
The genomic data are stored in the ValenciaYeast (VYdBase; http://vydbase.uv.es/) and GEOdatabases. The GEO Accession No. for the set ofdifferent hybridizations is GSE11521.
Results
Verification of the steady state for mRNAon yeast cells using genomic run-on (GRO)analyses
To determine whether the yeast transcriptome wasin a steady-state condition during the exponentialphase on the YPD medium, we measured the vari-ation of mRNA at five time points during exponen-tial growth. As most of the published experimentsstart with a very low OD600 after inoculation andreach a middle exponential phase of 0.3–0.6 atOD600, we decided to monitor the mRNA varia-tion under these conditions. We also used our GRO
Copyright 2010 John Wiley & Sons, Ltd. Yeast 2010; 27: 413–422.DOI: 10.1002/yea

416 V. Pelechano and J. E. Perez-Ortın
Figure 1. Relative contributions of the transcription rate (TR) and mRNA stability (RS) to the mRNA amount (RA)change. (A) Scheme of the protocol used to compute the mRNA variation, which is dependent in either TR or RS. Thetheoretical RA values in the experiment were computed for each gene by taking in account only the TR variations andby assuming a constant RS (in black). When comparing this theoretical TR-dependent RA change with the actual one(experimentally measured, in grey), it is possible to compute the percentage of RA variation for each gene, which isdue to changes in either TR or RS. The data shown correspond to a sample gene (YAL004W) that has been chosento show an important contribution of RS to RA variation. It is shown in natural scale to make the differences moreevident. However its RA slope does not reach the significance cut-off for being statistically different from 0 (in eithernatural or log2 scale; FDR p value >0.8). (B) Relative contribution of TR (light grey) or RS (dark grey) to the total RAvariation (black) for selected gene groups shown in Table 1. Bars represent the median value for the variation for allthe genes in each group. The groups with significant differences from 0 (as shown in Tables 1 and S3) are marked withblack dots
protocol, which allows the simultaneous determi-nation of TR and RA data. In this way, if thesteady-state condition was verified, we could alsocalculate the mRNA stabilities from the RA andTR data (Garcıa-Martınez et al., 2004).
We performed an experiment in triplicate forthe five time points at OD600 0.36–0.47 (span-ning 40 min, at 10 min intervals), using culturesinoculated 16 h beforehand. Under these condi-tions, the diauxic shift started several hours laterat OD600 ≈ 2 (V. Pelechano, unpublished observa-tion). All 15 samples were subjected to the GROprotocol for calculating RA and TR. The repetitive-ness of the samples was very good (see Supportinginformation, Figure S1). Pearson’s correlation was,on average, 0.934 for the TR data and 0.936 forthe RA data between the biological replicates. Thecorrelation for the data points for a single growthcurve was even better: 0.965 for TR and 0.964for RA. This suggests that there is more biolog-ical variation between growth curves in differentexperiments than within the time points of a sin-gle exponential phase curve. However, as we fusedthe different replicates, only the time-dependent
variations (common for all three experiments) weretaken into account.
We reasoned that the slight changes occurringduring growth in the culture composition wouldaffect the cells’ physiology, leading to a continuouschange in RA or TR, which would be visible aspositive or negative slopes in their respective plots.In this way, artifactual or random changes wouldnot be accounted for. However, when we analysedthese data using the GEPAS suite (a differentialexpression analysis tool; Montaner et al., 2006), noindividual slope of any gene differed significantlyfrom zero (FDR >0.6). This result confirms thatthe steady-state condition applies for all (at leastmost of) the yeast genes. Therefore, no importanterror is associated when taking samples for mRNAquantification from cells growing in the earlyexponential phase. Thus, either TR or RS can becalculated in these growth conditions from the RAexperimental data and either from the respective RSdata, measured by conventional methods (Grigullet al., 2004), or from the TR data, measuredby GRO by means of mathematical calculations(Perez-Ortın, 2007).
Copyright 2010 John Wiley & Sons, Ltd. Yeast 2010; 27: 413–422.DOI: 10.1002/yea
Steady-state transcriptome in exponentially growing yeast cells 417
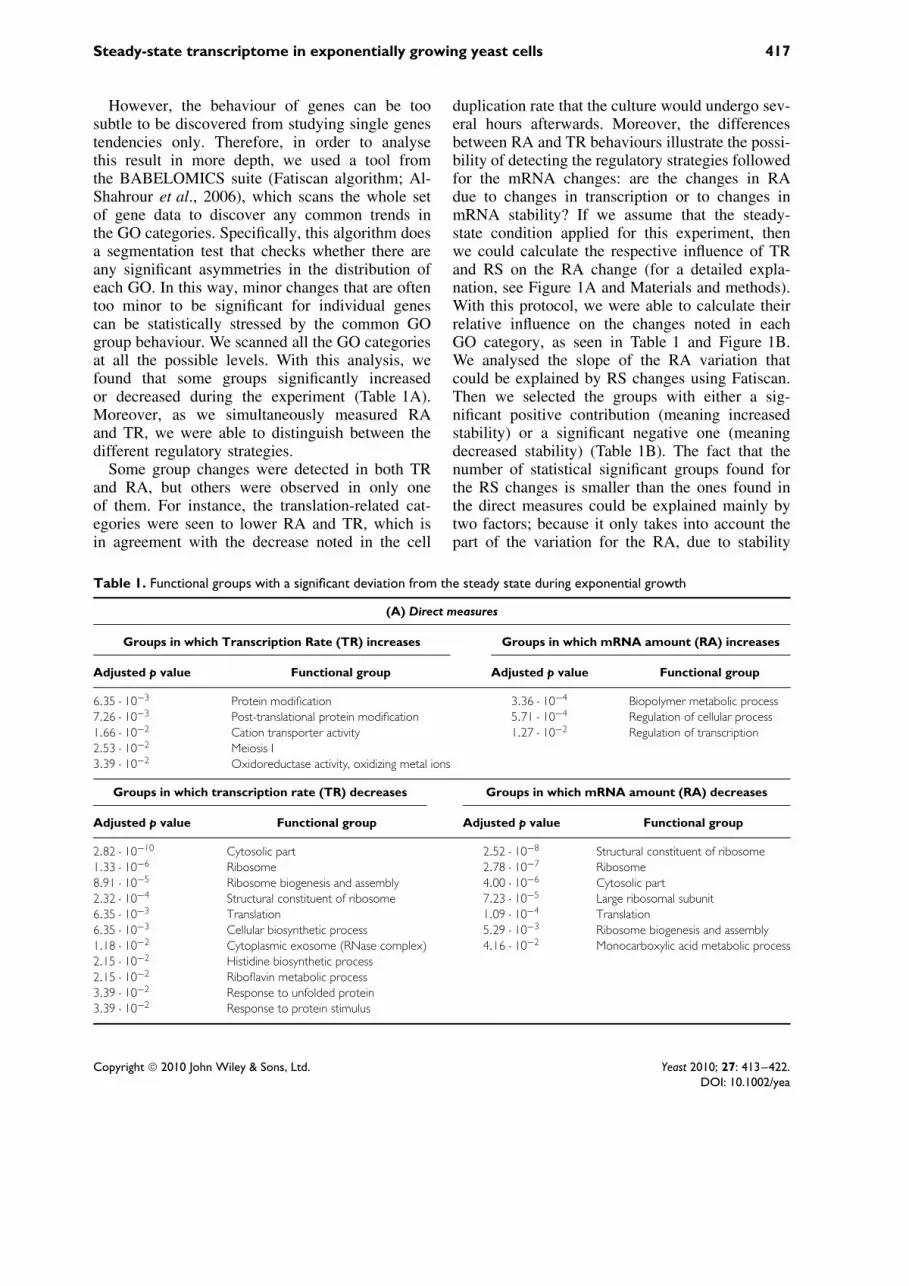
However, the behaviour of genes can be toosubtle to be discovered from studying single genestendencies only. Therefore, in order to analysethis result in more depth, we used a tool fromthe BABELOMICS suite (Fatiscan algorithm; Al-Shahrour et al., 2006), which scans the whole setof gene data to discover any common trends inthe GO categories. Specifically, this algorithm doesa segmentation test that checks whether there areany significant asymmetries in the distribution ofeach GO. In this way, minor changes that are oftentoo minor to be significant for individual genescan be statistically stressed by the common GOgroup behaviour. We scanned all the GO categoriesat all the possible levels. With this analysis, wefound that some groups significantly increasedor decreased during the experiment (Table 1A).Moreover, as we simultaneously measured RAand TR, we were able to distinguish between thedifferent regulatory strategies.
Some group changes were detected in both TRand RA, but others were observed in only oneof them. For instance, the translation-related cat-egories were seen to lower RA and TR, which isin agreement with the decrease noted in the cell
duplication rate that the culture would undergo sev-eral hours afterwards. Moreover, the differencesbetween RA and TR behaviours illustrate the possi-bility of detecting the regulatory strategies followedfor the mRNA changes: are the changes in RAdue to changes in transcription or to changes inmRNA stability? If we assume that the steady-state condition applied for this experiment, thenwe could calculate the respective influence of TRand RS on the RA change (for a detailed expla-nation, see Figure 1A and Materials and methods).With this protocol, we were able to calculate theirrelative influence on the changes noted in eachGO category, as seen in Table 1 and Figure 1B.We analysed the slope of the RA variation thatcould be explained by RS changes using Fatiscan.Then we selected the groups with either a sig-nificant positive contribution (meaning increasedstability) or a significant negative one (meaningdecreased stability) (Table 1B). The fact that thenumber of statistical significant groups found forthe RS changes is smaller than the ones found inthe direct measures could be explained mainly bytwo factors; because it only takes into account thepart of the variation for the RA, due to stability
Table 1. Functional groups with a significant deviation from the steady state during exponential growth
(A) Direct measures
Groups in which Transcription Rate (TR) increases Groups in which mRNA amount (RA) increases
Adjusted p value Functional group Adjusted p value Functional group
6.35 · 10−3 Protein modification 3.36 · 10−4 Biopolymer metabolic process7.26 · 10−3 Post-translational protein modification 5.71 · 10−4 Regulation of cellular process1.66 · 10−2 Cation transporter activity 1.27 · 10−2 Regulation of transcription2.53 · 10−2 Meiosis I3.39 · 10−2 Oxidoreductase activity, oxidizing metal ions
Groups in which transcription rate (TR) decreases Groups in which mRNA amount (RA) decreases
Adjusted p value Functional group Adjusted p value Functional group
2.82 · 10−10 Cytosolic part 2.52 · 10−8 Structural constituent of ribosome1.33 · 10−6 Ribosome 2.78 · 10−7 Ribosome8.91 · 10−5 Ribosome biogenesis and assembly 4.00 · 10−6 Cytosolic part2.32 · 10−4 Structural constituent of ribosome 7.23 · 10−5 Large ribosomal subunit6.35 · 10−3 Translation 1.09 · 10−4 Translation6.35 · 10−3 Cellular biosynthetic process 5.29 · 10−3 Ribosome biogenesis and assembly1.18 · 10−2 Cytoplasmic exosome (RNase complex) 4.16 · 10−2 Monocarboxylic acid metabolic process2.15 · 10−2 Histidine biosynthetic process2.15 · 10−2 Riboflavin metabolic process3.39 · 10−2 Response to unfolded protein3.39 · 10−2 Response to protein stimulus
Copyright 2010 John Wiley & Sons, Ltd. Yeast 2010; 27: 413–422.DOI: 10.1002/yea

418 V. Pelechano and J. E. Perez-Ortın
Table 1. Continued
(B) Indirect measures
Groups in which mRNA stability (RS) increases Groups in which mRNA stability (RS) decreases
Adjusted p value Functional group Adjusted p value Functional group
1.07 · 10−5 Biopolymer metabolic process 2.06 · 10−3 Organic acid metabolic process2.06 · 10−3 Regulation of biological process 2.06 · 10−3 Carboxylic acid metabolic process2.86 · 10−3 Regulation of cellular process
(A) Functional groups with significant slopes for experimentally determined (direct measures) TR or RA along the five time points analysedduring early exponential growth. (B) Functional groups with a significantly high contribution of RS to the RA increase or decrease (mRNAstabilization or destabilization, respectively). The RS-dependent RA slope was mathematically computed (indirect measures), as explained inFigure 1A, and used for the functional analysis. Only some representative GO are shown (for the complete list, see Supporting information,Table S3). All the analyses were done using the Fatiscan algorithm from BABELOMICS (Al Shahrour et al., 2006); the FDR-adjusted p valuesare shown.
changes, and because it is an indirect measure.The fact of being an indirect measure dependingon the TR and RA data makes it more noisy (infact the SD for the RS-dependent RA slopes islarger (0.0074) than that from TR or RA directmeasures (0.0058 and 0.0057, respectively). It canbe seen that both TR and RS cooperate to eitherlower or increase RA for most categories; that is tosay, homodirectional changes occurred, although invariable proportions. In some groups, however, thechanges observed operated in opposite senses. RiBigenes had a decreased RA, due to a large effecton TR that compensated slight mRNA stabiliza-tion, whereas unfolded protein response mRNAsincreased because of strong mRNA stabilization,despite a certain decrease in TR. It is important tonote that all these changes were very subtle, andcould be taken in account only for those GOs inwhich significant changes for the kinetic param-eters had been previously detected. These resultsillustrate the variable methods used by the yeastcell to change the mRNA level (Perez-Ortın et al.,2007).
Determination of the time windowwhen assuming the steady state for mRNAsin yeast cells growing in the exponential phase
As our experiment covered only a relatively smalltime window of exponential phase growth in yeast(OD600 = 0.3–0.5), we decided to assess whetherthis steady state for the transcriptome is maintainedin later phases of exponential growth. To deter-mine this, we reanalysed the data from the com-prehensive study of Radonjic et al. (2005). In their
experiment, the authors analysed the transcriptomeof wild-type yeast (S288c background) growing ina batch culture in YPD since the inoculation onfresh medium to the late stationary phase. They useOD600 = 0.5 as the starting condition, which pre-cludes a direct comparison with our conditions. Thegrowth curve included nine experimental points inthe exponential phase in the range 3.9–9 h afterinoculation (see Figure 1A from Radonjic et al.,2005). This study measured only the RA changes,but this is enough to check the steady-state condi-tion. First, we analysed this data using the GEPASsuite (a differential expression analysis tool; Mon-taner et al., 2006). Probably because the analysedtime window in this experiment is longer, coveringmore physiological variations, the number of geneswith a slope different from zero (FDR <0.01) washigher. We obtained 304 genes showing a posi-tive slope, and 271 showing a negative slope whentheir log2 RA data were plotted against the timecourse (Figure 2A). They were enriched in someGO categories. Specifically, the mRNA levels ofthose categories related with respiration and pro-tein catabolism increased, unlike the mRNA levelsof those categories related to ribosome biogenesis,which decreased (Figure 2B). Both results fitted theexpected changes in cell metabolism, which wouldtake place when entering the diauxic shift somehours later (DeRisi et al., 1997; Radonjic et al.,2005), and they are in agreement with the slightchanges detected in our previous experiment. Aclose inspection of the results, however, showedthat most of the changes noted in relation to theinitial exponential phase at 3.9 h in those genestook place at the last two time points analysed,
Copyright 2010 John Wiley & Sons, Ltd. Yeast 2010; 27: 413–422.DOI: 10.1002/yea

Steady-state transcriptome in exponentially growing yeast cells 419
Figure 2. mRNA amount variation during exponential growth. (A) Histogram of slopes for the mRNA amount (RA)variation (in log2 scale for arbitrary units) as a function of time (min) for the 3.9–9 h interval, according to Radonjic et al.(2005). The distribution of all the gene slopes is shown as a black line. Bars represent the genes with slopes that significantlydiffer (positively in dark grey and negatively in light grey) from 0 (FDR <0.01). The y axis represents the percentage ofgenes, with regard to the total number analysed, belonging to each class. (B) The gene groups that are significantly enrichedin genes that increase or decrease RA. Significance was calculated using FuncAssociate (Berriz et al., 2003) Only the mostrepresentative GO categories are shown
Table 2. Change in the mRNA amount slope during exponential growth
Functional group 3.9–4.75 h 4–5.25 h 4.25–5.75 h 4.75–6.5 h 5.25–7.25 h 5.75–9 h
Cytoplasm ↑ 2.29 · 10−8 ↑ 9.53 · 10−8 ↑ 2.76 · 10−5 ↑ 2.05 · 10−7 ↑ 3.35 · 10−16 ↑ 1.14 · 10−6
Mitochondrial part ↑ 3.42 · 10−4 — — ↑ 3.78 · 10−10 ↑ 2.88 · 10−16 ↑ 5.54 · 10−12
Oxidoreductase activity ↑ 2.31 · 10−6 — — — ↑ 4.72 · 10−4 ↑ 2.03 · 10−7
Alcohol metabolic process ↑ 6.73 · 10−3 — — — — ↑ 5.55 · 10−3
Response to unfoldedprotein
↑ 4.67 · 10−3 — — — ↑ 3.07 · 10−9 ↑ 4.12 · 10−3
Response to stress — — — — ↑ 1.56 · 10−3 ↑ 5.18 · 10−3
Integral to membrane ↑ 1.34 · 10−5 ↑ 1.00 · 10−7 ↑ 6.59 · 10−4 ↓ 4.44 · 10−4 — —Ribosome biogenesis andassembly
↓ 7.85 · 10−12 ↓ 4.75 · 10−6 — ↓ 1.21 · 10−3 ↓ 5.56 · 10−24 ↓ 1.05 · 10−28
Structural constituent ofribosome
↓ 6.20 · 10−3 — — — ↓ 1.17 · 10−17 ↓ 8.83 · 10−3
Translation ↓ 6.09 · 10−4 — — — ↓ 1.59 · 10−12 ↓ 1.97 · 10−6
Nucleus ↓ 8.04 · 10−14 ↓ 2.04 · 10−6 — — ↓ 3.13 · 10−8 ↓ 1.83 · 10−6
Gene-set enrichment analysis using Fatiscan (Al Shahrour et al., 2006) according to the RA slopes at different intervals during exponentialgrowth (Radonjic et al., 2005). The categories which increase RA (↑, enriched in the positive slopes) are shown in bold type, and the categorieswhich decrease RA (↓, enriched in the negative slopes) are depicted in normal type. All the slopes were computed using four time points.Only some representative functional groups are shown.
i.e. at 7.25 and 9 h after inoculation. When weconsidered only the first seven time points, from3.9 to 6.5 h, no gene’s slope significantly differedfrom zero when we used the same criteria. Thisresult confirms that the time window in which asteady state for the transcriptome can be widelyassumed is extended to up a couple of hours beforethe diauxic shift.
In order to confirm the small deviations fromthe steady state that we were able to calculatein our previous experiment, we used the samegene set enrichment analysis (Fatiscan algorithm;Al-Shahrour et al., 2006) to detect the groups ofthe related genes showing slight but significantchanges in their RA in the Radonjic et al. (2005)data. Table 2 shows how the RA of some GO
Copyright 2010 John Wiley & Sons, Ltd. Yeast 2010; 27: 413–422.DOI: 10.1002/yea

420 V. Pelechano and J. E. Perez-Ortın
categories tended to increase (↑, bold numbers) ordecrease (↓) along the growth curve. As expected,the respiration and stress response categories weresignificantly represented in the RA increase, whilethe translation categories were significantly repre-sented in the RA decrease.
Therefore, although we conducted a kineticallydetailed study of the transcriptome only duringmid-exponential growth, these results confirm thatour conclusions can be extrapolated to most of theexponential growth phase.
Discussion
It is commonly assumed that mRNAs are approxi-mately in a steady state during exponential growthin a free-living microorganism. For instance, wehave used this assumption in order to calculatethe mRNA stabilities in the yeast S. cerevisiaeby means of GRO experiments (Garcıa-Martınezet al., 2004). However, an experimental demonstra-tion is currently lacking.
Here we report a detailed study of the geneexpression in yeast during exponential growth. Inthis experiment we simultaneously checked bothRAs and TRs. The general conclusion is that asteady state for the transcriptome and transcriptionrates can be assumed, and that small deviationsfrom it can be detected, but only when lookingat all the genes from a given GO at the sametime. This last analysis procedure is much moresensitive because it detects common tendenciesfor a group of related genes. However, when weanalysed them individually, each yeast gene waswithin the steady-state condition for its mRNA.In addition, our kinetically orientated approachenables us to determine the respective contributionsof TR and RS to the putative changes in RA.For most cases, both changes work in the samedirection. However, certain exceptions indicatehow the cell uses mRNA stability as an additionalcontroller of the gene expression. Moreover, thedemonstration of steady state for TR allows theconclusion that the cells keep the RA valuesconstant by also maintaining constant turnover, notby coordinately changing TR and DR — a morecomplicated option but theoretically possible.
To extend our results and to determine howlong the steady state for the transcriptome canbe assumed during exponential growth, we used
data from a comprehensive microarray study byRadonjic et al. (2005), which is representative formany others. Using these data, we verified that thesteady-state condition is met by a sample seriesover a long period (for at least 3 h and up to 2 hbefore the diauxic shift). There is nevertheless asignificant tendency of the mRNAs related withthe growth rate (translation) to decrease and thegenes related to the diauxic shift (mitochondria)to increase. This probably reflects the cell’s earlyresponse to the forthcoming changes to take placein metabolism, and corroborates the suggestion thatyeast cells use a feed-forward strategy, anticipatinggrowth changes with gene expression changes(Levy and Barkai, 2009).
Having established that the steady-state condi-tion during exponential growth had been fulfilled,we can say that our protocol to calculate mRNAhalf-lives indirectly, as well as that used by otherauthors to calculate TR from the RA and RS data,have been verified. The correlations for direct andindirect computed TRs are about 0.5 (Perez-Ortın,2007). This is a significant correlation but is not ashigh as expected. There may be several reasons forthis: first, the mathematical error associated withindirect calculations; second, the error associatedwith the direct measurement of the mRNA half-life (see below). Both problems are unavoidableand will mostly introduce random noise into theindirect data and, therefore, decreased correlation.Another reason for the low correlation obtainedcould be that indirect TR measures the appear-ance of mature mRNA in the cytoplasm, whereasGRO (or other methods to estimate the TR, suchas RPCC (Pelechano et al., 2009), measures thedensity of RNA polymerases. Density can only beconverted into TR by assuming a constant RNApol II speed (Hirayoshi and Lis, 1999). Directmethods measure ‘nascent TR’, which can differfrom ‘mature TR’ (increase of mature, cytoplasmicmRNAs over time) if the proportion of produc-tive transcription (finished mRNAs) is not the samefor all the genes, or if the transport of mRNAs isnot equally efficient for them all. This discrepancy,however, is potentially interesting because it opensa way to determine the differences in transcriptionelongation or mRNA processing between differentgroups of genes.
The calculation of the RS data indirectly fromthe RA and TR data can also be compared withthose calculated by direct methods. In this case,
Copyright 2010 John Wiley & Sons, Ltd. Yeast 2010; 27: 413–422.DOI: 10.1002/yea

Steady-state transcriptome in exponentially growing yeast cells 421
no correlation exists (see Perez-Ortın, 2007). Thisresult is surprising and suggests potential con-fusing influences when mathematically operatingwith variables that have already been correlated.For instance, TR and RA correlate positively, andboth correlate negatively with RS (Garcıa-Martınezet al., 2007). Thus, when computing TR with theRA and RS data (TR ∝ RA/RS), we obtain anew dataset by dividing one dataset that correlatespositively with the TR by one that is inversely cor-related. The result is, therefore, a new dataset thatshould mathematically correlate positively with theTR, as is in fact the case. However, when weattempted to compute RS using the TR and RAdata (RS ∝ RA/TR), we divided two datasets thatnegatively correlated to RS. Thus, this negativecorrelation in the new dataset decreased, due to aconfusing effect of the different variables. Anothersource of discrepancy is the dilution effect causedby the continuous growth of the culture when cal-culating indirect RS that contributes to mRNAconcentration reduction besides the mRNA degra-dation itself (Alon, 2006), whereas it does not affectindirect methods because the growth of the cultureis stopped due to the transcription stop. Additionallimitations in the calculations are related to theuse of nascent TR (see above) and the well-knownproblems brought about by the stressing situationcaused to cells because of the transcription stopthat they require (Grigull et al., 2004; Perez-Ortınet al., 2007).
Finally, the confirmation of a transcriptionalsteady state during the exponential phase meansthat the functional analyses of gene expressiondone in yeast to date are reliable, as this steady stateconfirms that the different time points within thatphase can be considered as identical with regard toall mRNA levels.
Acknowledgements
We wish to thank Dr S. Chavez and Albert Sorribas forcritically reading the manuscript, and all the members ofthe Yeast Functional Genomics Group for discussions. Weare especially grateful to Jose Garcıa-Martınez (DNA-chipservice at the SCSIE) for performing the DNA macroarrays.V.P. was partially funded by a FPI fellowship from theGeneralitat Valenciana (Valencian Regional Government).This work was supported by Grant No. BFU2007-67575-CO3-01/BMC from the Spanish Ministerio de Cienciay Educacion and Grant No. ACOMP/2009/368 from theGeneralitat Valenciana (to J.E.P.-O.).
Supporting information on the internet
The following suporting information may be foundin the online version of this article:
Table S1. TR and RA values for the experimentTable S2. Relative contribution of TR to RA
changesTable S3. Complete lists of functional groups
with a significant deviation from the steady stateduring exponential growth
Figure S1. Correlation between the different timepoints for the amount of mRNA (RA) and thetranscription rate (TR)
References
Al-Shahrour F, Minguez P, Tarraga J, et al. 2006. BABE-LOMICS: a systems biology perspective in the functional anno-tation of genome-scale experiments. Nucleic Acids Res 34:W472–476.
Alberola TM, Garcıa-Martınez J, Antunez O, et al. 2004. A newset of DNA macrochips for the yeast Saccharomyces cerevisiae:features and uses. Int Microbiol 7: 199–206.
Berriz GF, King OD, Bryant B, et al. 2003. Characterizing genesets with FuncAssociate. Bioinformatics 19: 2502–2504.
Daran-Lapujade P, Daran JM, van Maris AJ, et al. 2009.Chemostat-based micro-array analysis in baker’s yeast. AdvMicrob Physiol 54: 257–311.
DeRisi JL, Iyer VR, Brown PO. 1997. Exploring the metabolicand genetic control of gene expression on a genomic scale.Science 278: 680–686.
Garcıa-Martınez J, Aranda A, Perez-Ortın JE. 2004. Genomicrun-on evaluates transcription rates for all yeast genes andidentifies gene regulatory mechanisms. Mol Cell 15: 303–313.
Garcıa-Martınez J, Gonzalez-Candelas F, Perez-Ortın JE. 2007.Common gene expression strategies revealed by genome-wideanalysis in yeast. Genome Biol 8: R222.
Grigull J, Mnaimneh S, Pootoolal J, et al. 2004. Genome-wideanalysis of mRNA stability using transcription inhibitors andmicroarrays reveals posttranscriptional control of ribosomebiogenesis factors. Mol Cell Biol 24: 5534–5547.
Hayes A, Zhang N, Wu J, et al. 2002. Hybridization arraytechnology coupled with chemostat culture: tools to interrogategene expression in Saccharomyces cerevisiae. Methods 26:281–290.
Hirayoshi K, Lis JT. 1999. Nuclear run-on assays: assessing tran-scription by measuring density of engaged RNA polymerases.Methods Enzymol 304: 351–362.
Holstege FC, Jennings EG, Wyrick JJ, et al. 1998. Dissecting theregulatory circuitry of a eukaryotic genome. Cell 95: 717–728.
Levy S, Barkai N. 2009. Coordination of gene expression withgrowth rate: a feedback or a feed-forward strategy? FEBS Lett583: 3974–3978.
Montaner D, Tarraga J, Huerta-Cepas J, et al. 2006. Next stationin microarray data analysis: GEPAS. Nucleic Acids Res 34:W486–491.
Copyright 2010 John Wiley & Sons, Ltd. Yeast 2010; 27: 413–422.DOI: 10.1002/yea

422 V. Pelechano and J. E. Perez-Ortın
Pelechano V, Jimeno-Gonzalez S, Rodrıguez-Gil A, et al. 2009.Regulon-specific control of transcription elongation across theyeast genome. PLoS Genet 5: e1000614.
Perez-Ortın JE. 2007. Genomics of mRNA turnover. Brief FunctGenom Proteom 6: 282–291.
Perez-Ortın JE, Alepuz PM, Moreno J. 2007. Genomics and genetranscription kinetics in yeast. Trends Genet 23: 250–257.
Radonjic M, Andrau JC, Lijnzaad P, et al. 2005. Genome-wideanalyses reveal RNA polymerase II located upstream of genes
poised for rapid response upon S. cerevisiae stationary phaseexit. Mol Cell 18: 171–183.
Regenberg B, Grotkjaer T, Winther O, et al. 2006. Growth-rateregulated genes have profound impact on interpretation oftranscriptome profiling in Saccharomyces cerevisiae. GenomeBiol 7: R107.
Alon U. 2006. An Introduction to Systems Biology: DesignPrinciples of Biological Circuits. Chapman & Hall/CRCMathematical & Computational Biology: Boca Raton, FL, USA.
Copyright 2010 John Wiley & Sons, Ltd. Yeast 2010; 27: 413–422.DOI: 10.1002/yea