improved exponentially weighted moving average control charts for monitoring process mean and...
TRANSCRIPT

Research Article
(wileyonlinelibrary.com) DOI: 10.1002/qre.1694 Published online in Wiley Online Library
A New Maximum Exponentially WeightedMoving Average Control Chart for MonitoringProcess Mean and DispersionAbdul Haq*† Jennifer Brown and Elena Moltchanova
Maximum exponentially weighted moving average (MaxEWMA) control charts have attracted substantial interest because of theirability to simultaneously detect increases and decreases in both the process mean and the process variability. In this paper, wepropose new MaxEWMA control charts based on ordered double ranked set sampling (ODRSS) and ordered imperfect doubleranked set sampling (OIDRSS) schemes, named MaxEWMA-ODRSS and MaxEWMA-OIDRSS control charts, respectively. Theproposed MaxEWMA control charts are based on the best linear unbiased estimators obtained under ODRSS and OIDRSS schemes.Extensive Monte Carlo simulations are used to estimate the average run length and standard deviation of the run length of theproposed MaxEWMA control charts. The run length performances and the diagnostic abilities of the proposed MaxEWMA controlcharts are compared with that of their counterparts based on simple random sampling (SRS), ordered ranked set sampling (ORSS)and ordered imperfect ranked set sampling schemes (OIRSS) schemes, that is, MaxEWMA-SRS, maximum generally weightedmoving average (MaxGWMA-SRS), MaxEWMA-ORSS and MaxEWMA-OIRSS control charts. It turns out that the proposedMaxEWMA-ODRSS and MaxEWMA-OIDRSS control charts perform uniformly better than the MaxEWMA-SRS, MaxGWMA-SRS,MaxEWMA-ORSS and MaxEWMA-OIRSS control charts in simultaneous detection of shifts in the process mean and variability. Anapplication to real data is also provided to illustrate the implementations of the proposed and existing MaxEWMA control charts.Copyright © 2014 John Wiley & Sons, Ltd.
Keywords: average run length; control chart; exponentially weighted moving average; Monte Carlo simulation; ordered doubleranked set sampling; statistical process control
1. Introduction
Quality control charts are widely recognized for their potential to be a powerful process monitoring tool of the statistical processcontrol (SPC). These control charts are frequently used in many industrial and service organizations to monitor in-control andout-of-control performances of a production or manufacturing process. The main objective of SPC is not only to detect
variations in different parameters of a production system but also enable the control system to take an appropriate corrective actionbefore many nonconforming units are manufactured.
The basic concept of the control chart was first introduced by Walter A. Shewhart in the 1920s. Later on, this concept laid thefoundation of modern SPC. Currently, advanced process monitoring techniques include exponentially weighted moving average(EWMA) and cumulative sum (CUSUM) control charts. These control charts have been widely used in chemical and process industriesbecause of their excellent performance in detecting small to moderate shifts in the process parameters. However, the Shewhartcontrol charts are better than the EWMA and the CUSUM control charts in detecting large shifts. The EWMA control chart was firstsuggested by Roberts1 to control the process mean. Crowder and Hamilton2 suggested an EWMA control chart for monitoringchanges in the process dispersion. Over the last few decades, the EWMA control charts have been used to detect small and moderateshifts in the process mean and in the process dispersion. For some literature in this direction, we refer to Abbasi and Miller,3 Abbaset al.,4–6 Riaz et al.,7 Huwang et al.,8 Haq,9,10 Haq et al. 11 and references cited therein.
Recently, there has been considerable research on control charting procedures to simultaneously detect changes in the processmean and the process dispersion. Generally, it is customary to use two control charts simultaneously to monitor the shifts in theprocess mean and variability. Chen and Cheng12 introduced a Max-chart to simultaneously monitor the changes in both the processmean and process standard deviation. Lee and Lin13 further increased the detection ability of the Max-chart by combining this chartwith the adaptive chart. They showed that the adaptive Max-charts with variable parameters are more sensitive to small shifts than
School of Mathematics and Statistics, University of Canterbury, Christchurch, New Zealand*Correspondence to: Abdul Haq, School of Mathematics and Statistics, University of Canterbury, Christchurch, New Zealand.†E-mail: [email protected]
Copyright © 2014 John Wiley & Sons, Ltd. Qual. Reliab. Engng. Int. 2014

A. HAQ, J. BROWN AND E. MOLTCHANOVA
the EWMA, CUSUM and double sampling control charts when monitoring the process mean and the process variance simultaneously.Later on, Chen et al. 14 suggested an improved maximum EWMA (MaxEWMA) control chart by combining the plotting-statistics of thetwo EWMA control charts—one to detect the process mean and the other to detect changes in the process dispersion. In a morerecent work, Sheu et al. 15 developed an extended maximum generally weighted moving average (MaxGWMA) control chart toconcurrently detect both increases and decreases in the process mean and/or variability of a process. They showed that the optimalMaxGWMA control chart is at least as efficient as the optimal MaxEWMA control chart. Because the mean and variance estimatorsunder both MaxEWMA and MaxGWMA control charts are based on the simple random sampling (SRS) scheme, therefore for brevityof discussion, we denote the MaxEWMA and the MaxGWMA control charts by the MaxEWMA-SRS and the MaxGWMA-SRS controlcharts, respectively. Sheu et al. 16 suggested a maximum chi-square generally weighted moving average (MCSGWMA) control chartto monitor both increases as well as decreases in the process mean and/or variability simultaneously. The MCSGWMA control chartis superior to the MaxEWMA control chart in detecting an increase or decrease in the process mean and the process variability.
The traditional ranked set sampling (RSS) scheme was first proposed by McIntyre17 for estimating mean pasture and forage yields.Later on, Takahashi and Wakimoto18 derived the mathematical setup of the RSS scheme and showed that the mean estimator underRSS scheme is at least as efficient as the mean estimator with SRS. The RSS scheme turns out to be an effective alternative to the SRSscheme when taking actual measurement of a quality characteristic is very costly while it is easy to rank a small of selected units basedon their quality level or by using any inexpensive method. For example, testing the size, volume or weights of products using expertknowledge and so on, see Jafari Jozani and Mirkamli.19 Dell and Clutter20 investigated the effect of imperfect rankings on theperformance of the RSS-based mean estimator. They proved that, even with imperfect rankings, the mean estimator under RSS stilloutperforms the mean estimator with SRS. Stokes21 showed that it is also possible to judge the ranks of the study variable by usinginformation on an auxiliary variable, provided there exists sufficient correlation between the study variable and the auxiliary variable.Salazar and Sinha22 suggested new Shewhart control charts for monitoring the process mean based on RSS. Al-Saleh and Al-Kadiri23
proposed a double RSS (DRSS) scheme. DRSS scheme not only provides an unbiased estimator of the population mean but also thesample mean with DRSS is at least as efficient as the mean estimator using RSS. Based on this fact, Abujiya and Muttlak24 and Al-Omariand Haq25 suggested several Shewhart-type quality control charts for monitoring the process mean using DRSS schemes. The controlcharts with DRSS schemes are more sensitive than their counterparts with SRS and RSS schemes. Balakrishnan and Li26,27 introducedthe idea of ordered RSS (ORSS) scheme, that is, considering the order statistics based on a ranked set sample. They obtained the best linearunbiased estimators (BLUEs) based on the ORSS scheme, named BLUEs-ORSS, of the unknown parameters of a location-scale family ofdistributions. Haq et al. 28 developed improved EWMA control charts based on the BLUEs-ORSS and showed that these control chartsare able to perform better than the EWMA control charts based on SRS and RSS schemes. Later on, Haq et al. 29 suggested an improvedMaxEWMA control charts based on ORSS and ordered imperfect RSS (OIRSS) schemes, named MaxEWMA-ORSS and MaxEWMA-OIRSScontrol charts, respectively, for monitoring changes in the process mean and process dispersion simultaneously.
Recently, Haq et al. 30 introduced ordered DRSS (ODRSS) scheme and used it to obtain the BLUEs of the location and the scaleparameters of a location-scale family of distributions, named BLUEs-ODRSS. It has shown that the BLUEs-ODRSS are at least asefficient as the BLUEs-ORSS scheme. Using this idea, Haq et al. 31 proposed new EWMA control charts for monitoring the processmean and the process variance independently based on ODRSS and ordered imperfect DRSS (OIDRSS) schemes, named EWMA-ODRSS and EWMA-OIDRSS control charts. The EWMA-ODRSS and EWMA-OIDRSS control charts provide much better sensitivitythan the EWMA-ORSS and EWMA-OIRSS control charts, respectively, for detecting overall changes in the process mean and inthe process dispersion.
In this paper, we extend the work on ODRSS scheme and propose new MaxEWMA control charts for simultaneously monitoring theprocess mean and variability based on ODRSS and OIDRSS schemes, named MaxEWMA-ODRSS and MaxEWMA-OIDRSS control charts.Monte Carlo simulations are used to estimate the run length characteristics of the proposed MaxEWMA control charts, including averagerun length (ARL) and standard deviation of run length (SDRL). ARL is defined as the expected number of samples that are required until anout-of-control signal is triggered by a control chart. For a fair comparison of the control charts, the run length performances of theproposed MaxEWMA control charts are compared with that of their counterparts, including MaxEWMA-SRS, MaxGWMA-SRS,MaxEWMA-ORSS and MaxEWMA-OIRSS control charts. Extensive run length comparisons reveal that the MaxEWMA-ODRSS andMaxEWMA-OIDRSS control charts are more sensitive than the control charts considered here.
The outline of the rest of the article is as follows: In Section 2, we briefly explain the control charting structures of the MaxEWMA-SRS,MaxEWMA-GWMAandMaxEWMA-ORSS control charts. The proposedMaxEWMA control charts based onODRSS andOIDRSS schemes areconstructed in Sections 3 and 4, respectively. The run length comparisons and diagnostic abilities of the control charts are given inSection 5. Section 6 provides an application to real data, and Section 7 concludes the paper.
2. Brief review of control charts
Let X be a quality characteristic of a process with the probability density function (PDF) f(x) and an absolutely continuous distributionfunction (CDF) F(x). Suppose that X is normally distributed with mean μ+ δσ and standard deviation ρσ, that is, X~N(μ+ δσ, ρ2σ2),where μ and σ are the standard values of a process. The process is said to be in-control when δ=0 and ρ=1; otherwise, the processis said to have changed or drifted.
Let Xit, i=1, 2,…,nt, t=1, 2,…, be the measurements of X arranged in groups each of size nt, where t is the index of the group number.LetXt andS
2t be samplemean and sample variance computed from the tth group, respectively, whereXt ¼ X1t þ X2t þ⋯þ Xnttð Þ=nt and
Copyright © 2014 John Wiley & Sons, Ltd. Qual. Reliab. Engng. Int. 2014

A. HAQ, J. BROWN AND E. MOLTCHANOVA
S2t ¼Xnti¼1
Xit � Xt
� �2= nt � 1ð Þ . Here, Xt is a normal random variable with mean μ+ δσ and standard deviation ρσ=
ffiffiffiffint
p, that is,
XteN μþ δσ ; ρ2σ2=ntð Þ ; nt � 1ð ÞS2t =ρ2σ2 is a chi-square random variable with nt� 1 degrees of freedom, that is,
nt � 1ð ÞS2t =ρ2σ2eχ2nt�1ð Þ, t=1, 2,…. Note that Xt and S2t are mutually independent variables. Based on Xt and S2t , we define the following
two independent statistics:
Ut ¼ Xt � μσ=
ffiffiffiffint
p and Vt ¼ Φ�1 Fnt � 1ð ÞS2t
σ2; nt � 1
� �� �; (1)
where Φ� 1(�) is the inverse standard normal CDF and F(�; v) is the chi-square CDF with v degrees of freedom. For more details on thesetransformations and their applications, see Quesenberry.32 In Equation (1), both Ut and Vt are independent standard normal randomvariables given that the process is in-control. Moreover, the underlying distributions of Ut and Vt are both independent of the samplesize nt.
2.1. MaxEWMA-SRS control chart
Chen et al. 14 were the first to discuss the concept of the MaxEWMA-SRS control chart. This chart effectively combines two EWMAcontrol charts into a single control chart. This enables the MaxEWMA-SRS control chart to simultaneously monitor the process meanand the process standard deviation.
Based on Ut and Vt, the EWMA sequences, U�t and V�
t , respectively, can be defined by using the following recursive formulae:
U�t ¼ ξUt þ 1� ξð ÞU�
t�1; 0 < ξ≤1; U�0 ¼ 0; t ¼ 1; 2;…; (2)
V�t ¼ ξVt þ 1� ξð ÞV�
t�1; 0 < ξ≤1; V�0 ¼ 0; t ¼ 1; 2;…; (3)
where U�0 and V�
0 are the starting values of U�t and V�
t , respectively, and ξ is a smoothing constant. Here, U�t and V�
t are also mutuallyindependent because of the independence of Ut and Vt. Note that for an in-control process, that is, δ= 0 and ρ= 1, we have
U�t eN 0;σ2
U�t
and V�
t e N 0;σ2V�t
, where σ2
U�t¼ σ2
V�t¼ ξ
2�ξð Þ 1� 1� ξð Þ2tn o
.
The plotting-statistic of the MaxEWMA-SRS control chart is given by
MEt ¼ max U�t
�� ��; V�t
�� ��� ; t ¼ 1; 2;…:; (4)
where max(A, B) is the maximum of A and B, and | � | is the absolute value. Because MEt is non-negative, the initial state of theMaxEWMA-SRS control chart is based only on an upper control limit UCLME
t
� �at time t, given by
UCLMEt ¼ E MEtð Þ þ L1
ffiffiffiffiffiffiffiffiffiffiffiffiffiffiffiffiffiffiffiVar MEtð Þ
p; (5)
where L1 is a positive chart multiplier and its value is selected such that the in-control ARL of the MaxEWMA-SRS control chart reachesa fixed level. Here, E(Mt) and Var(MEt) are the expected value and the variance of MEt, respectively. The MaxEWMA-SRS control charttriggers an out-of-control signal whenever MEt exceeds UCL
MEt . For more details see Xie33 and Chen et al. 14
2.2. MaxGWMA-SRS control chart
Sheu et al. 15 suggested the MaxGWMA-SRS control chart for simultaneously monitoring the process mean and the process variability.This chart is an extension of the MaxEWMA-SRS control chart and is at least as efficient as the MaxEWMA-SRS control chart.
Based on Ut and Vt, the GWMA sequences, G�t and H�
t , respectively, can be defined by using the following recursive formulae:
G�t ¼ P M ¼ 1ð ÞGt þ⋯þ P M ¼ tð ÞG1 þ P M > tð ÞG�
0; G�0 ¼ 0; t ¼ 1; 2;…; (6)
H�t ¼ P M ¼ 1ð ÞHt þ ��� þ P M ¼ tð ÞH1 þ P M > tð ÞH�
0; H�0 ¼ 0; t ¼ 1; 2;…; (7)
where P(M=1),P(M=2),…, P(M= t) are the weights of the current sample, the previous sample,…, the most out-of-date sample,respectively, and P(M> t) is weighted with the target value of the process mean. Sheu et al. 15 set the weights by considering the discreteWeibull distribution (cf. Nakagawa and Osaki,34), that is,P M ¼ tð Þ ¼ q t�1ð Þα � q tð Þα ; t ¼ 1; 2;…;where q(0≤ q≤ 1) is the design parameterand α is the adjustment parameter determined by the practitioner. The GWMA statistics, given in Equations (6) and (7), respectively, can besimplified as follows:
G�t ¼
Xtj¼1
q j�1ð Þα � q jð Þα
Ut�jþ1 þ q tð ÞαG�0; t ¼ 1; 2;…; (8)
H�t ¼
Xtj¼1
q j�1ð Þα � q jð Þα
Vt�jþ1 þ q tð ÞαH�0; t ¼ 1; 2;…; (9)
Copyright © 2014 John Wiley & Sons, Ltd. Qual. Reliab. Engng. Int. 2014
A. HAQ, J. BROWN AND E. MOLTCHANOVA
Here, G�t and H�
t are also mutually independent because of the independence of Ut and Vt. For an in-control process, we have
G�t e N 0;σ2
G�t
and H�
t e N 0;σ2H�t
, where σ2
G�t¼ σ2
H�t¼Xtj¼1
q j�1ð Þα � q jð Þα 2
for t= 1, 2,….
The plotting-statistic of the MaxGWMA-SRS control chart based G�t and H�
t is given by
MGt ¼ max G�t
�� ��; H�t
�� ��� ; t ¼ 1; 2;…: (10)
Here, MGt is non-negative. Thus, the initial state of the MaxGWMA-SRS control chart only needs an UCLMGt , which is given by
UCLMGt ¼ E MGtð Þ þ L2
ffiffiffiffiffiffiffiffiffiffiffiffiffiffiffiffiffiffiffiVar MGtð Þ
p; (11)
where L2 is the width of the control limits when the process is in statistical control. The MaxGWMA-SRS control chart generates an out-of-control signal whenever MGt exceeds UCL
MGt , given in Equation (11). More details concerning the computations of E(MGt) and Var
(MGt) may be seen in Sheu et al. 15
2.3. MaxEWMA-ORSS control chart
Recently, Haq et al. 29 suggested an improved MaxEWMA-ORSS control chart to simultaneously detect both increases and decreases inthe mean and/or dispersion of a process.
The traditional RSS scheme is as follows: start with n2 units from the parent population. Randomly allocate these units into n sets,each containing n units. Rank the units within each set visually or by using an inexpensive method. Then, quantify the ith smallestranked unit from the ith set of n units, for i=1, 2,…, n. This completes one cycle of a ranked set sample of size n. Now sort theobtained sample to get an ordered ranked set sample of size n. The whole procedure, if needed, can be repeated m times to obtainan ordered ranked set sample of size nm.
Let (X11, X12,…, X1n), (X21, X22,…, X2n),…, (Xn1, Xn2,…, Xnn) be n independent simple random samples, each of size n, drawn from f(x).Apply the RSS scheme on these n samples to obtain a ranked set sample of size n, denoted by Xr(r : n), r= 1, 2,…, n, where Xr(r : n) = rthmin{Xr1, Xr2,…, Xrn}. For simplicity, let X(r : n)≡ Xr(r : n) for r= 1, 2,…, n. The CDF and PDF of the rth order statistic X(r : n)(r=1, 2,…, n) are,respectively, given by
F r:nð Þ xð Þ ¼Xni¼r
n
i
� �F xð Þf gr 1� F xð Þf gn�i; � ∞ < x < ∞; (12)
f r:nð Þ xð Þ ¼ n!
r � 1ð Þ! n� rð Þ! F xð Þf gr�1 1� F xð Þf gn�r f xð Þ: (13)
For more details, see David and Nagaraja.35
LetXORSS1:nð Þ ; X
ORSS2:nð Þ ;…; XORSS
n:nð Þ represent an ordered ranked set sample of size n obtained by arranging X(1 :n),X(2 :n),…,X(n :n) in an increasing
order of magnitude, where XORSSr:nð Þ ¼ rth min X 1:nð Þ; ; X 2:nð Þ;…; ; X n:nð Þ
� for r=1, 2,…,n. Note that here XORSS
r:nð Þ r ¼ 1; 2;…; nð Þ are
independent but non-identically distributed (INID) random variables. Therefore, the PDF of XORSSr:nð Þ r ¼ 1; 2;…; nð Þ is given by
fORSSr:nð Þ xð Þ ¼ 1
r � 1ð Þ! n� rð Þ!XP n½ �
∏r�1
k¼1F ik :nð Þ xð Þ ∏
n
k¼rþ11� F ik :nð Þ xð Þ�
f ir :nð Þ xð Þ� �
; � ∞ < x < ∞; (14)
where ΣP[n] denotes the summation over all n ! permutations (i1, i2,…, in) of (1, 2,…, n).
Similarly, the joint PDF of XORSSr:nð Þ and XORSS
s:nð Þ 1≤r < s≤nð Þ is given by
fORSSr;s:nð Þ xr ; ; xsð Þ ¼ 1
r � 1ð Þ! s� r � 1ð Þ! n� sð Þ!XP n½ �
∏r�1
k¼1F ik :nð Þ xð Þ ∏
s�1
k¼rþ1F ik :nð Þ xsð Þ � F ik :nð Þ xrð Þ� �
∏n
k¼sþ11� F ik :nð Þ xsð Þ�
f ir :nð Þ xrð Þf is :nð Þ xsð Þ�; � ∞ < xr < xs < ∞:
(15)
From Equations (14) and (15), it is easy to compute the moments and cross-moments of random variables under ORSS. For furtherdetails see Balakrishnan and Li.26,27
Let X ′ORSS ¼ XORSS
1:nð Þ ; XORSS2:nð Þ ;…; XORSS
n:nð Þ
1�nbe an ordered ranked set sample of size n from an underlying process distribution f(x;μ,σ)
with the location parameter μ and the scale parameter σ(> 0). Let E ZORSSr:nð Þ
¼ μORSS
r:nð Þ for 1 ≤ r ≤ n and Cov ZORSSr:nð Þ ; Z
ORSSs:nð Þ
¼ σORSS
r;s:nð Þ for
1 ≤ r< s ≤ n, where ZORSSr:nð Þ ¼ XORSS
r:nð Þ � μ
=σ is the standardized variate with PDF independent of μ and σ. Following Balakrishnan and
Li 26, the BLUEs-ORSS of μ and σ are μ̂ORSSBLUE ¼ 1′Σ�1
ORSS1� ��1
1′Σ�1ORSSXORSS and σ̂ ORSS
BLUE ¼ μ′ORSSΣ
�1ORSSμORSS
� ��1μ′ORSSΣ
�1ORSSXORSS, respectively,
where 1′= (1, 1,…, 1)1 × n, ΣORSS ¼ σORSSr;s:nð Þ
n on�n
and μ′ORSS ¼ μORSS
1:nð Þ ;μORSS2:nð Þ ;…;μORSS
n:nð Þ
1�n. The variances of the BLUEs-ORSS are
Copyright © 2014 John Wiley & Sons, Ltd. Qual. Reliab. Engng. Int. 2014

A. HAQ, J. BROWN AND E. MOLTCHANOVA
Var μ̂ORSSBLUE
� � ¼ σ2 1′Σ�1ORSS1
� ��1and Var σ̂ ORSS
BLUE
� � ¼ σ2 μ′ORSSΣ
�1ORSSμORSS
� ��1. Note that for a symmetric distribution, we have
Cov μ̂ORSSBLUE ; σ̂
ORSSBLUE
� � ¼ 0.
Recall that for an in-control process Xt~N(μ,σ2), t=1, 2,…. Let μ̂ORSS
BLUE;t
n oand σ̂ ORSS
BLUE;t
n obe the sequences of independent and
identically distributed (IID) random variables for t=1, 2,…. Based on μ̂ORSSBLUE;t
n oand σ̂ ORSS
BLUE;t
n o, the EWMA sequences, At and Bt, respectively,
are defined as
At ¼ ξμ̂ORSSBLUE;t þ 1� ξð ÞAt�1; 0 ≤ ξ < 1; A0 ¼ μ; (16)
Bt ¼ ξσ̂ ORSSBLUE;t þ 1� ξð ÞBt�1; 0 ≤ ξ < 1; B0 ¼ σ ; (17)
where ξ is a smoothing constant. The initial values, A0 and B0, are usually set by the quality practitioners. Note that At and Bt aremutually independent because of the independence of μ̂ORSS
BLUE;t and σ̂ ORSSBLUE;t . Let A
�t and B�t be independent standardized statistics
corresponding to At and Bt, respectively, defined by
A�t ¼At � μffiffiffiffiffiffiffiffiffiffiffiffiffiffiffiffiffiffiffiffiffiffiffiffiffiffiffiffiffiffiffiffiffiffiffiffiffiffi
π ξ; tð ÞVar μ̂ORSSBLUE;t
r and B�t ¼Bt � σffiffiffiffiffiffiffiffiffiffiffiffiffiffiffiffiffiffiffiffiffiffiffiffiffiffiffiffiffiffiffiffiffiffiffiffiffiffiffi
π ξ; tð ÞVar σ̂ ORSSBLUE;t
r ; (18)
where π ξ; tð Þ ¼ ξ2�ξð Þ 1� 1� ξð Þ2t
n o; Var μ̂ORSS
BLUE;t
¼ σ2 1′Σ�1
ORSS1� ��1
and Var σ̂ ORSSBLUE;t
¼ σ2 μ′
ORSSΣ�1ORSSμORSS
� ��1.
The plotting-statistic of the EWMA-ORSS control chart is given by
MEORSSt ¼ max A�t
�� ��; B�t�� ���
; t ¼ 1; 2;…: (19)
Because MEORSSt is non-negative, the initial state of the MaxEWMA-ORSS control chart needs an UCLORSS, given by
UCLORSS ¼ E MEORSSt
� �þ L3
ffiffiffiffiffiffiffiffiffiffiffiffiffiffiffiffiffiffiffiffiffiffiffiffiffiffiVar MEORSSt
� �q; (20)
where L3 is the width of the control limits,E MEORSSt
� �andVar MEORSSt
� �are the expected value and the variance ofMEORSSt , respectively. The
MaxEWMA-ORSS control chart triggers an out-of-control signal as soon as MEORSSt exceeds UCLORSS. For more details see Haq et al. 29
3. MaxEWMA-ODRSS control chart
In this section, we propose a new MaxEWMA-ODRSS control chart for simultaneously monitoring the process mean and the processdispersion.
The DRSS scheme is as follows: start with n3 units from the target population. Randomly partition these units into n sets, each ofsize n2 units. Apply the RSS scheme on each set to get n ranked set samples, each having n units. Again apply the RSS scheme toobtain a double ranked set sample of size n. This completes one cycle of a double ranked set sample of size n. Now sort the obtainedsample to get an ordered double ranked set sample of size n. The whole procedure, if needed, can be repeated m times to get mordered double ranked set samples with total sample size nm. The mathematical properties of the random variables under ODRSSscheme are given in Appendix A.
Let X ′ODRSS ¼ XODRSS
1:nð Þ ; XODRSS2:nð Þ ;…; XODRSS
n:nð Þ
1�nbe an ordered double ranked set sample of size n from a location-scale family of
distributions f(x;μ,σ). Let E ZODRSSr:nð Þ
¼ μODRSS
r:nð Þ for 1 ≤ r ≤ n and Cov ZODRSSr:nð Þ ; ZODRSS
s:nð Þ
¼ σODRSSr;s:nð Þ for 1 ≤ r< s ≤ n, where ZODRSS
r:nð Þ ¼XODRSS
r:nð Þ � μ
=σ is the standardized variate with PDF independent of μ and σ. Following Haq et al.,30 the BLUEs-ODRSS of μ and
σ are μ̂ODRSSBLUE ¼ 1′Σ�1
ODRSS1� ��1
1′Σ�1ODRSSXODRSS and σ̂ ODRSS
BLUE ¼ μ′ODRSSΣ
�1ODRSSμODRSS
� ��1μ′ODRSSΣ
�1ODRSSXODRSS, respectively, where ΣODRSS ¼
σODRSSr;s:nð Þ
n on�n
and μ′ODRSS ¼ μODRSS
1:nð Þ ;μODRSS2:nð Þ ;…;μODRSS
n:nð Þ
1�n. The variances of the BLUEs-ODRSS are Var μ̂ODRSS
BLUE
� � ¼ σ2 1′Σ�1ODRSS1
� ��1
and Var σ̂ ODRSSBLUE
� � ¼ σ2 μ′ODRSSΣ
�1ODRSSμODRSS
� ��1. Note that for a symmetric distribution, we have Cov μ̂ODRSS
BLUE ; σ̂ ODRSSBLUE
� � ¼ 0. For moredetails related to the mean and variance of XODRSS, see Haq et al. 30,31
Remember that when the process is in-control Xt~N(μ,σ2). Let μ̂ODRSSBLUE;t
n oand σ̂ ODRSS
BLUE;t
n obe the sequences of IID random variables
for t=1, 2,…. We define two EWMA sequences, Ct and Dt, based on μ̂ODRSSBLUE;t
n oand σ̂ ODRSS
BLUE;t
n o, respectively, given by
Ct ¼ ξμ̂ODRSSBLUE;t þ 1� ξð ÞCt�1; 0 ≤ ξ < 1; C0 ¼ μ; (21)
Dt ¼ ξσ̂ ODRSSBLUE;t þ 1� ξð ÞDt�1; 0 ≤ ξ < 1; D0 ¼ σ ; (22)
Copyright © 2014 John Wiley & Sons, Ltd. Qual. Reliab. Engng. Int. 2014

A. HAQ, J. BROWN AND E. MOLTCHANOVA
where ξ is a smoothing parameter. Here, the initial values (C0 and D0) are usually set by the quality practitioners. Note that Ct and Dt
are also mutually independent because of the independence of μ̂ODRSSBLUE;t and σ̂ ODRSS
BLUE;t . Let C�t and D�
t be independent standardizedstatistics corresponding to Ct and Dt, respectively, defined by
C�t ¼
Ct � μffiffiffiffiffiffiffiffiffiffiffiffiffiffiffiffiffiffiffiffiffiffiffiffiffiffiffiffiffiffiffiffiffiffiffiffiffiffiffiπ ξ; tð ÞVar μ̂ODRSS
BLUE;t
r and D�t ¼
Dt � σffiffiffiffiffiffiffiffiffiffiffiffiffiffiffiffiffiffiffiffiffiffiffiffiffiffiffiffiffiffiffiffiffiffiffiffiffiffiffiπ ξ; tð ÞVar σ̂ ODRSS
BLUE;t
r ; (23)
where Var μ̂ODRSSBLUE;t
¼ σ2 1′Σ�1
ODRSS1� ��1
and Var σ̂ ODRSSBLUE;t
¼ σ2 μ′
ODRSSΣ�1ODRSSμODRSS
� ��1.
The plotting-statistic of the EWMA-ODRSS control chart is given by
MEODRSSt ¼ max C�t
�� ��; D�t
�� ��� ; t ¼ 1; 2;…: (24)
Similar to MEORSSt , here MEODRSSt is also non-negative. Thus, the initial state of the MaxEWMA-ODRSS control chart only needs anUCLODRSS, given by
UCLODRSS ¼ E MEODRSSt
� �þ L4
ffiffiffiffiffiffiffiffiffiffiffiffiffiffiffiffiffiffiffiffiffiffiffiffiffiffiffiffiVar MEODRSSt
� �q; (25)
where L4 is thewidth of the control limits,E ME ODRSSt
� �andVar ME ODRSS
t
� �are the expected value and the variance ofME ODRSS
t , respectively.The MaxEWMA-ODRSS control chart triggers an out-of-control signal whenever ME ODRSS
t exceeds UCLODRSS. It is difficult to derive exactmathematical expressions for E ME ODRSS
t
� �and Var ME ODRSS
t
� �. Thus, we estimate these quantities using Monte Carlo simulations.
The main steps involved in the implementation of the MaxEWMA-ODRSS control chart are as follows:
1. Estimate the unknown parameter(s), if any. These unknown parameters can be well estimated by using a large historical datathat were obtained when the process was in statistical control. Suppose that a large preliminary data set is available underODRSS scheme that comprises k subgroups, each of size n. Then, μ and σ can be estimated by their respective unbiased
estimators μ̂ODRSSBLUE and σ̂
ODRSS
BLUE , where μ̂ODRSSBLUE ¼ 1=kð Þ
Xki¼1
μ̂ODRSSBLUE;i and σ̂
ODRSS
BLUE ¼ 1=kð ÞXki¼1
σ̂ ODRSSBLUE;i .
2. Based on the desired in-control ARL, select the combination (ξ , L4) and sample size n.3. Compute the UCLODRSS, using Equation (25).4. Compute the values of Ct, Dt, C
�t , D
�t and ME ODRSS
t for each sample. The starting values of Ct and Dt are usually set to μ and σ,
respectively. In case of unknown parameters, we set C0 ¼ μ̂ODRSSBLUE andD0 ¼ σ̂
ODRSS
BLUE . Moreover, the standard deviations of μ̂ODRSSBLUE
and σ̂ ODRSSBLUE , that is, σ 1′Σ�1
ODRSS1� ��1=2
and σ μ′ODRSSΣ
�1ODRSSμODRSS
� ��1=2, can be estimated by their respective unbiased estimators
σ̂ODRSS
BLUE 1′Σ�1ODRSS1
� ��1=2and σ̂
ODRSS
BLUE μ′ODRSSΣ
�1ODRSSμODRSS
� ��1=2.
5. PlotMEODRSSt versus t on the chart and draw UCLODRSS. Plot a dot against t whenMEODRSSt ≤ UCLODRSS. IfMEODRSSt > UCLODRSS, thenexamine both C�
t
�� �� and D�t
�� ��. If C�t
�� �� alone is greater than UCLODRSS, then plot ‘m+’ against t whenC�t > 0 to indicate a positive shift
in only the process mean, and plot ‘m�’ against t when C�t < 0 to indicate a negative shift in only the process mean. Likewise, if
D�t
�� �� alone is greater than UCLODRSS, then plot ‘v+’ against t whenD�t > 0 to show an upward shift in only the process dispersion,
and plot ‘v�’ against t whenD�t < 0 to show a negative shift in only the process dispersion. If both C�
t
�� �� and D�t
�� �� are greater thanUCLODRSS, then plot ‘++’ against t when C�
t > 0 and D�t > 0 to indicate a concurrent increase in both the process mean and
dispersion. On similar lines, plot ‘+�’ when C�t > 0 and D�
t < 0, plot ‘�+’ when C�t < 0 and D�
t > 0, plot ‘��’ when C�t < 0
and D�t < 0, with similar interpretations.
6. Finally, examine the cause(s) for each out-of-control point.
It is customary to evaluate the statistical performance of a control chart in terms of ARL and SDRL. For an in-control process, theARL should be sufficiently large to avoid false alarms. However, it needs to be sufficiently small so as to quickly detect shifts in theprocess parameters when the process is out-of-control. Moreover, in terms of SDRL, the smaller the SDRL, the better the performanceof a control chart.
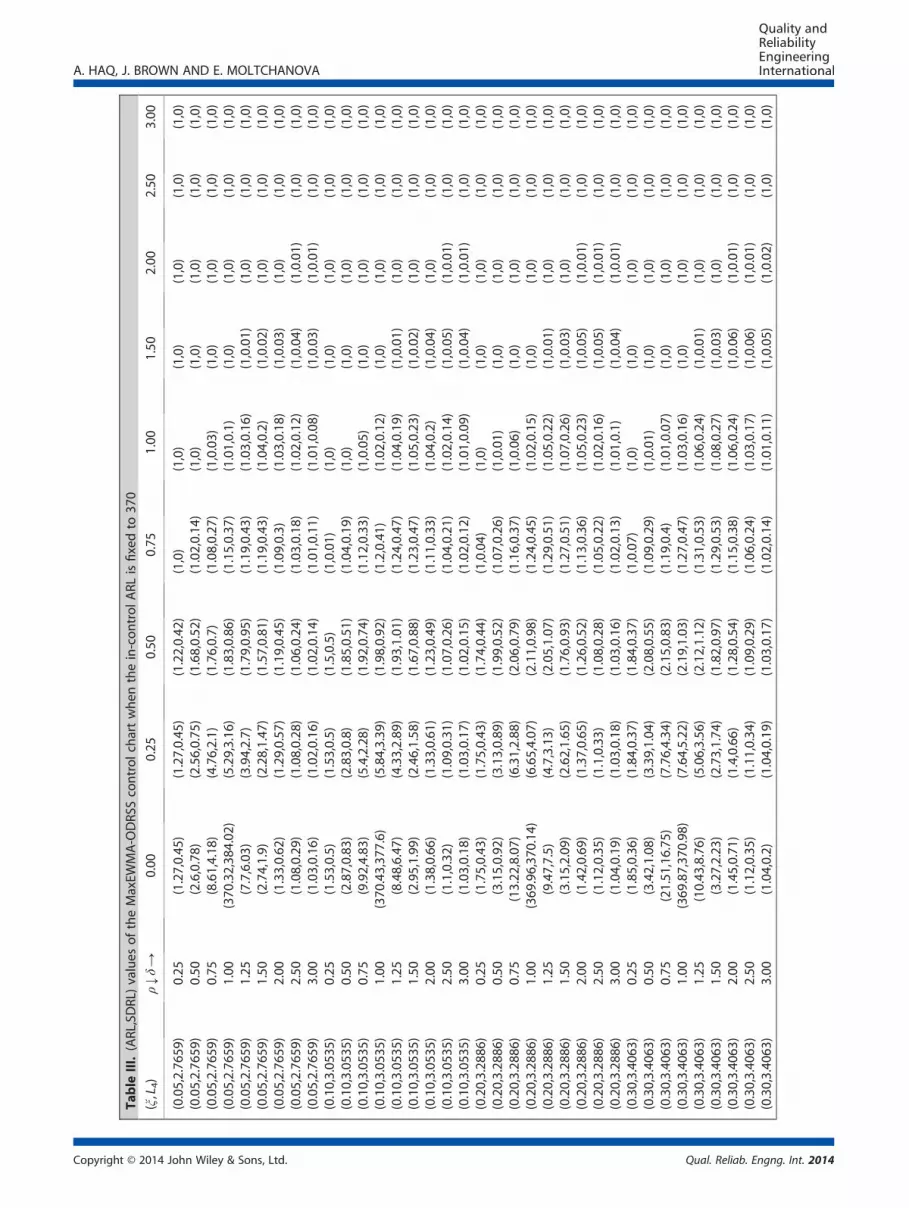
In this study, we explore the run length characteristics of the EWMA-ODRSS control chart in terms of ARL and SDRL. For this purpose,Monte Carlo simulations are used to estimate the ARL and the SDRL of the EWMA-ODRSS control chart. For brevity of discussion, theunderlying process is said to be in control state when δ=0 and ρ=1, that is, Xt~N(0, 1); otherwise, the process is said to be out-of-controldue to a change in either the process mean or the process dispersion or both. Different values of δ and ρ are considered for detectingchanges in the process mean and process dispersion, respectively, that is, δ=0.00, 0.25, 0.50, 0.75, 1.00, 1.25, 1.50, 2.00, 2.50, 3.00 andρ=0.25, 0.50, 0.75, 1.00, 1.25, 1.50, 2.00, 2.50, 3.00. The values considered for the smoothing constant ξ are 0.05, 0.10, 0.20, 0.30, whichare mostly used for a quick detection of small to moderate shifts in the process mean and/or dispersion. The subgroup size is taken tobe n=5. The in-control ARL of the MaxEWMA-ODRSS control chart is matched to 185, 250 and 370. Each simulation run comprises100,000 replications. For each value of the in-control ARL and with different values of ξ , δ and ρ considered here, the ARLs and SDRLsof the MaxEWMA-ODRSS control chart are calculated and are reported in Tables I–III.
It is observed from Tables I–III that, having fixed ξ , ρ and the in-control ARL, the values of out-of-control ARLs and SDRLs tend todecrease as the value of δ increases. Moreover, the performance of the MaxEWMA-ODRSS control chart increases when the value ofξ decreases.
Copyright © 2014 John Wiley & Sons, Ltd. Qual. Reliab. Engng. Int. 2014

Table
I.(ARL,SDRL)values
oftheMaxEW
MA-ODRS
Scontrolchartwhen
thein-controlA
RLisfixedto
185
(ξ,L
4)
ρ↓δ→
0.00
0.25
0.50
0.75
1.00
1.50
2.00
2.50
3.00
(0.05,2.33
74)
0.25
(1.06,0.24
)(1.06,0.24
)(1.03,0.17
)(1,0)
(1,0)
(1,0)
(1,0)
(1,0)
(1,0)
(0.05,2.33
74)
0.50
(2.24,0.73
)(2.19,0.69
)(1.43,0.51
)(1,0.07)
(1,0)
(1,0)
(1,0)
(1,0)
(1,0)
(0.05,2.33
74)
0.75
(7.19,3.75
)(3.93,1.84
)(1.55,0.63
)(1.04,0.2)
(1,0.02)
(1,0)
(1,0)
(1,0)
(1,0)
(0.05,2.33
74)
1.00
(185
.27,19
9.6)
(4.45,2.8)
(1.63,0.77
)(1.1,0.3)
(1,0.07)
(1,0)
(1,0)
(1,0)
(1,0)
(0.05,2.33
74)
1.25
(6.35,5.23
)(3.3,2.35)
(1.61,0.83
)(1.13,0.36
)(1.02,0.13
)(1,0.01)
(1,0)
(1,0)
(1,0)
(0.05,2.33
74)
1.50
(2.4,1.67)
(2.01,1.29
)(1.43,0.7)
(1.13,0.36
)(1.02,0.16
)(1,0.01)
(1,0)
(1,0)
(1,0)
(0.05,2.33
74)
2.00
(1.26,0.54
)(1.22,0.5)
(1.14,0.38
)(1.06,0.25
)(1.02,0.15
)(1,0.03)
(1,0)
(1,0)
(1,0)
(0.05,2.33
74)
2.50
(1.06,0.26
)(1.06,0.24
)(1.04,0.21
)(1.02,0.15
)(1.01,0.1)
(1,0.03)
(1,0)
(1,0)
(1,0)
(0.05,2.33
74)
3.00
(1.02,0.14
)(1.02,0.13
)(1.01,0.11
)(1.01,0.09
)(1,0.07)
(1,0.03)
(1,0)
(1,0)
(1,0)
(0.10,2.64
29)
0.25
(1.19,0.39
)(1.19,0.39
)(1.14,0.35
)(1,0)
(1,0)
(1,0)
(1,0)
(1,0)
(1,0)
(0.10,2.64
29)
0.50
(2.5,0.76)
(2.46,0.74
)(1.61,0.53
)(1.01,0.11
)(1,0)
(1,0)
(1,0)
(1,0)
(1,0)
(0.10,2.64
29)
0.75
(8.3,4.22)
(4.52,2.02
)(1.7,0.68)
(1.07,0.25
)(1,0.02)
(1,0)
(1,0)
(1,0)
(1,0)
(0.10,2.64
29)
1.00
(184
.98,19
0.38
)(4.99,3.03
)(1.77,0.83
)(1.13,0.35
)(1.01,0.09
)(1,0)
(1,0)
(1,0)
(1,0)
(0.10,2.64
29)
1.25
(7.08,5.62
)(3.68,2.53
)(1.73,0.91
)(1.17,0.4)
(1.02,0.15
)(1,0)
(1,0)
(1,0)
(1,0)
(0.10,2.64
29)
1.50
(2.61,1.79
)(2.18,1.39
)(1.52,0.77
)(1.17,0.4)
(1.04,0.19
)(1,0.02)
(1,0)
(1,0)
(1,0)
(0.10,2.64
29)
2.00
(1.31,0.59
)(1.26,0.54
)(1.17,0.42
)(1.08,0.29
)(1.03,0.17
)(1,0.03)
(1,0)
(1,0)
(1,0)
(0.10,2.64
29)
2.50
(1.08,0.29
)(1.07,0.27
)(1.05,0.23
)(1.03,0.17
)(1.01,0.12
)(1,0.03)
(1,0.01)
(1,0)
(1,0)
(0.10,2.64
29)
3.00
(1.02,0.15
)(1.02,0.15
)(1.02,0.13
)(1.01,0.1)
(1.01,0.08
)(1,0.03)
(1,0.01)
(1,0)
(1,0)
(0.20,2.89
28)
0.25
(1.38,0.49
)(1.38,0.49
)(1.34,0.47
)(1,0.01)
(1,0)
(1,0)
(1,0)
(1,0)
(1,0)
(0.20,2.89
28)
0.50
(2.76,0.84
)(2.71,0.8)
(1.76,0.52
)(1.03,0.16
)(1,0)
(1,0)
(1,0)
(1,0)
(1,0)
(0.20,2.89
28)
0.75
(10.46
,6.21)
(5.22,2.41
)(1.83,0.73
)(1.1,0.3)
(1,0.04)
(1,0)
(1,0)
(1,0)
(1,0)
(0.20,2.89
28)
1.00
(185
.01,18
6.29
)(5.61,3.5)
(1.89,0.89
)(1.17,0.39
)(1.01,0.11
)(1,0)
(1,0)
(1,0)
(1,0)
(0.20,2.89
28)
1.25
(7.72,6.22
)(3.99,2.7)
(1.85,0.96
)(1.21,0.45
)(1.03,0.18
)(1,0.01)
(1,0)
(1,0)
(1,0)
(0.20,2.89
28)
1.50
(2.78,1.88
)(2.33,1.47
)(1.61,0.83
)(1.2,0.45)
(1.05,0.21
)(1,0.02)
(1,0)
(1,0)
(1,0)
(0.20,2.89
28)
2.00
(1.34,0.63
)(1.3,0.58)
(1.2,0.46)
(1.1,0.32)
(1.04,0.19
)(1,0.04)
(1,0)
(1,0)
(1,0)
(0.20,2.89
28)
2.50
(1.09,0.31
)(1.08,0.3)
(1.06,0.25
)(1.04,0.19
)(1.02,0.13
)(1,0.04)
(1,0.01)
(1,0)
(1,0)
(0.20,2.89
28)
3.00
(1.03,0.17
)(1.03,0.16
)(1.02,0.14
)(1.01,0.12
)(1.01,0.09
)(1,0.04)
(1,0.01)
(1,0)
(1,0)
(0.30,3.01
38)
0.25
(1.5,0.5)
(1.49,0.5)
(1.46,0.5)
(1,0.01)
(1,0)
(1,0)
(1,0)
(1,0)
(1,0)
(0.30,3.01
38)
0.50
(2.95,0.94
)(2.92,0.9)
(1.84,0.53
)(1.04,0.19
)(1,0)
(1,0)
(1,0)
(1,0)
(1,0)
(0.30,3.01
38)
0.75
(14.71
,10.61
)(6.11,3.25
)(1.92,0.76
)(1.11,0.32
)(1,0.04)
(1,0)
(1,0)
(1,0)
(1,0)
(0.30,3.01
38)
1.00
(185
.94,18
6.66
)(6.27,4.24
)(1.97,0.94
)(1.19,0.41
)(1.01,0.12
)(1,0)
(1,0)
(1,0)
(1,0)
(0.30,3.01
38)
1.25
(8.42,7.06
)(4.25,2.95
)(1.91,1.01
)(1.24,0.47
)(1.04,0.19
)(1,0.01)
(1,0)
(1,0)
(1,0)
(0.30,3.01
38)
1.50
(2.89,1.97
)(2.41,1.53
)(1.66,0.87
)(1.23,0.47
)(1.05,0.22
)(1,0.02)
(1,0)
(1,0)
(1,0)
(0.30,3.01
38)
2.00
(1.37,0.65
)(1.32,0.59
)(1.22,0.47
)(1.11,0.33
)(1.04,0.2)
(1,0.04)
(1,0)
(1,0)
(1,0)
(0.30,3.01
38)
2.50
(1.1,0.32)
(1.09,0.3)
(1.07,0.26
)(1.04,0.2)
(1.02,0.14
)(1,0.04)
(1,0.01)
(1,0)
(1,0)
(0.30,3.01
38)
3.00
(1.03,0.17
)(1.03,0.17
)(1.02,0.15
)(1.01,0.12
)(1.01,0.09
)(1,0.04)
(1,0.01)
(1,0)
(1,0)
A. HAQ, J. BROWN AND E. MOLTCHANOVA
Copyright © 2014 John Wiley & Sons, Ltd. Qual. Reliab. Engng. Int. 2014

Table
II.(ARL,SDRL)values
oftheMaxEW
MA-ODRS
Scontrolchartwhen
thein-controlA
RLisfixedto
250
(ξ,L
4)
ρ↓δ→
0.00
0.25
0.50
0.75
1.00
1.50
2.00
2.50
3.00
(0.05,2.52
50)
0.25
(1.13,0.34
)(1.13,0.33
)(1.08,0.27
)(1,0)
(1,0)
(1,0)
(1,0)
(1,0)
(1,0)
(0.05,2.52
50)
0.50
(2.4,0.75)
(2.36,0.71
)(1.54,0.52
)(1.01,0.09
)(1,0)
(1,0)
(1,0)
(1,0)
(1,0)
(0.05,2.52
50)
0.75
(7.8,3.95)
(4.29,1.94
)(1.64,0.66
)(1.06,0.23
)(1,0.02)
(1,0)
(1,0)
(1,0)
(1,0)
(0.05,2.52
50)
1.00
(249
.53,26
3.5)
(4.81,2.97
)(1.72,0.81
)(1.12,0.33
)(1.01,0.08
)(1,0)
(1,0)
(1,0)
(1,0)
(0.05,2.52
50)
1.25
(6.91,5.59
)(3.57,2.51
)(1.69,0.88
)(1.16,0.39
)(1.02,0.14
)(1,0.01)
(1,0)
(1,0)
(1,0)
(0.05,2.52
50)
1.50
(2.54,1.77
)(2.12,1.37
)(1.49,0.76
)(1.15,0.39
)(1.03,0.17
)(1,0.01)
(1,0)
(1,0)
(1,0)
(0.05,2.52
50)
2.00
(1.29,0.58
)(1.25,0.53
)(1.16,0.41
)(1.07,0.27
)(1.03,0.16
)(1,0.03)
(1,0)
(1,0)
(1,0)
(0.05,2.52
50)
2.50
(1.07,0.27
)(1.07,0.26
)(1.05,0.22
)(1.03,0.17
)(1.01,0.11
)(1,0.03)
(1,0)
(1,0)
(1,0)
(0.05,2.52
50)
3.00
(1.02,0.15
)(1.02,0.14
)(1.01,0.12
)(1.01,0.1)
(1.01,0.07
)(1,0.03)
(1,0.01)
(1,0)
(1,0)
(0.10,2.82
55)
0.25
(1.32,0.47
)(1.32,0.47
)(1.27,0.45
)(1,0.01)
(1,0)
(1,0)
(1,0)
(1,0)
(1,0)
(0.10,2.82
55)
0.50
(2.66,0.79
)(2.63,0.77
)(1.72,0.52
)(1.02,0.14
)(1,0.01)
(1,0)
(1,0)
(1,0)
(1,0)
(0.10,2.82
55)
0.75
(8.98,4.51
)(4.9,2.13)
(1.79,0.71
)(1.09,0.28
)(1,0.04)
(1,0)
(1,0)
(1,0)
(1,0)
(0.10,2.82
55)
1.00
(250
.37,25
4.99
)(5.38,3.2)
(1.86,0.87
)(1.16,0.38
)(1.01,0.1)
(1,0)
(1,0)
(1,0)
(1,0)
(0.10,2.82
55)
1.25
(7.66,5.95
)(3.97,2.68
)(1.82,0.95
)(1.2,0.44)
(1.03,0.17
)(1,0.01)
(1,0)
(1,0)
(1,0)
(0.10,2.82
55)
1.50
(2.76,1.88
)(2.29,1.46
)(1.59,0.82
)(1.19,0.43
)(1.04,0.2)
(1,0.02)
(1,0)
(1,0)
(1,0)
(0.10,2.82
55)
2.00
(1.34,0.62
)(1.29,0.57
)(1.19,0.45
)(1.1,0.31)
(1.03,0.18
)(1,0.04)
(1,0)
(1,0)
(1,0)
(0.10,2.82
55)
2.50
(1.09,0.3)
(1.08,0.28
)(1.06,0.24
)(1.03,0.19
)(1.02,0.13
)(1,0.04)
(1,0.01)
(1,0)
(1,0)
(0.10,2.82
55)
3.00
(1.03,0.16
)(1.02,0.15
)(1.02,0.14
)(1.01,0.11
)(1.01,0.08
)(1,0.04)
(1,0.01)
(1,0)
(1,0)
(0.20,3.06
83)
0.25
(1.55,0.5)
(1.55,0.5)
(1.52,0.5)
(1,0.02)
(1,0)
(1,0)
(1,0)
(1,0)
(1,0)
(0.20,3.06
83)
0.50
(2.93,0.87
)(2.89,0.85
)(1.86,0.52
)(1.04,0.2)
(1,0)
(1,0)
(1,0)
(1,0)
(1,0)
(0.20,3.06
83)
0.75
(11.62
,6.92)
(5.67,2.61
)(1.93,0.75
)(1.12,0.33
)(1,0.05)
(1,0)
(1,0)
(1,0)
(1,0)
(0.20,3.06
83)
1.00
(249
.93,25
1.23
)(6.05,3.74
)(1.99,0.93
)(1.2,0.41)
(1.02,0.13
)(1,0)
(1,0)
(1,0)
(1,0)
(0.20,3.06
83)
1.25
(8.48,6.73
)(4.29,2.89
)(1.93,1.01
)(1.25,0.48
)(1.04,0.2)
(1,0.01)
(1,0)
(1,0)
(1,0)
(0.20,3.06
83)
1.50
(2.94,1.98
)(2.45,1.55
)(1.67,0.87
)(1.23,0.47
)(1.05,0.23
)(1,0.02)
(1,0)
(1,0)
(1,0)
(0.20,3.06
83)
2.00
(1.38,0.66
)(1.33,0.61
)(1.22,0.48
)(1.11,0.34
)(1.04,0.2)
(1,0.04)
(1,0)
(1,0)
(1,0)
(0.20,3.06
83)
2.50
(1.1,0.32)
(1.09,0.31
)(1.07,0.26
)(1.04,0.21
)(1.02,0.14
)(1,0.05)
(1,0.01)
(1,0)
(1,0)
(0.20,3.06
83)
3.00
(1.03,0.18
)(1.03,0.17
)(1.02,0.15
)(1.02,0.12
)(1.01,0.1)
(1,0.04)
(1,0.01)
(1,0)
(1,0)
(0.30,3.18
51)
0.25
(1.66,0.47
)(1.66,0.47
)(1.64,0.48
)(1,0.03)
(1,0)
(1,0)
(1,0)
(1,0)
(1,0)
(0.30,3.18
51)
0.50
(3.15,1)
(3.12,0.96
)(1.95,0.53
)(1.05,0.23
)(1,0)
(1,0)
(1,0)
(1,0)
(1,0)
(0.30,3.18
51)
0.75
(17.19
,12.9)
(6.76,3.68
)(2.02,0.79
)(1.15,0.36
)(1,0.05)
(1,0)
(1,0)
(1,0)
(1,0)
(0.30,3.18
51)
1.00
(250
.08,25
1.92
)(6.85,4.63
)(2.06,0.98
)(1.22,0.43
)(1.02,0.14
)(1,0)
(1,0)
(1,0)
(1,0)
(0.30,3.18
51)
1.25
(9.23,7.64
)(4.59,3.2)
(2,1.06)
(1.27,0.49
)(1.05,0.21
)(1,0.01)
(1,0)
(1,0)
(1,0)
(0.30,3.18
51)
1.50
(3.04,2.08
)(2.54,1.61
)(1.72,0.9)
(1.25,0.49
)(1.06,0.24
)(1,0.02)
(1,0)
(1,0)
(1,0)
(0.30,3.18
51)
2.00
(1.4,0.68)
(1.35,0.63
)(1.24,0.5)
(1.13,0.35
)(1.05,0.22
)(1,0.05)
(1,0)
(1,0)
(1,0)
(0.30,3.18
51)
2.50
(1.11,0.33
)(1.1,0.32)
(1.07,0.27
)(1.05,0.21
)(1.02,0.15
)(1,0.05)
(1,0.01)
(1,0)
(1,0)
(0.30,3.18
51)
3.00
(1.03,0.19
)(1.03,0.18
)(1.02,0.16
)(1.02,0.13
)(1.01,0.1)
(1,0.04)
(1,0.01)
(1,0)
(1,0)
A. HAQ, J. BROWN AND E. MOLTCHANOVA
Copyright © 2014 John Wiley & Sons, Ltd. Qual. Reliab. Engng. Int. 2014
Table
III.(ARL,SDRL)values
oftheMaxEW
MA-ODRS
Scontrolchartwhen
thein-controlA
RLisfixedto
370
(ξ,L
4)
ρ↓δ→
0.00
0.25
0.50
0.75
1.00
1.50
2.00
2.50
3.00
(0.05,2.76
59)
0.25
(1.27,0.45
)(1.27,0.45
)(1.22,0.42
)(1,0)
(1,0)
(1,0)
(1,0)
(1,0)
(1,0)
(0.05,2.76
59)
0.50
(2.6,0.78)
(2.56,0.75
)(1.68,0.52
)(1.02,0.14
)(1,0)
(1,0)
(1,0)
(1,0)
(1,0)
(0.05,2.76
59)
0.75
(8.61,4.18
)(4.76,2.1)
(1.76,0.7)
(1.08,0.27
)(1,0.03)
(1,0)
(1,0)
(1,0)
(1,0)
(0.05,2.76
59)
1.00
(370
.32,38
4.02
)(5.29,3.16
)(1.83,0.86
)(1.15,0.37
)(1.01,0.1)
(1,0)
(1,0)
(1,0)
(1,0)
(0.05,2.76
59)
1.25
(7.7,6.03)
(3.94,2.7)
(1.79,0.95
)(1.19,0.43
)(1.03,0.16
)(1,0.01)
(1,0)
(1,0)
(1,0)
(0.05,2.76
59)
1.50
(2.74,1.9)
(2.28,1.47
)(1.57,0.81
)(1.19,0.43
)(1.04,0.2)
(1,0.02)
(1,0)
(1,0)
(1,0)
(0.05,2.76
59)
2.00
(1.33,0.62
)(1.29,0.57
)(1.19,0.45
)(1.09,0.3)
(1.03,0.18
)(1,0.03)
(1,0)
(1,0)
(1,0)
(0.05,2.76
59)
2.50
(1.08,0.29
)(1.08,0.28
)(1.06,0.24
)(1.03,0.18
)(1.02,0.12
)(1,0.04)
(1,0.01)
(1,0)
(1,0)
(0.05,2.76
59)
3.00
(1.03,0.16
)(1.02,0.16
)(1.02,0.14
)(1.01,0.11
)(1.01,0.08
)(1,0.03)
(1,0.01)
(1,0)
(1,0)
(0.10,3.05
35)
0.25
(1.53,0.5)
(1.53,0.5)
(1.5,0.5)
(1,0.01)
(1,0)
(1,0)
(1,0)
(1,0)
(1,0)
(0.10,3.05
35)
0.50
(2.87,0.83
)(2.83,0.8)
(1.85,0.51
)(1.04,0.19
)(1,0)
(1,0)
(1,0)
(1,0)
(1,0)
(0.10,3.05
35)
0.75
(9.92,4.83
)(5.4,2.28)
(1.92,0.74
)(1.12,0.33
)(1,0.05)
(1,0)
(1,0)
(1,0)
(1,0)
(0.10,3.05
35)
1.00
(370
.43,37
7.6)
(5.84,3.39
)(1.98,0.92
)(1.2,0.41)
(1.02,0.12
)(1,0)
(1,0)
(1,0)
(1,0)
(0.10,3.05
35)
1.25
(8.48,6.47
)(4.33,2.89
)(1.93,1.01
)(1.24,0.47
)(1.04,0.19
)(1,0.01)
(1,0)
(1,0)
(1,0)
(0.10,3.05
35)
1.50
(2.95,1.99
)(2.46,1.58
)(1.67,0.88
)(1.23,0.47
)(1.05,0.23
)(1,0.02)
(1,0)
(1,0)
(1,0)
(0.10,3.05
35)
2.00
(1.38,0.66
)(1.33,0.61
)(1.23,0.49
)(1.11,0.33
)(1.04,0.2)
(1,0.04)
(1,0)
(1,0)
(1,0)
(0.10,3.05
35)
2.50
(1.1,0.32)
(1.09,0.31
)(1.07,0.26
)(1.04,0.21
)(1.02,0.14
)(1,0.05)
(1,0.01)
(1,0)
(1,0)
(0.10,3.05
35)
3.00
(1.03,0.18
)(1.03,0.17
)(1.02,0.15
)(1.02,0.12
)(1.01,0.09
)(1,0.04)
(1,0.01)
(1,0)
(1,0)
(0.20,3.28
86)
0.25
(1.75,0.43
)(1.75,0.43
)(1.74,0.44
)(1,0.04)
(1,0)
(1,0)
(1,0)
(1,0)
(1,0)
(0.20,3.28
86)
0.50
(3.15,0.92
)(3.13,0.89
)(1.99,0.52
)(1.07,0.26
)(1,0.01)
(1,0)
(1,0)
(1,0)
(1,0)
(0.20,3.28
86)
0.75
(13.22
,8.07)
(6.31,2.88
)(2.06,0.79
)(1.16,0.37
)(1,0.06)
(1,0)
(1,0)
(1,0)
(1,0)
(0.20,3.28
86)
1.00
(369
.96,37
0.14
)(6.65,4.07
)(2.11,0.98
)(1.24,0.45
)(1.02,0.15
)(1,0)
(1,0)
(1,0)
(1,0)
(0.20,3.28
86)
1.25
(9.47,7.5)
(4.7,3.13)
(2.05,1.07
)(1.29,0.51
)(1.05,0.22
)(1,0.01)
(1,0)
(1,0)
(1,0)
(0.20,3.28
86)
1.50
(3.15,2.09
)(2.62,1.65
)(1.76,0.93
)(1.27,0.51
)(1.07,0.26
)(1,0.03)
(1,0)
(1,0)
(1,0)
(0.20,3.28
86)
2.00
(1.42,0.69
)(1.37,0.65
)(1.26,0.52
)(1.13,0.36
)(1.05,0.23
)(1,0.05)
(1,0.01)
(1,0)
(1,0)
(0.20,3.28
86)
2.50
(1.12,0.35
)(1.1,0.33)
(1.08,0.28
)(1.05,0.22
)(1.02,0.16
)(1,0.05)
(1,0.01)
(1,0)
(1,0)
(0.20,3.28
86)
3.00
(1.04,0.19
)(1.03,0.18
)(1.03,0.16
)(1.02,0.13
)(1.01,0.1)
(1,0.04)
(1,0.01)
(1,0)
(1,0)
(0.30,3.40
63)
0.25
(1.85,0.36
)(1.84,0.37
)(1.84,0.37
)(1,0.07)
(1,0)
(1,0)
(1,0)
(1,0)
(1,0)
(0.30,3.40
63)
0.50
(3.42,1.08
)(3.39,1.04
)(2.08,0.55
)(1.09,0.29
)(1,0.01)
(1,0)
(1,0)
(1,0)
(1,0)
(0.30,3.40
63)
0.75
(21.51
,16.75
)(7.76,4.34
)(2.15,0.83
)(1.19,0.4)
(1.01,0.07
)(1,0)
(1,0)
(1,0)
(1,0)
(0.30,3.40
63)
1.00
(369
.87,37
0.98
)(7.64,5.22
)(2.19,1.03
)(1.27,0.47
)(1.03,0.16
)(1,0)
(1,0)
(1,0)
(1,0)
(0.30,3.40
63)
1.25
(10.43
,8.76)
(5.06,3.56
)(2.12,1.12
)(1.31,0.53
)(1.06,0.24
)(1,0.01)
(1,0)
(1,0)
(1,0)
(0.30,3.40
63)
1.50
(3.27,2.23
)(2.73,1.74
)(1.82,0.97
)(1.29,0.53
)(1.08,0.27
)(1,0.03)
(1,0)
(1,0)
(1,0)
(0.30,3.40
63)
2.00
(1.45,0.71
)(1.4,0.66)
(1.28,0.54
)(1.15,0.38
)(1.06,0.24
)(1,0.06)
(1,0.01)
(1,0)
(1,0)
(0.30,3.40
63)
2.50
(1.12,0.35
)(1.11,0.34
)(1.09,0.29
)(1.06,0.24
)(1.03,0.17
)(1,0.06)
(1,0.01)
(1,0)
(1,0)
(0.30,3.40
63)
3.00
(1.04,0.2)
(1.04,0.19
)(1.03,0.17
)(1.02,0.14
)(1.01,0.11
)(1,0.05)
(1,0.02)
(1,0)
(1,0)
A. HAQ, J. BROWN AND E. MOLTCHANOVA
Copyright © 2014 John Wiley & Sons, Ltd. Qual. Reliab. Engng. Int. 2014

A. HAQ, J. BROWN AND E. MOLTCHANOVA
4. MaxEWMA-OIDRSS control chart
In practice, the judgment errors are inevitable particularly when ranking large set sizes. However, it is difficult to predict when thejudgment error occurs. Hence, in this section, we examine the effect of imperfect rankings on the performance of the MaxEWMA-ODRSS control chart.
The simulation, considered here, is based on the method suggested by Dell and Clutter 20 and used by Haq et al. 31 for OIDRSS. Recallthat for an in-control process Xt~N(μ,σ
2). The method to select an ordered imperfect ranked set sample of size n is as follows: given n,generate Xij, i=1, 2,…,n, j=1, 2,…,n2, values from a normal distribution. Partition these n3 values into n sets, each containing n2 values.Generate random errors Wij from another normal distribution with mean zero and variance Q, that is, Wij~N(0,Q), i=1, 2,…,n,j=1, 2,…,n2. Then, we compute Yij=Xij+Wij. Note here that Xij is independent of Wij. Using the values of Yij, select a double ranked set
sample of size n, denoted byYDRSSr:nð Þ for r=1, 2,…,n. In fact, pairs are selected YDRSS
r;nð Þ ; XIDRSSr:n½ �
for r=1, 2,…,n, based on the ranks of Y, where
IDRSS stands for imperfect DRSS. Note that here Y values are perfectly ranked and X values are measured with error. Let XOIDRSSr:nð Þ ¼
rth min X IDRSS1:n½ � ; X
IDRSS2:n½ � ;…; X IDRSS
n:n½ �n o
for r=1, 2,…,n, denote an ordered imperfect double ranked set sample of size n. The BLUEs of μ and
σ based on OIDRSS scheme are μ̂OIDRSSBLUE ¼ 1′Σ�1
ODRSS1� ��1
1′Σ�1ODRSSXOIDRSS and σ̂ OIDRSS
BLUE ¼ μ′ODRSSΣ
�1ODRSSμODRSS
� ��1μ′ODRSSΣ
�1ODRSSXOIDRSS ,
respectively, where X ′OIDRSS ¼ XOIDRSS
1:nð Þ ; XOIDRSS2:nð Þ ;…; XOIDRSS
n:nð Þ
1�n. In practice, we may not know when the judgment error occurs. Therefore,
both μ̂OIDRSSBLUE and σ̂ OIDRSS
BLUE are based on the coefficients of μ̂ODRSSBLUE and σ̂ ODRSS
BLUE . Note that here μ̂OIDRSSBLUE and σ̂ OIDRSS
BLUE are only linear estimators andare no longer BLUEs. Because the random variables under OIDRSS scheme are the order statistics of an imperfect double ranked set
sample, it is very difficult to derive explicit mathematical expressions for the mean and variance ofXOIDRSSr:nð Þ . Hence, Monte Carlo simulations
are used to estimate the mean and variance of XOIDRSSr:nð Þ , r=1, 2,…,n.
Let μ̂OIDRSSBLUE;i and σ̂ OIDRSS
BLUE;i , i=1, 2,…, k, be the estimated values from k subgroups, each of size n, obtained under OIDRSS scheme, where
μ̂OIDRSSBLUE;i ¼ 1′Σ�1
ODRSS1� ��1
1′Σ�1ODRSSXOIDRSS;i and σ̂ OIDRSS
BLUE;i ¼ μ′ODRSSΣ
�1ODRSSμODRSS
� ��1μ′ODRSSΣ
�1ODRSSXOIDRSS;i . Let μ̂
OIDRSSBLUE ¼ 1=kð Þ
Xki¼1
μ̂OIDRSSBLUE;i and
σ̂OIDRSS
BLUE ¼ 1=kð ÞXki¼1
σ̂ OIDRSSBLUE;i , which can be used to estimate μ and σ, respectively. Likewise, the standard deviations of μ̂OIDRSS
BLUE and
σ̂ OIDRSSBLUE can be estimated by σ̂ μ̂OIDRSS
BLUE¼
ffiffiffiffiffiffiffiffiffiffiffiffiffiffiffiffiffiffiffiffiffiffiffiffiffiffiffiffiffiffiffiffiffiffiffiffiffiffiffiffiffiffiffiffiffiffiffiffiffiffiffiffiffiffiffiffiffiffi1
k�1ð ÞXki¼1
μ̂OIDRSSBLUE;i � μ̂
OIDRSSBLUE
2vuut and σ̂ σ̂ OIDRSSBLUE
¼ffiffiffiffiffiffiffiffiffiffiffiffiffiffiffiffiffiffiffiffiffiffiffiffiffiffiffiffiffiffiffiffiffiffiffiffiffiffiffiffiffiffiffiffiffiffiffiffiffiffiffiffiffiffiffiffiffiffiffi
1k�1ð Þ
Xki¼1
σ̂ OIDRSSBLUE;i � σ̂
OIDRSS
BLUE
2vuut , respectively.
Based on μ̂OIDRSSBLUE , σ̂
OIDRSS
BLUE , σ̂ μ̂OIDRSSBLUE
and σ̂ σ̂ OIDRSSBLUE
, the MaxEWMA-OIDRSS chart can be easily constructed.
Let μ̂OIDRSSBLUE;t
n oand σ̂ OIDRSS
BLUE;t
n obe the sequences of IID variables for t= 1, 2,…. Based on μ̂OIDRSS
BLUE;t
n oand σ̂ OIDRSS
BLUE;t
n o, we define the
EWMA sequences, {Et} and {Ft}, respectively, by using the following recursive formulae:
Et ¼ ξμ̂OIDRSSBLUE;t þ 1� ξð ÞEt�1; 0 < ξ≤1; E0 ¼ μ̂
OIDRSSBLUE ; (26)
Ft ¼ ξσ̂ OIDRSSBLUE;t þ 1� ξð ÞFt�1; 0 < ξ≤1; F0 ¼ σ̂
OIDRSS
BLUE : (27)
Let E�t and F�t be the standardized statistics based on {Et} and {Ft}, defined by
E�t ¼Et � μ̂
OIDRSSBLUEffiffiffiffiffiffiffiffiffiffiffiffiffiffiffiffiffiffiffiffiffiffiffiffiffiffiffiffiffiffiffiffiffiffi
π ξ; tð Þ σ̂ μ̂OIDRSSBLUE;t
2r and F�t ¼Ft � σ̂
OIDRSS
BLUEffiffiffiffiffiffiffiffiffiffiffiffiffiffiffiffiffiffiffiffiffiffiffiffiffiffiffiffiffiffiffiffiffiffiffiπ ξ; tð Þ σ̂ σ̂ OIDRSS
BLUE;t
2r : (28)
The plotting-statistic of the MaxEWMA-OIDRSS control chart is defined as
MEOIDRSSt ¼ max E�t�� ��; F�t
�� ��� ; t ¼ 1; 2;…; (29)
Because MEOIDRSSt is non-negative, the initial state of the MaxEWMA-OIDRSS chart requires only an UCLOIDRSS, given by
UCLOIDRSS ¼ E MEOIDRSSt
� �þ L5
ffiffiffiffiffiffiffiffiffiffiffiffiffiffiffiffiffiffiffiffiffiffiffiffiffiffiffiffiffiVar MEOIDRSSt
� �q; (30)
where L5 is the width of the control limits. The value of L5 can be selected such that the in-control ARL of the MaxEWMA-OIDRSS control chart reaches a certain level. The MaxEWMA-OIDRSS control chart generates an out-of-control wheneverMEOIDRSSt exceeds UCLOIDRSS. Similar to the MaxEWMA-ODRSS chart, here we estimate E MEOIDRSSt
� �and Var MEOIDRSSt
� �using
Monte Carlo simulations.In order to study the run length properties of the MaxEWMA-OIDRSS control chart, we first need to estimate the means and
standard deviations of the BLUEs-OIDRSS, and E MEOIDRSSt
� �and Var MEOIDRSSt
� �. Recall that for an in-control process Xt~N(0, 1). The
Copyright © 2014 John Wiley & Sons, Ltd. Qual. Reliab. Engng. Int. 2014

A. HAQ, J. BROWN AND E. MOLTCHANOVA
subgroup size is taken to be n=5 with ξ = 0.05, 0.10, 0.20, 0.30. Different values of error variance Q are also considered, that is,Q=0.05, 0.15, 0.30, 0.50. Based on 107 iterations, we estimate the means and standard deviations of the BLUEs-OIDRSS. Then, based
on another simulation, the numerical values of E MEOIDRSSt
� �and Var MEOIDRSSt
� �are calculated by using 5 × 10⁷ iterations. The ARLs and
SDRLs of the MaxEWMA-OIDRSS control chart are calculated by using 100,000 iterations using different values of δ and ρ. Note that forthe MaxEWMA-OIDRSS control chart, we consider L5 = L4 in order to study the stability of the false alarm under imperfect rankings. Therun length properties of the MaxEWMA-OIDRSS control chart are reported in Tables IV–VI.
From Tables IV–VI, we observe that the run length performance of the MaxEWMA-OIDRSS control chart is very much similar to thatof the MaxEWMA-ODRSS control chart in terms of out-of-control ARLs and SDRLs. The sensitivity of the MaxEWMA-OIDRSS controlchart increases as the value of Q decreases and vice versa. Remember that all results of the MaxEWMA-OIDRSS control chart are basedon the values of L4. It is also observed that, when ξ ≤ 0.10 and with imperfect rankings, the in-control ARLs of the MaxEWMA-OIDRSScontrol chart remain roughly equivalent to the in-control ARLs of the MaxEWMA-ODRSS control chart. However, when ξ > 0.10,generally, the false alarm under MaxEWMA-OIDRSS scheme decreases as the value of Q increases. Moreover, a decrease in the falsealarm rate also affects the detection abilities of the MaxEWMA-OIDRSS control chart for an out-of-control process.
5. Performance comparisons of control charts
The purpose of this section is to compare the run length performances of the proposed MaxEWMA control charts with that of theircounterparts.
5.1. MaxEWMA-ODRSS control chart versus optimal MaxEWMA-SRS, optimal MaxGWMA-SRS and MaxEWMA-ORSS control charts
In Tables VII–IX, the run length performances of the proposed MaxEWMA control chart is compared with that of other charts usingdifferent values of in-control ARL, ξ , δ and ρ. The values of the ARL and SDRL of the optimal MaxEWMA-SRS, optimal MaxGWMA-SRS and MaxEWMA-ORSS control charts are taken from Sheu et al. 15 and Haq et al. 29, respectively. It is worth mentioning that theMaxEWMA-ODRSS control chart performs uniformly better than the control charts considered here, that is, all of the out-of-controlARLs and SDRLs of the MaxEWMA-ODRSS control chart are uniformly less than those with the optimal MaxEWMA-SRS, optimalMaxGWMA-SRS and MaxEWMA-ORSS control charts.
5.2. MaxEWMA-OIDRSS control chart versus optimal MaxEWMA-SRS, optimal MaxGWMA-SRS and MaxEWMA-OIRSS control charts
In Table X, the run length characteristics of the MaxEWMA-OIDRSS control chart using different values of Q are compared with that ofthe other control charts. In this comparison, the in-control ARLs of the MaxEWMA-SRS and MaxGWMA-SRS control charts are fixed to370 with ξ = 0.05. The values of ARLs and SDRLs of the MaxEWMA-OIRSS control chart are taken from Haq et al. 29. It is clear that, evenwith imperfect rankings, the proposed MaxEWMA-OIDRSS control chart turns out to be more sensitive than its counterparts whendetecting all different shifts in the process mean and/or process dispersion.
5.3. Diagnostic abilities: MaxEWMA-ODRSS control chart versus MaxEWMA-ORSS control chart
Haq et al. 29 showed that the diagnostic abilities of the MaxEWMA-ORSS control chart are better than those of the MaxEWMA-SRS andMaxGWMA-SRS control charts. Therefore, for brevity of discussion, we only compare the diagnostic abilities of the MaxEWMA-ORSSand MaxEWMA-ODRSS control charts. For each shift combination of (δ, ρ), one thousand out-of-control signals for each of the controlchart were simulated. Then, based on the rules described in Section 3, the number of out-of-control signals detected by theMaxEWMA-ORSS and MaxEWMA-ODRSS control charts was counted. For both of these MaxEWMA control schemes, the in-controlARL was fixed to 370 with ξ =0.05 using time-varying control limits. The results obtained from earlier study are reported in Table XI.From Table XI, it can be observed that, for an in-control process (δ=0, ρ= 1), both MaxEWMA control charts have almost similarstatistical performances in detecting an increase or decrease in the process mean and dispersion. However, in most of out-of-controlcases, the MaxEWMA-ODRSS control chart has superior diagnostic abilities than those with the MaxEWMA-ORSS control chart. Forexample, consider detecting a positive shift in both the process mean and the process variability, say δ= ρ= 2, out of 1000 samplesunder both MaxEWMA control schemes. With the MaxEWMA-ORSS control chart, 408 and 590 samples are signaling ‘m+’ and ‘++’,respectively. However, with the MaxEWMA-ODRSS control chart, 281 and 719 samples are signaling ‘m+’ and ‘++’, respectively.
6. An application to real data
A real data set is considered to explain the implementations of the MaxEWMA-SRS, MaxGWMA-SRS, MaxEWMA-ORSS and theMaxEWMA-ODRSS control charts.
Suppose that our interest lies in establishing a statistical control of the inside diameters of the piston rings for an automotiveengine manufactured by a forging process. For this task, 40 samples, each of size five, have been taken from this process. The insidediameters of the piston rings are measured in millimeters (mm). The complete data set is available in Montgomery.36 In order to applythe MaxEWMA and MaxGWMA control charts, we need to collect samples under SRS, ORSS and ODRSS schemes, respectively. For this
Copyright © 2014 John Wiley & Sons, Ltd. Qual. Reliab. Engng. Int. 2014

Table
IV.(ARL,SDRL)values
oftheMaxEW
MA-OIDRS
Scontrolchartwhen
thein-controlA
RLoftheMaxEW
MA-ORS
Scontrolchartisfixedto
185
Q=0.05
Q=0.15
(ξ,L
4)
ρ↓δ→
0.00
0.25
0.50
1.00
2.00
0.00
0.25
0.50
1.00
2.00
(0.05,2.33
74)
0.25
(1.17,0.37
)(1.17,0.37
)(1.12,0.32
)(1,0)
(1,0)
(1.35,0.48
)(1.35,0.48
)(1.32,0.47
)(1,0.01)
(1,0)
(0.05,2.33
74)
0.50
(2.38,0.83
)(2.31,0.8)
(1.62,0.57
)(1,0.02)
(1,0)
(2.63,0.95
)(2.56,0.92
)(1.91,0.68
)(1.01,0.11
)(1,0)
(0.05,2.33
74)
1.00
(184
.69,19
8.43
)(5.28,3.44
)(1.87,0.94
)(1.02,0.14
)(1,0)
(185
.73,20
1.07
)(6.64,4.48
)(2.28,1.22
)(1.07,0.26
)(1,0)
(0.05,2.33
74)
1.50
(2.55,1.78
)(2.16,1.41
)(1.54,0.81
)(1.05,0.21
)(1,0)
(2.77,1.97
)(2.39,1.6)
(1.73,0.98
)(1.1,0.31)
(1,0.01)
(0.05,2.33
74)
2.00
(1.29,0.59
)(1.26,0.54
)(1.17,0.43
)(1.03,0.18
)(1,0)
(1.35,0.65
)(1.31,0.6)
(1.23,0.5)
(1.06,0.24
)(1,0.01)
(0.10,2.64
29)
0.25
(1.35,0.48
)(1.35,0.48
)(1.3,0.46)
(1,0)
(1,0)
(1.59,0.49
)(1.59,0.49
)(1.57,0.5)
(1,0.02)
(1,0)
(0.10,2.64
29)
0.50
(2.66,0.89
)(2.61,0.85
)(1.82,0.6)
(1,0.03)
(1,0)
(2.95,1.01
)(2.89,0.98
)(2.14,0.72
)(1.02,0.15
)(1,0)
(0.10,2.64
29)
1.00
(187
.15,19
1.78
)(5.93,3.71
)(2.04,1.01
)(1.03,0.17
)(1,0)
(186
.44,19
0.52
)(7.47,4.9)
(2.5,1.32)
(1.1,0.3)
(1,0)
(0.10,2.64
29)
1.50
(2.78,1.92
)(2.36,1.53
)(1.66,0.89
)(1.06,0.25
)(1,0)
(3.03,2.1)
(2.63,1.75
)(1.87,1.06
)(1.13,0.35
)(1,0.01)
(0.10,2.64
29)
2.00
(1.35,0.64
)(1.3,0.59)
(1.21,0.47
)(1.04,0.21
)(1,0.01)
(1.41,0.7)
(1.37,0.66
)(1.28,0.55
)(1.07,0.27
)(1,0.02)
(0.20,2.89
28)
0.25
(1.54,0.5)
(1.54,0.5)
(1.49,0.5)
(1,0)
(1,0)
(1.79,0.42
)(1.79,0.42
)(1.77,0.43
)(1,0.05)
(1,0)
(0.20,2.89
28)
0.50
(2.94,0.97
)(2.89,0.94
)(1.99,0.63
)(1,0.05)
(1,0)
(3.28,1.12
)(3.23,1.09
)(2.37,0.78
)(1.04,0.2)
(1,0)
(0.20,2.89
28)
1.00
(185
.51,18
6.41
)(6.76,4.41
)(2.2,1.08)
(1.04,0.2)
(1,0)
(187
.01,18
8.17
)(8.72,6.07
)(2.71,1.42
)(1.13,0.35
)(1,0)
(0.20,2.89
28)
1.50
(2.97,2.02
)(2.53,1.62
)(1.76,0.95
)(1.08,0.28
)(1,0)
(3.23,2.21
)(2.82,1.85
)(2,1.13)
(1.16,0.39
)(1,0.01)
(0.20,2.89
28)
2.00
(1.4,0.68)
(1.35,0.63
)(1.25,0.51
)(1.06,0.24
)(1,0.01)
(1.47,0.74
)(1.43,0.7)
(1.32,0.59
)(1.09,0.3)
(1,0.02)
(0.30,3.01
38)
0.25
(1.63,0.48
)(1.64,0.48
)(1.6,0.49)
(1,0)
(1,0)
(1.87,0.37
)(1.87,0.37
)(1.86,0.37
)(1,0.06)
(1,0)
(0.30,3.01
38)
0.50
(3.17,1.1)
(3.12,1.06
)(2.09,0.66
)(1,0.05)
(1,0)
(3.56,1.31
)(3.51,1.26
)(2.52,0.85
)(1.05,0.22
)(1,0)
(0.30,3.01
38)
1.00
(186
.88,18
7.75
)(7.72,5.52
)(2.3,1.15)
(1.05,0.21
)(1,0)
(190
.87,19
0.58
)(10.25
,7.81)
(2.86,1.53
)(1.15,0.37
)(1,0)
(0.30,3.01
38)
1.50
(3.07,2.1)
(2.62,1.68
)(1.81,0.98
)(1.09,0.3)
(1,0)
(3.37,2.34
)(2.92,1.93
)(2.07,1.17
)(1.18,0.41
)(1,0.01)
(0.30,3.01
38)
2.00
(1.41,0.69
)(1.37,0.64
)(1.27,0.53
)(1.06,0.24
)(1,0.01)
(1.49,0.76
)(1.45,0.72
)(1.34,0.61
)(1.1,0.32)
(1,0.02)
(ξ,L
4)
ρ↓δ→
Q=0.30
Q=0.50
(0.05,2.33
74)
0.25
(1.58,0.5)
(1.59,0.49
)(1.57,0.5)
(1,0.05)
(1,0)
(1.78,0.43
)(1.78,0.43
)(1.78,0.43
)(1.02,0.15
)(1,0)
(0.05,2.33
74)
0.50
(2.92,1.04
)(2.86,1.01
)(2.22,0.78
)(1.06,0.24
)(1,0)
(3.18,1.11
)(3.14,1.09
)(2.52,0.85
)(1.15,0.36
)(1,0)
(0.05,2.33
74)
1.00
(185
.05,19
9.22
)(8.11,5.66
)(2.74,1.55
)(1.17,0.39
)(1,0)
(185
.33,19
8.98
)(9.59,6.88
)(3.2,1.88)
(1.28,0.5)
(1,0.01)
(0.05,2.33
74)
1.50
(2.98,2.15
)(2.62,1.81
)(1.93,1.15
)(1.18,0.41
)(1,0.01)
(3.14,2.32
)(2.8,2)
(2.1,1.32)
(1.26,0.5)
(1,0.03)
(0.05,2.33
74)
2.00
(1.41,0.71
)(1.37,0.67
)(1.28,0.57
)(1.09,0.3)
(1,0.02)
(1.46,0.76
)(1.43,0.73
)(1.34,0.63
)(1.13,0.36
)(1,0.04)
(0.10,2.64
29)
0.25
(1.83,0.39
)(1.83,0.39
)(1.83,0.39
)(1.01,0.12
)(1,0)
(1.97,0.28
)(1.97,0.27
)(1.97,0.27
)(1.09,0.28
)(1,0)
(0.10,2.64
29)
0.50
(3.27,1.12
)(3.22,1.09
)(2.51,0.83
)(1.11,0.31
)(1,0)
(3.59,1.21
)(3.54,1.18
)(2.86,0.92
)(1.23,0.43
)(1,0)
(0.10,2.64
29)
1.00
(187
.52,19
2.64
)(9.23,6.26
)(3.03,1.67
)(1.22,0.44
)(1,0)
(186
.53,19
1.26
)(11,7.74
)(3.55,2.03
)(1.36,0.56
)(1,0.01)
(0.10,2.64
29)
1.50
(3.26,2.3)
(2.88,1.95
)(2.11,1.26
)(1.23,0.47
)(1,0.02)
(3.46,2.49
)(3.08,2.14
)(2.31,1.43
)(1.33,0.56
)(1,0.04)
(0.10,2.64
29)
2.00
(1.48,0.76
)(1.44,0.73
)(1.35,0.62
)(1.12,0.34
)(1,0.03)
(1.53,0.82
)(1.5,0.78)
(1.41,0.69
)(1.16,0.41
)(1,0.06)
(0.20,2.89
28)
0.25
(1.97,0.28
)(1.97,0.28
)(1.97,0.27
)(1.04,0.19
)(1,0)
(2.07,0.28
)(2.07,0.28
)(2.07,0.27
)(1.18,0.38
)(1,0)
(0.20,2.89
28)
0.50
(3.66,1.26
)(3.62,1.23
)(2.8,0.91)
(1.16,0.37
)(1,0)
(4.04,1.39
)(4,1.36)
(3.21,1.03
)(1.31,0.47
)(1,0)
(0.20,2.89
28)
1.00
(189
.33,19
0.49
)(11,8.06
)(3.3,1.81)
(1.27,0.48
)(1,0)
(188
.93,19
0.25
)(13.39
,10.27
)(3.89,2.22
)(1.42,0.59
)(1,0.02)
(0.20,2.89
28)
1.50
(3.47,2.4)
(3.09,2.07
)(2.26,1.34
)(1.27,0.51
)(1,0.02)
(3.68,2.6)
(3.32,2.27
)(2.48,1.51
)(1.39,0.61
)(1,0.05)
(0.20,2.89
28)
2.00
(1.54,0.81
)(1.5,0.77)
(1.4,0.66)
(1.15,0.38
)(1,0.04)
(1.6,0.86)
(1.56,0.83
)(1.47,0.73
)(1.2,0.45)
(1,0.07)
(0.30,3.01
38)
0.25
(2.03,0.27
)(2.03,0.27
)(2.02,0.26
)(1.06,0.24
)(1,0)
(2.14,0.35
)(2.14,0.35
)(2.13,0.34
)(1.24,0.43
)(1,0)
(0.30,3.01
38)
0.50
(4.06,1.53
)(4,1.49)
(3.01,1.03
)(1.19,0.39
)(1,0)
(4.53,1.75
)(4.51,1.73
)(3.5,1.2)
(1.36,0.49
)(1,0)
(0.30,3.01
38)
1.00
(193
.01,19
2.81
)(13.38
,10.86
)(3.52,2.02
)(1.3,0.5)
(1,0)
(193
.32,19
2.54
)(16.35
,13.75
)(4.2,2.52)
(1.46,0.62
)(1,0.02)
(0.30,3.01
38)
1.50
(3.64,2.58
)(3.24,2.17
)(2.35,1.4)
(1.3,0.53)
(1,0.02)
(3.86,2.79
)(3.45,2.38
)(2.59,1.59
)(1.42,0.64
)(1,0.05)
(0.30,3.01
38)
2.00
(1.57,0.82
)(1.53,0.79
)(1.43,0.68
)(1.16,0.4)
(1,0.04)
(1.63,0.89
)(1.59,0.85
)(1.5,0.76)
(1.22,0.47
)(1.01,0.07
)
A. HAQ, J. BROWN AND E. MOLTCHANOVA
Copyright © 2014 John Wiley & Sons, Ltd. Qual. Reliab. Engng. Int. 2014

Table
V.(ARL,SDRL)values
oftheMaxEW
MA-OIDRS
Scontrolchartwhen
thein-controlA
RLoftheMaxEW
MA-ORS
Scontrolchartisfixedto
250
Q=0.05
Q=0.15
(ξ,L
4)
ρ↓δ→
0.00
0.25
0.50
1.00
2.00
0.00
0.25
0.50
1.00
2.00
(0.05,2.52
50)
0.25
(1.27,0.44
)(1.27,0.44
)(1.22,0.41
)(1,0)
(1,0)
(1.5,0.5)
(1.5,0.5)
(1.46,0.5)
(1,0.01)
(1,0)
(0.05,2.52
50)
0.50
(2.54,0.86
)(2.49,0.83
)(1.74,0.59
)(1,0.02)
(1,0)
(2.82,0.98
)(2.76,0.95
)(2.05,0.7)
(1.02,0.13
)(1,0)
(0.05,2.52
50)
1.00
(249
.9,264
.78)
(5.7,3.62)
(1.97,0.98
)(1.02,0.16
)(1,0)
(249
.82,26
3.6)
(7.16,4.7)
(2.42,1.29
)(1.09,0.28
)(1,0)
(0.05,2.52
50)
1.50
(2.7,1.88)
(2.29,1.5)
(1.61,0.87
)(1.06,0.24
)(1,0)
(2.94,2.08
)(2.56,1.72
)(1.83,1.04
)(1.12,0.34
)(1,0.01)
(0.05,2.52
50)
2.00
(1.33,0.62
)(1.28,0.57
)(1.19,0.45
)(1.04,0.2)
(1,0.01)
(1.39,0.68
)(1.35,0.64
)(1.26,0.53
)(1.07,0.26
)(1,0.01)
(0.10,2.82
55)
0.25
(1.49,0.5)
(1.49,0.5)
(1.44,0.5)
(1,0)
(1,0)
(1.74,0.45
)(1.74,0.45
)(1.72,0.45
)(1,0.04)
(1,0)
(0.10,2.82
55)
0.50
(2.84,0.92
)(2.79,0.89
)(1.94,0.62
)(1,0.04)
(1,0)
(3.15,1.05
)(3.1,1.02)
(2.29,0.75
)(1.04,0.18
)(1,0)
(0.10,2.82
55)
1.00
(252
.13,25
6.83
)(6.41,3.94
)(2.15,1.06
)(1.04,0.19
)(1,0)
(253
.01,25
7.81
)(8.09,5.18
)(2.64,1.37
)(1.12,0.33
)(1,0)
(0.10,2.82
55)
1.50
(2.93,2)
(2.5,1.61)
(1.74,0.94
)(1.08,0.27
)(1,0)
(3.21,2.21
)(2.79,1.84
)(1.98,1.13
)(1.15,0.38
)(1,0.01)
(0.10,2.82
55)
2.00
(1.38,0.66
)(1.34,0.62
)(1.24,0.5)
(1.05,0.23
)(1,0.01)
(1.45,0.73
)(1.41,0.69
)(1.31,0.58
)(1.09,0.29
)(1,0.01)
(0.20,3.06
83)
0.25
(1.67,0.47
)(1.68,0.47
)(1.64,0.48
)(1,0)
(1,0)
(1.9,0.34)
(1.9,0.34)
(1.89,0.34
)(1,0.07)
(1,0)
(0.20,3.06
83)
0.50
(3.12,1.01
)(3.08,0.98
)(2.11,0.65
)(1,0.06)
(1,0)
(3.49,1.17
)(3.44,1.14
)(2.52,0.81
)(1.06,0.23
)(1,0)
(0.20,3.06
83)
1.00
(253
.61,25
5.28
)(7.33,4.77
)(2.31,1.13
)(1.05,0.22
)(1,0)
(255
.28,25
6.65
)(9.51,6.61
)(2.87,1.48
)(1.15,0.37
)(1,0)
(0.20,3.06
83)
1.50
(3.12,2.12
)(2.68,1.71
)(1.84,1)
(1.1,0.3)
(1,0)
(3.4,2.31)
(2.99,1.94
)(2.11,1.2)
(1.19,0.42
)(1,0.01)
(0.20,3.06
83)
2.00
(1.43,0.7)
(1.39,0.66
)(1.27,0.54
)(1.06,0.25
)(1,0.01)
(1.51,0.77
)(1.47,0.74
)(1.36,0.62
)(1.11,0.33
)(1,0.02)
(0.30,3.18
51)
0.25
(1.76,0.43
)(1.76,0.43
)(1.73,0.44
)(1,0)
(1,0)
(1.96,0.29
)(1.96,0.29
)(1.95,0.29
)(1.01,0.09
)(1,0)
(0.30,3.18
51)
0.50
(3.38,1.17
)(3.34,1.13
)(2.22,0.69
)(1.01,0.07
)(1,0)
(3.83,1.41
)(3.78,1.36
)(2.69,0.89
)(1.07,0.26
)(1,0)
(0.30,3.18
51)
1.00
(254
.42,25
4.17
)(8.46,6.08
)(2.42,1.21
)(1.06,0.24
)(1,0)
(260
.43,25
9.02
)(11.4,8.81
)(3.03,1.62
)(1.17,0.39
)(1,0)
(0.30,3.18
51)
1.50
(3.26,2.23
)(2.76,1.78
)(1.9,1.04)
(1.11,0.32
)(1,0)
(3.56,2.48
)(3.1,2.05)
(2.19,1.25
)(1.21,0.44
)(1,0.01)
(0.30,3.18
51)
2.00
(1.45,0.72
)(1.41,0.68
)(1.29,0.56
)(1.07,0.27
)(1,0.01)
(1.53,0.79
)(1.49,0.75
)(1.38,0.64
)(1.12,0.34
)(1,0.02)
(ξ,L
4)
ρ↓δ→
Q=0.30
Q=0.50
(0.05,2.52
50)
0.25
(1.75,0.44
)(1.75,0.44
)(1.74,0.45
)(1.01,0.08
)(1,0)
(1.91,0.33
)(1.91,0.33
)(1.91,0.33
)(1.06,0.23
)(1,0)
(0.05,2.52
50)
0.50
(3.13,1.08
)(3.08,1.05
)(2.4,0.81)
(1.09,0.28
)(1,0)
(3.42,1.16
)(3.38,1.14
)(2.72,0.89
)(1.2,0.4)
(1,0)
(0.05,2.52
50)
1.00
(249
.8,263
.34)
(8.88,6.01
)(2.92,1.63
)(1.2,0.42)
(1,0)
(248
.61,26
4.02
)(10.49
,7.27)
(3.42,1.97
)(1.32,0.53
)(1,0.01)
(0.05,2.52
50)
1.50
(3.17,2.28
)(2.8,1.94)
(2.04,1.23
)(1.2,0.44)
(1,0.02)
(3.35,2.44
)(2.99,2.12
)(2.25,1.41
)(1.3,0.54)
(1,0.03)
(0.05,2.52
50)
2.00
(1.45,0.74
)(1.42,0.71
)(1.32,0.6)
(1.11,0.33
)(1,0.03)
(1.51,0.81
)(1.47,0.77
)(1.38,0.67
)(1.15,0.4)
(1,0.05)
(0.10,2.82
55)
0.25
(1.94,0.3)
(1.94,0.3)
(1.94,0.29
)(1.03,0.17
)(1,0)
(2.04,0.25
)(2.04,0.25
)(2.04,0.25
)(1.15,0.36
)(1,0)
(0.10,2.82
55)
0.50
(3.49,1.15
)(3.46,1.14
)(2.69,0.87
)(1.14,0.35
)(1,0)
(3.83,1.25
)(3.81,1.25
)(3.08,0.97
)(1.29,0.46
)(1,0)
(0.10,2.82
55)
1.00
(252
.59,25
6.26
)(10.12
,6.73)
(3.23,1.74
)(1.26,0.47
)(1,0)
(252
.98,25
8.56
)(12.03
,8.3)
(3.79,2.11
)(1.4,0.58)
(1,0.01)
(0.10,2.82
55)
1.50
(3.46,2.42
)(3.07,2.06
)(2.23,1.33
)(1.26,0.5)
(1,0.02)
(3.67,2.61
)(3.28,2.26
)(2.45,1.51
)(1.37,0.6)
(1,0.04)
(0.10,2.82
55)
2.00
(1.53,0.81
)(1.49,0.77
)(1.38,0.66
)(1.14,0.37
)(1,0.03)
(1.59,0.86
)(1.55,0.83
)(1.45,0.73
)(1.19,0.44
)(1,0.06)
(0.20,3.06
83)
0.25
(2.04,0.25
)(2.04,0.25
)(2.03,0.24
)(1.07,0.26
)(1,0)
(2.14,0.35
)(2.14,0.35
)(2.14,0.35
)(1.27,0.45
)(1,0)
(0.20,3.06
83)
0.50
(3.91,1.32
)(3.88,1.31
)(2.99,0.96
)(1.2,0.4)
(1,0)
(4.32,1.46
)(4.3,1.45)
(3.45,1.09
)(1.38,0.5)
(1,0)
(0.20,3.06
83)
1.00
(258
.41,26
0.47
)(12.17
,8.96)
(3.51,1.9)
(1.32,0.51
)(1,0)
(257
.85,25
7.96
)(14.89
,11.5)
(4.16,2.35
)(1.48,0.62
)(1,0.02)
(0.20,3.06
83)
1.50
(3.7,2.56)
(3.28,2.18
)(2.38,1.4)
(1.31,0.54
)(1,0.03)
(3.94,2.77
)(3.53,2.39
)(2.63,1.6)
(1.44,0.65
)(1,0.06)
(0.20,3.06
83)
2.00
(1.59,0.84
)(1.55,0.81
)(1.44,0.7)
(1.17,0.4)
(1,0.04)
(1.65,0.91
)(1.62,0.88
)(1.51,0.77
)(1.23,0.48
)(1.01,0.07
)(0.30,3.18
51)
0.25
(2.09,0.3)
(2.09,0.3)
(2.09,0.29
)(1.1,0.3)
(1,0)
(2.23,0.43
)(2.23,0.43
)(2.23,0.42
)(1.34,0.48
)(1,0)
(0.30,3.18
51)
0.50
(4.38,1.66
)(4.33,1.62
)(3.23,1.09
)(1.23,0.43
)(1,0)
(4.92,1.91
)(4.89,1.9)
(3.78,1.28
)(1.43,0.52
)(1,0)
(0.30,3.18
51)
1.00
(262
.33,26
2.45
)(15.09
,12.3)
(3.75,2.13
)(1.34,0.53
)(1,0.01)
(262
.24,26
2.9)
(18.9,16
.12)
(4.51,2.7)
(1.52,0.65
)(1,0.02)
(0.30,3.18
51)
1.50
(3.85,2.73
)(3.43,2.32
)(2.48,1.48
)(1.33,0.56
)(1,0.03)
(4.09,2.93
)(3.7,2.57)
(2.73,1.68
)(1.47,0.67
)(1,0.06)
(0.30,3.18
51)
2.00
(1.61,0.86
)(1.58,0.83
)(1.47,0.72
)(1.18,0.42
)(1,0.05)
(1.69,0.93
)(1.66,0.9)
(1.55,0.79
)(1.25,0.49
)(1.01,0.08
)
A. HAQ, J. BROWN AND E. MOLTCHANOVA
Copyright © 2014 John Wiley & Sons, Ltd. Qual. Reliab. Engng. Int. 2014

Table
VI.(ARL,SDRL)values
oftheMaxEW
MA-OIDRS
Scontrolchartwhen
thein-controlA
RLoftheMaxEW
MA-ODRS
Scontrolchartisfixedto
370
Q=0.05
Q=0.15
(ξ,L
4)
ρ↓δ→
0.00
0.25
0.50
1.00
2.00
0.00
0.25
0.50
1.00
2.00
(0.05,2.76
59)
0.25
(1.43,0.5)
(1.44,0.5)
(1.39,0.49
)(1,0)
(1,0)
(1.69,0.47
)(1.69,0.47
)(1.68,0.47
)(1,0.03)
(1,0)
(0.05,2.76
59)
0.50
(2.77,0.9)
(2.72,0.87
)(1.89,0.61
)(1,0.03)
(1,0)
(3.08,1.02
)(3.03,1)
(2.24,0.73
)(1.03,0.18
)(1,0)
(0.05,2.76
59)
1.00
(370
.52,38
6.77
)(6.28,3.88
)(2.11,1.05
)(1.03,0.18
)(1,0)
(372
.9,386
.55)
(7.96,5.05
)(2.6,1.36)
(1.11,0.32
)(1,0)
(0.05,2.76
59)
1.50
(2.91,2.01
)(2.48,1.62
)(1.71,0.93
)(1.07,0.27
)(1,0)
(3.18,2.21
)(2.76,1.86
)(1.95,1.13
)(1.15,0.37
)(1,0.01)
(0.05,2.76
59)
2.00
(1.37,0.66
)(1.33,0.62
)(1.23,0.49
)(1.05,0.22
)(1,0.01)
(1.44,0.73
)(1.4,0.68)
(1.3,0.57)
(1.08,0.29
)(1,0.01)
(0.10,3.05
35)
0.25
(1.66,0.47
)(1.66,0.47
)(1.63,0.48
)(1,0)
(1,0)
(1.89,0.34
)(1.89,0.34
)(1.88,0.35
)(1,0.07)
(1,0)
(0.10,3.05
35)
0.50
(3.06,0.97
)(3.02,0.93
)(2.09,0.64
)(1,0.06)
(1,0)
(3.4,1.1)
(3.36,1.07
)(2.48,0.78
)(1.05,0.23
)(1,0)
(0.10,3.05
35)
1.00
(371
.95,37
7.61
)(7.02,4.21
)(2.3,1.12)
(1.05,0.22
)(1,0)
(376
.29,38
1.76
)(8.95,5.62
)(2.85,1.45
)(1.15,0.37
)(1,0)
(0.10,3.05
35)
1.50
(3.15,2.13
)(2.68,1.73
)(1.84,1.01
)(1.09,0.3)
(1,0)
(3.45,2.35
)(3.01,1.97
)(2.11,1.21
)(1.19,0.42
)(1,0.01)
(0.10,3.05
35)
2.00
(1.43,0.71
)(1.39,0.66
)(1.27,0.54
)(1.06,0.25
)(1,0.01)
(1.51,0.78
)(1.47,0.74
)(1.35,0.62
)(1.11,0.32
)(1,0.02)
(0.20,3.28
86)
0.25
(1.83,0.39
)(1.83,0.39
)(1.81,0.4)
(1,0.01)
(1,0)
(2,0.25)
(1.99,0.26
)(1.98,0.24
)(1.01,0.11
)(1,0)
(0.20,3.28
86)
0.50
(3.37,1.07
)(3.33,1.03
)(2.27,0.68
)(1.01,0.08
)(1,0)
(3.78,1.24
)(3.73,1.21
)(2.72,0.86
)(1.08,0.28
)(1,0)
(0.20,3.28
86)
1.00
(374
.64,37
7.59
)(8.09,5.24
)(2.47,1.19
)(1.07,0.25
)(1,0)
(379
.83,37
9.5)
(10.64
,7.36)
(3.07,1.56
)(1.19,0.41
)(1,0)
(0.20,3.28
86)
1.50
(3.35,2.25
)(2.86,1.83
)(1.94,1.07
)(1.12,0.33
)(1,0)
(3.66,2.47
)(3.21,2.07
)(2.25,1.28
)(1.22,0.45
)(1,0.01)
(0.20,3.28
86)
2.00
(1.48,0.74
)(1.43,0.7)
(1.31,0.57
)(1.08,0.28
)(1,0.01)
(1.56,0.81
)(1.52,0.77
)(1.4,0.66)
(1.13,0.35
)(1,0.02)
(0.30,3.40
63)
0.25
(1.89,0.34
)(1.89,0.34
)(1.88,0.34
)(1,0.01)
(1,0)
(2.04,0.26
)(2.04,0.26
)(2.03,0.25
)(1.02,0.14
)(1,0)
(0.30,3.40
63)
0.50
(3.68,1.27
)(3.64,1.23
)(2.4,0.73)
(1.01,0.1)
(1,0)
(4.19,1.53
)(4.13,1.49
)(2.92,0.96
)(1.1,0.3)
(1,0)
(0.30,3.40
63)
1.00
(382
.01,38
2.15
)(9.63,7)
(2.59,1.28
)(1.08,0.27
)(1,0)
(390
.54,39
0.05
)(13.29
,10.46
)(3.27,1.73
)(1.21,0.42
)(1,0)
(0.30,3.40
63)
1.50
(3.49,2.39
)(2.98,1.92
)(2.01,1.11
)(1.13,0.35
)(1,0)
(3.84,2.66
)(3.35,2.22
)(2.33,1.35
)(1.24,0.47
)(1,0.01)
(0.30,3.40
63)
2.00
(1.51,0.76
)(1.46,0.72
)(1.34,0.6)
(1.08,0.29
)(1,0.01)
(1.6,0.84)
(1.55,0.8)
(1.43,0.68
)(1.14,0.37
)(1,0.02)
(ξ,L
4)
ρ↓δ→
Q=0.30
Q=0.50
(0.05,2.76
59)
0.25
(1.91,0.33
)(1.91,0.33
)(1.9,0.33)
(1.02,0.15
)(1,0)
(2.02,0.25
)(2.02,0.24
)(2.02,0.24
)(1.13,0.33
)(1,0)
(0.05,2.76
59)
0.50
(3.41,1.13
)(3.37,1.11
)(2.63,0.85
)(1.13,0.33
)(1,0)
(3.74,1.23
)(3.7,1.21)
(2.99,0.95
)(1.27,0.45
)(1,0)
(0.05,2.76
59)
1.00
(377
.39,39
0.24
)(9.89,6.44
)(3.16,1.73
)(1.24,0.46
)(1,0)
(371
.81,38
6.45
)(11.69
,7.8)
(3.71,2.1)
(1.39,0.57
)(1,0.01)
(0.05,2.76
59)
1.50
(3.44,2.44
)(3.05,2.09
)(2.2,1.32)
(1.25,0.49
)(1,0.02)
(3.64,2.61
)(3.28,2.28
)(2.43,1.52
)(1.36,0.59
)(1,0.05)
(0.05,2.76
59)
2.00
(1.51,0.79
)(1.48,0.76
)(1.37,0.65
)(1.13,0.37
)(1,0.03)
(1.57,0.86
)(1.54,0.82
)(1.44,0.72
)(1.19,0.43
)(1,0.06)
(0.10,3.05
35)
0.25
(2.03,0.24
)(2.03,0.24
)(2.02,0.23
)(1.07,0.25
)(1,0)
(2.12,0.33
)(2.12,0.33
)(2.12,0.33
)(1.27,0.44
)(1,0)
(0.10,3.05
35)
0.50
(3.8,1.22)
(3.77,1.2)
(2.93,0.91
)(1.19,0.4)
(1,0)
(4.16,1.32
)(4.13,1.31
)(3.36,1.02
)(1.37,0.5)
(1,0)
(0.10,3.05
35)
1.00
(374
.85,37
9.92
)(11.18
,7.3)
(3.48,1.85
)(1.31,0.51
)(1,0.01)
(375
.7,378
.59)
(13.44
,9.11)
(4.08,2.24
)(1.48,0.62
)(1,0.02)
(0.10,3.05
35)
1.50
(3.7,2.54)
(3.31,2.2)
(2.4,1.42)
(1.31,0.54
)(1,0.02)
(3.96,2.76
)(3.58,2.42
)(2.64,1.62
)(1.44,0.65
)(1,0.05)
(0.10,3.05
35)
2.00
(1.58,0.84
)(1.55,0.81
)(1.44,0.7)
(1.17,0.41
)(1,0.04)
(1.65,0.91
)(1.62,0.88
)(1.51,0.77
)(1.23,0.48
)(1.01,0.08
)(0.20,3.28
86)
0.25
(2.11,0.32
)(2.11,0.32
)(2.11,0.31
)(1.14,0.34
)(1,0)
(2.27,0.45
)(2.26,0.45
)(2.26,0.44
)(1.41,0.49
)(1,0)
(0.20,3.28
86)
0.50
(4.25,1.41
)(4.22,1.4)
(3.25,1.01
)(1.26,0.44
)(1,0)
(4.7,1.57)
(4.69,1.55
)(3.76,1.16
)(1.47,0.53
)(1,0)
(0.20,3.28
86)
1.00
(383
.6,383
.96)
(13.88
,10.29
)(3.78,2.02
)(1.37,0.54
)(1,0.01)
(383
.33,38
4.83
)(17.11
,13.35
)(4.48,2.49
)(1.55,0.66
)(1,0.03)
(0.20,3.28
86)
1.50
(3.98,2.73
)(3.53,2.33
)(2.56,1.5)
(1.36,0.57
)(1,0.03)
(4.21,2.92
)(3.83,2.59
)(2.85,1.73
)(1.5,0.69)
(1,0.07)
(0.20,3.28
86)
2.00
(1.65,0.89
)(1.61,0.86
)(1.5,0.74)
(1.2,0.44)
(1,0.05)
(1.71,0.95
)(1.69,0.92
)(1.57,0.82
)(1.27,0.51
)(1.01,0.09
)(0.30,3.40
63)
0.25
(2.19,0.4)
(2.19,0.4)
(2.19,0.39
)(1.18,0.38
)(1,0)
(2.4,0.51)
(2.4,0.51)
(2.4,0.5)
(1.49,0.5)
(1,0)
(0.30,3.40
63)
0.50
(4.83,1.85
)(4.78,1.81
)(3.54,1.19
)(1.3,0.47)
(1,0)
(5.47,2.17
)(5.46,2.14
)(4.19,1.43
)(1.52,0.54
)(1,0)
(0.30,3.40
63)
1.00
(396
.33,39
7.32
)(17.86
,14.81
)(4.09,2.31
)(1.4,0.57)
(1,0.01)
(392
.82,39
2.06
)(22.77
,19.68
)(4.91,2.94
)(1.6,0.69)
(1,0.03)
(0.30,3.40
63)
1.50
(4.17,2.94
)(3.72,2.51
)(2.68,1.6)
(1.39,0.6)
(1,0.04)
(4.41,3.16
)(4.03,2.81
)(2.96,1.82
)(1.54,0.72
)(1.01,0.07
)(0.30,3.40
63)
2.00
(1.68,0.91
)(1.64,0.87
)(1.53,0.77
)(1.22,0.46
)(1,0.05)
(1.75,0.98
)(1.72,0.94
)(1.61,0.84
)(1.29,0.53
)(1.01,0.09
)
A. HAQ, J. BROWN AND E. MOLTCHANOVA
Copyright © 2014 John Wiley & Sons, Ltd. Qual. Reliab. Engng. Int. 2014

Table
VII.Comparisonsof(ARL,SDRL)o
ftheMaxEW
MA-ODRS
ScontrolchartwiththeoptimalMaxGWMA,optimalMaxEW
MAan
dtheMaxEW
MA-ORS
Scontrolchartswhen
the
in-controlA
RLisfixedto
185
Chart
ρ↓δ→
0.00
0.25
0.50
0.75
1.00
1.50
2.00
2.50
3.00
MaxEW
MA-SRS
0.25
(1.49,0.52
)(1.49,0.52
)(1.49,0.52
)(1.49,0.51
)(1.43,0.49
)(1,0.02)
(1,0)
(1,0)
(1,0)
MaxGWMA-SRS
(1.49,0.52
)(1.49,0.52
)(1.49,0.52
)(1.48,0.51
)(1.42,0.49
)(1,0.02)
(1,0)
(1,0)
(1,0)
MaxEW
MA-ORS
S(1.54,0.5)
(1.54,0.5)
(1.53,0.5)
(1.06,0.23
)(1,0)
(1,0)
(1,0)
(1,0)
(1,0)
MaxEW
MA-ODRS
S(1.06,0.24
)(1.06,0.24
)(1.03,0.17
)(1,0)
(1,0)
(1,0)
(1,0)
(1,0)
(1,0)
MaxEW
MA-SRS
0.50
(3.43,1.5)
(3.43,1.5)
(3.22,1.29
)(2.44,0.85
)(1.75,0.59
)(1.05,0.21
)(1,0.01)
(1,0)
(1,0)
MaxGWMA-SRS
(3.43,1.5)
(3.43,1.5)
(3.22,1.29
)(2.44,0.85
)(1.75,0.59
)(1.05,0.21
)(1,0.01)
(1,0)
(1,0)
MaxEW
MA-ORS
S(2.89,0.95
)(2.87,0.94
)(2.13,0.64
)(1.26,0.44
)(1.01,0.07
)(1,0)
(1,0)
(1,0)
(1,0)
MaxEW
MA-ODRS
S(2.24,0.73
)(2.19,0.69
)(1.43,0.51
)(1,0.07)
(1,0)
(1,0)
(1,0)
(1,0)
(1,0)
MaxEW
MA-SRS
0.75
(12.74
,7.91)
(10.35
,5.99)
(5.14,2.64
)(2.83,1.32
)(1.86,0.8)
(1.14,0.35
)(1.01,0.07
)(1,0.01)
(1,0)
MaxGWMA-SRS
(12.64
,7.78)
(10.3,5.91
)(5.14,2.64
)(2.83,1.32
)(1.86,0.8)
(1.14,0.35
)(1.01,0.07
)(1,0.01)
(1,0)
MaxEW
MA-ORS
S(9.57,5.14
)(5.99,2.95
)(2.37,1.05
)(1.36,0.52
)(1.05,0.21
)(1,0)
(1,0)
(1,0)
(1,0)
MaxEW
MA-ODRS
S(7.19,3.75
)(3.93,1.84
)(1.55,0.63
)(1.04,0.2)
(1,0.02)
(1,0)
(1,0)
(1,0)
(1,0)
MaxEW
MA-SRS
1.00
(185
.00,18
6.23
)(16.87
,13.13
)(5.54,3.65
)(2.95,1.71
)(1.95,1)
(1.22,0.44
)(1.03,0.16
)(1,0.03)
(1,0.01)
MaxGWMA-SRS
(185
.00,18
6.23
)(16.31
,12.4)
(5.51,3.6)
(2.95,1.71
)(1.95,1)
(1.22,0.44
)(1.03,0.16
)(1,0.03)
(1,0.01)
MaxEW
MA-ORS
S(184
.91,19
8.75
)(7.17,4.92
)(2.46,1.35
)(1.44,0.64
)(1.1,0.31)
(1,0.03)
(1,0)
(1,0)
(1,0)
MaxEW
MA-ODRS
S(185
.27,19
9.6)
(4.45,2.8)
(1.63,0.77
)(1.1,0.3)
(1,0.07)
(1,0)
(1,0)
(1,0)
(1,0)
MaxEW
MA-SRS
1.25
(11.22
,10.04
)(8.05,6.89
)(4.5,3.44)
(2.78,1.86
)(1.95,1.13
)(1.27,0.52
)(1.06,0.24
)(1.01,0.09
)(1,0.02)
MaxGWMA-SRS
(10.6,9.33
)(7.71,6.41
)(4.42,3.34
)(2.77,1.82
)(1.95,1.13
)(1.27,0.52
)(1.06,0.24
)(1.01,0.09
)(1,0.02)
MaxEW
MA-ORS
S(7.86,6.84
)(4.59,3.58
)(2.27,1.42
)(1.47,0.7)
(1.15,0.38
)(1,0.07)
(1,0)
(1,0)
(1,0)
MaxEW
MA-ODRS
S(6.35,5.23
)(3.3,2.35)
(1.61,0.83
)(1.13,0.36
)(1.02,0.13
)(1,0.01)
(1,0)
(1,0)
(1,0)
MaxEW
MA-SRS
1.50
(3.99,3.28
)(3.66,2.96
)(2.94,2.22
)(2.27,1.55
)(1.8,1.08)
(1.29,0.56
)(1.09,0.29
)(1.02,0.13
)(1,0.05)
MaxGWMA-SRS
(3.9,3.09)
(3.59,2.78
)(2.9,2.15)
(2.26,1.51
)(1.8,1.07)
(1.29,0.56
)(1.09,0.29
)(1.02,0.13
)(1,0.05)
MaxEW
MA-ORS
S(2.88,2.21
)(2.49,1.81
)(1.82,1.11
)(1.39,0.66
)(1.16,0.4)
(1.01,0.11
)(1,0.02)
(1,0)
(1,0)
MaxEW
MA-ODRS
S(2.4,1.67)
(2.01,1.29
)(1.43,0.7)
(1.13,0.36
)(1.02,0.16
)(1,0.01)
(1,0)
(1,0)
(1,0)
MaxEW
MA-SRS
2.00
(1.74,1.11
)(1.72,1.09
)(1.64,1)
(1.52,0.87
)(1.41,0.74
)(1.22,0.5)
(1.1,0.32)
(1.04,0.19
)(1.01,0.1)
MaxGWMA-SRS
(1.74,1.09
)(1.71,1.06
)(1.63,0.98
)(1.52,0.86
)(1.41,0.74
)(1.22,0.5)
(1.1,0.32)
(1.04,0.19
)(1.01,0.1)
MaxEW
MA-ORS
S(1.4,0.74)
(1.37,0.69
)(1.28,0.58
)(1.18,0.45
)(1.1,0.32)
(1.02,0.14
)(1,0.04)
(1,0.01)
(1,0)
MaxEW
MA-ODRS
S(1.26,0.54
)(1.22,0.5)
(1.14,0.38
)(1.06,0.25
)(1.02,0.15
)(1,0.03)
(1,0)
(1,0)
(1,0)
MaxEW
MA-SRS
2.50
(1.31,0.64
)(1.3,0.63)
(1.28,0.6)
(1.25,0.56
)(1.21,0.51
)(1.14,0.39
)(1.08,0.29
)(1.04,0.2)
(1.02,0.13
)MaxGWMA-SRS
(1.31,0.64
)(1.3,0.63)
(1.28,0.6)
(1.25,0.56
)(1.21,0.51
)(1.14,0.39
)(1.08,0.29
)(1.04,0.2)
(1.02,0.13
)MaxEW
MA-ORS
S(1.13,0.38
)(1.12,0.37
)(1.1,0.33)
(1.08,0.29
)(1.05,0.23
)(1.02,0.12
)(1,0.05)
(1,0.01)
(1,0)
MaxEW
MA-ODRS
S(1.06,0.26
)(1.06,0.24
)(1.04,0.21
)(1.02,0.15
)(1.01,0.1)
(1,0.03)
(1,0)
(1,0)
(1,0)
MaxEW
MA-SRS
3.00
(1.2,0.52)
(1.19,0.51
)(1.18,0.5)
(1.17,0.47
)(1.15,0.44
)(1.11,0.36
)(1.07,0.28
)(1.04,0.21
)(1.02,0.15
)MaxGWMA-SRS
(1.2,0.51)
(1.19,0.5)
(1.18,0.49
)(1.17,0.46
)(1.15,0.43
)(1.11,0.36
)(1.07,0.28
)(1.04,0.21
)(1.02,0.15
)MaxEW
MA-ORS
S(1.05,0.23
)(1.05,0.23
)(1.04,0.21
)(1.03,0.19
)(1.02,0.15
)(1.01,0.1)
(1,0.05)
(1,0.02)
(1,0.01)
MaxEW
MA-ODRS
S(1.02,0.14
)(1.02,0.13
)(1.01,0.11
)(1.01,0.09
)(1,0.07)
(1,0.03)
(1,0)
(1,0)
(1,0)
A. HAQ, J. BROWN AND E. MOLTCHANOVA
Copyright © 2014 John Wiley & Sons, Ltd. Qual. Reliab. Engng. Int. 2014

Table
VIII.Comparisonsof(ARL,SDRL)o
ftheMaxEW
MA-ODRS
ScontrolchartwiththeoptimalMaxGWMA,optimalMaxEW
MAan
dtheMaxEW
MA-ORS
Scontrolchartswhen
the
in-controlA
RLisfixedto
250
Chart
ρ↓δ→
0.00
0.25
0.50
0.75
1.00
1.50
2.00
2.50
3.00
MaxEW
MA-SRS
0.25
(1.58,0.53
)(1.58,0.53
)(1.58,0.53
)(1.58,0.52
)(1.54,0.5)
(1,0.04)
(1,0)
(1,0)
(1,0)
MaxGWMA-SRS
(1.58,0.53
)(1.58,0.53
)(1.58,0.53
)(1.58,0.52
)(1.54,0.5)
(1,0.04)
(1,0)
(1,0)
(1,0)
MaxEW
MA-ORS
S(1.71,0.45
)(1.71,0.45
)(1.71,0.45
)(1.15,0.36
)(1,0)
(1,0)
(1,0)
(1,0)
(1,0)
MaxEW
MA-ODRS
S(1.13,0.34
)(1.13,0.33
)(1.08,0.27
)(1,0)
(1,0)
(1,0)
(1,0)
(1,0)
(1,0)
MaxEW
MA-SRS
0.50
(3.68,1.57
)(3.68,1.57
)(3.47,1.36
)(2.64,0.89
)(1.87,0.6)
(1.08,0.26
)(1,0.01)
(1,0)
(1,0)
MaxGWMA-SRS
(3.68,1.57
)(3.68,1.57
)(3.47,1.36
)(2.64,0.89
)(1.87,0.6)
(1.08,0.26
)(1,0.01)
(1,0)
(1,0)
MaxEW
MA-ORS
S(3.11,0.99
)(3.09,0.98
)(2.28,0.66
)(1.34,0.48
)(1.01,0.1)
(1,0)
(1,0)
(1,0)
(1,0)
MaxEW
MA-ODRS
S(2.4,0.75)
(2.36,0.71
)(1.54,0.52
)(1.01,0.09
)(1,0)
(1,0)
(1,0)
(1,0)
(1,0)
MaxEW
MA-SRS
0.75
(13.9,8.39
)(11.44
,6.41)
(5.61,2.79
)(3.04,1.38
)(1.98,0.84
)(1.17,0.39
)(1.01,0.07
)(1,0.01)
(1,0)
MaxGWMA-SRS
(13.77
,8.24)
(11.37
,6.33)
(5.61,2.79
)(3.04,1.38
)(1.98,0.84
)(1.17,0.38
)(1.01,0.09
)(1,0.01)
(1,0)
MaxEW
MA-ORS
S(10.42
,5.42)
(6.58,3.13
)(2.53,1.1)
(1.42,0.56
)(1.06,0.24
)(1,0)
(1,0)
(1,0)
(1,0)
MaxEW
MA-ODRS
S(7.8,3.95)
(4.29,1.94
)(1.64,0.66
)(1.06,0.23
)(1,0.02)
(1,0)
(1,0)
(1,0)
(1,0)
MaxEW
MA-SRS
1.00
(250
.00,24
9.93
)(18.77
,14.15
)(6,3.84)
(3.15,1.79
)(2.06,1.05
)(1.25,0.47
)(1.04,0.18
)(1,0.04)
(1,0.01)
MaxGWMA-SRS
(250
.00,24
9.93
)(18.08
,13.3)
(5.96,3.79
)(3.15,1.79
)(2.06,1.05
)(1.25,0.47
)(1.04,0.18
)(1,0.04)
(1,0.01)
MaxEW
MA-ORS
S(249
.55,26
3.99
)(7.81,5.22
)(2.61,1.41
)(1.5,0.67)
(1.13,0.34
)(1,0.03)
(1,0)
(1,0)
(1,0)
MaxEW
MA-ODRS
S(249
.53,26
3.5)
(4.81,2.97
)(1.72,0.81
)(1.12,0.33
)(1.01,0.08
)(1,0)
(1,0)
(1,0)
(1,0)
MaxEW
MA-SRS
1.25
(12.53
,10.84
)(8.94,7.43
)(4.89,3.66
)(2.97,1.97
)(2.06,1.19
)(1.31,0.55
)(1.07,0.26
)(1.01,0.1)
(1,0.02)
MaxGWMA-SRS
(11.84
,10.11
)(8.54,6.94
)(4.81,3.56
)(2.96,1.93
)(2.06,1.19
)(1.31,0.55
)(1.07,0.26
)(1.01,0.1)
(1,0.02)
MaxEW
MA-ORS
S(8.61,7.31
)(5.01,3.86
)(2.42,1.51
)(1.52,0.74
)(1.17,0.41
)(1.01,0.08
)(1,0.01)
(1,0)
(1,0)
MaxEW
MA-ODRS
S(6.91,5.59
)(3.57,2.51
)(1.69,0.88
)(1.16,0.39
)(1.02,0.14
)(1,0.01)
(1,0)
(1,0)
(1,0)
MaxEW
MA-SRS
1.50
(4.33,3.5)
(3.97,3.16
)(3.16,2.37
)(2.42,1.65
)(1.9,1.15)
(1.33,0.59
)(1.1,0.32)
(1.02,0.15
)(1,0.06)
MaxGWMA-SRS
(4.22,3.29
)(3.88,2.98
)(3.12,2.3)
(2.4,1.61)
(1.89,1.13
)(1.33,0.59
)(1.1,0.32)
(1.02,0.15
)(1,0.06)
MaxEW
MA-ORS
S(3.08,2.34
)(2.65,1.91
)(1.92,1.19
)(1.44,0.71
)(1.18,0.43
)(1.01,0.12
)(1,0.02)
(1,0)
(1,0)
MaxEW
MA-ODRS
S(2.54,1.77
)(2.12,1.37
)(1.49,0.76
)(1.15,0.39
)(1.03,0.17
)(1,0.01)
(1,0)
(1,0)
(1,0)
MaxEW
MA-SRS
2.00
(1.83,1.19
)(1.8,1.15)
(1.71,1.06
)(1.59,0.93
)(1.46,0.79
)(1.24,0.53
)(1.11,0.34
)(1.04,0.21
)(1.01,0.11
)MaxGWMA-SRS
(1.82,1.16
)(1.79,1.13
)(1.7,1.04)
(1.58,0.91
)(1.46,0.78
)(1.24,0.53
)(1.11,0.34
)(1.04,0.21
)(1.01,0.11
)MaxEW
MA-ORS
S(1.45,0.78
)(1.41,0.74
)(1.31,0.62
)(1.2,0.48)
(1.12,0.35
)(1.02,0.15
)(1,0.05)
(1,0.01)
(1,0)
MaxEW
MA-ODRS
S(1.29,0.58
)(1.25,0.53
)(1.16,0.41
)(1.07,0.27
)(1.03,0.16
)(1,0.03)
(1,0)
(1,0)
(1,0)
MaxEW
MA-SRS
2.50
(1.34,0.68
)(1.33,0.67
)(1.31,0.64
)(1.28,0.59
)(1.24,0.54
)(1.15,0.42
)(1.09,0.31
)(1.04,0.21
)(1.02,0.14
)MaxGWMA-SRS
(1.34,0.67
)(1.33,0.66
)(1.31,0.63
)(1.28,0.58
)(1.24,0.54
)(1.15,0.42
)(1.09,0.31
)(1.04,0.21
)(1.02,0.14
)MaxEW
MA-ORS
S(1.15,0.41
)(1.14,0.39
)(1.12,0.36
)(1.09,0.3)
(1.06,0.24
)(1.02,0.13
)(1,0.06)
(1,0.02)
(1,0)
MaxEW
MA-ODRS
S(1.07,0.27
)(1.07,0.26
)(1.05,0.22
)(1.03,0.17
)(1.01,0.11
)(1,0.03)
(1,0)
(1,0)
(1,0)
MaxEW
MA-SRS
3.00
(1.22,0.55
)(1.21,0.54
)(1.2,0.52)
(1.19,0.5)
(1.16,0.46
)(1.12,0.38
)(1.08,0.29
)(1.05,0.22
)(1.02,0.16
)MaxGWMA-SRS
(1.22,0.54
)(1.21,0.53
)(1.2,0.51)
(1.18,0.49
)(1.16,0.45
)(1.12,0.38
)(1.08,0.29
)(1.05,0.22
)(1.02,0.16
)MaxEW
MA-ORS
S(1.06,0.25
)(1.06,0.24
)(1.05,0.23
)(1.04,0.2)
(1.03,0.17
)(1.01,0.11
)(1,0.06)
(1,0.03)
(1,0.01)
MaxEW
MA-ODRS
S(1.02,0.15
)(1.02,0.14
)(1.01,0.12
)(1.01,0.1)
(1.01,0.07
)(1,0.03)
(1,0.01)
(1,0)
(1,0)
A. HAQ, J. BROWN AND E. MOLTCHANOVA
Copyright © 2014 John Wiley & Sons, Ltd. Qual. Reliab. Engng. Int. 201
4
Table
IX.Comparisonsof(ARL,SDRL)oftheMaxEW
MA-ODRS
ScontrolchartwiththeoptimalMaxGWMA,optimalMaxEW
MAan
dtheMaxEW
MA-ORS
Scontrolchartswhen
the
in-controlA
RLisfixedto
370
Chart
ρ↓δ→
0.00
0.25
0.50
0.75
1.00
1.50
2.00
2.50
3.00
MaxEW
MA-SRS
0.25
(1.71,0.53
)(1.71,0.53
)(1.71,0.53
)(1.71,0.53
)(1.66,0.48
)(1.01,0.09
)(1,0)
(1,0)
(1,0)
MaxGWMA-SRS
(1.71,0.53
)(1.71,0.53
)(1.71,0.53
)(1.7,0.53)
(1.66,0.48
)(1.01,0.09
)(1,0)
(1,0)
(1,0)
MaxEW
MA-ORS
S(1.89,0.32
)(1.89,0.33
)(1.88,0.33
)(1.37,0.48
)(1,0.01)
(1,0)
(1,0)
(1,0)
(1,0)
MaxEW
MA-ODRS
S(1.27,0.45
)(1.27,0.45
)(1.22,0.42
)(1,0)
(1,0)
(1,0)
(1,0)
(1,0)
(1,0)
MaxEW
MA-SRS
0.50
(4.02,1.66
)(4.02,1.66
)(3.82,1.46
)(2.9,0.94)
(2.04,0.62
)(1.13,0.33
)(1,0.02)
(1,0)
(1,0)
MaxGWMA-SRS
(4.02,1.66
)(4.02,1.66
)(3.82,1.46
)(2.9,0.94)
(2.03,0.62
)(1.13,0.33
)(1,0.02)
(1,0)
(1,0)
MaxEW
MA-ORS
S(3.38,1.04
)(3.37,1.03
)(2.5,0.7)
(1.46,0.51
)(1.02,0.14
)(1,0)
(1,0)
(1,0)
(1,0)
MaxEW
MA-ODRS
S(2.6,0.78)
(2.56,0.75
)(1.68,0.52
)(1.02,0.14
)(1,0)
(1,0)
(1,0)
(1,0)
(1,0)
MaxEW
MA-SRS
0.75
(15.52
,9.06)
(12.96
,6.98)
(6.25,2.98
)(3.33,1.46
)(2.14,0.88
)(1.23,0.43
)(1.01,0.11
)(1,0.01)
(1,0)
MaxGWMA-SRS
(15.36
,8.85)
(12.88
,6.87)
(6.25,2.98
)(3.33,1.46
)(2.14,0.88
)(1.23,0.43
)(1.01,0.11
)(1,0.01)
(1,0)
MaxEW
MA-ORS
S(11.56
,5.79)
(7.38,3.37
)(2.75,1.16
)(1.52,0.59
)(1.09,0.29
)(1,0.01)
(1,0)
(1,0)
(1,0)
MaxEW
MA-ODRS
S(8.61,4.18
)(4.76,2.1)
(1.76,0.7)
(1.08,0.27
)(1,0.03)
(1,0)
(1,0)
(1,0)
(1,0)
MaxEW
MA-SRS
1.00
(370
.00,36
8.91
)(21.42
,85.57
)(6.63,4.1)
(3.42,1.9)
(2.21,1.11
)(1.31,0.51
)(1.05,0.21
)(1,0.05)
(1,0.01)
MaxGWMA-SRS
(370
.00,36
8.92
)(20.57
,14.53
)(6.58,4.04
)(3.42,1.9)
(2.21,1.11
)(1.31,0.51
)(1.05,0.21
)(1,0.05)
(1,0.01)
MaxEW
MA-ORS
S(370
.47,38
3.99
)(8.67,5.57
)(2.82,1.5)
(1.59,0.71
)(1.16,0.38
)(1,0.05)
(1,0)
(1,0)
(1,0)
MaxEW
MA-ODRS
S(370
.32,38
4.02
)(5.29,3.16
)(1.83,0.86
)(1.15,0.37
)(1.01,0.1)
(1,0)
(1,0)
(1,0)
(1,0)
MaxEW
MA-SRS
1.25
(14.37
,11.92
)(10.21
,8.15)
(5.44,3.96
)(3.24,2.11
)(2.21,1.28
)(1.37,0.6)
(1.09,0.29
)(1.01,0.11
)(1,0.03)
MaxGWMA-SRS
(13.56
,11.12
)(9.72,7.63
)(5.34,3.78
)(3.22,2.07
)(2.21,1.28
)(1.37,0.6)
(1.09,0.29
)(1.01,0.11
)(1,0.03)
MaxEW
MA-ORS
S(9.69,7.92
)(5.61,4.19
)(2.61,1.61
)(1.61,0.8)
(1.21,0.44
)(1.01,0.09
)(1,0.01)
(1,0)
(1,0)
MaxEW
MA-ODRS
S(7.7,6.03)
(3.94,2.7)
(1.79,0.95
)(1.19,0.43
)(1.03,0.16
)(1,0.01)
(1,0)
(1,0)
(1,0)
MaxEW
MA-SRS
1.50
(4.82,3.8)
(4.39,3.42
)(3.48,2.57
)(2.63,1.79
)(2.03,1.24
)(1.38,0.64
)(1.12,0.35
)(1.03,0.17
)(1,0.07)
MaxGWMA-SRS
(4.69,3.59
)(4.29,3.24
)(3.43,2.45
)(2.61,1.75
)(2.02,1.22
)(1.38,0.64
)(1.12,0.35
)(1.03,0.17
)(1,0.07)
MaxEW
MA-ORS
S(3.35,2.51
)(2.87,2.07
)(2.06,1.29
)(1.51,0.77
)(1.22,0.47
)(1.02,0.14
)(1,0.02)
(1,0)
(1,0)
MaxEW
MA-ODRS
S(2.74,1.9)
(2.28,1.47
)(1.57,0.81
)(1.19,0.43
)(1.04,0.2)
(1,0.02)
(1,0)
(1,0)
(1,0)
MaxEW
MA-SRS
2.00
(1.95,1.28
)(1.91,1.24
)(1.81,1.14
)(1.67,1)
(1.53,0.85
)(1.28,0.57
)(1.13,0.37
)(1.05,0.23
)(1.02,0.13
)MaxGWMA-SRS
(1.94,1.25
)(1.9,1.22)
(1.8,1.12)
(1.67,0.98
)(1.53,0.84
)(1.28,0.57
)(1.13,0.37
)(1.05,0.23
)(1.02,0.12
)MaxEW
MA-ORS
S(1.51,0.83
)(1.47,0.79
)(1.36,0.67
)(1.24,0.52
)(1.14,0.38
)(1.03,0.17
)(1,0.05)
(1,0.01)
(1,0)
MaxEW
MA-ODRS
S(1.33,0.62
)(1.29,0.57
)(1.19,0.45
)(1.09,0.3)
(1.03,0.18
)(1,0.03)
(1,0)
(1,0)
(1,0)
MaxEW
MA-SRS
2.50
(1.39,0.73
)(1.38,0.72
)(1.36,0.69
)(1.32,0.64
)(1.27,0.58
)(1.18,0.45
)(1.1,0.34)
(1.05,0.23
)(1.02,0.15
)MaxGWMA-SRS
(1.39,0.72
)(1.38,0.71
)(1.36,0.68
)(1.32,0.63
)(1.27,0.58
)(1.18,0.45
)(1.1,0.34)
(1.05,0.23
)(1.02,0.15
)MaxEW
MA-ORS
S(1.17,0.43
)(1.16,0.42
)(1.13,0.38
)(1.1,0.33)
(1.07,0.27
)(1.02,0.15
)(1,0.06)
(1,0.02)
(1,0.01)
MaxEW
MA-ODRS
S(1.08,0.29
)(1.08,0.28
)(1.06,0.24
)(1.03,0.18
)(1.02,0.12
)(1,0.04)
(1,0.01)
(1,0)
(1,0)
MaxEW
MA-SRS
3.00
(1.25,0.6)
(1.24,0.58
)(1.23,0.57
)(1.21,0.54
)(1.19,0.5)
(1.14,0.41
)(1.09,0.32
)(1.05,0.24
)(1.03,0.17
)MaxGWMA-SRS
(1.25,0.58
)(1.24,0.57
)(1.23,0.55
)(1.21,0.53
)(1.19,0.49
)(1.14,0.4)
(1.09,0.32
)(1.05,0.24
)(1.03,0.17
)MaxEW
MA-ORS
S(1.07,0.27
)(1.06,0.26
)(1.06,0.24
)(1.05,0.22
)(1.03,0.19
)(1.01,0.12
)(1,0.06)
(1,0.03)
(1,0.01)
MaxEW
MA-ODRS
S(1.03,0.16
)(1.02,0.16
)(1.02,0.14
)(1.01,0.11
)(1.01,0.08
)(1,0.03)
(1,0.01)
(1,0)
(1,0)
A. HAQ, J. BROWN AND E. MOLTCHANOVA
Copyright © 2014 John Wiley & Sons, Ltd. Qual. Reliab. Engng. Int. 2014

Table X. (ARL,SDRL) values of the MaxEWMA-SRS, MaxGWMA-SRS, MaxEWMA-OIRSS and MaxEWMA-OIDRSS control charts forξ =0.05 when the in-control ARL of the MaxEWMA-SRS and the MaxGWMA control charts is fixed to 370
Chart Q ρ ↓ δ→ 0.00 0.25 0.50 1.00 2.00
MaxEWMA-SRS — 0.25 (1.71,0.53) (1.71,0.53) (1.71,0.53) (1.66,0.48) (1,0)MaxGWMA-SRS — 0.25 (1.71,0.53) (1.71,0.53) (1.71,0.53) (1.66,0.48) (1,0)MaxEWMA-OIRSS 0.05 0.25 (1.89,0.33) (1.89,0.34) (1.89,0.34) (1.01,0.07) (1,0)MaxEWMA-OIDRSS 0.05 0.25 (1.43,0.5) (1.44,0.5) (1.39,0.49) (1,0) (1,0)MaxEWMA-OIRSS 0.15 0.25 (1.96,0.27) (1.96,0.28) (1.96,0.27) (1.04,0.2) (1,0)MaxEWMA-OIDRSS 0.15 0.25 (1.69,0.47) (1.69,0.47) (1.68,0.47) (1,0.03) (1,0)MaxEWMA-OIRSS 0.30 0.25 (2.03,0.24) (2.03,0.24) (2.02,0.24) (1.15,0.36) (1,0)MaxEWMA-OIDRSS 0.30 0.25 (1.91,0.33) (1.91,0.33) (1.9,0.33) (1.02,0.15) (1,0)MaxEWMA-OIRSS 0.50 0.25 (2.07,0.27) (2.07,0.27) (2.07,0.27) (1.32,0.47) (1,0)MaxEWMA-OIDRSS 0.50 0.25 (2.02,0.25) (2.02,0.24) (2.02,0.24) (1.13,0.33) (1,0)MaxEWMA-SRS — 0.50 (4.02,1.66) (4.02,1.66) (3.82,1.46) (2.04,0.62) (1,0.02)MaxGWMA-SRS — 0.50 (4.02,1.66) (4.02,1.66) (3.82,1.46) (2.03,0.62) (1,0.02)MaxEWMA-OIRSS 0.05 0.50 (3.44,1.09) (3.43,1.08) (2.61,0.77) (1.06,0.25) (1,0)MaxEWMA-OIDRSS 0.05 0.50 (2.77,0.9) (2.72,0.87) (1.89,0.61) (1,0.03) (1,0)MaxEWMA-OIRSS 0.15 0.50 (3.6,1.17) (3.57,1.14) (2.82,0.87) (1.16,0.37) (1,0)MaxEWMA-OIDRSS 0.15 0.50 (3.08,1.02) (3.03,1) (2.24,0.73) (1.03,0.18) (1,0)MaxEWMA-OIRSS 0.30 0.50 (3.78,1.22) (3.77,1.21) (3.07,0.94) (1.28,0.46) (1,0)MaxEWMA-OIDRSS 0.30 0.50 (3.41,1.13) (3.37,1.11) (2.63,0.85) (1.13,0.33) (1,0)MaxEWMA-OIRSS 0.50 0.50 (3.97,1.27) (3.95,1.26) (3.32,1.01) (1.41,0.51) (1,0)MaxEWMA-OIDRSS 0.50 0.50 (3.74,1.23) (3.7,1.21) (2.99,0.95) (1.27,0.45) (1,0)MaxEWMA-SRS — 1.00 (370.00,368.91) (21.42,85.57) (6.63,4.1) (2.21,1.11) (1.05,0.21)MaxGWMA-SRS — 1.00 (370.00,368.92) (20.57,14.53) (6.58,4.04) (2.21,1.11) (1.05,0.21)MaxEWMA-OIRSS 0.05 1.00 (370.38,386.23) (9.38,6.09) (3.03,1.65) (1.21,0.43) (1,0)MaxEWMA-OIDRSS 0.05 1.00 (370.52,386.77) (6.28,3.88) (2.11,1.05) (1.03,0.18) (1,0)MaxEWMA-OIRSS 0.15 1.00 (370.95,386.85) (10.57,6.94) (3.38,1.87) (1.3,0.51) (1,0.01)MaxEWMA-OIDRSS 0.15 1.00 (372.9,386.55) (7.96,5.05) (2.6,1.36) (1.11,0.32) (1,0)MaxEWMA-OIRSS 0.30 1.00 (375.87,391.03) (12.02,7.99) (3.8,2.14) (1.41,0.59) (1,0.02)MaxEWMA-OIDRSS 0.30 1.00 (377.39,390.24) (9.89,6.44) (3.16,1.73) (1.24,0.46) (1,0)MaxEWMA-OIRSS 0.50 1.00 (369.22,382.04) (13.39,9.11) (4.21,2.43) (1.53,0.67) (1,0.03)MaxEWMA-OIDRSS 0.50 1.00 (371.81,386.45) (11.69,7.8) (3.71,2.1) (1.39,0.57) (1,0.01)MaxEWMA-SRS — 1.50 (4.82,3.8) (4.39,3.42) (3.48,2.57) (2.03,1.24) (1.12,0.35)MaxGWMA-SRS — 1.50 (4.69,3.59) (4.29,3.24) (3.43,2.45) (2.02,1.22) (1.12,0.35)MaxEWMA-OIRSS 0.05 1.50 (3.42,2.56) (2.98,2.16) (2.16,1.36) (1.25,0.5) (1,0.03)MaxEWMA-OIDRSS 0.05 1.50 (2.91,2.01) (2.48,1.62) (1.71,0.93) (1.07,0.27) (1,0)MaxEWMA-OIRSS 0.15 1.50 (3.57,2.67) (3.13,2.26) (2.3,1.47) (1.32,0.56) (1,0.04)MaxEWMA-OIDRSS 0.15 1.50 (3.18,2.21) (2.76,1.86) (1.95,1.13) (1.15,0.37) (1,0.01)MaxEWMA-OIRSS 0.30 1.50 (3.7,2.77) (3.29,2.41) (2.45,1.6) (1.39,0.63) (1,0.06)MaxEWMA-OIDRSS 0.30 1.50 (3.44,2.44) (3.05,2.09) (2.2,1.32) (1.25,0.49) (1,0.02)MaxEWMA-OIRSS 0.50 1.50 (3.82,2.87) (3.43,2.52) (2.6,1.73) (1.47,0.71) (1.01,0.09)MaxEWMA-OIDRSS 0.50 1.50 (3.64,2.61) (3.28,2.28) (2.43,1.52) (1.36,0.59) (1,0.05)MaxEWMA-SRS — 2.00 (1.95,1.28) (1.91,1.24) (1.81,1.14) (1.53,0.85) (1.13,0.37)MaxGWMA-SRS — 2.00 (1.94,1.25) (1.9,1.22) (1.8,1.12) (1.53,0.84) (1.13,0.37)MaxEWMA-OIRSS 0.05 2.00 (1.53,0.86) (1.49,0.81) (1.39,0.69) (1.15,0.4) (1,0.06)MaxEWMA-OIDRSS 0.05 2.00 (1.37,0.66) (1.33,0.62) (1.23,0.49) (1.05,0.22) (1,0.01)MaxEWMA-OIRSS 0.15 2.00 (1.57,0.89) (1.53,0.85) (1.43,0.73) (1.18,0.43) (1.01,0.07)MaxEWMA-OIDRSS 0.15 2.00 (1.44,0.73) (1.4,0.68) (1.3,0.57) (1.08,0.29) (1,0.01)MaxEWMA-OIRSS 0.30 2.00 (1.61,0.92) (1.57,0.89) (1.47,0.78) (1.22,0.48) (1.01,0.1)MaxEWMA-OIDRSS 0.30 2.00 (1.51,0.79) (1.48,0.76) (1.37,0.65) (1.13,0.37) (1,0.03)MaxEWMA-OIRSS 0.50 2.00 (1.65,0.96) (1.61,0.93) (1.5,0.81) (1.25,0.52) (1.01,0.12)MaxEWMA-OIDRSS 0.50 2.00 (1.57,0.86) (1.54,0.82) (1.44,0.72) (1.19,0.43) (1,0.06)
A. HAQ, J. BROWN AND E. MOLTCHANOVA
purpose, all samples are combined so as to obtain 200 measurements. It has been shown in Haq et al. 28 that the complete data setmeets the normality assumption. We generate 25 samples, each of size 5, from the 200 measurements using SRS, ORSS and ODRSSschemes. Note that all samples are drawn using with replacement selection. Based on these samples, we estimate the unknownprocess parameters and calculate the plotting-statistic of the MaxEWMA control charts considered here. For each chart, the in-control
Copyright © 2014 John Wiley & Sons, Ltd. Qual. Reliab. Engng. Int. 2014

Table
XI.Acomparisonofthediagnosticab
ilities
oftheMaxGWMA-ORS
San
dtheMaxEW
MA-ODRS
Scontrolcharts
forξ=0.05
when
thein-controlA
RLisfixedto
370
MaxEW
MA-ORS
SMaxEW
MA-ODRS
S
ρδ→
0.00
0.25
0.50
0.75
1.00
1.50
2.00
2.50
3.00
0.00
0.25
0.50
0.75
1.00
1.50
2.00
2.50
3.00
0.25
m+
00
052
687
788
988
987
287
00
051
267
272
279
271
279
301
m�
00
00
00
00
00
00
00
00
00
v+
00
00
00
00
00
00
00
00
00
v�
1000
1000
699
430
00
00
1000
999
594
00
00
00
++
00
00
00
00
00
00
00
00
00
+�
00
301
431
123
111
111
128
130
01
355
733
728
721
729
721
699
�+
00
00
00
00
00
00
00
00
00
��
00
00
00
00
00
00
00
00
00
0.50
m+
06
547
916
994
995
995
992
993
029
636
954
961
967
964
964
962
m�
00
00
00
00
00
00
00
00
00
v+
00
00
00
00
00
00
00
00
00
v�
1000
975
165
20
00
00
1000
888
310
00
00
0++
00
00
00
00
00
00
00
00
00
+�
019
288
826
55
87
083
333
4639
3336
3638
�+
00
00
00
00
00
00
00
00
00
��
00
00
00
00
00
00
00
00
00
0.75
m+
058
496
599
299
899
910
0099
899
91
709
982
996
995
998
997
995
997
m�
10
00
00
00
01
00
00
00
00
v+
00
00
00
00
00
00
00
00
00
v�
999
351
110
00
00
099
822
24
00
00
00
++
00
00
00
00
00
00
00
00
00
+�
065
248
21
02
10
6914
45
23
53
�+
00
00
00
00
00
00
00
00
00
��
00
00
00
00
00
00
00
00
00
1.00
m+
247
973
989
992
994
994
994
993
996
233
981
986
992
996
994
996
991
993
m�
251
00
00
00
00
241
00
00
00
00
v+
291
215
62
00
00
328
127
10
00
00
v�
211
51
00
00
00
198
52
00
00
00
++
01
42
25
66
30
14
63
53
97
+�
00
10
21
01
10
11
11
11
00
�+
00
00
00
00
00
00
00
00
00
��
00
00
00
00
00
00
00
00
00
1.25
m+
3255
582
789
892
092
593
594
093
539
611
828
879
913
925
902
918
920
m�
541
00
00
00
031
00
00
00
00
v+
899
388
112
4718
10
00
921
313
7526
30
00
0v�
10
00
00
00
00
00
10
00
00
++
955
6155
6274
6560
654
7697
9484
7598
8280
+�
00
00
00
00
00
00
00
00
00
�+
51
00
00
00
05
00
00
00
00
(Con
tinues)
A. HAQ, J. BROWN AND E. MOLTCHANOVA
Copyright © 2014 John Wiley & Sons, Ltd. Qual. Reliab. Engng. Int. 2014

Table
XI.Con
tinued.
MaxEW
MA-ORS
SMaxEW
MA-ODRS
S
ρδ→
0.00
0.25
0.50
0.75
1.00
1.50
2.00
2.50
3.00
0.00
0.25
0.50
0.75
1.00
1.50
2.00
2.50
3.00
��
00
00
00
00
00
00
00
00
00
1.50
m+
5924
549
962
572
077
978
277
477
935
253
513
685
706
743
717
704
698
m�
438
20
00
00
030
30
00
00
00
v+
854
661
335
152
8012
00
089
259
625
271
180
00
0v�
00
00
00
00
01
00
00
00
00
++
1985
164
223
200
209
218
226
221
2614
623
524
427
625
728
329
630
2+�
00
00
00
00
00
00
00
00
00
�+
251
00
00
00
016
20
00
00
00
��
00
00
00
00
00
00
00
00
00
2.00
m+
3993
165
276
337
394
408
425
417
2176
174
233
280
298
281
295
303
m�
3523
20
00
00
019
71
00
00
00
v+
784
693
547
328
191
482
00
820
692
434
231
778
00
0v�
00
00
00
00
00
00
00
00
00
++
7016
827
739
447
255
859
057
558
361
200
388
536
642
694
719
705
697
+�
00
00
00
00
00
00
00
00
00
�+
7223
92
00
00
079
253
01
00
00
��
00
00
00
00
00
00
00
00
00
2.50
m+
2252
7510
515
317
619
618
816
914
3240
8284
9910
491
102
m�
2110
30
00
00
013
62
00
00
00
v+
711
664
566
453
271
103
252
071
567
350
029
315
122
20
0v�
00
00
00
00
00
00
00
00
00
++
108
217
318
431
573
721
779
810
831
125
250
441
622
764
879
894
909
898
+�
00
00
00
00
00
00
00
00
00
�+
138
5738
113
00
00
133
3917
31
00
00
��
00
00
00
00
00
00
00
00
00
3.00
m+
1236
3853
5590
8210
381
315
1626
3532
3639
39m
�16
47
10
10
00
03
01
00
00
0v+
648
617
538
475
369
162
5316
166
060
249
332
721
044
70
0v�
00
00
00
00
00
00
00
00
00
++
167
267
362
444
560
746
863
881
918
168
298
448
633
750
924
957
961
961
+�
00
00
00
00
00
00
00
00
00
�+
157
7655
2716
12
00
169
8243
135
00
00
��
00
00
00
00
00
00
00
00
00
A. HAQ, J. BROWN AND E. MOLTCHANOVA
Copyright © 2014 John Wiley & Sons, Ltd. Qual. Reliab. Engng. Int. 2014

Figure 1. Comparison of the MaxEWMA-SRS, MaxGWMA-SRS, MaxEWMA-ORSS and MaxEWMA-ODRSS control charts for piston rings data
A. HAQ, J. BROWN AND E. MOLTCHANOVA
ARL is fixed to 370. The other parameters’ values are ξ = 0.05, q= 0.95, α=0.80, L1 = 2.7640, L2 = 2.8430, L3 = 2.7650 and L4 = 2.7659. Allcharts are displayed in Figure 1. It is clear from sub-figures (A), (C), (E) and (F) that the process remains in statistical control for the first25 samples under each quality control scheme. Now suppose that the process gets out-of-control after the 25th sample due to someinternal cause(s). For this purpose, we generate 15 samples, each of size 5, from the 200 measurement under each sampling scheme.Then, we multiply the sample values under each sampling scheme by 1.00005 and add 0.01. The plotting-statistics of the controlcharts from these 15 samples are computed and plotted against the sample number in sub-figures (B), (D), (F) and (H) of Figure 1.It is now clear that the all charts are showing out-of-control signals after the 25th sample. The MaxEWMA-SRS, MaxGWMA-SRS,MaxEWMA-ORSS and MaxEWMA-ODRSS control charts are detecting shifts in the process parameters at the 31st, 30th, 28th and27th samples, respectively. This shows that the proposed MaxEWMA-ODRSS control chart is able to detect a shift in the process meanand/or process dispersion substantially quicker than its counterparts.
7. Conclusion
In this study, we have suggested new MaxEWMA-ODRSS and MaxEWMA-OIDRSS control charts for simultaneously monitoring theprocess mean and the process dispersion. Monte Carlo simulations have been used to estimate the ARLs and SDRLs of the proposedMaxEWMA control charts. The run length performances of the proposed charts have been compared with that of the existing controlcharts. It is worth mentioning that the MaxEWMA-ODRSS and MaxEWMA-OIDRSS control charts outperform the MaxEWMA-SRS,
Copyright © 2014 John Wiley & Sons, Ltd. Qual. Reliab. Engng. Int. 2014

A. HAQ, J. BROWN AND E. MOLTCHANOVA
MaxGWMA-SRS, MaxEWMA-ORSS and MaxEWMA-OIRSS control charts. Thus, we recommend the use of the proposed MaxEWMA-ODRSS and MaxEWMA-OIDRSS control charts for efficient simultaneous detection of shifts in the process mean and variability.
References1. Roberts SW. Control chart tests based on geometric moving averages. Technometrics 1959; 1:239–250.2. Crowder SV, Hamilton MD. An EWMA for monitoring a process standard deviation. Journal of Quality Technology 1992; 24:12–21.3. Abbasi SA, Miller A. On proper choice of variability control chart for normal and non-normal processes. Quality and Reliability Engineering
International 2012; 28:279–296.4. Abbas N, Riaz M, Does RJMM. Enhancing the performance of EWMA charts. Quality and Reliability Engineering International 2011; 27:821–833.5. Abbas N, Riaz M, Does RJMM. Mixed exponentially weighted moving average-cumulative sum charts for process monitoring. Quality and Reliability
Engineering International 2013; 29:345–356.6. Abbas N, Riaz M, Does RJMM. CS-EWMA chart for monitoring process dispersion. Quality and Reliability Engineering International 2013;
29:653–663.7. Riaz M, Abbas N, Does RJMM. Improving the performance of CUSUM charts. Quality and Reliability Engineering International 2011; 27:415–424.8. Huwang L, Huang C-J, Wang Y-HT. New EWMA control charts for monitoring process dispersion. Computational Statistics & Data Analysis 2010;
54:2328–2342.9. Haq A.. A new hybrid exponentially weighed moving average control chart for monitoring process mean. Quality and Reliability Engineering
International 2013; 29:1015–1025.10. Haq A. An improved mean deviation exponentially weighted moving average control chart to monitor process dispersion under ranked set
sampling. Journal of Statistical Computation and Simulation 2014; 84:2011–2024.11. Haq A, Brown J, Moltchanova E. New exponentially weighted moving average control charts for monitoring process dispersion. Quality and
Reliability Engineering International 2013. DOI: 10.1002/qre.1553.12. Chen G, Cheng SW. Max chart: combining X chart and S chart. Statistica Sinica 1998; 8:263–271.13. Lee P-H, Lin C-S. Adaptive Max charts for monitoring process mean and variability. Journal of the Chinese Institute of Industrial Engineers 2012;
29:193–205.14. Chen G, Cheng SW, Xie H. Monitoring process mean and variability with one EWMA chart. Journal of Quality Technology 2001; 33:223–233.15. Sheu S-H, Huang C-J, Hsu T-S. Extended maximum generally weighted moving average control chart for monitoring process mean and variability.
Computers & Industrial Engineering 2012; 62:216–225.16. Sheu S-H, Huang C-J, Hsu T-S. Maximum chi-square generally weighted moving average control chart for monitoring process mean and variability.
Communications in Statistics-Theory and Methods 2013; 42(23):4323–4341.17. McIntyre GA. A method for unbiased selective sampling, using ranked sets. Australian Journal of Agriculture Research 1952; 3:385–390.18. Takahasi K, Wakimoto K. On unbiased estimates of population mean based on sample stratified by means of ordering. Annals of the Institute of
Statistical Mathematics 1968; 20:1–31.19. Jafari Jozani M, Mirkamali SJ. Control charts for attributes with maxima nominated samples. Journal of Statistical Planning and Inference 2011;
141(7):2386–2398.20. Dell TR, Clutter JL. Ranked-set sampling theory with order statistics background. Biometrics 1972; 28:545–555.21. Stokes SL. Ranked set sampling with concomitant variables. Communications in Statistics-Theory and Methods 1977; 6(12):1207–1211.22. Salazar RD, Sinha AK. Control chart X-bar based on ranked set sampling. Comunicacion Tecica No. 1-97-09 (PE/CIMAT), 1997.23. Al-Saleh MF, Al-Kadiri MA. Double-ranked set sampling. Statistics & Probability Letters 2000; 48:205–212.24. Abujiya MR, Muttlak HA. Quality control chart for the mean using double ranked set sampling. Journal of Applied Statistics 2004; 31:1185–1201.25. Al-Omari AI, Haq A. Improved quality control charts for monitoring the process mean, using double-ranked set sampling methods. Journal of
Applied Statistics 2012; 39(4):745–763.26. Balakrishnan N, Li T. BLUEs of parameters of generalized geometric distribution using ordered ranked set sampling. Communications in Statistics-
Simulation and Computation 2005; 34:253–266.27. Balakrishnan N, Li T. Ordered ranked set samples and applications to inference. Journal of Statistical Planning and Inference 2008; 138:3512–3524.28. Haq A, Brown J, Moltchanova E, Al-Omari AI. Improved exponentially weighted moving average control charts for monitoring process mean and
dispersion. Quality and Reliability Engineering International 2013. DOI: 10.1002/qre.1573.29. Haq A, Brown J, Moltchanova E. An improved maximum exponentially weighted moving average control chart for monitoring process mean and
variability. Quality and Reliability Engineering International 2013. DOI: 10.1002/qre.1586.30. Haq A, Brown J, Moltchanova E, Al-Omari AI. Ordered double ranked set samples and applications to inference. American Journal of Mathematical
and Management Sciences 2014; Accepted for publication.31. Haq A, Brown J, Moltchanova E. New exponentially weighted moving average control charts for monitoring process mean and process dispersion.
Quality and Reliability Engineering International 2014. DOI: 10.1002/qre.1646.32. Quesenberry CP. On properties of Q charts for variables. Journal of Quality Technology 1995; 27:184–203.33. Xie H. Contributions to qualimetry. Ph.D. thesis. Winnipeg, Canada: University of Manitoba, 1999.34. Nakagawa T, Osaki S. The discrete Weibull distribution. IEEE Transaction on Reliability 1975; R-24:300–301.35. David HA, Nagaraja HN. Order Statistics, 3rd edn. John Wiley & Sons: New York, 2003.36. Montgomery DC. Introduction to Statistical Quality Control, 6th edn. John Wiley & Sons, Inc.: New York, 2009.
Appendix A
Recall that X(r :m), r=1, 2,…,n, are INID random variables. Let (X(1 :n),j,X(2 :n),j,…,X(n :n),j) denote a ranked set sample of size n obtained in thejth cycle, for j=1, 2,…,n. Let XDRSS
r:nð Þ ¼ rth min X 1:nð Þ;r ; ; X 2:nð Þ;r ;…; ; X n:nð Þ;r�
, r=1, 2,…,n, denote a double ranked set sample of size n.
Suppose A= ((ai,j)) is a square matrix of order n. The permanent of the matrix A is defined as Per Að Þ ¼XP
∏n
j¼1aj;ij , where
XP
�ð Þdenotes the sum over all n ! permutations (i1, i2,…, in) of (1, 2,…, n).
The CDF of XDRSSr:nð Þ 1≤r≤nð Þ is given by
Copyright © 2014 John Wiley & Sons, Ltd. Qual. Reliab. Engng. Int. 2014

A. HAQ, J. BROWN AND E. MOLTCHANOVA
FDRSSr:nð Þ xð Þ ¼Xni¼r
1
i! n� ið Þ! Per A1ð Þ; � ∞ < x < ∞;
whereA1 ¼F 1:nð Þ xð Þ F 2:nð Þ xð Þ ⋯ F n:nð Þ xð Þ
1� F 1:nð Þ xð Þ 1� F 2:nð Þ xð Þ ⋯ 1� F n:nð Þ xð Þ
!gign� i. Here, ‘}i’ and ‘}n� i’ show that the first row is repeated i times
and the second row is repeated n� i times, respectively.
Similarly, the PDF of XDRSSr:nð Þ 1 ≤ r ≤ nð Þ is given by
fDRSSr:nð Þ xð Þ ¼ 1
r � 1ð Þ! n� rð Þ! Per A2ð Þ; � ∞ < x < ∞;
where A2 ¼F 1:nð Þ xð Þ F 2:nð Þ xð Þ ⋯ F n:nð Þ xð Þf 1:nð Þ xð Þ f 2:nð Þ xð Þ ⋯ f n:nð Þ xð Þ
1� F 1:nð Þ xð Þ 1� F 2:nð Þ xð Þ ⋯ 1� F n:nð Þ xð Þ
0B@1CA gr � 1g1gn� r.
Under ODRSS scheme, we sort the random variables under DRSS scheme in an increasing order of magnitude. Let XODRSSr:nð Þ ¼
rth min XDRSS1:nð Þ ; X
DRSS2:nð Þ ;…; XDRSS
n:nð Þn o
, r=1, 2,…, n, denote an ordered double ranked set sample of size n. Note that here XDRSSr:nð Þ ,
r=1, 2,…, n, are INID random variables.
Following Haq et al. 30,31, the PDF of XODRSSr:nð Þ 1 ≤ r ≤ nð Þ is given by
fODRSSr:nð Þ xð Þ ¼ 1
r � 1ð Þ! n� rð Þ! Per A3ð Þ; � ∞ < x < ∞;
where A3 ¼FDRSS1:nð Þ xð Þ FDRSS2:nð Þ xð Þ ⋯ FDRSSn:nð Þ xð ÞfDRSS1:nð Þ xð Þ fDRSS2:nð Þ xð Þ ⋯ fDRSSn:nð Þ xð Þ
1� FDRSS1:nð Þ xð Þ 1� FDRSS2:nð Þ xð Þ ⋯ 1� FDRSSn:nð Þ xð Þ
0BB@1CCA gr � 1g1gn� r.
The joint density function of XODRSSr:nð Þ and XODRSS
s:nð Þ 1≤ r < s ≤ nð Þ is given by
fODRSSr;s:nð Þ xr ; ; xsð Þ ¼ 1
r � 1ð Þ! s� r � 1ð Þ! n� sð Þ! Per A4ð Þ; � ∞ < xr < xs < ∞;
FDRSS1:nð Þ xrð Þ FDRSS2:nð Þ xrð Þ ⋯ FDRSSn:nð Þ xrð ÞfDRSS1:nð Þ xrð Þ fDRSS2:nð Þ xrð Þ ⋯ fDRSSn:nð Þ xrð Þ
0BBB1CCC
where A4 ¼ FDRSS1:nð Þ xsð Þ � FDRSS1:nð Þ xrð Þ FDRSS2:nð Þ xsð Þ � FDRSS2:nð Þ xrð Þ ⋯ FDRSSn:nð Þ xsð Þ � FDRSSn:nð Þ xrð ÞfDRSS1:nð Þ xsð Þ fDRSS2:nð Þ xsð Þ ⋯ fDRSSn:nð Þ xsð Þ
1� FDRSS1:nð Þ xsð Þ 1� FDRSS2:nð Þ xsð Þ ⋯ 1� FDRSSn:nð Þ xsð Þ
BBBBB@CCCCCA
gr � 1g1gs� r � 1g1gn� s.
Let μODRSSX r:nð Þ and σODRSS
X r;r:nð Þ be the mean and variance of XODRSSr:nð Þ 1≤ r ≤ nð Þ, respectively, given by
μODRSSX r:nð Þ ¼ ∫x fODRSSr:nð Þ xð Þdx and σODRSS
X r;r:nð Þ ¼ ∫ x � μODRSSr:nð Þ
2fODRSSr:nð Þ xð Þdx.
Similarly, the covariance between XODRSSr:nð Þ and XODRSS
s:nð Þ , say σODRSSX r;s:nð Þ 1≤r < s ≤ nð Þ, is given by
σODRSSX r;s:nð Þ ¼ ∫
∞
�∞∫xs
�∞xr xs f
ODRSSr;s:nð Þ xr ; xsð Þdxr dxs � μODRSS
X r:nð Þ μODRSSX s:nð Þ :
Authors' biographies
Abdul Haq gained his MSc in Statistics from the Department of Statistics, Quaid-i-Azam University (QAU), Islamabad, Pakistan, in 2007and MPhil in Statistics from the Department of Statistics, QAU, Islamabad, Pakistan, in 2010. He is a lecturer at the Department ofStatistics, QAU, Islamabad, Pakistan, and currently doing PhD in Statistics at the School of Mathematics and Statistics, University ofCanterbury, Christchurch, New Zealand. His research interests are quality control charts and their applications, ranked set sampling,and Bayesian inference.
Copyright © 2014 John Wiley & Sons, Ltd. Qual. Reliab. Engng. Int. 2014

A. HAQ, J. BROWN AND E. MOLTCHANOVA
Professor Jennifer Brown is the head of the School of Mathematics and Statistics at University of Canterbury. She is the immediatepast president of the New Zealand Statistical Association. She gained her PhD in Statistics from Otago University and has been anacademic at University of Canterbury since 1996. Her research interests are in sample surveying and environmental statistics.
Elena Moltchanova has defended her PhD thesis on ‘Application of Bayesian Spatial Methods in Health and Population Studies UsingRegistry Data’ in the University of Jyvaskyla, Finland, in 2005. She has, since then, applied spatial statistical methods in a variety offields, including epidemiology, forestry, and archaeology. Her research interests include Bayesian spatiotemporal models andmodeling of extreme events. She is currently with the University of Canterbury, Christchurch, New Zealand.
Copyright © 2014 John Wiley & Sons, Ltd. Qual. Reliab. Engng. Int. 2014