theme discovery from gene lists for identification and viewing of multiple functional groups
TRANSCRIPT
BioMed CentralBMC Bioinformatics
ss
Open AcceMethodology articleTheme discovery from gene lists for identification and viewing of multiple functional groupsPetri Pehkonen1,2, Garry Wong1 and Petri Törönen*1,3Address: 1Department of Neurobiology, A.I. Virtanen-Institute, University of Kuopio P.O. Box 1627, FIN-70211 Kuopio, Finland, 2Department of Computer Science, University of Kuopio P.O. Box 1627, FIN-70211 Kuopio, Finland and 3Bioinformatics Group, Institute of Biotechnology, P.O. Box 56, 00014 University of Helsinki, Finland
Email: Petri Pehkonen - [email protected]; Garry Wong - [email protected]; Petri Törönen* - [email protected]
* Corresponding author
AbstractBackground: High throughput methods of the genome era produce vast amounts of data in theform of gene lists. These lists are large and difficult to interpret without advanced computationalor bioinformatic tools. Most existing methods analyse a gene list as a single entity although it iscomprised of multiple gene groups associated with separate biological functions. Therefore it isimperative to define and visualize gene groups with unique functionality within gene lists.
Results: In order to analyse the functional heterogeneity within a gene list, we have developed amethod that clusters genes to groups with homogenous functionalities. The method uses Non-negative Matrix Factorization (NMF) to create several clustering results with varying numbers ofclusters. The obtained clustering results are combined into a simple graphical presentation showingthe functional groups over-represented in the analyzed gene list. We demonstrate its performanceon two data sets and show results that improve upon existing methods. The comparison alsoshows that our method creates a more simplified view that aids in discovery of biological themeswithin the list and discards less informative classes from the results.
Conclusion: The presented method and associated software are useful for the identification andinterpretation of biological functions associated with gene lists and are especially useful for theanalysis of large lists.
BackgroundRecent developments in biosciences have created a dra-matic change from the analysis of a few genes to large genelists. These lists are usually selected at the genomic level bycriteria such as activity in a stress treatment [1], impor-tance to cell survival in a specific growth condition [2], oras a result of clustering genes by expression profiles [3]. Ascurrent high throughput methods produce a vast amountof data as gene lists, the subsequent analysis tends to be a
bottleneck due the size of the data set and the high prob-ability of false positive genes among the lists.
One solution to analyse a gene list is to draw informationeither from the existing literature or from the databasesrepresenting whole genome [4,5] or proteome annota-tions [6,7], and then using these to guide the analysis.Most of these databases simplify the analysis by classify-ing genes to the biological categories or classes thatpresent their function, localization, or partnership in
Published: 29 June 2005
BMC Bioinformatics 2005, 6:162 doi:10.1186/1471-2105-6-162
Received: 18 March 2005Accepted: 29 June 2005
This article is available from: http://www.biomedcentral.com/1471-2105/6/162
© 2005 Pehkonen et al; licensee BioMed Central Ltd. This is an Open Access article distributed under the terms of the Creative Commons Attribution License (http://creativecommons.org/licenses/by/2.0), which permits unrestricted use, distribution, and reproduction in any medium, provided the original work is properly cited.
Page 1 of 18(page number not for citation purposes)
BMC Bioinformatics 2005, 6:162 http://www.biomedcentral.com/1471-2105/6/162
some protein complex. A further step is to estimate thestatistical significance of associations between the classesand genes of the obtained list. Several applications havebeen recently reported for such analysis [8,9]. Most ofthese applications compare the frequency of gene classesin the user supplied gene list, obtained by various criteria,to the remaining genes that did not fulfill the criteria. Thelatter often includes the rest of the genes from the wholegenome. The usual outcome from these methods is asorted list of biological classes considered important.These methods have been beneficial to data analysis byguiding the process towards the most important featuresin the gene list [10-13]. In addition, the observation ofmultiple genes from the same functional class increasesconfidence in results obtained from high throughputmethods.
While these methods are useful, several weaknesses areassociated with this approach. A gene list can have a het-erogeneous structure with multiple dissimilar gene groupssuch as stress response, a specific metabolic pathway, andprotein degradation. The basic statistics used by the previ-ously mentioned methods are often insufficient to revealthis kind of heterogeneity from the associated functionalclasses. Rather, they have a tendency to be biased towardthe gene sub-group associated with the most over-repre-sented functional classes within the analyzed list of genes.This overwhelms many important, but less over-repre-sented, classes that are associated with the rest of the genesin the list. Therefore, it could be hypothesized that thereexists other interesting biological functions among thegenes that are not members of the best scoring classes. Assuch, the existing methods do not address this questionand thus there is a need for an approach that would con-centrate on the possible heterogeneity in the gene list. Inthe current work, we propose the clustering of a gene listfor finding gene groups that differ in functional classannotations.
ResultsPrinciple of the methodOur method takes, as input, the user given gene list cho-sen by some selection criteria. The selected list is referredto as a sample gene list, and the gene list that did not meetthe criteria is referred to as a reference gene list. The aim isthen clustering the sample gene list for finding genegroups with different functional class annotations. Theclustering is solely based on the gene associations withfunctional classes obtained from Gene Ontology (GO)database [14], and the measurements like gene expressionlevel or sequence similarity are not used. As a clusteringmethod, we use Non-negative Matrix Factorization (NMF)[15] to create a k-means like partition. The well knownweakness with this type of clustering approach is therequirement to select the number of clusters and the ini-
tialization for the algorithm. We circumvent this weaknessby using a non-nested hierarchical clustering scheme,which allows parallel visualization of several differentclustering results. Here, a gene list is repeatedly dividedinto a growing number of clusters by clustering from ran-dom starting initializations. The different clusteringresults are presented in consecutive levels ordered withthe number of clusters, with the first level presenting thegene list without any clustering. Strongly correlating clus-ters between the consecutive levels are connected by edgesforming a non-nested hierarchy (see figures 1, 2, 3). Theoutput graph highlights the clusters that stay similarthrough the different clustering levels despite the varyingnumber of divisions and different random starting initial-izations. The resulting visualization can be used either forobtaining suitable grouping for a gene list, or identifyingindividual clusters that are of interest.
In the non-nested clustering hierarchy, the cluster con-tents are described with the most representative func-tional classes. For this, a combination of three differentmeasures was used to show over-represented classeswithin each cluster. The measures are positive/negativesigned ten based logarithmic transforms [10] of p-valuescalculated with Fisher's test [16,17], which compares classfrequencies between two sets of genes. The first measure,"Original log(p)" (denoted by O.log(p)), makes a com-parison between the whole user given sample and refer-ence gene lists. It reports class over-representation thatwas observed before any clustering. Because of the wideusage of this measure reported in the literature [10,11,18],it is suitable for method comparison. As a comparison,the second measure, "Sample log(p)" (denoted byS.log(p)), concentrates fully on clustered sample gene listby comparing a single cluster against the other genes inthe sample list. It highlights the classes that contributedmost to the formation of the cluster. The third measure,"Complete log(p)" (denoted by C.log(p)), compares asingle cluster against the other genes of the sample genelist and reference. It takes into account both the contribu-tion to the formation of a cluster and the over-representa-tion in the sample list before clustering, and thus we useit for reporting the contents of a cluster. C.log(p) is partlydependent on the preceding clustering, and thus canreport some classes that are not over-represented in thewhole user given sample gene list, which we are aiming toanalyze. Therefore, such hits are filtered by excluding theclasses with weak O.log(p) from the report. Similarly,classes that have not contributed to the formation of theanalyzed cluster are removed by discarding the classes thatdo not show even slight over-representation withS.log(p). As a result of filtering, the remaining classes areover-represented in both the analyzed cluster and in theoriginal sample list. In this description, only O.log(p)gives statistically analyzable results because C.log(p) and
Page 2 of 18(page number not for citation purposes)
BMC Bioinformatics 2005, 6:162 http://www.biomedcentral.com/1471-2105/6/162
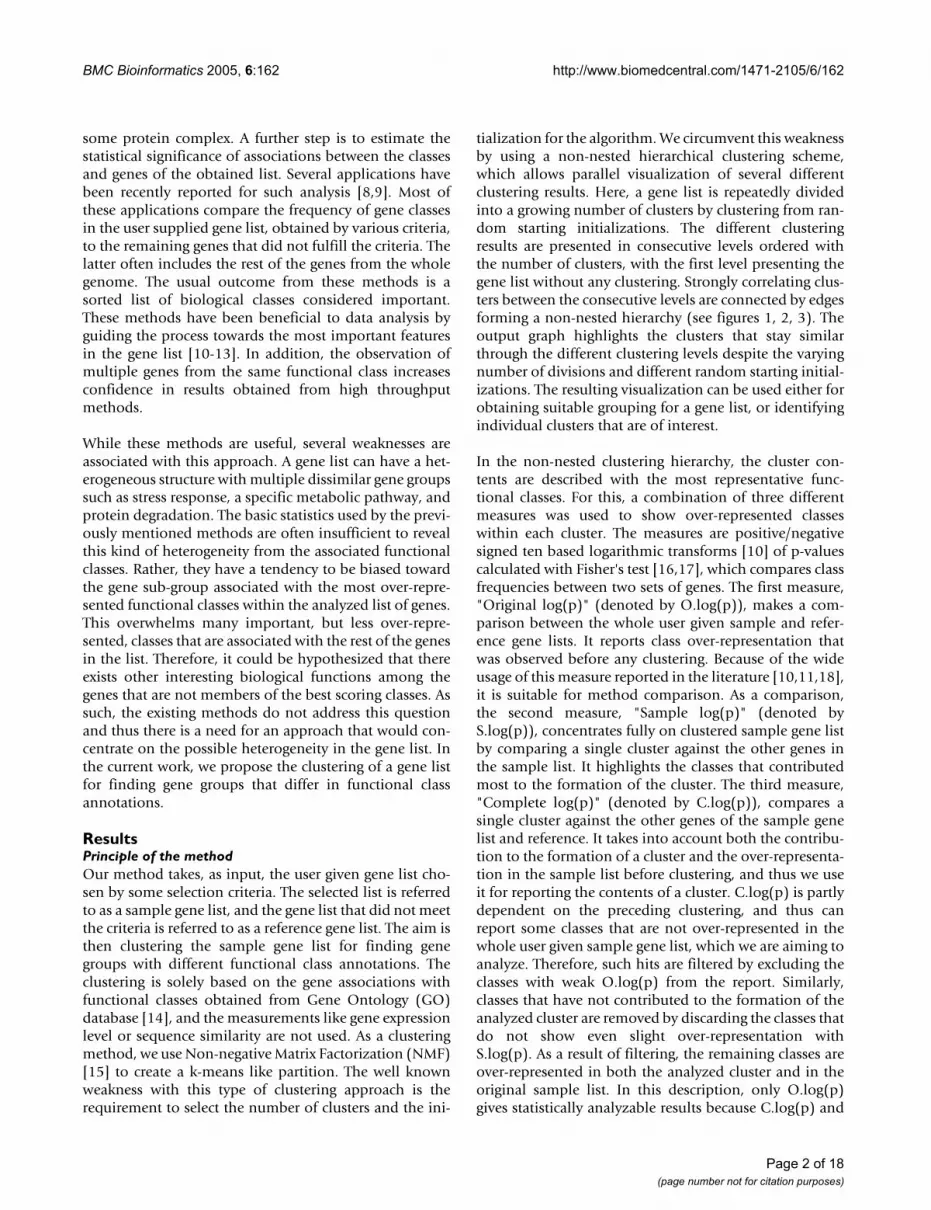
Graphical results from the analysis of H2O2 datasetFigure 1Graphical results from the analysis of H2O2 dataset. The figure shows the non-nested hierarchical clustering tree obtained from GENERATOR with the H2O2 dataset. Each layer presents one clustering solution and each box a single cluster. Boxes show the two best scoring functional classes and the colour of the box corresponds to the over-representation of the best scoring functional class. Best correlating clusters between the consecutive clustering layers are connected with lines. A thicker line indicates a stronger correlation. The correlation value is indicated beside each line. The lines between the first and second level (marked with asterisks) do not present any value as the correlation measure is not defined here. Section A presents a view where two functional classes that contributed most to the cluster formation are shown for each cluster. Sec-tion B shows more informative visualization, the default view of GENERATOR, where two classes that were most over-repre-sented in both the original sample list and in the cluster in question are shown. Note the conserved clusters across the different clustering results. We have marked them with Roman numerals.
Page 3 of 18(page number not for citation purposes)
BMC Bioinformatics 2005, 6:162 http://www.biomedcentral.com/1471-2105/6/162
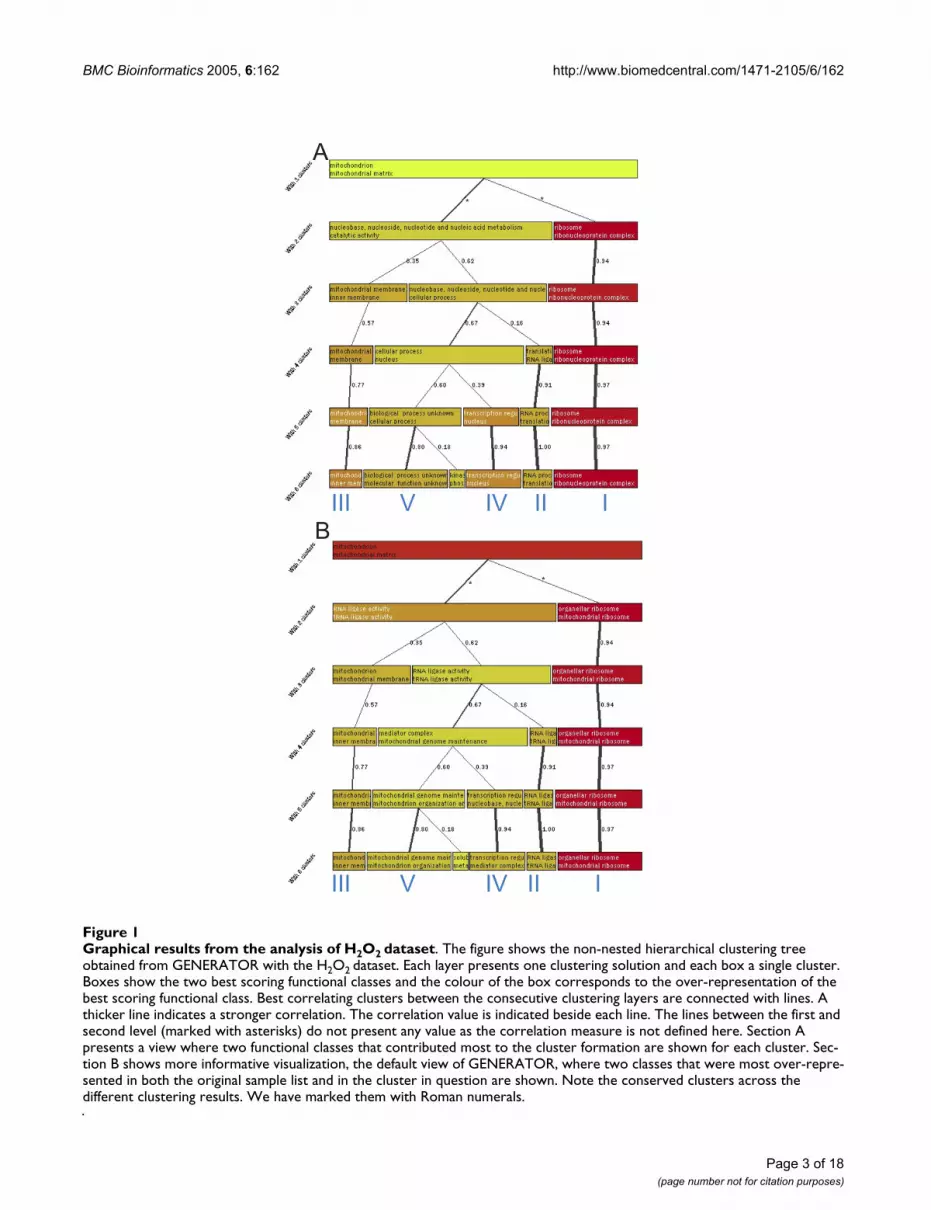
Replications of non-nested hierarchical clustering tree with H2O2 datasetFigure 2Replications of non-nested hierarchical clustering tree with H2O2 dataset. The figure presents the four replications for the non-nested hierarchical clustering graph for H2O2 dataset. We have marked the conserved gene clusters with the same Roman numerals as in figure 1. Notice that most clusters (especially I, II and III) can be observed over several levels in each cluster tree.
Page 4 of 18(page number not for citation purposes)
BMC Bioinformatics 2005, 6:162 http://www.biomedcentral.com/1471-2105/6/162
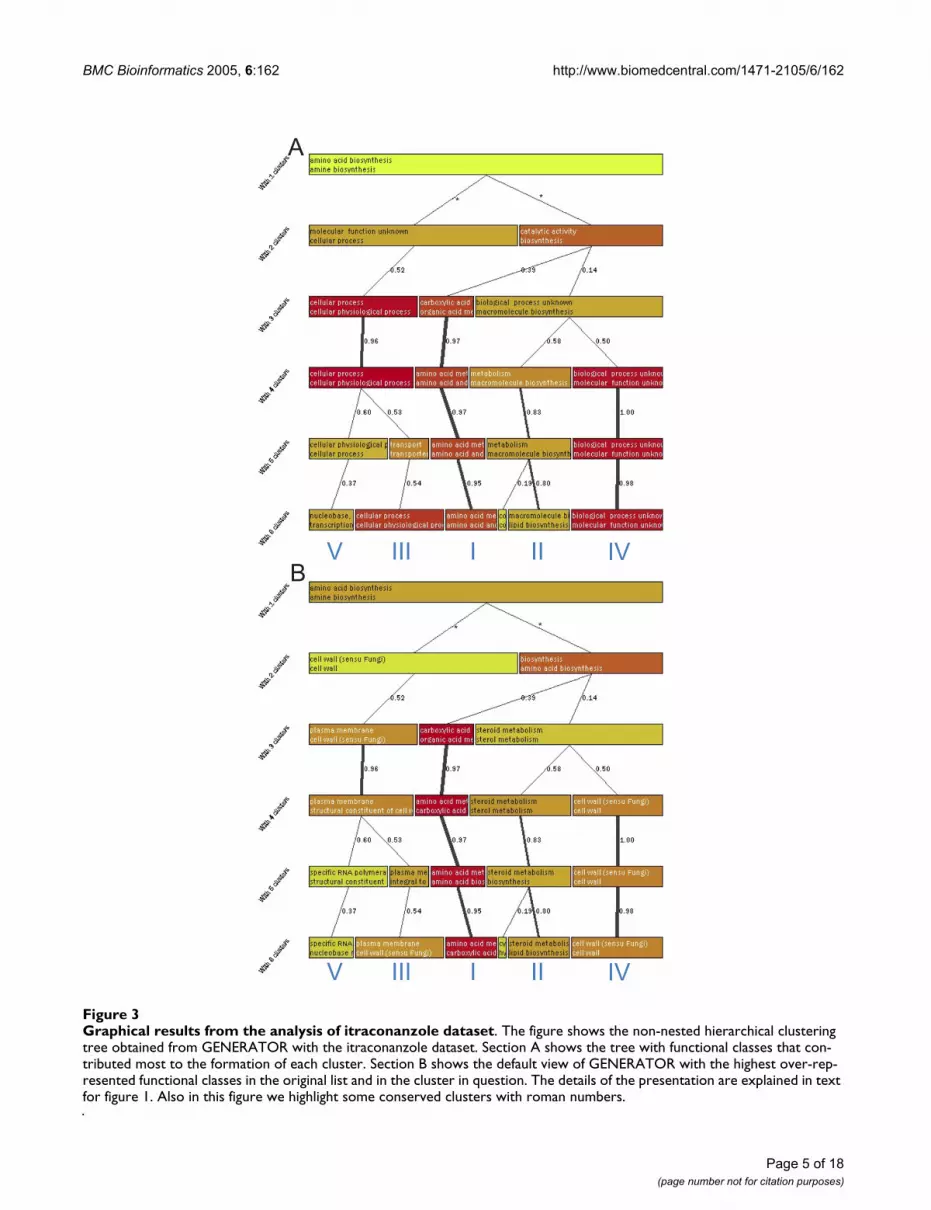
Graphical results from the analysis of itraconanzole datasetFigure 3Graphical results from the analysis of itraconanzole dataset. The figure shows the non-nested hierarchical clustering tree obtained from GENERATOR with the itraconanzole dataset. Section A shows the tree with functional classes that con-tributed most to the formation of each cluster. Section B shows the default view of GENERATOR with the highest over-rep-resented functional classes in the original list and in the cluster in question. The details of the presentation are explained in text for figure 1. Also in this figure we highlight some conserved clusters with roman numbers.
Page 5 of 18(page number not for citation purposes)
BMC Bioinformatics 2005, 6:162 http://www.biomedcentral.com/1471-2105/6/162
S.log(p) are both based on the same data with the preced-ing clustering. Nevertheless, the latter two are suitable forhighlighting the classes that are over-represented withinthe clusters. A more detailed description of the non-nestedclustering scheme is given in the Methods section.
Software implementationIn order to make the method applicable for others, wehave developed an end-user program called GENERATOR(GENElist Research Aimed Theme-discovery executOR)for the Windows 2000/XP environments. It takes, asinput, the sample and reference lists of genes that can becomprised of gene names or identifiers supported by GOdatabase. The list of available species and allowable nam-ing systems are described more in GENERATOR user man-ual [21] and in GO web site [22]. Alternatively,GENERATOR can be used to analyze existing binary datamatrices like in-house created functional gene classifica-tions or other similar binary data analysis problems con-sisting of sample and reference groups. The first outcomefrom the program is a non-nested hierarchical clusteringtree, which shows the discovered gene sub-groups fromthe user given sample gene list. The content of each clusteris described by the two most over-represented classes. Amore detailed analysis is also possible for each cluster byviewing the sorted list of over-represented classes or byviewing the clustered genes. The program can create mul-tiple cluster trees, produce statistical evaluations for clus-tering divisions and single clusters, and provide flexibilityin changing the parameters for clustering execution andvisualizations. Results can be saved as graph figures andtab-delimited files describing different gene groups orclass contents within them. These functions are furtherdescribed in the program manual. GENERATOR will beupdated twice in a year including the GO database withinit and is freely available [21].
Analysis with GENERATORGene list from yeast under H2O2 stressWe have analyzed the data obtained from growing yeastdeletion strains during oxidative stress [2]. Yeast deletionstrains have deletions in genes not needed in normalgrowth conditions (non-essential genes). The researchaims to find new genes and functionalities that are impor-tant for the cells to survive and grow in the presence ofoxidative stress. We limit the analysis to the gene listobtained from hydrogen peroxide stress (H2O2 stress).This was used as a sample list for GENERATOR and itincluded 117 genes of which 109 were recognized by theGO database. The remaining 4589 non-essential yeastgenes were used as a reference list of which 4115 were rec-ognized by the database. The use of a whole genome as areference here might cause some error in the results as it isnatural to assume that different functional groups havedifferent proportions of non-essential genes. The princi-
pal observation when analyzing the results as one groupin the original article is the clear association with mito-chondrion [2].
Clustering was done with 2 to 6 groups. In the first stepthe obtained clusters were analyzed against the other clus-ters using S.log(p) values to determine which functionalclasses contributed most to the formation of each cluster.The obtained graphical view is shown in figure 1A. Thefigure shows a cluster of ribosome genes that forms theclearest separate group (marked with I) and remainsalthough the number of clusters changes from 2 to 6. Thestrong link between the different clustering results (thicklines showing correlations higher than 0.9) highlightsthis. Similarly, a cluster of genes with RNA associatedfunction (marked with II) is clearly separated and isshown on several levels. Also, a small cluster of 'mito-chondrial inner membrane' genes (marked with III), acluster of genes with unknown function (marked with V),and a cluster associated with 'transcription regulation' and'nucleus' (marked with IV) can be seen. All of these fiveclusters stay similar over many levels of the visualizationdespite the changing number of clusters and different ran-dom starting points. The whole cluster tree step was alsoreplicated four times, each showing similar results. Thesereplications are detailed below.
The previous information obtained by S.log(p) explainsthe clustering, but it does little to help understand theoriginal sample list. This is due to the exclusion of the ref-erence list from the analysis. For example, the previousresults do not provide emphasis on mitochondrial func-tions although it is the most significant theme when ana-lyzing the data as one group (see table 2). Figure 1A alsopresents 'molecular function unknown' class, although itis under-represented in the original sample list. Therefore,the second step of the analysis is to take the reference genelist into account. Here, classes are sorted with C.log(p)values and O.log(p) and S.log(p) are used as cut-offs toremove non-relevant information. The rationale of usingthe cut-offs and the purpose of the different values is dis-cussed more in the Methods (Description of the cluster con-tents). This is also the default view of GENERATOR. Theresulting graph is presented in figure 1B. Now theobtained view is different showing 'mitochondrial ribos-ome' cluster (I, previous ribosome cluster), 'tRNA ligase'cluster (II, previous RNA associated cluster), 'mitochon-drial inner membrane' cluster (III) and 'transcription reg-ulation' cluster (IV, previous transcription and nucleuscluster) and a 'mitochondrial genome maintenance' clus-ter (V, previous cluster of unknown genes). The clustersare the same as the ones shown in the figure 1A but noweach one of the clusters shows the functional classes, over-represented in the original sample list, that are associatedwith the clustered genes. The over-represented classes for
Page 6 of 18(page number not for citation purposes)
BMC Bioinformatics 2005, 6:162 http://www.biomedcentral.com/1471-2105/6/162
clustering with 5 clusters from figure 1 are shown in table1. In order to see how robust the results are, the non-nested hierarchical clustering was replicated four times.The replications are in figure 2 and show that similar clus-ters can be obtained with each.
Analysis of the results in figures 1 and 2 (result summaryshown in tables 1 and 5 [see Additional file 5]) shows thatwithin the group of genes that first seem homogeneous,there are sub-groups differently associated with the mito-chondrial functionality. The strongest feature in theobtained results is the group of mitochondrial ribosomeclusters that stays similar whether clustering from 2 to 6clusters. Analysis of this cluster actually reveals that thereare two genes (YNR036C and YPL183W-A) that arereported as hypothetical mitochondrial ribosome pro-teins. The fact that the mitochondrial ribosome proteins
are strongly over-represented in the dataset support thenotion that they are mitochondrial ribosomal proteins.
One small group, not mentioned in the original analysis[2], is the group of tRNA ligases (cluster II). Although thisgroup only includes 6 members, its O.log(p) was 6.64making the over-representation significant. A moredetailed analysis reveals that the genes in question aremitochondrion associated tRNA ligases and one of themis a hypothetical mitochondrial tRNA ligase. Again itsimportance for the growth of yeast cells in oxidative stressfurther confirms its association with mitochondrial func-tion. The rank of these ligase associated categories starts at23 in the sorted class list for the original sample gene list(see table 2) and therefore this group can go easily unno-ticed if the sample list is analyzed without clustering. Therest of the cluster II (in fig. 1, when using five clusters)includes proteins that link to RNA processing and to
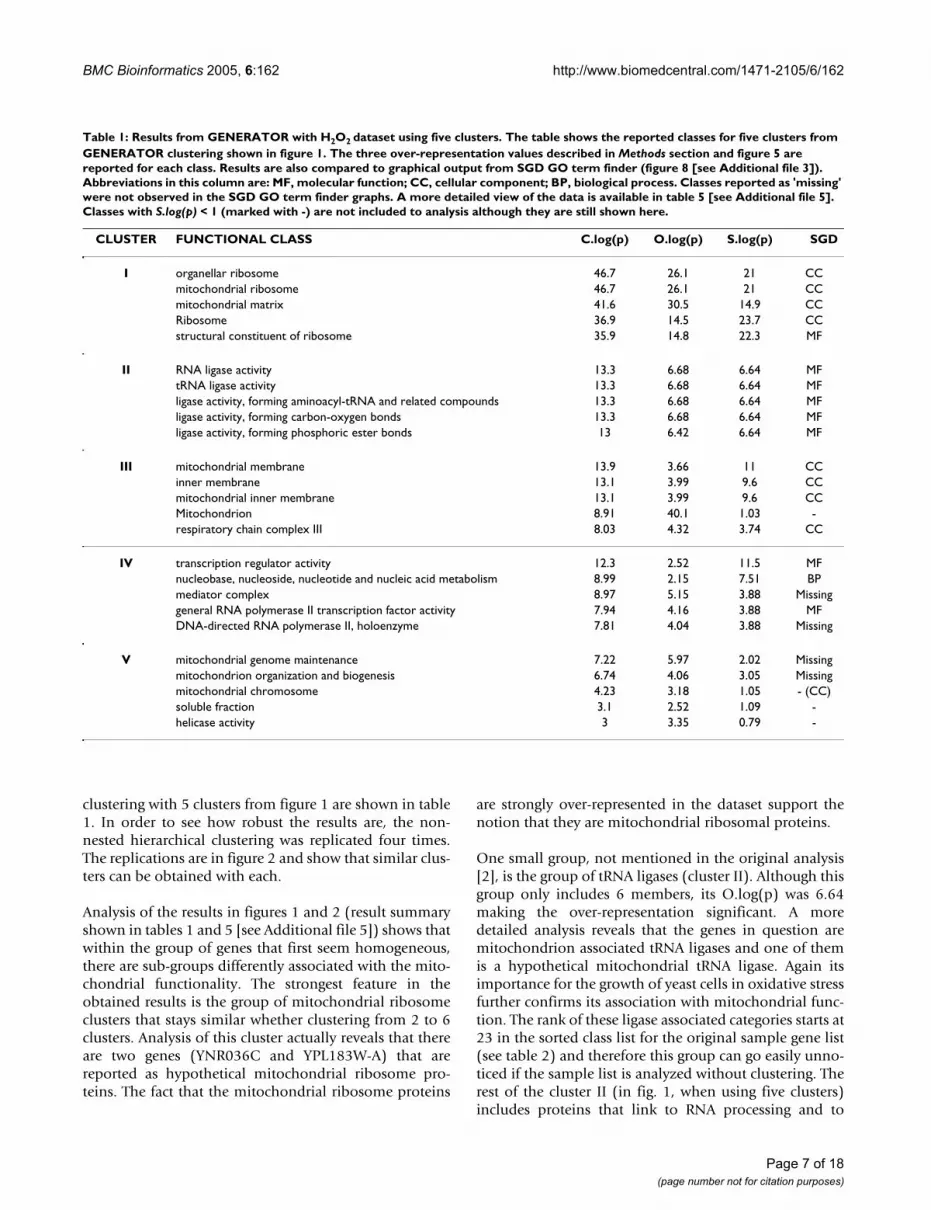
Table 1: Results from GENERATOR with H2O2 dataset using five clusters. The table shows the reported classes for five clusters from GENERATOR clustering shown in figure 1. The three over-representation values described in Methods section and figure 5 are reported for each class. Results are also compared to graphical output from SGD GO term finder (figure 8 [see Additional file 3]). Abbreviations in this column are: MF, molecular function; CC, cellular component; BP, biological process. Classes reported as 'missing' were not observed in the SGD GO term finder graphs. A more detailed view of the data is available in table 5 [see Additional file 5]. Classes with S.log(p) < 1 (marked with -) are not included to analysis although they are still shown here.
CLUSTER FUNCTIONAL CLASS C.log(p) O.log(p) S.log(p) SGD
I organellar ribosome 46.7 26.1 21 CCmitochondrial ribosome 46.7 26.1 21 CCmitochondrial matrix 41.6 30.5 14.9 CCRibosome 36.9 14.5 23.7 CCstructural constituent of ribosome 35.9 14.8 22.3 MF
II RNA ligase activity 13.3 6.68 6.64 MFtRNA ligase activity 13.3 6.68 6.64 MFligase activity, forming aminoacyl-tRNA and related compounds 13.3 6.68 6.64 MFligase activity, forming carbon-oxygen bonds 13.3 6.68 6.64 MFligase activity, forming phosphoric ester bonds 13 6.42 6.64 MF
III mitochondrial membrane 13.9 3.66 11 CCinner membrane 13.1 3.99 9.6 CCmitochondrial inner membrane 13.1 3.99 9.6 CCMitochondrion 8.91 40.1 1.03 -respiratory chain complex III 8.03 4.32 3.74 CC
IV transcription regulator activity 12.3 2.52 11.5 MFnucleobase, nucleoside, nucleotide and nucleic acid metabolism 8.99 2.15 7.51 BPmediator complex 8.97 5.15 3.88 Missinggeneral RNA polymerase II transcription factor activity 7.94 4.16 3.88 MFDNA-directed RNA polymerase II, holoenzyme 7.81 4.04 3.88 Missing
V mitochondrial genome maintenance 7.22 5.97 2.02 Missingmitochondrion organization and biogenesis 6.74 4.06 3.05 Missingmitochondrial chromosome 4.23 3.18 1.05 - (CC)soluble fraction 3.1 2.52 1.09 -helicase activity 3 3.35 0.79 -
Page 7 of 18(page number not for citation purposes)
BMC Bioinformatics 2005, 6:162 http://www.biomedcentral.com/1471-2105/6/162
translation, for example, NAM1, two mitochondrial elon-gation factors, and YDR194C.
Cluster V shows 'mitochondrion organization' and'genome maintenance' (5 and 7 genes, with O.log(p) 4.06and 5.97) but the analysis of the cluster content shows noclear common theme. Instead, most of the genes have noknown function, and therefore this cluster does not seemto contribute to the analysis. Indeed the unknown func-tion was associated to this cluster in figure 1A. A separatecluster of unknown genes is an expected behavior for ourmethod as these genes have highly different GO classifica-tion profiles from the known genes. We have alsoobserved it regularly with other datasets. Still, this clusterwas able to highlight the small group of genes associatedwith mitochondrion genome maintenance.
Cluster IV shows nucleus-associated functionalities ('tran-scription regulator activity', 'regulator complex', 'generalRNA polymerase II transcription factor activity'). When
the actual cluster content is analyzed, the cluster includes:RNA polymerase II holoenzymes, transcription factors,and transcription regulators. This cluster of genes wasunexpected and seems to show a link from nucleus drivenfunctionalities to mitochondrial functionalities. ClustersII and IV show nicely mitochondrion linked functionselsewhere in the cell, but at the same time these groups areharder to detect when analyzing the data as one group(see tables 2 and 7 [see Additional file 7]). In summary,GENERATOR has shown that within the mitochondrionassociated gene list, the main members are mitochon-drion ribosomal proteins, mitochondrion membranegenes, tRNA ligases, unknown genes, and genes associatedwith transcription regulation.
Gene list from drug treated yeastAnother dataset that was analyzed includes the geneexpression differences in yeast during itraconanzole treat-ment, a drug known to affect sterol biosynthesis and nor-mal growth [20]. Both up and down regulated genes were
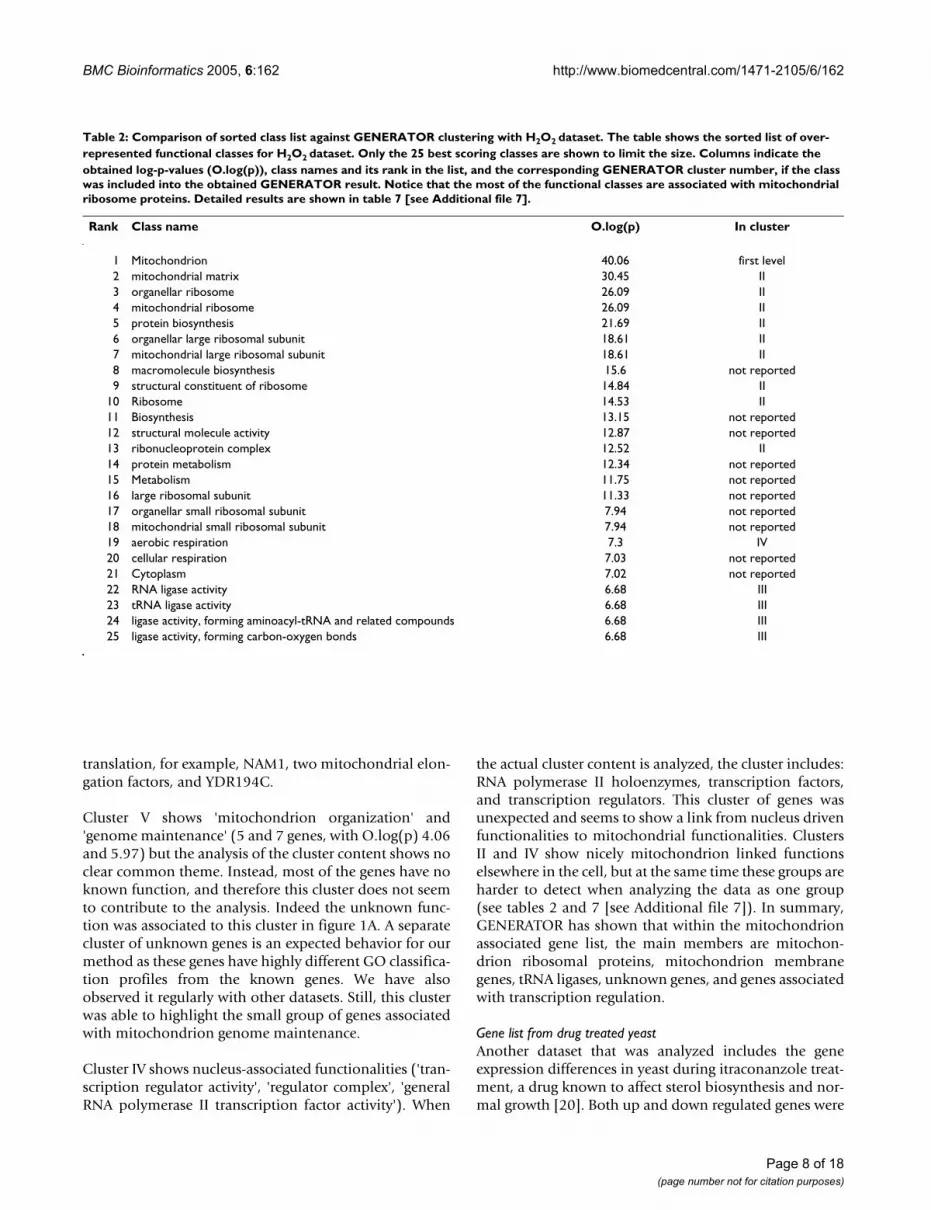
Table 2: Comparison of sorted class list against GENERATOR clustering with H2O2 dataset. The table shows the sorted list of over-represented functional classes for H2O2 dataset. Only the 25 best scoring classes are shown to limit the size. Columns indicate the obtained log-p-values (O.log(p)), class names and its rank in the list, and the corresponding GENERATOR cluster number, if the class was included into the obtained GENERATOR result. Notice that the most of the functional classes are associated with mitochondrial ribosome proteins. Detailed results are shown in table 7 [see Additional file 7].
Rank Class name O.log(p) In cluster
1 Mitochondrion 40.06 first level2 mitochondrial matrix 30.45 II3 organellar ribosome 26.09 II4 mitochondrial ribosome 26.09 II5 protein biosynthesis 21.69 II6 organellar large ribosomal subunit 18.61 II7 mitochondrial large ribosomal subunit 18.61 II8 macromolecule biosynthesis 15.6 not reported9 structural constituent of ribosome 14.84 II
10 Ribosome 14.53 II11 Biosynthesis 13.15 not reported12 structural molecule activity 12.87 not reported13 ribonucleoprotein complex 12.52 II14 protein metabolism 12.34 not reported15 Metabolism 11.75 not reported16 large ribosomal subunit 11.33 not reported17 organellar small ribosomal subunit 7.94 not reported18 mitochondrial small ribosomal subunit 7.94 not reported19 aerobic respiration 7.3 IV20 cellular respiration 7.03 not reported21 Cytoplasm 7.02 not reported22 RNA ligase activity 6.68 III23 tRNA ligase activity 6.68 III24 ligase activity, forming aminoacyl-tRNA and related compounds 6.68 III25 ligase activity, forming carbon-oxygen bonds 6.68 III
Page 8 of 18(page number not for citation purposes)

BMC Bioinformatics 2005, 6:162 http://www.biomedcentral.com/1471-2105/6/162
used for the analysis. These contained 255 genes of which248 were recognized by the GENERATOR GO database.The remaining 6102 non-regulated yeast genes consti-tuted the reference list of which 5369 were recognized byour database. When the obtained gene list is analyzed nor-mally with the sorted class list, the most significant featureobserved is the massive over-representation of the 'ami-noacid biosynthesis' and related functional classes (table4).
Similar to the previous analysis, two steps were used andthe classes that contributed most to the clustering weremonitored first. The results show the 'carboxylic acid bio-synthesis' associated cluster (marked with I) a cluster asso-ciated with 'cellular process' class (III); a 'macromoleculebiosynthesis' associated cluster (II); and a cluster associ-ated with unknown functionality (IV). With a largernumber of clusters, 'nucleobase metabolism' and 'tran-scription' associated cluster (V) can be seen.
When the clustering view is changed to show the over-rep-resentation reported by C.log(p) (figure 3B), the previousclusters obtain different annotations (result summaryshown in tables 3 and 6 [see Additional file 6]). This anal-ysis step was again repeated four times to see how similarthe results remained (figure 6 [see Additional file 1]).Cluster I, that showed in fig. 3A carboxylic acid biosynthe-sis, is now associated with amino acid and carboxylic acidbiosynthesis. It forms the most stable cluster and it is seenregularly on several clustering levels also in the replica-tions. Cluster II (macromolecule biosynthesis) is nowassociated with steroid biosynthesis. Genes in the clusterrepresent sterol biosynthesis associated functions andother macromolecule biosynthesis functions (for examplesynthesis of phospholipids). Steroid synthesis is a knowntarget of the drug and that it is now nicely separated fromother functionalities that are likely more secondaryresponses to the drug. Third, a regularly seen cluster is oneenriching the plasma membrane and cell wall associatedfunctionalities (III). The genes in this cluster show manymembrane associated functions, like transporting
Table 3: Results from GENERATOR with itraconanzole dataset using five clusters. The table presents the reported classes from GENERATOR clustering with six clusters shown in figure 3. Columns and abbreviations are the same as in table 1. A more detailed view is presented in table 6 [see Additional file 6]. We omit the classes with S.log(p) smaller than 1 from the comparison with SGD (-). One outlier cluster is also omitted (shown in more detailed view).
CLUSTER FUNCTIONAL CLASS C.log(p) O.log(p) S.log(p) SGD
I amino acid metabolism 51.48 14.7 38.32 BPcarboxylic acid metabolism 50.64 14.77 36.64 BPorganic acid metabolism 50.64 14.77 36.64 BPamino acid and derivative metabolism 50.36 13.75 38.32 BPamino acid biosynthesis 49.98 19.07 31.6 BP
II steroid metabolism 19.83 8.89 11.36 BPlipid biosynthesis 17.88 5.24 14.07 BPlipid metabolism 17.87 5.05 13.81 BPsterol metabolism 17.3 8.02 9.61 BPsteroid biosynthesis 16.95 7.69 9.61 BP
III plasma membrane 9.08 2.58 7.5 Missingcell wall (sensu Fungi) 4.18 4.37 1.43 CCcell wall 4.18 4.37 1.43 CCexternal encapsulating structure 4.18 4.37 1.43 CCstructural constituent of cell wall 3.97 2.23 1.8 Missing
IV cell wall (sensu Fungi) 2.4 4.37 0.54 -cell wall 2.4 4.37 0.54 -external encapsulating structure 2.4 4.37 0.54 -acid phosphatase activity 1.25 3.1 0.22 -
V specific RNA polymerase II transcription factor activity 10.18 3.24 7.48 MFnucleobase metabolism 3.26 2.85 1.52 Missingpurine base metabolism 2.56 2.58 1.09 Missingaromatic compound metabolism 2.54 5.85 0.72 -heterocycle metabolism 2.22 2.65 1.02 Missing
Page 9 of 18(page number not for citation purposes)
BMC Bioinformatics 2005, 6:162 http://www.biomedcentral.com/1471-2105/6/162
activities. Unexpectedly, another cluster, associated withcell wall (cluster IV) can be regularly observed. A detailedanalysis of these clusters still reveals that they are differ-ent. Cluster III is associated strongly with 'plasma mem-brane' and 'cell wall'. The other cell wall cluster (clusterIV) is more connected to unknown cellular componentthan to cell wall and the connection to cell wall is alsovery weak. Even a slight raise of the cut-off for S.log(p)would filter this link. A more detailed analysis of the clus-ter IV reveals that 55 out of the 65 genes in the cluster havebiological process unknown. Moreover, molecular func-tion is unknown for 58 of these genes. Therefore this clus-ter does not contribute to the analysis of the gene list.Cluster V does not seem as stable as the earlier clusters.Still, it is observed in most of the replications (figure 6 [seeAdditional file 1]). It groups together genes associatedwith nucleobase metabolism and transcription. Detailedanalysis shows transcription factors associated with regu-lation of transcription from the Pol II promoter. Amongthese genes, some of them are reported to be importantfor drug resistance (YLR266C, YCR106W) and to stressresponse (YFL031W, YMR037C) and to two associatedwith copper uptake (YGL166W, YMR021C). In summary,we observed with GENERATOR an amino acid biosynthe-
sis associated group, steroid and lipid biosynthesis associ-ated group, a group of unknown genes, and genesassociated to membrane and transport.
Comparison with competing methodsSorted class listGENERATOR was also compared to existing methods.One of the simplest ways of analyzing a gene list is to takeit as one single group, analyze how over-representeddifferent classes are, and to report the results as a sortedlist. Sorting is based on the p-values calculated for theobserved over-representation in order to show the bestresults at the top of the list. This method does not takeinto consideration the heterogeneity in the list, but other-wise it is similar to analysis done with each of the GENER-ATOR clusters. Actually, the first level of the GENERATORcluster tree graph does this analysis. Therefore we com-pared GENERATOR clustering to the sorted class list usingthe results from the first level. We changed the default set-tings so that the number of reported functional classeswas not limited.
The comparison used the two previously analyzed datasets. The results from sorted class list were compared to
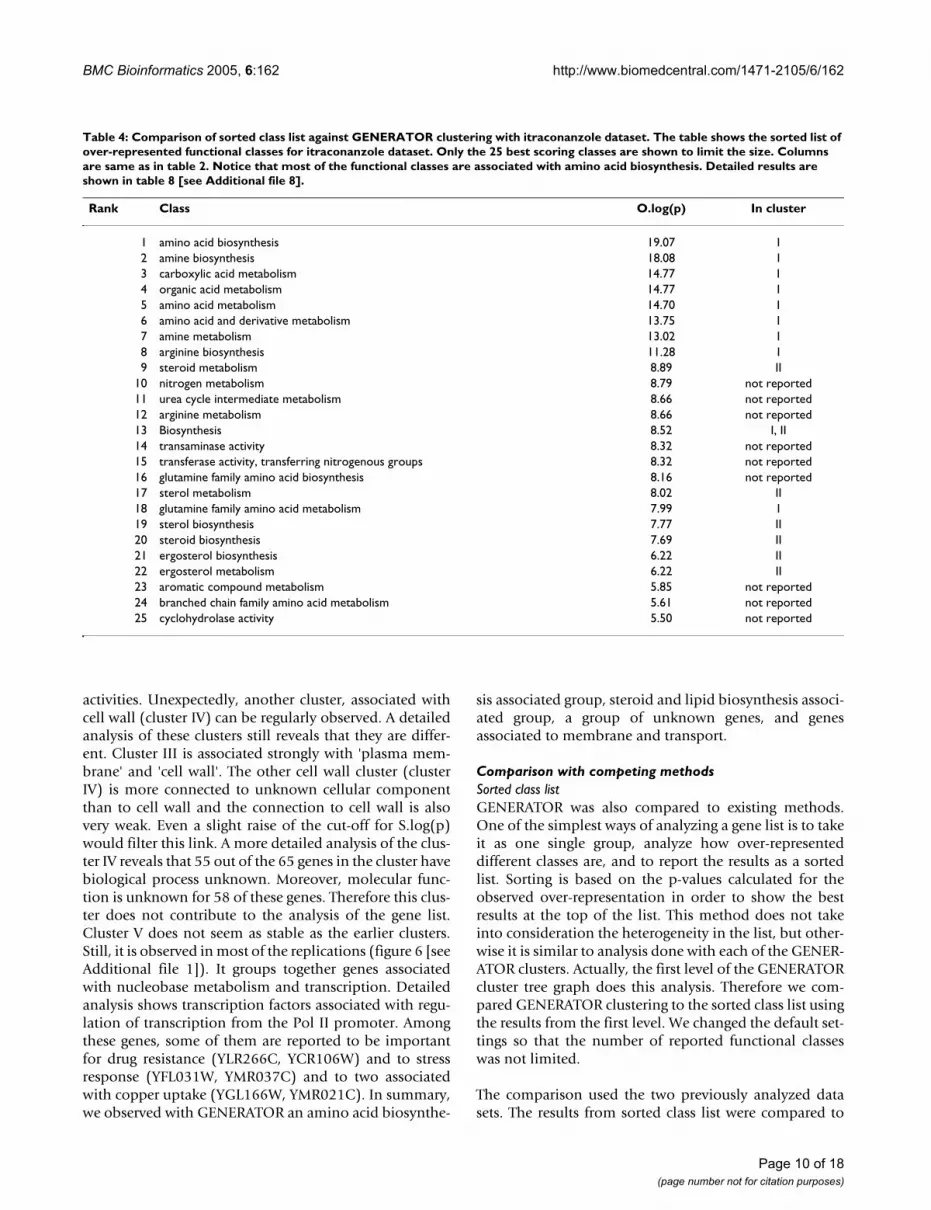
Table 4: Comparison of sorted class list against GENERATOR clustering with itraconanzole dataset. The table shows the sorted list of over-represented functional classes for itraconanzole dataset. Only the 25 best scoring classes are shown to limit the size. Columns are same as in table 2. Notice that most of the functional classes are associated with amino acid biosynthesis. Detailed results are shown in table 8 [see Additional file 8].
Rank Class O.log(p) In cluster
1 amino acid biosynthesis 19.07 I2 amine biosynthesis 18.08 I3 carboxylic acid metabolism 14.77 I4 organic acid metabolism 14.77 I5 amino acid metabolism 14.70 I6 amino acid and derivative metabolism 13.75 I7 amine metabolism 13.02 I8 arginine biosynthesis 11.28 I9 steroid metabolism 8.89 II
10 nitrogen metabolism 8.79 not reported11 urea cycle intermediate metabolism 8.66 not reported12 arginine metabolism 8.66 not reported13 Biosynthesis 8.52 I, II14 transaminase activity 8.32 not reported15 transferase activity, transferring nitrogenous groups 8.32 not reported16 glutamine family amino acid biosynthesis 8.16 not reported17 sterol metabolism 8.02 II18 glutamine family amino acid metabolism 7.99 I19 sterol biosynthesis 7.77 II20 steroid biosynthesis 7.69 II21 ergosterol biosynthesis 6.22 II22 ergosterol metabolism 6.22 II23 aromatic compound metabolism 5.85 not reported24 branched chain family amino acid metabolism 5.61 not reported25 cyclohydrolase activity 5.50 not reported
Page 10 of 18(page number not for citation purposes)
BMC Bioinformatics 2005, 6:162 http://www.biomedcentral.com/1471-2105/6/162
GENERATOR clustering summaries shown in tables 1 and3. When the number of classes was limited only by the p-value, an immediately observed drawback of the sortedlist method was the amount of information (number ofclasses) obtained. For the H2O2 dataset, we obtained 75classes and for itraconanzole 76 with -log(p-value) > 2 (55and 43 with -log(p-value) > 3). The resulting sorted listsare shown in tables 7 [see Additional file 7] and 8 [seeAdditional file 8]. This can be corrected by raising the cut-off for the included genes. This is also reasonable as wehave not used here any correction for increased risk offalse positives due to multiple testing. Strong filteringwith p-values or limiting the number of reported classesleaves the most over-represented functional classes. In theexample datasets, the most over-represented functionalclasses were all associated with the same gene group. WithH2O2, the first 18 functional classes were associated withmitochondrial ribosome proteins (see table 2). With itra-conanzole, the first 19 classes (except classes 9 and 17)show functions associated with amino acid biosynthesis(see table 4).
When the GENERATOR results were compared to a sortedclass list, many classes were omitted from the results. Withdefault settings, GENERATOR shows at maximum tenclasses for each cluster in the output text file. This filtersout the repetitive occurrences of functional classes associ-ated with the same gene group. In the H2O2 dataset,classes like macromolecule biosynthesis, protein metabo-lism, and large ribosomal subunit were excluded in thisway. This seems acceptable as many similar classes areshown in the results by cluster I. The omitted classes canbe still viewed with the sorted list available for each clus-ter. Another group of classes that are not reported by GEN-ERATOR with H2O2 were very broad classes, such asintracellular, cell, or physiological process. These contrib-ute very little information to the analysis. Similar observa-tions were also seen with the itraconanzole dataset, wheremany amino acid biosynthesis associated classes wereexcluded from GENERATOR clustering results. As anexception, itraconanzole showed some broad classes inthe results (plasma membrane, cell wall).
Direct acyclic graphAnother way to analyze the obtained gene list is to mapthe over-represented functional classes into a tree likestructure that is behind the GO classes and visualize theresults as a graph structure. The benefit to the sorted listpresentation is that the hierarchical structures are now vis-ible, highlighting the over-represented functional classesoccurring repetitively in the same part of the GO graph.Also, if there are different branches showing over-repre-sented functional classes in the GO structure, they areclearly separated. The major drawback is the large size ofthe obtained visualization. The graph obtained from
AMIGO server [23] using the whole list of over-repre-sented classes from H2O2 dataset was simply too large foranalysis (figure 7 [see Additional file 2]). Instead weselected a graphical output from GO term finder at Sac-charomyces Genome Database [8] for comparison. TheGO term finder adds color coding to show which of theclasses showed strongest over-representation. It also triesto make the obtained graph smaller by discarding somebranches. As the graph for each ontology is obtained sep-arately, we combined the obtained three graphs to thesame picture for a better view. We used GENERATOR clus-tering summaries shown in tables 1 and 3 for comparison.
In order to compare the obtained GO graphs with theGENERATOR results, we flagged each class that wasreported significant if it was included in the GENERATORresult table (figures 8 [see Additional file 3] and 9 [seeAdditional file 4]). We first observed, in the comparison,that the graphs obtained from SGD GO term finder arestill large for analysis. Also, the important features arescattered over three graphs, in comparison to the singletable from GENERATOR. It was observed that someclasses in the H2O2 data were not shown in the SGD GOgraph even though their log-p-value results were highlysignificant (tables 1 and 3, classes marked as 'missing').Some of these classes were: aerobic respiration (O.log(p)7.3), cellular respiration (7.03), and mitochondrialgenome maintenance (5.97). This might be an artifactcaused by the limited size of the GO graph. SGD graph, onthe other hand, showed classes that were not reported byGENERATOR. These classes were the same classes dis-cussed when comparing GENERATOR with the sortedlists. Some of the differences between the results might beexplained by the usage of binomial test for calculating sig-nificance of the functional classes in GO term finder. Itshould be noted that the Fisher's exact test used by GEN-ERATOR is a more correct method [8], although weobserved similar p-values with both methods. Also thewhole genome is always used as a population by GO termfinder, which might also cause bias in the results withsome datasets (see analysis of H2O2 dataset above).
Comparison to GOToolBoxDuring the preparation of this manuscript, we alsoobserved another method that performs similar GO clus-tering. GO-Proxy in GOToolBox [19], takes the user givensample gene list, creates the GO classifications for eachgene and clusters the obtained matrix by usingczekanowski-dice distance and hierarchical clustering.The reported clusters (called classes) are selected from thedifferent levels of tree with two parameters, defined by theuser. One parameter defines how similar genes have to beinside the cluster and the other defines the minimum sizefor the cluster. The principal difference between the meth-ods is that GENERATOR (with default parameters) reports
Page 11 of 18(page number not for citation purposes)
BMC Bioinformatics 2005, 6:162 http://www.biomedcentral.com/1471-2105/6/162
only the GO-classes that display over-representation inboth the original sample gene list and in the obtainedcluster, whereas GOToolBox concentrates its analysis tothe obtained cluster. Also, GENERATOR gives an overviewof the clustered data with visualization.
In the analysis for H2O2 and itraconanzole datasets,GOToolBox, with default parameters, created more andsmaller clusters when compared to GENERATOR (tables 9[see Additional file 9] and 10 [see Additional file 10] forresults with each ontology). The cluster number is proba-bly larger because the same clusters with minor changesare selected from different levels of the hierarchicalclustering tree which causes repetition in the results. Thesmall clusters in GOToolBox results tend to give a scat-tered view of the data but could be also useful when ana-lyzing details from the obtained gene list. However, bysetting a larger minimum cluster size they can be filtered.With larger clusters GOToolBox reported nonspecificfunctional classes like cellular process, cell, or metabolismin addition to the same GO-classes that were previouslyreported by GENERATOR (mitochondrial ribosomeclasses, tRNA classes etc.). With the default settings,GOToolBox found also some small clusters that were notreported by GENERATOR (clusters associated with 'abi-otic stress', 'RNA metabolism' etc.). These clusters werequite small and the most associated functional classes didnot show any over-representation in the original samplelist (see table 7 [see Additional file 7]) as GOToolBox doesnot filter the results with O.log(p). GENERATOR could bealso run with a larger maximum cluster number in orderto obtain similar smaller clusters.
DiscussionWe have presented a method that groups a user providedgene list into functionally dissimilar gene clusters. Thegrouping is done with varying numbers of clusters, whichare used to create a tree-like graphic visualization. Despitethe emphasis on clustering, our method also analyzes thegene list as a single entity (result with one cluster). Theobtained graph presents the main output of the methodshowing the most important simultaneous gene groupsthat occur in the data in a single figure. The graph can becreated multiple times to see how stable it remains whendifferent random initializations are used for clustering.Our results from clustering replications show that themost visible gene groups remain, thus increasing confi-dence in the method.
There are two alternative methods previously used toobtain an overview of the over-represented functional cat-egories. Methods like EASE analyze the gene list as oneentity and output the functional categories as a sorted listaccording to the significance of the over-representation.Other methods, like SGD GO term finder, give the over-
represented functional categories as a directed tree-likegraph by using the hierarchical structure of GO. Graphmethods create a much more complex representationwith the danger of overwhelming the user with unimpor-tant details. The sorted list gives an impression of ahomogenous gene group. As an example, we showed theresults from SGD GO term finder, AMIGO visualization,and the sorted list of functional classes for the gene list asone entity. These methods do not group the gene listbefore analyzing it. A positive unexpected observationwas that results from the other methods seemed moreinformative after we marked them with the correspondingGENERATOR clusters. For example classes in a sorted listcan be marked according to which cluster they belong to(see tables 2 and 4). Marking the corresponding clustersenables the opportunity to combine GENERATOR cluster-ing results and results from other methods.
We also compared the GENERATOR results to anothergene clustering tool, GOToolBox. The principal differencein methods is that GENERATOR provides the clusterdescription by using filtering procedure which discardsthe GO-classes with no over-representation in the originalsample gene list and with weak association to the genes ofthe cluster. GENERATOR includes also visualization forviewing the optional clustering results. Despite the differ-ences we were able to obtain also similar GO-classes withboth methods when analyzing the H2O2 and itraconan-zole datasets.
Since partitive clustering has an inherent weakness in theinitialization, we present a novel solution. Instead ofselecting a single clustering number, we monitor theresults with a range of clustering numbers. As a result, weobtain correlations between the clusters that highlightthose features that can be obtained even though the clus-ter number would change. The replication of the wholecluster tree visualization was done in order to furtherhighlight those features that are conserved. It should benoted that these ideas could also be used with other clus-tering applications. Similar work was done by Heger andHolm [24] by replicating NMF many times and lookingfor the conserved features in the obtained matrix factori-zations and by Brunet et al [25] where optimal clusternumber was selected by replicating NMF clustering manytimes.
We analyzed the obtained clusters by concentrating onthose functional categories that were over-represented inthe cluster when compared to the rest of the gene list andalso in the original list of genes when compared to a refer-ence list of genes. If the over-representation in the clusteronly would be monitored, the obtained cluster would bewell explained, but the drawback would be that theobtained categories could at worst be such that they were
Page 12 of 18(page number not for citation purposes)

BMC Bioinformatics 2005, 6:162 http://www.biomedcentral.com/1471-2105/6/162
under-represented in the original gene list and thereforeproduce erroneous conclusions. If the over-representationin the original list would be only monitored, the cluster-ing would not be informative to the analysis. The currentway of combining these two over-representations high-lights those features that are common between the origi-nal list and the obtained cluster. As the data is grouped toseparate clusters, each of them will represent differentfeatures from the list of over-represented functionalclasses for the original gene list. The reporting methodtherefore separates those functional categories from theoriginal gene list that are not associated to the same genesand groups together those functional categories from theoriginal gene list that are connected to the same genes. Agood example of genes that were associated to the samefunction were the members of the same protein complexthat were often seen as a separate cluster.
The selection of the reported functional categoriesrequires the definition of the cut-off for the significantover-representation. Here the threshold was purposelyselected to be liberal (p-value < 0.01, O.log(p) > 2.0). Thisis known to be too weak a threshold when the analysisincludes multiple testing as it increases the possibility ofthe false positives. Therefore the emphasis was placed inthe later analysis on those functional categories thatshowed clearly stronger over-representation than what thecut-off was and the p-values larger than 0.001 were mon-itored with caution. Similarly we also discarded classeswith S.log(p) < 1 from our analysis. The P-value borderscould be selected more precisely by doing repetitive test-ing with a similar sized sample list with randomly selectedmembers (permutation analysis). The evaluation of theresults using runs with randomized samples from the ana-lyzed data is one of the planned additions to the GENER-ATOR software.
The associated software uses a reference list to calculateover-representation for the original cluster. Although thewhole genome for the organism could be used, the refer-ence list will ensure that the biases towards somefunctional groups in the test situation do not affect theanalysis.
The method demonstrates that a drugs primary target canbe identified within a separate group among different reg-ulated genes and different cellular functions. Work shownhere was done with yeast allowing the use of detailedannotation of the yeast genome. Still, we have alsoobtained encouraging results from human cell line and C.elegans gene expression datasets (manuscript in prepara-tion). As more information is being gathered from thegene functions, this method should be able to performeven better. Nonetheless, accuracy in the used gene anno-tations is the weak link for our method. This should not
necessarily be a hindrance, as the randomly classifiedgenes should distribute randomly also among the obser-vations. Another limitation is the recognition of the ana-lyzed genes. Gene identifiers can be problematic whenworking with different naming systems that originatefrom various databases or high throughput methods, likegene chips. These are also the problems faced by othermethods.
The presented software includes the possibility of using italso with binary matrices. The reference group can begiven as a binary matrix or as a vector that represents anumber of members of each category and also the size ofthe reference group. This should enable the analysis ofother similar binary data sets, like SNP datasets, wordoccurrences in abstract texts etc. These are being currentlytested as future applications.
ConclusionWe have presented an analysis method and associatedsoftware, GENERATOR, for analysis of large gene lists.Our aim has been to fulfill the need for an analysis tool toseparate and identify functional gene groups from genelists that would otherwise be difficult to find. The methodshould be useful especially as larger and more complexgene lists are produced due to the increased use of highthroughput genomic methods.
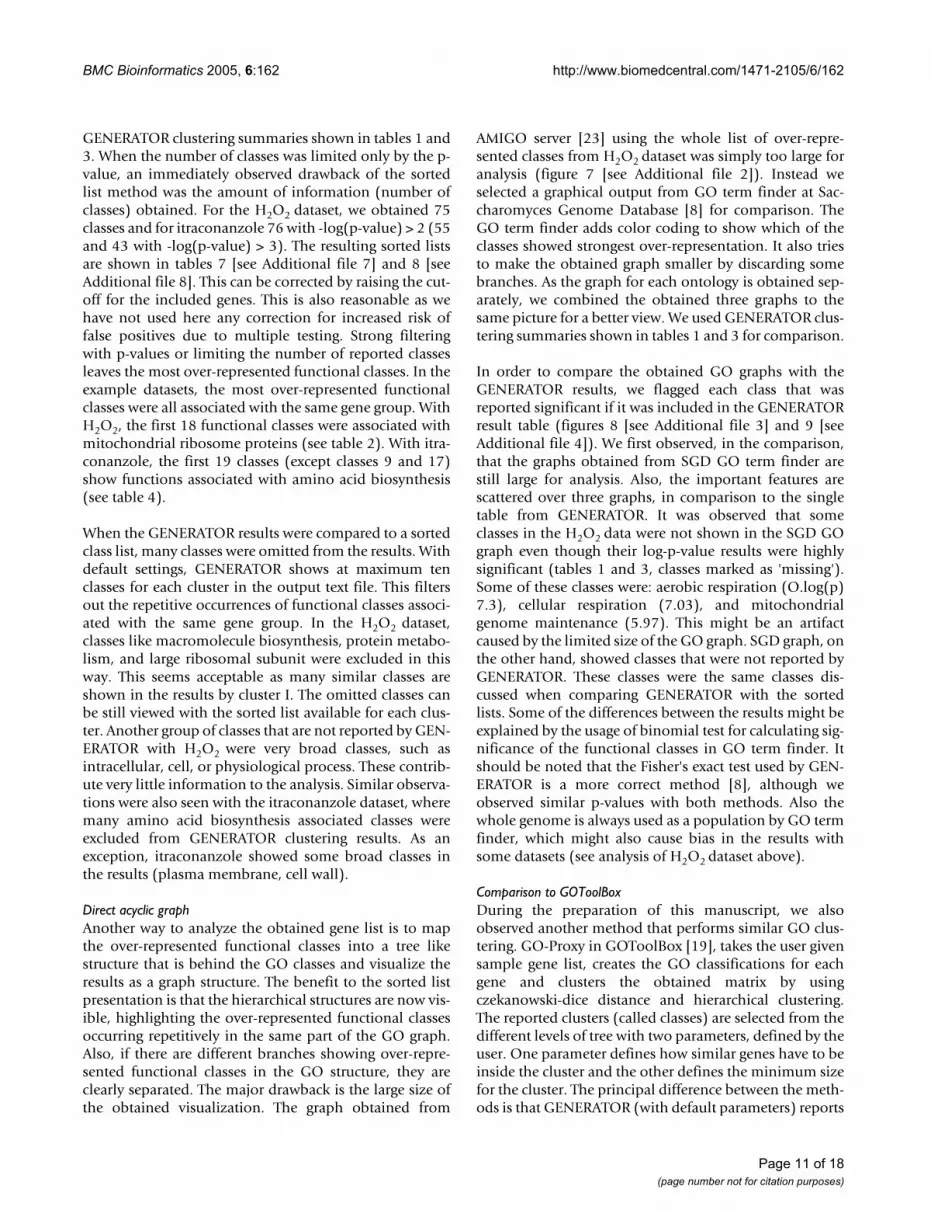
MethodsData representationThe associations between genes and functional classes inthe sample and reference gene lists must be represented asa binary matrix to enable the analysis (see figure 4, stepsA and a). As functional classes, we use annotations fromthe April 2004 delivery of Gene Ontology (GO) database[14]. GO includes three principal sub-hierarchies, repre-senting biological processes, cellular components and molecu-lar functions for a gene. We combine the information fromall these three hierarchies in the clustering process.
The gene and functional class associations are trans-formed into binary matrix where rows represent genes andcolumns represent classes. Association between gene andclass is denoted by one and lack of association with zeroin a matrix cell. In addition to directly associated classes,a gene is also denoted to associate with its ancestors in thehierarchical GO structure to assure maximal informationfor analysis. The obtained matrix for sample gene list isinputted for the clustering process whereas the matrix forthe reference list is summed into an occurrence vector (fig-ure 4, step b) which is used later for analyzing the over-represented classes within the obtained clusters.
Page 13 of 18(page number not for citation purposes)
BMC Bioinformatics 2005, 6:162 http://www.biomedcentral.com/1471-2105/6/162
Clustering technique for binary dataA binary matrix is used as data when clustering the usergiven sample gene list into a fixed number of groups (seefigure 4, step B). Many traditional clustering methodsobtain weak results with such data due to its non-contin-uous nature (see for example [26,27]) and the small pro-portion of non-zero entries (sparse matrix). Therefore wehave selected a clustering procedure based on Non-nega-tive Matrix Factorization (NMF, [15]) that has showngood performance with binary data in the 'topic finding'literature ([15,28]).
NMF aims to reduce the dimensions of multivariate databy factorization X ≈ WH where X represents the binarymatrix obtained from the associations of n genes and mclasses in the user given sample gene list. Given the fixednumber for r, two matrices W (size n × r) and H (size r ×m) are produced as a result, representing the input data Xin compressed form of r factors. The first of the matricesdescribes the loadings of the genes on r factors and is fur-ther used in clustering. In the clustering process, the genesare deposited into clusters by using a winner-takes-allapproach that finds the factor with the highest loading foreach gene from matrix W. The relation between the high-est loading and sum of all loadings is used to measure thefitness of a gene in a cluster. In the visualization (see next
chapter) the fitness is used to present genes in a sortedorder for each cluster. More detailed descriptions concern-ing clustering binary data with NMF are given in [15,28].We use the NMF algorithm presented in [29] which mini-mizes the least squares error (LSE) between the input dataand resulting factorization.
Non-nested hierarchical clustering schemeThe core of the proposed method is a non-nested hierar-chical clustering tree, which is shown in figure 4, step C.There the user given sample gene list is repeatedly clus-tered into r number of groups, where r grows graduallyfrom two into a user given number. Each partitive cluster-ing is executed from a random starting initialization usingNMF, producing an independent division level to the vis-ualization. The levels are placed consecutively in thegrowing order of r starting from r = 1, which represents thesample gene list without any clustering. In the visualiza-tion, each level is shown with a bar of constant size that issplit into r sections. Each section represents a singlecluster, the size of which is indicated by the width of thesection. Correlations between each cluster in level r andall clusters of previous level r-1 are calculated by compar-ing cluster memberships of genes with a correlation meas-ure between two binary classifications presented in [10].The strongest correlation for each cluster is denoted by a
Flow diagram of the methodFigure 4Flow diagram of the method. The gene associations with the GO functional classes in the sample and reference gene lists are transformed into binary matrices (A and a) and a sum vector (b). The sample set is clustered with NMF based method (B) into a varying number of sub-groups producing a non-nested hierarchical tree (C). Contents of the clusters are described with the over-represented classes within them (c and D).
G1
G2
G3
C1
C2
C3
C4
……………
…000G4
…000G3
…010G2
…101G1
…C3C2C1
G5
G6
G7
C1
C2
C3
C4
C5……………
…000G8
…000G7
…100G6
…101G5
…C3C2C1
BA C
D
a b …193213321
…C3C2C1Sum
c
G4C5
G8
Sample gene list:
Reference gene list:
Page 14 of 18(page number not for citation purposes)
BMC Bioinformatics 2005, 6:162 http://www.biomedcentral.com/1471-2105/6/162
line between the corresponding clusters. The width of theline indicates the magnitude of the correlation. The linesbetween the first and second levels present only the pro-portions of the genes, as the binary correlation with thefirst level can not be defined. Together the edges and sec-tions form a non-nested hierarchical tree that visualizesthe underlying heterogeneity in the gene and class associ-ation data.
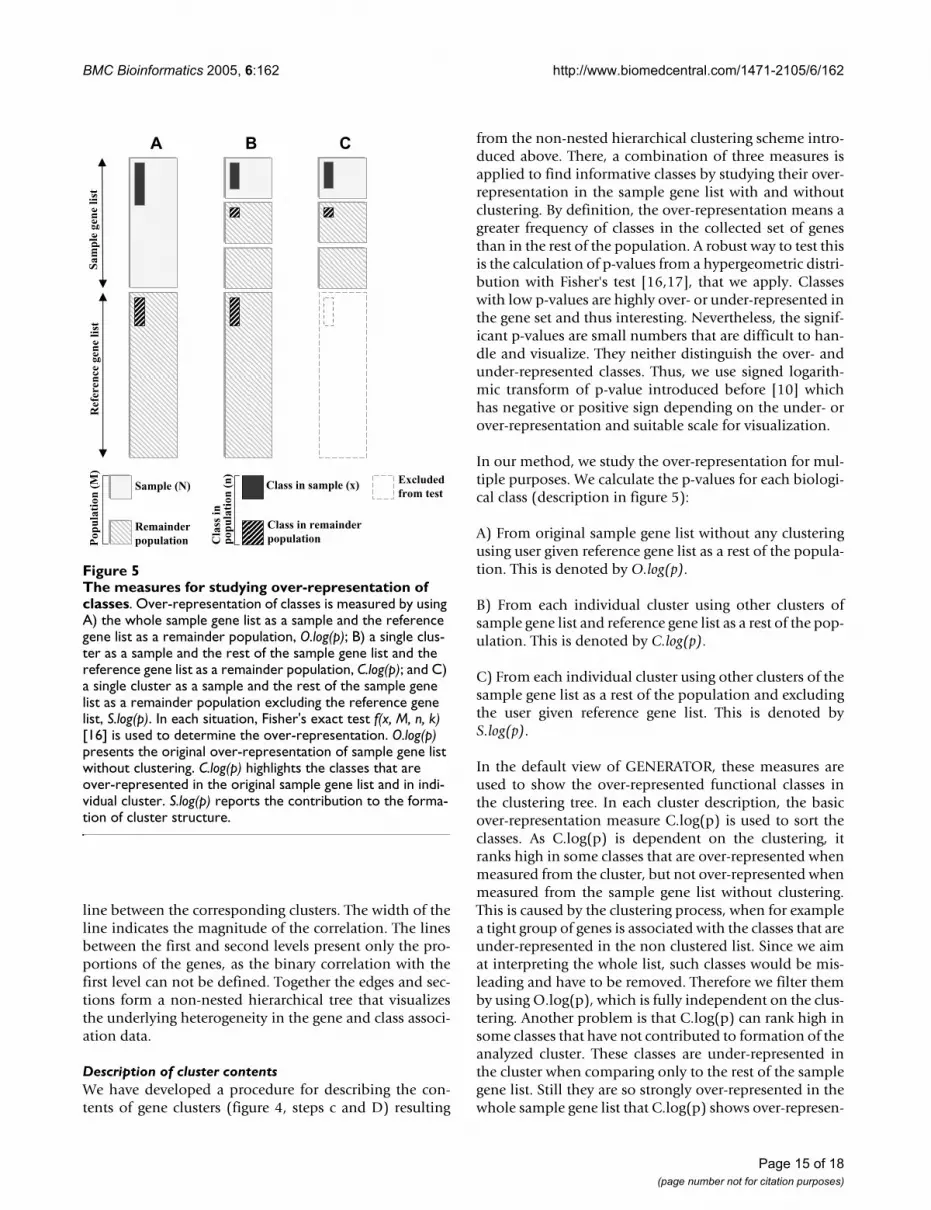
Description of cluster contentsWe have developed a procedure for describing the con-tents of gene clusters (figure 4, steps c and D) resulting
from the non-nested hierarchical clustering scheme intro-duced above. There, a combination of three measures isapplied to find informative classes by studying their over-representation in the sample gene list with and withoutclustering. By definition, the over-representation means agreater frequency of classes in the collected set of genesthan in the rest of the population. A robust way to test thisis the calculation of p-values from a hypergeometric distri-bution with Fisher's test [16,17], that we apply. Classeswith low p-values are highly over- or under-represented inthe gene set and thus interesting. Nevertheless, the signif-icant p-values are small numbers that are difficult to han-dle and visualize. They neither distinguish the over- andunder-represented classes. Thus, we use signed logarith-mic transform of p-value introduced before [10] whichhas negative or positive sign depending on the under- orover-representation and suitable scale for visualization.
In our method, we study the over-representation for mul-tiple purposes. We calculate the p-values for each biologi-cal class (description in figure 5):
A) From original sample gene list without any clusteringusing user given reference gene list as a rest of the popula-tion. This is denoted by O.log(p).
B) From each individual cluster using other clusters ofsample gene list and reference gene list as a rest of the pop-ulation. This is denoted by C.log(p).
C) From each individual cluster using other clusters of thesample gene list as a rest of the population and excludingthe user given reference gene list. This is denoted byS.log(p).
In the default view of GENERATOR, these measures areused to show the over-represented functional classes inthe clustering tree. In each cluster description, the basicover-representation measure C.log(p) is used to sort theclasses. As C.log(p) is dependent on the clustering, itranks high in some classes that are over-represented whenmeasured from the cluster, but not over-represented whenmeasured from the sample gene list without clustering.This is caused by the clustering process, when for examplea tight group of genes is associated with the classes that areunder-represented in the non clustered list. Since we aimat interpreting the whole list, such classes would be mis-leading and have to be removed. Therefore we filter themby using O.log(p), which is fully independent on the clus-tering. Another problem is that C.log(p) can rank high insome classes that have not contributed to formation of theanalyzed cluster. These classes are under-represented inthe cluster when comparing only to the rest of the samplegene list. Still they are so strongly over-represented in thewhole sample gene list that C.log(p) shows over-represen-
The measures for studying over-representation of classesFigure 5The measures for studying over-representation of classes. Over-representation of classes is measured by using A) the whole sample gene list as a sample and the reference gene list as a remainder population, O.log(p); B) a single clus-ter as a sample and the rest of the sample gene list and the reference gene list as a remainder population, C.log(p); and C) a single cluster as a sample and the rest of the sample gene list as a remainder population excluding the reference gene list, S.log(p). In each situation, Fisher's exact test f(x, M, n, k) [16] is used to determine the over-representation. O.log(p) presents the original over-representation of sample gene list without clustering. C.log(p) highlights the classes that are over-represented in the original sample gene list and in indi-vidual cluster. S.log(p) reports the contribution to the forma-tion of cluster structure.
A B C
Sam
ple
gene
list
Ref
eren
cege
nelis
t
Sample (N)
Remainderpopulation
Excludedfrom test
Class in sample (x)
Class in remainderpopulationC
lass
inpo
pula
tion
(n)
Pop
ulat
ion
(M)
Page 15 of 18(page number not for citation purposes)

BMC Bioinformatics 2005, 6:162 http://www.biomedcentral.com/1471-2105/6/162
tation. As these classes are uninformative for the analysisof the cluster, we filter them by using S.log(p). By default,the classes with O.log(p) < 2.0 or S.log(p) < 0.0 are fil-tered, although we encourage also the use of stricter cut-offs like 3 and 1, which we have found to work betterespecially with S.log(p). In the non-nested tree visualiza-tion, the two best classes from this filtered list are shownto describe cluster contents, and the longer list is availablethrough the user interface (see Software Implementation inResults). The cluster is coloured according to the C.log(p)value of its most over-represented class with the strongestred for largest over-representation.
Analysis protocolWe study two clustering views for each data set in ouranalysis. In addition to previously discussed default view,which shows the over-represented classes in the clusteringtree, we first study the cluster formation. For that, we sortthe classes by S.log(p) within the clusters, which excludesthe reference gene list and fully concentrates on clustereddata. The outcomes from this setting are shown in fig. 1Aand fig. 3A in Results. Similarly, the outcomes from thedefault view are shown in fig. 1(B) and fig. 3B. In ourmanual analysis (results shown in tables), we further fil-tered the results from default view by emphasizing theclasses with O.log(p) > 3.0 and S.log(p) > 1.0. In additionto two different clustering views, we also study the stabil-ity of our clustering scheme with both datasets in figures2 and 6 [see Additional file 1]. This helps us to detect ran-dom and non-random outcomes in similar way as withsingle clustering levels explained above.
List of abbreviationsGENERATOR GENElist Research Aimed Theme-discoveryexecutOR
NMF Non-negative Matrix Factorization
GO Gene Ontology
SGD Saccharomyces Genome Database
MIPS Munich Information center for Protein Sequences
DAG Direct Acyclic Graph
LSE Least Squares Error
log(p) Signed 10 based Logarithmic Transform of p-value
O.log(p) Original log(p)
C.log(p) Complete log(p)
S.log(p) Sample log(p)
Authors' contributionsThe original idea of the approach was introduced by PT.Design of the method and the associated software wascontributed equally by both PT and PP. PP implementedand tested the software and executed the analysis for bio-logical datasets. GW reviewed the results and providedadvice and guidance on improving the analysis and per-forming comparison to other methods. The obtainedresults were interpreted by PT.
Additional material
Additional File 1Four replications of non-nested hierarchical cluster tree with itraco-nanzole dataset. Figure 6 The figure shows four replications for the non-nested hierarchical clustering graph for itraconanzole dataset. We have marked the conserved gene clusters with the same Roman numerals as in figure 1. Notice again the conserved clusters observed over several levels in each cluster tree.Click here for file[http://www.biomedcentral.com/content/supplementary/1471-2105-6-162-S1.pdf]
Additional File 2H2O2 dataset analysed with Amigo DAG View. Figure 7 The figure presents the DAG view of all the reported classes shown in table 7 [see Additional file 7]. These classes had p-value < 0.01 (O.log(p) > 2.0). Fig-ure was obtained from AMIGO server. The obtained figure was considered too complex for manual analysis.Click here for file[http://www.biomedcentral.com/content/supplementary/1471-2105-6-162-S2.png]
Additional File 3H2O2 dataset analysed with SGD DAG View. Figure 8 The figure presents the three DAG tree figures obtained from SGD GO term finder with the H2O2 data. The reported classes are colour coded according the reported p-value. We have marked the classes that were reported by some cluster in GENERATOR results by adding the number of corresponding cluster. Note that many classes that were not reported by GENERATOR are usually close in the hierarchy to already reported classes.Click here for file[http://www.biomedcentral.com/content/supplementary/1471-2105-6-162-S3.pdf]
Additional File 4Itraconanzole data analysed with SGD DAG View. Figure 9 Figure presents the three DAG tree figures obtained from SGD GO term finder using itraconanzole data. The reported classes are colour coded according the reported p-value. We have marked the classes that were reported by some cluster in GENERATOR results by adding the number of correspond-ing cluster. Note that many classes that were not reported by GENERA-TOR are usually close in the hierarchy to already reported classes.Click here for file[http://www.biomedcentral.com/content/supplementary/1471-2105-6-162-S4.pdf]
Page 16 of 18(page number not for citation purposes)
BMC Bioinformatics 2005, 6:162 http://www.biomedcentral.com/1471-2105/6/162
AcknowledgementsWe would like to thank Dr. Aleksei Krasnov for comments. Jouni K. Sep-pänen and Ella Bingham provided the NMF Matlab code for preliminary testing of the method. PT and PP would like to thank the Finnish Cultural Foundation for financial support.
References1. Gasch AP, Spellman PT, Kao CM, Carmel-Harel O, Eisen MB, Storz
G, Botstein D, Brown PO: Genomic expression programs in theresponse of yeast cells to environmental changes. Mol Biol Cell2000, 11(12):4241-4257.
2. Thorpe GW, Fong CS, Alic N, Higgins VJ, Dawes IW: Cells have dis-tinct mechanisms to maintain protection against differentreactive oxygen species: oxidative-stress-response genes.Proc Natl Acad Sci U S A 2004, 101(17):6564-6569.
3. Eisen MB, Spellman PT, Brown PO, Botstein D: Cluster analysisand display of genome-wide expression patterns. Proc NatlAcad Sci U S A 1998, 95(25):14863-14868.
4. Weng S, Dong Q, Balakrishnan R, Christie K, Costanzo M, DolinskiK, Dwight SS, Engel S, Fisk DG, Hong E, Issel-Tarver L, Sethuraman A,Theesfeld C, Andrada R, Binkley G, Lane C, Schroeder M, Botstein D,Michael Cherry J: Saccharomyces Genome Database (SGD)provides biochemical and structural information for buddingyeast proteins. Nucleic Acids Res 2003, 31(1):216-218.
5. Mewes HW, Frishman D, Guldener U, Mannhaupt G, Mayer K,Mokrejs M, Morgenstern B, Munsterkotter M, Rudd S, Weil B: MIPS:a database for genomes and protein sequences. Nucleic AcidsRes 2000, 28(1):37-40.
6. Apweiler R, Bairoch A, Wu CH, Barker WC, Boeckmann B, Ferro S,Gasteiger E, Huang H, Lopez R, Magrane M, Martin MJ, Natale DA,O'Donovan C, Redaschi N, Yeh LS: UniProt: the Universal Pro-tein knowledgebase. Nucleic Acids Res 2004, 32(Data-base):D115-119.
7. Boeckmann B, Bairoch A, Apweiler R, Blatter MC, Estreicher A,Gasteiger E, Martin MJ, Michoud K, O'Donovan C, Phan I, Pilbout S,Schneider M: The SWISS-PROT protein knowledgebase andits supplement TrEMBL in 2003. Nucleic Acids Res 2003,31(1):365-370.
8. Boyle EI, Weng S, Gollub J, Jin H, Botstein D, Cherry JM, Sherlock G:GO::TermFinder – open source software for accessing GeneOntology information and finding significantly enrichedGene Ontology terms associated with a list of genes. Bioinfor-matics 2004, 20(18):3710-5.
9. Hosack DA, Dennis G Jr, Sherman BT, Lane HC, Lempicki RA: Iden-tifying biological themes within lists of genes with EASE.Genome Biol 2003, 4(10):R70.
10. Toronen P: Selection of informative clusters from hierarchicalcluster tree with gene classes. BMC Bioinformatics 2004, 5(1):32.
11. Wu LF, Hughes TR, Davierwala AP, Robinson MD, Stoughton R, Alt-schuler SJ: Large-scale prediction of Saccharomyces cerevi-siae gene function using overlapping transcriptional clusters.Nat Genet 2002, 31(3):255-265.
12. Knuuttila J, Törönen P, Castren E: Effects of antidepressant drugimipramine on gene expression in rat prefrontal cortex. Neu-rochem Res 2004, 29(6):1235-1244.
13. Lähteinen S, Pitkänen A, Knuuttila J, Törönen P, Castren E: Brain-derived neurotrophic factor signaling modifies hippocampalgene expression during epileptogenesis in transgenic mice.Eur J Neurosci 2004, 19(12):3245-54.
14. Ashburner M, Ball CA, Blake JA, Botstein D, Butler H, Cherry JM,Davis AP, Dolinski K, Dwight SS, Eppig JT, Harris MA, Hill DP, Issel-
Additional File 5GENERATOR detailed class output for H2O2 dataset. Table 5 The table presents a detailed view for the results obtained from GENERATOR with H2O2 data using five clusters. The table has two components. The first col-umns present the reported functional classes. The presented functional classes are selected with GENERATOR default view so that they highlight functional classes over-represented in the original list of genes and also in the cluster in question. In addition this part also shows the three reported p-values. These are the same as in the table 1. The table also includes number of class members in the cluster (inner size), number of class mem-bers in the original sample list (original inner size) and the number of class members in both sample and reference list (total size). These values can be used to analyse the proportion of the class that was included to clus-ter and the proportion of the class from the reported cluster. The reported classes can be also viewed as DAG with the included link to AMIGO www server. This enables the analysis of the hierarchy structure of the reported classes. The second part of table presents the list of genes for each cluster. Genes are presented in the sorted order so that the ones at the top of the list have always the strongest membership to the analyzed cluster.Click here for file[http://www.biomedcentral.com/content/supplementary/1471-2105-6-162-S5.xls]
Additional File 6GENERATOR detailed class output for itraconanzole dataset. Table 6 The table presents a detailed view for the results obtained from GENER-ATOR with itraconanzole data using six clusters. One outlier cluster has not been taken in our analysis. Table has three main components. These are similar to the first three components in the table 5 [see Additional file 5].Click here for file[http://www.biomedcentral.com/content/supplementary/1471-2105-6-162-S6.xls]
Additional File 7Detailed sorted class list for H2O2 dataset. Table 7 The table presents a detailed sorted list of over-represented classes obtained with H2O2 dataset. Classes with p-value < 0.01 (O.log(p) > 2.0) are shown.Click here for file[http://www.biomedcentral.com/content/supplementary/1471-2105-6-162-S7.xls]
Additional File 8Detailed sorted class list for itraconanzole dataset. Table 8 The table presents a detailed sorted list of over-represented classes obtained with itraconanzole dataset. Classes with p-value < 0.01 (O.log(p) > 2.0) are shown.Click here for file[http://www.biomedcentral.com/content/supplementary/1471-2105-6-162-S8.xls]
Additional File 9Summary of GOToolBox results with H2O2 dataset. Table 9 The table shows a summary of H2O2 dataset analysis with GOToolBox. Results are shown separately for three sub-ontologies of GO. Columns show GOTool-Box cluster number (Cluster nb), number of gene products within each cluster (Number of genes), and obtained class description (Class names). The raw output from GOToolBox is available in table 10 [see Additional file 10].Click here for file[http://www.biomedcentral.com/content/supplementary/1471-2105-6-162-S9.xls]
Additional File 10GOToolBox outputs from analysis with H2O2 and itraconanzole data-sets. Table 10 Files include the clustering results for H2O2 and itraconan-zole datasets from GOToolBox.Click here for file[http://www.biomedcentral.com/content/supplementary/1471-2105-6-162-S10.zip]
Page 17 of 18(page number not for citation purposes)
BMC Bioinformatics 2005, 6:162 http://www.biomedcentral.com/1471-2105/6/162
Publish with BioMed Central and every scientist can read your work free of charge
"BioMed Central will be the most significant development for disseminating the results of biomedical research in our lifetime."
Sir Paul Nurse, Cancer Research UK
Your research papers will be:
available free of charge to the entire biomedical community
peer reviewed and published immediately upon acceptance
cited in PubMed and archived on PubMed Central
yours — you keep the copyright
Submit your manuscript here:http://www.biomedcentral.com/info/publishing_adv.asp
BioMedcentral
Tarver L, Kasarskis A, Lewis S, Matese JC, Richardson JE, Ringwald M,Rubin GM, Sherlock G: Gene ontology: tool for the unificationof biology. The Gene Ontology Consortium. Nat Genet 2000,25(1):25-29.
15. Lee DD, Seung HS: Learning the parts of objects by non-nega-tive matrix factorization. Nature 1999, 401(6755):788-791.
16. Fisher RA: On the interpretation of c2 from contingencytables, and on the calculation of P. J R Stat Soc 1922, 85:81-94.
17. Agresti A: A Survey of Exact Inference for ContingencyTables. Stat Sci 1992, 1(7):131-177.
18. Segal E, R Y, Koller D: Genome-wide discovery of Transcrip-tional Modules from DNA Sequence and Gene Expression.Bioinformatics 2003, 19(Suppl 1):i273-282.
19. Martin D, Brun C, Remy E, Mouren P, Thieffry D, Jacq B: GOTool-Box: functional analysis of gene datasets based on GeneOntology. Genome Biol 2004, 5(12):R101.
20. Hughes TR, Marton MJ, Jones AR, Roberts CJ, Stoughton R, ArmourCD, Bennett HA, Coffey E, Dai H, He YD, Kidd MJ, King AM, MeyerMR, Slade D, Lum PY, Stepaniants SB, Shoemaker DD, Gachotte D,Chakraburtty K, Simon J, Bard M, Friend SH: Functional discoveryvia a compendium of expression profiles. Cell 2000,102(1):109-126.
21. The GENERATOR web page [http://www.oppi.uku.fi/pehkonen/generator]
22. The Gene Ontology web page [http://www.geneontology.org]23. The AMIGO web server [http://www.godatabase.org/cgi-bin/
amigo/go.cgi]24. Heger A, Holm L: Sensitive pattern discovery with 'fuzzy' align-
ments of distantly related proteins. Bioinformatics 2003,19(Suppl 1):i130-7.
25. Brunet JP, Tamayo P, Golub TR, Mesirov JP: Metagenes andmolecular pattern discovery using matrix factorization. ProcNatl Acad Sci U S A 2004, 101(12):4164-9.
26. Fränti P, Xu M, Kärkkäinen I: Classification of binary vectors byusing DeltaSC-distance to minimize stochastic complexity.Pattern Recogn Lett 2003, 24(1–3):65-73.
27. Cai L, Huang H, Blackshaw S, Liu JS, Cepko C, Wong WH: Cluster-ing analysis of SAGE data using a Poisson approach. GenomeBiol 2004, 5(7):R51.
28. Seppänen JK, Bingham E, Mannila H: A simple algorithm for topicidentification in 0–1 data. In Knowledge Discovery in Databases:PKDD 2003; Cavtat-Dubrovnik, Croatia Edited by: Nada Lavrac, DraganGamberger, Hendrik Blockeel, Ljupco Todorovski. Springer;2003:423-434.
29. Lee DD, Seung HS: Algorithms for non-negative matrix factor-ization. In Adv Neural Info Proc Syst: 2001; Vancouver, British Columbia,Canada Edited by: Todd K Leen, Thomas G Dietterich, Volker Tresp.MIT Press; 2001:556-562.
Page 18 of 18(page number not for citation purposes)