the wmo field intercomparison of rain intensity gauges
TRANSCRIPT

Atmospheric Research 94 (2009) 534–543
Contents lists available at ScienceDirect
Atmospheric Research
j ourna l homepage: www.e lsev ie r.com/ locate /atmos
The WMO Field Intercomparison of Rain Intensity Gauges
Luca G. Lanza a,⁎, E. Vuerich b
a DICAT, Department of Construction, Environmental and Territorial Engineering, University of Genova, 1 Montallegro 16145 Genoa, Italyb Italian Meteorological Service, km 20,100 Braccianese Claudia, 00062 Bracciano, Italy
a r t i c l e i n f o
⁎ Corresponding author.E-mail addresses: [email protected] (L.G. Lanza),
(E. Vuerich).
0169-8095/$ – see front matter © 2009 Elsevier B.V.doi:10.1016/j.atmosres.2009.06.012
a b s t r a c t
Article history:Received 13 November 2008Received in revised form 12 June 2009Accepted 21 June 2009
The first Field Intercomparison of Rainfall Intensity (RI) gauges was organised by WMO (theWorld Meteorological Organisation) from October 2007 to April 2009 in Vigna di Valle, Rome(Italy). The campaign is held at the Centre of Meteorological Experimentations (ReSMA) of theItalian Meteorological Service. A group of 30 previously selected rain gauges based on differentmeasuring principles are involved in the Intercomparison. Installation of the instruments in thefield was preceded by the laboratory calibration of all submitted catching-type rain gauges atthe University of Genoa. Additional meteorological sensors (ancillary information) and theobservations and measurements performed by the Global Climate Observing System/GlobalAtmosphere Watch (GCOS/GAW) meteorological station of Vigna di Valle were analyzed asmetadata. All catching-type gauges were tested after installation using a portable calibrationdevice specifically developed at the University of Genoa, simulating an ordinary calibrationinspection in the field.This paper is dedicated to the summary of preliminary results of the Intercomparisonmeasurements. It offers a view on the main achievements expected from the Intercomparisonin evaluating the performance of the instruments in field conditions. Comparison of several raingauges demonstrated the possibility to evaluate the performance of RI gauges at one-minuteresolution in time, as recommended by the WMO Commission for Instruments and Methods ofObservations (WMO-CIMO). Results indicate that synchronised tipping-bucket rain gauges(TBR), using internal correction algorithms, and weighing gauges (WG) with improveddynamic stability and short step response are the most accurate gauges for one-minute RImeasurements, since providing the lowest measurement uncertainty with respect to theassumed working reference.
© 2009 Elsevier B.V. All rights reserved.
Keywords:Rainfall intensityPrecipitationMeasurementAccuracyIntercomparison
1. Introduction
The need to perform an Intercomparison of RainfallIntensity (RI) gauges within the World Meteorological Organi-sation (WMO) dates back to the two Expert Meetings onRainfall IntensityMeasurements respectively held in Bratislava,SlovakRepublic, 23–25April 2001 (WMO, 2001) and inGeneva,Switzerland, 5–9 December 2005 (WMO, 2005). The formerwas mainly focused on the Laboratory Intercomparison of rainintensity (RI) gauges and the accuracy aspects of RI measure-ments, while the latter was concentrated on the objectives and
All rights reserved.
operational aspects of the recommended follow-up Intercom-parison of RI gauges to be performed in the field.
Before the meeting in Bratislava, there was a general lackof knowledge, practise, standardization and recommenda-tions with respect to RI measurements within WMO. At theend of the meeting a standard definition of RI was adopted asthe amount of precipitation collected per unit time interval,expressed in millimetres per hour. The range of measure-ments, the required uncertainties and the output averagingtime were also defined. In particular, an uncertainty of 5% inthe range 2–2000 mm h−1 and an output averaging time of1 min were recommended, so we generally refer now to RI[mm h−1] at the 1 min averaging time interval. It has beenrecognized by many users that RI at such a high resolution intime is suitable for hydro-meteorological warnings, flood

535L.G. Lanza, E. Vuerich / Atmospheric Research 94 (2009) 534–543
forecasting, disaster prevention andmitigation, urban hydrol-ogy applications, etc. (see e.g. Molini et al., 2001; 2005a,b).
Although the history of instrument intercomparison in thecaseof rainfallmeasurements dates back significantly in the lastcenturies — experiments in the field being reported by Stow(1871) and recently by Goodison et al. (1998) (see Fig. 1) —
previous international rain gauges intercomparison effortswere focused on accumulated amounts of precipitation, lowintensity rainfall (including solid precipitation) and sometimesonly on qualitative RI information (light, moderate, heavy).These studies did not focus in particular on quantitative valuesof RI and no intercomparison of a large number of RImeasuringinstruments had yet been conducted in both laboratory andfield conditions. For such reasons the WMO considered as thefirst and necessary step to organize an intercomparison of suchinstruments first in the laboratory and eventually in the field.
The recommendation is in line with the well-establishedawareness of the relevance of intercomparison exercises inatmospheric sciences, since Father Francesco Denza, memberof the Italian Meteorological Society, already stated in 1872that “… in order that meteorological studies produceadvantages for human beings… it is not only necessary tohave lots of observatories and observations/measurements bedone with intelligence and accuracy, but it is moreoverrequested a meteorological investigation with same metho-dology and with well compared instruments”.
The first Intercomparison started in 2004 and wasconcluded in 2005. An international standardized procedurefor laboratory calibration of catchment type RI gauges and thereference instruments to be used for the Intercomparison ofRI gauges in the Field have become recommendations of thefourteenth session of the WMO Commission for Instrumentsand Methods of Observation (WMO-CIMO). Final results areavailable on the WMO Web site, and were already publishedelsewhere (Lanza et al., 2005a,b; Lanza and Stagi, 2008).
The main objective of the follow-up Field Intercomparison isto test the performance of rainfall intensity measurementinstruments in real world conditions and with a special focuson high rainfall rates. The objective is to offer advice for RIuncertainty determination and to improve RI measurementaccuracy, to provide guidancematerial for further improvements
Fig. 1. Experiments to investigate the effect of measurement heigh
in the area of Intercomparison exercises, to draft recommenda-tions for consideration by the WMO-CIMO, and to allowcomparison of both the catchment and non-catchment types ofrain gauges so as to better investigate their respectiveperformance.
In terms of accuracy, both the Laboratory and FieldIntercomparison efforts have contributed to a quantitativeevaluation of counting errors (systematic — “ability to sense”)and catching errors (weather related, wetting, splashing,evaporation — “ability to collect”) of RI gauges. This specificaspect will allow further definition of the general principles ofmeasurement accuracy to be applied in RImeasurements. Notethat some RI gauges were properly modified by manufacturersor NMHS (National Meteo-Hydrological Services) after theresults of the first Laboratory Intercomparison and beforetaking part into the Field Intercomparison, by improving theirperformance in terms of accuracy and according to the above-mentioned international recommendations, demonstrating theimmediate usefulness of the intercomparison results.
The present paper concerns the results obtained duringthe WMO Field Intercomparison of Rain Intensity Gauges,held in Vigna di Valle (Rome), with particular emphasis onthe field tests performed in real world conditions. A compa-nion paper is devoted in this issue to the analysis and dis-cussion of the behaviour of the instruments under controlledlaboratory conditions (Lanza and Stagi, 2009-this issue).The laboratory phase was limited to catching-type instru-ments, and was duly performed before the installation of thegauges in the field. The spare instruments provided by themanufacturers have been tested as well, so as to be ready toreplace their companion instrument in case of malfunction.All catching-type gauges were further periodically tested afterinstallation, using a portable calibration device specificallydeveloped at the University of Genoa, and simulating ordinarycalibration inspections in the field.
In Section 2 below, a description of the test site and theinstrumentation installed in the field is provided. Results ofthe tests performed are synthetically reported in Section 3 forsample individual gauges belonging to the main categories ofmeasurement principles involved. Section 4 deals with theperformance intercomparison of the various types of gauges
t (by Symons in 1862) as quoted by Goodison et al. (1998).

536 L.G. Lanza, E. Vuerich / Atmospheric Research 94 (2009) 534–543
during some sample rain events, according to their measuringprinciple, and an overall assessment is provided beforeconclusions are drawn in Section 5.
2. The test site and instrumentation
The Centre of Meteorological Instruments Experimenta-tions and historic observatory (ReSMA) of the Italian Air Forceis sited in Vigna di Valle, next to Rome, in the historic building,dated 1909 (see Fig. 2), where the first Italian aerologicalstation had been hosted.
TheReSMAcentre ensures quality control onmeteorologicalobservations, certifies the compliance ofmeteorological instru-ments with the relevant standards and performs specialmeasurement campaigns that allow assessing the performanceof various observation devices. It is also equipped, among otherinstruments, with a baro-climatic chamber, where criticalmeteorological conditions can be reproduced and instrumentsbe tested in such conditions. The Centre alsomanages and takescare of the archives of the special observations networks. Moreprecisely these includeozonemeasurements (3 stations locatedin Vigna di Valle, Monte Cimone and Messina), total solarradiation anddurationof sunshine (30 stations), carbondioxide(1 station at Monte Cimone) and the chemical analysis ofprecipitation (7 stations). For these latter measurements theReSMACentre includes amodern chemical laboratory, with thetask of collecting and analyzing precipitation samples.
The site of Vigna di Valle, located on the bank of the lake ofBracciano, is characterized by a South West–North Eastdominant wind regime. During autumn and spring, the mostintense rainfall intensity events lasting for at least severalminutes are generally produced by thunderstorms and showersdeveloped within cold/warm fronts mainly originated fromSouth West (due to the sea “breeze”). The most intenseconditions occur when perturbations encounter the BraccianoLake humidity supply. A similar situation can be observedduring summer for intense precipitation events (although lessfrequent), with dominant winds from the East, and are causedby the “heat island” effect of the nearby town of Rome.
Fig. 2. The Centre of Meteorological Instruments Experimentati
During precipitation events, average wind speeds of 10 kt–5 m/s are usually recorded, with the exception of those caseswhen large Tower Cumulus or Cumulonimbus outflows(stronger winds) usually anticipate intense showers, and lastfor several minutes (120–240 mm h−1).
The specific site selected to host the Field Intercompar-ison of RI gauges, is a green grass area of 400 m2, equippedwith 34 evenly positioned concrete platforms for dataacquisition (see Fig. 3), and a central pit with four positions,specifically used for the installation and acquisition of theworking reference — a set of four RI gauges already iden-tified and recommended within the previous WMO Labora-tory Intercomparison.
The working reference gauges were inserted in a four-foldReference Rain Gauge Pit (RRGP) with gauge collectors at theground level, according to the standard EN13798: “Specifica-tions for a reference rain gauge pit” (see Fig. 4) adopted for thisIntercomparison. A reference can be defined as a virtual devicebased on a set of measuring instruments and, according to theVocabulary of Metrology, aworking reference is a calibrated setof instruments used to control/make comparisonwithmeasur-ing instruments. For this Field Intercomparison of RI gauges aset of instruments was recommended and the combinedanalysis of the reference gauges will provide the best possibleestimation of RI in the field, based on their demonstratedperformance during the previous Laboratory Intercomparison.The working reference rain gauges were inserted in a RRGP inorder to minimize weather related catching errors.
According to the results of the WMO Laboratory Inter-comparison of RI gauges, corrected tipping-bucket raingauges (TBR) and weighing gauges (WG) with the shorteststep response and the lowest uncertainty were used asworking reference instruments.
According to such requirements, the tipping-bucket raingauges ETG-R102 and CAE-PMB2, as well as the weighinggauges Meteoservices-MRW500 and GEONOR-T200B, wereselected as working reference gauges, inserted in the RRGPand installed on four dedicated platforms.
A total number of 26 different RI gauges were installed ondedicated ground platforms; 13 additional meteorological
ons and historic observatory (ReSMA) in 1911 and today.

Fig. 3. The test site for the WMO Field Intercomparison of RI gauges (at ReSMA — Italy).
537L.G. Lanza, E. Vuerich / Atmospheric Research 94 (2009) 534–543
sensors for monitoring environmental conditions wereinstalled on 6 further platforms (see Fig. 3). All recommendedstandards contained in theWMO-CIMOguiden.8 (WMO,2008),concerning precipitation measurements, instrument installa-tion and procedures for conducting the Intercomparison, wereadopted and maintained. The standard procedures and equip-ment recommended for meteorological data acquisition wereadopted with care as part of a general quality assuranceframework.
Participation in the intercomparison was accepted basedon the following conditions:
a) Only in situ, both catchment and non-catchment, RIinstruments that are currently being used in nationalnetworks or being considered for use in national networkswere included;
b) Only instruments that are capable of measuring rainfallintensities as high as 200 mm/h at a time resolution of1 min were accepted.
Fig. 4. The standard pit hosting four reference gauges at the test site of
Because the number of instruments proposed exceededthe capacity of the field site, a further selection was madebased on the following additional criteria:
a) Instruments were selected to cover a variety of measure-ment principles;
b) Preference was given to new promising measuringprinciples;
c) Preference was given to instruments that were widelyused;
d) For those equipment tested in the WMO laboratoryintercomparison, results of the laboratory tests weretaken into consideration.
The four instruments used as reference gauges in the pithad a companion instrument installed in the open field inorder to better quantify the effect ofwind losses (Koschmieder,1934). All participants were also requested to calibrate theirinstruments against any suitable recognized standard before
the WMO Field Intercomparison of RI gauges (at ReSMA — Italy).

538 L.G. Lanza, E. Vuerich / Atmospheric Research 94 (2009) 534–543
shipment and to provide appropriate calibration certificates.Participants provided their assistance for installation andduring the Intercomparison, allowing the test to be carried outproperly (a Participants Meeting was held in May 2008).
The list of selected instruments is reported in Table 1.The environmental conditions were monitored using the
following ancillary sensors:
– four Young 05106 propeller-vane anemometers installedat each corner of the test site;
– four Vaisala DRD11A wetness sensors installed at eachcorner of the test site;
– one Rotronic M101A Temperature/Relative Humiditysensor, one Young 61020L atmospheric pressure sensorand one Lycor 200X global irradiance sensor, all installedin a side positioned ground platform;
– one Gill Windsonic ultrasonic anemometer installed on aground platform close to the four-fold RRGP in the centreof the test site.
The decision was taken to exclude windshields so as toprovide comparablemeasurements fromall gauges. Instrumentsand someancillary sensors (wind,wetness)were installed at 1mheight. Other ancillary sensors (temperature, relative humidity,solar radiation, atmospheric pressure) were installed at CIMOstandard heights.
The following criteria for positioning the gauges withinthe test site were applied:
a) Almost random distribution of gauges with differentmeasuring principles;
b) No clustering of large gauges in order to prevent mutualdisturbance of the wind field.
Table 1WMO Field Intercomparison of RI gauges: list of the involved instruments.
ID Model Co
1 7499020BoMV2/RIMCO A2 AP23/PAAR A3 R01 3070/PRECIS-MECANIQUE Fr4 PT 5.4032.35.008/THIES G5 R 102 ETG It6 DQA031/LSI LASTEM It7 T-PLUV UM7525/I/SIAP-MICROS It8 PM B2 CAE It9 RAIN COLLECTOR II7852 DAVIS U10 15188/LAMBRECHT G11 PP040/MTX It12 ARG100/ENV. MEAS. Lmt. Br13 MRW500 METEOSERVIS Cz14 VRG101/VAISALA Fi15 PLUVIO/OTT G16 PG200/EWS H17 T-200B/GEONOR N18 TRwS/MPS Sl19 MPA-1M/SA “MIRRAD” U20 PWD22/VAISALA Fi21 PARSIVEL/OTT G22 LPM/THIES G23 WXT510/VAISALA Fi24 ANS 410-H/EIGENBRODT G25 Electrical rain gauge/KNMI N26 DRP/PVK-ATTEX R
The data acquisition system was made of a CampbellScientific CR1000 data-logger equipped with serial outputfiltering peripherals (SDM-SIO4), switch closure/open collectorperipherals (SDM-SW8A), multiplexers peripherals (AM16/32A), memory cards (field data storage), converters for serialprotocols (ADAM4520-RS232-422-485), 2batterypacks, anUPS(Uninterruptible Power Supply) system and an Ethernetmodulefor communication and data transfer to the main computer (asecond data storage). The main computer was also equippedwith a UPS and mirror hard disk systems for providing fail safeoperations and un-interrupted data acquisition. Moreover thesystem was equipped with a couple of external USB (UniversalSerial Bus) hard disks for full backup of raw data (third datastorage).
The focus of this Intercomparison is on liquid precipita-tion, therefore only liquid precipitation events are evaluated.Events containing particles of mixed or solid phase arediscarded. Discrimination of the events was based on thevarious kinds of messages provided by the ReSMA H24weather station (WMO ID 16224).
3. Data analysis and discussion
The main objective of the data analysis was to perform anintercomparison of in situ rainfall intensity measurements inhigh RI field conditions. The first stepwas therefore to establisha suitable reference RI, obtained as the best estimation of theone-minute RI values derived from the working referencegauges located in the RRGP.
In this field intercomparison the reference RIwas composedof 4 working reference gauges, namely 2 corrected TBRs (withcorrection algorithms) and 2 WGs with the shortest stepresponse and the lowest uncertainty according to the WMO
untry Measuring principle
ustralia Tipping bucketustria Tipping bucketance Tipping bucketermany Tipping bucketaly Tipping bucketaly Tipping bucketaly Tipping bucketaly Tipping bucketSA Tipping bucketermany Tipping bucketaly Tipping bucketazil/UK Tipping bucketech Rep. Weighing gaugenland Weighing gaugeermany Weighing gaugeungary Weighing gaugeorway Weighing gaugeovak Rep. Weighing gaugekraine Weighing gaugenland Optical disdrometerermany Optical disdrometerermany Optical disdrometernland Acoustic detection of individual rain dropsermany Pressure sensoretherlands Level sensorussian Fed Micro Doppler radar

539L.G. Lanza, E. Vuerich / Atmospheric Research 94 (2009) 534–543
Laboratory Intercomparison results. The best estimation of the“true” RI can be achieved in two different ways:
– by evaluating the dynamic performance characteristics ofthe set of reference gauges;
– by statistically elaborating on the experimental data.
The first method consists in performing specific laboratoryor field tests with several step function inputs in a suitablerange of RI and experimentally deriving the step responsefunction and the time delay of each instrument in terms of afunction depending on dynamic parameters and time. Theenergy distribution of a physical system like a specific raingauge could not be constant, unless the system is said to be ina static state. To determine static characteristics, measure-ments of the output must be taken for many different valuesof the input with each measurement being made when thesystem is static. During the transition from one static state toanother, as is the case during any precipitation event, thesystem is dynamic. The time scale or the response time delayduring which a rain gauge is dynamic should be evaluatedexperimentally by a suitable range of step function inputs inorder to retrieve the value of the input (best estimation of1 min RI) during a precipitation event or a specific test. Thestep response function of each reference rain gauge applied infield conditions will allow to retrieve the true one-minute RIvalue within an uncertainty which is a proper combination ofthe uncertainties of the rain gauges evaluated experimentallyin laboratory through a standard procedure. This methodcould not be discarded in the management of the fieldIntercomparison, because the accuracy of some catching-typerain gauges such as WG (typically second-order systems)could strongly depend on both systematic errors and errorsinduced by the dynamic characteristics of atmosphericprecipitation: the related uncertainty could be degradedwith respect to the uncertainty evaluated in laboratory instationary conditions (steady flow rate). This is true especiallyat the one-minute time scale, the output averaging timerecommended for RI evaluation. At coarser time scales (5–10 min) the dynamic characteristic will be smoothed and themeasurement uncertainty reduced. It could happen that somerain gauges cannot be compared with the reference at one-minute time scale, being affected by dynamic characteristicsthat allow accurate measurements only at larger time scales.Such gauges are preferably used for rainfall amount [mm]determination at the hourly/daily base or can be used for one-minute RI determination only after modification of theresponse function.
The second method consists in a statistical evaluation ofthe dataset obtained from the Intercomparison. This metho-dology, used for the evaluation of preliminary results aspresented in this paper, is particularly advantageous becauseit provides the data analyst with a first level analysis prior toperform ad hoc and accurate step response tests for derivingthe dynamic characteristics of individual gauges. As thefollowing graphs will show, this procedure is thereforeadvantageous to determine the 1min reference RI, to performcomparisons among the group of rain gauges under test andthe reference RI (the purpose of the Intercomparison) and toidentify rain gauges that are particularly affected by thedynamic characteristics of rainfall intensity, any defect ofsynchronisation or any time delay in output.
For evaluating statistically the 1 min reference RI as thebest estimation of the 1 min “true” RI, a weighted average ofthe one-minute rainfall intensity values measured by the fourworking reference gauges was calculated as:
RIXREF =
Piμ iRIi
Piμ i
where µi is theweight of the individual i-th working referencegauge.
Calculation ofweights is themost challenging issue. In orderto take into account the effects related to both the dynamicinternal characteristics and the possible lack of synchronisationat the 1 min time scale, weights were calculated as:
μ i =S−1i � FiP
iS−1i � Fi
with Si =Pi ≠ k
σ ik whereσik are statistical parameters calculated
for each working reference gauge i with respect to the otherworking references in RRGP throughout the database of allprecipitation events as:
σ =
PNj=1
RIij−RIkj� �2
Nbeing:
– RIij the j-th 1 min intensity measured by the workingreference rain gauge i in the RRGP,
– RIkj the j-th 1 min intensity measured by the workingreference rain gauge k in the RRGP,
– N the number of experimental (one-minute RI) data of allevents analyzed,
and where F is a “gross” parameter assigned by the analyst onan event by event basis, after detailed examination of themeasured data. The gross parameterwill be equal to 0when theexamined working reference gauge is evidently affected by a-synchronism or dynamic “defects”, and equal to 1 otherwise.
The highly peaked RI events from the complete databasewere selected for the present analysis, with a maximumintensity of about 160 mm h−1. We obviously recognize theneed of addressing all other monitored events, and thestatistical parameter σ has been already calculated for allevents till May 2008, however the present synthetic pre-sentation of the three most intense events aims at providingan insight into the more complete results that are still inpreparation at the time of writing of the present paper.
Since the Intercomparison is still in progress we will onlypresent here partial results in an anonymous way, i.e. nomention is made of single gauge models and the respectivemanufacturer.
The observed behaviour of a few sample instruments isreported in Figs. 5 and 6, where relative deviations of themeasured intensity from the reference one ([Imeas− Iref] / Iref)are plotted for some representative events against thevariability of the rain signal, here intended as the simplevariation from the previous to the current reference intensityvalue (ΔIref). Note that the calculated deviations cannot beconsidered as errors, since the reference intensity is not thetrue intensity, and the derived information is not precisely the

Fig. 5. Dynamic behaviour of a tipping-bucket rain gauge, corrected by using a calibration curve, where deviations with respect to the reference intensity areplotted as a function of the variability of the rain signal.
540 L.G. Lanza, E. Vuerich / Atmospheric Research 94 (2009) 534–543
accuracy of the instrument in hand. The actual accuracy ofeach instrument in the field must be derived after considera-tions about the accuracy of the reference intensity itself. Suchconsiderations will be possible upon completion of theintercomparison exercise, based on the fact that referencegauges are located in the RRGP and counting errors— alreadyquantified in the preliminary laboratory phase — can beassumed as the predominant limiting factor for accuracy.
From the first graphs it is evident that, irrespective of theconfiguration chosen for the weights used to calculate thereference intensity, the instrument shows good performanceover the whole range of variability of the rain signal as
Fig. 6. Dynamic behaviour of a tipping-bucket rain gauge, corrected by using a calplotted as a function of the variability of the rain signal. A synchronisation problem
observed during the selected events. There is no evidentindication of any degradation of the performances withincreasing the (absolute) variation in time of the referenceintensity. On the contrary, it seems that a better agreement isobtained at the larger values of ΔIref, but this might be due tothe scarce number of one-minute data with such largevariations recorded during the events.
The graph in Fig. 6 illustrates the effect of possibleanomalies in the case of specific events. More precisely, foranother tipping-bucket rain gauge with correction based onthe application of a calibration curve (therefore with goodexpected performances) a very bad agreement was observed
ibration curve, where deviations with respect to the reference intensity areoccurred for the event depicted by triangles.

Fig. 7. Comparison of various types of instruments with the reference intensity.
541L.G. Lanza, E. Vuerich / Atmospheric Research 94 (2009) 534–543
542 L.G. Lanza, E. Vuerich / Atmospheric Research 94 (2009) 534–543
for one of the observed events (denoted by triangles in thegraph). Also, a well defined trend of the deviations with therain signal variability is evident from the graph. After accuratechecking of all data from that gauge, a synchronisation errorwas discovered to affect the records during a certain period ofthe campaign, and was later corrected. This reinforces thestatement that synchronisation is really one fundamentalissue in this and similar intercomparison efforts in the field,especially when operating at such a fine resolution of themeasurements in time (the 1 min time scale).
4. Comparison of measuring performance
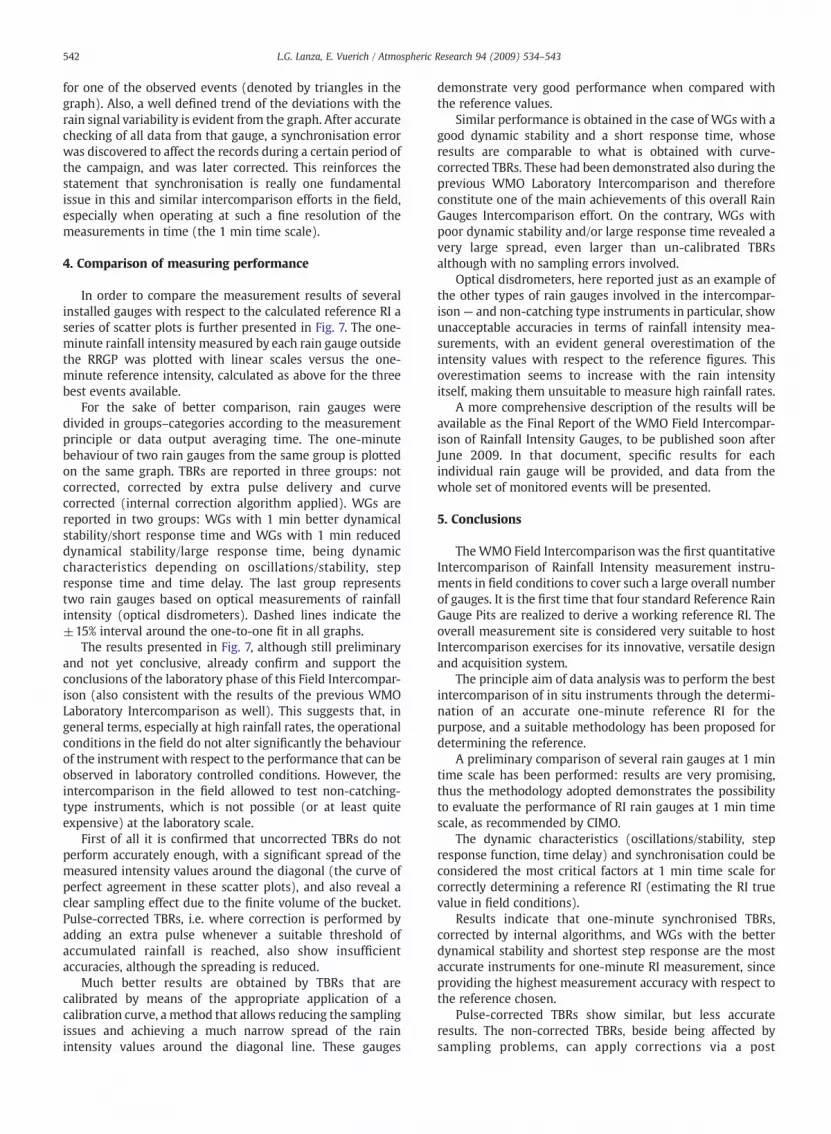
In order to compare the measurement results of severalinstalled gauges with respect to the calculated reference RI aseries of scatter plots is further presented in Fig. 7. The one-minute rainfall intensity measured by each rain gauge outsidethe RRGP was plotted with linear scales versus the one-minute reference intensity, calculated as above for the threebest events available.
For the sake of better comparison, rain gauges weredivided in groups–categories according to the measurementprinciple or data output averaging time. The one-minutebehaviour of two rain gauges from the same group is plottedon the same graph. TBRs are reported in three groups: notcorrected, corrected by extra pulse delivery and curvecorrected (internal correction algorithm applied). WGs arereported in two groups: WGs with 1 min better dynamicalstability/short response time and WGs with 1 min reduceddynamical stability/large response time, being dynamiccharacteristics depending on oscillations/stability, stepresponse time and time delay. The last group representstwo rain gauges based on optical measurements of rainfallintensity (optical disdrometers). Dashed lines indicate the±15% interval around the one-to-one fit in all graphs.
The results presented in Fig. 7, although still preliminaryand not yet conclusive, already confirm and support theconclusions of the laboratory phase of this Field Intercompar-ison (also consistent with the results of the previous WMOLaboratory Intercomparison as well). This suggests that, ingeneral terms, especially at high rainfall rates, the operationalconditions in the field do not alter significantly the behaviourof the instrument with respect to the performance that can beobserved in laboratory controlled conditions. However, theintercomparison in the field allowed to test non-catching-type instruments, which is not possible (or at least quiteexpensive) at the laboratory scale.
First of all it is confirmed that uncorrected TBRs do notperform accurately enough, with a significant spread of themeasured intensity values around the diagonal (the curve ofperfect agreement in these scatter plots), and also reveal aclear sampling effect due to the finite volume of the bucket.Pulse-corrected TBRs, i.e. where correction is performed byadding an extra pulse whenever a suitable threshold ofaccumulated rainfall is reached, also show insufficientaccuracies, although the spreading is reduced.
Much better results are obtained by TBRs that arecalibrated by means of the appropriate application of acalibration curve, a method that allows reducing the samplingissues and achieving a much narrow spread of the rainintensity values around the diagonal line. These gauges
demonstrate very good performance when compared withthe reference values.
Similar performance is obtained in the case of WGs with agood dynamic stability and a short response time, whoseresults are comparable to what is obtained with curve-corrected TBRs. These had been demonstrated also during theprevious WMO Laboratory Intercomparison and thereforeconstitute one of the main achievements of this overall RainGauges Intercomparison effort. On the contrary, WGs withpoor dynamic stability and/or large response time revealed avery large spread, even larger than un-calibrated TBRsalthough with no sampling errors involved.
Optical disdrometers, here reported just as an example ofthe other types of rain gauges involved in the intercompar-ison— and non-catching type instruments in particular, showunacceptable accuracies in terms of rainfall intensity mea-surements, with an evident general overestimation of theintensity values with respect to the reference figures. Thisoverestimation seems to increase with the rain intensityitself, making them unsuitable to measure high rainfall rates.
A more comprehensive description of the results will beavailable as the Final Report of the WMO Field Intercompar-ison of Rainfall Intensity Gauges, to be published soon afterJune 2009. In that document, specific results for eachindividual rain gauge will be provided, and data from thewhole set of monitored events will be presented.
5. Conclusions
TheWMO Field Intercomparisonwas the first quantitativeIntercomparison of Rainfall Intensity measurement instru-ments in field conditions to cover such a large overall numberof gauges. It is the first time that four standard Reference RainGauge Pits are realized to derive a working reference RI. Theoverall measurement site is considered very suitable to hostIntercomparison exercises for its innovative, versatile designand acquisition system.
The principle aim of data analysis was to perform the bestintercomparison of in situ instruments through the determi-nation of an accurate one-minute reference RI for thepurpose, and a suitable methodology has been proposed fordetermining the reference.
A preliminary comparison of several rain gauges at 1 mintime scale has been performed: results are very promising,thus the methodology adopted demonstrates the possibilityto evaluate the performance of RI rain gauges at 1 min timescale, as recommended by CIMO.
The dynamic characteristics (oscillations/stability, stepresponse function, time delay) and synchronisation could beconsidered the most critical factors at 1 min time scale forcorrectly determining a reference RI (estimating the RI truevalue in field conditions).
Results indicate that one-minute synchronised TBRs,corrected by internal algorithms, and WGs with the betterdynamical stability and shortest step response are the mostaccurate instruments for one-minute RI measurement, sinceproviding the highest measurement accuracy with respect tothe reference chosen.
Pulse-corrected TBRs show similar, but less accurateresults. The non-corrected TBRs, beside being affected bysampling problems, can apply corrections via a post

543L.G. Lanza, E. Vuerich / Atmospheric Research 94 (2009) 534–543
processing software or provide a correction curve/table to bealmost as accurate as the corrected ones.
WGs with lower dynamical stability or lack of synchron-ism/large step response at the 1 min time scale are lessaccurate. The two analyzed optical disdrometers show anoverestimation trend with respect to the reference chosenand this trend is yet to be further investigated and explained.
In conclusion, the proposed methodology allows suitabledetermination of the best reference and evaluation of thecontribution of catching and counting errors on the overallmeasurement uncertainty by comparing the results of thepreliminary laboratory phase and the final analysis of the fieldphase.
Acknowledgements
This work was performed within the WMO Field Inter-comparison of RI Gauges. The authors are grateful to allmembers of the WMO Expert Team (ET) on “Surface-basedinstrument Intercomparisons and Calibration Method” and theInternational Organizing Committee (IOC) on “Surface-basedInstrument Intercomparisons”, and in particular to E. Lanzinger(the Project Leader), for their collaboration and continuedstimulating discussion held during various meetings andtelephone conferences. Special thanks are due to M. Leroy,Chair of the ET/IOC and to L. Stagi (Site Manager of theLaboratory Intercomparison). Finally, the authors wish tothank C. Monesi for having elaborated most of the informa-tion synthetically presented in the graphs and the staff ofReSMA at the Italian Air Force site for technical assistance. Aspecial thank is due to G. Daddario, Director of ReSMA, for hiscontinuous and encouraging support during the wholemeasurement campaign.
References
Goodison, B.E., Louie, P.Y.T., Yang, D., 1998. WMO Solid Precipitation Measure-ment Intercomparison— Final Report. Instruments andObservingmethodsReport No. 67, WMO/TD-No. 872.
Koschmieder, H., 1934. Methods and results of definite rain measurements.Mon. Weat. Rev. 1 (5–8).
Lanza, L.G., Stagi, L., 2008. Certified accuracy of rainfall data as a standardrequirement in scientific investigations. Adv. Geosci. 16, 43–48.
Lanza, L.G., Stagi, L., 2009. High resolution performances of catching type raingauges from the laboratory phase of the WMO Field Intercomparison ofRain Intensity Gauges. Atmos. Res 94 (4), 555–563 (this issue).
Lanza, L.G., Leroy, M., Alexadropoulos, C., Stagi, L., Wauben, W., 2005a. WMOLaboratory Intercomparison of Rainfall Intensity Gauges — Final Report.IOM Report No. 84, WMO/TD No. 1304.
Lanza, L.G., Leroy, M., Van Der Menlen, J., Ondras, M., 2005b. The WMOLaboratory Intercomparison of Rainfall Intensity (RI) Gauges. WMOTechnical Conference on Meteorological and Environmental Instrumentsand Methods of Observation (TECO-2005), Bucharest, Romania, 4–7 May2005 (published on CD-ROM).
Molini, A., La Barbera, P., Lanza, L.G., Stagi, L., 2001. Rainfall intermittencyand the sampling error of tipping-bucket rain gauges. Phys. Chem. Earth26 (10–12), 737–742.
Molini, A., Lanza, L.G., La Barbera, P., 2005a. The impact of tipping-bucket raingauge measurement errors on design rainfall for urban scale applications.Hydrol. Processes 19 (5), 1073–1088.
Molini, A., Lanza, L.G., La Barbera, P., 2005b. Improving the accuracy oftipping-bucket rain records using aggregation techniques. Atmos. Res.36 (3), 815–817.
Stow, M.H., 1871. Rain gauge experiments at Hawskers, nearWhitby, Yorkshire.Br. Rainfall 1870, 9–22.
WMO, 2001. Final Report of the Expert Meeting on Rainfall IntensityMeasurements, Bratislava, Slovakia, 23–25 April 2001. (available atwww.wmo.int/pages/prog/www/IMOP/reports).
WMO, 2005. Joint CIMO Expert Team on Surface-Based InstrumentIntercomparison and Calibration Methods and IOC on Surface-BasedInstrument Intercomparison, Geneva, 5–9 December 2005. (available atwww.wmo.int/pages/prog/www/IMOP/reports).
WMO, 2008. Guide toMeteorological Instruments andMethods of Observation.WMO Pub. No. 8 Seventh Edition. WMO, Geneva978-92-63-10008-5.(available at www.wmo.int/pages/prog/www/IMOP/publications).