the spectroscopic atomic and molecular databases at the
TRANSCRIPT
HAL Id: hal-03244497https://hal.archives-ouvertes.fr/hal-03244497
Submitted on 4 Jun 2021
HAL is a multi-disciplinary open accessarchive for the deposit and dissemination of sci-entific research documents, whether they are pub-lished or not. The documents may come fromteaching and research institutions in France orabroad, or from public or private research centers.
L’archive ouverte pluridisciplinaire HAL, estdestinée au dépôt et à la diffusion de documentsscientifiques de niveau recherche, publiés ou non,émanant des établissements d’enseignement et derecherche français ou étrangers, des laboratoirespublics ou privés.
Distributed under a Creative Commons Attribution| 4.0 International License
The Spectroscopic Atomic and Molecular Databases atthe Paris Observatory
Evelyne Roueff, Sylvie Sahal-Bréchot, Milan Dimitrijević, Nicolas Moreau,Hervé Abgrall
To cite this version:Evelyne Roueff, Sylvie Sahal-Bréchot, Milan Dimitrijević, Nicolas Moreau, Hervé Abgrall. The Spec-troscopic Atomic and Molecular Databases at the Paris Observatory. Atoms, MDPI, 2020, 8 (3),pp.36. �10.3390/atoms8030036�. �hal-03244497�
atoms
Article
The Spectroscopic Atomic and Molecular Databasesat the Paris Observatory
Evelyne Roueff 1,* , Sylvie Sahal-Bréchot 1,† , Milan S. Dimitrijevic 1,2,† ,Nicolas Moreau 1,† and Hervé Abgrall 1,†
1 Observatoire de Paris, PSL University, Sorbonne Université, CNRS, LERMA, 92190 Meudon, France;[email protected] (S.S.-B.); [email protected] (M.S.D.); [email protected] (N.M.);[email protected] (H.A.)
2 Astronomical Observatory, Volgina 7, 11060 Belgrade, Serbia* Correspondence: [email protected]† These authors contributed equally to this work.
Received: 15 June 2020; Accepted: 11 July 2020; Published: 21 July 2020�����������������
Abstract: This paper is intended to give a comprehensive overview of the current status anddevelopments of the Paris Observatory STARK-B, MOLAT and SESAM databases which canbe interrogated thanks to interoperability tools. The STARK-B database provides shifting andbroadening parameters of different atomic and ionic transitions due to impacts with charged particles(the so-called Stark broadening) for different temperatures and densities. The spectroscopic MOLATand SESAM databases provide the wavelengths, the oscillator strengths or Einstein spontaneousemission coefficients of H2, CO and isotopologues molecules.
Keywords: atomic and molecular physics; stark broadening; UV spectra
1. Introduction
Astrophysical environments can only be probed remotely thanks to particle or photon messengerscollected through space or ground-based telescopes. The analysis of the recorded spectra is expectedto allow for derivation of the physical conditions of the observed regions. However, this can only beachieved if the fundamental basic microscopic processes involving atoms, ions, molecules, electrons,etc., are well enough identified and understood. We describe in this review the efforts developed at theParis Observatory to provide complete and relevant spectral information dedicated to astrophysicaland laboratory plasmas and colder molecular environments through online databases. Section 2reports the STARK-B database providing the shifting and broadening parameters of different atomicand ionic transitions due to electron impact, referred to as Stark broadening, for different temperaturesand densities. We present in Section 3 the spectroscopic MOLAT and SESAM databases which providethe wavelengths and the transition strengths of different molecules.These achievements have greatlybenefited from the interoperability tools developed within the VAMDC project which will be describedin another paper of this issue by M.L. Dubernet and coworkers. The integration process of SESAM andSTARK-B databases into the VAMDC architecture and the software tools that were used are describedin Section 4.
2. STARK-B
Interpretation of collisional broadening and shifting of spectral lines is important for providinginformation on the medium, such as temperatures; densities of the perturbers; and chemicalabundances of the emitting or absorbing atoms or molecules. Due to the great and continuous progressof astrophysical observations and laboratory measurements, accurate spectroscopic diagnostics are
Atoms 2020, 8, 36; doi:10.3390/atoms8030036 www.mdpi.com/journal/atoms
Atoms 2020, 8, 36 2 of 11
more and more needed. Modeling of synthetic spectra requires the knowledge of numerous spectralline profiles, which can be modified by collisions with the particles of the medium, especially electronand positive ions for hot and medium-hot stellar atmospheres and their interiors. For laboratoryplasmas, the increasing development of magnetic confinement fusion devices (Tokamaks, such asWEST (formerly Tore Supra) or the ITER project) of inertial confinement fusion devices (such as NIF or“Laser MégaJoule”), and technological plasmas also needs many atomic data, including line profilesdue to interactions with electrons and ions of the medium. The access to such data via online databaseshas become indispensable.
In Astrophysics, the interest for databases emerged at the IAU XXIInd General Assembly (1994),where a Joint discussion “Atomic Databases, New power Source for Astronomy” was organized byW. L. Wiese [1].
In fact, since the eighties, Sahal-Bréchot, Dimitrijevic and coworkers have been updating andoperating at a large scale the numerical code that was created by Sahal-Bréchot several years earlierfor calculating Stark broadening and shifting of isolated lines in the impact complete collisionapproximation of neutral and ionized elements. Though this broadening mechanism is usuallycalled “Stark” broadening, it is a matter of collisions with electrons and ions and not of Stark effect.This code, named SCP, is based on the impact semi-classical-perturbation approximation [2]. The rangeof considered temperatures and densities is large, and depends on the degree of ionization of thestudied element.
A summary of that theory and the approximations can be found in [2] and earlier papers citedin [2]. The numerical calculations are very fast. Thus, the method is especially adapted for obtaining agreat number of data in the same run. Moreover, it is accurate enough for the needs of users: 20–30%on average for the widths. The SCP results agree with the other theoretical methods [3–5], and withexperimental results, [5] for instance. The uncertainty of the SCP results is due to the use of theperturbation theory [2]. For the shifts, the results can sometimes be less accurate, due to negativeinterference effects between the upper and lower levels of the studied line.
Thanks to this collaborative work, which is currently being continued, more than 150 papers,concerning 125 neutral and ionized elements broadened and shifted by collisions with electrons andions, have been published.
In addition, the development of the Virtual Observatory, due to the great amount of data whichneeded to be connected, increased in the beginning of this new century. Interoperable e-infrastructureswere urgently needed. This request enabled the creation of databases at the Paris Observatory.
Then LERMA1 laboratory gave us a support to put all the results of our numerous tables in adatabase named STARK-B [6]. A precursor, named BELDATA, was foreseen by AOB (AstronomicalObservatory of Belgrade) [7]. Then, STARK-B started at Paris Observatory, with S. Sahal-Bréchot andM.S. Dimitrijevic, who developed the database with the support of LERMA, as part of the databasesof the Paris Observatory. STARK-B opened on line at fall 2008 with a link to the Serbian VirtualObservatory [8]. Currently, S. Sahal-Bréchot and M.S. Dimitrijevic are the scientists co-responsiblefor the database, and N. Moreau is responsible for all the technical aspects. STARK-B is in freeaccess [6] and is also accessible through the thumbnail of the Scientific databases of the website ofParis Observatory [9], in addition to MOLAT [10].
In 2009, the European project VAMDC (Virtual Atomic and Molecular Data Centre) [11], was born,and this helped us a lot. STARK-B became a node of VAMDC. VAMDC is a secure, documented,flexible, interoperable platform based on e-science, which permits optimized search and exchange ofatomic and molecular data. The STARK-B data model follows the VAMDC standards, and STARK-B isalso accessible via the VAMDC portal [12].
1 refer to the Abbreviations Section
Atoms 2020, 8, 36 3 of 11
STARK-B is aimed at meeting the above cited needs for widths and shifts of isolated lines ofneutral and ionized atoms due to electron and ion collisions (i.e., impacts). The elements of interest arenumerous. The ranges of temperatures and densities are large, and depend on the degree of ionizationof the studied element: for the temperatures from 2500 K to about 6 × 10⁶ K, and for the electrondensities from 1010 to 1023 cm−3.
Presently, STARK-B contains Stark broadening and shifts for many transitions calculated withthe SCP method. Besides the SCP results, it also contains a number of MSE (modified semi-empirical)datums obtained by Dimitrijevic, Konjevic and coworkers [13–15]. This method is more approximate(estimated averaged error bar ±40%) than the SCP method but can be used for emitters when atomicdata are not sufficiently complete to perform a semiclassical perturbation calculation. This is often thecase for heavy elements.
2.1. Description of STARK-B Database
Since 2010, approximately every two years the database and its detailed content has beenpresented in several workshops and conferences. We will only give a brief outline in the following.
The homepage of STARK-B (http://stark-b.obspm.fr) has several menus. “Introduction”summarizes the theoretical methods and approximations, and provides references to the basic papers.“Data Description” describes the data that are in the files. “Access to the Data” provides a graphicalinterface with the periodic table with access for getting to the required data. The user is guidedthroughout the query toward the desired element; the required ionization degree; and the requiredlines, densities, temperatures and colliding perturbers. Concerning SCP data, colliding perturbers areelectrons, and most often protons; He+ and He++ ions, which interest stellar physics; and frequently,other positive ions interesting for laboratory or technological plasmas. For MSE data, only widths(and sometimes shifts) due to electron collisions exist. The user can make a query by domain ofwavelengths or by transitions. The data model (in particular the identification of the levels of theline transitions) follows the VAMDC standards, in order to allow interoperability with other atomicdatabases included in VAMDC. So the transitions are defined by configurations, terms and J-values,but different couplings can be taken into account. Then a table displaying the widths and the shifts isgenerated. According to the theory, when LS coupling is valid, the data are given for multiplets onlyand not for the individual fine structure lines. A number of warnings (validity of impact approximation,of isolated line approximation, of complete collision approximation) are included in the tables. Theyare commented on in “Introduction” and “Data Description” menus. Bibliographic references to thepapers are provided, which can be freely downloaded if access is not restricted. Then widths andshifts data can be downloaded in ASCII and in VOTable format (XML format) and adapted to VirtualObservatory tools.
For the computer codes leading to the modeling of stellar atmospheres, fitting formulae andcoefficients as functions of temperature for every line are asked for, because they are much moreconvenient for the numerical calculations than widths and shifts tabulated for a set of temperatures.Consequently, an ad-hoc simple and accurate fitting formula using the Levenberg–Marquardtalgorithm for least-squares method has been obtained for interpolation in the displayed data [16].Thus another table has been added to each table of widths and shifts. It gives the fitting coefficientswith the temperature, which can also be downloaded in ASCII and in VOTable format, and introducedin the computer codes for stellar modeling.
Newly added datasets and revised datasets are displayed in the “Data History” menu.The ”Contact” menu is intended for further inquiries and user support. Almost 2000 queries havebeen performed on the STARK-B website over 2018 and 2019. The access query through VAMDC isminor (less than one hundred per year).
Atoms 2020, 8, 36 4 of 11
2.2. Future and Conclusions
In the short and medium term, we will continue to implement our published calculated datain STARK-B. With our coworkers, we also continue to carry on new calculations of line widths andshifts for needs in modeling and spectroscopic diagnostics. Furthermore, we plan to implement ourpublished quantum results in STARK-B to develop other fitting formulae, such as regularities andsystematic trends, and to include them in STARK-B.
3. MOLAT and SESAM
The MOLAT [10] and SESAM [17] databases provide atomic and molecular data computed orgathered by members of the Paris Observatory and some other spectroscopic databases. The consultingand possible downloads are fully accessible without any restriction. The focus is principally on UVelectronic spectroscopy, which reflects the availability of the 10 m VUV spectrograph on the Meudonsite of the Paris Observatory and the work performed on the LURE synchrotron radiation facility on theOrsay Campus of Paris University. These experimental studies were closely linked to several spatialmissions: the 1200–1500 Å spectral range was indeed available with the International UV Explorer(IUE) and the Hubble Space Telescope (HST) with the Goddard High Resolution Spectrograph (GHRS).In the early 2000s, the 912–1200 Å spectral range became accessible with the far UV SpectroscopicExplorer (FUSE).
3.1. MOLAT
The MOLAT database was set up about thirty years ago. The deliveries are essentially ascii fileswith proper references. Nevertheless, some data are also displayed in PDF format. We focus here on thedata which have been subsequently translated in the XML language via the XSAMS protocol to complywith interoperability requirements. They correspond to VUV Spectra of H2 and its isotopologuesand CO. The specificity and we think the interest of the deliveries are the joined informationof spectral transition wavenumbers/wavelengths and the corresponding oscillator strengths orEinstein emission transition probabilities. Most spectroscopic experimental papers report accuratetransition wavenumbers which are subsequently interpreted in terms of Hamiltonian properties withderivation of term energy values. The corresponding transition oscillator strengths require additionalexperimental (lifetime studies) or theoretical and computational work involving ab-initio quantumchemistry calculations of the interatomic potentials, possible couplings and transition momentsfollowed by the integration of the matrix elements of the transition moment over the radial variable.
3.1.1. CO
Two different spectral ranges are displayed.
• The spectrum from the intersystem transitions of CO, involving a’ 3Σ+-X1Σ+, e 3Σ+-X1Σ+
and d3∆-X1Σ+ is reported in [18]. The corresponding transitions take place inthe ∼ 1250–1650 Å window, where the so-called fourth positive system A1Π-X1Σ transitions arealso available but are often subject to large opacity effects in absorption astronomical spectra.
• The VUV spectrum between 911.2 and 1152.2 Å of CO and different isotopomers is also displayed,following [19]. These transitions involve 31 different electronic states and are sometimes subjectto predissociation, resulting from the numerous possible couplings between nearby electronicstates. These results are of paramount importance to computing photodissociation of CO underinterstellar conditions and possible isotopic selective photodissociation effects.
3.1.2. H2 VUV Spectrum
The data reported for H2 are the results of a long term collaboration between experimentalistsand theoreticians [20,21]. The data are displayed for four electronic systems, B1Σ+
u -X1Σ+g (Lyman band
system), C1Πu-X1Σ+g (Werner band system), B’1Σ+
u -X1Σ+g and D1Πu-X1Σ+
g . The four upper electronic
Atoms 2020, 8, 36 5 of 11
states are coupled through both radial and rotational terms, and the theoretical computations takingthis into account allow one to derive the spectroscopic properties of the different electronic transitions.The emission probabilities towards the continuum of the ground state, i.e., above the dissociationenergy of H2, are also reported up to a rotational quantum number J = 25. These data have beenextensively used by astrophysicists for different applications (interpretation of FUSE observations ofVUV absorption transitions [22], far UV emission from circumstellar disks [23,24], emission bump inprotoplanetary disks [25], auroral and dayglow emission of Uranus atmosphere [26], Jovian auroralspectroscopy [27]). The remarkable accuracy of the reported computed wavelength is a fraction of anAngstrom. This achievement results from the semi-empirical approach applied in the calculations [28],where the energy terms of the ground electronic state are the experimental values of [29] and the upperelectronic potential functions have been slightly and carefully modified compared to the ab-initiovalues [30] to reproduce experimental transition wavelengths, when available.
3.2. SESAM
The SESAM database represents a recent initiative aiming to update the results displayed inMOLAT and offers new tools based on the VAMDC project. The present SESAM database is restricted tothe VUV spectrum H2 and its isotopes through its Lyman B1Σu-X1Σg, Werner C1Πu-X1Σg , B’1Σu-X1Σg
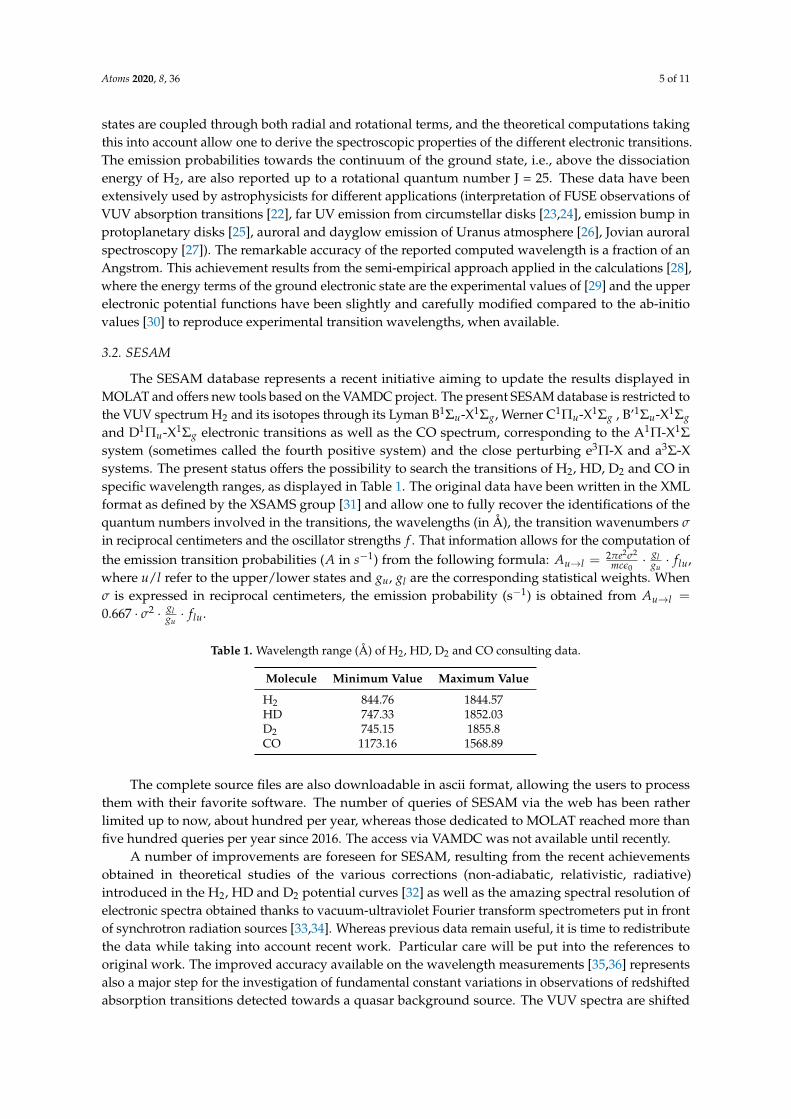
and D1Πu-X1Σg electronic transitions as well as the CO spectrum, corresponding to the A1Π-X1Σsystem (sometimes called the fourth positive system) and the close perturbing e3Π-X and a3Σ-Xsystems. The present status offers the possibility to search the transitions of H2, HD, D2 and CO inspecific wavelength ranges, as displayed in Table 1. The original data have been written in the XMLformat as defined by the XSAMS group [31] and allow one to fully recover the identifications of thequantum numbers involved in the transitions, the wavelengths (in Å), the transition wavenumbers σ
in reciprocal centimeters and the oscillator strengths f . That information allows for the computation ofthe emission transition probabilities (A in s−1) from the following formula: Au→l =
2πe2σ2
mcε0· gl
gu· flu,
where u/l refer to the upper/lower states and gu, gl are the corresponding statistical weights. Whenσ is expressed in reciprocal centimeters, the emission probability (s−1) is obtained from Au→l =
0.667 · σ2 · glgu· flu.
Table 1. Wavelength range (Å) of H2, HD, D2 and CO consulting data.
Molecule Minimum Value Maximum Value
H2 844.76 1844.57HD 747.33 1852.03D2 745.15 1855.8CO 1173.16 1568.89
The complete source files are also downloadable in ascii format, allowing the users to processthem with their favorite software. The number of queries of SESAM via the web has been ratherlimited up to now, about hundred per year, whereas those dedicated to MOLAT reached more thanfive hundred queries per year since 2016. The access via VAMDC was not available until recently.
A number of improvements are foreseen for SESAM, resulting from the recent achievementsobtained in theoretical studies of the various corrections (non-adiabatic, relativistic, radiative)introduced in the H2, HD and D2 potential curves [32] as well as the amazing spectral resolution ofelectronic spectra obtained thanks to vacuum-ultraviolet Fourier transform spectrometers put in frontof synchrotron radiation sources [33,34]. Whereas previous data remain useful, it is time to redistributethe data while taking into account recent work. Particular care will be put into the references tooriginal work. The improved accuracy available on the wavelength measurements [35,36] representsalso a major step for the investigation of fundamental constant variations in observations of redshiftedabsorption transitions detected towards a quasar background source. The VUV spectra are shifted
Atoms 2020, 8, 36 6 of 11
towards the visible region of the spectrum thanks to the relation λobs = λvacuum × (1 + z) where z isthe redshift. A tool allowing one to compute the spectra at any redshift will be made available as well.
4. Interoperability
4.1. VAMDC Environment
The VAMDC infrastructure is based on a set of standards that, together, provide theinteroperability layers. The corner stone of the system is the data model, called XSAMS (XML schemafor atomic, molecular and solid data [37]), which is now officially endorsed by the IAEA. It covers manyfields of atomic and molecular physics and provides a common definition of the quantities to the dataprovider. This schema are used at different levels. First and foremost, being an XML schema, it definesthe structure of an XML document. Instances of these schema are used as data exchange formatsbetween the elements of the infrastructures. They are also used to define the names of queryable andsearchable quantities in the query language vocabulary. VAMDC also defined an access protocol toquery the VAMDC compatible databases. It provides a common query language allowing a user toquery many services at the same time. With each one returning the result in the same XSAMS format,the user can use the same tools to analyze them. The VAMDC-compatible databases are called VAMDCnodes. They must be compatible with the standards. In order to make their implementation simpler,data producers can use the VAMDC node-software [38], a python middleware that can be connectedto the database, taking care of understanding the request and generating the XSAMS documents.All the VAMDC nodes are registered into a service registry. It stores the capabilities of each node(which are the queryable parameters and returned quantities). It can be searched by a user but alsoby software, which can discover existing services according to the quantities it returns for example.The VAMDC registry relies on the standard defined by the International Virtual Observatory Alliancefor the implementation of resource registries [39].
4.2. Implementation on the Databases
As implementing standards is a tedious process, VAMDC provides a middleware application,called the node software, taking care of it. This python application, based on the Django framework,is able to understand the user queries, translate them into SQL so that the underlying database canexecute them and generate a XSAMS document from the results. The main condition to be able to usethe node software is that the database relies on a relational database management system, such asMySQL, MariaDB or PostgreSQL.
Since its origin, STARK-B relied on MySQL. Integrating it into VAMDC implied few modificationsin its schema, mainly adding new mandatory information that was not available at the time (like theInchI/InchIKey description of chemical species [40]).
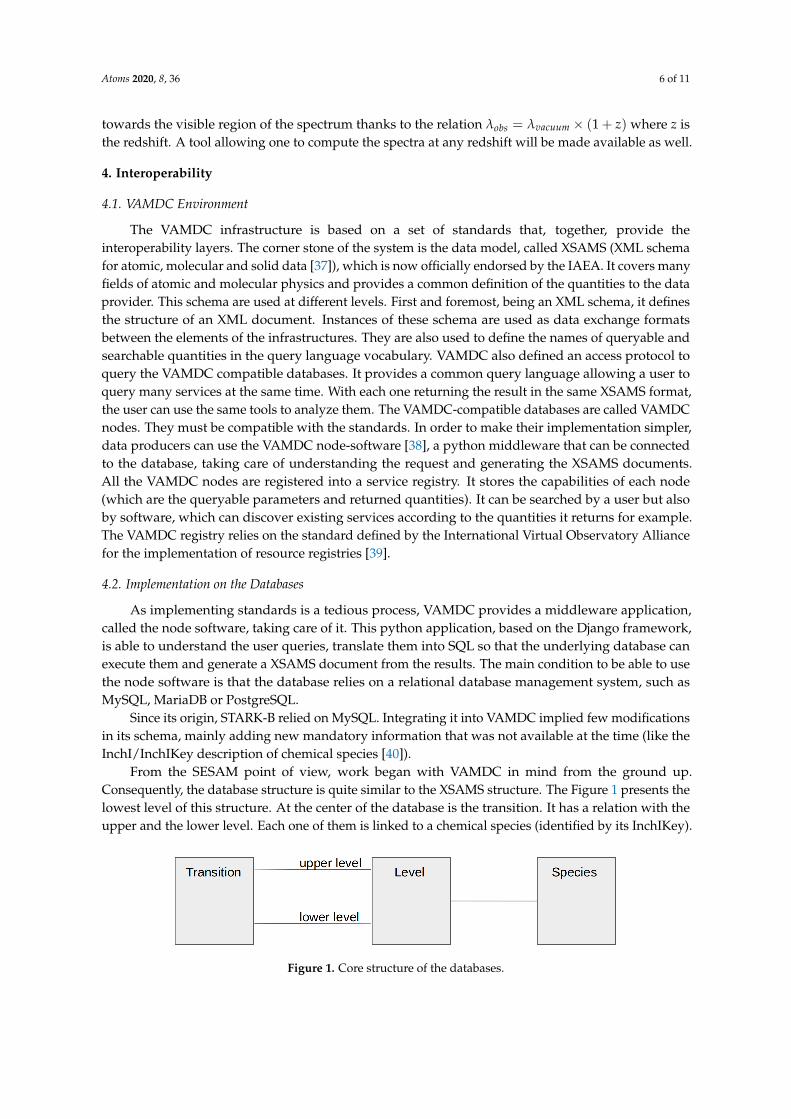
From the SESAM point of view, work began with VAMDC in mind from the ground up.Consequently, the database structure is quite similar to the XSAMS structure. The Figure 1 presents thelowest level of this structure. At the center of the database is the transition. It has a relation with theupper and the lower level. Each one of them is linked to a chemical species (identified by its InchIKey).
Version July 8, 2020 submitted to Atoms 6 of 12
towards the visible region of the spectrum thanks to the relation λobs = λvacuum × (1 + z) where z is207
the redshift. A tool allowing to compute the spectra at any redshift will be made available as well.208
4. Interoperability209
4.1. VAMDC environment210
The VAMDC infrastructure is based on a set of standards that, together, provide the211
interoperability layers. The corner stone of the system is the data model, called XSAMS (XML Schema212
for Atomic, Molecular and Solid Data [35] ), now officially endorsed by the IAEA. It covers many213
fields of atomic and molecular physics and provide a common definition of the quantities to the data214
provider. This schema is used at different levels. First and foremost, being an XML Schema it defines215
the structure of an XML document. Instances of these schema are used as a data exchange format216
between the elements of the infrastructures. It is also used to define the names of queryables and217
searchables quantities in the query language vocabulary. VAMDC also defined an access protocol to218
query the VAMDC compatible databases. It provides a common query language allowing a user to219
query many services at the same time. Each one returning the result in the same XSAMS format, the220
user can use the same tools to analyze them. The VAMDC compatible databases are called VAMDC221
nodes. They must be compatible with the standards. In order to make their implementation simpler,222
data producers can use the VAMDC node-software [36], a python middleware that can be connected223
to the database, taking care of understanding the request and generating the XSAMS documents. All224
the VAMDC nodes are registered into a service registry. It stores the capabilities of each node (what225
are the queryable parameters and returned quantities). It can be searched by a user but also by a226
software, that can discover existing services according to the quantities it returns for example. The227
VAMDC registry relies on the standard defined by the International Virtual Observatory Alliance for228
the implementation of resource registries [37].229
4.2. Implementation on the databases230
As implementing standards is a tedious process, VAMDC provides a middleware application,231
called the node software, taking care of it. This python application, based on the Django framework,232
is able to understand the user queries, translate them into SQL so that the underlying database can233
execute it and generate a XSAMS document from the result. The main condition to be able to use the234
node software is that the database relies on a relational database management system, like MySQL,235
MariaDB or PostgreSQL.236
Since its origin, STARK-B relied on MySQL. Integrating it into VAMDC implied few modifications237
in its schema , mainly adding new mandatory informations that were not available at the time (like238
the InchI/InchIKey description of chemical species [38]).239
From the SESAM point of view, work began with VAMDC in mind from the ground up.240
Consequently the database structure is quite similar to the XSAMS structure. The figure 1 presents the241
lowest level of this structure. At the center of the database is the transition. It has a relation with the242
upper and the lower level. Each one of them is linked to a chemical species (identified by its InchIKey).243
Figure 1. Core structure of the databasesFigure 1. Core structure of the databases.
Atoms 2020, 8, 36 7 of 11
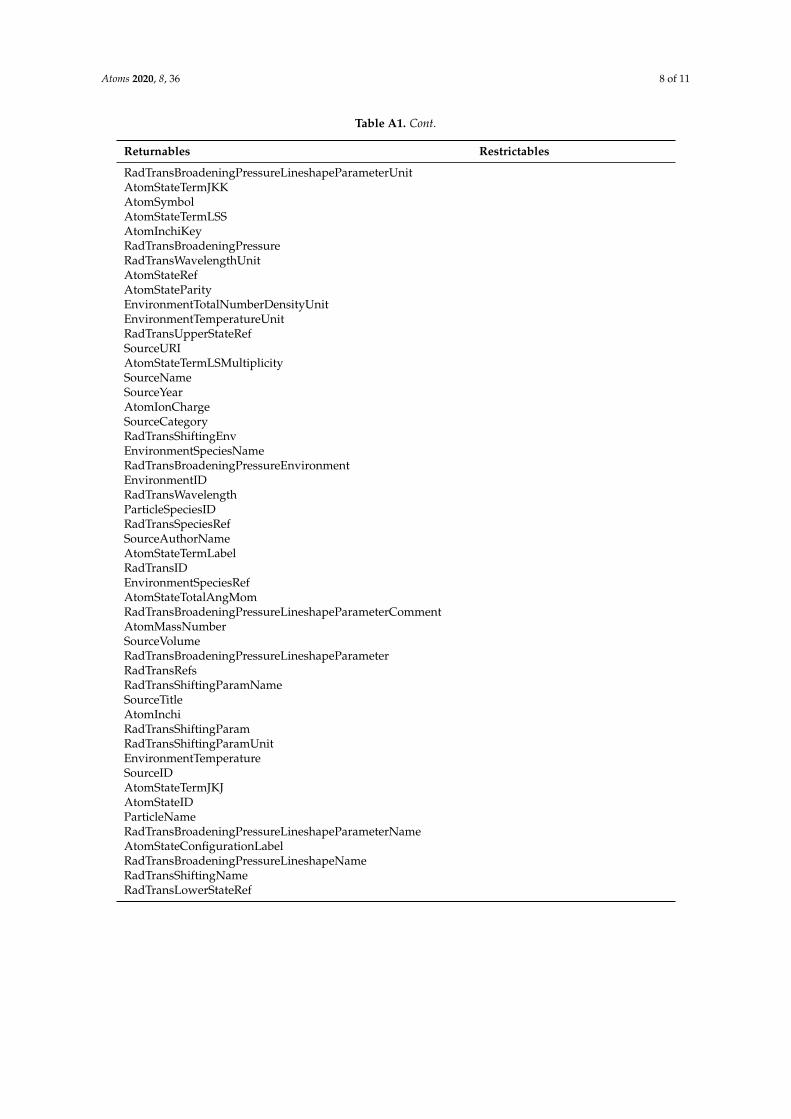
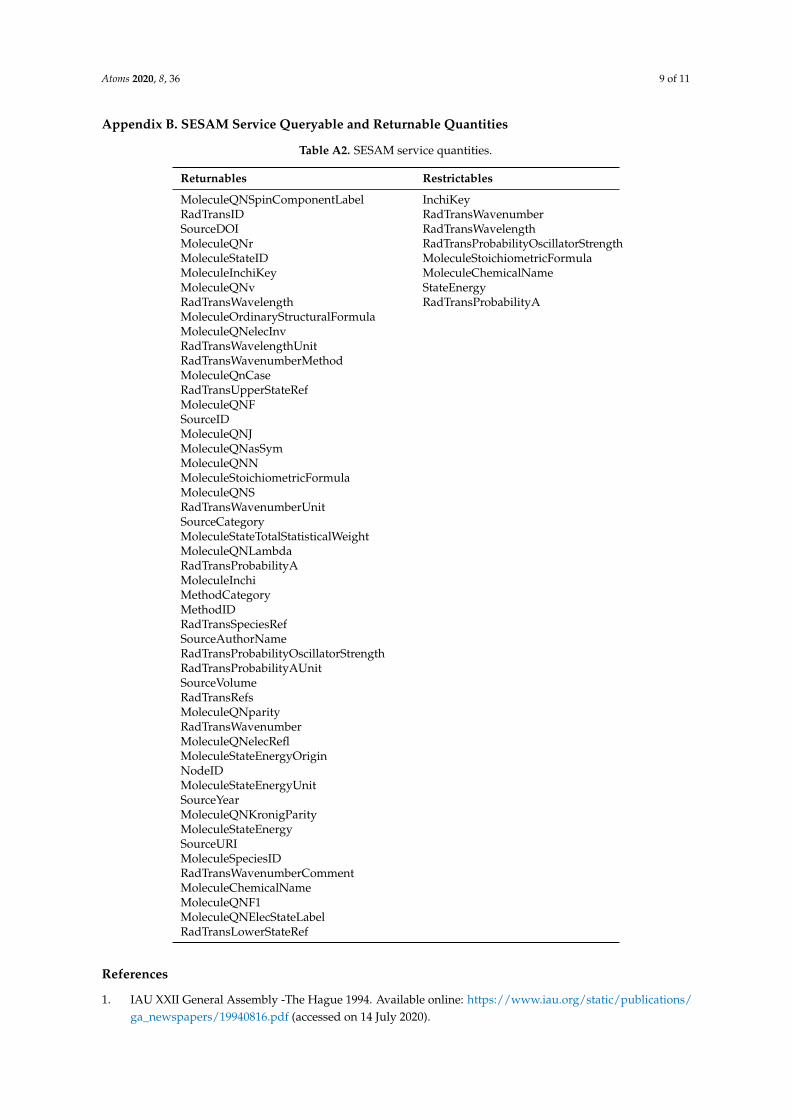
The other parts of the databases have nothing in common as they deal with very different data.Once it has been properly configured, the node software execute the queries against the content ofthose tables. In Appendices A and B, tables listing the queryable and returned quantities for bothnodes are available.
The configuration of the middleware consists of declaring in a file which columns of the databasecorrespond to standardized one in the XSAMS data model. It can be done in a matter of hours whichensures a quick deployment, if the data are already stored in a relational database system.
Author Contributions: E.R. coordinated the full paper. The draft of Section 2 was prepared by S.S.-B. and M.S.D.;that of Section 3 by E.R. and H.A.; and that of Section 4 by N.M. All authors have read and agreed to the publishedversion of the manuscript.
Funding: This research received support from VAMDC. VAMDC is funded under the Combination ofCollaborative Projects and Coordination and Support Actions Funding Scheme of The Seventh FrameworkProgram. Call topic: INFRA-2008-1.2.2 Scientific Data Infrastructure. Grant agreement number: 239108.
Acknowledgments: This work has also been supported by the Paris Observatory (LERMA and ParisAstronomical Data Centre (PADC)), the CNRS and the Programme National de Physique Stellaire (INSU-CNRS).The cooperation agreements between Tunisia (DGRS) and France (CNRS) (project code 09/R 13.03, number22637) are also acknowledged. The support of IAEA is gratefully acknowledged. The support of Ministry ofEducation, Science and Technological Development of the Republic of Serbia through projects 176002 and III44022is also acknowledged.
Conflicts of Interest: The authors declare no conflict of interest. The funders had no role in the design of thestudy; in the collection, analyses or interpretation of data; in the writing of the manuscript, or in the decision topublish the results.
Abbreviations
The following abbreviations are used in this manuscript:
ASCII American Standard Code for Information InterchangeFUSE Far Ultraviolet Space ExplorerGHRS Goddard High Resolution SpectrographHST Hubble Space TelescopeITER the Way in latinIUE International Ultraviolet ExplorerLERMA Laboratoire d’Etudes du Rayonnement et de la Matière en AstrophysiqueLURE Laboratoire d’Utilisation du Rayonnement ElectromagnétiqueMSE Modified Semi- Empirical codeNIF National Ignition FacilitySCP Semi-Classical Perturbation codeSESAM SpEctroScopic Atomic and Molecular databaseVAMDC Virtual Atomic and Molecular Data CenterVUV Vacuum Ultra VioletWEST Tungsten (W) Environment in Steady-state TokamakXML Extensible Markup LanguageXSAMS XML Schema for Atomic, Molecular and Solid Data
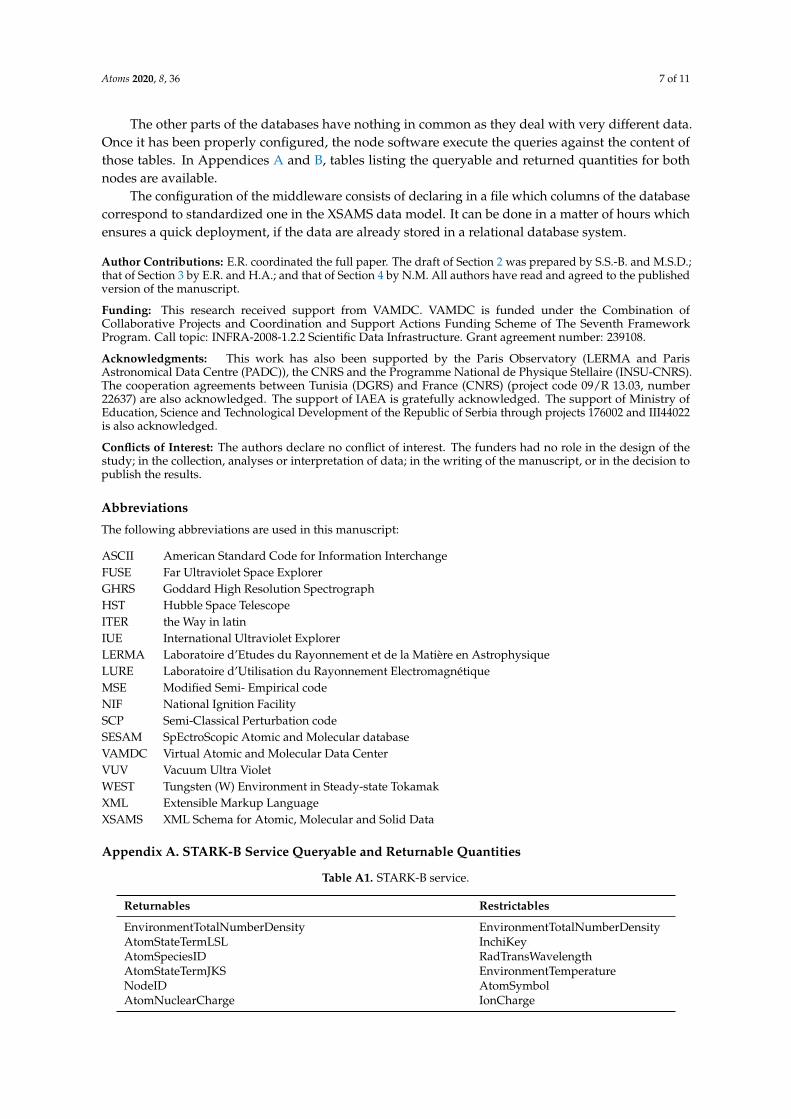
Appendix A. STARK-B Service Queryable and Returnable Quantities
Table A1. STARK-B service.
Returnables Restrictables
EnvironmentTotalNumberDensity EnvironmentTotalNumberDensityAtomStateTermLSL InchiKeyAtomSpeciesID RadTransWavelengthAtomStateTermJKS EnvironmentTemperatureNodeID AtomSymbolAtomNuclearCharge IonCharge
Atoms 2020, 8, 36 8 of 11
Table A1. Cont.
Returnables Restrictables
RadTransBroadeningPressureLineshapeParameterUnitAtomStateTermJKKAtomSymbolAtomStateTermLSSAtomInchiKeyRadTransBroadeningPressureRadTransWavelengthUnitAtomStateRefAtomStateParityEnvironmentTotalNumberDensityUnitEnvironmentTemperatureUnitRadTransUpperStateRefSourceURIAtomStateTermLSMultiplicitySourceNameSourceYearAtomIonChargeSourceCategoryRadTransShiftingEnvEnvironmentSpeciesNameRadTransBroadeningPressureEnvironmentEnvironmentIDRadTransWavelengthParticleSpeciesIDRadTransSpeciesRefSourceAuthorNameAtomStateTermLabelRadTransIDEnvironmentSpeciesRefAtomStateTotalAngMomRadTransBroadeningPressureLineshapeParameterCommentAtomMassNumberSourceVolumeRadTransBroadeningPressureLineshapeParameterRadTransRefsRadTransShiftingParamNameSourceTitleAtomInchiRadTransShiftingParamRadTransShiftingParamUnitEnvironmentTemperatureSourceIDAtomStateTermJKJAtomStateIDParticleNameRadTransBroadeningPressureLineshapeParameterNameAtomStateConfigurationLabelRadTransBroadeningPressureLineshapeNameRadTransShiftingNameRadTransLowerStateRef
Atoms 2020, 8, 36 9 of 11
Appendix B. SESAM Service Queryable and Returnable Quantities
Table A2. SESAM service quantities.
Returnables Restrictables
MoleculeQNSpinComponentLabel InchiKeyRadTransID RadTransWavenumberSourceDOI RadTransWavelengthMoleculeQNr RadTransProbabilityOscillatorStrengthMoleculeStateID MoleculeStoichiometricFormulaMoleculeInchiKey MoleculeChemicalNameMoleculeQNv StateEnergyRadTransWavelength RadTransProbabilityAMoleculeOrdinaryStructuralFormulaMoleculeQNelecInvRadTransWavelengthUnitRadTransWavenumberMethodMoleculeQnCaseRadTransUpperStateRefMoleculeQNFSourceIDMoleculeQNJMoleculeQNasSymMoleculeQNNMoleculeStoichiometricFormulaMoleculeQNSRadTransWavenumberUnitSourceCategoryMoleculeStateTotalStatisticalWeightMoleculeQNLambdaRadTransProbabilityAMoleculeInchiMethodCategoryMethodIDRadTransSpeciesRefSourceAuthorNameRadTransProbabilityOscillatorStrengthRadTransProbabilityAUnitSourceVolumeRadTransRefsMoleculeQNparityRadTransWavenumberMoleculeQNelecReflMoleculeStateEnergyOriginNodeIDMoleculeStateEnergyUnitSourceYearMoleculeQNKronigParityMoleculeStateEnergySourceURIMoleculeSpeciesIDRadTransWavenumberCommentMoleculeChemicalNameMoleculeQNF1MoleculeQNElecStateLabelRadTransLowerStateRef
References
1. IAU XXII General Assembly -The Hague 1994. Available online: https://www.iau.org/static/publications/ga_newspapers/19940816.pdf (accessed on 14 July 2020).
Atoms 2020, 8, 36 10 of 11
2. Sahal-Bréchot, S.; Dimitrijevic, M.S.; Ben Nessib, N. Widths and shifts of isolated lines of neutral and ionizedatoms perturbed by collisions with electrons and ions: An outline of the semiclassical perturbation (SCP)method and of the approximations used for the calculations. Atoms 2014, 2, 225–252. [CrossRef]
3. Alexiou, S.; Dimitrijevic, M.; Sahal-Bréchot, S.; Stambulchik, E.; Duan, B.; González, H.; Gigosos, M. TheSecond Workshop on Lineshape Code Comparison: Isolated Lines. Atoms 2014, 2, 157–177. [CrossRef]
4. Sahal-Bréchot, S.; Stambulchik, E.; Dimitrijevic, M.S.; Alexiou, S.; Duan,B.; Bommier, V. The Third and FourthWorkshops on Spectral Line Shapes in Plasma Code Comparison: Isolated Lines. Atoms 2018, 6, 30–43.
5. Elabidi, H.; Sahal-Bréchot, S.; Ben Nessib, N. Quantum Stark broadening of 3s-3p spectral lines in Li-likeions; Z-scaling and comparison with semi-classical perturbation theory. Eur. Phys. J. D 2009, 54, 51–64.[CrossRef]
6. STARK-B. Available online: http://stark-b.obspm.fr (accessed on 15 April 2020).7. Milovanovic, N.; Popovic, L.C.; Dimitrijevic, M.S. BELDATA—The Database of Belgrade
Astronomical Observatory. Balt. Astron. 2000, 9, 595–598. Available online: https://molat.obspm.fr/(accessed on 8 July 2020). [CrossRef]
8. SERBIAN VIRTUAL OBSERVATORY. Available online: http://servo.aob.rs// (accessed on 15 April 2020).9. Scientific Data Bases of the Paris Observatory. Available online: https://www.observatoiredeparis.psl.eu/
-bases-de-donnees-scientifiques-.html?lang=en (accessed on 8 July 2020).10. MOLAT. Available online: https://molat.obspm.fr/ (accessed on 8 July 2020).11. VAMDC Consortium. Available online: http://www.vamdc.eu/ (accessed on 15 April 2020).12. VAMDC Portal. Available online: https://portal.vamdc.eu (accessed on 15 April 2020).13. Dimitrijevic, M.S.; Konjevic, N. Stark widths of doubly and triply-ionized atoms lines. J. Quant. Spectrosc.
Radiat. Transf. 1980, 24, 451–549. [CrossRef]14. Dimitrijevic, M.S.; Kršljanin, V. Electron-impact shifts of ion lines: Modified semiempirical approach.
Astron. Astrophys. 1986, 165, 269–274.15. Dimitrijevic, M.S.; Popovic, L.C. Modified SemiEmpirical Method. J. Appl. Spectr. 2001, 68, 893–901.
[CrossRef]16. Sahal-Bréchot, S.; Dimitrijevic, M.S.; Ben Nessib, N. Comparison and comments on electron and ion impact
profiles on spectral lines. Balt. Astron. 2011, 20, 523–530. [CrossRef]17. SESAM. Available online: https://sesam.obspm.fr/ (accessed on 14 July 2020).18. Eidelsberg, M.; Rostas, F. An Atlas of the Intersystem Transitions of CO. Astrophys. J. Suppl. 2003, 145, 89–109.
[CrossRef]19. Eidelsberg, M.; Viala, Y.; Rostas, F.; Benayoun, J.J. Atlas of the absorption/dissociation spectra of CO and its
isotopes between 91.2 nm and 115.2 nm. Astron. Astrophys. Suppl. Ser. 1991, 90, 231–282.20. Abgrall, H.; Launay, F.; Roueff, E.; Roncin, J.Y. Effect of rotational coupling on emission probabilities
of Lyman and Werner band systems of the vacuum ultraviolet spectrum of H2. J. Chem. Phys. 1987,87, 2036–2044. [CrossRef]
21. Abgrall, H.; Roueff, E.; Liu, X.; Shemansky, D.E. The Emission Continuum of Electron-excited MolecularHydrogen. Astrophys. J. 1997, 481, 557–566. [CrossRef]
22. Rachford, B.L.; Snow, T.P.; Tumlinson, J.; Shull, J.M.; Roueff, E.; Andre, M.; Desert, J.M.; Ferlet, R.;Vidal-Madjar, A.; York, D.G. Far Ultraviolet Spectroscopic Explorer Observations of Molecular Hydrogen inTranslucent Interstellar Clouds. II. The Line of Sight toward HD 110432. Astrophys. J. 2001, 555, 839–849.[CrossRef]
23. Ingleby, L.; Calvet, N.; Bergin, E.; Yerasi, A.; Espaillat, C.; Herczeg, G.; Roueff, E.; Abgrall, H.; Hernández,J.; Briceño, C.; et al. Far-Ultraviolet H2 Emission from Circumstellar Disks. Astrophys. J. Lett. 2009,703, L137–L141. [CrossRef]
24. Ingleby, L.; Calvet, N.; Bergin, E.; Herczeg, G.; Brown, A.; Alexander, R.; Edwards, S.; Espaillat, C.;France, K.; Gregory, S.G.; et al. Near-ultraviolet Excess in Slowly Accreting T Tauri Stars: Limits Imposed byChromospheric Emission. Astrophys. J. 2011, 743, 105. [CrossRef]
25. France, K.; Roueff, E.; Abgrall, H. The 1600 Å Emission Bump in Protoplanetary Disks: A Spectral Signatureof H2O Dissociation. Astrophys. J. 2017, 844, 169. [CrossRef]
26. Barthélemy, M.; Lamy, L.; Menager, H.; Schulik, M.; Bernard, D.; Abgrall, H.; Roueff, E.; Cessateur, G.;Prange, R.; Lilensten, J. Dayglow and auroral emissions of Uranus in H2 FUV bands. Icarus 2014, 239, 160–167.[CrossRef]
Atoms 2020, 8, 36 11 of 11
27. Gustin, J.; Feldman, P.D.; Gérard, J.C.; Grodent, D.; Vidal-Madjar, A.; Ben Jaffel, L.; Desert, J.M.; Moos, H.W.;Sahnow, D.J.; Weaver, H.A.; et al. Jovian auroral spectroscopy with FUSE: Analysis of self-absorption andimplications for electron precipitation. Icarus 2004, 171, 336–355. [CrossRef]
28. Abgrall, H.; Roueff, E.; Launay, F.; Roncin, J.Y. The B’1Σu+ - X1Σg
+ and D1Πu+ - X1Σg
+ band systems ofmolecular hydrogen. Can. J. Phys. 1994, 72, 856. [CrossRef]
29. Dabrowski, I. The Lyman and Werner bands of H2. Can. J. Phys. 1984, 62, 1639. [CrossRef]30. Wolniewicz, L.; Dressler, K. The B1Σ+
u , B’1Σ+u , C1Πu, and D 1Πu states of the H2 molecule. Matrix elements
of angular and radial nonadiabatic coupling and improved ab initio potential energy curves. J. Chem. 1988,88, 3861–3870. [CrossRef]
31. XSAMS. Available online: https://www-amdis.iaea.org/xsams/docu/xsams-0.1.1.pdf (accessed on14 July 2020).
32. Komasa, J.; Puchalski, M.; Czachorowski, P.; Łach, G.; Pachucki, K. Rovibrational energy levels of thehydrogen molecule through nonadiabatic perturbation theory. Phys. Rev. A 2019, 100, 032519. [CrossRef]
33. Glass-Maujean, M.; Jungen, C.; Dickenson, G.D.; Ubachs, W.; de Oliveira, N.; Joyeux, D.; Nahon, L.VUV Fourier-Transform absorption study of the npπ 1Π−u , v, N ←X1Σ+
g , v” = 0, N” transitions in D2.J. Mol. Spectrosc. 2015, 315, 147–154. [CrossRef]
34. Niu, M.L.; Heays, A.N.; Jones, S.; Salumbides, E.J.; van Dishoeck, E.F.; De Oliveira, N.; Nahon, L.; Ubachs, W.VUV-synchrotron absorption studies of N2 and CO at 900 K. J. Mol. Spectrosc. 2015, 315, 137–146. [CrossRef]
35. Daprà, M.; Niu, M.L.; Salumbides, E.J.; Murphy, M.T.; Ubachs, W. Constraint on a Cosmological Variation inthe Proton-to-electron Mass Ratio from Electronic CO Absorption. Astrophys. J. 2016, 826, 192. [CrossRef]
36. Ubachs, W.; Salumbides, E.J.; Murphy, M.T.; Abgrall, H.; Roueff, E. H2/HD molecular data for analysis ofquasar spectra in search of varying constants. Astron. Astrophys. 2019, 622, A127. [CrossRef]
37. VAMDC XSAMS Standard Documentation. Available online: http://vamdc.eu/documents/standards/dataModel/vamdcxsams (accessed on 14 July 2020).
38. VAMDC Node Software Documentation. Available online: http://www.vamdc.eu/documents/nodesoftware/intro.html (accessed on 14 July 2020).
39. IVOA Registry 1.0. Available online: http://www.ivoa.net/documents/RegistryInterface/20091104/(accessed on 14 July 2020).
40. IUPAC INCHI Website. Available online: https://iupac.org/who-we-are/divisions/division-details/inchi/(accessed on 14 July 2020).
c© 2020 by the authors. Licensee MDPI, Basel, Switzerland. This article is an open accessarticle distributed under the terms and conditions of the Creative Commons Attribution(CC BY) license (http://creativecommons.org/licenses/by/4.0/).