the role of transmural ventricular heterogeneities in cardiac vulnerability to electric shocks
TRANSCRIPT
The role of transmural ventricular heterogeneities in cardiacvulnerability to electric shocks
Thushka Maharaja,*, Robert Blakeb, Natalia Trayanovac, David Gavaghana, and BlancaRodriguezaaComputing Laboratory, University of Oxford, Oxford, OX1 3PG, UKbDepartment of Biomedical Engineering, Tulane University, New Orleans, LA 70118, USAcDepartment of Biomedical Engineering and Institute for Computational Medicine, Johns HopkinsUniversity, Baltimore, MD 21218, USA
AbstractTransmural electrophysiological heterogeneities have been shown to contribute to arrhythmiainduction in the heart; however, their role in defibrillation failure has never been examined. The goalof this study is to investigate how transmural heterogeneities in ionic currents and gap-junctionalcoupling contribute to arrhythmia generation following defibrillation strength shocks. This studyused a 3D anatomically realistic bidomain model of the rabbit ventricles. Transmural heterogeneityin ionic currents and reduced sub-epicardial intercellular coupling were incorporated based onexperimental data. The ventricles were paced apically, and truncated-exponential monophasic shocksof varying strength and timing were applied via large external electrodes. Simulations demonstratethat inclusion of transmural heterogeneity in ionic currents results in an increase in vulnerability toshocks, reflected in the increased upper limit of vulnerability, ULV, and the enlarged vulnerablewindow, VW. These changes in vulnerability stem from increased post-shock dispersion inrepolarisation as it increases the likelihood of establishment of re-entrant circuits. In contrast, reducedsub-epicardial coupling results in decrease in both ULV and VW. This decrease is caused by alteredvirtual electrode polarisation around the region of sub-epicardal uncoupling, and specifically, by theincrease in (1) the amount of positively polarised myocardium at shock-end and (2) the spatial extentof post-shock wavefronts.
KeywordsTransmural electrophysiological heterogeneities; Vulnerability to electric shocks; Bidomainsimulations
1. IntroductionElectrical defibrillation by the timely application of a strong electric shock to the heart is theonly effective therapy against lethal arrhythmias. However, the mechanisms behinddefibrillation failure still remain incompletely understood. A large body of experimentalresearch has demonstrated that defibrillation and vulnerability to electric shocks are stronglylinked as they are driven by the same underlying factors (Chen et al., 1986, 1991; Malkin etal., 1995). As a result, the upper limit of vulnerability (ULV), which is defined as the highest
© 2007 Elsevier Ltd. All rights reserved.*Corresponding author. Fax: +44 1865 283531. [email protected] (T. Maharaj)..
NIH Public AccessAuthor ManuscriptProg Biophys Mol Biol. Author manuscript; available in PMC 2010 February 12.
Published in final edited form as:Prog Biophys Mol Biol. 2008 ; 96(1-3): 321. doi:10.1016/j.pbiomolbio.2007.07.017.
NIH
-PA Author Manuscript
NIH
-PA Author Manuscript
NIH
-PA Author Manuscript
shock strength (SS) above which no arrhythmia is induced, can be used to approximate thedefibrillation threshold as part of the clinical procedure of programming the implantablecardioverter/defibrillators.
Recently, the use of an anatomically based computational model of stimulation/defibrillationhas provided significant insight into the mechanisms of cardiac vulnerability to electric shocksand defibrillation in normal (Trayanova et al., 2002; Aguel et al., 2003; Rodriguez et al.,2005), and diseased hearts (Rodriguez et al., 2004). These simulations have suppliedinformation with high spatial and temporal resolution regarding the shock-induced electricalevents within the depth of the myocardial wall, not accessible by current experimentaltechniques. However, one of the main limitations of these computational studies has been thefact that they considered cardiac tissue to be both electrophysiologically and structurallyhomogeneous.
Experimental studies of isolated ventricular tissue (Antzelevitch et al., 1999a, b; Idriss andWolf, 2004), and of single myocytes isolated from various locations across the ventricular wall(McIntosh et al., 2000) have demonstrated that ionic properties change in the depth of theventricular wall. In particular, three layers of functionally different cell types have beenidentified, namely the epicardial, endocardial, and midmyocardial layers (Ueda et al., 2004).Transmural dispersion in action potential duration (APD), which results from variations incellular ionic properties, is known to modulate the arrhythmogenic substrate (Kuo et al.,1983; Laurita et al., 1998; Antzelevitch and Fish, 2001) and could thus play a role in theoutcome of anti-arrhythmia therapy.
Furthermore, experimental studies (Drouin et al., 1995; Yan et al., 1998a; Poelzing et al.,2004; Yamada et al., 2004) have documented heterogeneity in intercellular gap-junctionalcoupling within the sub-epicardium of human, canine, and rodent ventricles. Reduced gap-junctional coupling causes slow conduction and unidirectional block leading to theestablishment of re-entry (Peters et al., 1997). However, other studies (Huelsing et al., 2000)have suggested that reduced intercellular communication may be cardioprotective bypreventing impulse propagation between midmyocardium and epicardium. The role of gap-junctional coupling heterogeneity in arrhythmogenesis remains unclear; so does itscontribution to the success or failure of a defibrillation shock.
The goal of this study is to provide insight into the contribution of transmural heterogeneitiesin ionic currents and in gap-junctional coupling to the mechanisms of defibrillation failure.This is achieved by investigating the mechanisms of cardiac vulnerability to electric shocksusing an anatomically accurate three-dimensional (3D) rabbit ventricular model (Vetter andMcCulloch, 1998; Trayanova et al., 2002), which for the first time incorporates transmuralheterogeneities in electrophysiological properties and gap-junctional coupling.
In understanding the mechanisms of defibrillation failure in the heterogeneous heart, ofparticular importance is knowledge of how the transmural heterogeneity in ionic currents andthe reduced sub-epicardial coupling interact with the electrophysiological heterogeneityimposed by the application of a defibrillation shock, modulating virtual electrode polarisation(VEP) within the depths of the ventricular wall as well as the characteristics of the ensuingpost-shock wavefronts. We hypothesise that transmural heterogeneities in both ionic propertiesand intercellular coupling alter the outcome of the shock by affecting the spatial extent ofpositive VEP and the characteristics of post-shock wavefronts. This, in turn, alters the globalvulnerability parameters, such as the duration of the vulnerable window (VW) and the valueof the ULV.
Maharaj et al. Page 2
Prog Biophys Mol Biol. Author manuscript; available in PMC 2010 February 12.
NIH
-PA Author Manuscript
NIH
-PA Author Manuscript
NIH
-PA Author Manuscript
2. Methods2.1. Computational model
This study used a 3D geometrically accurate rabbit ventricular model (Vetter and McCulloch,1998) that incorporated realistic fibre architecture and representation of the blood within theventricular cavities and the perfusing bath (Trayanova et al., 2002). The finite element meshconsisted of 829 021 tetrahedral elements, with a spatial resolution of 500 μm. The bidomainapproach was used to simulate electrical activity in the myocardium, where a semi-implicitfinite element approach was used to solve for the potentials, as previously described (Easonand Malkin, 2000). The time step was 5 μs during the application of external shocks, and 10μs during propagation before and after shock application. The bidomain conductivities usedin the rabbit ventricular model are based on data measured by Clerc (Clerc, 1976), as describedpreviously (Eason and Malkin, 2000, Trayanova et al., 2002).
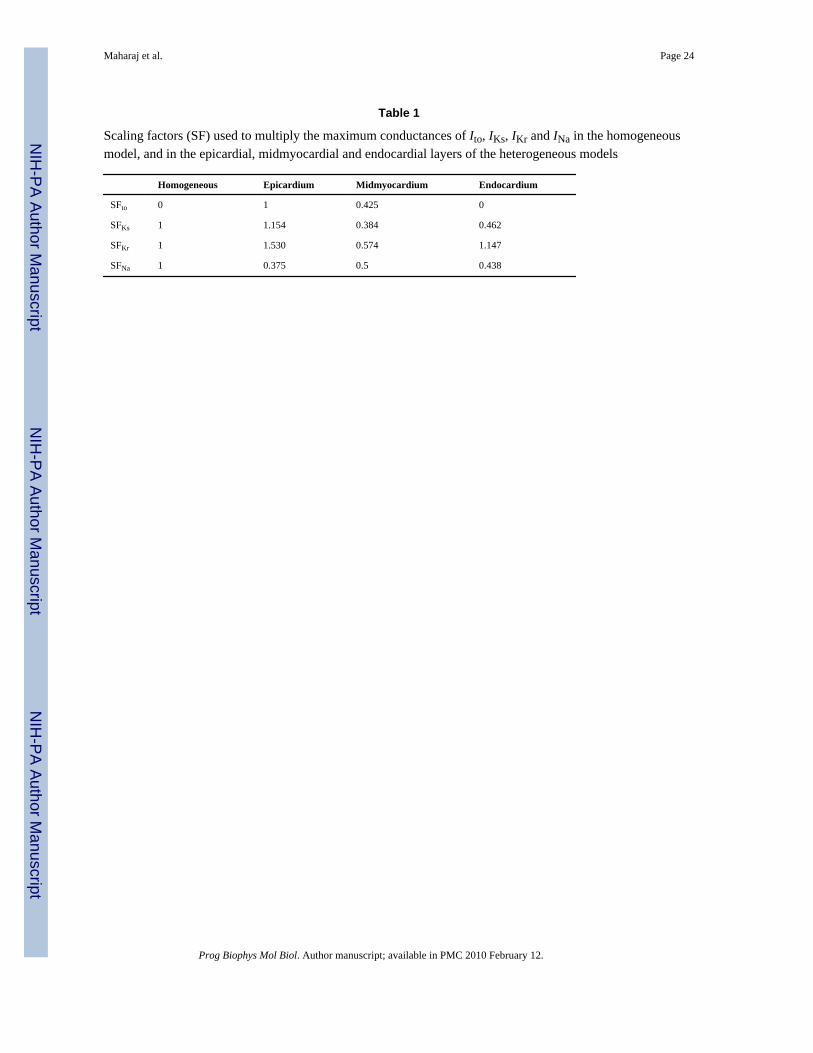
Membrane kinetics were represented by the Luo–Rudy dynamic model (Luo and Rudy,1994) augmented for defibrillation (Ashihara and Trayanova, 2004). Transmural ventricularheterogeneities in the transient outward potassium current (Ito), in the slow and rapid delayedrectifier potassium currents (IKs, IKr), and in the sodium (INa) current were incorporated in themodel based on experimental data (McIntosh et al., 1998, 2000; Dumaine et al., 1999; Xu etal., 2001), as done previously (Saucerman et al., 2004). The above are the main currentsresponsible for transmural heterogeneities in action potential shape and duration. The spatialdistribution of transmural heterogeneity in ionic currents was incorporated using endocardial,epicardial and midmyocardial layers with relative thickness of 3:3:2 (Saucerman et al.,2004). Each myocardial node was assigned endocardial, midmyocardial or epicardialmembrane kinetics, depending on its position within the ventricular wall. The maximumconductances for Ito, IKs, IKr and INa in each layer were multiplied by scaling factors SFto,SFKs, SFKr and SFNa, as listed in Table 1. A five-fold decrease in intercellular coupling wasintroduced within the sub-epicardium, i.e. at the border between the midmyocardial andepicardial layers, consistent with experimental data (Drouin et al., 1995; Yan et al., 1998a;Poelzing et al., 2004; Yamada et al., 2004).
2.2. Protocol for determining the vulnerability areaThe protocol used for determining the vulnerability area (VA), i.e. the area on a 2D grid thatencompasses episodes of re-entrant arrhythmia induction by the shock, was described in aprevious paper (Rodriguez et al., 2004). In brief, the rabbit ventricular model was paced at theapex at a basic cycle length of 250 ms, to ensure that the ULV approximated the defibrillationthreshold (Malkin et al., 1995). After seven paced beats, 8 ms truncated-exponentialmonophasic shocks of strength 3.81–38.09 V/cm were applied over a range of couplingintervals, CIs (100–200 ms) via large planar electrodes located at the vertical boundaries ofthe perfusing bath (Fig. 1). The electrode near the right ventricle (RV) was the cathode, andthe one near the left ventricle (LV) was the grounding electrode. CI was defined as the timeinterval between the onset of the last pacing stimulus and the onset of the shock. SS referredto the leading-edge value of the electric field between electrodes. The VA was constructed forthree cases: (1) homogeneous ventricular model, i.e. the same membrane kinetics and thus thesame action potential shape and duration was considered at every node in the ventricular mesh;(2) heterogeneous ventricular model, i.e. epicardial–endocardial heterogeneity in ionic currentswas implemented and (3) heterogeneous ventricular model that also incorporated sub-epicardial uncoupling.
An arrhythmia was considered sustained if two or more beats were induced after the applicationof the shock. The VW was defined as the range of CIs for which a sustained arrhythmia ensuedfollowing the shock. The ULV was the highest SS above which no arrhythmia was induced.
Maharaj et al. Page 3
Prog Biophys Mol Biol. Author manuscript; available in PMC 2010 February 12.
NIH
-PA Author Manuscript
NIH
-PA Author Manuscript
NIH
-PA Author Manuscript
2.3. Data analysisTo analyse the effect of incorporating heterogeneities in ionic currents and sub-epicardialcoupling in ventricular electrical behaviour, activation and repolarisation times were quantifiedat each ventricular node. At each node, local activation time was calculated following the 7thpacing stimulus as the interval between the stimulus onset and the time of maximum actionpotential upstroke velocity. Local repolarisation time was calculated as the interval betweenthe onset of the seventh stimulus and the time at which the node was 70% repolarised. APDwas the difference between activation and repolarisation times. Local activation andrepolarisation times and APD were measured during the 7th paced beat, at a basic cycle lengthof 250 ms. In addition, to better study arrhythmogenesis in the rabbit ventricles, the dynamicsof the scroll-wave filaments, the organising centres of re-entrant activity, was analysed usingan algorithm published previously (Trayanova et al., 2002; Larson et al., 2003). Pseudo-electrocardiograms (ECG) (Plonsey and Barr, 2000), were computed at a node marked E2 inFig. 1, in a manner previously described by Gima and Rudy (2002), and using a three-pointGauss quadrature scheme for numerical integration over the finite element tetrahedral mesh.
3. Results3.1. Electrical activity following apical stimulation
Fig. 2A presents the time course of an action potential computed using the ionic modelimplemented in the homogeneous ventricular model, while Fig. 2B presents the time courseof action potentials computed using single cell models of epicardial (dashed line),midmyocardial (solid line) and endocardial (dot-dashed line) cells, with properties describedin the Methods section. For the basic cycle length of 250 ms used in our study, APD is 110 msin the homogeneous model, while it is 108, 140 and 131 ms in the epicardial, midmyocardialand endocardial cells, respectively. The epicardial cell has the shortest APD and themidmyocardial the longest, which is consistent with previous observations (Viswanathan etal., 1999;McIntosh et al., 2000;Gima and Rudy, 2002;Aslanidi et al., 2005;Sampson andHenriquez, 2005). Note also that the midmyocardial and epicardial action potentials arecharacterised with a notch that follows the upstroke; it is due to Ito (McIntosh et al., 2000).
Fig. 3 presents activation and repolarisation maps (rows I and II), APD maps and actionpotential traces (row III), and pseudo-ECGs (row IV) following the application of an apicalpacing stimulus to the homogeneous ventricles (A), the heterogeneous ventricles (B), and theheterogeneous ventricles with sub-epicardial uncoupling (C). In all three models, activationproceeds from apex to base with the longest local activation time being 85 ms in thehomogeneous model, 81 ms in the heterogeneous model, and 83 ms in the heterogeneous modelwith sub-epicardial uncoupling. This represents a 4.7% and 2.4% increase in averageconduction velocity, with respect to the homogeneous model, in the heterogeneous model andin the heterogeneous model with sub-epicardial uncoupling, respectively. The increase inaverage conduction velocity might be due to differences in INa.
The activation maps presented in Fig. 3, panel I, reveal that, in the three models, local activationtimes are affected by fibre orientation, and that transmural dispersion in activation times ispresent in the ventricles even in the homogeneous model, in which membrane kinetics are thesame at every node (Fig. 3A, I). Fig. 3B and C, panel I, show that in the two heterogeneousmodels activation proceeds slower in the midmyocardial region than in the endocardial orepicardial regions (Fig. 3B and C, panel I, transmural views).
As shown in Fig. 3A, in the homogeneous model, the repolarisation sequence follows theactivation (Fig. 3A I and II), with the earliest (RTmin) and latest (RTmax) local repolarisationtimes being 110 and 195 ms, respectively. In contrast, in both heterogeneous models, the
Maharaj et al. Page 4
Prog Biophys Mol Biol. Author manuscript; available in PMC 2010 February 12.
NIH
-PA Author Manuscript
NIH
-PA Author Manuscript
NIH
-PA Author Manuscript
presence of transmural heterogeneity in ionic currents results in a complex repolarisationpattern, particularly within the LV wall (Fig. 3B and C, II panels). In both cases, the epicardiallayer repolarises faster than either the midmyocardial or endocardial layers, and as a result, therepolarisation sequence does not follow the activation sequence in the heterogeneous models.Shortest and longest local repolarisation times are 110 and 201 ms in the heterogeneous modeland 110 and 206 ms in the heterogeneous model with sub-epicardial uncoupling. Thus, whilethe shortest local repolarisation time is similar in all three models, the longest localrepolarisation time is larger in the heterogeneous models than in the homogeneous model, dueto the longer APD in the midmyocardial layer. The maximum transmural dispersion inrepolarisation times (calculated as the maximum difference in repolarisation times across theventricular wall) is 10 ms in the homogeneous model and 30 ms in both heterogeneous models.
Differences between activation and repolarisation patterns in the heterogeneous models stemfrom transmural differences in APD, as illustrated in Fig. 3, panel III. The left image in eachpanel III of Fig. 3 shows APD maps, while the right image presents the time course of actionpotentials recorded in the middle of the LV free wall of the homogeneous ventricles (Fig. 3A,panels III), and in the middle of the epicardial (blue), midmyocardial (green) and endocardial(red) layers of the LV free wall in the heterogeneous model (Fig. 3B, panels III) and in theheterogeneous model with sub-epicardial uncoupling (Fig. 3C, panels III). As shown inprevious studies (Yan et al., 1998a;Idriss and Wolf, 2004;Sampson and Henriquez, 2005), theshape and duration of action potentials obtained from cells within the intact ventricles (Fig.3A–C, panel III) differs from the single cell action potentials (Fig. 2). In both heterogeneousmodels, the action potential amplitude and shape is similar in the three cell layers, and APDincreases monotonically across the ventricular wall, from 110 ms in the epicardium to 140 msin the endocardium, representing a transmural dispersion in APD of 30 ms. Note that thedistribution of APD is similar in both heterogeneous models (Fig. 3B and C, III).
Fig. 3A–C, panel IV, illustrate the pseudo-ECGs recorded in the homogeneous model, theheterogeneous model and the heterogeneous model with sub-epicardial uncoupling,respectively. The QRS complex is similar in the three models, consistent with the similaractivation sequences, as shown in Fig. 3A–C, panel I. However, the differences inrepolarisation sequence between the three models result in differences in amplitude and shapeof the T-wave. In the homogeneous model, the T-wave is biphasic with phases of similaramplitude; the negative phase is of amplitude –0.022 mV and occurs at 142 ms following thepacing stimulus, while the positive phase reaches 0.021 mV and occurs at 168 ms. In contrast,in both heterogeneous models, the T-wave is nearly monophasic with a small negative peak ofamplitude –0.007 mV occurring at 128 ms, followed by a positive wave with a maximum at161 ms and of amplitude 0.043 and 0.050 mV without and with sub-epicardial uncoupling,respectively. Therefore, the T-wave shows a larger deviation from the baseline in the twoheterogeneous models than in the homogeneous model. In all three models, the beginning andend of the T-wave roughly occur at RTmin and RTmax respectively, as illustrated in Fig. 3,panel IV.
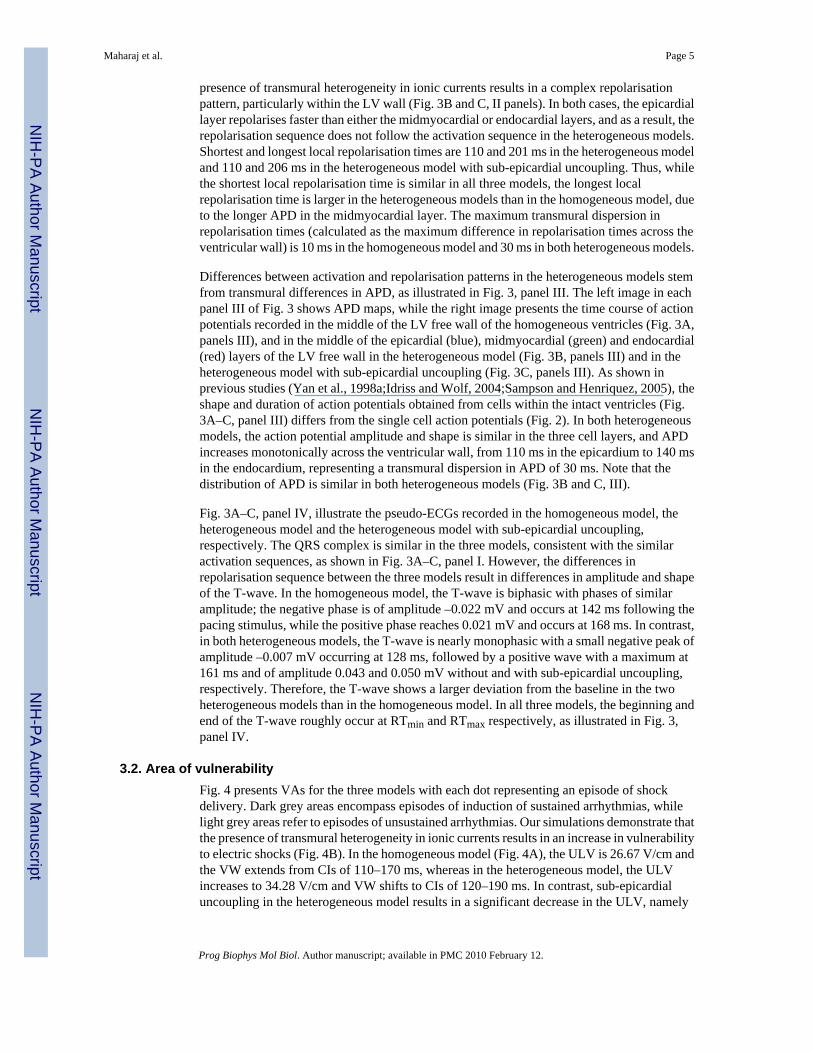
3.2. Area of vulnerabilityFig. 4 presents VAs for the three models with each dot representing an episode of shockdelivery. Dark grey areas encompass episodes of induction of sustained arrhythmias, whilelight grey areas refer to episodes of unsustained arrhythmias. Our simulations demonstrate thatthe presence of transmural heterogeneity in ionic currents results in an increase in vulnerabilityto electric shocks (Fig. 4B). In the homogeneous model (Fig. 4A), the ULV is 26.67 V/cm andthe VW extends from CIs of 110–170 ms, whereas in the heterogeneous model, the ULVincreases to 34.28 V/cm and VW shifts to CIs of 120–190 ms. In contrast, sub-epicardialuncoupling in the heterogeneous model results in a significant decrease in the ULV, namely
Maharaj et al. Page 5
Prog Biophys Mol Biol. Author manuscript; available in PMC 2010 February 12.
NIH
-PA Author Manuscript
NIH
-PA Author Manuscript
NIH
-PA Author Manuscript
to 15.24 V/cm (Fig. 4C). In this case, the duration of the VW is reduced, spanning CIs from140 to 190 ms. In order to elucidate the mechanisms underlying the changes in vulnerabilitycaused by transmural heterogeneity in ionic currents and by decreased gap-junctional couplingwithin the sub-epicardium, we analysed the pre-shock state of the tissue, the shock-inducedVEP, and the post-shock electrical activity in the three models for various SSs and CIs.
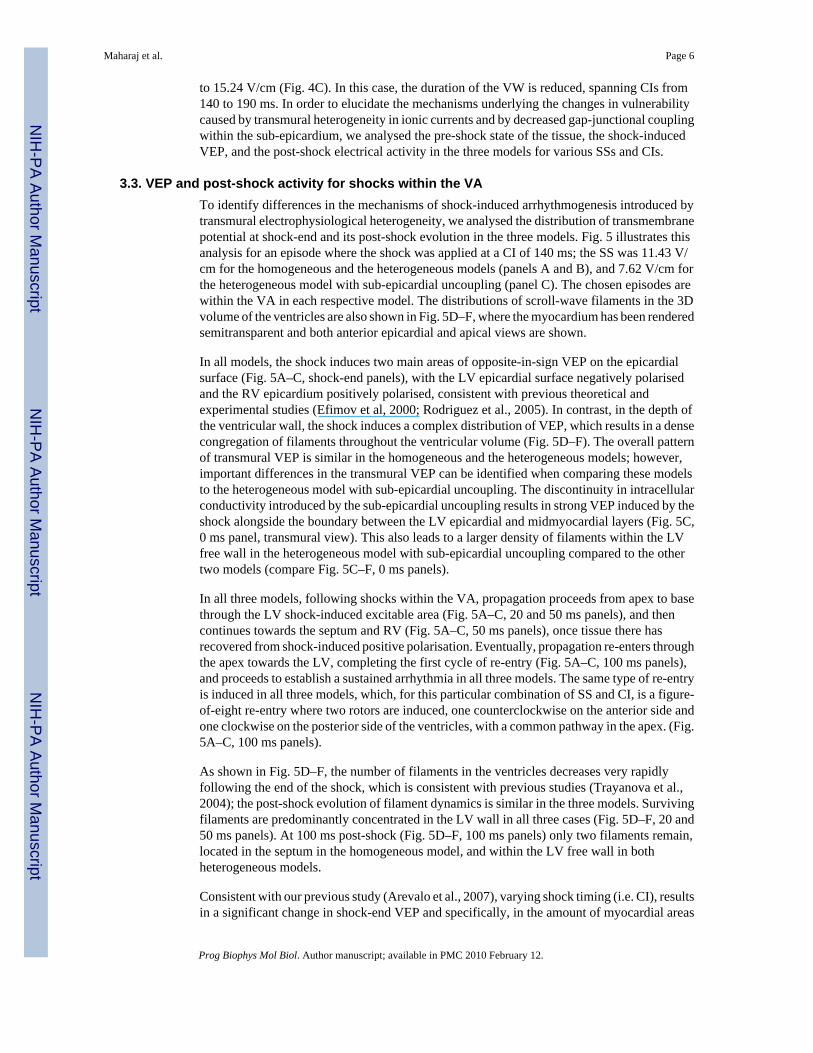
3.3. VEP and post-shock activity for shocks within the VATo identify differences in the mechanisms of shock-induced arrhythmogenesis introduced bytransmural electrophysiological heterogeneity, we analysed the distribution of transmembranepotential at shock-end and its post-shock evolution in the three models. Fig. 5 illustrates thisanalysis for an episode where the shock was applied at a CI of 140 ms; the SS was 11.43 V/cm for the homogeneous and the heterogeneous models (panels A and B), and 7.62 V/cm forthe heterogeneous model with sub-epicardial uncoupling (panel C). The chosen episodes arewithin the VA in each respective model. The distributions of scroll-wave filaments in the 3Dvolume of the ventricles are also shown in Fig. 5D–F, where the myocardium has been renderedsemitransparent and both anterior epicardial and apical views are shown.
In all models, the shock induces two main areas of opposite-in-sign VEP on the epicardialsurface (Fig. 5A–C, shock-end panels), with the LV epicardial surface negatively polarisedand the RV epicardium positively polarised, consistent with previous theoretical andexperimental studies (Efimov et al, 2000; Rodriguez et al., 2005). In contrast, in the depth ofthe ventricular wall, the shock induces a complex distribution of VEP, which results in a densecongregation of filaments throughout the ventricular volume (Fig. 5D–F). The overall patternof transmural VEP is similar in the homogeneous and the heterogeneous models; however,important differences in the transmural VEP can be identified when comparing these modelsto the heterogeneous model with sub-epicardial uncoupling. The discontinuity in intracellularconductivity introduced by the sub-epicardial uncoupling results in strong VEP induced by theshock alongside the boundary between the LV epicardial and midmyocardial layers (Fig. 5C,0 ms panel, transmural view). This also leads to a larger density of filaments within the LVfree wall in the heterogeneous model with sub-epicardial uncoupling compared to the othertwo models (compare Fig. 5C–F, 0 ms panels).
In all three models, following shocks within the VA, propagation proceeds from apex to basethrough the LV shock-induced excitable area (Fig. 5A–C, 20 and 50 ms panels), and thencontinues towards the septum and RV (Fig. 5A–C, 50 ms panels), once tissue there hasrecovered from shock-induced positive polarisation. Eventually, propagation re-enters throughthe apex towards the LV, completing the first cycle of re-entry (Fig. 5A–C, 100 ms panels),and proceeds to establish a sustained arrhythmia in all three models. The same type of re-entryis induced in all three models, which, for this particular combination of SS and CI, is a figure-of-eight re-entry where two rotors are induced, one counterclockwise on the anterior side andone clockwise on the posterior side of the ventricles, with a common pathway in the apex. (Fig.5A–C, 100 ms panels).
As shown in Fig. 5D–F, the number of filaments in the ventricles decreases very rapidlyfollowing the end of the shock, which is consistent with previous studies (Trayanova et al.,2004); the post-shock evolution of filament dynamics is similar in the three models. Survivingfilaments are predominantly concentrated in the LV wall in all three cases (Fig. 5D–F, 20 and50 ms panels). At 100 ms post-shock (Fig. 5D–F, 100 ms panels) only two filaments remain,located in the septum in the homogeneous model, and within the LV free wall in bothheterogeneous models.
Consistent with our previous study (Arevalo et al., 2007), varying shock timing (i.e. CI), resultsin a significant change in shock-end VEP and specifically, in the amount of myocardial areas
Maharaj et al. Page 6
Prog Biophys Mol Biol. Author manuscript; available in PMC 2010 February 12.
NIH
-PA Author Manuscript
NIH
-PA Author Manuscript
NIH
-PA Author Manuscript
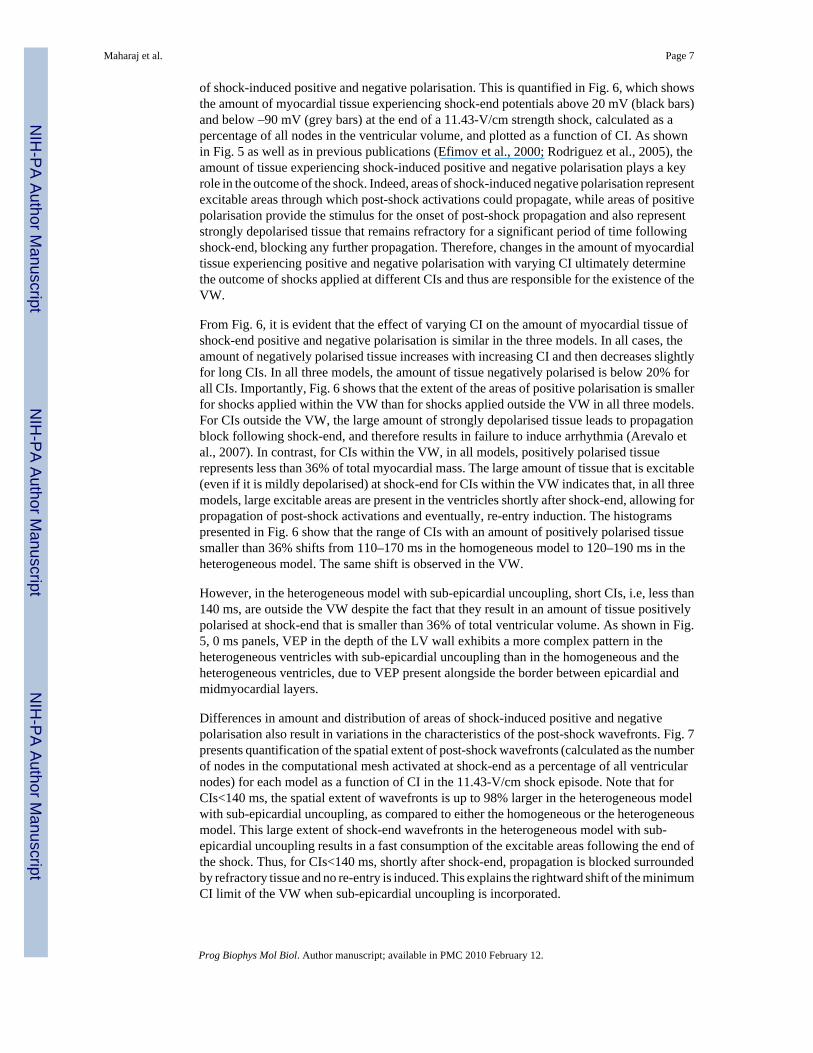
of shock-induced positive and negative polarisation. This is quantified in Fig. 6, which showsthe amount of myocardial tissue experiencing shock-end potentials above 20 mV (black bars)and below –90 mV (grey bars) at the end of a 11.43-V/cm strength shock, calculated as apercentage of all nodes in the ventricular volume, and plotted as a function of CI. As shownin Fig. 5 as well as in previous publications (Efimov et al., 2000; Rodriguez et al., 2005), theamount of tissue experiencing shock-induced positive and negative polarisation plays a keyrole in the outcome of the shock. Indeed, areas of shock-induced negative polarisation representexcitable areas through which post-shock activations could propagate, while areas of positivepolarisation provide the stimulus for the onset of post-shock propagation and also representstrongly depolarised tissue that remains refractory for a significant period of time followingshock-end, blocking any further propagation. Therefore, changes in the amount of myocardialtissue experiencing positive and negative polarisation with varying CI ultimately determinethe outcome of shocks applied at different CIs and thus are responsible for the existence of theVW.
From Fig. 6, it is evident that the effect of varying CI on the amount of myocardial tissue ofshock-end positive and negative polarisation is similar in the three models. In all cases, theamount of negatively polarised tissue increases with increasing CI and then decreases slightlyfor long CIs. In all three models, the amount of tissue negatively polarised is below 20% forall CIs. Importantly, Fig. 6 shows that the extent of the areas of positive polarisation is smallerfor shocks applied within the VW than for shocks applied outside the VW in all three models.For CIs outside the VW, the large amount of strongly depolarised tissue leads to propagationblock following shock-end, and therefore results in failure to induce arrhythmia (Arevalo etal., 2007). In contrast, for CIs within the VW, in all models, positively polarised tissuerepresents less than 36% of total myocardial mass. The large amount of tissue that is excitable(even if it is mildly depolarised) at shock-end for CIs within the VW indicates that, in all threemodels, large excitable areas are present in the ventricles shortly after shock-end, allowing forpropagation of post-shock activations and eventually, re-entry induction. The histogramspresented in Fig. 6 show that the range of CIs with an amount of positively polarised tissuesmaller than 36% shifts from 110–170 ms in the homogeneous model to 120–190 ms in theheterogeneous model. The same shift is observed in the VW.
However, in the heterogeneous model with sub-epicardial uncoupling, short CIs, i.e, less than140 ms, are outside the VW despite the fact that they result in an amount of tissue positivelypolarised at shock-end that is smaller than 36% of total ventricular volume. As shown in Fig.5, 0 ms panels, VEP in the depth of the LV wall exhibits a more complex pattern in theheterogeneous ventricles with sub-epicardial uncoupling than in the homogeneous and theheterogeneous ventricles, due to VEP present alongside the border between epicardial andmidmyocardial layers.
Differences in amount and distribution of areas of shock-induced positive and negativepolarisation also result in variations in the characteristics of the post-shock wavefronts. Fig. 7presents quantification of the spatial extent of post-shock wavefronts (calculated as the numberof nodes in the computational mesh activated at shock-end as a percentage of all ventricularnodes) for each model as a function of CI in the 11.43-V/cm shock episode. Note that forCIs<140 ms, the spatial extent of wavefronts is up to 98% larger in the heterogeneous modelwith sub-epicardial uncoupling, as compared to either the homogeneous or the heterogeneousmodel. This large extent of shock-end wavefronts in the heterogeneous model with sub-epicardial uncoupling results in a fast consumption of the excitable areas following the end ofthe shock. Thus, for CIs<140 ms, shortly after shock-end, propagation is blocked surroundedby refractory tissue and no re-entry is induced. This explains the rightward shift of the minimumCI limit of the VW when sub-epicardial uncoupling is incorporated.
Maharaj et al. Page 7
Prog Biophys Mol Biol. Author manuscript; available in PMC 2010 February 12.
NIH
-PA Author Manuscript
NIH
-PA Author Manuscript
NIH
-PA Author Manuscript
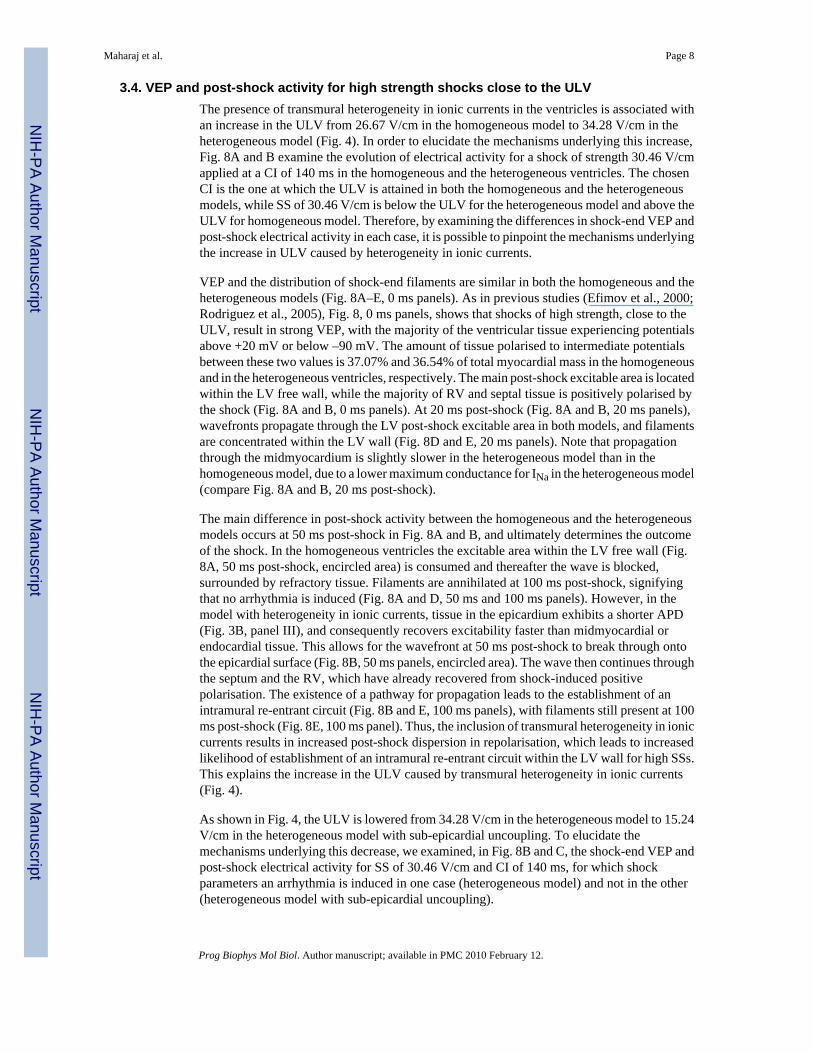
3.4. VEP and post-shock activity for high strength shocks close to the ULVThe presence of transmural heterogeneity in ionic currents in the ventricles is associated withan increase in the ULV from 26.67 V/cm in the homogeneous model to 34.28 V/cm in theheterogeneous model (Fig. 4). In order to elucidate the mechanisms underlying this increase,Fig. 8A and B examine the evolution of electrical activity for a shock of strength 30.46 V/cmapplied at a CI of 140 ms in the homogeneous and the heterogeneous ventricles. The chosenCI is the one at which the ULV is attained in both the homogeneous and the heterogeneousmodels, while SS of 30.46 V/cm is below the ULV for the heterogeneous model and above theULV for homogeneous model. Therefore, by examining the differences in shock-end VEP andpost-shock electrical activity in each case, it is possible to pinpoint the mechanisms underlyingthe increase in ULV caused by heterogeneity in ionic currents.
VEP and the distribution of shock-end filaments are similar in both the homogeneous and theheterogeneous models (Fig. 8A–E, 0 ms panels). As in previous studies (Efimov et al., 2000;Rodriguez et al., 2005), Fig. 8, 0 ms panels, shows that shocks of high strength, close to theULV, result in strong VEP, with the majority of the ventricular tissue experiencing potentialsabove +20 mV or below –90 mV. The amount of tissue polarised to intermediate potentialsbetween these two values is 37.07% and 36.54% of total myocardial mass in the homogeneousand in the heterogeneous ventricles, respectively. The main post-shock excitable area is locatedwithin the LV free wall, while the majority of RV and septal tissue is positively polarised bythe shock (Fig. 8A and B, 0 ms panels). At 20 ms post-shock (Fig. 8A and B, 20 ms panels),wavefronts propagate through the LV post-shock excitable area in both models, and filamentsare concentrated within the LV wall (Fig. 8D and E, 20 ms panels). Note that propagationthrough the midmyocardium is slightly slower in the heterogeneous model than in thehomogeneous model, due to a lower maximum conductance for INa in the heterogeneous model(compare Fig. 8A and B, 20 ms post-shock).
The main difference in post-shock activity between the homogeneous and the heterogeneousmodels occurs at 50 ms post-shock in Fig. 8A and B, and ultimately determines the outcomeof the shock. In the homogeneous ventricles the excitable area within the LV free wall (Fig.8A, 50 ms post-shock, encircled area) is consumed and thereafter the wave is blocked,surrounded by refractory tissue. Filaments are annihilated at 100 ms post-shock, signifyingthat no arrhythmia is induced (Fig. 8A and D, 50 ms and 100 ms panels). However, in themodel with heterogeneity in ionic currents, tissue in the epicardium exhibits a shorter APD(Fig. 3B, panel III), and consequently recovers excitability faster than midmyocardial orendocardial tissue. This allows for the wavefront at 50 ms post-shock to break through ontothe epicardial surface (Fig. 8B, 50 ms panels, encircled area). The wave then continues throughthe septum and the RV, which have already recovered from shock-induced positivepolarisation. The existence of a pathway for propagation leads to the establishment of anintramural re-entrant circuit (Fig. 8B and E, 100 ms panels), with filaments still present at 100ms post-shock (Fig. 8E, 100 ms panel). Thus, the inclusion of transmural heterogeneity in ioniccurrents results in increased post-shock dispersion in repolarisation, which leads to increasedlikelihood of establishment of an intramural re-entrant circuit within the LV wall for high SSs.This explains the increase in the ULV caused by transmural heterogeneity in ionic currents(Fig. 4).
As shown in Fig. 4, the ULV is lowered from 34.28 V/cm in the heterogeneous model to 15.24V/cm in the heterogeneous model with sub-epicardial uncoupling. To elucidate themechanisms underlying this decrease, we examined, in Fig. 8B and C, the shock-end VEP andpost-shock electrical activity for SS of 30.46 V/cm and CI of 140 ms, for which shockparameters an arrhythmia is induced in one case (heterogeneous model) and not in the other(heterogeneous model with sub-epicardial uncoupling).
Maharaj et al. Page 8
Prog Biophys Mol Biol. Author manuscript; available in PMC 2010 February 12.
NIH
-PA Author Manuscript
NIH
-PA Author Manuscript
NIH
-PA Author Manuscript
As can be seen in Fig. 8B and C, shock-end panels, sub-epicardial uncoupling in theheterogeneous model results in altered VEP with an increase in the spatial extent of areas ofshock-induced positive polarisation, particularly within the LV free wall (Fig. 8B and C, 0 mspanels). The amount of positively polarised tissue is 38.2% of the total myocardial volume inthe heterogeneous model with sub-epicardial uncoupling, as compared to 35% in theheterogeneous model. Fig. 8F, 0 ms panels, shows that altered VEP introduced by sub-epicardial uncoupling is accompanied by a larger density of scroll-wave filaments.Furthermore, our simulation results show that changes in VEP due to sub-epicardial uncouplingresult in altered characteristics of the post-shock wavefronts and in particular, in an increasein the spatial extent of post-shock wavefronts (as defined previously) from 10.44% in theheterogeneous model to 12.95% in the heterogeneous model with sub-epicardial uncoupling.
Both the increase in the amount of shock-end positively polarised myocardium and in thespatial extent of post-shock wavefronts contribute to the decrease in the ULV, since lower SSsare required to cause post-shock activations to traverse the post-shock excitable areas beforethe surrounding tissue, positively polarised at shock-end, recovers excitability. Fig. 8C, 20 mspanel, presents the distribution of transmembrane potential after the post-shock excitable areais consumed and shows that propagation is terminated in the heterogeneous model with sub-epicardial uncoupling. Accordingly, the density of filaments decreases rapidly after shock-end(Fig. 8F, 20 ms panel) and filaments are completely annihilated at 50 ms post-shock, signifyingthat no re-entry is induced in this model (Fig. 8C and F, 50 ms and 100 ms panels). In contrast,in the heterogeneous model, as mentioned previously, propagation proceeds through the LVwall and breaks through onto the epicardial surface at 50 ms post-shock, establishing a re-entrant circuit.
Thus, Fig. 8B and C demonstrate that the decrease in the ULV associated with sub-epicardialuncoupling in the heterogeneous ventricles results from differences in VEP and in thecharacteristics of the post-shock wavefronts. Specifically, the larger amount of the positivelypolarised myocardium and the increase in the spatial extent of post-shock wavefronts preventthe establishment of re-entrant circuits following shocks of high strength, and ultimately leadto a decrease in the ULV.
4. DiscussionThis study used an anatomically realistic model of the rabbit ventricles to investigate the roleof transmural heterogeneities in ionic currents and of gap-junctional coupling in modulatingcardiac vulnerability to electric shocks. Our bidomain simulations demonstrate that transmuralheterogeneities in ionic currents in the ventricles result in an increase in vulnerability to electricshocks, manifested as increased ULV and extended VW. These changes in vulnerability stemfrom increased post-shock dispersion in repolarisation caused by the transmural heterogeneityin ionic currents, which leads to an increased likelihood of establishment of re-entrant circuits.In contrast, sub-epicardial gap-junctional uncoupling in the heterogeneous ventricular modelresults in a significant decrease in vulnerability to electric shocks, with significantly lowerULV and narrower VW compared to both the heterogeneous and the homogeneous models.Our simulations show that reduced vulnerability to shocks in the presence of sub-epicardialuncoupling is due to alterations in VEP and in the characteristics of post-shock wavefronts.The study dissects the mechanisms underlying the changes in cardiac vulnerability to electricshocks due to both heterogeneities in ionic currents and gap-junctional coupling.
4.1. Transmural electrophysiological heterogeneities in the ventriclesA large body of research has shown that the ventricular myocardium exhibits heterogeneouselectrophysiological properties caused by regional differences in ionic currents. Experimentalstudies using isolated endocardial, midmyocardial and epicardial myocytes report transmural
Maharaj et al. Page 9
Prog Biophys Mol Biol. Author manuscript; available in PMC 2010 February 12.
NIH
-PA Author Manuscript
NIH
-PA Author Manuscript
NIH
-PA Author Manuscript
differences in Ito in canine, rabbit, guinea pig and human (Li et al., 1998; McIntosh et al.,1998; Antzelevitch et al., 1999a, b), in INa in canine (Antzelevitch et al., 1999a, b), in IKs incanine and rabbit (Liu and Antzelevitch, 1995; Xu et al., 2001; Yan et al., 2001), and to asmaller extent, in IKr in rabbit (Xu et al., 2001). In our study, transmural heterogeneities inionic currents have been incorporated based on rabbit experimental data (McIntosh et al.,1998, 2000; Xu et al., 2001), as done in a previous simulation study (Saucerman et al., 2004).Consistent with previous research (McIntosh et al., 1998, 2000; Viswanathan et al., 1999; Xuet al., 2001; Gima and Rudy, 2002; Idriss and Wolf, 2004; Saucerman et al., 2004; Sampsonand Henriquez, 2005), our study shows that the transmural differences in ionic currents resultin differences in the shape and duration of the action potential in epicardial, midmyocardialand endocardial cells. In isolated single cells, the presence of a prominent Ito current inepicardial and midmycardial myocytes gives rise to a notch following the upstroke of the actionpotential, which is absent in endocardial action potentials (Fig. 2). In addition, smaller IKr andIKs in midmyocardial and endocardial myocytes as shown in Table 1 result in APDs that are32 and 23 ms longer in midmyocardial and endocardial myocytes, respectively, than inepicardial cells (Fig. 2), for the basic cycle length of 250 ms used in our study.
As in previous studies (Yan et al., 1998a; Sampson and Henriquez, 2005), when transmuraldifferences in ionic currents are incorporated in our rabbit ventricular model, electrotonicinteractions alter the shape and duration of the action potentials in the three cell layers comparedto those of the single cell (action potentials in Figs. 2 and 3, panel III). Firstly, the notch presentin the action potentials of isolated epicardial and midmyocardial cells is not observed in actionpotentials recorded in the heterogeneous ventricular model, and, secondly, the LV transmuralAPD profile in the rabbit model is characterised by a gradual APD increase to 30 ms from epi-to endocardium, with cells in the midmyocardial layer exhibiting intermediate APD (Fig. 3).These results are consistent with experimental recordings in adult rabbit LV wedgepreparations (Yan et al., 2001; Idriss and Wolf, 2004). Increasing basic cycle length results inincreased transmural dispersion in APD in the rabbit ventricles. However, rapid pacing ratesprior to shock application have been shown to result in a better agreement between ULV anddefibrillation threshold (Malkin et al., 1995) since the activation sequence is very rapid duringfibrillation. Therefore, in this study, the ventricles were paced at a basic cycle length of 250ms before shock application.
Transmural differences in APD caused by transmural heterogeneity in ionic currents also meanincreased transmural dispersion in repolarisation (Fig. 3, panel II). This results in a significantchange in the shape of the T-wave, as shown in Fig. 3, panel IV, as well as in previous studies(Yan et al., 1998b;Gima and Rudy, 2002;Idriss and Wolf, 2004;Ritsema van Eck et al.,2005). It should be noted however, that, while there is a large body of evidence supporting theexistence of transmural heterogeneities in ionic currents and electrophysiological propertiesof ventricular tissue, some experimental studies have documented little or no transmuraldifferences in APD in vivo (Anyukhovsky et al., 1996,1999;Taggart et al., 2001;Conrath et al.;2004).
In addition to transmural differences in ionic currents, recent experimental studies havereported an increase in tissue resistivity in the subepicardium in dog (Yan et al., 1998a), rodent(Yamada et al., 2004) and human (Drouin et al., 1995), which might be attributable to a reducedexpression of connexin43 (Yamada et al., 2004). Our results demonstrate that sub-epicardialuncoupling does not lead to significant changes in the electrical activity following apicalstimulation (Fig. 3). However, it leads to differences in shock-end VEP and post-shockbehaviour that alter the shock outcome and lead to changes in vulnerability to shocks, asaddressed in the following sections.
Maharaj et al. Page 10
Prog Biophys Mol Biol. Author manuscript; available in PMC 2010 February 12.
NIH
-PA Author Manuscript
NIH
-PA Author Manuscript
NIH
-PA Author Manuscript
4.2. Mechanisms underlying the changes in vulnerability to shocks caused by transmuralelectrophysiological heterogeneities
Our simulation results show that incorporating transmural heterogeneity in ionic currents doesnot alter the overall pattern of shock-end VEP in the ventricles. However, in the heterogeneousmodel, local repolarisation times in the midmyocardial and the endocardial layers are longerthan in the homogeneous model (Fig. 3). Therefore, a similar level of post-shock recovery isestablished later in the heterogeneous model than in the homogeneous model. This explainsthe overall rightward shift of the VW in the heterogeneous model as compared to thehomogeneous model.
Since it arises from the VEP pattern, early post-shock activity is also similar in thehomogeneous and the heterogeneous ventricles (Figs. 5 and 8, 20 ms panels). Propagationproceeds through the post-shock excitable area located within the LV free wall, while tissuerendered refractory at shock-end recovers. However, in the heterogeneous ventricles post-shock dispersion in repolarisation within the LV free wall is enhanced by the transmural APDdispersion; this increases the likelihood of establishment of shock-induced re-entrant circuitswithin the LV free wall, and explains the increase in ULV.
While decreased gap-junctional coupling between the midmyocardial and epicardial layersdoes not alter ventricular electrical activity following pacing (Fig. 2), it leads to a significantchange in VEP and thus plays a key role in vulnerability to shocks. Sub-epicardial gap-junctional uncoupling within the LV free wall represents a discontinuity in the bidomainintracellular conductivities, which leads to the formation of shock-induced VEP (Entcheva etal., 1999). Areas of positive and negative polarisation are induced alongside the boundarybetween epicardial and midmyocardial layers, as shown in Figs. 5 and 8, 0 ms panels. Thisresults in an increase in the amount of positively polarised tissue at shock-end, and in the spatialextent of the post-shock wavefronts. Both factors contribute to (i) a decrease in the ULV in thepresence of sub-epicardial uncoupling, since lower SSs are required to cause post-shockactivations to traverse the post-shock excitable areas before refractory tissue recovers; and (ii)a rightward shift of the minimum CI limit in the VW, with no arrhythmia induced for CIs<140ms.
Therefore, this study proves that transmural heterogeneities in ionic currents and gap-junctionaluncoupling modulate cardiac vulnerability to electric shocks by altering shock-induced VEP,the characteristics of post-shock propagation, and the post-shock dispersion of refractoriness.Experimental studies have shown that transmural dispersion in refractoriness resulting fromtransmural electrophysiological heterogeneity is dependent on factors such as age (Idriss andWolf, 2004) and, importantly, is determined by the pacing rate, due to the different restitutionproperties of epicardial, midmyocardial and endocardial cells (Drouin et al., 1995; Yan et al.,1998a, 2001; Li et al., 1998; Antzelevitch et al., 1999a, b; Idriss and Wolf, 2004). Our resultssuggest that dispersion in post-shock refractoriness affects vulnerability to electric shocks.Thus, factors that enhance transmural dispersion in repolarisation, such as age and pacingprotocol, are also expected to affect changes in vulnerability to electric shocks throughmechanisms that are similar to those described in the sections above.
In the present study, a uniform field and a monophasic shock waveform were applied to thehomogeneous, the heterogeneous, and the heterogeneous ventricles with sub-epicardialuncoupling to reveal the contribution of transmural heterogeneities in ionic currents and sub-epicardial gap-junctional uncoupling to the mechanisms of cardiac vulnerability to electricshocks. By using this protocol, this contribution was not masked by applied field nonuniformityand additional nonlinear effects associated with biphasic waveform shocks. The findings ofthis study have a direct application to external defibrillation with monophasic shocks. Therelevancy of these results can be further extended to biphasic defibrillation waveforms, as
Maharaj et al. Page 11
Prog Biophys Mol Biol. Author manuscript; available in PMC 2010 February 12.
NIH
-PA Author Manuscript
NIH
-PA Author Manuscript
NIH
-PA Author Manuscript
transmural heterogeneities in ionic currents and intercellular coupling will still be present inthe ventricles, and thus shock-induced effects and 3D post-shock activity will still be partiallydetermined by transmural electrophysiological heterogeneities.
4.3. LimitationsThe limitations of the ventricular rabbit model used in this study have been described elsewhere(Trayanova et al., 2002). Here we overcome some of the limitations of previous models byincorporating a realistic representation of transmural heterogeneity in ionic currents and sub-epicardial uncoupling based on experimental data. However, model limitations include the lackof additional heterogeneities in ionic currents such as apico-basal and interventricular gradients(Brahmajothi et al., 1997; Volders et al., 1999; Cheng and Kodama, 2004), and accuraterepresentation of heterogeneities in late INa (Antzelevitch et al., 1999a, b).
Despite these limitations, this study provides a detailed understanding of the role of transmuralelectrophysiological heterogeneity in ionic currents and gap-junctional uncoupling in cardiacvulnerability to electric shocks. It should be noted that differences in size, electrophysiologicalproperties and geometry between human and rabbit hearts, and the heterogeneities in theelectrophysiological properties in diseased hearts might limit the applicability of our results tothe human heart.
AcknowledgmentsThis work was supported by Rhodes Scholarship (T.M.), EPSRC-funded Integrative Biology e-Science pilot project(D.G.), the UK National Grid Service, and NIH Grant HL063195 (N.T). A portion of this work was published inabstract form (Maharaj et al., 2006).
ReferencesAguel F, Eason J, Trayanova N. Advances in modeling cardiac defibrillation. Int. J. Bifurcations Chaos
2003;13:3791–3805.Antzelevitch C, Fish J. Electrical heterogeneity within the ventricular wall. Basic Res. Cardiol
2001;96:517–527. [PubMed: 11770069]Antzelevitch C, Shimizu W, Yan GX, Sicouri S, Weissenburger J, Nesterenko VV, Burashnikov A, di
Diego J, Saffitz J, Thomas GP. The M cell: its contribution to the ECG and to normal and abnormalelectrical function of the heart. J. Cardiovasc. Electrophysiol 1999a;10(8):1124–1152. [PubMed:10466495]
Antzelevitch, C.; Yan, GX.; Shimizu, W.; Burashnikov, A. Electrical heterogeneity, the ECG, and cardiacarrhythmias.. In: Zipes, DP.; Jalife, J., editors. Cardiac Electrophysiology: From Cell to Bedside. W.B.Saunders Co.; Philadelphia: 1999b. p. 222-228.
Anyukhovsky EP, Sosunov EA, Rosen MR. Regional differences in electrophysiological properties ofepicardium, midmyocardium, and endocardium, in vitro and in vivo correlations. Circulation1996;94:1981–1988. [PubMed: 8873677]
Anyukhovsky EP, Sosunov EA, Gainullin RZ, Rosen MR. The controversial M cell. J. Cardiovasc.Electrophysiol 1999;10:244–260. [PubMed: 10090229]
Arevalo H, Rodriguez B, Trayanova N. Arrhythmogenesis in the heart: insights from multiscalemodelling studies. Chaos 2007;17(1–13):015103. [PubMed: 17411260]
Ashihara T, Trayanova N. Asymmetry in membrane responses to electric shocks: Insights from bidomainsimulations. Biophys. J 2004;87:2271–2282. [PubMed: 15454429]
Aslanidi OV, Clayton RH, Lambert JL, Holden AV. Dynamical and cellular electrophysiologicalmechanisms of ECG changes during ischaemia. J. Theor. Biol 2005;237(4):369–381. [PubMed:15979649]
Brahmajothi MV, Morales MJ, Reimer KA, Strauss HC. Regional localization of ERG, the channelprotein responsible for the rapid component of the delayed rectifier, K+ current in the ferret heart.Circ. Res 1997;81:128–135. [PubMed: 9201036]
Maharaj et al. Page 12
Prog Biophys Mol Biol. Author manuscript; available in PMC 2010 February 12.
NIH
-PA Author Manuscript
NIH
-PA Author Manuscript
NIH
-PA Author Manuscript
Chen PS, Shibata N, Dixon EG, Wolf PD, Danieley ND, Sweeney MB, Smith WM, Ideker RE. Activationduring ventricular defibrillation in open-chest dogs. J. Clin. Invest 1986;77(3):810–823. [PubMed:3949979]
Chen PS, Feld GK, Mower MM, Peters BB. Effects of pacing rate and timing of defibrillation shock onthe relation between the defibrillation threshold and the upper limit of vulnerability in open chestdogs. J. Am. Coll. Cardiol 1991;18:1555–1563. [PubMed: 1939961]
Cheng JH, Kodama I. Two components of delayed rectifier K+ current in heart: molecular basis,functional diversity, and contribution to repolarization. Acta Pharmacol. Sin 2004;25:137–145.[PubMed: 14769199]
Clerc L. Directional differences of impulse spread in trabecular muscle from mammalian heart. J. Physiol.(London) 1976;225:335–346. [PubMed: 1255523]
Conrath CE, Wilders R, Coronel R, de Bakkerd JMT, Taggart P, de Grootd JR, Opthof T. Intercellularcoupling through gap junctions masks M cells in the human heart. Cardiovasc. Res 2004;62(2):407–414. [PubMed: 15094360]
Drouin E, Charpentier F, Gauthier C, Laurent K, Le Marec H. Electrophysiologic characteristics of cellsspanning the left ventricular wall of human heart: evidence for presence of M cells. J. Am. Coll.Cardiol 1995;26:185–192. [PubMed: 7797750]
Dumaine R, Towbin JA, Brugada P, Vatta M, Nesterenko DV, Nesterenko VV, Brugada J, Brugada R,Antzelevitch C. Ionic mechanisms responsible for the electrocardiographic phenotype of the Brugadasyndrome are temperature dependent. Circ. Res 1999;85:803–809. [PubMed: 10532948]
Eason J, Malkin RA. A simulation study evaluating the performance of high density electrode arrays onmyocardial tissue. IEEE Trans. Biomed. Eng 2000;47:893–901. [PubMed: 10916260]
Efimov IR, Aguel F, Cheng Y, Wollenzier B, Trayanova N. Virtual electrode polarization in the far field:implications for external defibrillation. Am. J. Physiol. Heart Circ Physiol 2000;279:1055–1070.
Entcheva E, Trayanova N, Claydon FJ. Patterns of and mechanisms for shock-induced polarization inthe heart: a bidomain analysis. IEEE Trans. Biomed. Eng 1999;46:260–270. [PubMed: 10097461]
Gima K, Rudy Y. Ionic current basis of electrocardiographic waveforms: a model study. Circ. Res2002;90:889–896. [PubMed: 11988490]
Huelsing DJ, Spitzer KW, Pollard AE. Electrotonic suppression of early afterdepolarizations in isolatedrabbit Purkinje myocytes. Am. J. Physiol. Heart Circ. Physiol 2000;279:H250–H259. [PubMed:10899064]
Idriss SF, Wolf PD. Transmural action potential repolarisation heterogeneity develops postnatally in therabbit. J. Cardiovas. Electrophysiol 2004;15:795–801.
Kuo CS, Munakata K, Reddy CP, Surawicz B. Characteristics and possible mechanism of ventriculararrhythmia dependent on the dispersion of action potential durations. Circulation 1983;67:1356–1367. [PubMed: 6851031]
Larson C, Dragnev L, Trayanova N. Analysis of electrically-induced reentrant circuits in a sheet ofmyocardium. Ann. Biomed. Eng 2003;31:768–780. [PubMed: 12971610]
Laurita KR, Girouard SD, Akar FD, Rosenbaum DS. Modulated dispersion explains changes inarrhythmia vulnerability during premature stimulation of the heart. Circulation 1998;98:2774–2780.[PubMed: 9851966]
Li G, Feng J, Lixia Y, Carrier M. Transmural heterogeneity of action potentials and Ito 1 in myocytesisolated from the human right ventricle. Am. J. Physiol. Heart Circ. Physiol 1998;44:H369–H377.
Liu DW, Antzelevitch C. Characteristics of the Delayed Rectifier Current (IKr and IKs) in canineventricular epicardial, midmyocardial, and endocardial myocytes: a weaker IKs contributes to thelonger action potential of the M cell. Circ. Res 1995;76:351–365. [PubMed: 7859382]
Luo CH, Rudy Y. A dynamic model of the cardiac ventricular action potential: I. Simulations of ioniccurrents and concentration changes. Circ. Res 1994;74:1071–1097. [PubMed: 7514509]
Maharaj T, Rodriguez B, Blake R III, Trayanova N, Gavaghan D. Role of transmural heterogeneities invulnerability to electric shocks. Heart Rhythm 2006;3(5):S225–S225.
Malkin RA, Idriss SF, Walker RG, Ideker RE. Effect of rapid pacing and T-wave scanning on the relationbetween the defibrillation and upper-limit-of-vulnerability dose–response curves. Circulation1995;92:1291–1299. [PubMed: 7648678]
Maharaj et al. Page 13
Prog Biophys Mol Biol. Author manuscript; available in PMC 2010 February 12.
NIH
-PA Author Manuscript
NIH
-PA Author Manuscript
NIH
-PA Author Manuscript
McIntosh MA, Cobbe SM, Kane KA, Rankin AC. Action potential prolongation and potassium currentsin left-ventricular myocytes isolated from hypertrophied rabbit hearts. J. Mol. Cell. Cardiol1998;30:43–53. [PubMed: 9500863]
McIntosh MA, Cobbe SM, Smith GL. Heterogeneous changes in action potential and intracellular Ca2+ in left ventricular myocyte sub-types from rabbits with heart failure. Cardiovasc. Res 2000;45(2):397–409. [PubMed: 10728360]
Peters NS, Coromilas J, Severs NJ, Wit AL. Disturbed connexin43 gap junction distribution correlateswith the location of reentrant circuits in the epicardial border zone of healing canine infarcts thatcause ventricular tachycardia. Circulation 1997;95:988–996. [PubMed: 9054762]
Plonsey, R.; Barr, RC. second ed.. Kluwer Academic, Plenum Press; New York, NY: 2000. Bioelectricity:A Quantitative Approach; p. 1490163
Poelzing S, Akar FD, Baron E, Rosenbaum DS. Heterogeneous connexin43 expression produceselectrophysiological heterogeneities across ventricular wall. Am. J. Physiol. Heart Circ. Physiol2004;286:H2001–H2009. [PubMed: 14704225]
Ritsema van Eck HJ, Kors JA, van Herpen G. The U wave in the electrocardiogram: a solution for a 100-year old riddle. Cardiovasc. Res 2005;67:256–262. [PubMed: 15913583]
Rodríguez B, Tice B, Eason J, Aguel F, Trayanova N. Cardiac vulnerability to electric shocks duringphase 1A of acute global ischemia. Heart Rhythm 2004;1(6):695–703. [PubMed: 15851241]
Rodríguez B, Li L, Eason JC, Efimov IR, Trayanova N. Differences between left and right ventricularchamber geometry affect cardiac vulnerability to electric shocks. Circ. Res 2005;97:168–175.[PubMed: 15976315]
Sampson KJ, Henriquez CS. Electrotonic influences on action potential duration dispersion in smallhearts: a simulation study. Am. J. Physiol. Heart Circ. Physiol 2005;289:H350–H360. [PubMed:15734889]
Saucerman JJ, Healy SN, Belik ME, Puglisi JL, McCulloch AD. Proarrhythmic consequences of aKCNQ1 AKAP-binding domain mutation computational models of whole cells and heterogeneoustissue. Circ. Res 2004;95:1216–1224. [PubMed: 15528464]
Taggart P, Sutton PM, Opthof T, Coronel R, Trimlett R, Pugsley W, Kallis P. Transmural repolarisationin the left ventricle in humans during normoxia and ischaemia. Cardiovasc. Res 2001;50(3):454–462. [PubMed: 11376621]
Trayanova N, Eason J, Aguel F. Computer simulations of cardiac defibrillation: a look inside the heart.Comput. Visual Sci 2002;4:259–270.
Trayanova, N.; Aguel, F.; Larson, HC. Modelling cardiac defibrillation: an inquiry into post-shockdynamics.. In: Zipes, DP.; Jalife, J., editors. Cardiac Electrophysiology: From Cell to Bedside. fourthed.. 2004. p. 282-290.
Ueda N, Zipes DP, Wu J. Functional and transmural modulation of M cell behavior in canine ventricularwall. Am. J. Physiol 2004;287:H2569–H2575.
Vetter FJ, McCulloch AD. Three-dimensional analysis of regional cardiac function: a model of rabbitventricular anatomy. Prog. Biophys. Mol. Biol 1998;69:157–183. [PubMed: 9785937]
Viswanathan PC, Shaw RM, Rudy Y. Effects of IKr and IKs heterogeneity on action potential durationand its rate dependence a simulation study. Circulation 1999;99:2466–2474. [PubMed: 10318671]
Volders PGA, Sipido KR, Carmeliet E, Spätjens RLHMG, Wellens HJJ, Vos MA. Repolarizing K+currents Ito1 and IKs are larger in right than left canine ventricular midmyocardium. Circulation1999;99:206–210. [PubMed: 9892584]
Xu X, Rials SJ, Wu Y, Salata JS, Liu T, Bharucha DB, Marinchak RA, Kowey PR. Left ventricularhypertrophy decreases slowly but not rapidly activating delayed rectifier potassium currents ofepicardial and endocardial myocytes in rabbits. Circulation 2001;103:1585–1590. [PubMed:11257089]
Yamada K, Kanter EM, Green KG, Saffitz JE. Transmural distribution of connexins in rodent hearts. J.Cardiovasc. Electrophysiol 2004;15:1–6.
Yan GX, Shimizu W, Antzelevitch C. Characteristics and distribution of M cells in arterially perfusedcanine left ventricular wedge preparations. Circulation 1998a;98:1921–1927. [PubMed: 9799214]
Yan GX, Shimizu W, Antzelevitch C. Cellular basis for the normal T-wave and the electrocardiographicmanifestations of the long-QT syndrome. Circulation 1998b;98:1928–1936. [PubMed: 9799215]
Maharaj et al. Page 14
Prog Biophys Mol Biol. Author manuscript; available in PMC 2010 February 12.
NIH
-PA Author Manuscript
NIH
-PA Author Manuscript
NIH
-PA Author Manuscript
Yan GX, Rials SJ, Wu Y, Liu T, Xu X, Marinchak RA, Kowey PR. Ventricular hypertrophy amplifiestransmural repolarization dispersion and induces early afterdepolarization. Am. J. Physiol. HeartCirc. Physiol 2001;281:H1968–H1975. [PubMed: 11668057]
Maharaj et al. Page 15
Prog Biophys Mol Biol. Author manuscript; available in PMC 2010 February 12.
NIH
-PA Author Manuscript
NIH
-PA Author Manuscript
NIH
-PA Author Manuscript
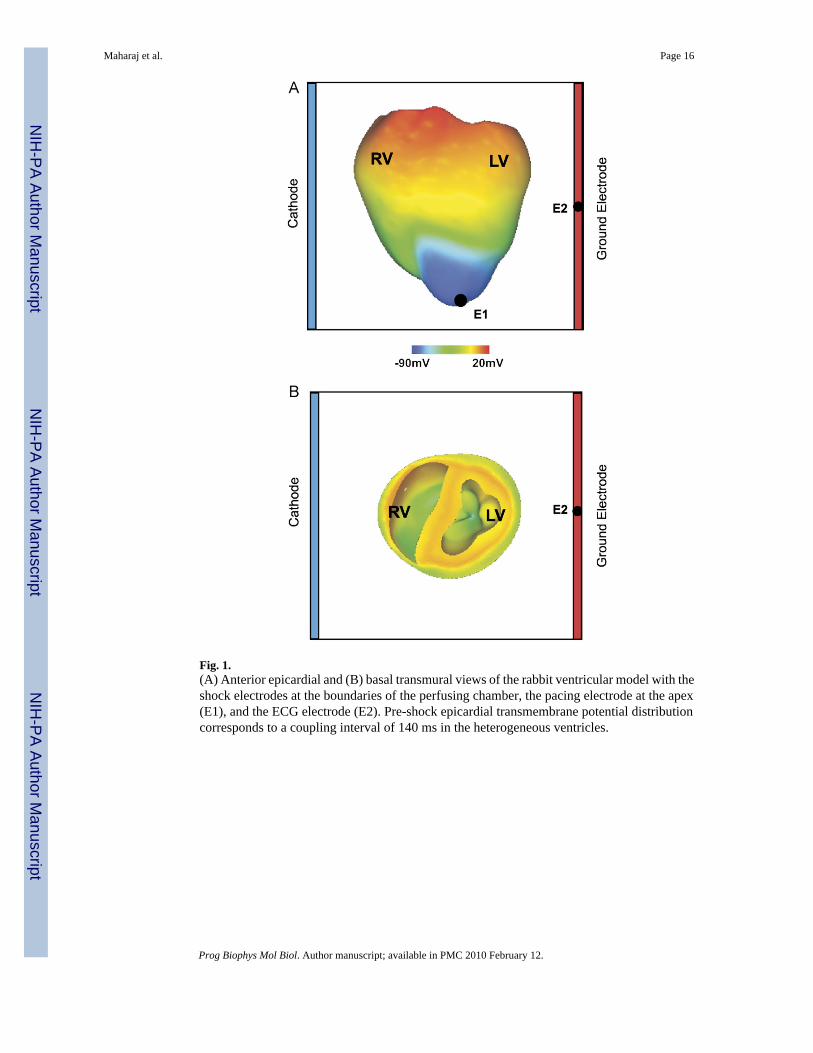
Fig. 1.(A) Anterior epicardial and (B) basal transmural views of the rabbit ventricular model with theshock electrodes at the boundaries of the perfusing chamber, the pacing electrode at the apex(E1), and the ECG electrode (E2). Pre-shock epicardial transmembrane potential distributioncorresponds to a coupling interval of 140 ms in the heterogeneous ventricles.
Maharaj et al. Page 16
Prog Biophys Mol Biol. Author manuscript; available in PMC 2010 February 12.
NIH
-PA Author Manuscript
NIH
-PA Author Manuscript
NIH
-PA Author Manuscript
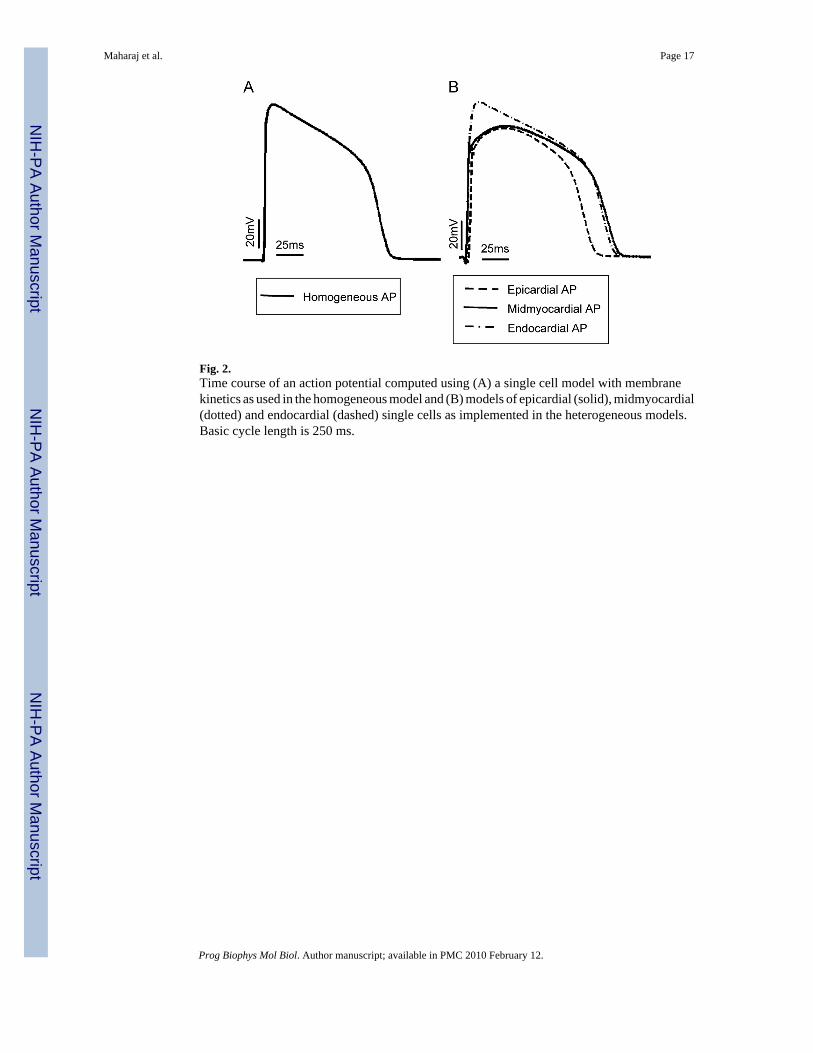
Fig. 2.Time course of an action potential computed using (A) a single cell model with membranekinetics as used in the homogeneous model and (B) models of epicardial (solid), midmyocardial(dotted) and endocardial (dashed) single cells as implemented in the heterogeneous models.Basic cycle length is 250 ms.
Maharaj et al. Page 17
Prog Biophys Mol Biol. Author manuscript; available in PMC 2010 February 12.
NIH
-PA Author Manuscript
NIH
-PA Author Manuscript
NIH
-PA Author Manuscript
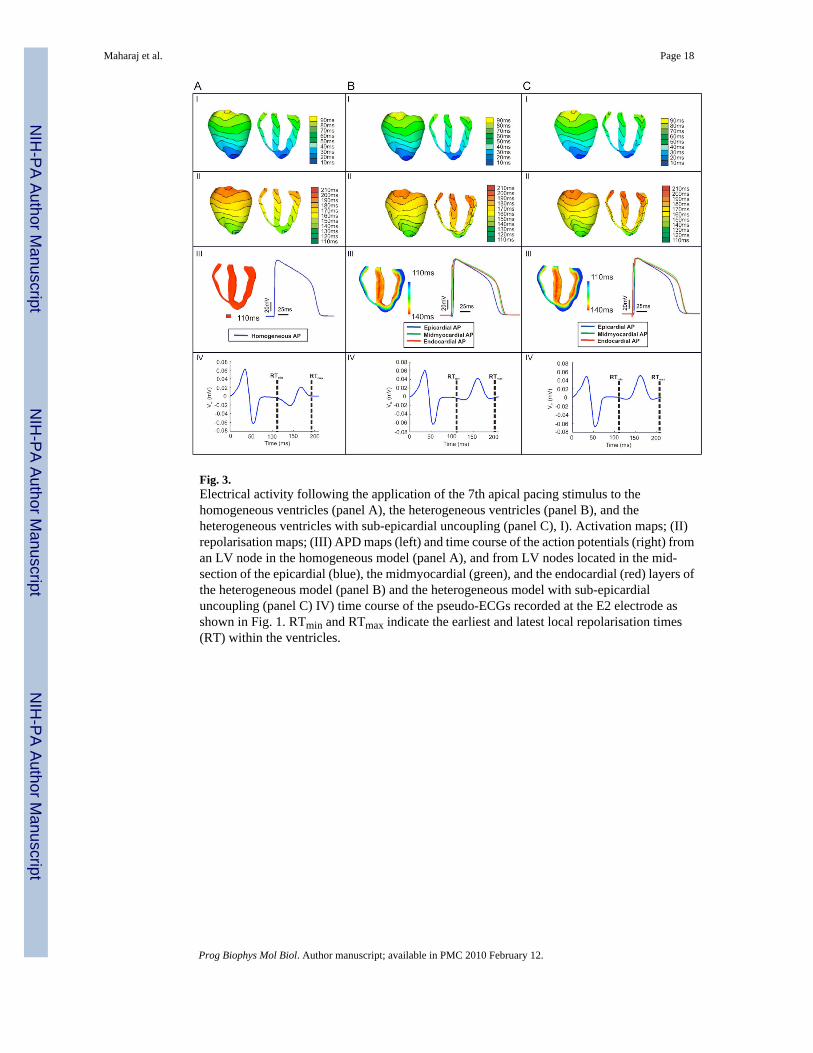
Fig. 3.Electrical activity following the application of the 7th apical pacing stimulus to thehomogeneous ventricles (panel A), the heterogeneous ventricles (panel B), and theheterogeneous ventricles with sub-epicardial uncoupling (panel C), I). Activation maps; (II)repolarisation maps; (III) APD maps (left) and time course of the action potentials (right) froman LV node in the homogeneous model (panel A), and from LV nodes located in the mid-section of the epicardial (blue), the midmyocardial (green), and the endocardial (red) layers ofthe heterogeneous model (panel B) and the heterogeneous model with sub-epicardialuncoupling (panel C) IV) time course of the pseudo-ECGs recorded at the E2 electrode asshown in Fig. 1. RTmin and RTmax indicate the earliest and latest local repolarisation times(RT) within the ventricles.
Maharaj et al. Page 18
Prog Biophys Mol Biol. Author manuscript; available in PMC 2010 February 12.
NIH
-PA Author Manuscript
NIH
-PA Author Manuscript
NIH
-PA Author Manuscript
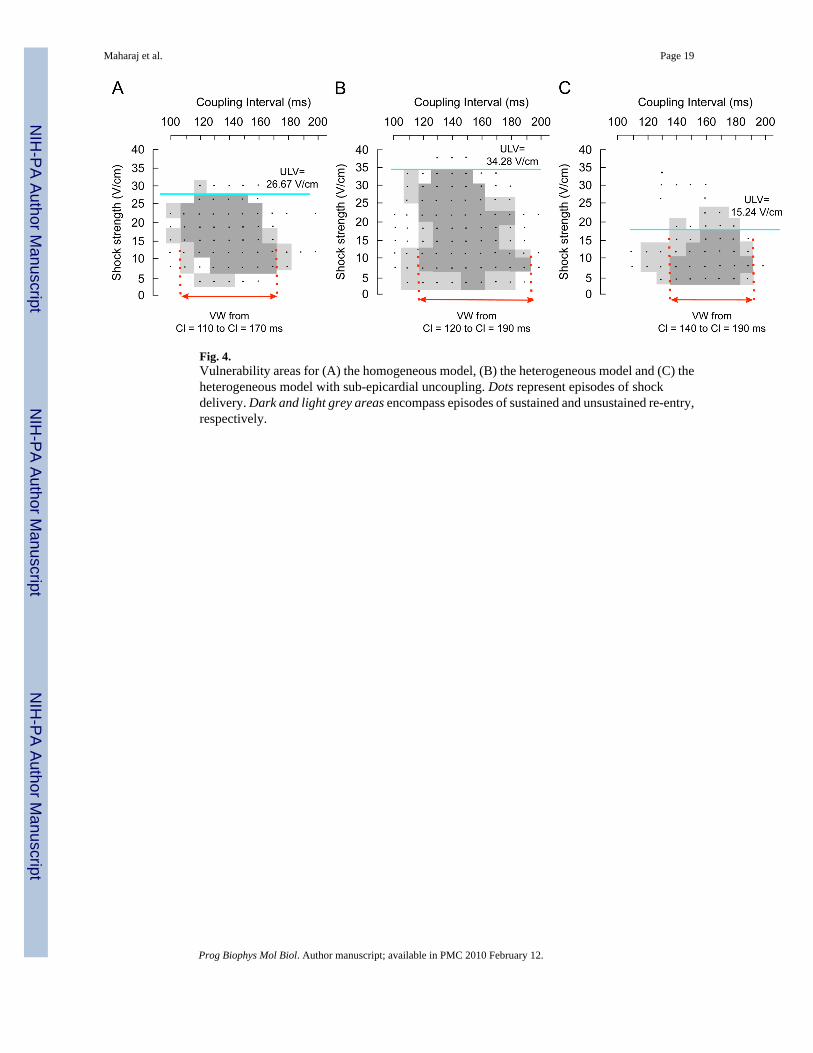
Fig. 4.Vulnerability areas for (A) the homogeneous model, (B) the heterogeneous model and (C) theheterogeneous model with sub-epicardial uncoupling. Dots represent episodes of shockdelivery. Dark and light grey areas encompass episodes of sustained and unsustained re-entry,respectively.
Maharaj et al. Page 19
Prog Biophys Mol Biol. Author manuscript; available in PMC 2010 February 12.
NIH
-PA Author Manuscript
NIH
-PA Author Manuscript
NIH
-PA Author Manuscript
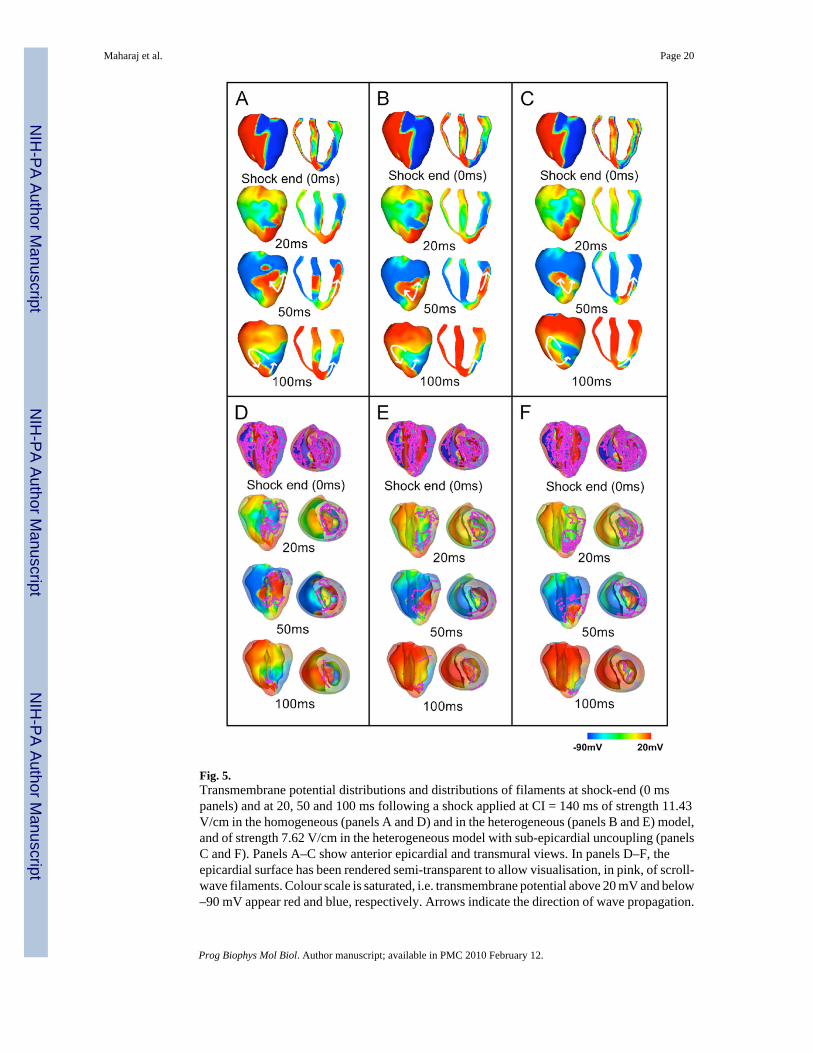
Fig. 5.Transmembrane potential distributions and distributions of filaments at shock-end (0 mspanels) and at 20, 50 and 100 ms following a shock applied at CI = 140 ms of strength 11.43V/cm in the homogeneous (panels A and D) and in the heterogeneous (panels B and E) model,and of strength 7.62 V/cm in the heterogeneous model with sub-epicardial uncoupling (panelsC and F). Panels A–C show anterior epicardial and transmural views. In panels D–F, theepicardial surface has been rendered semi-transparent to allow visualisation, in pink, of scroll-wave filaments. Colour scale is saturated, i.e. transmembrane potential above 20 mV and below–90 mV appear red and blue, respectively. Arrows indicate the direction of wave propagation.
Maharaj et al. Page 20
Prog Biophys Mol Biol. Author manuscript; available in PMC 2010 February 12.
NIH
-PA Author Manuscript
NIH
-PA Author Manuscript
NIH
-PA Author Manuscript
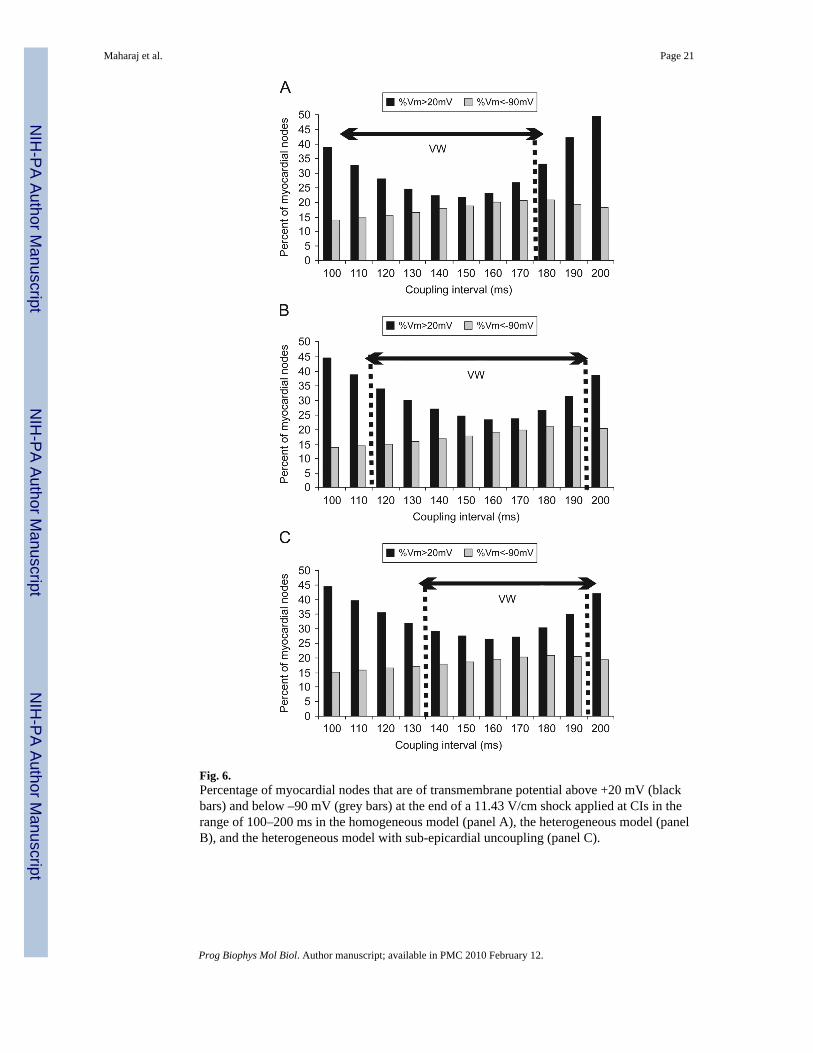
Fig. 6.Percentage of myocardial nodes that are of transmembrane potential above +20 mV (blackbars) and below –90 mV (grey bars) at the end of a 11.43 V/cm shock applied at CIs in therange of 100–200 ms in the homogeneous model (panel A), the heterogeneous model (panelB), and the heterogeneous model with sub-epicardial uncoupling (panel C).
Maharaj et al. Page 21
Prog Biophys Mol Biol. Author manuscript; available in PMC 2010 February 12.
NIH
-PA Author Manuscript
NIH
-PA Author Manuscript
NIH
-PA Author Manuscript
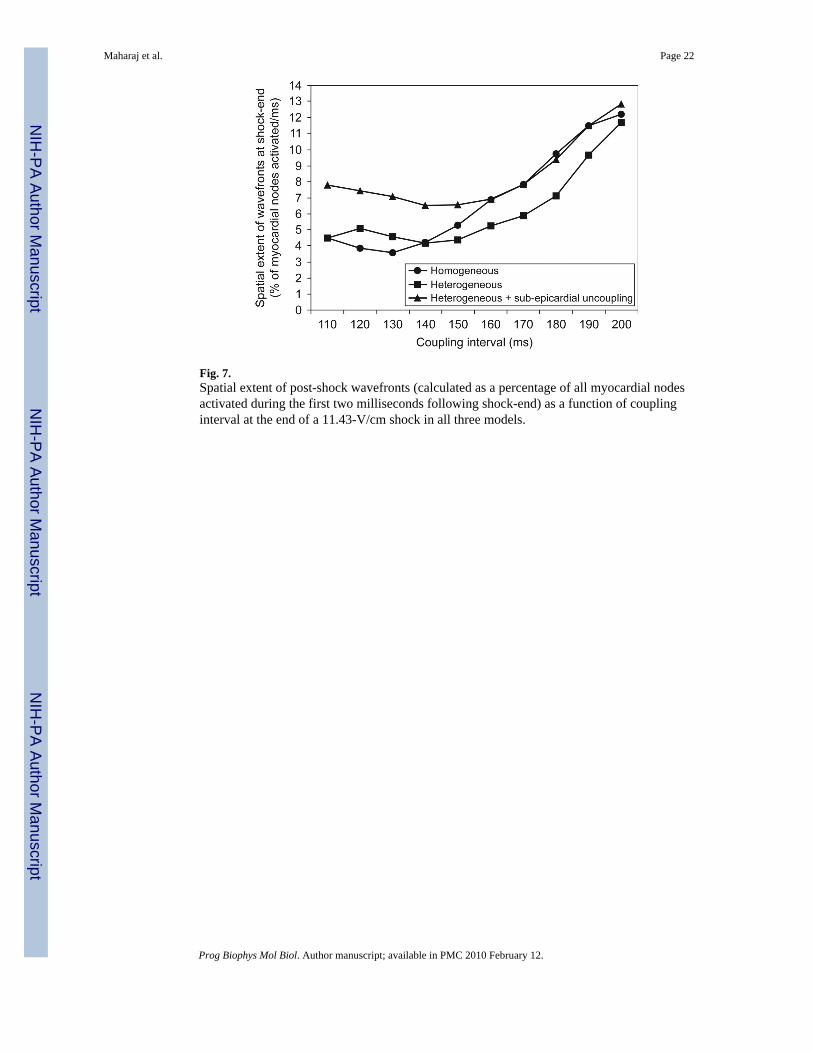
Fig. 7.Spatial extent of post-shock wavefronts (calculated as a percentage of all myocardial nodesactivated during the first two milliseconds following shock-end) as a function of couplinginterval at the end of a 11.43-V/cm shock in all three models.
Maharaj et al. Page 22
Prog Biophys Mol Biol. Author manuscript; available in PMC 2010 February 12.
NIH
-PA Author Manuscript
NIH
-PA Author Manuscript
NIH
-PA Author Manuscript
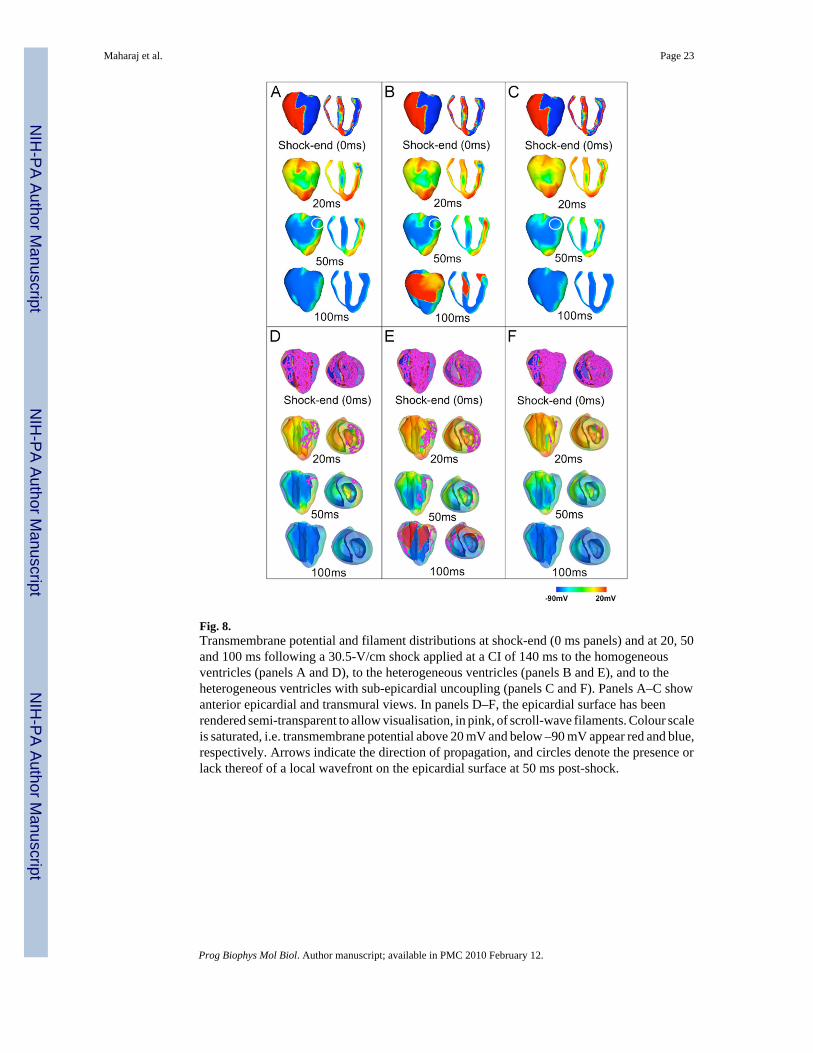
Fig. 8.Transmembrane potential and filament distributions at shock-end (0 ms panels) and at 20, 50and 100 ms following a 30.5-V/cm shock applied at a CI of 140 ms to the homogeneousventricles (panels A and D), to the heterogeneous ventricles (panels B and E), and to theheterogeneous ventricles with sub-epicardial uncoupling (panels C and F). Panels A–C showanterior epicardial and transmural views. In panels D–F, the epicardial surface has beenrendered semi-transparent to allow visualisation, in pink, of scroll-wave filaments. Colour scaleis saturated, i.e. transmembrane potential above 20 mV and below –90 mV appear red and blue,respectively. Arrows indicate the direction of propagation, and circles denote the presence orlack thereof of a local wavefront on the epicardial surface at 50 ms post-shock.
Maharaj et al. Page 23
Prog Biophys Mol Biol. Author manuscript; available in PMC 2010 February 12.
NIH
-PA Author Manuscript
NIH
-PA Author Manuscript
NIH
-PA Author Manuscript
NIH
-PA Author Manuscript
NIH
-PA Author Manuscript
NIH
-PA Author Manuscript
Maharaj et al. Page 24
Table 1
Scaling factors (SF) used to multiply the maximum conductances of Ito, IKs, IKr and INa in the homogeneousmodel, and in the epicardial, midmyocardial and endocardial layers of the heterogeneous models
Homogeneous Epicardium Midmyocardium Endocardium
SFto 0 1 0.425 0
SFKs 1 1.154 0.384 0.462
SFKr 1 1.530 0.574 1.147
SFNa 1 0.375 0.5 0.438
Prog Biophys Mol Biol. Author manuscript; available in PMC 2010 February 12.