loan supply shocks and the business cycle
TRANSCRIPT

Seediscussions,stats,andauthorprofilesforthispublicationat:https://www.researchgate.net/publication/256033043
LoanSupplyShocksandtheBusinessCycle
ARTICLE·SEPTEMBER2012
CITATIONS
6
READS
22
2AUTHORS,INCLUDING:
AlbertoMusso
EuropeanCentralBank
12PUBLICATIONS255CITATIONS
SEEPROFILE
Availablefrom:AlbertoMusso
Retrievedon:04February2016

© European Central Bank, 2012
AddressKaiserstrasse 29, 60311 Frankfurt am Main, Germany
Postal addressPostfach 16 03 19, 60066 Frankfurt am Main, Germany
Telephone+49 69 1344 0
Internethttp://www.ecb.europa.eu
Fax+49 69 1344 6000
All rights reserved.
ISSN 1725-2806 (online)
Any reproduction, publication and reprint in the form of a different publication, whether printed or produced electronically, in whole or in part, is permitted only with the explicit written authorisation of the ECB or the authors.
This paper can be downloaded without charge from http://www.ecb.europa.eu or from the Social Science Research Network electronic library at http://ssrn.com/abstract_id=2141791.
Information on all of the papers published in the ECB Working Paper Series can be found on the ECB’s website, http://www.ecb.europa.eu/pub/scientific/wps/date/html/index.en.html
Acknowledgements�The�financial�support�from�the�Spanish�Ministry�of�Science�and�Innovation�through�grant�ECO2009-09847�and�the�Barcelona�Graduate�School Research Network is gratefully acknowledged. The views expressed in this paper are those of the authors and do not necessarily reflect�those�of�the�European�Central�Bank.�The�authors�would�like�to�thank�for�useful�comments�Pooyan�Amir�Ahmadi,�Björn�Fischer,�James�Talbot�and�participants�to�the�presentation�of�previous�versions�of�this�paper�at�the�Royal�Economic�Society�2012�Annual�Confer-ence�(University�of�Cambridge,�Cambridge,�UK,�March�2012),�the�ECB�Workshop�on�“The�role�of�credit�in�the�macroeconomy”�(ECB,�Frankfurt,�Germany,�May�2012)�and�the�27th�Annual�Congress�of�the�European�Economic�Association�(University�of�Málaga,�Málaga,�Spain,�August�2012).�We�are�grateful�also�to�Ryland�Thomas�for�very�useful�input�on�the�data�for�the�UK.
Luca Gambettiat�Universitat�Autonoma�de�Barcelona,�B3.1130�Departament�d’Economia�i�Historia�Economica,�Edifici�B,�Bellaterra�08193,�Barce-lona, Spain; e-mail: [email protected]
Alberto Mussoat�European�Central�Bank,�Kaiserstrasse�29,�D-60311�Frankfurt�am�Main,�Germany;�e-mail:�alberto [email protected]�

Abstract
This paper provides empirical evidence on the role played by loan supply shocks
over the business cycle in the Euro Area, the United Kingdom and the United States
from 1980 to 2010 by applying a time-varying parameters VAR model with stochastic
volatility and identifying these shocks with sign restrictions. The evidence suggests
that loan supply shocks appear to have a signi�cant e¤ect on economic activity
and credit market variables, but to some extent also in�ation, in all three economic
areas. Moreover, we report evidence that the short-term impact of these shocks on
real GDP and loan volumes appears to have increased in all three economic areas
over the past few years. The results of the analysis also suggest that the impact of
loan supply shocks seems to be particularly important during slowdowns in economic
activity. As regards to the most recent recession, we �nd that the contribution of
these shocks can explain about one half of the decline in annual real GDP growth
during 2008 and 2009 in the Euro Area and the United States and possibly about
three fourths of that observed in the United Kingdom. Finally, the contribution of
loan supply shocks to the decline in the annual growth rate of loans observed from
the peaks of 2007 to the troughs of 2009/2010 was slightly less than half of the total
decline in all three economic areas considered.
JEL classi�cation: C32; E32; E51.
Keywords: Loan supply; Business cycle; Euro Area; UK; US; time-varying VAR; sign restric-tions.
1

Non-technical summary
It is widely agreed that financial intermediaries and credit markets more in general appear to
have played a significant role in the context of the events which led to the severe recession
experienced during 2008 and 2009 by advanced economies such as the Euro Area, the United
Kingdom and the United States. Together with a number of other historical episodes in recent
decades, such as the well documented “capital crunch” during the early 1990s recession in the
US, these represent clear indications that credit markets may play a non-negligible role over the
business cycle on a recurrent basis. In the context of understanding the role of credit markets
over the business cycle, from a policy perspective it is important to assess the relative role of
supply and demand forces in driving credit, output and inflation developments, as these factors
may call for a very different response of monetary and fiscal policy. For example, an insufficient
provision of loans to the private sector by banks caused by balance sheet constraints affecting
financial intermediaries may require a different policy response compared to the case of
declining loan growth due to declining demand from households and enterprises. In the former
case measures to directly support the banking system may be needed, while in the latter case
measures to directly support the real economy are likely to have priority. Another key
challenge which policy-makers face is to disentangle the role of credit markets as propagators of
shocks originating in other sectors of the economy (such as technological innovations,
unexpected changes in oil prices or investors' changes in confidence, to make few examples
relating to both aggregate supply and aggregate demand shocks) and as impulse mechanisms,
that is sources of disturbances or shocks. Indeed, the provision of loans to the private sector by
banks depends on the state of banks’ capital and financing capability, which in turn change both
(endogenously) due to the economy's changing conditions as well as (exogenously) due to
factors directly affecting banks balance sheets. Clearly, the source of the potential problem is
different in these two cases.
Against this background, it is important to quantify the contribution of supply shocks to loan
growth. In this paper we propose a methodology which allows for such contributions to be
estimated in the context of an empirical model which takes into account potentially important
changes in the macroeconomy. To account for possibly significant changes in the
macroeconomic environment is a potentially very important step in deriving reliable estimates
of the impact of loan supply shocks, as major changes have been taking place in recent years,
including the so-called Great Moderation starting in the mid-1980s to the early 1990s until the
recent crisis started. Thus, we apply a time-varying parameter VAR with stochastic volatility
and identify loan supply shocks with sign restrictions on impulse response functions. Moreover,
2
we provide a systematic comparison of the role of loan supply shocks over the business cycle
across the Euro Area, the United Kingdom and the United States from 1980 to 2010.
The main results of the empirical analysis are the following. First, loan supply shocks appear
to have a significant effect on economic activity and credit markets, but to some extent also
inflation, in all three economic areas. However, some differences across geographic areas can
also be uncovered. For example, the short-term impact on real GDP and loan volumes appears
to be stronger in the United States and, especially for loan growth, in the United Kingdom,
than in the Euro Area. Second, the impact of these shocks may have changed over time, as for
example the short-term impact of these shocks on real GDP and loans seems to have increased
in all three economic areas over the past few years. Third, it appears that the contribution of
loan supply shocks is particularly important during slowdowns. For example, the contribution
of these shocks can explain about one half of the decline in annual real GDP growth during
2008 and 2009 in the Euro Area and the United States and possibly about three fourths of that
observed in the United Kingdom. Finally, the contribution of loan supply shocks to the decline
in the annual growth rate of loans observed from the peaks of 2007 to the troughs of
2009/2010 was slightly less than half of the total decline in all three economies considered.
3

1 Introduction
Financial intermediaries and credit markets more in general appear to have played a
signi�cant role in the context of the events which led to the severe recession experienced
during 2008 and 2009 by advanced economies such as the Euro Area, the United Kingdom
and the United States. Indeed, the economic crisis was preceded and accompanied
by �nancial turbulence in various segments of �nancial markets, such as the US sub-
prime mortgage market and the international interbank short-term liquidity market.
Moreover, Lehman Brothers�default in September 2008 clearly exacerbated the �nancial
and economic crisis, also bringing at the centre of the attention questions regarding the
actual state of banks�balance sheets and their ability to provide loans to households and
non-�nancial corporations to �nance consumption and investment expenditure, among
other e¤ects. In addition, it is widely agreed that speci�c developments in the banking
industry, such as the process of securitisation and the increasing recourse to short-term
debt, contributed markedly to the lending boom and housing bubble of the mid-2000s
and subsequent credit slowdown and house price fall (Brunnermeier, 2009; Diamond and
Rajan, 2009; Gorton, 2009).
From a policy perspective it is important to assess the relative role of supply and
demand forces in driving credit, output and in�ation developments, especially during
periods around crises such as the recent one. Indeed, these factors may call for a very
di¤erent response of monetary and �scal policy. Clearly, an insu¢ cient provision of loans
to the private sector by banks caused by balance sheet constraints a¤ecting �nancial
intermediaries may require a di¤erent policy response compared to the case of declining
loan growth due to declining demand from households and enterprises. Thus, for a
central bank it is essential to know whether loan �ows to the private sector decline
mainly because of problems a¤ecting balance sheets of banks or largely because the
demand for credit is diminishing. In the former case measures to support the banking
system may be needed, while in the latter case measures to support the real economy
may have priority. Another key challenge which policy-makers face is to disentangle the
role of credit markets as propagators of shocks originating in other sectors of the economy
(such as technological innovations, unexpected changes in oil prices or investors�changes
in con�dence, to make few examples relating to both aggregate supply and aggregate
demand shocks) and as impulse mechanisms, that is sources of disturbances or shocks.
Indeed, the provision of loans to the private sector by banks depends on the state of
banks�capital and �nancing capability, which in turn change both (endogenously) due
to the economy�s changing conditions as well as (exogenously) due to factors directly
a¤ecting banks balance sheets. Clearly, the source of the potential problem is di¤erent
in these two cases.
4

Against this background, a key challenge for policy-makers is to quantify the con-
tribution of supply shocks to loan growth. The purpose of this paper is to propose a
methodology which allows for such contributions to be estimated in the context of an
empirical model which takes into account potentially important changes in the macro-
economy and to provide some empirical evidence for the Euro Area, the United Kingdom
and the United States. To account for possibly signi�cant changes in the macroeconomic
environment is a potentially very important step in deriving reliable estimates of the im-
pact of loan supply shocks, as major changes have been taking place in recent years.
For example, there is evidence that the volatility of shocks my have changed over time
(Cogley and Sargent, 2005, Fernández-Villaverde and Rubio-Ramírez, 2010). Moreover,
in addition to the evidence for a Great Moderation starting in the mid-1980s to the
early 1990s, depending on the countries considered, the recent economic and �nancial
crisis may have induced a further gradual structural change in the economy, for example
a¤ecting persistently economic agents�risk aversion, and although it may be too early
to conclude to which extent fundamental underlying changes may have taken place it is
important to allow for them. Thus, it is critical to estimate the impact of loan supply
shocks in a framework which allows for possible changes in stochastic volatility and time-
varying parameters. The model we use, a time-varying parameter VAR with stochastic
volatility, seems particularly suited for the purpose of this paper. This is one of the main
advantages of the approach adopted in this study compared to the macroeconomic liter-
ature which has attempted to estimate the e¤ects of loan supply shocks, which typically
is based on �xed parameters and constant volatility models (Lown and Morgan, 2006;
Bassett et al., 2010; Busch et al., 2010; Ciccarelli et al., 2010; De Nicolò and Lucchetta,
2011; Gilchrist and Zakraj�ek, 2011; Hristov et al., 2011). The identi�cation of loan sup-
ply shocks we adopt is based on sign restrictions. The latter have been applied before
to identify these shocks (see for example Musso, 2009; Busch et al., 2010; De Nicoló and
Lucchetta, 2011; Hristov et al., 2011), but the way they have been speci�ed has in most
cases limitations which we try to overcome, as we will argue below. A parallel literature,
based on microeconomic data for banks and/or �rms, provides some insight into the rele-
vance of credit supply shocks for recent loan developments in a number of economies (see
for example, Albertazzi and Marchetti, 2010; Berrospiedo and Edge, 2010; Jiménez et al,
2012). These contributions, which can be seen as providing complementary evidence to
the question addressed in this paper, are however conditioned by the more limited time
span of the available data and econometric di¢ culties in applying time-varying parame-
ters, thus forcing their authors to assume constant parameters, as opposed to the present
contribution. Moreover, our paper is the �rst to provide a systematic comparison across
the Euro Area, the United Kingdom and the United States.
The main results of the empirical analysis are the following. First, loan supply
5

shocks appear to have a signi�cant e¤ect on economic activity and credit markets, but
to some extent also in�ation, in all three economic areas. However, some di¤erences
across geographic areas can also be uncovered. For example, the short-term impact on
real GDP and loan volumes appears to be stronger in the United States and, especially
for loan growth, in the United Kingdom, than in the Euro Area. Second, the impact
of these shocks may have changed over time, as for example the short-term impact of
these shocks on real GDP and loans seems to have increased in all three economic areas
over the past few years. Third, it appears that the contribution of loan supply shocks is
particulary important during slowdowns. For example, the contribution of these shocks
can explain about one half of the decline in annual real GDP growth during 2008 and
2009 in the Euro Area and the United States and possibly about three fourths of that
observed in the United Kingdom. Finally, the contribution of loan supply shocks to the
decline in the annual growth rate of loans observed from the peaks of 2007 to the troughs
of 2009/2010 was slightly less than half of the total decline in all three economic areas.
The remainder of the paper is structured as follows. Section 2 illustrates the empirical
approach and describes the data. Section 3 reports and discusses the results. Section 4
provides conclusions.
2 The empirical approach
In this section we describe the econometric model used as well as the data for the three
economic areas considered.
2.1 The model
We carry out the analysis using a time-varying VAR model with stochastic volatility.
Over the last few years, this model has become a quite popular tool in macroeconomics
to address questions related to the evolution of the structure of the economy and the
volatility of the shocks (see Cogley and Sargent, 2005, Primiceri, 2005, Benati, 2008,
Canova and Gambetti, 2009, Gali and Gambetti, 2009). Moreover, D�Agostino, Gam-
betti and Giannone (2011) shows that the model has a good forecasting performance.
Let yt be a vector containing the variables of interest (real GDP, consumer prices,
loan volumes, a composite lending rate and a reference short-term interest rate) and
assume it satis�es
yt = A0;t +A1;tyt�1 + :::+Ap;tyt�p + "t (1)
where A0;t is a vector of time-varying intercepts, Ai;t are matrices of time-varying coef-
�cients, i = 1; :::; p and "t is a Gaussian white noise with zero mean and time-varying
covariance matrix �t. Let At = [A0;t; A1;t:::; Ap;t], and �t = vec(A0t); where vec(�) is
6

the column stacking operator. Conditional on such an assumption, we postulate the
following law of motion for �t:
�t = �t�1 + !t (2)
where !t is a Gaussian white noise with zero mean and covariance . We let �t = FtDtF0t ,
where Ft is lower triangular, with ones on the main diagonal, and Dt a diagonal matrix.
Let �t be the vector of the diagonal elements of D1=2t and �i;t, i = 1; :::; n�1 the column
vector formed by the non-zero and non-one elements of the (i + 1)-th row of F�1t . We
assume that
log �t = log �t�1 + �t (3)
�i;t = �i;t�1 + i;t (4)
where �t and i;t are Gaussian white noises with zero mean and covariance matrix �
and i, respectively. Let �t = [�01;t; : : : ; �0n�1;t], t = [ 01;t; : : : ;
0n�1;t], and be the
covariance matrix of t. We assume that i;t is independent of j;t, for j 6= i, and
that �t, t, !t, "t are mutually uncorrelated at all leads and lags. Details about the
estimation can be found in Appendix A.
The impulse response functions in this model are derived from the approximated MA
representation
yt = �t + Ct(L)"t (5)
where Ct(L) =P1k=1Ck;tL
k, C0;t = I, �t =P1k=0Ck;tA0t, Ck;t = Sn;n(Akt ), At =�
AtIn(p�1) 0n(p�1);n
�and Sn;n(X) is a function which selects the �rst n rows and n columns
of the matrix X.
Structural impulse response functions are derived using the (lower triangular) Cholesky
factor St of �t (StS0t = �t) and any orthogonal matrix Ht (HtH 0t = I). The class of
structural representation is therefore de�ned as
yt = �t + Ct(L)StHtet (6)
where et = H 0tS�1t "t and Dt(L) = Ct(L)StHt are the impulse response functions to
structural shocks.
2.2 Data
For each economy we estimate one model including �ve variables: real GDP, a consumer
price index, non-�nancial private sector loan volumes, a composite lending rate and a
reference short-term interest rate. Chart 1 shows all time series used in the analysis, while
details on the de�nition, treatment and sources of the data are reported in Appendix B.
The evolution of real GDP growth shows how all three economic areas experienced
recessions in similar periods (the early 1980s, the early 1990s and between 2008 and
7

2009), although with some variation in terms of turning points. Moreover, the data are
consistent with the evidence for a Great Moderation from the mid-1980s until the most
recent crisis. It is striking how synchronised and of similar magnitude the slowdown in
real GDP growth was between 2008 and 2009 across these economic areas.
The consumer price index selected for each economic area is that representing the
main reference for the corresponding central bank: the harmonised index of consumer
prices (HICP) for the Euro Area, the retail prices index (RPI) for the United Kingdom
and the consumer price index (CPI) for the United States. In all three economic areas it is
apparent how in�ation gradually declined during the 1980s and has been at relatively low
and stable levels since the early 1990s, with signs of increased volatility only reappearing
over the last few years.
The reference short-term interest rates are represented by the 3-month Treasury bill
rates for the United Kingdom and the United States, while for the Euro Area we use
the 3-month Euribor up to the beginning of the recent crisis. The crisis which started
in August 2007 a¤ected interbank money markets signi�cantly with a loss of con�dence
and associated disruption of unsecured interbank lending market, implying that the
corresponding interest rates (Euribor or Eonia) may be of questionable representativeness
as reference interest rates. Thus, we use the 3-month Euro Repo rate, for secured
interbank lending, from 2007 onwards as a reference short-term interest rate for the
Euro Area.
As regards to loan volumes, we consider series which correspond to indices for the
outstanding amounts of loans granted by �nancial intermediaries to households and non-
�nancial corporations, corrected for the impact of loan sales and securitisation. The latter
correction is important to gauge the amount of loans originated by banks, as in recent
years the fraction of loans granted and subsequently securitised and taken o¤ banks�
balance sheets has been signi�cant. For the US we use data from the �ow of funds
statistics, which include not only loans obtained by US households and non-�nancial
corporations by commercial banks, which in contrast to the Euro Area and to some
extent also the United Kingdom represent only a small fraction to total loans obtained
by these sectors, but also loans from other sources (see for example ECB, 2009). The
data show how the credit cycles in the three economic areas appear to be relatively
synchronised.
For the composite lending rates a weighted average of lending rates for loans to house-
holds and for loans to non-�nancial corporations are used, with weights corresponding to
the respective loan outstanding amounts. Since no o¢ cial series exists for any of these
economic areas, we have constructed such series using available interest rates and (for the
weights) loan data for the various loan categories. These series have some limitations,
especially for the 1980s, as they do not cover all types of loans and are based on data
8

not fully harmonised (for example across Euro Area countries, especially for the 1980s
and to some extent also 1990s). The constructed series do not display unexplainable
movements or excessive volatility and they seem to behave similarly across the three
economic areas, but the limited quality of these data represents a source of uncertainty
for the results of any analysis like the present one.
2.3 Identi�cation
We identify three shocks: a loan supply shock, an aggregate supply shock and an ag-
gregate demand shock. Intuitively, a loan supply shock can be associated with various
events, such as unexpected changes in bank capital available for loans (for example due
to a change in regulatory capital ratio requirements), changes in bank funding (for in-
stance following bank runs or the introduction of credible deposit insurance schemes or
changes in the ceiling of the latter), changes in the risk perception of potential borrowers
by bank management (for example following changes in key bank managerial positions
or innovations in bank monitoring technology) or changes in the degree of competition
in the banking sector. Examples of aggregate supply shocks include technology or pro-
ductivity shocks, oil price shocks and labour supply shocks. Aggregate demand shocks
include consumption or preference shocks, investment demand shocks, monetary policy
shocks and �scal policy shocks.
Although the main focus of the paper is on loan supply shocks, identi�cation of
aggregate supply and demand disturbances helps the identi�cation of the loan supply
shock. Identi�cation is achieved by means of sign restrictions. As conventionally done, it
is assumed that aggregate supply shocks move output and prices in the opposite direction,
while aggregate demand shocks a¤ect the two variables with a response of the same sign.
The three shocks, if expansionary (i.e., if causing an expansion in real GDP growth),
increase loan supply (while contractionary shocks will have symmetric e¤ects). However,
while expansionary aggregate demand and supply shocks increase the lending rate, loan
supply shocks reduce it. The restrictions are summarized in Table 1 and are imposed
on the variables only on impact (the sensitivity analysis section provides a discussion of
how results change if restrictions are imposed also up to three periods after the shock).
No restriction is imposed on the sign of the responses of short-term interest rates to any
shock.
The idea underlying these restrictions is that, in the case of an expansionary loan
supply shock, if a bank decides exogenously to expand the supply of loans to the private
sector it would do so by increasing the quantity made available and/or by decreasing the
lending rate (or, more likely, both), such that at aggregate level both e¤ects are observed.
This would have an expansionary e¤ect on output as households would borrow more and
use some of these funds to expand their consumption and enterprises would borrow more
9

and use some of these funds to expand their investments. However, in contrast to other
studies (for example, Busch et al. 2010) we leave the e¤ect on in�ation unspeci�ed as
it is to some extent uncertain. Indeed, while the increased consumption and investment
expenditure would imply in�ationary pressures, the lower lending rate implies a lower
cost to �rms which could potentially respond by decreasing prices of their products. Since
it is not obvious which e¤ect might prevail, we leave this impact unspeci�ed. Hristov et
al. (2011) provide a discussion on how some benchmark DSGE models with a banking
sector lead to e¤ects consistent with those imposed here for loan volumes and spreads
(or lending rates) and real GDP, while the e¤ect on aggregate prices is ambiguous.
The results suggest that the loan supply shock identi�ed has di¤erent features than
a standard monetary policy shock, as for example the former leads to a decrease in
short-term interest rates but a decrease in in�ation in the short run. Nevertheless, the
robustness section also identi�es a fourth shock, a standard monetary policy shock, and
shows that results for the loan supply shock are very similar. As regards aggregate
supply and aggregate demand shocks, it is assumed that expansionary shocks of either
category would induce an increase in the demand for loans, leading to an increase in loan
quantities as well as an increase in the lending rate. Note that the aggregate demand
shock includes also loan demand shocks, but we do not di¤erentiate the latter from other
aggregate demand shocks as the variables included in the model do not allow for such
distinction. The restrictions are imposed on the lending rate and not on the spread
between the lending rate and the short-term interest rate as changes in the latter as well
as loan volumes may also be induced by shocks other than loan supply, including for
example wealth shocks (i.e. an expansionary wealth shock may induce an increase in the
demand for loans, leading to a possible increase in the lending rate but also in�ationary
pressures with a possible increase in the policy rate, with an uncertain sign of the spread
in the short run). The robustness analysis section shows, however, that results are very
similar if instead the restriction is imposed on the spread.
Technically speaking, at each point in time and for each draw of the reduced form
coe¢ cients we draw Ht in such a way that the elements of each row represent the coordi-
nates of a point uniformly distributed over the unit hypersphere and that is orthogonal
to the other points de�ned by the remaining columns, see Rubio-Ramirez, Waggoner and
Zha (2009).
3 Results
3.1 Evidence of time-variation
The evolution of the residual time-varying variances is shown in Chart 2. In most
cases there is evidence of signi�cant time-variation in the residual variances, with spikes
10

appearing most often in the most recent years in correspondence to the latest economic
and �nancial crisis. Moreover, for interest rate there are clear signs of a decrease in their
volatility during the �rst half of the sample. Overall, the evidence supports the use of
stochastic volatility speci�cations for all three models.
Table 2 shows the posterior mean of the trace of as well as 68% con�dence bands
and the trace of 0 (i.e. the prior variance-covariance matrix). This is a way to establish
whether time-variation in the parameters is a feature of the data, see Cogley and Sargent
(2005). In all three cases, it appears to be the case that the trace of 0 is lower than
the 16% percentile, pointing to the presence to time-variation in the data, as the sample
points towards greater time-variation in the parameters than that of the prior selected.
3.2 The average e¤ect of loan supply shocks
The average impulse response functions to loan supply shocks over the whole sample
period show remarkable similarities across the three economic areas. The posterior mean
of the impulse responses and the 68% con�dence bands appear in most cases very similar
(see Chart 3). For example, an expansionary loan supply shock seems to have a large
but short-lasting (less than a year) impact on real GDP in all three cases. However,
it appears to be stronger in the short run for the United Kingdom and United States,
than for the Euro Area, although only moderately so. Moreover, for all three economic
areas the impact on in�ation tends to be negative in the short run but positive in the
medium run, suggesting that beyond the very short run the channel operating through
the expansion of demand seems to prevail. However, in most cases the response of
in�ation is very close to zero. On average, expansionary loan supply shocks seem to
correspond to a larger increase in loan volumes in the United States and especially the
United Kingdom compared to the Euro Area, and to a bigger decline in the lending rate in
the United Kingdom than in the Euro Area and United States. However, the persistence
of the e¤ect of the initial shocks tends to di¤er across areas, with a longer-lasting e¤ect
appearing for both loan volumes and the lending rate in the United Kingdom.
It can be noticed that for the Euro Area and the United States the average short-term
response of real GDP growth to a loan supply shock appears to be stronger than that of
loan growth, which may appear puzzling at �rst sight. However, a possible explanation
of such result can be associated with the possible reaction of �rms to such shock: for
example, in the presence of an adverse loan supply shock, �rms may decide to cut
immediately investments, with negative consequences for real GDP growth, while at the
same time compensate for the lower availability of new loans by drawing on previously
agreed upon credit lines, for example in order to maintain their stocks of products and
for other short-term expenses. It can also be noticed that, as already mentioned, loan
supply shocks tend to be associated with a decline in short-term interest rates in the
11

short term but also with a decline in in�ation in the short term, thus suggesting that
these shocks have di¤erent e¤ects than standard monetary policy shocks.
The average importance of loan supply shocks can be assessed on the basis of variance
decompositions, shown in Chart 4 for various horizons. Overall, these shocks seem to
explain a sizeable fraction of the variance of all variables in all three economic areas,
especially beyond the very short horizon of one quarter. In all three areas, these shocks
appear to explain about one �fth of the variance of both real GDP growth and in�ation.
Loan supply shocks seem to explain a larger fraction of the variance of loan volumes
in all three cases, ranging between 20% and 30% beyond very short horizons. Loan
supply shocks appear to be less important to explain the variance of interest rates (both
the lending rate and the short-term interest rate), explaining between 10% and 20% on
average.
3.3 The evolution of the e¤ect of loan supply shocks over time
The evolution of the impulse responses over time for di¤erent horizons suggests that some
time-variation can be detected in several cases (see Charts 5 to 9, as well as Appendix C).
In general, it appears that the short-term impact of these shocks on real GDP and loans
may have increased in all three economic areas over the past few years (see Charts 5 and
7). For loan growth, also the medium-run (i.e. one- to three-year) impact of loan supply
shocks seems to have increased in the most recent years (see Chart 7). For in�ation,
the response to loan supply shocks appears to be most often close to zero (Chart 6).
Finally, the responses of the lending rate and the short-term interest rate appear to have
remaind close to zero beyond the short term in all three areas over the whole period,
with at most signs of a slightly stronger response of the lending rate in the initial part
of the sample in all three economic areas (see Chart 8).
Observing variance decompositions over time also provides some impression of time-
variation in some cases (see Chart 10 and Appendix D). More speci�cally, the fraction
of real GDP growth variance explained by loan supply shocks appears to have increased
in the Euro Area since the mid-1990s and in the United States since the early 2000s.
Similar evidence can be detected for the lending rate. By contrast, for in�ation, loan
growth and short-term interest rates no major signs of time-variation can be detected in
all three economic areas.
The evolution of the e¤ect of loan supply shocks can also be assessed on the basis
of historical decompositions, or counterfactuals (which indicate how each variable would
have evolved in the absence of these shocks). Overall, it appears that the contribution
of loan supply shocks is particulary important during slowdowns (see Chart 11). For
example, the contribution of these shocks can explain about one half of the decline in
annual real GDP growth during 2008 and 2009 in the Euro Area and the United States
12

and possibly about three fourths of that observed in the United Kingdom. Similarly, in
all three economic areas loan supply shocks appear to have contributed to a large extent
to the recessions of the early 1990s. Loan supply shocks accounted also for signi�cant
fractions in the evolution of loan volumes in all three economies over the whole sample
period. In particular, in the absence of loan supply shocks the decline in the annual
growth rate of loans observed from the peaks of 2007 to the troughs of 2009/2010 would
have been about 30% smaller in the United States and 40% smaller in both the Euro Area
and the United Kingdom. The sensitivity exercises suggest that these estimates may be
slightly higher for the Euro Area and United States, but the di¤erence is minor and does
not change the picture substantially. Loan supply shocks also contributed to drive the
evolution of in�ation and interest rates in all three economies in speci�c periods. This
appears to be the case, for example, for the decline in in�ation in 2009 as well as the
declines in the lending rate and short-term interest rates from 2008 to 2010.
3.4 The role of loan supply shocks during speci�c recessions and recoveries
As discussed in the previous section, counterfactuals indicate that loan supply shocks
appear to have played signi�cant roles in driving both the early 1990s and the 2008/2009
recessions in all three economic areas. This is con�rmed by the impulse responses of real
GDP especially during the most recent recession in all three economies, as the impact
responses are clearly stronger than the average ones (see Charts 12 to 14).1 By contrast,
the di¤erence between the responses during the early 1990s recession do not seem very
much di¤erent from the average ones. Similar evidence emerges for the responses of loans
to loan supply shocks, with stronger impacts observed for the most recent recession,
especially for the Euro Area and the United Kingdom, while not much di¤erence can be
observed for the early 1990s recession.
A comparison of the responses across recent recessions and the subsequent recoveries
- de�ned here as developments in the four quarters following the trough - suggests that
no major asymmetries emerge. In particular, in most cases the response of real GDP
to loan supply shocks during the recessions discussed and subsequent recoveries appears
very similar. Similarly, the responses of loan growth to the loan supply shock are very
similar across these recessions and recoveries. Thus, there does not seem to emerge
evidence of systematic asymmetries across business cycle phases in the response of loan
supply shocks.
1Turning points are those identi�ed by the CEPR Euro Area Business Cycle DatingCommittee for the Euro Area and the NBER Business Cycle Dating Committee for theUnited States, while for the United Kingdom they are based on real GDP growth withrecessions de�ned as periods of two or more consecutive negative quarter-on-quartergrowth rates.
13

Beyond counterfactuals and impulse responses during speci�c business cycle phases,
the series of structural shocks can also provide useful information on the role of loan
supply shocks around recession periods. Moreover, a visual inspection of these series
can provide an indirect way to assess the plausibility of the method adopted to identify
loan supply shocks. Indeed, although there is no perfect way to assess whether the
shocks identi�ed correspond in fact to exogenous or unexpected changes in loan supply,
an informal assessment of their plausibility can be undertaken by observing the series of
structural shocks and discussing particular spikes with reference to anecdotal information
on real world events. Chart 15 shows the series for the loan supply shocks for all three
economic areas. It can be observed that large negative spikes can be found in all three
cases in the periods around the default of Lehman Brothers (September 2008), which
presumably had an immediate unexpected adverse e¤ect on the balance sheet of most
banks, among other e¤ects. For the Euro Area three negative spikes can be seen from
2008Q2 to 2008Q4 and a bigger one in 2009Q1, while for the United Kingdom and the
United States two consecutive negative spikes can be found for 2008Q2 and 2008Q3.
Moreover, for the United States large negative spikes can also be observed in the early
1990s, in coincidence with the so-called "capital crunch " associated to the early 1990s
recession (Bernanke and Lown, 1991; Peek and Rosengren, 1995) and in 1999, in the
aftermath of the Long-Term Capital Management crisis.2 Overall, it can be observed that
in all three economies considered a number of consecutive negative spikes can be found
during the most of the main recessions. Moreover, these series are in line with a signi�cant
role played by adverse loan supply shocks during the early 1990s and 2008/2009 recessions
in all three economies.
3.5 Sensitivity analysis
In order to assess the robustness of results, we undertake various exercises. First, we
examine how the main results change if the identi�cation restrictions are imposed on
more than one period, up to four periods. Second, we carry out the analysis estimating
the model with only four variables, that is without the short-term interest rate which
was not used in the identi�cation scheme but was included as a core variable typically
included in VARs. Third, we estimate the model with only four variables but with the
spread between the lending rate and the short-term interest rate instead of the lending2A comparison of the loans supply shocks with available banking survey data would be
tempting but would have severe limitations. Indeed, indicators from surveys such as theECB Bank Lending Survey, the Federal Reserve�s Senior Loan O¢ cer Opinion Survey orthe Bank of England�s Credit Conditions Survey are all endogenous, that is they re�ectchanges in response to both the economic situation and exogenous changes independentof the latter. Trying to estimate both components is di¢ cult and inevitably a¤ected byhigh uncertainty, not least due to the short span of the survey indicators.
14

rate. Fourth, we use the baseline model with the �ve variables used in the main analysis
but also identify a fourth shock, more precisely a standard monetary policy shock. Rather
than showing how all results change with these modi�cations we focus on two main sets
of results, the average impulse responses and the counterfactuals.
As regards the �rst sensitivity exercise, Chart 16 shows the average impulse responses
(with 68% percentiles) for four cases. In the �rst, restrictions are imposed only on impact
(K=1, baseline model); in the second, restrictions are imposed on impact as well as on
one period after that (K=1&2); in the third, restrictions are imposed on impact as well
as on �rst two periods after that (K=1&2&3); and in the fourth restrictions are imposed
on impact as well as on subsequent three periods after that (K=1&2&3&4).3 It can
be noticed that results are very similar in all cases across these four sets of restrictions.
Chart 17 shows that counterfactuals are also very similar for all variables for all economic
area across the four scenarios. Very similar results are found also for average variance
decompositions and series of structural shocks to loan supply, with notable spikes in the
same periods as discussed above (not shown but available upon request).
As regards the second sensitivity exercise, Chart 18 shows the average impulse re-
sponses (with 68% percentiles) for two cases: i) model with �ve variables and restrictions
imposed only on impact (baseline model); ii) model with four variables (i.e. excluding
the short-term interest rate) and restrictions imposed only on impact. Also in this case
the shape, magnitude and uncertainty bands of impulse responses are very similar across
the two cases. The main di¤erence is that the short-term response of in�ation is more
markedly negative in the case of the model with four variables in all three cases. Sim-
ilarly, as shown in Chart 19, also the counterfactuals are barely distinguishable across
the two sets of models. An exception as regards the latter is represented by the coun-
terfactual for loan growth for the US, with the model with four variables pointing to a
bigger contribution of loan supply shocks to the decline in loan growth between 2007
and 2009, by about 50% instead of only by about 30% as the counterfactual based on
the baseline model suggests. By contrast, the counterfactuals for the Euro Area and the
United Kingdom for loan growth are very similar, with only minor di¤erences emerging
between the baseline case and the 4-variables model case.
As regards the third sensitivity exercise, Chart 20 shows the average impulse re-
sponses (with 68% percentiles) for two cases: i) model with �ve variables and restric-
tions imposed only on impact (baseline model); ii) model with four variables, but in
contrast to the second sensitivity exercise with the spread between the lending rate and
the short-term interest rate instead of the lending rate, and restrictions imposed only on
impact. In this case some di¤erences emerge. First, the response of in�ation based on
the smaller model becomes markedly positive in the short term for all three economic
3Note that for the case of the Euro Area results were found only for the �rst two cases.
15

areas. Second, the responses of loans appears to be stronger in the short run in the
case of the smaller model for all three economies. However, overall, the responses of
real GDP and loans seem very similar across the two models. Similarly, Chart 21 shows
that the counterfactuals based on the two models are in most cases very similar, with
few exceptions. The latter include a stronger contribution of loan supply shocks to the
decline in loan growth between 2007 and 2009 in the euro area, mildly so, and especially
the United States, by about 45% instead of only by about 30% as the counterfactual
based on the baseline model suggests. Moreover, in the case of the United Kingdom the
impact of loan supply shocks on the decline of in�ation in 2009 seems much smaller in
the case the 4-variables model than the baseline model.
As regards the fourth sensitivity exercise, we estimate in both cases the baseline
model with the same �ve variables but identify in the alternative case also a fourth
shock, a standard monetary policy shock. For this purpose, in the alternative model
with four shocks some changes in the identi�cation scheme are needed. As shown in
Table 3, the standard monetary policy shock is identi�ed by assuming that on impact an
expansionary monetary policy shock would be associated with a decrease in the short-
term policy rate and increases in real GDP in�ation and loan volumes (presumably
driven by higher loan demand). By contrast, no assumption is imposed on the response
of the lending rate as it is not needed and it might be uncertain, with the decline in
the policy rate possibly implying some pass-through to the lending rate (although it
sometimes takes more time for banks to pass-through such changes) but the implied
increase in loan demand possibly implying some upward pressure on the lending rate.
In order to di¤erentiate the aggregate demand shock from the standard monetary policy
shock, we assume that the former leads to an increase in interest rates on impact in
the case of an expansionary shock, as presumably the central bank would respond to an
expansionary (non-monetary policy) demand shock by tightening interest rate due to the
in�ationary pressures emerging from such shock. In order to identify loan supply shocks,
and in particular to di¤erentiate them from standard monetary policy shocks, we assume
that they have the same e¤ects as in the baseline model with three shocks, except that
the short-term impact on in�ation is negative, a choice driven by the results presented
above which indicate that this tends to be the case in all three economies. Chart 22
suggests that the average impact of the loan supply shock based on the two models is
very similar, with the main exception being the stronger negative response of in�ation
on impact in all three economic areas in the case of the model with four shocks, which
of course is a consequence of the identi�cation scheme adopted. Chart 23 shows that the
counterfactuals based on the two models are in most cases very similar, with possibly
only a slightly stronger contribution of loan supply shocks to the decline in loan growth
between 2007 and 2009 in the Euro Area in the case of the model with four identi�ed
16

shocks, now closer to 50% instead of only about 40% as the counterfactual based on the
baseline model suggests.
Overall, the various sensitivity exercises carried out suggest clearly that the impact
of loan supply shocks appears to be robust to a number of modi�cations in the baseline
model and identi�cation scheme assumed, thus reinforcing the credibility of the results
presented in the previous sub-sections.
4 Conclusions
This paper provides some evidence that loan supply shocks have played an important
role in business cycle �uctuations in the Euro Area, the United Kingdom and the United
States over the past three decades. The model adopted, a time-varying parameters VAR
with stochastic volatility, seems to be particularly useful to capture the role of these
shocks over the business cycle, as evidence can be found that this role has changed over
time. The main results of the empirical analysis are the following. First, loan supply
shocks appear to have a signi�cant e¤ect on economic activity and credit markets, but to
some extent also in�ation, in all three economic areas. At the same time, some di¤erences
across geographic areas can also be uncovered. For example, the short-term impact on
real GDP and loan volumes appears to be stronger in the United States and, especially
for loan growth, in the United Kingdom, than in the Euro Area. Second, the impact
of these shocks may have changed over time, as for example the short-term impact of
these shocks on real GDP and loans seems to have increased in all three economic areas
over the past few years. Third, it appears that the contribution of loan supply shocks is
particulary important during slowdowns. For example, the contribution of these shocks
can explain about one half of the decline in annual real GDP growth during 2008 and
2009 in the Euro Area and the United States and possibly about three fourths of that
observed in the United Kingdom. Finally, the contribution of loan supply shocks to the
decline in the annual growth rate of loans observed from the peaks of 2007 to the troughs
of 2009/2010 was slightly less than half of the total decline in all three economic areas
considered.
5 References
Albertazzi, U. and D. Marchetti (2010): "Credit Supply, Flight to Quality and Ever-
greening: An Analysis of Bank-Firm Relationships after Lehman", Working Paper N.
756, Bank of Italy.
Bassett, W. F., M. B. Chosak, J. C. Driscoll and E. Zakraj�ek (2010): "Identifying
the Macroeconomic E¤ects of Bank Lending Supply Shocks", mimeo, December 2010,
Federal Reserve Board.
17

Benati, L. (2008): "The "Great Moderation" in the United Kingdom", Journal of
Money, Credit and Banking, vol. 40(1), pp. 121-147.
Bernanke, B. and C. Lown (1991): "The credit crunch", Brookings Papers on Eco-
nomic Activity, vol. 2, pp. 205-247.
Berrospide, J. M. and R.M. Edge (2010): "The E¤ects of Bank Capital on Lend-
ing: What Do We Know, and What Does It Mean? ", International Journal of Central
Banking, vol. 6 (4), Dec. 2010, pp.5-54.
Brunnermeier, M. K. (2009): "Deciphering the Liquidity and Credit Crunch 2007-
2008," Journal of Economic Perspectives, vol. 23(1), pp. 77-100.
Busch, U., M. Scharnagl and J. Scheithauer (2010): "Loan Supply in Germany
During the Financial Crisis", Discussion Paper Series 1 05/2010, Deutsche Bank.
Canova, F. and L. Gambetti (2009): "Structural changes in the US economy: Is there
a role for monetary policy?", Journal of Economic Dynamics and Control, vol. 33(2),
pp. 477-490.
Carter, C. and R. Kohn (1994): "On Gibbs sampling for state space models",
Biometrika, vol. 81, pp. 541�53.
Ciccarelli, M., A. Maddaloni and J.-L. Peydró (2010): "Trusting the bankers: a new
look at the credit channel of monetary policy", ECB Working Paper n. 1228, July 2010.
Cogley, T. and T. J. Sargent (2005): "Drift and Volatilities: Monetary Policies and
Outcomes in the Post WWII U.S.", Review of Economic Dynamics, vol. 8(2), pp. 262-
302.
D�Agostino, A., L. Gambetti and D. Giannone (2011): "Macroeconomic Forecasting
and Structural Change", Journal of Applied Econometrics (forthcoming).
De Nicolò, G. and M. Lucchetta (2011): �Systemic Risks and the Macroeconomy,�
NBER Working Paper 16998, April 2011.
Diamond, D. W. and R. G. Rajan (2009): "The Credit Crisis: Conjectures about
Causes and Remedies," American Economic Review, vol. 99(2), pp.606-10.
ECB (2009): "The external �nancing of households and non-�nancial corporations:
a comparison of the euro area and the United States", Monthly Bulletin, April 2009.
Fernández-Villaverde, F. and J. F. Rubio-Ramírez (2010): "Macroeconomics and
Volatility: Data, Models, and Estimation," NBER Working Papers 16618.
Galí, J. and L. Gambetti (2009): "On the Sources of the Great Moderation," Amer-
ican Economic Journal: Macroeconomics, vol. 1(1), pp. 26-57.
Gelman, A., J. B. Carlin, H. S. Stern and D. B. Rubin (1995): "Bayesian Data
Analysis", Chapman and Hall, London.
Gilchrist, S. and E. Zakraj�ek (2011): "Monetary Policy and Credit Supply Shocks,"
IMF Economic Review, vol. 59(2), pp. 195-232.
18

Gorton, G. B. (2009): "The panic of 2007", in Maintaining stability in a changing
�nancial system, Proceedings of the 2008 Jackson Hole Conference.
Hristov, N., O. Hülsewig and T. Wollmershäuser (2011): "Loan Supply Shocks during
the Financial Crisis: Evidence for the Euro Area", CESifo Working Paper Nr. 3395, 2011.
Jiménez, G., S. Ongena, J.L. Peydro and J. Saurina (2012): "Credit Supply and
Monetary Policy: Identifying the Bank Balance-Sheet Channel with Loan Applications",
American Economic Review, forthcoming.
Kim, S.N., N. Shephard and S. Chib (1998): "Stochastic volatility: likelihood in-
ference and comparison with ARCH models", Review of Economic Studies, vol. 65, pp.
361�393.
Lown, C. and D. P. Morgan (2006): "The Credit Cycle and the Business Cycle: New
Findings Using the Loan O¢ cer Opinion Survey," Journal of Money, Credit and Banking,
vol. 38(6), pp. 1575-97.
Musso, A. (2009): "Money and credit over the business cycle", mimeo, April 2009,
European Central Bank.
Peek, J. and E. Rosengren (1995): "The Capital Crunch: Neither a Borrower nor a
Lender Be," Journal of Money, Credit and Banking, vol. 27(3), pp. 625-38.
Primiceri, G. (2005): "Time Varying Structural Vector Autoregressions and Monetary
Policy ", The Review of Economic Studies, vol. 72, pp. 821-852.
Rubio-Ramirez, J. F., D. F. Waggoner and T. Zha (2010): "Structural Vector Autore-
gressions: Theory of Identi�cation and Algorithms for Inference," Review of Economic
Studies, vol. 77(2), pp. 665-96.
19

Appendix A - Estimation
Estimation is done using Bayesian methods. To draw from the joint posterior distribution
of model parameters we use a Gibbs sampling algorithm along the lines described in
Primiceri (2005). The basic idea of the algorithm is to draw sets of coe¢ cients from
known conditional posterior distributions. The algorithm is initialized at some values
and, under some regularity conditions, the draws converge to a draw from the joint
posterior after a burn in period. Let z be (q � 1) vector, we denote zT the sequence[z01; :::; z
0T ]0. Each repetition is composed of the following steps:
1. p(�T jxT ; �T ; �T ;;�;; sT )
2. p(sT jxT ; �T ; �T ; �T ;;�;)4
3. p(�T jxT ; �T ; �T ;;�;; sT )
4. p(�T jxT ; �T ; �T ;;�;; sT )
5. p(jxT ; �T ; �T ; �T ;�;; sT )
6. p(�jxT ; �T ; �T ; �T ;;; sT )
7. p(jxT ; �T ; �T ; �T ;;�; sT )
Gibbs sampling algorithm
� Step 1: sample from p(�T jyT ; �T ; �T ;;�;; sT )To draw �T we use the algorithm of Kim, Shephard and Chibb (KSC) (1998). Con-
sider the system of equations y�t � F�1t (yt � X 0t�t) = D
1=2t ut, where ut � N(0; I),
Xt = (In x0t), and xt = [1n; yt�1:::yt�p]. Conditional on yT ; �T , and �T , y�t is observ-
able. Squaring and taking the logarithm, we obtain
y��t = 2rt + �t (7)
rt = rt�1 + �t (8)
where y��i;t = log((y�i;t)
2+0:001) - the constant (0.001) is added to make estimation more
robust - �i;t = log(u2i;t) and rt = log �i;t. Since, the innovation in (7) is distributed
as log�2(1), we use, following KSC, a mixture of 7 normal densities with component
probabilities qj , means mj�1:2704, and variances v2j (j=1,...,7) to transform the systemin a Gaussian one, where fqj ;mj ; v
2j g are chosen to match the moments of the log�2(1)
distribution. The values are:4See below the de�nition of sT .
20

Table A1: Parameters Speci�cation
j qj mj v2j
1.0000 0.0073 -10.1300 5.7960
2.0000 0.1056 -3.9728 2.6137
3.0000 0.0000 -8.5669 5.1795
4.0000 0.0440 2.7779 0.1674
5.0000 0.3400 0.6194 0.6401
6.0000 0.2457 1.7952 0.3402
7.0000 0.2575 -1.0882 1.2626
Let sT = [s1; :::; sT ]0 be a matrix of indicators selecting the member of the mixture to
be used for each element of �t at each point in time. Conditional on sT , (�i;tjsi;t = j) �N(mj � 1:2704; v2j ). Therefore we can use the algorithm of Carter and Kohn (1994) to
draw rt (t=1,...,T) fromN(rtjt+1; Rtjt+1), where rtjt+1 = E(rtjrt+1; yt; �T ; �T ;;�;; sT ; )and Rtjt+1 = V ar(rtjrt+1; yt; �T ; �T ;;�;; sT ).
� Step 2: sample from p(sT jyT ; �T ; �T ; �T ;;�;)Conditional on y��i;t and r
T , we independently sample each si;t from the discrete den-
sity de�ned by Pr(si;t = jjy��i;t ; ri;t) / fN (y��i;t j2ri;t +mj � 1:2704; v2j ), where fN (yj�; �2)
denotes a normal density with mean � and variance �2.
� Step 3: sample from p(�T jyT ; �T ; �T ;;�;; sT )Consider again the system of equations F�1t (yt � X 0
t�t) = F�1t yt = D1=2t ut. Con-
ditional on �T , yt is observable. Since F�1t is lower triangular with ones in the main
diagonal, each equation in the above system can be written as
y1;t = �1;tu1;t (9)
yi;t = �y[1;i�1];t�i;t + �i;tui;t i = 2; :::; n (10)
where �i;t and ui;t are the ith elements of �t and ut respectively, y[1;i�1];t = [y1;t; :::; yi�1;t].
Under the block diagonality of, the algorithm of Carter and Kohn (1994) can be applied
equation by equation, obtaining draws for �i;t from a N(�i;tjt+1;�i;tjt+1), where �i;tjt+1 =
E(�i;tj�i;t+1; yt; �T ; �T ;;�;) and �i;tjt+1 = V ar(�i;tj�i;t+1; yt; �T ; �T ;;�;).
� Step 4: sample from p(�T jyT ; �T ; �T ;;�;; sT )Conditional on all other parameters and the observables we have
yt = X 0t�t + "t (11)
�t = �t�1 + !t (12)
21

Draws for �t can be obtained from aN(�tjt+1; Ptjt+1), where �tjt+1 = E(�tj�t+1; yT ; �T ; �T ;;�;)and Ptjt+1 = V ar(�tj�t+1; yT ; �T ; �T ;;�;) are obtained with the algorithm of Carter
and Kohn (1994).
� Step 5: sample from p(jyT ; �T ; �T ; �T ;�;; sT )Conditional on the other coe¢ cients and the data, has an Inverse-Wishart posterior
density with scale matrix �11 = (0+PTt=1��t(��t)
0)�1 and degrees of freedom df1 =
df0 + T , where �10 is the prior scale matrix, df0 are the prior degrees of freedom and
T is length of the sample use for estimation. To draw a realization for make df1independent draws zi (i=1,...,df1) from N(0;�11 ) and compute = (
Pdf1i=1 ziz
0i)�1
(see Gelman et. al., 1995).
� Step 6: sample from p(�i;ijyT ; �T ; �T ; �T ;;; sT )Conditional the other coe¢ cients and the data, � has an Inverse-Wishart posterior
density with scale matrix ��11 = (�0+PTt=1� log �t(� log �t)
0)�1 and degrees of freedom
df�1 = df�0+T where ��10 is the prior scale matrix and df�0 the prior degrees of freedom.
Draws are obtained as in step 5.
� Step 7: sample from p(jyT ; �T ; �T ; �T ;;�; sT ).Conditional on the other coe¢ cients and the data, i has an Inverse-Wishart pos-
terior density with scale matrix �1i;1 = (i;0 +PTt=1��i;t(��i;t)
0)�1 and degrees of
freedom dfi;1 = dfi;0 + T where �1i;0 is the prior scale matrix and dfi;0 the prior
degrees of freedom. Draws are obtained as in step 5 for all i.
We make 15000 repetitions discarding the �rst 10000 and collecting one out of �ve
draws.
22
Appendix B - Data
The following paragraphs provide details on the data de�nitions, sources and treatment.
Real GDP
Euro area: Gross domestic product at market price, Chain linked, ECU/euro, Seasonally
and working day adjusted, Euro area 16 �xed composition, ESA95 National Accounts
(see ECB�s Statistical Data Warehouse, SDW, code: ESA.Q.I5.S.0000.B1QG00.1000.
TTTT.L.U.R, see http://sdw.ecb.europa.eu/), from 1996Q1 onwards. Extended back-
wards using (the growth rates of) the Area-Wide Model database series YER (real GDP)
(10th update, September 2010, downloadable from the Euro Area Business Cycle Net-
work, EABCN, www.eabcn.org). Sources: Eurostat and Area-Wide Model database.
United Kingdom: Gross domestic product at market price, Chain linked volumes,
reference year 2000, National currency, Working day and seasonally adjusted, United
Kingdom, ESA95 National Accounts (see ECB�s Statistical Data Warehouse, SDW,
code: ESA.Q.GB.Y.0000.B1QG00.1000.TTTT.L.N.A, see http://sdw.ecb.europa.eu/).
Sources: Eurostat.
United States: Real Gross Domestic Product, Billions of Chained 2005 Dollars, Quar-
terly, Seasonally Adjusted, downloaded from Fred II (GDPC96), see http://research.
stlouisfed.org/fred2/. Sources: U.S. Department of Commerce: Bureau of Economic
Analysis.
Consumer prices
Euro area: Harmonised index of consumer prices (HICP), Euro area (changing compo-
sition), quarterly averages of monthly index, backdated, ECU (to 1989) & �xed euro
conversion rate (from 1990) used for weights, Seasonally adjusted, not working day ad-
justed (see ECB�s Statistical Data Warehouse, SDW, code: ICP.M.U2.S.000000.3.ECX,
see http://sdw.ecb.europa.eu/), ECB calculation based on national and Eurostat data.
Sources: European Central Bank and Eurostat.
United Kingdom: General index of retail prices (RPI), all items, unadjusted, aver-
age of monthly index, United Kingdom. Own seasonal adjustment by X12 ARIMA (via
GiveWin). Downloaded from dataset BISM: BIS Macro-economic series (Blocks A-K, Q-
W), BIS code: BISM.M.VEBA.GB.01. For more details on the data see www.statistics.gov.uk/
hub/index.html. Sources: United Kingdom O¢ ce for National Statistics.
United States: Consumer Price Index for All Urban Consumers: All Items, seasonally
adjusted, downloaded from Fred II (CPIAUCSL), see http://research.stlouisfed.org/fred2/.
Sources: U.S. Department of Labor: Bureau of Labor Statistics.
23

Short-term interest rates
Euro area: EMU 3-month EURIBOR, historical close, average of observations through
period (see ECB�s Statistical Data Warehouse, SDW, code: FM.M.U2.EUR.RT.MM.
EURIBOR3MD_.HSTA, see http://sdw.ecb.europa.eu/), ECB calculation based on data
provided by Reuters, from 1994 until 2006. Extended backwards using the Area-Wide
Model database series STN (Nominal Short-Term Interest Rate) (10th update, Sep-
tember 2010, downloadable from the Euro Area Business Cycle Network, EABCN,
www.eabcn.org). From 2007 onwards Euro benchmark 3-month Euro Repo, provided
by DataStream. Sources: European Central Bank, DataStream, Reuters and Area-Wide
Model database.
United Kingdom: 3-month (91-days) rate on Treasury Bills, average allotment rate,
end-of-period rate, United Kingdom. Downloaded from dataset BISM: BIS Macro-
economic series (Blocks A-K, Q-W), BIS code: BISM.M.HEPA.GB.01. For more details
on the data see www.statistics.gov.uk/hub/index.html. Sources: United Kingdom O¢ ce
for National Statistics.
United States: 3-Month Treasury Bill: Secondary Market Rate, average of monthly
data, downloaded from Fred II (TB3MS), see http://research.stlouisfed.org/fred2/. Sources:
Board of Governors of the Federal Reserve System.
Loans to the non-�nancial private sector
Euro area: Sum of (nominal) outstanding amounts of loans to households and loans to
non-�nancial corporations, derived by rescaling indices of notional stocks with base equal
to the outstanding amounts for 2010Q1. Series adjusted to include loan sales and securi-
tisation from 2003Q1 onwards (until 2008Q4 on the basis of a "best estimate" and from
2009Q1 onwards using the new harmonised ECB monetary and �nancial statistics; see
the box on "The impact of loan sales and securitisation activity on recent developments
in MFI loans to non-�nancial corporations and households" in the July 2011 issue of the
ECB Monthly Bulletin). Sources: Own calculations based on data from the European
Central Bank.
United Kingdom: Sum of (nominal) monthly amounts outstanding of monetary �-
nancial institutions�sterling net lending excluding securitisations to household sector and
to non-�nancial corporations (in sterling millions), seasonally adjusted. Bank of England
Statistical Interactive Database codes: LPMBC44 and LPMBC57 (see www.bankofengland.co.uk/
mfsd/iadb/NewIntermed.asp). Data adjusted for breaks associated to write o¤s and pop-
ulation changes, with adjustments kindly provided by the Bank of England. Sources:
Bank of England.
United States: Sum of (nominal) outstanding amounts (billions of dollars) of loans
24

to households (Flow of Funds de�nitions and codes: "Households and nonpro�t organi-
zations; credit market instruments; liability" FL154104005.q minus "Nonpro�t organiza-
tions; municipal securities and loans; liability" FL163162005.q) and loans to non-�nancial
corporations (Flow of Funds de�nitions and codes: "Non�nancial business; credit mar-
ket instruments; liability" FL144104005.q minus "Nonfarm non�nancial corporate busi-
ness; commercial paper; liability" FL103169100.q, "Nonfarm non�nancial corporate busi-
ness; municipal securities and loans; liability" FL103163003.q and "Nonfarm non�nan-
cial corporate business; corporate bonds; liability" FL103162005.q). Downloaded from
www.federalreserve.gov/releases/z1/ current/. Sources: Flow of Funds Accounts of the
United States, Board of Governors of the Federal Reserve System.
Composite lending rates
Euro area: Composite lending rate, derived as weighted average of interest rates charged
on loans to households and loans to non-�nancial corporations, with weights based on the
nominal outstanding amounts (or, if not available, �ows) of loans to households and to
non-�nancial corporations. Sources: Own calculations based on data from the European
Central Bank.
United Kingdom: Composite lending rate, derived as weighted average of inter-
est rates charged on loans to households and loans to non-�nancial corporations, with
weights based on the nominal outstanding amounts of loans to households and to non-
�nancial corporations. Composite lending rate for non-�nancial corporations derived
from quarterly average of UK resident monetary �nancial institutions� (excl. Cen-
tral Bank) sterling weighted average interest rate on other loans, new advances to
private non-�nancial corporations (in percent), not seasonally adjusted (Bank of Eng-
land Statistical Interactive Database code: CFMBJ82, see www.bankofengland.co.uk/
mfsd/iadb/NewIntermed.asp) from 2004Q1 onwards; extended backwards to 1999Q1
using the (�rst di¤erence of) quarterly average of UK resident monetary �nancial in-
stitutions�(excl. Central Bank) sterling weighted average interest rate, other loans to
private non-�nancial corporations (in percent), not seasonally adjusted (Bank of Eng-
land Statistical Interactive Database code: CFMHSDC, see www.bankofengland.co.uk/
mfsd/iadb/NewIntermed.asp); extended backwards using Bank of England estimates for
corporate bond rate. Composite lending rate for households derived as composite of
lending rate of mortgage rate (IUMTLMV, see www.bankofengland.co.uk/ mfsd/iadb/
NewIntermed.asp, from 1995Q1 onwards, extended back using di¤erences in BIS data
- average of mortgage rates by building societies and retail banks- until 1985Q1, ex-
tended back using di¤erences in Council of Mortgage Lenders, CML, building societies
basic mortgage rate), personal loan rate (IUMHPTL, see www.bankofengland.co.uk/
mfsd/iadb/NewIntermed.asp, from 1995Q1 onwards, extended back using di¤erences in
25

Bank of England estimates for personal loan rates data) and credit card rate (IUMCCTL,
see www.bankofengland.co.uk/ mfsd/iadb/NewIntermed.asp, from 1995Q1 onwards, ex-
tended back using di¤erences in Bank of England estimates for credit card rates data),
with weights based on outstanding amounts of corresponding loan categories. Sources:
Own calculations based on data from the Bank of England.
United States: Composite lending rate, derived as weighted average of interest rates
charged on loans to households and loans to non-�nancial corporations, with weights
based on the nominal outstanding amounts of loans to households and to non-�nancial
corporations. Composite lending rate for non-�nancial corporations derived as average
of bank prime loan rate prime rate on short-term business loans (Fred II: MPRIME, see
http:// research.stlouisfed.org/fred2/) and commercial and industrial loan rate (Board
of Governors of the Federal Reserve System E.2 SURVEY OF TERMS OF BUSI-
NESS LENDING, see http://www.federalreserve.gov/ releases/e2/) from 1986Q1 on-
wards, extended backwards using the (�rst di¤erence of) the bank prime loan rate prime
rate on short-term business loans (Fred II: MPRIME, see http://research.stlouisfed.
org/fred2/). Composite lending rate for households derived as composite of lending
rate of mortgage rate (30-Year Conventional Mortgage Rate, Fred II: MORTG, see
http:// research.stlouisfed.org/fred2/) and personal loan rate (average of interest rate
on 48-month new car loans: G19/TERMS/RIFLPBCIANM48_N.M, interest rate on
24-month personal loans: G19/TERMS/RIFLPBCIPLM24_N.M and interest rate on
credit card plans - all accounts: G19/TERMS/RIFSPBCICC_N.M, from 1994Q4 on-
wards, extended backwards using changes in average of interest rate on �rst two loans, see
www.federalreserve.gov/releases/g19/hist/), with weights based on outstanding amounts
of corresponding loan categories. Sources: Own calculations based on data from the
Board of Governors of the Federal Reserve System.
26

27

28

29

30

31

32

Tables
Table 1 – Identification restrictions
SHOCK real GDP inflation loans lending rate short term interest rate
Aggregate supply + - + + no restriction
Aggregate demand + + + + no restriction
Loan supply + no restriction + - no restriction
SHORT RUN RESPONSES TO AN EXPANSIONARY SHOCK
Note: Sign imposed on the impulse response on impact of all variables for the case of a shock causing an increase in real GDP.
Table 2 – Trace tests
16% perc. 50% perc. 84% perc. trace(Q0)
Euro area 0.938 1.458 2.240 0.016
United Kingdom 0.916 1.318 1.988 0.076
United States 3.380 5.008 7.303 0.076
Note: The first three columns show the 16%, 50% and 84% percentiles of the posterior of the trace of the variance-covariance matrix of the error term of the law of motion of the parameters of the VAR while the fourth column shows the trace of the prior variance-covariance matrix. Following Cogley and Sargent (2005), since the value of the trace of the prior variance-covariance matrix is smaller that even the 16% percentile, this can be interpreted as evidence pointing to the presence of time variation in the parameters of the VAR (i.e. the sample points towards greater time variation in the parameters than that of the prior selected).
Table 3 – Alternative identification restrictions
SHOCK real GDP inflation loans lending rate short term interest rate
Aggregate supply + - + + no restriction
Aggregate demand + + + + +Loan supply + - + - no restriction
Monetary policy + + + no restriction -
SHORT RUN RESPONSES TO AN EXPANSIONARY SHOCK
Note: Sign imposed on the impulse response on impact of all variables for the case of a shock causing an increase in real GDP.
33

Charts
Chart 1 - Data Real GDP growth
Inflation
Loans
34

Chart 1 - Data (continued)
Short term interest rate
Composite lending rate
Spread (composite lending rate – short term interest rate)
Sources: Bank of England, EABCN, ECB, Eurostat, UK ONS, US BEA, US Board of Governors. Note: See Appendix A for details on data sources, definitions and treatment.
35

Chart 2 - Stochastic volatility
Euro Area
United Kingdom
United States
Note: Residual time-varying variances, median, 16% and 84% percentiles.
36

Chart 3 - Impulse response functions to loan supply shock (median whole sample period)
Real GDP Inflation Loans Lending rate Short term interest rate Euro Area
United Kingdom
United States
Note: Averages of impulse response functions over time. Line is the median, grey are delimits the space between the 16% and 84% percentiles.
37
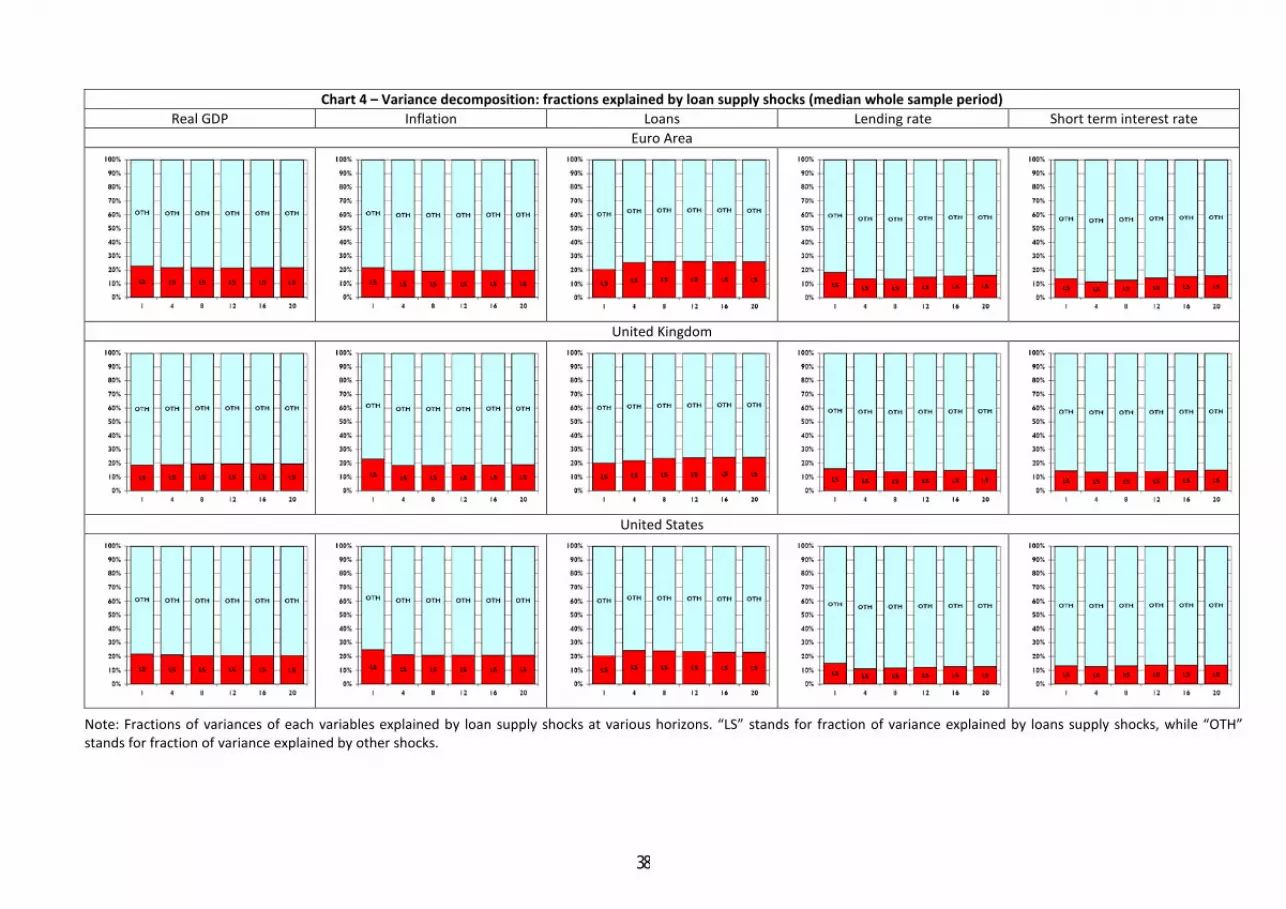
Chart 4 – Variance decomposition: fractions explained by loan supply shocks (median whole sample period)
Real GDP Inflation Loans Lending rate Short term interest rate Euro Area
United Kingdom
United States
Note: Fractions of variances of each variables explained by loan supply shocks at various horizons. “LS” stands for fraction of variance explained by loans supply shocks, while “OTH” stands for fraction of variance explained by other shocks.
38

Chart 5 – Evolution of impulse response functions of real GDP growth to a loan supply shock at various horizons
Horizon = 1 Horizon = 4 Horizon = 8 Horizon = 12 Horizon = 20 Euro Area
United Kingdom
United States
Note: Evolution of impulse responses of real GDP growth to a loan supply shock at specific horizons over time, median, 16% and 84% percentiles.
39
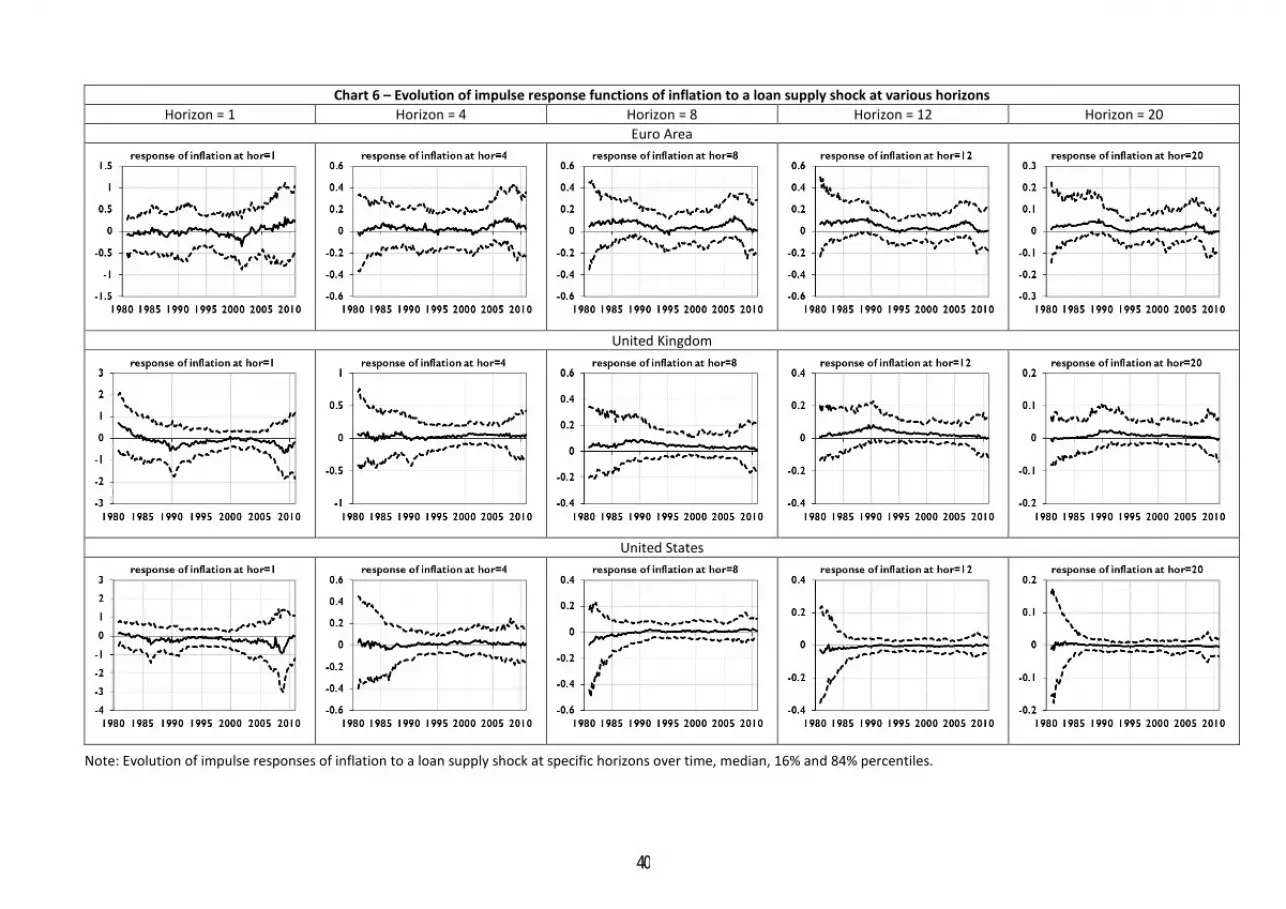
Chart 6 – Evolution of impulse response functions of inflation to a loan supply shock at various horizons
Horizon = 1 Horizon = 4 Horizon = 8 Horizon = 12 Horizon = 20 Euro Area
United Kingdom
United States
Note: Evolution of impulse responses of inflation to a loan supply shock at specific horizons over time, median, 16% and 84% percentiles.
40

Chart 7 – Evolution of impulse response functions of loan growth to a loan supply shock at various horizons
Horizon = 1 Horizon = 4 Horizon = 8 Horizon = 12 Horizon = 20 Euro Area
United Kingdom
United States
Note: Evolution of impulse responses of loan growth to a loan supply shock at specific horizons over time, median, 16% and 84% percentiles.
41

Chart 8 – Evolution of impulse response functions of the lending rate to a loan supply shock at various horizons Horizon = 1 Horizon = 4 Horizon = 8 Horizon = 12 Horizon = 20
Euro Area
United Kingdom
United States
Note: Evolution of impulse responses of lending rate to a loan supply shock at specific horizons over time, median, 16% and 84% percentiles.
42

Chart 9 – Evolution of impulse response functions of the short term interest rate to a loan supply shock at various horizons Horizon = 1 Horizon = 4 Horizon = 8 Horizon = 12 Horizon = 20
Euro Area
United Kingdom
United States
Note: Evolution of impulse responses of short term interest rate to a loan supply shock at specific horizons over time, median, 16% and 84% percentiles.
43

Chart 10 – Evolution of variance decomposition at various horizons (fractions of variance explained by loan supply shocks)
Real GDP Inflation Loans Lending rate Short term interest rate Euro Area
United Kingdom
United States
Note: Evolution of fractions of variances of the variables explained by loan supply shocks at specific horizons over time, median.
44

Chart 11 – Counterfactual: evolution of the variables in the absence of loan supply shocks
Euro Area United Kingdom United States real GDP growth
inflation
loan growth
lending rate
short term interest rate
Note: Counterfactual exercises: evolution of variables in the absence of loan supply shocks.
45

Chart 12 - Impulse response functions of all variables to loan supply shocks during and after the 2008/2009 and early 1990s recessions in the euro area
Real GDP growth Inflation Loan growth Lending rate Short term interest rate
Note: Impulse response functions averages in specific recessions and subsequent recoveries as defined in first column in the Euro Area. Line is the median, grey area delimits the space between the 16% and 84% percentiles. Recessions as identified by the CEPR, recoveries as first four quarters after troughs.
2008
/200
9 re
cess
ion
early
199
0s re
cess
ion
2008
/200
9 re
cove
ry
ea
rly 1
990s
reco
very
46

Chart 13 - Impulse response functions of all variables to loan supply shocks during and after the 2008/2009 and early 1990s recessions in the United Kingdom Real GDP growth Inflation Loan growth Lending rate Short term interest rate
Note: Impulse response functions averages in specific recessions and subsequent recoveries as defined in first column in the United Kingdom. Line is the median, grey area delimits the space between the 16% and 84% percentiles. Recessions as identified by Bank of England, recoveries as first four quarters after troughs.
2008
/200
9 re
cess
ion
early
199
0s re
cess
ion
2008
/200
9 re
cove
ry
ea
rly 1
990s
reco
very
47
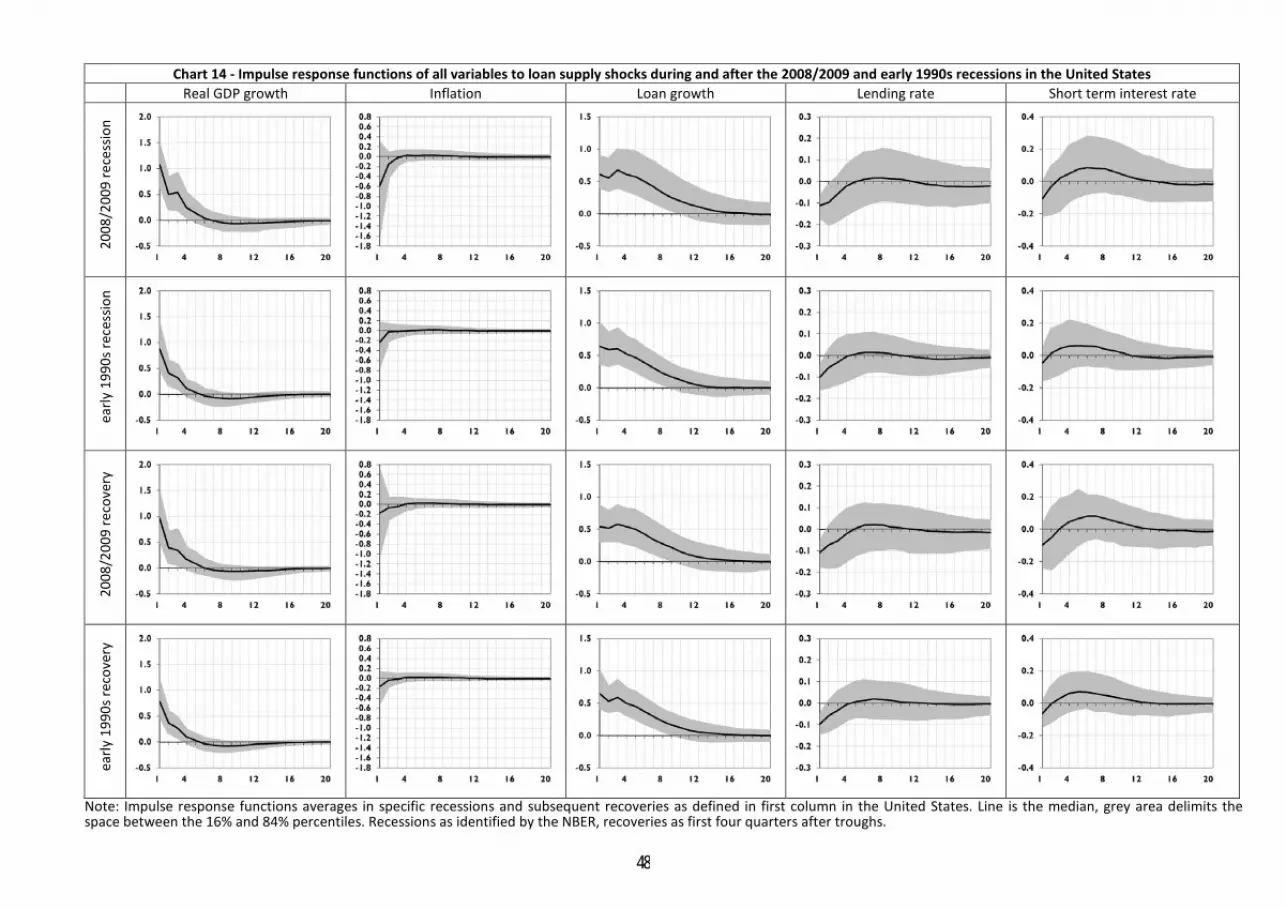
Chart 14 - Impulse response functions of all variables to loan supply shocks during and after the 2008/2009 and early 1990s recessions in the United States Real GDP growth Inflation Loan growth Lending rate Short term interest rate
Note: Impulse response functions averages in specific recessions and subsequent recoveries as defined in first column in the United States. Line is the median, grey area delimits the space between the 16% and 84% percentiles. Recessions as identified by the NBER, recoveries as first four quarters after troughs.
2008
/200
9 re
cess
ion
early
199
0s re
cess
ion
2008
/200
9 re
cove
ry
ea
rly 1
990s
reco
very
48

Chart 15 – Series of structural loan supply shocks
Note: Shaded areas delimit recession periods, as identified by the CEPR for the Euro Area, by the Bank of England for the United Kingdom and by the NBER for the United States.
49
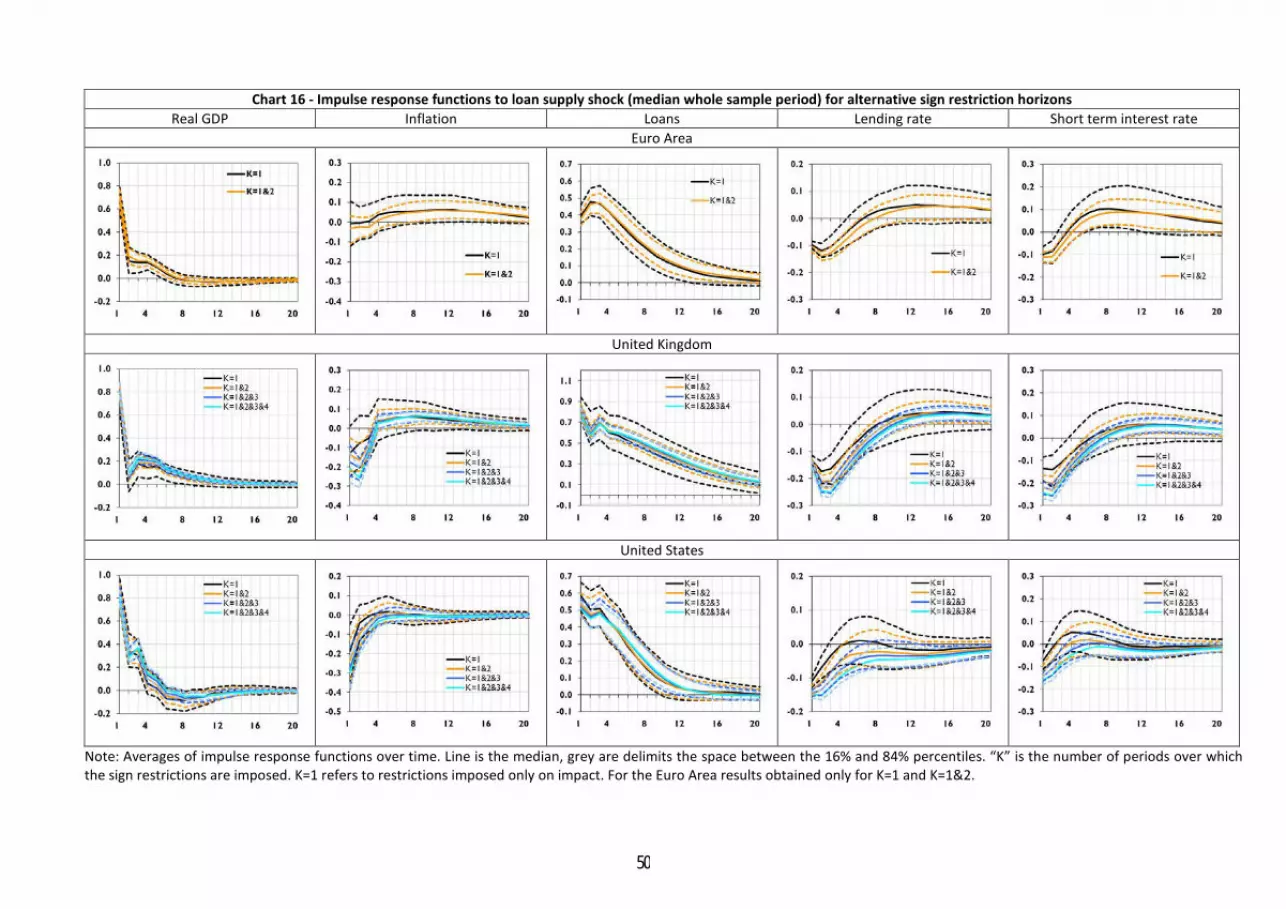
Chart 16 - Impulse response functions to loan supply shock (median whole sample period) for alternative sign restriction horizons
Real GDP Inflation Loans Lending rate Short term interest rate Euro Area
United Kingdom
United States
Note: Averages of impulse response functions over time. Line is the median, grey are delimits the space between the 16% and 84% percentiles. “K” is the number of periods over which the sign restrictions are imposed. K=1 refers to restrictions imposed only on impact. For the Euro Area results obtained only for K=1 and K=1&2.
50

Chart 17 – Counterfactual: variables evolution in the absence of loan supply shocks for alternative sign restriction horizons Euro Area United Kingdom United States
real GDP growth
inflation
loan growth
lending rate
short term interest rate
Note: Counterfactual exercises: evolution of variables in the absence of loan supply shocks. “K” is the number of periods over which the sign restrictions are imposed. K=1 refers to restrictions imposed only on impact. For the Euro Area results obtained only for K=1 and K=1&2.
51

Chart 18 - Impulse response functions to loan supply shock (median whole sample period) for alternative model sizes Real GDP Inflation Loans Lending rate
Euro Area
United Kingdom
United States
Note: Averages of impulse response functions over time. Line is the median, grey are delimits the space between the 16% and 84% percentiles. Model with 5 variables includes real GDP growth, inflation, non-financial private sector loan growth, the composite lending rate and the short term interest rate (baseline model). Model with 4 variables includes only the latter first four variables (i.e. the variables on which sign restrictions are imposed). “K” is the number of periods over which the sign restrictions are imposed. K=1 refers to restrictions imposed only on impact (baseline).
52

Chart 19 – Counterfactual: variables evolution in the absence of loan supply shocks for alternative model sizes
Euro Area United Kingdom United States real GDP growth
inflation
loan growth
lending rate
Note: Counterfactual exercises: evolution of variables in the absence of loan supply shocks. Model with 5 variables includes real GDP growth, inflation, non-financial private sector loan growth, the composite lending rate and the short term interest rate (baseline model). Model with 4 variables includes only the latter first four variables (i.e. the variables on which sign restrictions are imposed). “K” is the number of periods over which the sign restrictions are imposed. K=1 refers to restrictions imposed only on impact (baseline). 53

Chart 20 - Impulse response functions to loan supply shock (median whole sample period) for alternative models Real GDP Inflation Loans
Euro Area
United Kingdom
United States
Note: Averages of impulse response functions over time. Line is the median, grey are delimits the space between the 16% and 84% percentiles. Model with 5 variables includes real GDP growth, inflation, non-financial private sector loan growth, the composite lending rate and the short term interest rate (baseline model). Model with 4 variables includes real GDP growth, inflation, non-financial private sector loan growth and the spread between the composite lending rate and the short term interest rate. “K” is the number of periods over which the sign restrictions are imposed. K=1 refers to restrictions imposed only on impact (baseline).
54

Chart 21 – Counterfactual: variables evolution in the absence of loan supply shocks for alternative models Euro Area United Kingdom United States
real GDP growth
inflation
loan growth
Note: Counterfactual exercises: evolution of variables in the absence of loan supply shocks. Model with 5 variables includes real GDP growth, inflation, non-financial private sector loan growth, the composite lending rate and the short term interest rate (baseline model). Model with 4 variables includes real GDP growth, inflation, non-financial private sector loan growth and the spread between the composite lending rate and the short term interest rate. “K” is the number of periods over which the sign restrictions are imposed. K=1 refers to restrictions imposed only on impact (baseline).
55

Chart 22 - Impulse response functions to loan supply shock (median whole sample period) for alternative identification schemes
Real GDP Inflation Loans Lending rate Short term interest rate Euro Area
United Kingdom
United States
Note: Averages of impulse response functions over time. Line is the median, grey are delimits the space between the 16% and 84% percentiles. “Model 5 variables, 3 shocks” is the baseline model, while “Model 5 variables, 4 shocks” also identifies monetary policy shocks (see text for details). In both cases, K=1.
56

Chart 23 – Counterfactual: variables evolution in the absence of loan supply shocks for alternative identification schemes
Euro Area United Kingdom United States real GDP growth
inflation
loan growth
lending rate
short term interest rate
Note: Counterfactual exercises: evolution of variables in the absence of loan supply shocks. “Model 5 variables, 3 shocks” is the baseline model, while “Model 5 variables, 4 shocks” also identifies monetary policy shocks (see text for details). In both cases, K=1.
57