the role of h3+in planetary atmospheres
TRANSCRIPT
This material has been published in the Philosophical Transactions of the Royal Society A, the original publication copyright and all rights therein are retained by the Royal Society.
The role of H3+ in planetary atmospheres
By Steven Miller1†, Nick Achilleos1†, Gilda E. Ballester2, Thomas R. Geballe3, Robert D. Joseph4, Renee Prangé5, Daniel Rego5, Tom Stallard1†, Jonathan Tennyson1†, Laurence M. Trafton6† and J. Hunter Waite Jr7
1Department of Physics and Astronomy, University College London, Gower Street, London WC1E 6BT, UK 2Department of Atmospheric, Oceanic and Space Sciences, University of Michigan, 2455 Hayward Street, Ann Arbor, MI 48109, USA 3Gemini Observatory, 670 North A’ohoku Place, Hilo, HI 96720, USA 4Institute for Astronomy, University of Hawaii, Woodlawn Drive, Honolulu, HI 96822, USA 5Institut d’Astrophysique Spatiale, UMR-CNRS 120, B^atiment 121, Université de Paris XI, 91405 Orsay Cedex, France 6McDonald Observatory and Department of Astronomy, University of Texas at Austin, Austin, TX 78712, USA 7Department of Space Science, Southwest Research Institute, PO Box 28510, San Antonio, TX 78228, USA †Visiting observer on the NASA Infrared Telescope Facility (IRTF), which is operated for NASA by the University of Hawaii Institute for Astronomy.
Abstract Spectroscopic studies of the upper atmospheres of the giant planets using infrared wavelengths sensitive to the H3
+ molecular ion show that this species plays a critical role in determining the physical conditions there. For Jupiter, we propose that the recently detected H3
+ electrojet holds the key to the mechanism by which the equatorial plasma sheet is kept in (partial) co-rotation with the planet, and that this mechanism also provides a previously unconsidered source of energy that helps explain why the jovian thermosphere is considerably hotter than expected. For Saturn, we show that the H3
+ auroral emission is ca.1% of that of Jupiter because of the lower ionospheric/thermospheric temperature and the lower flux of ionizing particles precipitated there; it is probably unnecessary to invoke additional chemistry in the auroral/polar regions. For Uranus, we report further evidence that its emission intensity is controlled by the cycle of solar activity. And we propose that H3
+ emission may just be detectable using current technology from some of the giant extra-solar planets that have been detected orbiting nearby stars, such as Tau Bootes.
Introduction The accidental discovery of emission from H3
+ in the infrared spectrum of Jupiter’s aurorae in 1988 (Drossart et al . 1989) has opened up a decade of investigations making use of this fundamental ion as a probe of the ionospheres of the outer planets. H3
+ had been proposed as a constituent of this atmospheric region a quarter of a century before its eventual detection (Gross & Rasool 1964), and its presence had been inferred from Voyager II measurements of the jovian magnetosphere (Hamilton et al . 1980). But, in 1988, no one could predict just how useful this ion would prove to be as a physical and chemical indicator, nor quite how important it would turn out to be in determining how the upper atmosphere of Jupiter and its fellow giants behaved.
Studies presented elsewhere in this issue explain how infrared imaging, using wavelengths sensitive to H3
+, has been used to elucidate key parameters in the jovian magnetic field, and to highlight the highly energetic electromagnetic interactions between Jupiter and its moons, particularly Io (Connerney & Satoh, this issue). Our contribution looks mainly at the use of H3
+ infrared spectroscopic studies of the outer planets. It discusses the role that H3
+ plays in determining the thermal structure of the upper atmospheres of these giants and the more recent use of Doppler-shifted lines to probe the dynamics of the polar regions of Jupiter. And it looks ahead to a future in which the planetary supergiants that have been detected orbiting stars close to our own Solar System (see, for example, Mayor & Queloz 1995; Marcy & Butler 1996; Cameron et al . 1999) might similarly be probed.
There have been many successful attempts to model giant planetary ionospheres (see, for example, Gross & Rasool 1964; Atreya & Donahue 1976; Waite et al . 1983; McConnell & Majeed 1991; Kim et al. 1992) to complement terrestrial and in situ measurements. In these models, H3
+ is produced by chemical reactions, such as
H2 + e* -> H2+ + e + e
H2 + hν -> H2+ + e
H2 + H2+ -> H3
+ + H
(1.1)
where e* represents energetic electrons precipitating along magnetic fieldlines, and hν is solar extreme ultraviolet (EUV) radiation. The ion is destroyed by
H3+ + e -> H2 + H
-> H + H + H
(1.2)
Until recently, such models were all one dimensional, so that the dynamical production and distribution of this ion on a planet rotating under solar radiation could not be reproduced. Achilleos et al. (1998), however, have now produced a three-dimensional, fully coupled model of the jovian thermosphere/ionosphere. (The thermosphere, consisting of neutral gas, and the ionosphere, consisting of plasma, physically coexist for the giant planets in the pressure region from ca. 1 mbar to ca. 0.01 nbar.) Here we shall make considerable use of this jovian ionosphere model (known as JIM) to interpret the results of H3
+ spectroscopic studies. We shall also consider the possibility of extending JIM to model other planets.
2. Jupiter
(a) Some outstanding questions
Apart from the solar wind, the jovian magnetosphere is the largest structure in our Solar System. In the Sunward direction, it extends ca. 7 million km, while the magnetotail stretches out to the orbit of Saturn (and may sometimes even envelop that planet). Unlike the terrestrial magnetosphere, which is fuelled by the solar wind, the predominant source of plasma in the jovian system is the Galilean moon Io, whose volcanoes pump out approximately 1 to a few tonnes of material per second (J. Spencer, personal communication). This gives rise to a dense plasma region along the orbit of Io, known as the Io plasma torus, and an extended equatorial plasma sheet, which rotates along with the planet out to about 20 jovian radii (RJ = 71,492 km); partial co-rotation probably extends for up to 50-60RJ. The mechanism by which the plasma sheet is kept co-rotating, proposed by Hill (1979), involves the transfer of rotational energy from Jupiter by a kind of electromagnetic friction. Co-rotation is maintained by currents flowing outwards through the sheet itself, and along magnetic fieldlines that connect the orbit of Io (upwards from the planet) and the outer edge of the co-rotating plasma (downwards towards the planet) to the atmosphere; the circuit is closed by means of an equatorward current flowing through the ionosphere itself. In the steady state, it is possible to show that this mechanism must be transferring between 1 and 10 × 1012 J of rotational kinetic energy per second from Jupiter to the plasma sheet; this is a similar, if somewhat smaller, amount of energy to the tidal energy Jupiter supplies to Io to produce its volcanic activity. (There is no chance of Jupiter’s angular momentum reservoir being exhausted, however, since it is ca. 6 × 1034 J.) Just how this energy transfer process works in detail is still in question.
Another such question involves the rather high temperatures detected in the jovian upper atmosphere. Voyager found the ionospheric temperature to be ca. 1000 K, and this high temperature was confirmed by Drossart et al .’s (1989) auroral measurement of 1100 K. Subsequent H3
+ auroral infrared measurements have resulted in temperatures between 670 K (Oka & Geballe 1990) and 1250 K (Maillard et al . 1990), with `ambient’ temperatures between 800 and 1100 K (Miller et al . 1990; Lam et al . 1997a). One key finding was that H3
+ emission showed the gas was in `quasi-thermal equilibrium’ (Miller et al . 1990): that means that this ion and its emission are sensitive to temperatures prevailing in the ionosphere/thermosphere in a way that UV emission is not. The auroral temperatures may be explicable by the energy influx required to power Jupiter’s ultraviolet aurorae. What are more difficult to explain are the non-auroral temperatures, shown to be between 700 and 950 K (de Bergh et al .
1992; Miller et al . 1997), several hundred degrees higher than might be expected from the solar influx to the ionosphere/thermosphere of just 60 mWm-2 (Atreya 1986). Waite et al . (1983) proposed that thermospheric winds might be involved in distributing energy from the auroral regions to lower latitudes to account for these high temperatures. But, again, just how?
We shall argue that H3+ holds the key to explaining both the temperature structure of
the jovian upper atmosphere and the process by which planetary angular momentum is transferred to the equatorial plasma sheet. But first we need to look at some considerations of the overall energy balance, and just where that energy is located.
(b) Energy considerations
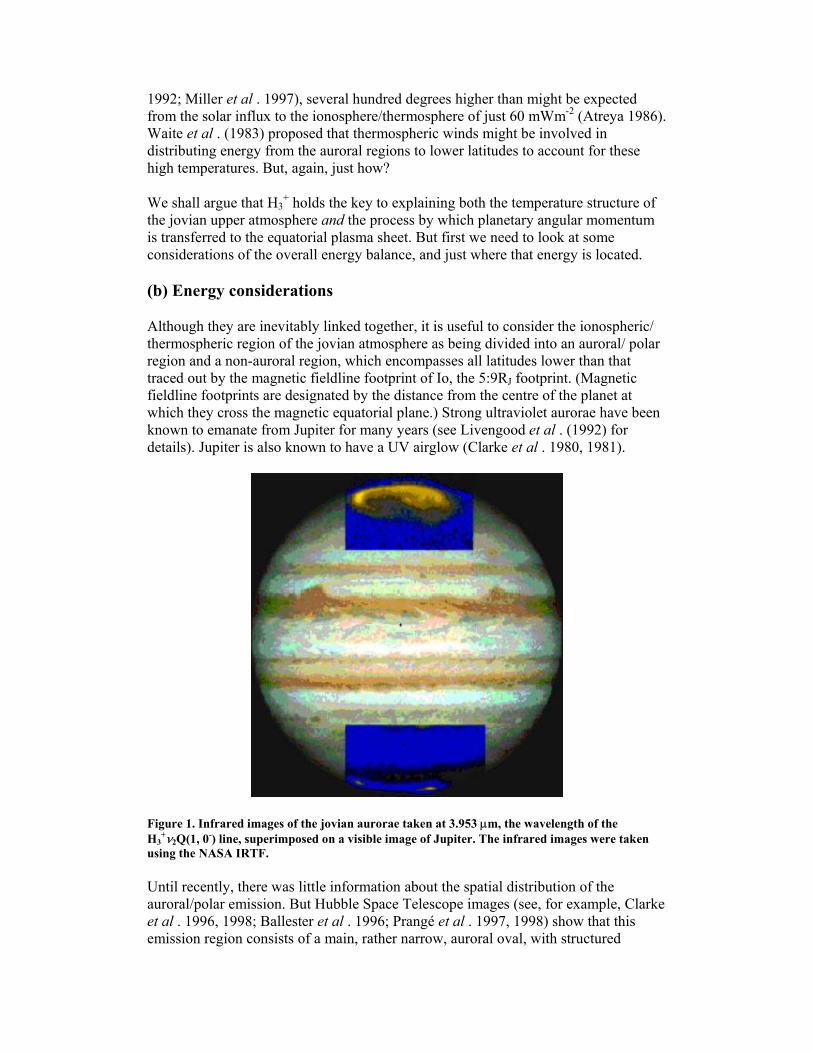
Although they are inevitably linked together, it is useful to consider the ionospheric/ thermospheric region of the jovian atmosphere as being divided into an auroral/ polar region and a non-auroral region, which encompasses all latitudes lower than that traced out by the magnetic fieldline footprint of Io, the 5:9RJ footprint. (Magnetic fieldline footprints are designated by the distance from the centre of the planet at which they cross the magnetic equatorial plane.) Strong ultraviolet aurorae have been known to emanate from Jupiter for many years (see Livengood et al . (1992) for details). Jupiter is also known to have a UV airglow (Clarke et al . 1980, 1981).
Figure 1. Infrared images of the jovian aurorae taken at 3.953 µm, the wavelength of the H3
+ν2Q(1, 0-) line, superimposed on a visible image of Jupiter. The infrared images were taken using the NASA IRTF.
Until recently, there was little information about the spatial distribution of the auroral/polar emission. But Hubble Space Telescope images (see, for example, Clarke et al . 1996, 1998; Ballester et al . 1996; Prangé et al . 1997, 1998) show that this emission region consists of a main, rather narrow, auroral oval, with structured
emission at higher latitude and inside of the polar cap, and a belt of emission at lower latitudes that includes trails corresponding to the footprints of Io and, perhaps, other Galilean moons. This structure is mirrored in the infrared H3
+ images of Jupiter’s polar regions (see figure 1; see also Satoh et al . (1996) and Satoh & Connerney (1999)), indicating that the production of this ion closely follows the production of UV emission. There is additionally mid-to-low (MTL) H3
+ emission (Miller et al . 1997) extending equatorwards from the Io orbital footprint.
The UV auroral/polar output has variously been estimated at a few × 1012 W (Clarke et al . 1996) to more than 1013 W (see Livengood et al . (1992) for a fuller discussion). Based on an efficiency of ca. 10%, energy inputs have then been estimated to be between 1013 and 1014 W; this input energy comes in the form of particles: mainly keV electrons precipitating along fieldlines into the atmosphere. But two recent studies (Satoh & Connerney 1999; Rego et al . 2000) have both shown that in the auroral/polar region, the atmosphere above the 2 m bar homopause—where it consists of hydrogen and helium species only, and where H3
+ is produced—absorbs only a few × 1012 W. (The remainder of this input precipitation energy is presumably absorbed at or below the homopause, consistent with the fact that the UV aurorae are usually accompanied by hydrocarbon absorption features.) There appears to be further precipitation in the MTL latitude regions required to account for X-ray emission (Waite et al . 1997) and the MTL H3
+ emission noted by Miller et al . (1997). This latter has been calculated to be 0:65 × 1012 W per hemisphere (Rego et al . 2000). Gravity waves have been suggested as a source of energy to the ionosphere/thermosphere (Yelle et al . 1996; Young et al. 1997), in an attempt to explain the low-latitude temperature profile found by the Galileo probe (Seiff et al . 1997), although doubt has recently been cast on the efficacy of this process (Matcheva & Strobel 1999). In addition, the insolation available to the jovian ionosphere/thermosphere—60 m Wm2 in the EUV—translates to ca. 1012 W planet-wide. Overall, therefore, the energy absorbed by the ionosphere/thermosphere above the homopause is ca. 5 × 10¹² W (Rego et al . 2000).
The effect of these various energy inputs must be to heat up the ionosphere, unless they are somehow re-radiated, or conducted and/or convected (unlikely above the homopause, which, by definition, is a region where convection ceases) away. The ionosphere/thermosphere is a poor conductor of heat, which leaves radiation. According to studies of the jovian UV electroglow, this feature can probably account for almost all of the 1012 W of EUV insolation (Feldman et al . 1993; Liu & Dalgarno 1996). That still leaves ca. 4 × 10¹² W to be considered. Since it is not a black body, the ionosphere will heat up until some species starts to radiate efficiently. The dominant atmospheric species, molecular hydrogen, is a poor radiator at infrared wavelengths as it has neither a permanent nor a vibrationally induced dipole moment. But at temperatures between 700 and 1100 K, H3
+ emits between 5 × 10-21 Wsr-1 molecule-1 and 5 × 10²⁰ W sr-1 molecule-1. Although its density is rarely above 1011 m-
3, compared with [H2]ca: 1018 m-3 at the µbar level, this high radiative efficiency is enough to make H3
+ emission the predominant cooling mechanism in both the auroral/polar (Satoh & Connerney 1999; Rego et al . 2000) and non-auroral ionosphere/thermosphere (Waite et al. 1997). Indeed, it is clear that H3
+ emission may account for more than the ca. 5 × 10¹² W of input energy considered so far: the findings of Rego et al . (2000) could be interpreted as showing H3
+ emitting up to 8 × 10¹² W planet-wide.
(c) The auroral electrojet
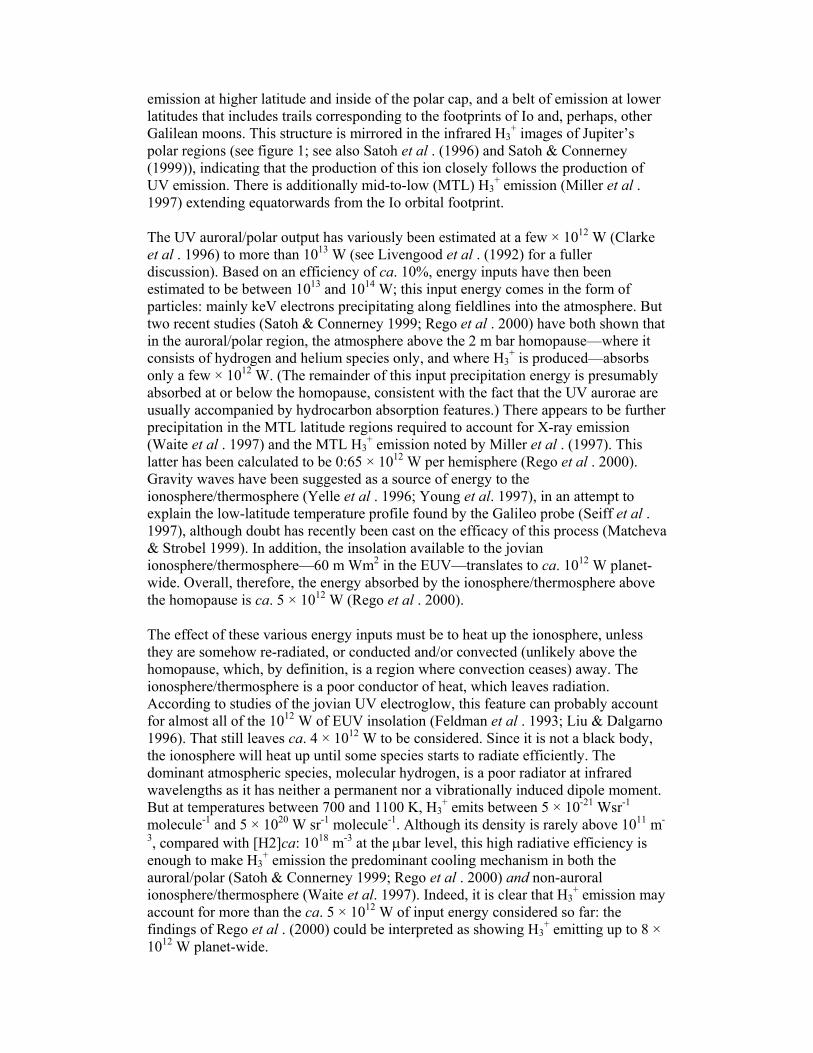
Recently, Rego et al . (1999) have detected an ion wind flowing around the auroral oval of Jupiter, by means of a Doppler-shifted H3
+ spectrum (figure 2). This auroral electrojet that these authors detected was unusually rapid, associated with velocities of ca. 3 km s-1, close to or just exceeding the local thermospheric speed of sound, and they attributed their detecting it to an unusually energetic `auroral event’. The electrojet results naturally from the mechanism proposed by Hill (1979) to explain the way in which plasma sheet co-rotation is enforced via currents flowing outwards in the plasma sheet and along the fieldlines that connect the outer (downward current) and inner (upward current) parts of the plasma sheet to the ionosphere. The current closes through the ionosphere, where fields of a few hundred kV to a few MV may be produced. The resulting combination of Jupiter’s magnetic field, B, being normal to the planet’s surface, and the equatorward electric field, E, produces an E × B force that drives ions (and electrons) around the auroral oval in the clockwise, antico- rotational, sense. Follow-up studies by T. Stallard et al . (unpublished data) show that electrojet velocities of ca. 500 m s-1 may routinely be detected. Achilleos et al . (2000) have modelled the production of electrojets using JIM for a variety of equatorial, transauroral voltages; they found that equatorward fields of ca. 2 MV produce ion velocities of ca. 500 m s-1.
Figure 2. Pole-to-equator spectral images of Jupiter at 3.953 mm, the wavelength of the H3+
ν2Q(1; 0-) line, obtained using CSHELL, the facility echelle spectrometer on the NASA IRTF. The spectrometer slit is aligned jovian north-south along the central meridian. North is at the top. (a) North pole to equator, 16 July 1996; (b) north pole to equator, 8 August 1997; (c) south pole to equator, 14 July 1996; (d) south pole to equator, 8 September 1997. In the 1996 spectra, only one intensity peak is visible, but in the 1997 data, a double peak is seen as the result of an `auroral event’ . The outermost peak is also clearly Doppler shifted (red in the north, blue in the south) as the slit cuts the auroral electrojet.
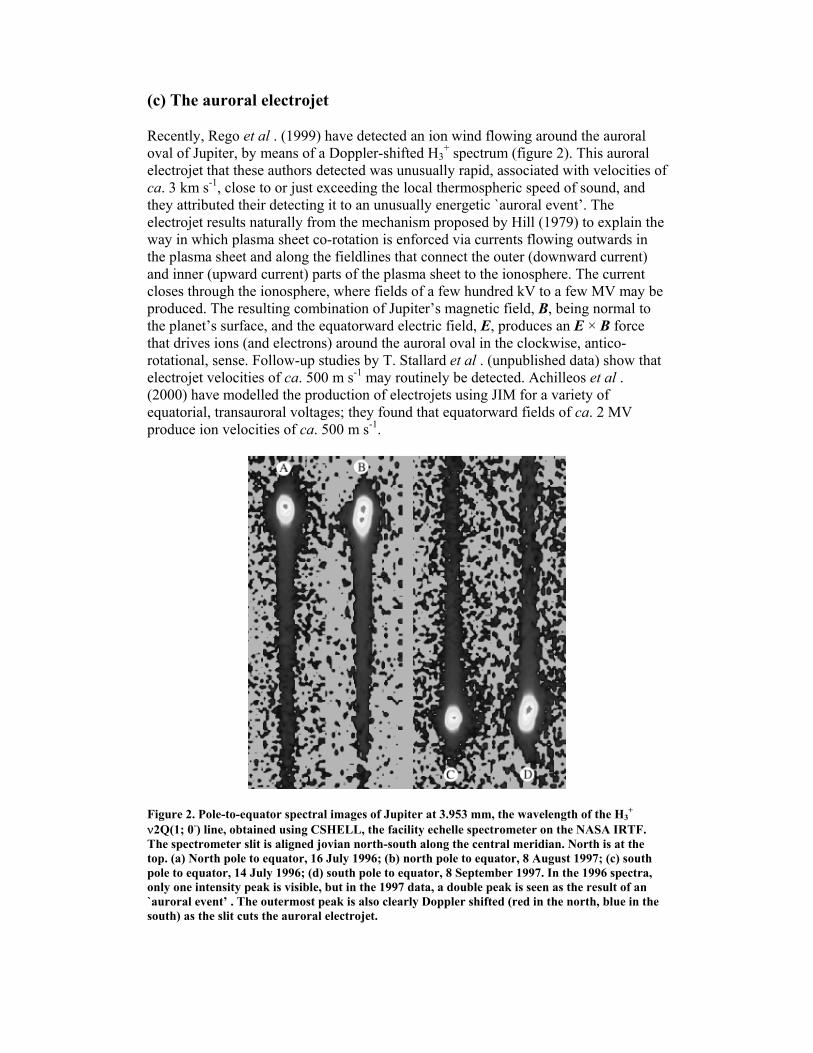
What is even more significant, however, is that the modelling shows that, as the velocity of the ions increases, they entrain the neutral thermosphere in the auroral oval, producing velocities that reach between 20% and 40% of the ions (figure 3). Such neutral entrainment in the auroral electrojet is associated with a large amount of energy: for the case of a 2 MV potential, ca. 8 × 10¹⁵ J are associated with the neutrals as they stream counter to the planet’s direction of diurnal rotation. This motion must be associated with considerable atmospheric `friction’, as entrained gas sweeps past the atmosphere outside of the electrojet region, which is in corotation with the planet. It is this friction that provides the mechanism to impart the rotational energy of the planet to the plasma sheet. To find out how much frictional energy was being transferred, we switched off the equatorward field in JIM; this is equivalent to instantaneously bringing the plasma sheet into perfect co-rotation, while shutting down the mechanism by which plasma drifts outwards from the orbit of Io. The results showed that the energy of the neutral atmosphere entrained in the electrojet was dissipated with a half-life of ca. 1000 s, corresponding to an overall energy input to the atmosphere of ca. 8 × 10¹² W. In the `steady’ state of outward drift in the plasma sheet and non-perfect co-rotation, this energy—or some fraction of it—is available to the upper atmosphere as a further—and previously unconsidered—source of heating.
Figure 3. Effect of increasing the equatorward potential across the jovian auroral oval. Voltages increase from 10 kV ((a), (b)), through 100 kV ((c), (d)), to 1 MV ((e), (f )). Ion winds are shown on the left, neutral winds on the right. (a), (b) λΙΙΙ = 304 (noon); time is 3.84 jovian days. (c), (d) λIII = 104 (noon); time is 4.29 jovian days. (e), (f ) λIII = 144 (noon); time is 4.40 jovian days.
(d) Summary
From the foregoing discussion it is clear that H3+ plays a vital role in the physical
conditions prevailing in Jupiter’s ionosphere/thermosphere. It is the main coolant in both the auroral/polar and non-auroral regions, and the fact that its strong emission comes in at temperatures between 700 and 1100 K helps explain why temperatures in this range are consistently found above the jovian homopause. H3
+ is also pivotal in the mechanism by which the rotational energy of the planet is transferred to the equatorial plasma sheet and made available for heating the upper atmosphere.
One area not considered here is the role that H3+ plays in the network of chemical
reactions that occur in the jovian atmosphere. Models of the ionosphere/thermosphere show the concentration of this ion falling off rapidly at the homopause, even in the auroral/polar regions, despite the continuing presence of precipitating electrons with enough energy to ionize molecular hydrogen. This die off is due to reactions with, primarily, hydrocarbons occurring at or just below the m bar homopause. These reactions may be important in initiating the formation of more complex hydrocarbons, and other species. It would, therefore, be extremely interesting to be able to probe such processes using infrared spectroscopic observations; to date, however, no successful observations of jovian hydrocarbon ions have been made. But it may still be that the most important contribution that H3
+ makes to the chemistry below the homopause is in providing H atoms resulting from dissociative recombination (reaction (1.2)), as proposed by Prinn & Owen (1976).
3. The other giant planets While H3
+ emission from Jupiter has received by far and away the most attention, this molecule is also known on Saturn (Geballe et al . 1993) and Uranus (Trafton et al . 1993), although studies of Neptune have failed to reveal its presence there. As in so many of their properties, while comparisons may be drawn, H3
+ studies reveal that each of the planets is different, a product of its own unique circumstances.
(a) Saturn
When H3+ emission was first detected from Saturn by Geballe et al . (1993), two
questions immediately came to mind: why was it so weak—only ca.1% of the jovian auroral emission (see figure 4)—given that Saturn was of similar size to Jupiter (RS ~ 60 000 km) and that its exposure to the solar wind should only be down by about a factor of four as a result, mainly, of the difference in distance from the Sun; and what was the distribution of the ion across the planet? Geballe et al ’s (1993) spatial resolution was ca. 3″, and they were not able to distinguish between auroral enhancements at the poles and the effect that limb brightening might have on a uniformly emitting disc. These workers deduced an ionospheric temperature of ca. 800 K from their spectrum. This was in accordance with the top end of the 600-800 K
range obtained by Atreya et al . (1984), but much higher than the 420 K that Majeed & McConnell (1996) required to fit radio occultation radio densities.
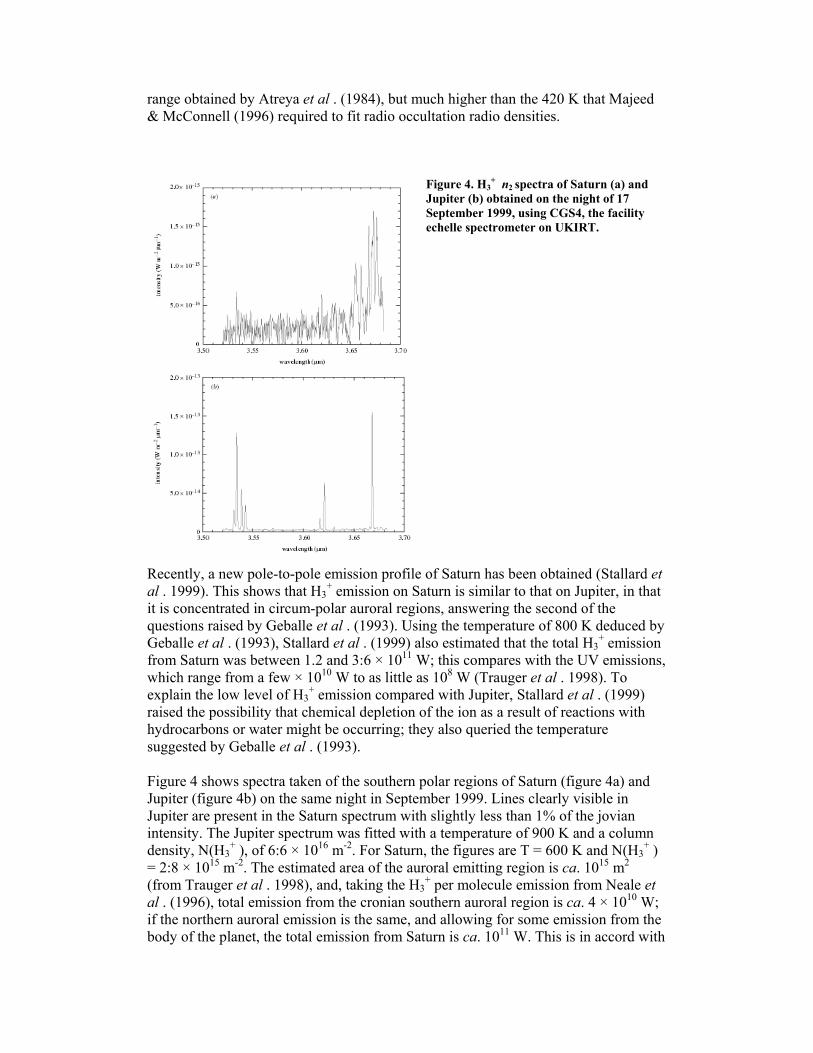
Figure 4. H3+ n2 spectra of Saturn (a) and
Jupiter (b) obtained on the night of 17 September 1999, using CGS4, the facility echelle spectrometer on UKIRT.
Recently, a new pole-to-pole emission profile of Saturn has been obtained (Stallard et al . 1999). This shows that H3
+ emission on Saturn is similar to that on Jupiter, in that it is concentrated in circum-polar auroral regions, answering the second of the questions raised by Geballe et al . (1993). Using the temperature of 800 K deduced by Geballe et al . (1993), Stallard et al . (1999) also estimated that the total H3
+ emission from Saturn was between 1.2 and 3:6 × 10¹¹ W; this compares with the UV emissions, which range from a few × 1010 W to as little as 108 W (Trauger et al . 1998). To explain the low level of H3
+ emission compared with Jupiter, Stallard et al . (1999) raised the possibility that chemical depletion of the ion as a result of reactions with hydrocarbons or water might be occurring; they also queried the temperature suggested by Geballe et al . (1993).
Figure 4 shows spectra taken of the southern polar regions of Saturn (figure 4a) and Jupiter (figure 4b) on the same night in September 1999. Lines clearly visible in Jupiter are present in the Saturn spectrum with slightly less than 1% of the jovian intensity. The Jupiter spectrum was fitted with a temperature of 900 K and a column density, N(H3
+ ), of 6:6 × 10¹⁶ m-2. For Saturn, the figures are T = 600 K and N(H3+ )
= 2:8 × 10¹⁵ m-2. The estimated area of the auroral emitting region is ca. 1015 m2 (from Trauger et al . 1998), and, taking the H3
+ per molecule emission from Neale et al . (1996), total emission from the cronian southern auroral region is ca. 4 × 10¹⁰ W; if the northern auroral emission is the same, and allowing for some emission from the body of the planet, the total emission from Saturn is ca. 1011 W. This is in accord with
the lower limit deduced by Stallard et al . (1999), and is ca. 2% of the total jovian emission.
The lower cronian temperature means that each H3+ molecule emits, on average, ca.
10% of the radiation it does on Jupiter. Moreover, the UV results show that energy inputs into the ionosphere/thermosphere of Saturn are at least two orders of magnitude less than Jupiter, and possibly even lower. Since the JIM model shows that the density of H3
+ varies approximately as the square root of the input energy (Achilleos et al . 1998), the column density derived for the Saturn spectrum is consistent with the ratio of cronian to jovian energy inputs. What then causes the relatively low emission from Saturn is a combination of lower input fluxes, leading to lower H3
+ column densities, coupled with lower temperatures. This suggests it is not necessary to invoke additional chemical depletion to explain the observations (see Atreya 1986). The lower ionospheric temperatures—presumably resulting from lower input energies—suggest that H3
+ emission may not be as effective a coolant as is the case for Jupiter. But a detailed energy balance of Saturn is still awaited.
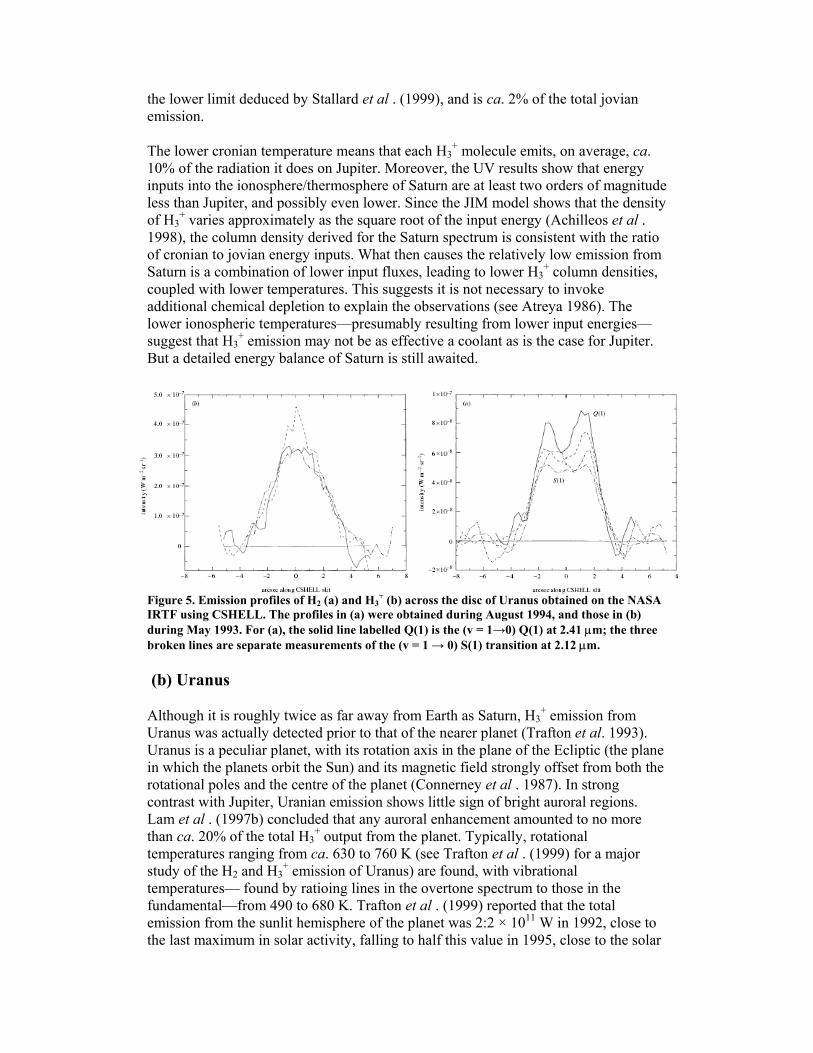
Figure 5. Emission profiles of H2 (a) and H3+ (b) across the disc of Uranus obtained on the NASA
IRTF using CSHELL. The profiles in (a) were obtained during August 1994, and those in (b) during May 1993. For (a), the solid line labelled Q(1) is the (v = 1→0) Q(1) at 2.41 µm; the three broken lines are separate measurements of the (v = 1 → 0) S(1) transition at 2.12 µm.
(b) Uranus
Although it is roughly twice as far away from Earth as Saturn, H3+ emission from
Uranus was actually detected prior to that of the nearer planet (Trafton et al. 1993). Uranus is a peculiar planet, with its rotation axis in the plane of the Ecliptic (the plane in which the planets orbit the Sun) and its magnetic field strongly offset from both the rotational poles and the centre of the planet (Connerney et al . 1987). In strong contrast with Jupiter, Uranian emission shows little sign of bright auroral regions. Lam et al . (1997b) concluded that any auroral enhancement amounted to no more than ca. 20% of the total H3
+ output from the planet. Typically, rotational temperatures ranging from ca. 630 to 760 K (see Trafton et al . (1999) for a major study of the H2 and H3
+ emission of Uranus) are found, with vibrational temperatures— found by ratioing lines in the overtone spectrum to those in the fundamental—from 490 to 680 K. Trafton et al . (1999) reported that the total emission from the sunlit hemisphere of the planet was 2:2 × 10¹¹ W in 1992, close to the last maximum in solar activity, falling to half this value in 1995, close to the solar
minimum. They concluded that Uranian H3+ emission was dependent upon solar
activity much more directly than has been reported for Jupiter (Baron et al . 1996). Recent measurements show the emission levels increasing once more with the rise in solar activity (L. M. Trafton et al ., unpublished data).
Additionally, Trafton et al . (1999) found that the total infrared emission from H3+
was comparable with, or maybe only 50% of, that of molecular hydrogen; this again is a contrast with Jupiter, where H3
+ emission is the main coolant in the upper atmosphere. However, it may be that the bulk of the H2 emission comes from deeper in the atmosphere: the Uranian homopause is lower than that of Jupiter. The distribution of the two molecules across the planetary disc is by no means similar: while H3
+ emission appears to be peaked close to the sub-solar point on the planet, H2 emission shows strong brightening at the limbs of the planet (figure 5). Trafton et al . (1999) attributed this difference to H2 emission being formed in a thick shell reaching right down to the 10 m bar pressure level, while that from H3
+ came from a thin shell, which extended no further than the 1 m bar level, much more susceptible to effects of increased insolation at the sub-solar point. It may be that all of the H3
+ emission from Uranus results from the formation of this molecule by solar EUV ionization. Measurements of equatorial H3
+ column densities on Jupiter (Lam et al . 1997a; Miller et al . 1997) and modelling (Achilleos et al . 1998) are consistent in showing values of a few × 1015 m-2, and, at four times the distance from the Sun, Uranian values should be ca. 25% of this. Trafton et al . (1999) reported values between 1.43 and 4:28 × 1015 m-2. These are possibly a little too high to result solely from solar EUV. But the magnetic field of Uranus is such that relatively high particle precipitation levels, derived from the solar wind, are also possible at the sub-solar point (Hudson et al . 1989).
(c) Extra-solar planets
The discovery in the last few years of more than 20 planets orbiting around stars close to our own Solar System has transformed the field of planetary science, bringing it right into the centre of contemporary astronomy. The technique used almost exclusively so far—looking for Doppler shifts in the spectra of the central stars that can be accounted for by the gravitational attraction of orbiting bodies (Mayor & Queloz 1995; Marcy & Butler 1996; Cumming et al. 1999)—reveals details about the orbital parameters and masses of the planets concerned, but little about their intrinsic nature. The Doppler-shift method, by its very nature, is most sensitive to large planets that orbit close to their star. The catalogue maintained by Schneider (http://www.obspm.fr/planets) shows many planets with masses similar to or greater than that of Jupiter. Recently, two groups have reported detecting a planet transiting in front of the Sun-like star HD 209458 (Charbonneau et al . 2000; Henry et al . 2000), which give, additionally, the radius, estimated to be between 1.27 and 1:42RJ. And, even more excitingly, Cameron et al . (1999) have detected starlight reflected from an 8MJ, blue-green planet orbiting Tau Bootes. The way to study planetary atmospheres in systems other than our own is opening up at the beginning of the new millennium.
So what might conditions be like on these (super-)Jupiters, which appear to have spiralled in towards their central stars to a position of blistering proximity? We have used JIM to simulate the effect of bringing our own Jupiter in towards the Sun (figure
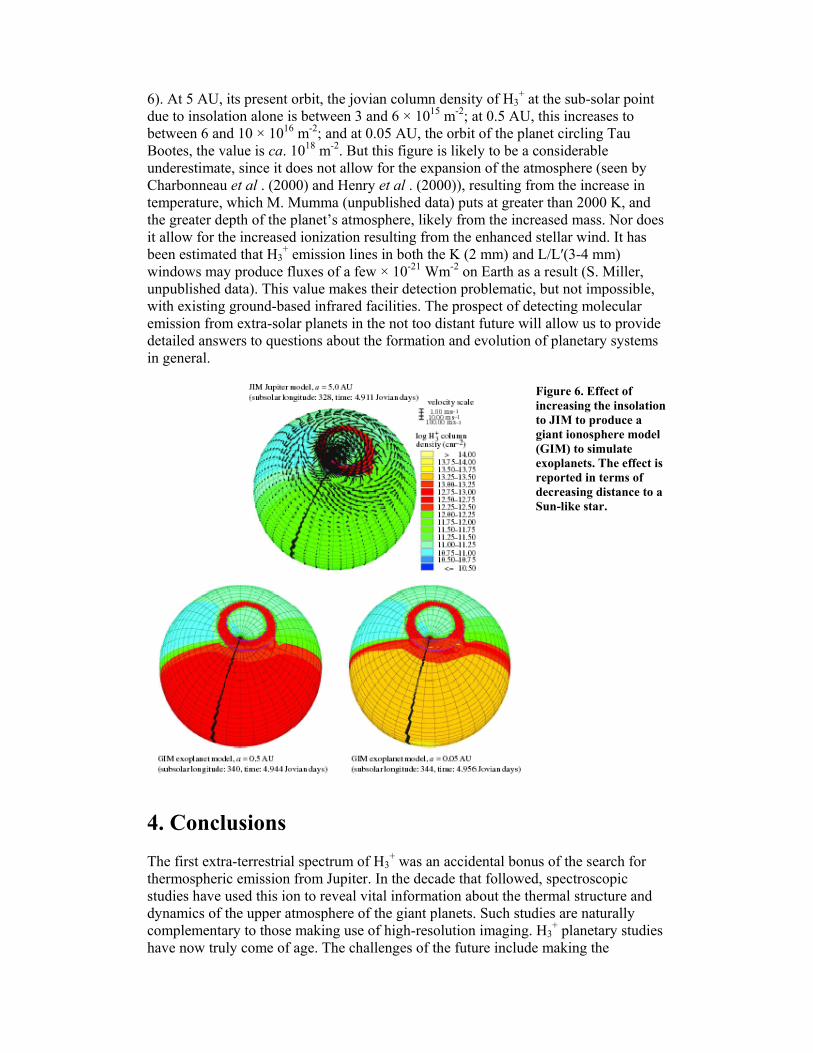
6). At 5 AU, its present orbit, the jovian column density of H3+ at the sub-solar point
due to insolation alone is between 3 and 6 × 10¹⁵ m-2; at 0.5 AU, this increases to between 6 and 10 × 1016 m-2; and at 0.05 AU, the orbit of the planet circling Tau Bootes, the value is ca. 1018 m-2. But this figure is likely to be a considerable underestimate, since it does not allow for the expansion of the atmosphere (seen by Charbonneau et al . (2000) and Henry et al . (2000)), resulting from the increase in temperature, which M. Mumma (unpublished data) puts at greater than 2000 K, and the greater depth of the planet’s atmosphere, likely from the increased mass. Nor does it allow for the increased ionization resulting from the enhanced stellar wind. It has been estimated that H3
+ emission lines in both the K (2 mm) and L/L′(3-4 mm) windows may produce fluxes of a few × 10-21 Wm-2 on Earth as a result (S. Miller, unpublished data). This value makes their detection problematic, but not impossible, with existing ground-based infrared facilities. The prospect of detecting molecular emission from extra-solar planets in the not too distant future will allow us to provide detailed answers to questions about the formation and evolution of planetary systems in general.
Figure 6. Effect of increasing the insolation to JIM to produce a giant ionosphere model (GIM) to simulate exoplanets. The effect is reported in terms of decreasing distance to a Sun-like star.
4. Conclusions The first extra-terrestrial spectrum of H3
+ was an accidental bonus of the search for thermospheric emission from Jupiter. In the decade that followed, spectroscopic studies have used this ion to reveal vital information about the thermal structure and dynamics of the upper atmosphere of the giant planets. Such studies are naturally complementary to those making use of high-resolution imaging. H3
+ planetary studies have now truly come of age. The challenges of the future include making the
measurement of ion winds a routine technique for probing the transport of energy in the ionosphere/thermosphere and the way in which this region couples to planetary magnetospheres, and the detection of H3
+ emission from extra-solar planets.
It is a pleasure to acknowledge the expert assistance of staff at the United Kingdom Infrared Telescope and the NASA Infrared Telescope Facility, both located on Mauna Kea, Hawaii. Without their help, this work would not have been possible. This work was supported by the UK Particle Physics and Astronomy Research Council.
References Achilleos, N., Miller, S., Tennyson, J., Aylward, A. D., Mueller-Wodarg, I. & Rees, D. 1998 JIM: a time-dependent, three-dimensional model of Jupiter’s thermosphere and ionosphere. J. Geophys. Res. 103, 20 089-20 112.
Achilleos, N., Miller, S., Prangé, R. & Dougherty, M. K. 2000 A dynamical model of Jupiter’s auroral electrojet. New J. Phys. (Submitted.)
Atreya, S. K. 1986 Atmospheres and ionospheres of the outer planets and their satellites, pp. 139- 143. Springer.
Atreya, S. K. & Donahue, T. M. 1976 Model ionospheres of Jupiter. In Jupiter (ed. T. Gehrels), pp. 304-310. Tucson, AZ: University of Arizona Press.
Atreya, S. K., Waite Jr, J. H., Donahue, T. M., Nagy, A. F. & McConnell, J. C. 1984 Model ionospheres of Saturn. In Saturn (ed. T. Gehrels), pp. 239-251. Tucson, AZ: University of Arizona Press.
Ballester, G. E. (and 21 others) 1996 Time-resolved observations of Jupiter’s far-ultraviolet aurora. Science 274, 409-413.
Baron, R., Owen, T., Connerney, J. E. P., Satoh, T. & Harrington, J. 1996 Solar wind control of Jupiter’s H3
+ auroras. Icarus 120, 437-442.
Cameron, A. C., Horne, K., Penny, A. & James, D. 1999 Probable detection of starlight reflected from the giant exoplanet orbiting ½ Bootes. Nature 402, 751-756.
Charbonneau, D., Brown, T. M., Latham, D. W. & Mayor, M. 2000 Detection of planetary transits across a Sun-like star. Astrophys. J. 529, L45-L48.
Clarke, J. T., Weaver, H. A., Feldman, P. D., Moos, H. W., Fastie, W. G. & Opal, C. B. 1980 Spatial imaging of hydrogen Lyman alpha emission from Jupiter. Astrophys. J. 240, 696-701.
Clarke, J. T., Gladstone, G. R. & ben Jafl el, L. 1981 Jupiter’s dayglow H Lyα emission profile. Geophys. Res. Lett. 18, 1935-1938.
Clarke, J. T. (and 20 others) 1996 Far-ultraviolet imaging of Jupiter’s aurora and the `Io footprint’ . Science 274, 404-409.
Clarke, J. T. (and 11 others) 1998 Hubble Space Telescope imaging of Jupiter’s UV aurora during the Galileo orbiter mission. J. Geophys. Res. 103, 20 217-20 236.
Connerney, J. E. P., Acuna, M. H. & Ness, N. F. 1987 The magnetic field of Uranus. J. Geophys. Res. 92, 329-345.
Cumming, A., Marcy, G. W. & Butler, R. P. 1999 The Lick Planet Search: detectability and mass thresholds. Astrophys. J. 526, 890-915.
de Bergh, C., Martin, A., Owen, T., Gautier, D., Maillard, J.-P., Lutz, B. L. & Drossart, P. 1992 Paper presented at Workshop on Variable Phenomena in jovian Planetary Systems, Anapolis, MD, 13-16 July 1992.
Drossart, P. (and 11 others) 1989 Detection of H3+ on Jupiter. Nature 340, 539-541.
Feldman, P. D., McGrath, M. A., Moos, H. W., Durrance, S. T., Strobel, D. F. & Davidsen, A. F. 1993 The spectrum of the jovian dayglow observed at 3Å resolution with the Hopkins Ultraviolet Telescope. Astrophys. J. 406, 279-284.
Geballe, T. R., Jagod, M.-F. & Oka, T. 1993 Detection of H3+ infrared emission lines
in Saturn. Astrophys. J. 410, L109-L112.
Gross, S. H. & Rasool, S. I. 1964 The upper atmosphere of Jupiter. Icarus 3, 311-322.
Hamilton, D. C., Gloeker, G., Krimigis, S. M., Bostrom, C. O., Armstrong, T. P., Axford, W. I., Fan, C. Y., Lanzerotti, L. J. & Hunten, D. M. 1980 Detection of energetic hydrogen molecules in Jupiter’s magnetosphere by Voyager 2: evidence for an ionospheric plasma source. Geophys. Res. Lett. 7, 813-816.
Henry, G. W., Marcy, G. W., Butler, R. P. & Vogt, S. S. 2000 A transiting `51 Peg-like’ planet. Astrophys. J. 529, L41-L44.
Hill, T. W. 1979 Inertial limit on corotation. J. Geophys. Res. 84, 6554-6558.
Hudson, M. K., Clarke, J. T. & Warren, J. A. 1989 Ionospheric dynamo theory for production of far ultraviolet emissions on Uranus. J. Geophys. Res. 94, 6517-6522.
Kim, Y. K., Fox, J. L. & Porter, H. S. 1992 On H3+ density profiles in the jovian
auroral ionosphere. J. Geophys. Res. 87, 6093-6101.
Lam, H. A., Achilleos, N., Miller, S., Tennyson, J., Trafton, L. M., Geballe, T. R. & Ballester, G. E. 1997a A baseline spectroscopic study of the infrared auroras of Jupiter. Icarus 127, 379-393.
Lam, H. A., Miller, S., Joseph, R. D., Geballe, T. R., Trafton, L. M., Tennyson, J. & Ballester, G. E. 1997b Variation in the H3
+ emission of Uranus. Astrophys. J. 474, L73-L76.
Liu, W. & Dalgarno, A. 1996 The ultraviolet spectrum of the jovian dayglow. Astrophys. J. 462, 502-518.
Livengood, T. A., Moos, H. W., Ballester, G. E. & Prangé, R. 1992 Jovian ultraviolet activity, 1981-1991. Icarus 97, 26-45.
McConnell, J. C. & Majeed, T. 1991 H3+ in the jovian ionosphere. J. Geophys. Res.
92, 8570- 8578.
Maillard, J.-P., Drossart, P., Watson, J. K. G., Kim, S. J. & Caldwell, J. 1990 H3+
fundamental band in Jupiter’s auroral zones at high resolution from 2400 to 2900 inverse centimeters. Astrophys. J. 363, L37-L41.
Majeed, T. & McConnell, J. C. 1996 Voyager electron density measurements on Saturn: analysis with a time dependent ionospheric model. J. Geophys. Res. 101, 7589-7598.
Marcy, G. W. & Butler, R. P. 1996 A planetary companion to 70 Viginis. Astrophys. J. 464, L147-L151.
Matcheva, K. I. & Strobel, D. F. 1999 Heating of Jupiter’s thermosphere by dissipation of gravity waves due to molecular viscosity and heat conduction. Icarus 140, 328-340.
Mayor, M. & Queloz, D. 1995 A Jupiter-mass companion to a solar-type star. Nature 378, 355-359.
Miller, S., Joseph, R. D. & Tennyson, J. 1990 Infrared emissions of H3+ in the
atmosphere of Jupiter at the 2.1 and 4.0 micron region. Astrophys. J. 360, L55-L58.
Miller, S., Achilleos, N., Ballester, G. E., Lam, H. A., Tennyson, J., Geballe, T. R. & Trafton, L. M. 1997 Mid-to-low latitude H3
+ emission from Jupiter. Icarus 130, 57-67.
Neale, L., Miller, S. & Tennyson, J. 1996 Spectroscopic properties of the H3+
molecule: a new calculated linelist. Astrophys. J. 464, 516-520.
Oka, T. & Geballe, T. R. 1990 Observations of the fundamental 4 micron band of H3+
in Jupiter. Astrophys. J. 351, L53-L56.
Prangé, R., Maurice, S., Harris, W. M., Rego, D. & Livengood, T. 1997 Comparison of IUE and HST diagnostics of the jovian aurora. J. Geophys. Res. 102, 9289-9301.
Prangé, R., Rego, D., Pallier, L., Connerney, J. E. P., Zarka, P. & Queinnec, J. 1998 Detailed study of FUV jovian auroral features with the post-COSTAR faint object camera. J. Geophys. Res. 103, 20 195-20 216.
Prinn, R. G. & Owen, T. 1976 The chemistry and spectroscopy of the jovian atmosphere. In Jupiter (ed. T. Gehrels), pp. 319-371. Tucson, AZ: University of Arizona Press.
Rego, D., Achilleos, N., Stallard, T., Miller, S., Prangé, R., Dougherty, M. K. & Joseph, R. D. 1999 Supersonic winds in Jupiter’s aurorae. Nature 399, 121-124.
Rego, D., Miller, S., Achilleos, N., Prangé, R. & Joseph, R. D. 2000 Latitudinal profiles of the jovian IR emission of H3
+ at 4 m m with the NASA Infrared Telescope Facility: energy inputs and thermal balance. Icarus. (In the press.)
Satoh, T. & Connerney, J. E. P. 1999 Jupiter’s H3+ emissions viewed in corrected
jovimagnetic co-ordinates. Icarus 141, 236-252.
Satoh, T., Connerney, J. E. P. & Baron, R. 1996 Emission source model of Jupiter’s H3
+ aurorae: a generalised analysis of images. Icarus 122, 1-23.
Seifl , A., Kirk, D. B., Knight, T. C., Young, L. A., Milos, F. S., Venkatapathy, E., Mihalov, J. D., Blanchard, R. C., Young, R. E. & Shubert, G. 1997 Thermal structure of Jupiter’s upper atmosphere derived from the Galileo probe. Science 276, 102-104.
Stallard, T., Miller, S., Ballester, G. E., Rego, D., Joseph, R. D. & Trafton, L. M. 1999 The H3
+ latitudinal profile of Saturn. Astrophys. J. 521, L149-L152.
Trafton, L. M., Geballe, T. R., Miller, S. & Tennyson, J. 1993 Detection of H3+ from
Uranus. Astrophys. J. 405, 761-766.
Trafton, L. M., Miller, S., Geballe, T. R., Tennyson, J. & Ballester, G. E. 1999 H2 and H3
+ emission from Uranus: the uranian thermosphere, ionosphere and aurora. Astrophys. J. 524, 1059-1083.
Trauger, J. T. (and 16 others) 1998 Saturn’s hydrogen aurora: widefield and planetary camera 2 imaging from the Hubble Space Telescope. J. Geophys. Res. 103, 20 237-20 244.
Waite Jr, J. H., Cravens, T. E., Kozyra, J., Nagy, A. F., Atreya, S. K. & Chen, R. H. 1983 Electron precipitation and related aeronomy on the jovian thermosphere and ionosphere. J. Geophys. Res. 88, 6143-6163.
Waite Jr, J. H., Gladstone, G. R., Drossart, P., Cravens, T. E., Maurellis, A., Lewis, W. S., Mauk, B. & Miller, S. 1997 Jovian X-ray emission: key to understanding high temperatures measured by Galilean probe. Science 276, 104-108.
Yelle, R. V., Young, L. A., Vervack Jr, R. J., Young, R. E., Pfister, L. & Sandel, B. R. 1996 The structure of Jupiter’s atmosphere: prediction for Galileo. J. Geophys. Res. 101, 2149-2161.
Young, L. A., Yelle, R. V., Young, R. E., Seifl , A. & Kirk, D. B. 1997 Gravity waves in Jupiter’s thermosphere. Science 276, 108-111.
Discussion F. SCAPPINI (Instituto di Spettroscopia Molecolare, Bologna, Italy ). You showed a spectrum of H3
+ taken with a vertical-slit spectrometer. What is the horizontal feature?
S. MILLER. The horizontal feature you see at all wavelengths across the spectrum of Jupiter in the polar regions is a `polar haze’. This does not have a discrete line spectrum, but shows up as an enhanced continuum at the north and south pole. The assumption (I do not think anyone has actually modelled this) is that this haze is being formed by carbo-ion and carbo-radical reactions. These species are being created by the high fluxes of energetic particles that are precipitated at the jovian poles, and which are also responsible for the aurorae themselves.
J. B. A. MITCHELL (PALMS, Université de Rennes, France). Regarding your comment about H3
+ being a cooling agent in the ionosphere of Jupiter, the dissociative recombination of this ion is a violent event. For example, the dissociative recombination of NO+ is responsible for converting spark plug electrical energy into chemical energy, which ignites the fuel in a gasoline engine. For H3
+ , the fragments can carry away as much as 9 eV of kinetic energy. Electron degradation studies show that, for example, a 10 keV cosmic-ray electron loses much of its energy in the production of H3
+ in an interstellar cloud, and the released kinetic energy kinetic energy of the products serves to heat up the cloud. Has your model taken this effect into account?
S. MILLER. It is certainly true that the dissociative recombination of H3+ is an
energetic process. But it is not a primary source of energy to the jovian ionosphere/ thermosphere. Instead, one can regard it as part of the process by which the energy of the precipitating particles (in the case of the auroral/polar regions) and the solar EUV flux, which are responsible for ionizing the atmosphere in the first place, is degraded into heat for the atmosphere. In a simplied schema one has:
H2 + e* -> H2+ + e + e (energy absorbed);
H2 + EUV -> H2+ + e;
H2+ + H2 -> H3
+ + H (initial energy release);
H3+ + e -> H + H + H (further energy release);
-> H2 + H:
Effectively, one is using the energy of precipitating particles/EUV photons to dissociate H2 molecules and collisionally heat the atmosphere via fast hydrogen atoms. (Typical fluxes are of the order of 60 mWm-2 for solar EUV and 1-10 mW m-2 for particles.)
In the process, however, a column density of H3+ of around n × 1016 m-2 in the auroral
regions and m × 1015 m-2 is produced. These ions radiate strongly in the infrared at temperatures of ca. 1000 K, and, thus, radiate away the heat being produced by ionization and subsequent dissociative recombination. So our model takes these effects into account.
E. F. VAN DISHOECK (Leiden Observatory, The Netherlands). Can you comment on the H3
+ observations of the comet Shoemaker-Levy impact on Jupiter?
S. MILLER. As the comet crashed into the atmosphere of Jupiter, it was difficult to pick up the immediate effects on the ionosphere/thermosphere, which is where H3
+ emission is formed, because the H3
+ lines were swamped by very high intensity emission from hot methane in the stratosphere. This methane reached temperatures in excess of 2000 K, and some of it was blast accelerated to velocities up to 100 km s-1 (greater than the jovian escape velocity). So the immediate effects on the ionosphere were not visible in H3
+ emission. But three important effects were noted.
(i) Between ca. 40 min and 1 h after the impact of some of the fragments, auroral emission was reported around latitudes of 40-50º in the Northern Hemisphere, corresponding to regions which were linked by magnetic fieldlines to the southern impact sites.
(ii) After a few days, the ionosphere above the impact sites showed lower levels of H3
+ emission than normal. This was put down to chemical depletion of H3+ by dust
and metal-rich gas, which was mixed high into the ionosphere/thermosphere, above the normal homopause at around the 1 m bar pressure level.
(iii) After about a week, the normal southern auroral oval emission was found to be very `depressed’ such that the northern aurora appeared about 10 times brighter, instead of being of roughly equal intensity, as is usually the case. The northern auroral may have been brightened by about a factor of two, contributing to some of this effect. But, again, it was mainly attributed to the southern auroral H3
+ being chemically depleted by metal-rich gas and dust drifting from the impact sites into the circumpolar auroral region.