nlte water lines in betelgeuse-like atmospheres
TRANSCRIPT

The Title of this VolumeEditors : will be set by the publisher
EAS Publications Series, Vol. ?, 2013
NLTE WATER LINES IN BETELGEUSE-LIKE ATMOSPHERES
Julien Lambert1, 2, Eric Josselin1, Nils Ryde2 and Alexandre Faure3
Abstract. The interpretation of water lines in red supergiant stellar at-mospheres has been much debated over the past decade. The introduc-tion of the so-called MOLspheres to account for near-infrared ”extra”absorption has been controversial. We propose that non-LTE effectsshould be taken into account before considering any extra-photosphericcontribution.
After a brief introduction on the radiative transfer treatment andthe inadequacy of classical treatments in the case of large-scale systemssuch as molecules, we present a new code, based on preconditionedKrylov subspace methods. Preliminary results suggest that NLTE ef-fects lead to deeper water bands, as well as extra cooling.
1 Water in RSG atmospheres
The interpretation of water lines in red supergiant stellar atmospheres has been de-bated for more than a decade. For example, Tsuji (2000) shows that near-infraredwater bands observed with the Infrared Satellite Observatory (ISO) low resolutionspectrograph toward µ Cep appear significantly deeper than expected from a purephotospheric, 1D, local thermodynamic equilibrium (LTE) and hydrostatic syn-thetic spectrum. In order to quantify this extra absorption, he considered the pos-sibility to add an ad hoc quasi-static molecular shell baptized ”MOLsphere”. Butwhat was initially introduced as toy model gained support through interferometricobservations which reveal a larger spatial extension in water bands compared tothe stellar radius determined in the continuum (see Perrin et al. 2005; Ohnaka2004).
However the MOLsphere model is still subject to some weaknesses. First of all,no model is up to now able to explain the formation of such extra-photospheric
1 LUPM UMR5299, CNRS & Universite Montpellier II, Place Eugene Bataillon, 34095Montpellier Cedex 05, France e-mail: [email protected] Lund Observatory, Box 43, SE-22100 Lund, Sweden3 IPAG - UMR5274, CNRS & UJF-Grenoble, F-38041 Grenoble, France
c© EDP Sciences 2013DOI: (will be inserted later)
arX
iv:1
304.
4111
v1 [
astr
o-ph
.SR
] 1
5 A
pr 2
013

2 The Title of this Volume
layer (even gas levitation by shock wave cannot account for the parameters suchas density and water abundance proposed in MOLsphere models). One shouldalso keep in mind that, due to the rather poor coverage of the Fourier plane bycurrent infrared interferometers, the interpretation of such observations stronglyrely on a presupposed model. More importantly, based on high resolution spectraobtained with TEXES, Ryde et al. (2006) showed that water lines around 12 µm,predicted in emission by MOLsphere models, are in fact observed in absorptionand are probably of photospheric origin.
In order to reconcile the interpretation of observations in various spectralranges, we want to test how important non LTE (NLTE) effects are and whetherthey may mimic a MOLsphere through a strengthening of absorption lines. TheseNLTE effects may also affect the thermodynamical structure of the atmospheresthrough e.g. the contribution of molecules to the cooling function and the ra-diative pressure. If it leads to a more extended atmosphere and a shift of thewater line contribution function, this could potentially explain the interferometricobservations.
2 General context of radiative transfer in molecular lines
2.1 Basics of radiative transfer
In order to determine the specific intensity Iν in a line, one has to solve theradiative transfer equation (RTE). For a 1D plane parallel geometry, this equationis a simple ordinary differential equation of the first order,
µdIνdτν
= Iν − Sν . (2.1)
Solving the RTE under NLTE conditions is however not straightforward, becauseof an intricate non-linear and non-local coupling between level populations andradiation. Indeed the determination of the source function for a given line due toa transition i→ j at an optical depth τ requires the knowledge of the populationson the levels i and j at this optical depth.
Sνij (τ) =2hνij
3
c21
xj(τ)xl(τ)
− 1, (2.2)
where xk = nk/gk, with nk being the relative population of level k and gk is itsstatistical weight. The other symbols have their usual meanings. These popu-lations can be derived by solving the statistical equilibrium system of equations,which is a set of rate equations for each energy level.
ni
N∑j<i
Aij +
N∑j 6=i
(BijJ ij + ncolCij (T )
)−
N∑j>i
njAji +
N∑j 6=i
nj(BjiJ ji + ncolCji (T )
) = 0,
(2.3)

short title 3
where J ji denotes the mean radiation field for the i→ j transition, integrated overthe line profile. This system has in general no analytical solution. However, if oneconsiders that the probability of radiative (de)excitation is very small comparedto the collisional (de)excitation, either because the radiative field (through J ji) isweak or because the density of colliders ncol is large, the system can be simplifiedand leads to an analytical solution for the level populations, being the Boltzmanndistribution. The populations then only depend on the local kinetic temperatureat τ . This is the LTE hypothesis. The source function is simplified to the Planckfunction which only depends on the local temperature as well. On the contrary, ifthe radiative field is strong and/or the collider density is low, one has to considerthe radiative terms associated to J and invert this system of equations. The maindifficulty is that the mean intensity field J depends on the solution of the RTE:
J ij(τ) =1
2
∫ ∞0
φν(τ)
∫ +1
−1Iν(τ, µ)dµdν (2.4)
This explicit dependence on the solution means that to solve the statistical equi-librium in order to determine the source function, one need to know the intensityat different locations and for different frequencies simultaneously. The radiativetransfer is thus a non-local problem where the physical state at a given τ is coupledwith every other layer. Furthermore, for a multi-level system, the problem is alsonon-linear. Because of this coupling, the source function and the mean intensityfield are usually determined iteratively. This is the classical way to solve NLTEradiative transfer.
2.2 The water molecule
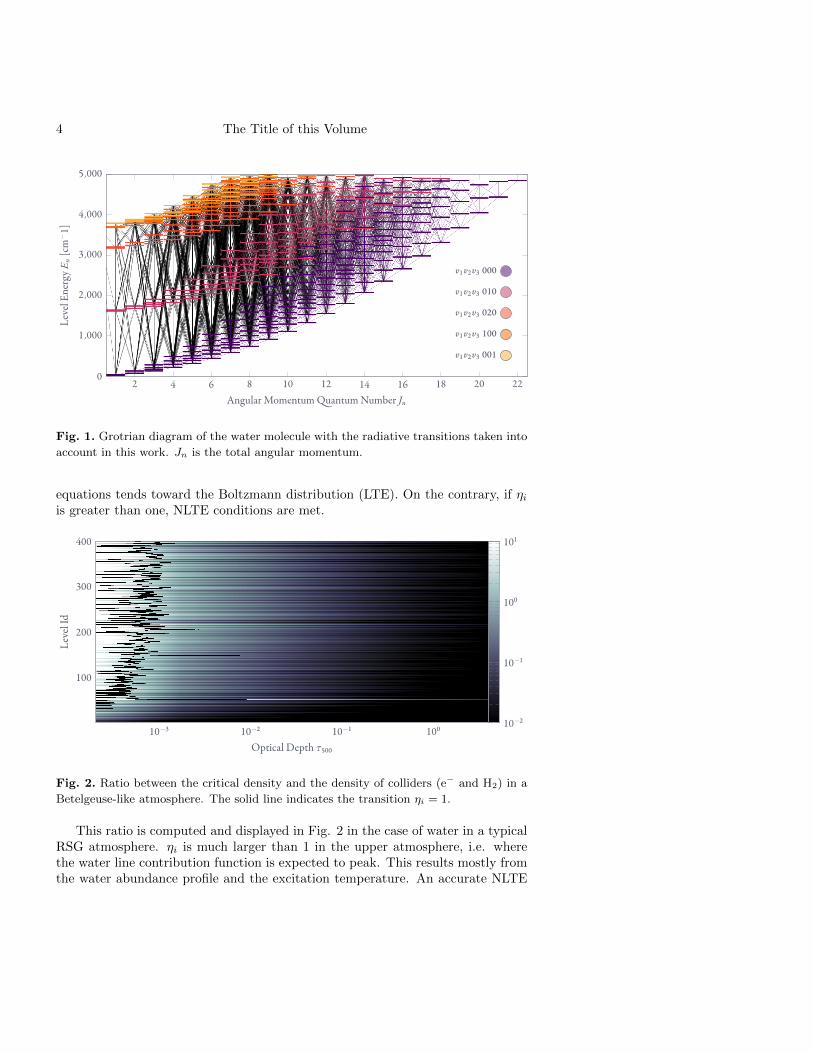
Solving the statistical equilibrium system requires molecular data: the energy andstatistical weight of each level, the Einstein coefficients Aij (including the selectionrules), and finally, the collisional rates Cij . For the water molecule, we have usedthe line list and radiative coefficients from Barber et al. (2006). The radiativetransitions we have taken into account are displayed in Fig. 1. The collisionalrates were computed by Faure & Josselin (2008) thanks to an original methodof extrapolation for high J (relevant to the temperatures met in red supergiant -RSG - atmospheres).
A first rough estimate of the deviation from LTE can be obtained by evaluatingthe competition between radiative and collisional processes. A good indicator ofthis deviation is thus the ratio between radiative and collisional de-excitation rates,that is, the ratio between the critical density and the density of colliders for eachenergy level.
ηi(τ) =ncrii (τ)
ncol(τ)=
1
ncol(τ)
∑i−1j=1Aij∑i−1
j=1 Cij(T (τ))(2.5)
If this ratio ηi is much smaller than 1 for every level i, collisions dominate ev-erywhere over radiative transitions and the solution of the statistical equilibrium
4 The Title of this Volume
......2
.4
.6
.8
.10
.12
.14
.16
.18
.20
.22
.0 .
1,000
.
2,000
.
3,000
.
4,000
.
5,000
.
Angular Momentum uantumNumber Jn
.
LevelEnergyE
n[cm
− 1]
..
v1v2v3 000
..
v1v2v3 010
..
v1v2v3 020
..
v1v2v3 100
..
v1v2v3 001
Fig. 1. Grotrian diagram of the water molecule with the radiative transitions taken into
account in this work. Jn is the total angular momentum.
equations tends toward the Boltzmann distribution (LTE). On the contrary, if ηiis greater than one, NLTE conditions are met.
... ...10−3
.10−2
.10−1
.100.
100
.
200
.
300
.
400
.
Optical Depth τ500
.
LevelId
..
...
10−2
.
10−1
. 100.
101
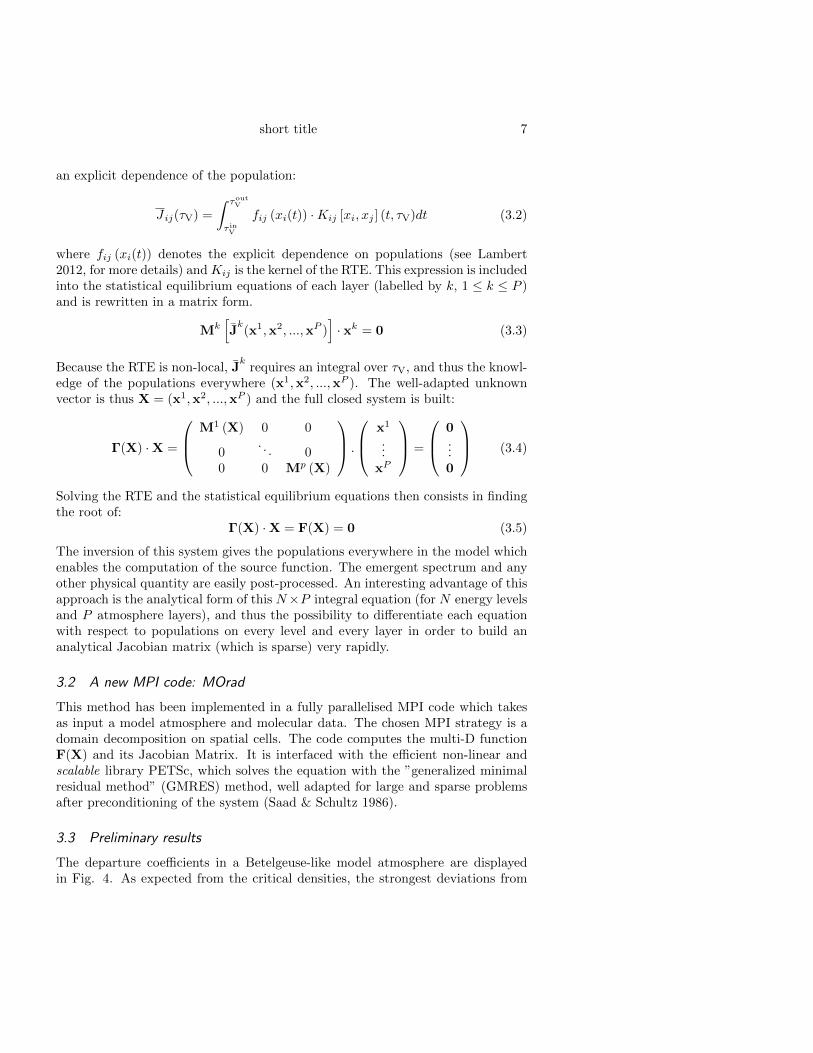
Fig. 2. Ratio between the critical density and the density of colliders (e− and H2) in a
Betelgeuse-like atmosphere. The solid line indicates the transition ηi = 1.
This ratio is computed and displayed in Fig. 2 in the case of water in a typicalRSG atmosphere. ηi is much larger than 1 in the upper atmosphere, i.e. wherethe water line contribution function is expected to peak. This results mostly fromthe water abundance profile and the excitation temperature. An accurate NLTE

short title 5
treatment of the RTE is thus required to properly analyze water spectra.
2.3 The weakness of classical methods for large-scale systems
The classical methods generally used to solve the RTE rely on the operator split-ting technique, which is derived from the Lambda Iteration (LI) (Trujillo Bueno& Fabiani Bendicho 1995). The LI method consists in iteratively computing theSchwarzschild-Milne integral with the use of an integration operator Λ. Λ inte-grates the source function over the domain (i.e. the stellar atmosphere) in orderto determine the mean intensity field. However, LI is inefficient and inaccuratein many cases, as it does not converge toward the true solution. This is due tothe fact that the spectral radius of the amplification matrix of this scheme λmax
depends on the NLTE parameter ε (i.e. the photon destruction probability; thelower ε, the stronger the NLTE effects) and the total optical depth of the mediumT , as λmax ' (1−ε)(1−T−1)−1. It is close to one if ε is small (i.e. strongly NLTE)and/or if T is large. In order to improve its convergence toward the true solution,a better conditioning can be obtained through operator splitting methods, suchas ALI (Jacobi), Gauss-Seidel or Successive OverRelaxation method SOR (Tru-jillo Bueno & Fabiani Bendicho 1995), which reduce the spectral radius (see Fig.3). Unfortunately, for large discretized and strongly NLTE problems, the spectralradius remains large, and the convergence slow (e.g. typically ∼ 100 iterationsin case B in Fig. 3). This slow convergence becomes problematic if the modelatom or molecule is large, as for each iteration the large statistical equilibriumsystem has to be solved. For water, this system is huge (about 1000 energy levels,corresponding to about 15,000 radiative rates and more than 330,000 collisionalrates; see Fig. 1) and the total time needed to converge becomes prohibitive. Fur-thermore, the accuracy of these methods may be poor (see Chevallier et al. 2003,especially Fig. 9). This is intrinsically due to the static nature of the iterations.
3 New method and preliminary results
3.1 Methodology
Rather than determining iteratively the source function, the new method describedin Lambert (2012) is to determine, in a unique step, the RTE and the populationsin every layer of a discretised model atmosphere. This is done by inverting ageneralised multi-zone statistical equilibrium system with a non-linear solver basedon non-static methods such as sub-space Krylov methods (Saad 2003).
The first step consists in rewriting the RTE with an explicit dependence onpopulations which become the new unknowns. Moreover, because of the non-locality of the RTE and the need to couple the sets of statistical equilibrium inevery layer, we use a unique transition-independent scale (e.g. τV = τ500).
µdIνdτV
= αν (xj , xi) Iν − jν (xi) (3.1)

6 The Title of this Volume
......0.
0.2.0.4.
0.6.0.8.
1.2 .
4
.
8
.
16
.
32
.
64
.
128
.
512
.
B
.
A
.
Destruction probability ε
.
Pointsperd
ecadeξ
.
Spectral Radii (|λMax| for Λ⋆ = 0)
..
........ −0.15.
−0.10.
−0.05
.
−0.00
.
log(S
ν/Bν)
.
Two levels benchmark
.. ...10−1
.100.
101.
102.
103. −2.00.
−1.50.
−1.00.
−0.50
.
−0.00
.
Optical Depth τν
.
log(S
ν/Bν)
......0.
0.2.0.4.
0.6.0.8.
1.2 .
4
.
8
.
16
.
32
.
64
.
128
.
512
.
B
.
A
.
Destruction probability ε
.
Pointsperd
ecadeξ
.
Spectral Radii (|λMax| for Λ⋆ = Λ(τ)I)
..
........ −0.15.
−0.10.
−0.05
.
−0.00
.log(S
ν/Bν)
.
Two levels benchmark
.. ...10−1
.100.
101.
102.
103. −2.00.
−1.50.
−1.00.
−0.50
.
−0.00
.
Optical Depth τν
.
log(S
ν/Bν)
Fig. 3. Spectral radius (left) and convergence properties (right) for two static iterative
methods (LI: upper part; ALI with Λ? = diagonal of Λ: lower part). For each method,
the convergence is shown for two spectral radii, marked with letters A (upper panel) and
B (lower panel) in the right-hand panels (the true solution is given there by the orange
line).
Then, the formal solution of this equation can be determined by the use of itsGreen function and its integration over the model atmosphere. By including thissolution into Eq. 2.4, an analytical form of the mean intensity is obtained, with
short title 7
an explicit dependence of the population:
J ij(τV) =
∫ τoutV
τ inV
fij (xi(t)) ·Kij [xi, xj ] (t, τV)dt (3.2)
where fij (xi(t)) denotes the explicit dependence on populations (see Lambert2012, for more details) and Kij is the kernel of the RTE. This expression is includedinto the statistical equilibrium equations of each layer (labelled by k, 1 ≤ k ≤ P )and is rewritten in a matrix form.
Mk[Jk(x1,x2, ...,xP )
]· xk = 0 (3.3)
Because the RTE is non-local, Jk
requires an integral over τV, and thus the knowl-edge of the populations everywhere (x1,x2, ...,xP ). The well-adapted unknownvector is thus X = (x1,x2, ...,xP ) and the full closed system is built:
Γ(X) ·X =
M1 (X) 0 0
0. . . 0
0 0 Mp (X)
.
x1
...xP
=
0...0
(3.4)
Solving the RTE and the statistical equilibrium equations then consists in findingthe root of:
Γ(X) ·X = F(X) = 0 (3.5)
The inversion of this system gives the populations everywhere in the model whichenables the computation of the source function. The emergent spectrum and anyother physical quantity are easily post-processed. An interesting advantage of thisapproach is the analytical form of this N×P integral equation (for N energy levelsand P atmosphere layers), and thus the possibility to differentiate each equationwith respect to populations on every level and every layer in order to build ananalytical Jacobian matrix (which is sparse) very rapidly.
3.2 A new MPI code: MOrad
This method has been implemented in a fully parallelised MPI code which takesas input a model atmosphere and molecular data. The chosen MPI strategy is adomain decomposition on spatial cells. The code computes the multi-D functionF(X) and its Jacobian Matrix. It is interfaced with the efficient non-linear andscalable library PETSc, which solves the equation with the ”generalized minimalresidual method” (GMRES) method, well adapted for large and sparse problemsafter preconditioning of the system (Saad & Schultz 1986).
3.3 Preliminary results
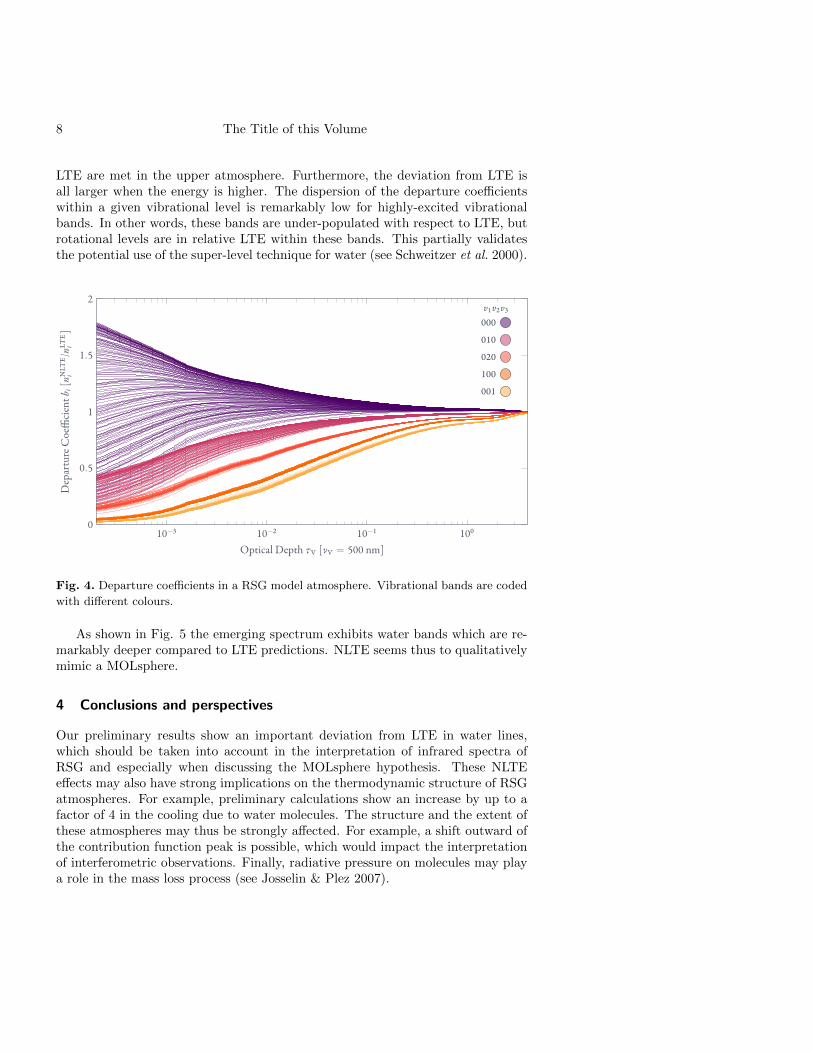
The departure coefficients in a Betelgeuse-like model atmosphere are displayedin Fig. 4. As expected from the critical densities, the strongest deviations from
8 The Title of this Volume
LTE are met in the upper atmosphere. Furthermore, the deviation from LTE isall larger when the energy is higher. The dispersion of the departure coefficientswithin a given vibrational level is remarkably low for highly-excited vibrationalbands. In other words, these bands are under-populated with respect to LTE, butrotational levels are in relative LTE within these bands. This partially validatesthe potential use of the super-level technique for water (see Schweitzer et al. 2000).
... ...10−3
.10−2
.10−1
.100.0 .
0.5
.
1
.
1.5
.
2
.
Optical Depth τV [νV = 500 nm]
.
DepartureCoefficientb
i[n
NLT
Ei
/nLTE
i]
..
v1v2v3
..
000
..
010
..
020
..
100
..
001
Fig. 4. Departure coefficients in a RSG model atmosphere. Vibrational bands are coded
with different colours.
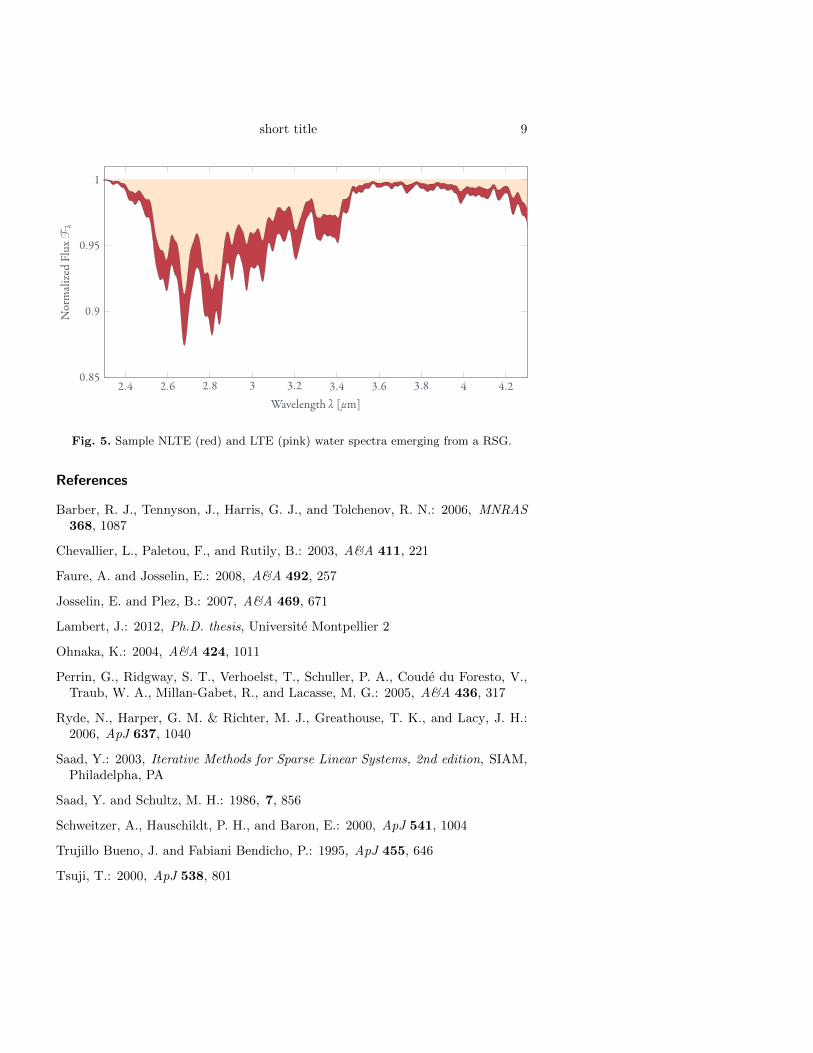
As shown in Fig. 5 the emerging spectrum exhibits water bands which are re-markably deeper compared to LTE predictions. NLTE seems thus to qualitativelymimic a MOLsphere.
4 Conclusions and perspectives
Our preliminary results show an important deviation from LTE in water lines,which should be taken into account in the interpretation of infrared spectra ofRSG and especially when discussing the MOLsphere hypothesis. These NLTEeffects may also have strong implications on the thermodynamic structure of RSGatmospheres. For example, preliminary calculations show an increase by up to afactor of 4 in the cooling due to water molecules. The structure and the extent ofthese atmospheres may thus be strongly affected. For example, a shift outward ofthe contribution function peak is possible, which would impact the interpretationof interferometric observations. Finally, radiative pressure on molecules may playa role in the mass loss process (see Josselin & Plez 2007).
short title 9
.....2.4.
2.6.2.8.
3.
3.2.3.4.
3.6.3.8.
4.
4.2.0.85 .
0.9
.
0.95
.
1
..
Wavelength λ [μm]
.
Normalized
Flux
F λ
Fig. 5. Sample NLTE (red) and LTE (pink) water spectra emerging from a RSG.
References
Barber, R. J., Tennyson, J., Harris, G. J., and Tolchenov, R. N.: 2006, MNRAS368, 1087
Chevallier, L., Paletou, F., and Rutily, B.: 2003, A&A 411, 221
Faure, A. and Josselin, E.: 2008, A&A 492, 257
Josselin, E. and Plez, B.: 2007, A&A 469, 671
Lambert, J.: 2012, Ph.D. thesis, Universite Montpellier 2
Ohnaka, K.: 2004, A&A 424, 1011
Perrin, G., Ridgway, S. T., Verhoelst, T., Schuller, P. A., Coude du Foresto, V.,Traub, W. A., Millan-Gabet, R., and Lacasse, M. G.: 2005, A&A 436, 317
Ryde, N., Harper, G. M. & Richter, M. J., Greathouse, T. K., and Lacy, J. H.:2006, ApJ 637, 1040
Saad, Y.: 2003, Iterative Methods for Sparse Linear Systems, 2nd edition, SIAM,Philadelpha, PA
Saad, Y. and Schultz, M. H.: 1986, 7, 856
Schweitzer, A., Hauschildt, P. H., and Baron, E.: 2000, ApJ 541, 1004
Trujillo Bueno, J. and Fabiani Bendicho, P.: 1995, ApJ 455, 646
Tsuji, T.: 2000, ApJ 538, 801