solubility of rock in steam atmospheres of planets
TRANSCRIPT
SOLUBILITY OF ROCK IN STEAM ATMOSPHERES OF PLANETS
Bruce Fegley, Jr.1,2, Nathan S. Jacobson
3, K. B. Williams
2, J. M. C. Plane
4, L. Schaefer
5, and Katharina Lodders
1,2
1 Planetary Chemistry Laboratory, McDonnell Center for the Space Sciences, Washington University, St. Louis, MO 63130, USA; [email protected] Department of Earth & Planetary Sciences, Washington University, St. Louis, MO 63130, USA
3 Materials Division, NASA Glenn Research Center, MS106-1, 21000 Brookpark Road, Cleveland, OH 44135, USA4 School of Chemistry, University of Leeds, Leeds LS2 9JT, UK
5 Harvard—Smithsonian Center for Astrophysics, 60 Garden Street, Cambridge, MA 02138, USAReceived 2016 January 29; accepted 2016 March 24; published 2016 June 20
ABSTRACT
Extensive experimental studies show that all major rock-forming elements (e.g., Si, Mg, Fe, Ca, Al, Na, K)dissolve in steam to a greater or lesser extent. We use these results to compute chemical equilibrium abundances ofrocky-element-bearing gases in steam atmospheres equilibrated with silicate magma oceans. Rocky elementspartition into steam atmospheres as volatile hydroxide gases (e.g., Si(OH)4, Mg(OH)2, Fe(OH)2, Ni(OH)2,Al(OH)3, Ca(OH)2, NaOH, KOH) and via reaction with HF and HCl as volatile halide gases (e.g., NaCl, KCl,CaFOH, CaClOH, FAl(OH)2) in much larger amounts than expected from their vapor pressures over volatile-freesolid or molten rock at high temperatures expected for steam atmospheres on the early Earth and hot rockyexoplanets. We quantitatively compute the extent of fractional vaporization by defining gas/magma distributioncoefficients and show that Earthʼs subsolar Si/Mg ratio may be due to loss of a primordial steam atmosphere. Weconclude that hot rocky exoplanets that are undergoing or have undergone escape of steam-bearing atmospheresmay experience fractional vaporization and loss of Si, Mg, Fe, Ni, Al, Ca, Na, and K. This loss can modify theirbulk composition, density, heat balance, and interior structure.
Key words: planets and satellites: atmospheres – planets and satellites: composition – planets and satellites:formation – planets and satellites: general – planets and satellites: terrestrial planets
1. INTRODUCTION
We investigated the solubility of rocky elements, inparticular Mg, Si, and Fe in H2O-rich (henceforth steam)atmospheres and the potential effects of their solubility forcomposition of hot rocky exoplanets and their atmospheres.Magnesium, silicon, and iron are the three most abundantelements in solar composition material that combine withoxygen to form rock (Lodders 2003). Their atomic abundanceson the cosmochemical scale are similar to one another (within20%) and are 1.03 × 10⁶ (Mg), 1.00 × 10⁶ (Si), and0.848 × 106 (Fe). Other rock-forming elements that we alsoconsider such as Al (0.0846 × 10⁶), Ca (0.0604 × 10⁶), Na(0.0577 × 10⁶), Ni (0.049 × 10⁶), and K (0.00376 × 10⁶) aremuch less abundant, and we focus on Mg, Si, and Fe.
Oxygen, Mg, Si, and Fe are also the major elements in thesilicate portions of meteorites, Earth (O + Mg + Si +Fe> 90% by mass), the other three terrestrial planets, andEarthʼs moon (see the geochemical analyses for meteorites,Earth, the Moon, Mars, and Venus in Lodders & Fegley 1998,and for Mercury in Nittler et al. 2011). Spectroscopic studies ofmain-sequence F and G stars with near-solar metallicity showconstant ratios of Fe, Mg, and Si to one another (see Section3.4.7 in Lodders et al. 2009). It is safe to assume that Mg, Si,and Fe are the most abundant rock-forming elements combinedwith oxygen in rocky exoplanets and the rocky cores of gas-rich and water-rich exoplanets around stars with solar or near-solar metallicity.
The solubility of Mg, Si, and Fe in steam atmospheres issignificant. High-pressure steam in equilibrium with quartz +SiO2—rich melt at 9.5–10 kbar and ∼1080°C (the uppercritical end point in the SiO2–H2O system) is ∼50 mol% silica(Kennedy et al. 1962; Newton & Manning 2008), and moltenSiO2+H2O are completely miscible at higher temperatures.
The significant solubility of Si and other rocky elements insteam (over a wide P–T range) raises interesting possibilities.One is the formation of potentially spectroscopically obser-vable gases such as Si(OH)4, Mg(OH)2, Fe(OH)2, Ni(OH)2,Al(OH)3, Ca(OH)2, NaOH, and KOH and their photolysisproducts. Another is loss of Mg, Si, Fe, Ni, Al, Ca, Na, and Kfrom hot rocky exoplanets that are losing or have lost steam-bearing atmospheres. Significant changes in the relative ratiosof Mg, Si, Fe, and Ni may alter the bulk composition, density,and interior structure of the remnant rocky planet left after lossof an early-formed steam atmosphere. The loss of radioactive40K may also affect the heat balance of a remnant rocky planet.The loss of Si, Al, Ca, Na, and K—abundant in Earthʼscontinental crust—may alter the surface composition, miner-alogy, and structure of a remnant rocky planet.Our work is motivated by three disparate developments: (1)
observations of over 100 hot rocky exoplanets in recent years,(2) theoretical models of steam atmospheres on the early Earthand rocky exoplanets, and (3) experimental measurements ofthe solubility of minerals and rocks in steam.Nearly all of the known hot rocky exoplanets are closer to
their host stars than Mercury is to the Sun. All small exoplanets(R < 2.7 REarth) with well-constrained masses (as of 2015December) receive at least 10 times more stellar insolation thanEarth (e.g., Figure 13 of Gettel et al. 2015), with correspond-ingly higher equilibrium temperatures. The hottest of these areplanets such as CoRoT-7b and Kepler-10b, with equilibriumtemperatures greater than 2000 K. However, others, such as thenewly discovered MEarth planet GJ 1132 b (Berta-Thompsonet al. 2015) and the closest and brightest transiting super-EarthHD 219134 b (Motalebi et al. 2015), have lower temperaturesof 500 and 1100 K, respectively. Many of the hot rockyexoplanets lie on a density curve consistent with thecomposition of Earth (Dressing et al. 2015). However, this
The Astrophysical Journal, 824:103 (29pp), 2016 June 20 doi:10.3847/0004-637X/824/2/103© 2016. The American Astronomical Society. All rights reserved.
1
population of planets (R < 2.7 REarth) also includes objects withdensities low enough to require substantial volatile envelopeson top of their solid (or liquid) surface. These include 55 Cancrie, Kepler-454 b, Kepler-11b, Kepler 48-c, HIP 116454b, HD97658b, and Kepler-10c, which have equilibrium temperaturesranging from ∼600 K to greater than 2000 K. New planets inthis radius range are being discovered rapidly with K2 (e.g.,Vanderburg et al. 2015), and even more planets in short-periodorbits will probably be discovered following the launches ofthe Transiting Exoplanet Survey Satellite mission and theCHaracterizing ExOPlanet Satellite (CHEOPS) mission in2017. The James Webb Space Telescope, slated for launch in2018, should be able to take detailed infrared spectra of theseplanets’ atmospheres.
The planets discussed above are important here because,given their high temperatures and an Earth-like volatileabundance, they could have a steam atmosphere that wouldgenerate surface temperatures hot enough to melt silicates. Forcomparison, (water-poor) Venus has an equilibrium tempera-ture of ∼260 K, but its atmosphere of ∼95 bars of CO2 (withmuch smaller amounts of SO2 and H2O) produces surfacetemperatures of ∼740 K. Venusʼs surface is almost hot enoughto melt alkali-rich silicates, e.g., the albite—sodium disilicateeutectic is 767 K (Table 12-1 in Fegley 2013), and all of theplanets mentioned above have significantly higher equilibriumtemperatures than Venus. Although steam atmosphere condi-tions on Earth were likely transient, the lifetime of potentialsteam atmospheres on the hot rocky exoplanets would belimited only by atmospheric escape. Hydrodynamic escape ofhydrogen can also drag along heavier elements—up to Xe—ifthe outflow is strong enough (e.g., Hunten et al. 1987; Pepin1997). Therefore, the solubility of rocky elements in steam maylead to elemental fractionation on planets with long-lived steamatmospheres undergoing escape. However, we stress that ourchemical equilibrium calculations are not tied to any particularplanet mentioned above, but are meant to map out atmosphericchemistry across a wide P, T range.
Our previous models were about outgassing during planetaryaccretion and atmospheric chemistry of rocky planets in oursolar system and other planetary systems and used chemicalequilibrium and chemical kinetic calculations. Schaefer &Fegley (2007, 2010) modeled the composition of the majorvolatile-bearing gases (H, C, N, O, S) in outgassed atmospheresas functions of temperature and total pressure for the differenttypes of chondritic material (i.e., carbonaceous [CI, CM, CV],ordinary [H, L, LL], and enstatite [EH, EL]). Schaefer &Fegley (2009) did chemical equilibrium models of silicatevapor atmospheres on volatile-free hot rocky exoplanets suchas CoRoT-7b. Schaefer et al. (2012) considered vaporization ofvolatile-bearing hot rocky exoplanets like Earth using tworocky compositions—Earthʼs SiO2-rich continental crust andthe MgO- and FeO-rich bulk silicate Earth (BSE). The BSE isthe composition of Earthʼs silicate portion before it evolvedinto the atmosphere, oceans, crust, and mantle. It has a mass of4.03 × 1024 kg, of which the mantle is 99.4%, so the BSEcomposition is close to that of Earthʼs mantle.
Outgassing of the two model compositions generatedatmospheres rich in steam and CO2with variable amounts ofother gases depending on pressure and temperature (e.g., seeFigures 1–5, and Table 3 in Schaefer et al. 2012). The majorMg, Si, and Fe gases in their 100 bar model were Mg(OH)2,SiO, and Fe(OH)2.
At the time the calculations in Schaefer et al. (2012) weredone, a thorough assessment of the thermodynamics of SiO2
solubility in steam and the derived thermodynamic propertiesof Si(OH)4 gas was unavailable. Fegley (2014) used therecently published Si(OH)4 data of Plyasunov (2011b, 2012)and found Si(OH)4 partial pressures 10,000 times larger thanthe SiO partial pressure expected from Si vaporization fromanhydrous lavas at the same conditions (BSE-like melt at1873 K in a 100 bar H2O–CO2 atmosphere). This preliminaryresult warrants more comprehensive models of rocky elementsolubility in steam atmospheres.This paper is organized as follows. Section 2 briefly reviews
the history of prior work on steam atmosphere models,describes effects of steam atmospheres on rock melting, anddiscusses the size of steam atmospheres expected from thecurrent H2O and CO2 content of Earthʼs mantle for the earlyEarth. Section 3 reviews prior experimental and theoreticalstudies on the solubility of rock-forming elements in steam andfocuses on Si, the rocky element that is the most soluble insteam.Section 4 describes the methods used in our chemical
equilibrium calculations. Section 5 compares the solubility ofMg, Si, Fe, Ni, Al, and Ca in steam to the vapor pressure of thepure oxides. Section 6 demonstrates that other gases possiblypresent in steam atmospheres (CO2, N2, SO2, O2, and CH4) areinert dilutants that do not alter the solubility of Mg, Si, and Fein steam.Section 7 describes the results of our chemical equilibrium
calculations of metal hydroxide gas abundances in steamatmospheres of hot rocky exoplanets. These calculations takeinto account chemical interactions with magma oceans on theseplanets. (We use the terms “rocky elements” and “metals”interchangeably.) The effects of fractional vaporization ofrocky elements on the bulk composition of the residual planetare illustrated in several figures and tabulated using gas/magma distribution (i.e., partition) coefficients. We show thatthe Si/Mg ratio in the BSE can be produced by loss of a steamatmosphere with a few percent of the BSE mass. Section 7 alsodescribes the effects of stellar UV photolysis on abundances ofthe major hydroxide gases of Mg, Si, and Fe and lists somegases that may be observable spectroscopically. Section 8discusses some cosmochemical applications of our work andsuggests some future avenues. Section 9 summarizes our majorconclusions.
2. STEAM ATMOSPHERES
2.1. Historical Review
Arrhenius et al. (1974) proposed that heating duringaccretion of Earth degassed water-bearing minerals in theaccreted planetesimals and formed a steam atmosphere. Thesteam atmosphere formed Earthʼs hydrosphere as Earth cooled,a process that may have taken ∼2.5 Myr (Sleep et al. 2001).Subsequent experiments showed that water and CO2 are thetwo major volatiles formed by impact degassing of CM2carbonaceous chondritic material during planetary accretion(e.g., Lange & Ahrens 1982; Tyburczy et al. 1986). Chemicalequilibrium calculations showed that H2O and CO2 are the twomajor gases formed by impact degassing of CI, CM2, and CV3chondritic material (Schaefer & Fegley 2010). Theoreticalmodels of the origin and evolution of an impact-generated
2
The Astrophysical Journal, 824:103 (29pp), 2016 June 20 Fegley et al.
steam atmosphere on the early Earth were presented by Abe &Matsui (e.g., Abe & Matsui 1985, 1988; Matsui & Abe 1986).
Fegley & Schaefer (2014) modeled a massive (∼1000 bar)H2O–CO2–SO2 steam atmosphere on the early Earth andcomputed gas-phase chemical equilibria in it from 2000 to6000 K. They found that thermal dissociation of H2O, CO2, andSO2 produced increasing amounts of OH, H2, CO, O2, H, O,and SO with increasing temperature at constant total pressure(see their Figure 5). They also showed that a steam atmospherewas significantly more oxidizing with a higher oxygen fugacity(fO2) than the solar nebula and suggested that easily oxidizedelements such as Si, Fe, Cr, Mo, W, B, and V would vaporizefrom the magma ocean as hydroxides (e.g., Si(OH)4, Fe(OH)2,H2CrO4, H2MoO4, H2WO4, H3BO3) and gaseous oxides of Cr,Mo, V, and W. This is potentially important for the early Earthbecause geochemical signatures may be in the rock record (B.Fegley et al. 2016, in preparation).
2.2. Effects on Rock Melting
Water vapor and CO2 are greenhouse gases, and thedevelopment of a massive steam atmosphere and a magmaocean at the planetary surface are closely linked (e.g., Abe &Matsui 1985, 1988; Matsui & Abe 1986; Zahnle et al. 1988;Abe 1993; Elkins-Tanton 2008; LeBrun et al. 2013). Asufficiently massive steam atmosphere can heat the surface ofa rocky planet to (and above) the melting point of rock (e.g.,see the discussion in Zahnle et al. 1988).
At 1 bar pressure peridotite, the major rock in Earthʼs uppermantle, starts to melt at 1120–1200°C (1390–1473 K, thesolidus, Tsol) and is completely molten by ∼1970 K (theliquidus, Tliq) (e.g., see Kushiro et al. 1968; Takahashi 1986;Takahashi et al. 1993). The bulk composition of peridotite rockfrom different locales, in particular the Na/Ca ratio, alters thesolidus temperature (Green 2015). Peridotite melting has apositive Clapeyron slope dTsol/dP of ∼12 K kbar−1
(120 KGPa−1) in the 1 bar–50 kbar range (Kushiro et al.1968; Green 2015), and the increased pressure caused by theweight of a massive steam atmosphere will increase the meltingpoint. However, this is counteracted by the freezing pointdepression due to the solubility of H2O (more soluble) and CO2
(less soluble) in silicate magmas. The negative ΔT from thefreezing point depression is larger than the positive ΔT fromthe increased pressure, and the net effect is that the meltingpoint of H2O-saturated peridotite is less than that of dryperidotite, by about 400°C at 26 kbar pressure (≈80 km depth;see Figure 1 in Kushiro et al. 1968). Dissolution of H2O andCO2 also lowers the freezing points of other molten rocks andminerals and is a general effect that is expected to occur on anyrocky exoplanet made of silicates that also contains CO2 andwater.
2.3. Steam Atmosphere on the Early Earth
The properties (e.g., mass, composition, lifetime) of a steamatmosphere on a planet depend on several factors, such as thetotal amount of water and other volatiles, the fractional amountof the volatiles that are outgassed into the atmosphere,planetary surface temperature, planetary distance from theprimary star, and primary star type (e.g., see Hamano et al.2013, 2015). For illustration we briefly discuss possibleproperties of a steam atmosphere on early Earth.
The mass fraction (in ppm = parts per million) of hydrogenin the BSE is 120 ppm (∼1070 ppm as H2O) (Palme & O’Neill2014). This mass fraction of H2O is equivalent to∼4.3 × 10²¹ kg of water versus ∼1.7 × 10²¹ kg of H2O inthe hydrosphere (oceans + glaciers + freshwater). Thus, onlyabout 40% of Earthʼs total water is outgassed on its surface,and additional water ∼1.6 times that in the hydrosphereremains inside the BSE. Other estimates of water in the BSEare smaller, but they still give about one hydrosphere worth ofwater inside Earth (Saal et al. 2002; Hirschmann &Dasgupta 2009).Palme and O’Neill (2014) list 100 ppm carbon (∼370 ppm as
CO2) in the BSE. Other estimates for the carbon content of theBSE range from 46 to 250 ppm (summarized in Table 6.9 ofLodders & Fegley 1998). Using the Palme & O’Neill (2014)values, mass balance shows that outgassing of all hydrogen andcarbon in the BSE as H2O (4.3 × 10²¹ kg) and CO2
(1.5 × 10²¹ kg) would give a steam atmosphere with a surfacepressure of ∼1100 bar composed of ∼75% steam and 25% CO2
(P = mg, using g = 980.665 cgs). LeBrun et al. (2013)consider a similar range of 100–1000 bars for a steam—CO2
atmosphere on the early Earth.This calculation is illustrative and assumes that the silicate
portion of the early Earth had the same composition and massas the BSE and current surface gravity. Earthʼs volatiledepletion with respect to chondritic material and solarabundances suggests that all estimates of its current volatilecontent are plausibly smaller than its initial endowment (e.g.,see pp. 73–77 in Fegley & Schaefer 2014). Although the exactproperties of steam atmospheres on the early Earth and hotrocky exoplanets depend on several variables, we explicitlyassume that steam atmospheres form and we explore theireffect on chemistry of rock-forming elements with an emphasison the major elements Si, Mg, and Fe.
3. PAST WORK ON THE SOLUBILITY OF ROCKYELEMENTS IN STEAM
Extensive experimental work going back to the 1930s showsthat most elements found in rocks are soluble in steam (e.g., seeAlexander et al. 1963; Maeda et al. 1978; Hashimoto 1992 forMgO; Antignano & Manning 2008; Nguyen et al. 2014 forTiO2; Belton & Richardson 1962; Belton & Jordan 1967 forCo, Fe, Ni; Matsumoto & Sata 1981; Hashimoto 1992 for CaO;Hashimoto 1992; Opila & Myers 2004 for Al2O3; Meschteret al. 2013 for a review of all elements; Morey 1957 for Al2O3,BaSO4, BeO, CaCO3, CaSO4, Fe2O3, GeO2, NaCl, Na2SO4,Nb2O5, NiO, PbSO4, SiO2, SnO2, Ta2O5, and ZnS; Preston &Turner 1934; Van Nieuwenberg & Blumendal 1930, 1931a,1931b for SiO2; Verhoogen 1949, p. 91; Shen & Keppler 1997;Bureau & Keppler 1999 for several minerals). In order ofdecreasing solar elemental abundances (Lodders 2003), this listof rock-forming elements includes Mg, Si, Fe, Al, Ca, Na, Ni,Cr, Mn, P, K, Ti, Co, Zn, V, Li, Ga, Sr, B, Zr, Rb, Te, Y, Ba,Mo, La (and other rare Earth elements), Cs, Be, W, and U.The geological literature contains many experimental studies
of the solubility of silica in water, steam, and mixtures of thetwo and empirical models for total silica solubility because ofits importance for processes in Earthʼs crust and mantle (e.g.,Kennedy 1950; Morey & Hesselgesser 1951a, 1951b; Morey1957; Kitahara 1960; Kennedy et al. 1962; Morey et al. 1962;Weill & Fyfe 1964; Anderson & Burnham 1965; Walther &Helgeson 1977; Fournier & Potter 1982; Manning 1994;
3
The Astrophysical Journal, 824:103 (29pp), 2016 June 20 Fegley et al.
Rimstidt 1997; Gunnarsson & Arnórsson 2000; Newton &Manning 2002, 2003, 2008; Hunt & Manning 2012; Cruz &Manning 2015).
Although significant dissolution of silica in steam wasrecognized early, the molecular form(s) of the Si-bearing gas(es) in steam remained unknown until Brady (1953) analyzedexperimental data of Kennedy (1950), Morey & Hesselgesser(1951a, 1951b), and Straub & Grabowski (1945). Bradyinferred that orthosilicic acid vapor Si(OH)4 is the major Si-bearing molecule in steam over a wide P–T range. Subsequentwork supports his conclusions (e.g., see Mosebach 1957;Wasserburg 1958; Kitahara 1960; Krikorian 1970; Walther &Helgeson 1977; Hashimoto 1992; Zotov & Keppler 2002;Jacobson et al. 2005; Plyasunov 2011b, 2012 and referencestherein). Silica dissolves in steam primarily via the reaction
( ) ( ) ( ) ( ) ( )+ =SiO silica 2H O steam Si OH gas . 12 2 4
In particular, we refer the reader to Plyasunov (2011b, 2012).He carefully analyzed ambient pressure transpiration experi-ments, solubility data for amorphous silica and quartz in water—steam mixtures along the H2O vapor pressure curve up to thecritical point of water (647.096 K), and in steam above thecritical point. He computed ideal gas thermodynamic propertiesand fugacity coefficients for Si(OH)4 gas, partition coefficientsfor Si(OH)4 between water and steam, and showed that reaction(1) accounts for 100% of dissolved silica in steam at densities�322 kg m−3, the density of H2O at its critical point (e.g., seeTable 3 and Figures 7, 9, and 14 in Plyasunov 2012).
4. COMPUTATIONAL METHODS AND DATA SOURCES
We performed three different sets of calculations: (1) theestimated partial pressures of Si(OH)4 and other Si–O–H gasesin steam as a function of P and T from 1573 to 2000 K andfrom 4 × 10⁻⁵ to 1100 bars, (2) the solubility of pure oxides(SiO2, MgO, “FeO,” CaO, Al2O3, NiO) in steam, and (3) thechemistry of a steam atmosphere in equilibrium with a magmaocean. The first set of calculations confirms that Si(OH)4 is themajor Si-bearing gas in steam at high temperatures up to 1100bars of pressure, in agreement with the prior experimental andtheoretical work cited above. It also shows agreement betweencalculations performed with the IVTAN code at WashingtonUniversity and with the FactSage code at NASA Glenn. Thesecond set shows the maximum solubility of an oxide in steamand the maximum pressure of the respective hydroxide gas as afunction of temperature and steam pressure. The third set ofcalculations gives the abundances of metal hydroxide gases inthe steam atmosphere of an exoplanet. Gas abundances areexpressed as mole fractions (X) defined as moles (N) of a gasdivided by total moles of all gases in the atmosphere
( )=å =
=XN
N. 2i
i
ii N
i1
We used the IVTAN code, which is a Gibbs-energyminimization code of the type described by Van Zeggern &Storey (1970), to perform ideal gas and real gas chemicalequilibrium calculations. Thermodynamic data are from theNIST-JANAF Tables (Chase 1998), the IVTAN database(Gurvich et al. 1983, 1989), Robie & Hemingway (1995), andother sources cited in the text below. Several hundredcompounds of the elements discussed in this paper wereincluded in the chemical equilibrium calculations.
Our first set of calculations (discussed in Section 5.1) usesexperimental data for Si(OH)4 gas from Plyasunov (2011b,2012) and estimated thermodynamic data for other Si–O–Hgases from Krikorian (1970) and Allendorf et al. (1995).Krikorian (1970) estimated molecular geometry, bond lengths,and vibrational frequencies for Si–O–H gases by analogy withrelated compounds and used statistical mechanics (Pitzer &Brewer 1961, chapter 27) to compute free energy functions[(G T
o –Ho0)/T]. He computed standard enthalpy of reaction
values at 0 K from his analysis of data for SiO2 solubility insteam. The combination of the two functions gives the standardGibbs energy for formation of an ideal gas at 1 bar pressurefrom its constituent elements in their reference states as afunction of temperature via the relationship
( ) ( )
=
-+
⎡⎣⎢
⎤⎦⎥
G
T
G
T
H
T
H. 3T
oTo o o
0 0
For example, the standard Gibbs energy for formation ofSi2O(OH)6 gas is the Gibbs energy change for the reaction
( ) ( ) ( ) ( ) ( )( )
+ + =2Si crystal 7 2O gas 3H gas Si O OH gas .4
2 2 2 6
The change in the Gibbs energy functions for this reaction is
( )
( ) ( )
( ) ( ) ( )
( ) ( )
( ) ( )
-
=-
--
--
--
⎡⎣⎢
⎤⎦⎥
⎡⎣⎢
⎤⎦⎥
⎡⎣⎢
⎤⎦⎥
⎡⎣⎢
⎤⎦⎥
⎡⎣⎢
⎤⎦⎥
G
T
G
T
G
T
G
T
G
T
H
H2
H
7
2
H3
H. 5
To o
To o
To o
c
To o
g
To o
g
0
0
Si O OH
0
Si
0
O
0
H
2 6
2 2
In contrast, Allendorf et al. (1995) used quantum chemistrycomposite calculations to compute molecular geometry andvibrational frequencies and then used statistical mechanics tocompute Gibbs energy functions for Si–O–H gases. Allendorfet al. (1995) computed standard enthalpy of formation valuesfrom their quantum chemistry calculations. They then com-puted the temperature-dependent ΔGo
T value for a gas usingthe same equations shown above.The interactions of Si(OH)4 and the other metal hydroxide
gases with H2O are strongly non-ideal at some P, T conditions,and we used fugacity coefficients (f) for H2O, Si(OH)4,Mg(OH)2, Fe(OH)2, Ca(OH)2, Ni(OH)2, and Al(OH)3 in ourreal gas calculations. The fugacity coefficients for H2O werecalculated from the equation of state (EOS) for water using theLonerHGK code (Bakker 2009) available from his Web site(fluids.unileoben.ac.at). Figures 1 and 2 illustrate the extent ofnon-ideality for H2O and Si(OH)4 at pressures �2000 bar,where our calculations were performed.Plyasunov (2011a, 2012) used the truncated virial EOS to
derive fugacity coefficients for B(OH)3 and Si(OH)4 in steam.His modeling shows
( )*
= - =¥ B
Bk
ln
ln
21 . 62
1
12
11
The k is an empirical constant, which equals 6.8 ± 0.4 (2σ) forSi(OH)4 and 5.2 ± 0.30 (2σ) for B(OH)3; the fugacitycoefficient and second virial coefficient for pure steam are *f1and B11, respectively; the fugacity coefficient for the secondcomponent at infinite dilution in steam is f¥
2 ; and the second
4
The Astrophysical Journal, 824:103 (29pp), 2016 June 20 Fegley et al.
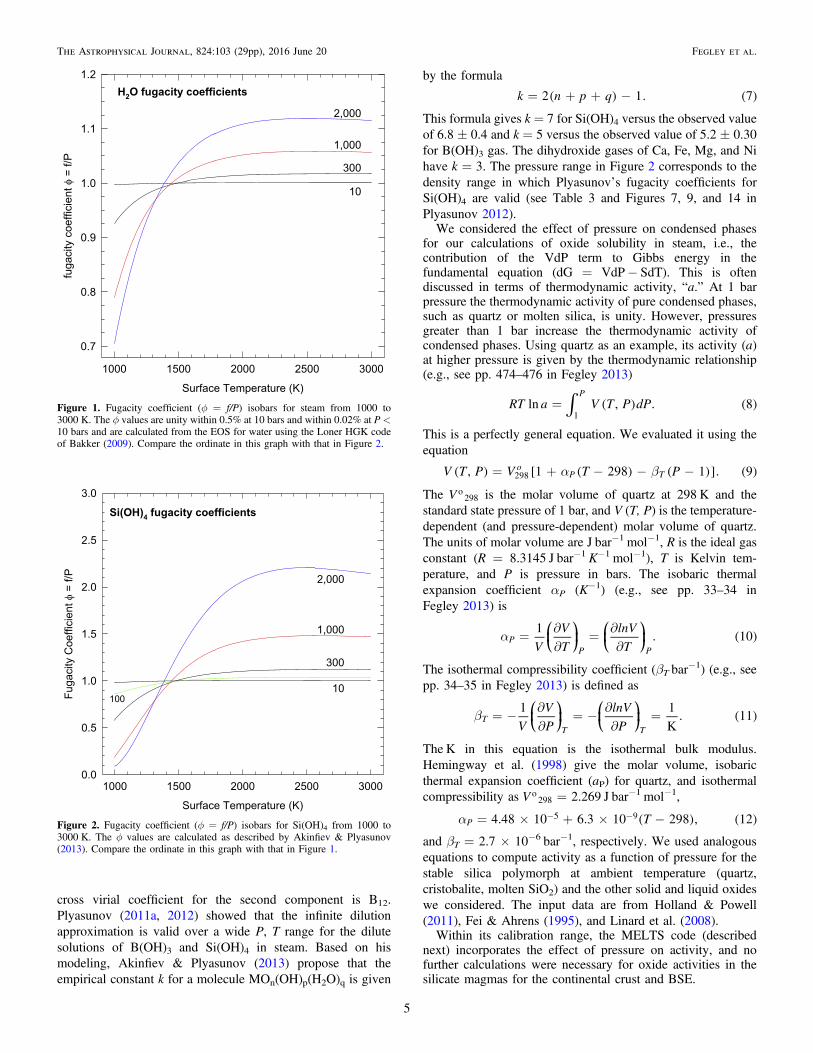
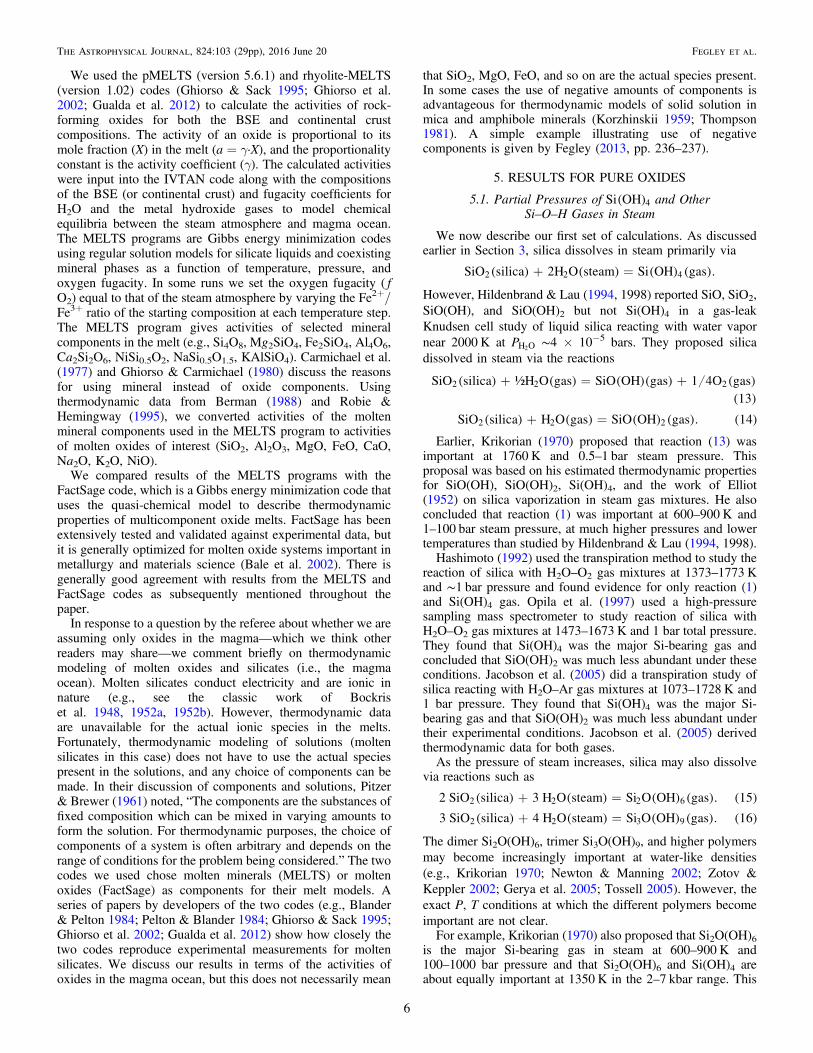
cross virial coefficient for the second component is B12.Plyasunov (2011a, 2012) showed that the infinite dilutionapproximation is valid over a wide P, T range for the dilutesolutions of B(OH)3 and Si(OH)4 in steam. Based on hismodeling, Akinfiev & Plyasunov (2013) propose that theempirical constant k for a molecule MOn(OH)p(H2O)q is given
by the formula
( ) ( )= + + -k n p q2 1. 7
This formula gives k = 7 for Si(OH)4 versus the observed valueof 6.8 ± 0.4 and k = 5 versus the observed value of 5.2 ± 0.30for B(OH)3 gas. The dihydroxide gases of Ca, Fe, Mg, and Nihave k = 3. The pressure range in Figure 2 corresponds to thedensity range in which Plyasunovʼs fugacity coefficients forSi(OH)4 are valid (see Table 3 and Figures 7, 9, and 14 inPlyasunov 2012).We considered the effect of pressure on condensed phases
for our calculations of oxide solubility in steam, i.e., thecontribution of the VdP term to Gibbs energy in thefundamental equation (dG = VdP− SdT). This is oftendiscussed in terms of thermodynamic activity, “a.” At 1 barpressure the thermodynamic activity of pure condensed phases,such as quartz or molten silica, is unity. However, pressuresgreater than 1 bar increase the thermodynamic activity ofcondensed phases. Using quartz as an example, its activity (a)at higher pressure is given by the thermodynamic relationship(e.g., see pp. 474–476 in Fegley 2013)
( ) ( )ò=RT a V T P dPln , . 8P
1
This is a perfectly general equation. We evaluated it using theequation
( ) [ ( ) ( )] ( )a b= + - - -V T P V T P, 1 298 1 . 9oP T298
The V o298 is the molar volume of quartz at 298 K and the
standard state pressure of 1 bar, and V (T, P) is the temperature-dependent (and pressure-dependent) molar volume of quartz.The units of molar volume are J bar−1 mol−1, R is the ideal gasconstant (R = 8.3145 J bar−1K−1 mol−1), T is Kelvin tem-perature, and P is pressure in bars. The isobaric thermalexpansion coefficient αP (K−1) (e.g., see pp. 33–34 inFegley 2013) is
( )a =¶¶
=¶¶
⎜ ⎟ ⎜ ⎟⎛⎝
⎞⎠
⎛⎝
⎞⎠V
V
T
lnV
T
1. 10P
P P
The isothermal compressibility coefficient (βT bar−1) (e.g., see
pp. 34–35 in Fegley 2013) is defined as
( )b = -¶¶
= -¶¶
=⎜ ⎟ ⎜ ⎟⎛⎝
⎞⎠
⎛⎝
⎞⎠V
V
P
lnV
P
1 1
K. 11T
T T
The K in this equation is the isothermal bulk modulus.Hemingway et al. (1998) give the molar volume, isobaricthermal expansion coefficient (aP) for quartz, and isothermalcompressibility as V o
298 = 2.269 J bar−1 mol−1,
( ) ( )a = ´ + ´ -- - T4.48 10 6.3 10 298 , 12P5 9
and βT = 2.7 × 10⁻⁶ bar−1, respectively. We used analogousequations to compute activity as a function of pressure for thestable silica polymorph at ambient temperature (quartz,cristobalite, molten SiO2) and the other solid and liquid oxideswe considered. The input data are from Holland & Powell(2011), Fei & Ahrens (1995), and Linard et al. (2008).Within its calibration range, the MELTS code (described
next) incorporates the effect of pressure on activity, and nofurther calculations were necessary for oxide activities in thesilicate magmas for the continental crust and BSE.
Figure 1. Fugacity coefficient (f = f/P) isobars for steam from 1000 to3000 K. The f values are unity within 0.5% at 10 bars and within 0.02% at P <10 bars and are calculated from the EOS for water using the Loner HGK codeof Bakker (2009). Compare the ordinate in this graph with that in Figure 2.
Figure 2. Fugacity coefficient (f = f/P) isobars for Si(OH)4 from 1000 to3000 K. The f values are calculated as described by Akinfiev & Plyasunov(2013). Compare the ordinate in this graph with that in Figure 1.
5
The Astrophysical Journal, 824:103 (29pp), 2016 June 20 Fegley et al.
We used the pMELTS (version 5.6.1) and rhyolite-MELTS(version 1.02) codes (Ghiorso & Sack 1995; Ghiorso et al.2002; Gualda et al. 2012) to calculate the activities of rock-forming oxides for both the BSE and continental crustcompositions. The activity of an oxide is proportional to itsmole fraction (X) in the melt (a = γ·X), and the proportionalityconstant is the activity coefficient (γ). The calculated activitieswere input into the IVTAN code along with the compositionsof the BSE (or continental crust) and fugacity coefficients forH2O and the metal hydroxide gases to model chemicalequilibria between the steam atmosphere and magma ocean.The MELTS programs are Gibbs energy minimization codesusing regular solution models for silicate liquids and coexistingmineral phases as a function of temperature, pressure, andoxygen fugacity. In some runs we set the oxygen fugacity ( fO2) equal to that of the steam atmosphere by varying the Fe2+/Fe3+ ratio of the starting composition at each temperature step.The MELTS program gives activities of selected mineralcomponents in the melt (e.g., Si4O8, Mg2SiO4, Fe2SiO4, Al4O6,Ca2Si2O6, NiSi0.5O2, NaSi0.5O1.5, KAlSiO4). Carmichael et al.(1977) and Ghiorso & Carmichael (1980) discuss the reasonsfor using mineral instead of oxide components. Usingthermodynamic data from Berman (1988) and Robie &Hemingway (1995), we converted activities of the moltenmineral components used in the MELTS program to activitiesof molten oxides of interest (SiO2, Al2O3, MgO, FeO, CaO,Na2O, K2O, NiO).
We compared results of the MELTS programs with theFactSage code, which is a Gibbs energy minimization code thatuses the quasi-chemical model to describe thermodynamicproperties of multicomponent oxide melts. FactSage has beenextensively tested and validated against experimental data, butit is generally optimized for molten oxide systems important inmetallurgy and materials science (Bale et al. 2002). There isgenerally good agreement with results from the MELTS andFactSage codes as subsequently mentioned throughout thepaper.
In response to a question by the referee about whether we areassuming only oxides in the magma—which we think otherreaders may share—we comment briefly on thermodynamicmodeling of molten oxides and silicates (i.e., the magmaocean). Molten silicates conduct electricity and are ionic innature (e.g., see the classic work of Bockriset al. 1948, 1952a, 1952b). However, thermodynamic dataare unavailable for the actual ionic species in the melts.Fortunately, thermodynamic modeling of solutions (moltensilicates in this case) does not have to use the actual speciespresent in the solutions, and any choice of components can bemade. In their discussion of components and solutions, Pitzer& Brewer (1961) noted, “The components are the substances offixed composition which can be mixed in varying amounts toform the solution. For thermodynamic purposes, the choice ofcomponents of a system is often arbitrary and depends on therange of conditions for the problem being considered.” The twocodes we used chose molten minerals (MELTS) or moltenoxides (FactSage) as components for their melt models. Aseries of papers by developers of the two codes (e.g., Blander& Pelton 1984; Pelton & Blander 1984; Ghiorso & Sack 1995;Ghiorso et al. 2002; Gualda et al. 2012) show how closely thetwo codes reproduce experimental measurements for moltensilicates. We discuss our results in terms of the activities ofoxides in the magma ocean, but this does not necessarily mean
that SiO2, MgO, FeO, and so on are the actual species present.In some cases the use of negative amounts of components isadvantageous for thermodynamic models of solid solution inmica and amphibole minerals (Korzhinskii 1959; Thompson1981). A simple example illustrating use of negativecomponents is given by Fegley (2013, pp. 236–237).
5. RESULTS FOR PURE OXIDES
5.1. Partial Pressures of ( )Si OH 4 and OtherSi–O–H Gases in Steam
We now describe our first set of calculations. As discussedearlier in Section 3, silica dissolves in steam primarily via
( ) ( ) ( ) ( )+ =SiO silica 2H O steam Si OH gas .2 2 4
However, Hildenbrand & Lau (1994, 1998) reported SiO, SiO2,SiO(OH), and SiO(OH)2 but not Si(OH)4 in a gas-leakKnudsen cell study of liquid silica reacting with water vapornear 2000 K at PH O2 ∼4 × 10⁻⁵ bars. They proposed silicadissolved in steam via the reactions
( ) ( ) ( )( ) ( )( )
+ = +SiO silica ½H O gas SiO OH gas 1 4O gas13
2 2 2
( ) ( ) ( ) ( ) ( )+ =SiO silica H O gas SiO OH gas . 142 2 2
Earlier, Krikorian (1970) proposed that reaction (13) wasimportant at 1760 K and 0.5–1 bar steam pressure. Thisproposal was based on his estimated thermodynamic propertiesfor SiO(OH), SiO(OH)2, Si(OH)4, and the work of Elliot(1952) on silica vaporization in steam gas mixtures. He alsoconcluded that reaction (1) was important at 600–900 K and1–100 bar steam pressure, at much higher pressures and lowertemperatures than studied by Hildenbrand & Lau (1994, 1998).Hashimoto (1992) used the transpiration method to study the
reaction of silica with H2O–O2 gas mixtures at 1373–1773 Kand ∼1 bar pressure and found evidence for only reaction (1)and Si(OH)4 gas. Opila et al. (1997) used a high-pressuresampling mass spectrometer to study reaction of silica withH2O–O2 gas mixtures at 1473–1673 K and 1 bar total pressure.They found that Si(OH)4 was the major Si-bearing gas andconcluded that SiO(OH)2 was much less abundant under theseconditions. Jacobson et al. (2005) did a transpiration study ofsilica reacting with H2O–Ar gas mixtures at 1073–1728 K and1 bar pressure. They found that Si(OH)4 was the major Si-bearing gas and that SiO(OH)2 was much less abundant undertheir experimental conditions. Jacobson et al. (2005) derivedthermodynamic data for both gases.As the pressure of steam increases, silica may also dissolve
via reactions such as
( ) ( ) ( ) ( ) ( )+ =2 SiO silica 3 H O steam Si O OH gas . 152 2 2 6
( ) ( ) ( ) ( ) ( )+ =3 SiO silica 4 H O steam Si O OH gas . 162 2 3 9
The dimer Si2O(OH)6, trimer Si3O(OH)9, and higher polymersmay become increasingly important at water-like densities(e.g., Krikorian 1970; Newton & Manning 2002; Zotov &Keppler 2002; Gerya et al. 2005; Tossell 2005). However, theexact P, T conditions at which the different polymers becomeimportant are not clear.For example, Krikorian (1970) also proposed that Si2O(OH)6
is the major Si-bearing gas in steam at 600–900 K and100–1000 bar pressure and that Si2O(OH)6 and Si(OH)4 areabout equally important at 1350 K in the 2–7 kbar range. This
6
The Astrophysical Journal, 824:103 (29pp), 2016 June 20 Fegley et al.
proposal was based on his estimated thermodynamic data forSiO(OH), SiO(OH)2, Si(OH)4, and Si2O(OH)6.
However, Zotov & Keppler (2002) concluded that Si2O(OH)6only became important at higher pressures than proposed byKrikorian (1970). They measured Raman spectra of dissolvedsilica species in saturated aqueous solutions of quartz andobserved Si2O(OH)6 at pressures above 5–6 kbar. Theircalculated concentrations of Si(OH)4 and Si2O(OH)6 showsignificant amounts of Si2O(OH)6 at the high pressures theystudied. For example, at 973 K and 5.6 ± 0.9 kbar pressure, ∼37mol% of total dissolved silica is present as Si2O(OH)6,increasing to ∼55 mol% at 10.6 ± 2.3 kbar. These highconcentrations of Si2O(OH)6 are in high-pressure steam withwater-like densities of 780–940 kg m−3. Water-rich fluids withdensities in this range may be important at the boundary betweenthe atmospheres and rocky interiors of planets such as Uranusand Neptune in our solar system (e.g., see the models in Fegley& Prinn 1986) and H2O-rich exoplanets. Water-rich fluids suchas H2O–H2 and/or H2O–CO2 may be relevant to Uranus- andNeptune-like exoplanets in other planetary systems. We note thatthe solubility of high-pressure polymorphs (e.g., coesite andstishovite) in water-rich fluids may be applicable to theatmosphere—“surface” interface inside water-rich exoplanetsanalogous to Neptune, but we do not consider this topicfurther here.
We used the experimental values for thermodynamicproperties of Si(OH)4 gas (Plyasunov 2011b, 2012), the partlyexperimental and partly estimated properties for SiO(OH)2 gas(Allendorf et al. 1995; Jacobson et al. 2005), and the estimatedthermodynamic properties for SiO(OH) gas (Allendorfet al. 1995) and Si2O(OH)6 gas (Krikorian 1970) to calculatethe partial pressures of all four species for four sets of P, Tconditions: (A) 2000 K and 4 × 10⁻⁵ bar, (B) 1673 K and1 bar, (C) 1500 K and 270 bar, and (D) 2000 K and 1100 bar.These conditions correspond to the experiments of Hildenbrand& Lau (1994, 1998) and Opila et al. (1997), a steamatmosphere produced by vaporization of all water in Earthʼsoceans (e.g., Zahnle et al. 1988), and a steam atmosphereproduced by complete outgassing of all H2O and CO2 inthe BSE.
The results of our chemical equilibrium calculations aresummarized in Table 1. They show that Hildenbrand & Lau(1994, 1998) are correct that Si(OH)4 is unimportant andSiO(OH) and SiO(OH)2 are more abundant at 2000 K and4 × 10−5 bars. However, we compute that SiO (92%) and SiO2
(8%) are the major gases under their experimental conditions.Second, we find that Si(OH)4 is the major species at the otherthree sets of P, T conditions. For example, at 2000 K thecrossover point where the abundances of SiO and Si(OH)4become equal is 0.23 bars, with Si(OH)4 being the major gas athigher pressures. It remains the major gas until much higherpressures. Table 1 shows that the Si2O(OH)6/Si(OH)4 ratio is<9 × 10⁻⁴ in the 1100 bar steam atmosphere. Othercalculations in Section 5.2.1 show that Si(OH)4 is the majorspecies in steam at 2 kbar at temperatures �1300 K, where theH2O density is �322 kg m−3.
5.2. Vapor Pressure and Solubility in Steam of SiO2,MgO, and Fe Oxides
We now describe the results of our second set ofcalculations. Figures 3–11 compare the total vapor pressuresof the pure oxides (black curves) with solubility of the oxide insteam (red curves). The error bars on the red curves correspondto the uncertainties in the standard Gibbs energies of Si(OH)4,Mg(OH)2, Fe(OH)2, Ca(OH)2, Al(OH)3, and Ni(OH)2 and are
Table 1Estimated Partial Pressures of Si-bearing Gases
Pi (bar) A B C D
SiO 8.6 × 10⁻⁶ 1.6 × 10⁻¹³ 4.4 × 10⁻¹⁴ 2.9 × 10⁻⁸
SiO2 6.9 × 10⁻⁷ 6.4 × 10⁻¹¹ 7.6 × 10⁻¹² 6.9 × 10⁻⁷
SiO(OH) 3.4 × 10⁻¹¹ 6.7 × 10⁻¹⁵ 1.9 × 10⁻¹⁴ 1.3 × 10⁻⁸
SiO(OH)2 3.3 × 10⁻¹¹ 5.9 × 10⁻⁹ 4.9 × 10⁻⁷ 1.5 × 10⁻³
Si(OH)4 3.9 × 10⁻¹⁵ 4.1 × 10⁻⁶ 3.0 × 10⁻¹ 8.25Si2O(OH)6 7.5 × 10⁻²⁶ 2.0 × 10⁻¹¹ 5.4 × 10⁻⁴ 7.2 × 10⁻³
Σall Si gases 9.3 × 10⁻⁶ 4.1 × 10⁻⁶ 3.0 × 10⁻¹ 8.25
Notes. A: T = 2000 K, total P (PT) = 4 × 10⁻⁵ bars, liquid silica + steam.B: T = 1573 K, PT = 1 bar, cristobalite + 90% steam—10% O2 gas mixture.C: T = 1500 K, PT = 270 bars, cristobalite + steam. D: T = 2000 K,PT = 1100 bars, liquid silica in steam (75%)–CO2 (25%) atmosphere. Boldvalues represent the major gas(es) in each column.
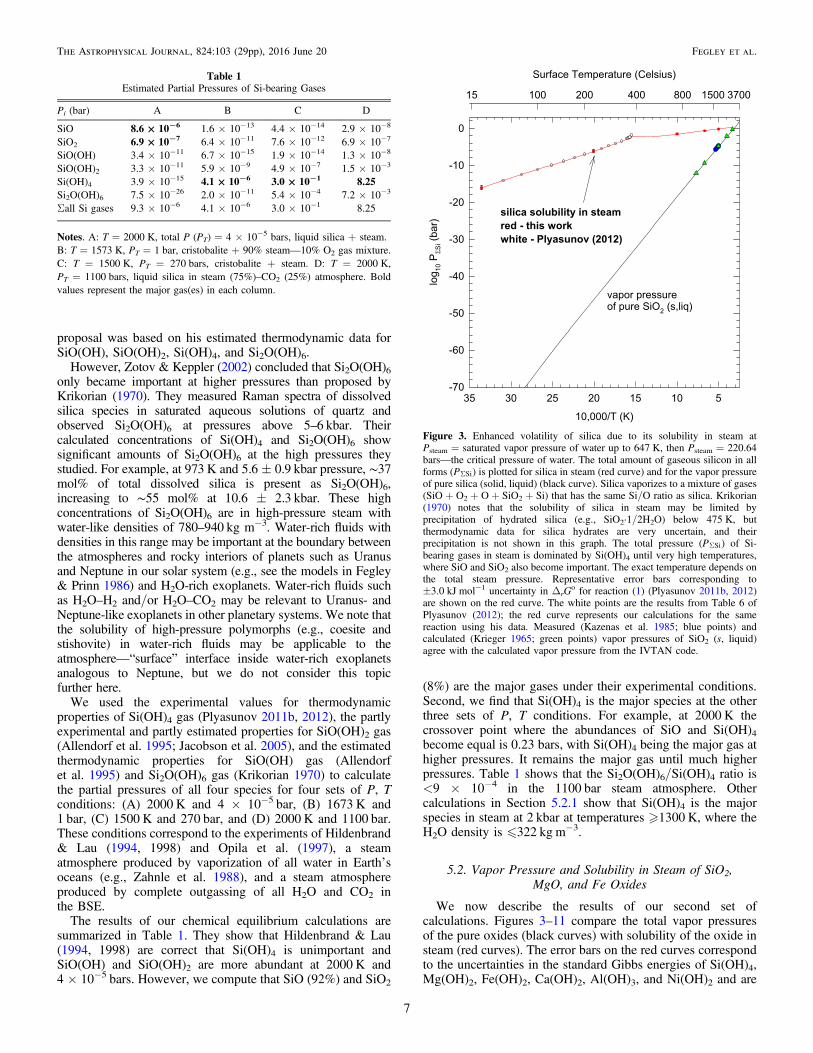
Figure 3. Enhanced volatility of silica due to its solubility in steam atPsteam = saturated vapor pressure of water up to 647 K, then Psteam = 220.64bars—the critical pressure of water. The total amount of gaseous silicon in allforms (PSSi) is plotted for silica in steam (red curve) and for the vapor pressureof pure silica (solid, liquid) (black curve). Silica vaporizes to a mixture of gases(SiO + O2 + O + SiO2 + Si) that has the same Si/O ratio as silica. Krikorian(1970) notes that the solubility of silica in steam may be limited byprecipitation of hydrated silica (e.g., SiO2·1/2H2O) below 475 K, butthermodynamic data for silica hydrates are very uncertain, and theirprecipitation is not shown in this graph. The total pressure (PSSi) of Si-bearing gases in steam is dominated by Si(OH)4 until very high temperatures,where SiO and SiO2 also become important. The exact temperature depends onthe total steam pressure. Representative error bars corresponding to±3.0 kJ mol−1 uncertainty in ΔrG
o for reaction (1) (Plyasunov 2011b, 2012)are shown on the red curve. The white points are the results from Table 6 ofPlyasunov (2012); the red curve represents our calculations for the samereaction using his data. Measured (Kazenas et al. 1985; blue points) andcalculated (Krieger 1965; green points) vapor pressures of SiO2 (s, liquid)agree with the calculated vapor pressure from the IVTAN code.
7
The Astrophysical Journal, 824:103 (29pp), 2016 June 20 Fegley et al.
described in the figure captions. All of these figures cover thesame temperature range of 288.15–3500 K. The lowertemperature of 288.15 K (15 C) is the global average surfacetemperature on Earth. The upper temperature of 3500 K isabove the estimated surface temperatures of all known hotrocky exoplanets and above the 1 bar melting points ofessentially all minerals and rocks (except ThO2, which melts at3640 ± 40 K; Ackermann et al. 1963). As discussed inSection 2.2, at 1 bar dry peridotite starts to melt at1390–1473 K and is completely molten by ∼1970 K.
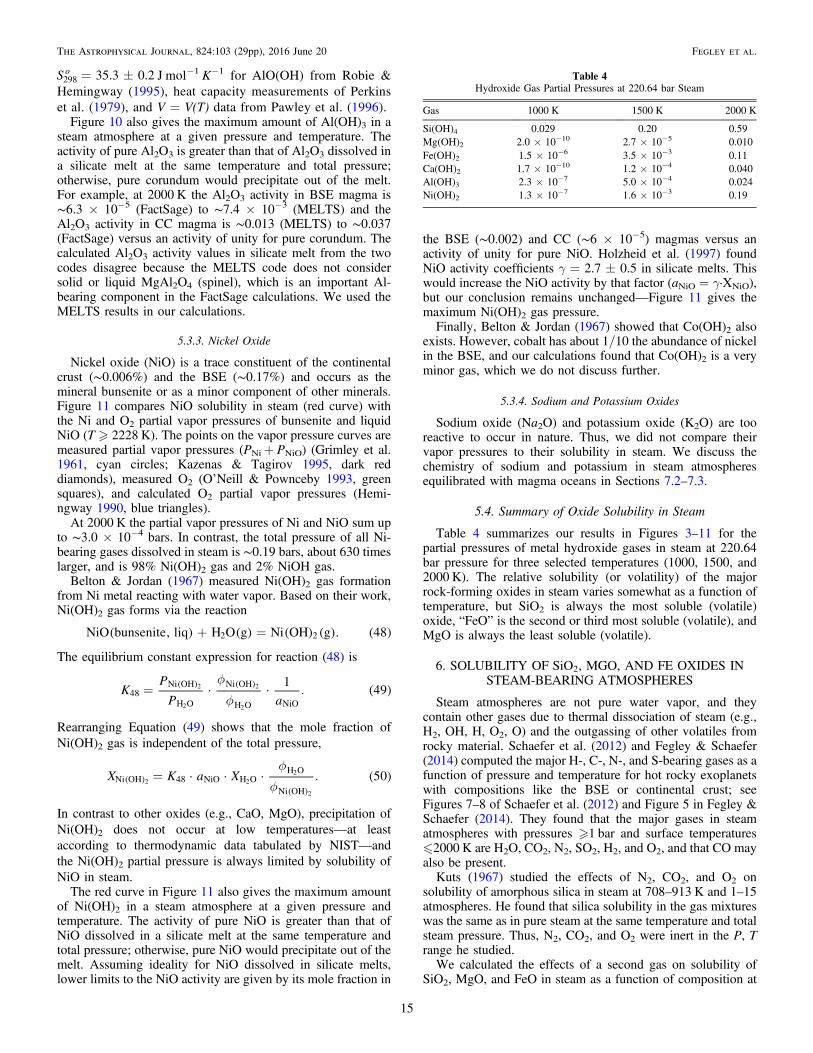
We show oxide solubility in steam along the H2O vaporpressure curve up to the critical point of pure water at647.096 K (Wagner & Pruss 2002) and then at a constant steampressure of 220.64 bars, which is the pressure at the criticalpoint (called the critical isobar in our discussion below). Thesolubility of each oxide in steam is the sum of the partialpressures of all gases of the respective element (e.g., all Si-bearing gases for SiO2, all Mg-bearing gases for MgO, and allFe-bearing gases for Fe oxides). Likewise, the total vaporpressure of each pure oxide is the sum of the partial pressuresof all gases in the saturated vapor in equilibrium with the solidor molten oxide, e.g., Mg+O2+O+MgO+Mg2 for MgO.
The vapor pressure curves were calculated using the IVTANcode and database (Gurvich et al. 1983, 1989). We emphasizethat the vapor pressure curves are calculated from thetemperature-dependent standard Gibbs free energies of thesolid and gases. With one exception discussed later (Fe3O4),the curves are not extrapolations of high-temperature vaporpressure data. We compare the IVTAN code calculations forvapor pressures of the pure oxides to representative values fromother calculations and measurements where data are available.Vapor pressures were measured by Knudsen effusion massspectrometry (KEMS; Drowart et al. 1960; Grimley et al. 1961;Chervonnyi et al. 1977; Kazenas et al. 1983, 1985; Kazenas &
Tagirov 1995; Samoilova & Kazenas 1995) and manometry(Salmon 1961). Oxygen fugacities (partial pressures) weremeasured using solid-state zirconia sensors (Blumenthal &Whitmore 1961; Jacobsson 1985; O’Neill 1988; O’Neill &Pownceby 1993). We refer the reader to the experimental and/or theoretical papers cited for each oxide for details of theexperimental measurements and /or calculations.In our discussion below we use 2000 K—just above the
liquidus temperature of peridotite—as a reference temperaturefor comparing oxide solubility in steam and the vapor pressureof the pure oxide. Our 2000 K reference temperature is wellwithin the range of substellar equilibrium temperatures forseveral hot rocky exoplanets (e.g., ∼1475 K for Kepler-36b,∼1570 K for Kepler-93b, 2425 K for CoRoT-7b, ∼2670 K for55 Cnc e, and ∼3010 K for Kepler-10b; Kite et al. 2016).
5.2.1. Silica
Silica is the most abundant oxide in Earthʼs continental crust(∼69 mol%) and the second most abundant oxide in the BSE(∼40 mol%; see Tables 2 and 3). It also has the highestsolubility in steam of rocky oxides. Figure 3 compares thevapor pressure of solid and liquid (T � 1996 K) SiO2 (the blackcurve) with the solubility of silica in steam (the red curve). The
Figure 4. Silica solubility isobars in steam from 1 to 2000 bars of pressure.Solubility is expressed as mass% silica in steam and as the mole fraction oforthosilicic acid vapor Si(OH)4. The 1000–1200 K points on the 2000 barisobar are above the maximum density of 322 kg m−3 at which the Si(OH)4fugacity coefficients are reliable (see text and Plyasunov 2012). The three greenpoints from Anderson & Burnham (1965) show the “true” solubility of silica atthese points, and they blend smoothly into the 2000 bar isobar at 1300 K,where ρsteam ∼ 322 kg m−3.
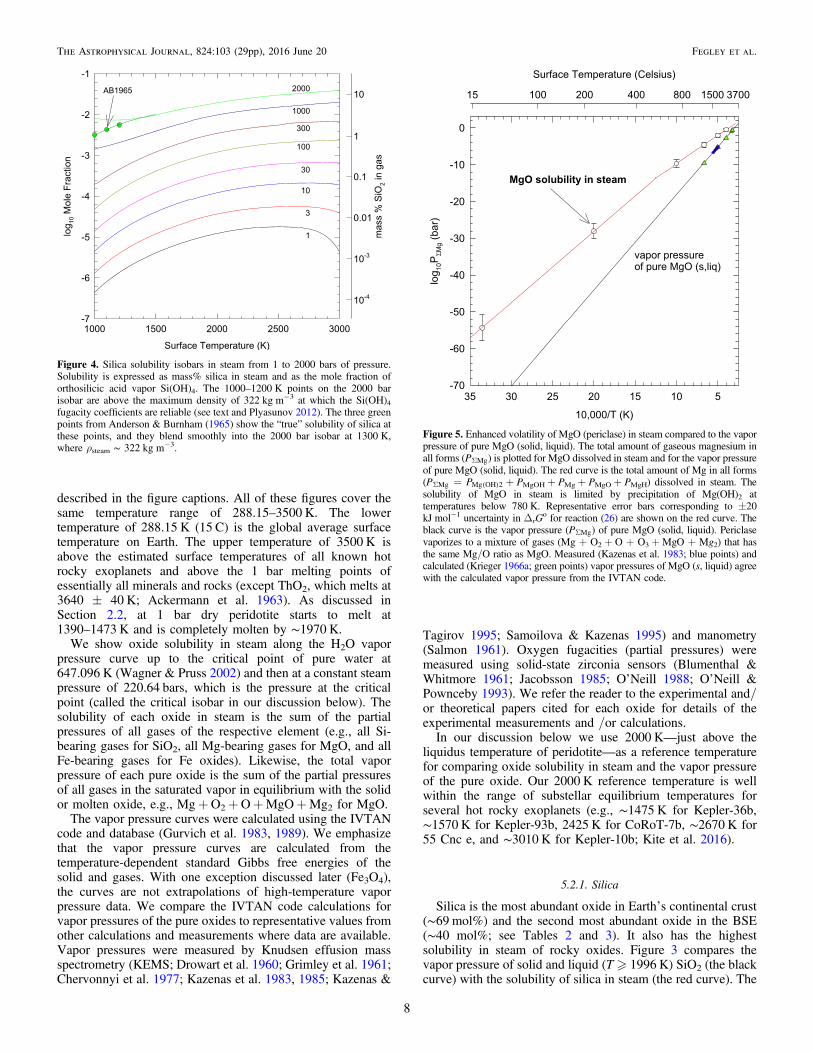
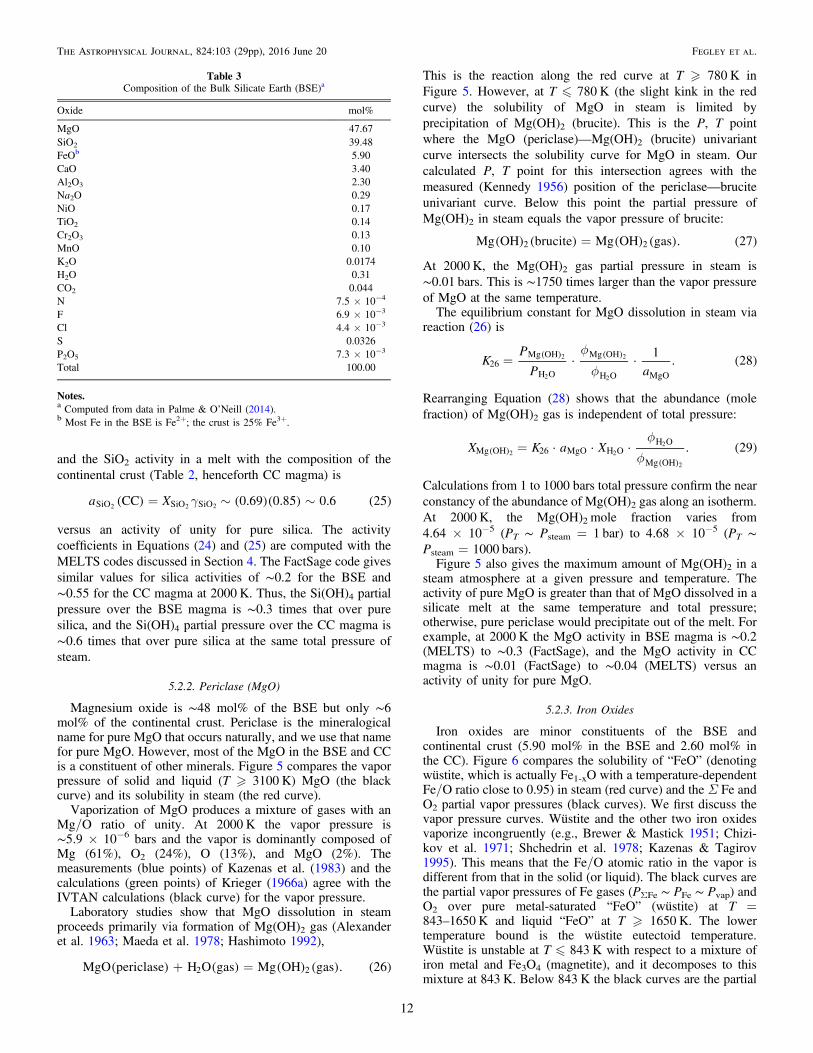
Figure 5. Enhanced volatility of MgO (periclase) in steam compared to the vaporpressure of pure MgO (solid, liquid). The total amount of gaseous magnesium inall forms (PSMg) is plotted for MgO dissolved in steam and for the vapor pressureof pure MgO (solid, liquid). The red curve is the total amount of Mg in all forms(PSMg = ( )PMg OH 2 + PMgOH + PMg + PMgO + PMgH) dissolved in steam. Thesolubility of MgO in steam is limited by precipitation of Mg(OH)2 attemperatures below 780 K. Representative error bars corresponding to ±20kJ mol−1 uncertainty in ΔrG
o for reaction (26) are shown on the red curve. Theblack curve is the vapor pressure (PSMg) of pure MgO (solid, liquid). Periclasevaporizes to a mixture of gases (Mg + O2 + O + O3 +MgO + Mg2) that hasthe same Mg/O ratio as MgO. Measured (Kazenas et al. 1983; blue points) andcalculated (Krieger 1966a; green points) vapor pressures of MgO (s, liquid) agreewith the calculated vapor pressure from the IVTAN code.
8
The Astrophysical Journal, 824:103 (29pp), 2016 June 20 Fegley et al.
silica vapor pressure curve is simpler to explain, and we discussit first.
Silica vaporization produces a mixture of gases with an O/Siratio of 2, as in SiO2. The vapor pressure (Pvap) is the sum ofpartial pressures of all gases in the mixture
( )= + + + + + + +P P P P P P P P P .
17vap SiO O2 O SiO Si O Si Si2 3 2 3
At 2000 K the total vapor pressure over liquid SiO2 is1.54 × 10−5 bars and the vapor is dominantly composed ofSiO (61%), O2 (26%), O (8.5%) and SiO2 (4.5%). Liquid silica“boils” at 3130 K, where the total vapor pressure is 1 bar andthe vapor is dominantly composed of SiO (57%), O2 (24%),SiO2 (10%), and O (9%). All other gases (including ions) areless abundant than these four major gases. Measured (Kazenaset al. 1985, blue points) and calculated (Krieger 1965, greenpoints) vapor pressures of SiO2 (s, liquid) agree with thecalculated vapor pressure (black curve) from the IVTAN code.
In contrast, the amount of silica dissolved in steamcorresponds to a significantly higher pressure (at the sametemperature) than the vapor pressure curve until very hightemperatures (∼3000 K). The total pressure (PSSi) of silicadissolved in steam is dominated by Si(OH)4 until very high
temperatures where either SiO or SiO2 reaches the sameabundance. The exact temperature depends on the total steampressure and is 2000 K (Psteam = 0.23 bars), 2200 K(Psteam = 1 bar), 2500 K (Psteam = 10 bars), and >3000 K(Psteam = 100 bars). At 2000 K, the total pressure of silicadissolved in steam along the critical isobar is ∼0.59 bars, all ofwhich is Si(OH)4 gas. This is ∼38,000 times higher than thevapor pressure of silica at the same temperature.As discussed in Sections 3 and 5.1, dissolution of silica
(SiO2) in steam primarily proceeds via formation of orthosilicicacid vapor Si(OH)4,
( ) ( ) ( ) ( )+ =SiO silica 2H O gas Si OH gas .2 2 4
The equilibrium constant for reaction (1) is
( )( )=Kf
a f. 181
Si OH
SiO H O2
4
2 2
The fugacity ( fi) of each gas is the product of its partialpressure (Pi) and fugacity coefficient (fi). The fugacitycoefficient equals unity for an ideal gas and is either >1 or<1 for a real gas. The thermodynamic activity (ai) of silica isunity at 1 bar pressure for pure silica and is proportional to itsmole fraction in silicate magma. The proportionality constant isthe activity coefficient (γi), which is unity for an ideal solutionand is either >1 or <1 for a non-ideal solution.
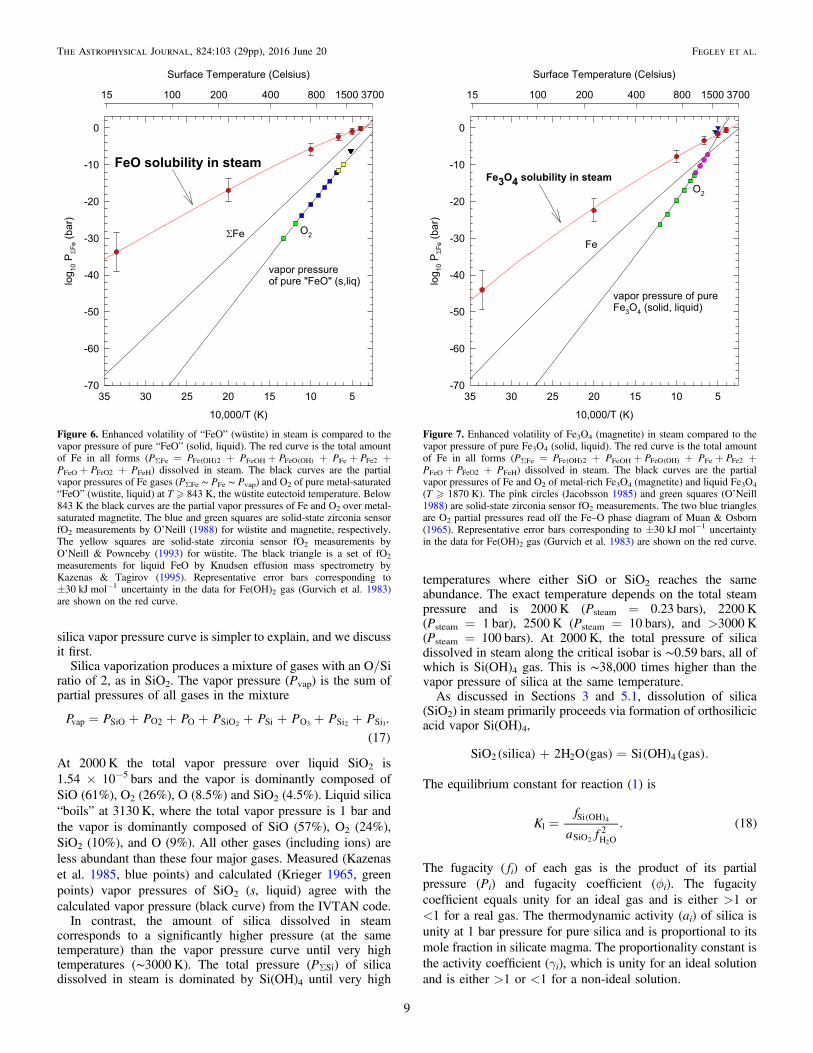
Figure 6. Enhanced volatility of “FeO” (wüstite) in steam is compared to thevapor pressure of pure “FeO” (solid, liquid). The red curve is the total amountof Fe in all forms (PΣFe = ( )PFe OH 2 + PFeOH + ( )PFeO OH + PFe + PFe2 +PFeO + PFeO2 + PFeH) dissolved in steam. The black curves are the partialvapor pressures of Fe gases (PΣFe ∼ PFe ∼ Pvap) and O2 of pure metal-saturated“FeO” (wüstite, liquid) at T � 843 K, the wüstite eutectoid temperature. Below843 K the black curves are the partial vapor pressures of Fe and O2 over metal-saturated magnetite. The blue and green squares are solid-state zirconia sensorfO2 measurements by O’Neill (1988) for wüstite and magnetite, respectively.The yellow squares are solid-state zirconia sensor fO2 measurements byO’Neill & Pownceby (1993) for wüstite. The black triangle is a set of fO2
measurements for liquid FeO by Knudsen effusion mass spectrometry byKazenas & Tagirov (1995). Representative error bars corresponding to±30 kJ mol−1 uncertainty in the data for Fe(OH)2 gas (Gurvich et al. 1983)are shown on the red curve.
Figure 7. Enhanced volatility of Fe3O4 (magnetite) in steam compared to thevapor pressure of pure Fe3O4 (solid, liquid). The red curve is the total amountof Fe in all forms (PΣFe = ( )PFe OH 2 + PFeOH + ( )PFeO OH + PFe + PFe2 +PFeO + PFeO2 + PFeH) dissolved in steam. The black curves are the partialvapor pressures of Fe and O2 of metal-rich Fe3O4 (magnetite) and liquid Fe3O4
(T � 1870 K). The pink circles (Jacobsson 1985) and green squares (O’Neill1988) are solid-state zirconia sensor fO2 measurements. The two blue trianglesare O2 partial pressures read off the Fe–O phase diagram of Muan & Osborn(1965). Representative error bars corresponding to ±30 kJ mol−1 uncertaintyin the data for Fe(OH)2 gas (Gurvich et al. 1983) are shown on the red curve.
9
The Astrophysical Journal, 824:103 (29pp), 2016 June 20 Fegley et al.
We can rewrite the equilibrium constant expression forreaction (1) as
· · ( )( ) ( )f
f=K
P
P a
1. 191
Si OH
H O2
Si OH
H O2
SiO
4
2
4
2 2
The partial pressure of silicic acid vapor is thus
· · · ( )( )( )
f
f=P K a P . 20Si OH 1 SiO H O
2 H O2
Si OH4 2 2
2
4
The equilibrium constant K1 varies with temperature and iscalculated from the standard Gibbs free energy of reaction via
( )= -⎜ ⎟⎛
⎝⎞⎠K
G
RTexp . 21r
o
1
The standard Gibbs free energy of reaction ΔrGo is for reaction
(1) with ideal gases at 1 bar pressure. It was calculated fromthermodynamic data for Si(OH)4 (g) given by Plyasunov(2011b, 2012) and thermodynamic data for H2O (g) and SiO2
(s, liq) from thermodynamic data compilations (Gurvichet al. 1983; Chase 1998).
The equilibrium constant expression for reaction (1) showsthat the amount of Si(OH)4, given by its mole fraction ( )XSi OH 4,
is proportional to the total pressure (PT):
· · · · ( )( )( )
f
f=X P K a X . 22TSi OH 1 SiO H O
2 H O2
Si OH4 2 2
2
4
Thus, under otherwise constant conditions, more silica willdissolve in steam at a higher total pressure and more Si(OH)4will be produced.Figure 4 shows the Si(OH)4 mole fractions and mass% silica
solubility along isobars from 1 to 2000 bars total (steam)pressure. The proportionality deduced from Equation (22)holds very well in the 1–2000 bar range, e.g., at 2000 K, ingoing from 1 to 3 to 10 to 30 to 100 to 300 to 1000 to 2000 barsthe Si(OH)4 mole fraction increases by factors of 3.0, 10.1,31.7, 101, 292, 803, and 1,656 times, respectively. Deviationsfrom the exact linear proportionality are due to small changeswith temperature and pressure of the product
· ( )( )
f
fa . 23SiO
H O2
Si OH2
2
4
For example, at 2000 K and 2000 bars, this product equals0.828 (thus giving 2000 = 1656/0.828 for the increase in theSi(OH)4 mole fraction from 1 to 2000 bar pressure). Theexpected linear proportionality is also affected by thermal
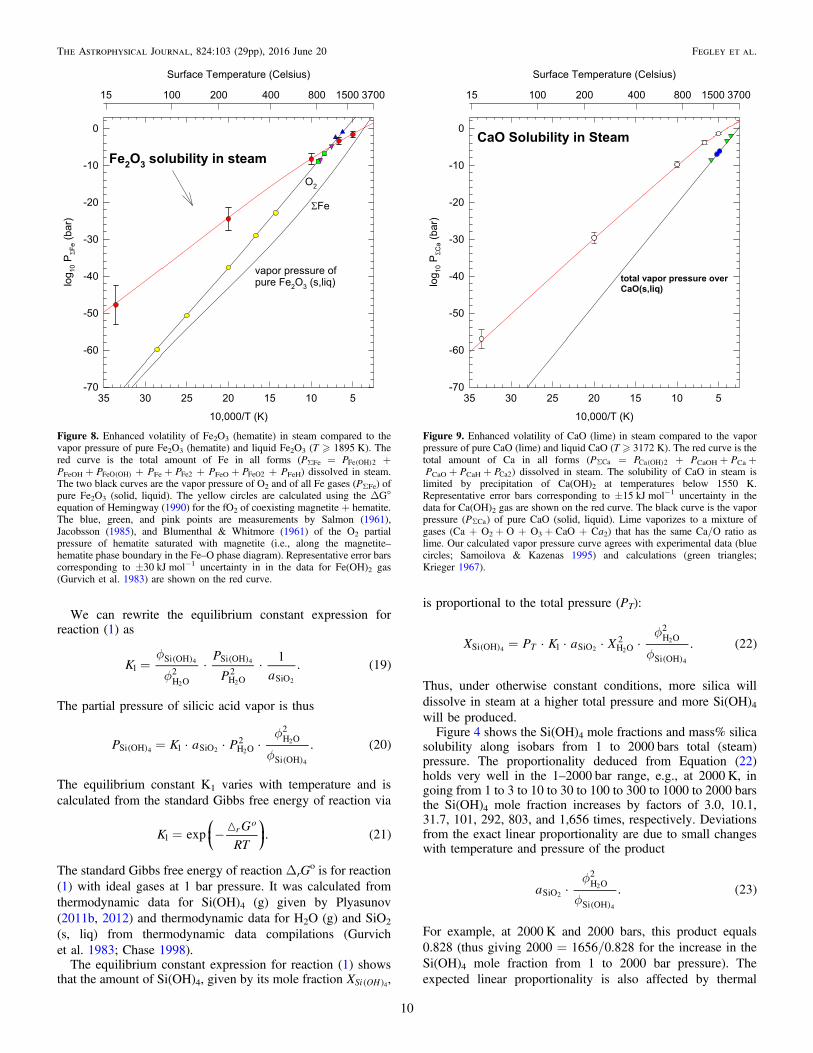
Figure 8. Enhanced volatility of Fe2O3 (hematite) in steam compared to thevapor pressure of pure Fe2O3 (hematite) and liquid Fe2O3 (T � 1895 K). Thered curve is the total amount of Fe in all forms (PΣFe = ( )PFe OH 2 +PFeOH + ( )PFeO OH + PFe + PFe2 + PFeO + PFeO2 + PFeH) dissolved in steam.The two black curves are the vapor pressure of O2 and of all Fe gases (PΣFe) ofpure Fe2O3 (solid, liquid). The yellow circles are calculated using the ΔG°equation of Hemingway (1990) for the fO2 of coexisting magnetite + hematite.The blue, green, and pink points are measurements by Salmon (1961),Jacobsson (1985), and Blumenthal & Whitmore (1961) of the O2 partialpressure of hematite saturated with magnetite (i.e., along the magnetite–hematite phase boundary in the Fe–O phase diagram). Representative error barscorresponding to ±30 kJ mol−1 uncertainty in in the data for Fe(OH)2 gas(Gurvich et al. 1983) are shown on the red curve.
Figure 9. Enhanced volatility of CaO (lime) in steam compared to the vaporpressure of pure CaO (lime) and liquid CaO (T � 3172 K). The red curve is thetotal amount of Ca in all forms (PSCa = ( )PCa OH 2 + PCaOH + PCa +PCaO + PCaH + PCa2) dissolved in steam. The solubility of CaO in steam islimited by precipitation of Ca(OH)2 at temperatures below 1550 K.Representative error bars corresponding to ±15 kJ mol−1 uncertainty in thedata for Ca(OH)2 gas are shown on the red curve. The black curve is the vaporpressure (PSCa) of pure CaO (solid, liquid). Lime vaporizes to a mixture ofgases (Ca + O2 + O + O3 + CaO + Ca2) that has the same Ca/O ratio aslime. Our calculated vapor pressure curve agrees with experimental data (bluecircles; Samoilova & Kazenas 1995) and calculations (green triangles;Krieger 1967).
10
The Astrophysical Journal, 824:103 (29pp), 2016 June 20 Fegley et al.
dissociation of steam to H2 and O2 at high temperature and lowpressure, which slightly decreases the steam mole fraction.
With the exception of temperatures �1300 K on the 2 kbarisobar, all calculations on the graph are at mass density�322 kg m−3, the density at the critical point of water. This isthe density range in which Plyasunovʼs fugacity coefficients forSi(OH)4 are valid (e.g., Table 3 and Figures 7, 9, and 14 inPlyasunov 2012). The three green points show the measuredSiO2 solubility in steam at 2 kbar pressure (Anderson &Burnham 1965) at 1000, 1100, and 1200 K, where the massdensity is larger than 322 kg m−3. These points smoothly blendinto the 2 kbar curve at 1300 K, where the steam mass densitydecreases to the critical value.
Figures 3 and 4 also give the maximum amount of Si(OH)4in a steam atmosphere at a given pressure and temperature.Figure 4 also shows the mass percentage of SiO2 in the gas as afunction of pressure and temperature. The activity of pure silicais greater than that of SiO2 dissolved in a silicate melt at thesame temperature and total pressure; otherwise, pure silicawould precipitate out of the melt. For example, at 2000 K theSiO2 activity in a melt with the composition of the BSE
(Table 3, henceforth BSE magma) is
( ) ( )( ) ( )g= ~ ~a XBSE 0.40 0.7 0.3, 24SiO SiO SiO2 2 2
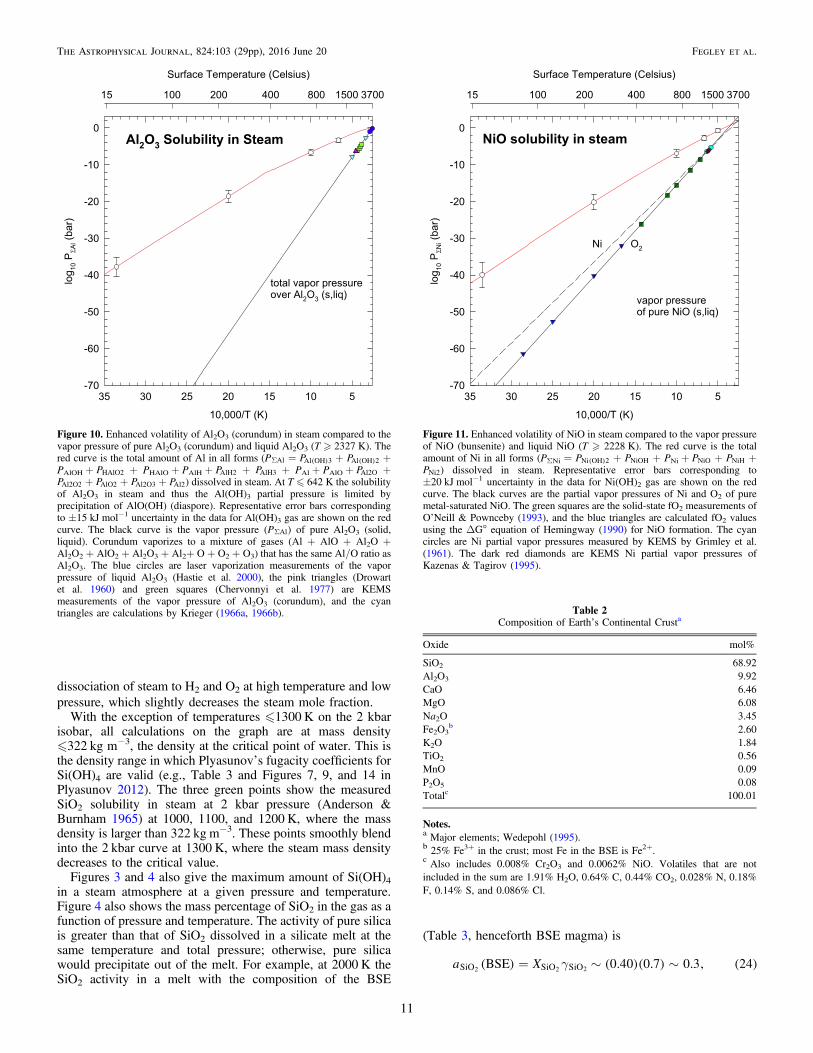
Figure 10. Enhanced volatility of Al2O3 (corundum) in steam compared to thevapor pressure of pure Al2O3 (corundum) and liquid Al2O3 (T � 2327 K). Thered curve is the total amount of Al in all forms (PSAl = ( )PAl OH 3 + ( )PAl OH 2 +PAlOH + PHAlO2 + PHAlO + PAlH + PAlH2 + PAlH3 + PAl + PAlO + PAl2O +PAl2O2 + PAlO2 + PAl2O3 + PAl2) dissolved in steam. At T � 642 K the solubilityof Al2O3 in steam and thus the Al(OH)3 partial pressure is limited byprecipitation of AlO(OH) (diaspore). Representative error bars correspondingto ±15 kJ mol−1 uncertainty in the data for Al(OH)3 gas are shown on the redcurve. The black curve is the vapor pressure (PSAl) of pure Al2O3 (solid,liquid). Corundum vaporizes to a mixture of gases (Al + AlO + Al2O +Al2O2 + AlO2 + Al2O3 + Al2+ O + O2 + O3) that has the same Al/O ratio asAl2O3. The blue circles are laser vaporization measurements of the vaporpressure of liquid Al2O3 (Hastie et al. 2000), the pink triangles (Drowartet al. 1960) and green squares (Chervonnyi et al. 1977) are KEMSmeasurements of the vapor pressure of Al2O3 (corundum), and the cyantriangles are calculations by Krieger (1966a, 1966b).
Figure 11. Enhanced volatility of NiO in steam compared to the vapor pressureof NiO (bunsenite) and liquid NiO (T � 2228 K). The red curve is the totalamount of Ni in all forms (PΣNi = ( )PNi OH 2 + PNiOH + PNi + PNiO + PNiH +PNi2) dissolved in steam. Representative error bars corresponding to±20 kJ mol−1 uncertainty in the data for Ni(OH)2 gas are shown on the redcurve. The black curves are the partial vapor pressures of Ni and O2 of puremetal-saturated NiO. The green squares are the solid-state fO2 measurements ofO’Neill & Pownceby (1993), and the blue triangles are calculated fO2 valuesusing the ΔG° equation of Hemingway (1990) for NiO formation. The cyancircles are Ni partial vapor pressures measured by KEMS by Grimley et al.(1961). The dark red diamonds are KEMS Ni partial vapor pressures ofKazenas & Tagirov (1995).
Table 2Composition of Earthʼs Continental Crusta
Oxide mol%
SiO2 68.92Al2O3 9.92CaO 6.46MgO 6.08Na2O 3.45Fe2O3
b 2.60K2O 1.84TiO2 0.56MnO 0.09P2O5 0.08Totalc 100.01
Notes.a Major elements; Wedepohl (1995).b 25% Fe3+ in the crust; most Fe in the BSE is Fe2+.c Also includes 0.008% Cr2O3 and 0.0062% NiO. Volatiles that are notincluded in the sum are 1.91% H2O, 0.64% C, 0.44% CO2, 0.028% N, 0.18%F, 0.14% S, and 0.086% Cl.
11
The Astrophysical Journal, 824:103 (29pp), 2016 June 20 Fegley et al.
and the SiO2 activity in a melt with the composition of thecontinental crust (Table 2, henceforth CC magma) is
( ) ( )( ) ( )g= ~ ~a XCC 0.69 0.85 0.6 25SiO SiO SiO2 2 2
versus an activity of unity for pure silica. The activitycoefficients in Equations (24) and (25) are computed with theMELTS codes discussed in Section 4. The FactSage code givessimilar values for silica activities of ∼0.2 for the BSE and∼0.55 for the CC magma at 2000 K. Thus, the Si(OH)4 partialpressure over the BSE magma is ∼0.3 times that over puresilica, and the Si(OH)4 partial pressure over the CC magma is∼0.6 times that over pure silica at the same total pressure ofsteam.
5.2.2. Periclase (MgO)
Magnesium oxide is ∼48 mol% of the BSE but only ∼6mol% of the continental crust. Periclase is the mineralogicalname for pure MgO that occurs naturally, and we use that namefor pure MgO. However, most of the MgO in the BSE and CCis a constituent of other minerals. Figure 5 compares the vaporpressure of solid and liquid (T � 3100 K) MgO (the blackcurve) and its solubility in steam (the red curve).
Vaporization of MgO produces a mixture of gases with anMg/O ratio of unity. At 2000 K the vapor pressure is∼5.9 × 10⁻⁶ bars and the vapor is dominantly composed ofMg (61%), O2 (24%), O (13%), and MgO (2%). Themeasurements (blue points) of Kazenas et al. (1983) and thecalculations (green points) of Krieger (1966a) agree with theIVTAN calculations (black curve) for the vapor pressure.
Laboratory studies show that MgO dissolution in steamproceeds primarily via formation of Mg(OH)2 gas (Alexanderet al. 1963; Maeda et al. 1978; Hashimoto 1992),
( ) ( ) ( ) ( ) ( )+ =MgO periclase H O gas Mg OH gas . 262 2
This is the reaction along the red curve at T � 780 K inFigure 5. However, at T � 780 K (the slight kink in the redcurve) the solubility of MgO in steam is limited byprecipitation of Mg(OH)2 (brucite). This is the P, T pointwhere the MgO (periclase)—Mg(OH)2 (brucite) univariantcurve intersects the solubility curve for MgO in steam. Ourcalculated P, T point for this intersection agrees with themeasured (Kennedy 1956) position of the periclase—bruciteunivariant curve. Below this point the partial pressure ofMg(OH)2 in steam equals the vapor pressure of brucite:
( ) ( ) ( ) ( ) ( )=Mg OH brucite Mg OH gas . 272 2
At 2000 K, the Mg(OH)2 gas partial pressure in steam is∼0.01 bars. This is ∼1750 times larger than the vapor pressureof MgO at the same temperature.The equilibrium constant for MgO dissolution in steam via
reaction (26) is
· · ( )( ) ( )f
f=K
P
P a
1. 2826
Mg OH
H O
Mg OH
H O MgO
2
2
2
2
Rearranging Equation (28) shows that the abundance (molefraction) of Mg(OH)2 gas is independent of total pressure:
· · · ( )( )( )
f
f=X K a X . 29Mg OH 26 MgO H O
H O
Mg OH2 2
2
2
Calculations from 1 to 1000 bars total pressure confirm the nearconstancy of the abundance of Mg(OH)2 gas along an isotherm.At 2000 K, the Mg(OH)2 mole fraction varies from4.64 × 10−5 (PT ∼ Psteam = 1 bar) to 4.68 × 10⁻⁵ (PT ∼Psteam = 1000 bars).Figure 5 also gives the maximum amount of Mg(OH)2 in a
steam atmosphere at a given pressure and temperature. Theactivity of pure MgO is greater than that of MgO dissolved in asilicate melt at the same temperature and total pressure;otherwise, pure periclase would precipitate out of the melt. Forexample, at 2000 K the MgO activity in BSE magma is ∼0.2(MELTS) to ∼0.3 (FactSage), and the MgO activity in CCmagma is ∼0.01 (FactSage) to ∼0.04 (MELTS) versus anactivity of unity for pure MgO.
5.2.3. Iron Oxides
Iron oxides are minor constituents of the BSE andcontinental crust (5.90 mol% in the BSE and 2.60 mol% inthe CC). Figure 6 compares the solubility of “FeO” (denotingwüstite, which is actually Fe1-xO with a temperature-dependentFe/O ratio close to 0.95) in steam (red curve) and the Σ Fe andO2 partial vapor pressures (black curves). We first discuss thevapor pressure curves. Wüstite and the other two iron oxidesvaporize incongruently (e.g., Brewer & Mastick 1951; Chizi-kov et al. 1971; Shchedrin et al. 1978; Kazenas & Tagirov1995). This means that the Fe/O atomic ratio in the vapor isdifferent from that in the solid (or liquid). The black curves arethe partial vapor pressures of Fe gases (PΣFe ∼ PFe ∼ Pvap) andO2 over pure metal-saturated “FeO” (wüstite) at T =843–1650 K and liquid “FeO” at T � 1650 K. The lowertemperature bound is the wüstite eutectoid temperature.Wüstite is unstable at T � 843 K with respect to a mixture ofiron metal and Fe3O4 (magnetite), and it decomposes to thismixture at 843 K. Below 843 K the black curves are the partial
Table 3Composition of the Bulk Silicate Earth (BSE)a
Oxide mol%
MgO 47.67SiO2 39.48FeOb 5.90CaO 3.40Al2O3 2.30Na2O 0.29NiO 0.17TiO2 0.14Cr2O3 0.13MnO 0.10K2O 0.0174H2O 0.31CO2 0.044N 7.5 × 10⁻⁴
F 6.9 × 10⁻³
Cl 4.4 × 10⁻³
S 0.0326P2O5 7.3 × 10⁻³
Total 100.00
Notes.a Computed from data in Palme & O’Neill (2014).b Most Fe in the BSE is Fe2+; the crust is 25% Fe3+.
12
The Astrophysical Journal, 824:103 (29pp), 2016 June 20 Fegley et al.
vapor pressures of Fe and O2 over metal-saturated magnetite.Several comparisons to experimental data are shown on thegraph. The blue and green squares are solid-state zirconiasensor fO2 measurements by O’Neill (1988) for iron—wüstiteand iron—magnetite, respectively. The yellow squares aresolid-state zirconia sensor (i.e., emf) fO2 measurements byO’Neill & Pownceby (1993) for iron—wüstite. The blacktriangle is a set of fO2 measurements for liquid “FeO” byKEMS by Kazenas & Tagirov (1995). As Figure 6 shows, theFe partial vapor pressure is significantly larger than the O2
partial vapor pressure (i.e., the oxygen fugacity, fO2). At2000 K the vapor pressure of liquid “FeO” is ∼0.0004 bars(Pvap ∼ PFe).
The red curve is the total amount of Fe in all forms (PΣFe=( )PFe OH 2 + PFeOH + PFeO(OH) + PFe + PFe2 + PFeO + PFeO2 +
PFeH) dissolved in steam. Fe(OH)2 is the dominant gas at alltemperatures shown. Representative error bars correspondingto ±30 kJ mol−1 uncertainty in the Fe(OH)2 gas data (Gurvichet al. 1983) are shown on the red curve. Thermodynamiccalculations predict that “FeO” dissolution in steam occurs as
( ̈ ) ( ) ( ) ( ) ( )+ =“FeO” wustite H O gas Fe OH gas . 302 2
The analogous reaction involving FeO (gas) is well known(Farber et al. 1974; Rollason & Plane 2000), and Belton &Richardson (1962) showed Fe metal dissolved in steam via ananalogous reaction to Equation (30). At 2000 K the Fe(OH)2gas partial pressure in steam is ∼0.09 bars, which is ∼220 timeslarger than the vapor pressure of liquid “FeO.”
The equilibrium constant expression for reaction (30) is
· · ( )( ) ( )f
f=K
P
P a
1. 3130
Fe OH
H O
Fe OH
H O FeO
2
2
2
2
The partial pressure and mole fraction of Fe(OH)2 vapor arethus given by
· · · ( )( )( )
f
f=P K a P 32Fe OH 30 FeO H O
H O
Fe OH2 2
2
2
· · · ( )( )( )
f
f=X K a X . 33Fe OH 30 FeO H O
H O
Fe OH2 2
2
2
Equation (33) shows that the mole fraction of Fe(OH)2 gas isindependent of total pressure. Calculations from 1 to 1000 barstotal pressure confirm the near constancy of the abundance ofFe(OH)2 gas. At 2000 K, the Fe(OH)2 mole fraction only variesfrom 4.25 × 10⁻⁴ (PT ∼ Psteam = 1 bar) to 4.27 × 10⁻⁴ (PT ∼Psteam = 1000 bars).
Figure 7 compares the solubility of Fe3O4 (magnetite) insteam (red curve) and the Fe (g) and O2 partial vapor pressures(black curves). Magnetite vaporization produces significantlymore Fe gas than oxygen until high temperatures. The Fe andO2 partial pressures are equal at ∼1540 K, and O2 is dominantat higher temperatures. The partial vapor pressure curves for Feand O2 are for metal-rich Fe3O4 and liquid Fe3O4 (at T �1870 K) and are computed from the partial molal Gibbsenergies of oxygen and Fe metal-rich Fe3O4 in equilibriumwith wüstite from 843 to 1573 K tabulated by Spencer &Kubaschewski (1978), i.e.,
( )=RT f Gln 2 34O O2
( )=RT f Gln . 35Fe Fe
The reason for doing this is as follows. The O2 partial vaporpressure of Fe3O4 coexisting with wüstite is for the reaction
( )( )( )
( )( )-
+ =--
-y
y
y
3
1 4Fe O
1
2O
1
1 4Fe O . 36y1 2 3 4
The wüstite composition along the phase boundary(843–1697 K) is different from that of metal-rich wüstite andvaries significantly with temperature. Neither JANAF norIVTAN (nor any other compilation we know of) tabulates thenecessary thermodynamic data to do calculations. We extra-polated the partial vapor pressure curves from 1573 K to highertemperatures. The pink circles (Jacobsson 1985) and greensquares (O’Neill 1988) are solid-state zirconia sensor fO2
measurements. These data sets are on our calculated O2 partialvapor pressure curve. The two blue triangles are O2 partialpressures read off the Fe–O phase diagram of Muan & Osborn(1965). They are slightly higher than our extrapolated O2 curve.Below 843 K the curves are the same as in Figure 6 becauseFe3O4 coexists with Fe metal in this range.The red curve is analogous to the one in Figure 6. It shows
the partial pressure of Fe(OH)2 in steam due to dissolution ofFe3O4 via the reaction
( ) ( )( ) ( ) ( ) ( )
+= +
Fe O magnetite 3H O gas3Fe OH gas ½O gas . 37
3 4 2
2 2
As discussed below, Belton & Richardson (1962) showed thatFe2O3 dissolves in steam via an analogous reaction. At 2000 Kthe Fe(OH)2 partial pressure in steam due to dissolution ofmagnetite is ∼0.02 bars, while the partial vapor pressure of Feover liquid Fe3O4 is ∼2000 times smaller and is about10−5 bars.Figure 8 compares the solubility of Fe2O3 (hematite) in
steam with the Fe and O2 partial vapor pressures of hematiteand liquid Fe2O3 (T � 1895 K). Hematite vaporizes to almostpure O2 with very little Fe. Figure 8 shows two vapor pressurecurves for Fe2O3—one is the O2 partial pressure, and the otheris the sum of the pressures of all Fe-bearing gases(Fe+ FeO+ FeO2+ Fe2). The blue points (manometry; Sal-mon 1961), green points (emf; Jacobsson 1985), and pinkpoints (emf; Blumenthal & Whitmore 1961) on the O2 curveare measurements of the O2 partial pressure by two differentmethods.The red curve is analogous to the one in Figure 6. It shows
the partial pressure of Fe(OH)2 in steam due to dissolution ofFe2O3 via the reaction
( ) ( )( ) ( ) ( ) ( )
+= +
Fe O hematite 2H O gas2Fe OH gas ½ O gas . 38
2 3 2
2 2
Belton & Richardson (1962) studied reaction (38) and theanalogous reaction with iron metal:
( ) ( ) ( ) ( ) ( )+ = +Fe metal 2H O gas Fe OH H gas . 392 2 2
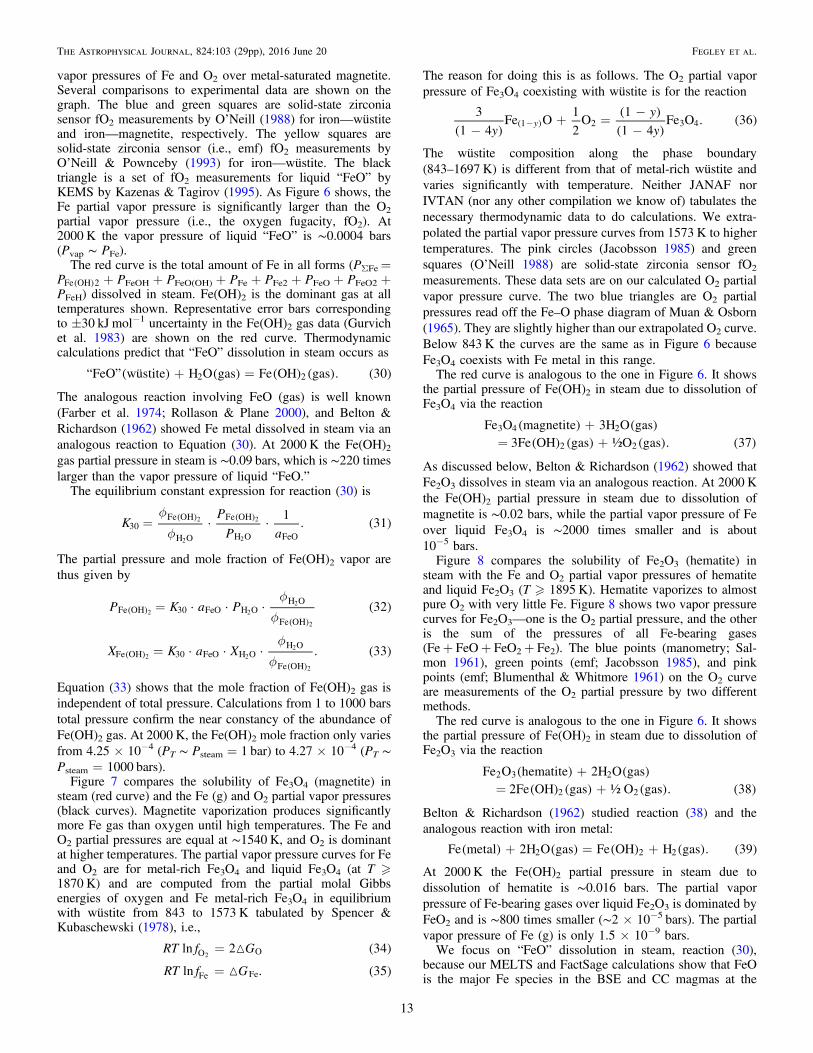
At 2000 K the Fe(OH)2 partial pressure in steam due todissolution of hematite is ∼0.016 bars. The partial vaporpressure of Fe-bearing gases over liquid Fe2O3 is dominated byFeO2 and is ∼800 times smaller (∼2 × 10⁻⁵ bars). The partialvapor pressure of Fe (g) is only 1.5 × 10⁻⁹ bars.We focus on “FeO” dissolution in steam, reaction (30),
because our MELTS and FactSage calculations show that FeOis the major Fe species in the BSE and CC magmas at the
13
The Astrophysical Journal, 824:103 (29pp), 2016 June 20 Fegley et al.
oxygen fugacity (fO2) of the steam atmospheres, e.g., at 2000 Kthe FeO/Fe2O3 activity ratio is ∼155 in the BSE magma and∼20 in the CC magma.
Figure 6 also gives the maximum amount of Fe(OH)2 in asteam atmosphere at a given pressure and temperature. Theactivity of pure “FeO” is greater than that of FeO dissolved in asilicate melt at the same temperature and total pressure;otherwise, pure wüstite would precipitate out of the melt. Forexample, at 2000 K the FeO activity in BSE magma is ∼0.11(FactSage) to ∼0.14 (MELTS) and the FeO activity in CCmagma is ∼0.06 (FactSage) to ∼0.15 (MELTS) versus anactivity of unity for pure wüstite.
5.3. Vapor Pressure and Solubility in Steamof Less Abundant Oxides
5.3.1. Calcium Oxide
Calcium oxide (CaO, calcia, lime) is a minor constituent ofEarthʼs continental crust (∼6.5%) and BSE (∼3.4%). Figure 9compares the vapor pressure of solid and liquid (T � 3172 K)CaO (black curve) and its solubility in steam (red curve), whichis limited by precipitation of solid and liquid Ca(OH)2 attemperatures up to 1550 K.
Lime vaporizes congruently to a mixture of gases with a Ca/O ratio of unity. Our calculated vapor pressure curve agreeswith measurements (blue circles; Samoilova & Kazenas 1995)and calculations (green triangles; Krieger 1967). At 2000 K thevapor pressure is ∼3.6 × 10⁻⁷ bars and the vapor is dominantlycomposed of Ca (55%), O (35%), and O2 (10%). In contrast,the total pressure of all Ca-bearing gases dissolved in steam is∼3.1 × 10⁻² bars, about 84,000 times larger.
Calcium dihydroxide [Ca(OH)2] is the major Ca species insteam. It forms via the reaction (Matsumoto & Sata 1981;Hashimoto 1992)
( ) ( ) ( ) ( ) ( )+ =CaO lime, liq H O g Ca OH g . 402 2
The equilibrium constant expression for this reaction is
· · ( )( ) ( )f
f=K
P
P a
1. 4140
Ca OH
H O
Ca OH
H O CaO
2
2
2
2
Rearranging Equation (41) shows that the mole fraction ofCa(OH)2 gas is independent of the total pressure,
· · · ( )( )( )
f
f=X K a X . 42Ca OH 40 CaO H O
H O
Ca OH2 2
2
2
However, at T � 1550 K, the solubility of CaO in steam andthus the partial pressure of Ca(OH)2 gas are controlled byprecipitation of Ca(OH)2 (portlandite). This occurs at the P, Tpoint, where the CaO (lime)–Ca(OH)2 (portlandite) univariantcurve intersects the solubility curve for CaO in steam. Belowthis point the partial pressure of Ca(OH)2 gas equals the vaporpressure of portlandite:
( ) ( ) ( ) ( ) ( )=Ca OH portlandite, liquid Ca OH gas . 432 2
Calculations at 2000 K from 1 to 338 bars total pressureconfirm the near constancy of the abundance of Ca(OH)2 gas.At this temperature, the Ca(OH)2 mole fraction varies from1.39 × 10−4 (PT ∼ Psteam = 1 bar) to 1.43 × 10⁻⁴ (PT ∼Psteam = 338 bars). Liquid Ca(OH)2 forms at Psteam � 338 bars,
and the partial pressure of Ca(OH)2 is controlled by the vaporpressure of liquid Ca(OH)2 at Psteam � 338 bars at 2000 K.Figure 9 also gives the maximum amount of Ca(OH)2 in a
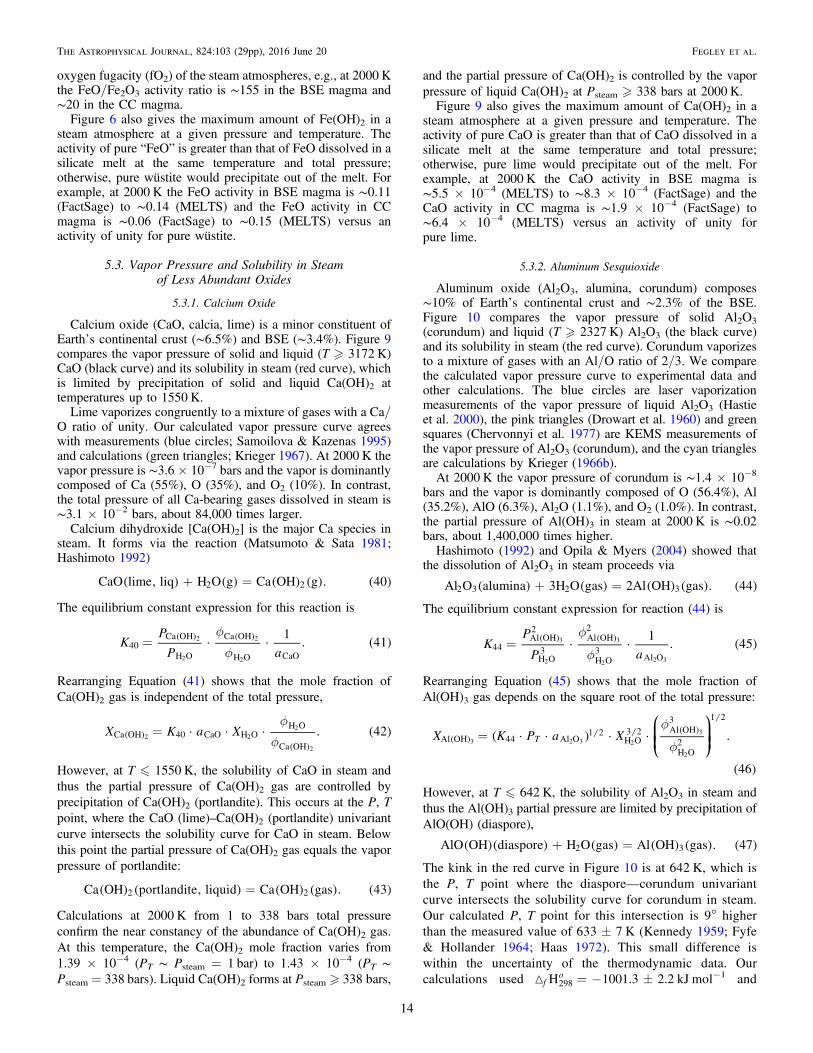
steam atmosphere at a given pressure and temperature. Theactivity of pure CaO is greater than that of CaO dissolved in asilicate melt at the same temperature and total pressure;otherwise, pure lime would precipitate out of the melt. Forexample, at 2000 K the CaO activity in BSE magma is∼5.5 × 10⁻⁴ (MELTS) to ∼8.3 × 10⁻⁴ (FactSage) and theCaO activity in CC magma is ∼1.9 × 10⁻⁴ (FactSage) to∼6.4 × 10⁻⁴ (MELTS) versus an activity of unity forpure lime.
5.3.2. Aluminum Sesquioxide
Aluminum oxide (Al2O3, alumina, corundum) composes∼10% of Earthʼs continental crust and ∼2.3% of the BSE.Figure 10 compares the vapor pressure of solid Al2O3
(corundum) and liquid (T � 2327 K) Al2O3 (the black curve)and its solubility in steam (the red curve). Corundum vaporizesto a mixture of gases with an Al/O ratio of 2/3. We comparethe calculated vapor pressure curve to experimental data andother calculations. The blue circles are laser vaporizationmeasurements of the vapor pressure of liquid Al2O3 (Hastieet al. 2000), the pink triangles (Drowart et al. 1960) and greensquares (Chervonnyi et al. 1977) are KEMS measurements ofthe vapor pressure of Al2O3 (corundum), and the cyan trianglesare calculations by Krieger (1966b).At 2000 K the vapor pressure of corundum is ∼1.4 × 10⁻⁸
bars and the vapor is dominantly composed of O (56.4%), Al(35.2%), AlO (6.3%), Al2O (1.1%), and O2 (1.0%). In contrast,the partial pressure of Al(OH)3 in steam at 2000 K is ∼0.02bars, about 1,400,000 times higher.Hashimoto (1992) and Opila & Myers (2004) showed that
the dissolution of Al2O3 in steam proceeds via
( ) ( ) ( ) ( ) ( )+ =Al O alumina 3H O gas 2Al OH gas . 442 3 2 3
The equilibrium constant expression for reaction (44) is
· · ( )( ) ( )f
f=K
P
P a
1. 4544
Al OH2
H O3
Al OH2
H O3
Al O
3
2
3
2 2 3
Rearranging Equation (45) shows that the mole fraction ofAl(OH)3 gas depends on the square root of the total pressure:
( · · ) · ·
( )
( )( )f
f=
⎛⎝⎜⎜
⎞⎠⎟⎟X K P a X .
46
TAl OH 44 Al O1 2
H O3 2 Al OH
3
H O2
1 2
3 2 3 2
3
2
However, at T � 642 K, the solubility of Al2O3 in steam andthus the Al(OH)3 partial pressure are limited by precipitation ofAlO(OH) (diaspore),
( )( ) ( ) ( ) ( ) ( )+ =AlO OH diaspore H O gas Al OH gas . 472 3
The kink in the red curve in Figure 10 is at 642 K, which isthe P, T point where the diaspore—corundum univariantcurve intersects the solubility curve for corundum in steam.Our calculated P, T point for this intersection is 9° higherthan the measured value of 633 ± 7 K (Kennedy 1959; Fyfe& Hollander 1964; Haas 1972). This small difference iswithin the uncertainty of the thermodynamic data. Ourcalculations used = - H 1001.3 2.2f
o298 kJ mol−1 and
14
The Astrophysical Journal, 824:103 (29pp), 2016 June 20 Fegley et al.
= S 35.3 0.2o298 J mol−1 K−1 for AlO(OH) from Robie &Hemingway (1995), heat capacity measurements of Perkinset al. (1979), and V = V(T) data from Pawley et al. (1996).
Figure 10 also gives the maximum amount of Al(OH)3 in asteam atmosphere at a given pressure and temperature. Theactivity of pure Al2O3 is greater than that of Al2O3 dissolved ina silicate melt at the same temperature and total pressure;otherwise, pure corundum would precipitate out of the melt.For example, at 2000 K the Al2O3 activity in BSE magma is∼6.3 × 10⁻⁵ (FactSage) to ∼7.4 × 10⁻³ (MELTS) and theAl2O3 activity in CC magma is ∼0.013 (MELTS) to ∼0.037(FactSage) versus an activity of unity for pure corundum. Thecalculated Al2O3 activity values in silicate melt from the twocodes disagree because the MELTS code does not considersolid or liquid MgAl2O4 (spinel), which is an important Al-bearing component in the FactSage calculations. We used theMELTS results in our calculations.
5.3.3. Nickel Oxide
Nickel oxide (NiO) is a trace constituent of the continentalcrust (∼0.006%) and the BSE (∼0.17%) and occurs as themineral bunsenite or as a minor component of other minerals.Figure 11 compares NiO solubility in steam (red curve) withthe Ni and O2 partial vapor pressures of bunsenite and liquidNiO (T � 2228 K). The points on the vapor pressure curves aremeasured partial vapor pressures (PNi+ PNiO) (Grimley et al.1961, cyan circles; Kazenas & Tagirov 1995, dark reddiamonds), measured O2 (O’Neill & Pownceby 1993, greensquares), and calculated O2 partial vapor pressures (Hemi-ngway 1990, blue triangles).
At 2000 K the partial vapor pressures of Ni and NiO sum upto ∼3.0 × 10⁻⁴ bars. In contrast, the total pressure of all Ni-bearing gases dissolved in steam is ∼0.19 bars, about 630 timeslarger, and is 98% Ni(OH)2 gas and 2% NiOH gas.
Belton & Jordan (1967) measured Ni(OH)2 gas formationfrom Ni metal reacting with water vapor. Based on their work,Ni(OH)2 gas forms via the reaction
( ) ( ) ( ) ( ) ( )+ =NiO bunsenite, liq H O g Ni OH g . 482 2
The equilibrium constant expression for reaction (48) is
· · ( )( ) ( )f
f=K
P
P a
1. 4948
Ni OH
H O
Ni OH
H O NiO
2
2
2
2
Rearranging Equation (49) shows that the mole fraction ofNi(OH)2 gas is independent of the total pressure,
· · · ( )( )( )
f
f=X K a X . 50Ni OH 48 NiO H O
H O
Ni OH2 2
2
2
In contrast to other oxides (e.g., CaO, MgO), precipitation ofNi(OH)2 does not occur at low temperatures—at leastaccording to thermodynamic data tabulated by NIST—andthe Ni(OH)2 partial pressure is always limited by solubility ofNiO in steam.
The red curve in Figure 11 also gives the maximum amountof Ni(OH)2 in a steam atmosphere at a given pressure andtemperature. The activity of pure NiO is greater than that ofNiO dissolved in a silicate melt at the same temperature andtotal pressure; otherwise, pure NiO would precipitate out of themelt. Assuming ideality for NiO dissolved in silicate melts,lower limits to the NiO activity are given by its mole fraction in
the BSE (∼0.002) and CC (∼6 × 10⁻⁵) magmas versus anactivity of unity for pure NiO. Holzheid et al. (1997) foundNiO activity coefficients γ = 2.7 ± 0.5 in silicate melts. Thiswould increase the NiO activity by that factor (aNiO = γ·XNiO),but our conclusion remains unchanged—Figure 11 gives themaximum Ni(OH)2 gas pressure.Finally, Belton & Jordan (1967) showed that Co(OH)2 also
exists. However, cobalt has about 1/10 the abundance of nickelin the BSE, and our calculations found that Co(OH)2 is a veryminor gas, which we do not discuss further.
5.3.4. Sodium and Potassium Oxides
Sodium oxide (Na2O) and potassium oxide (K2O) are tooreactive to occur in nature. Thus, we did not compare theirvapor pressures to their solubility in steam. We discuss thechemistry of sodium and potassium in steam atmospheresequilibrated with magma oceans in Sections 7.2–7.3.
5.4. Summary of Oxide Solubility in Steam
Table 4 summarizes our results in Figures 3–11 for thepartial pressures of metal hydroxide gases in steam at 220.64bar pressure for three selected temperatures (1000, 1500, and2000 K). The relative solubility (or volatility) of the majorrock-forming oxides in steam varies somewhat as a function oftemperature, but SiO2 is always the most soluble (volatile)oxide, “FeO” is the second or third most soluble (volatile), andMgO is always the least soluble (volatile).
6. SOLUBILITY OF SiO2, MGO, AND FE OXIDES INSTEAM-BEARING ATMOSPHERES
Steam atmospheres are not pure water vapor, and theycontain other gases due to thermal dissociation of steam (e.g.,H2, OH, H, O2, O) and the outgassing of other volatiles fromrocky material. Schaefer et al. (2012) and Fegley & Schaefer(2014) computed the major H-, C-, N-, and S-bearing gases as afunction of pressure and temperature for hot rocky exoplanetswith compositions like the BSE or continental crust; seeFigures 7–8 of Schaefer et al. (2012) and Figure 5 in Fegley &Schaefer (2014). They found that the major gases in steamatmospheres with pressures �1 bar and surface temperatures�2000 K are H2O, CO2, N2, SO2, H2, and O2, and that CO mayalso be present.Kuts (1967) studied the effects of N2, CO2, and O2 on
solubility of amorphous silica in steam at 708–913 K and 1–15atmospheres. He found that silica solubility in the gas mixtureswas the same as in pure steam at the same temperature and totalsteam pressure. Thus, N2, CO2, and O2 were inert in the P, Trange he studied.We calculated the effects of a second gas on solubility of
SiO2, MgO, and FeO in steam as a function of composition at
Table 4Hydroxide Gas Partial Pressures at 220.64 bar Steam
Gas 1000 K 1500 K 2000 K
Si(OH)4 0.029 0.20 0.59Mg(OH)2 2.0 × 10⁻¹⁰ 2.7 × 10⁻⁵ 0.010Fe(OH)2 1.5 × 10⁻⁶ 3.5 × 10⁻³ 0.11Ca(OH)2 1.7 × 10⁻¹⁰ 1.2 × 10⁻⁴ 0.040Al(OH)3 2.3 × 10⁻⁷ 5.0 × 10⁻⁴ 0.024Ni(OH)2 1.3 × 10⁻⁷ 1.6 × 10⁻³ 0.19
15
The Astrophysical Journal, 824:103 (29pp), 2016 June 20 Fegley et al.
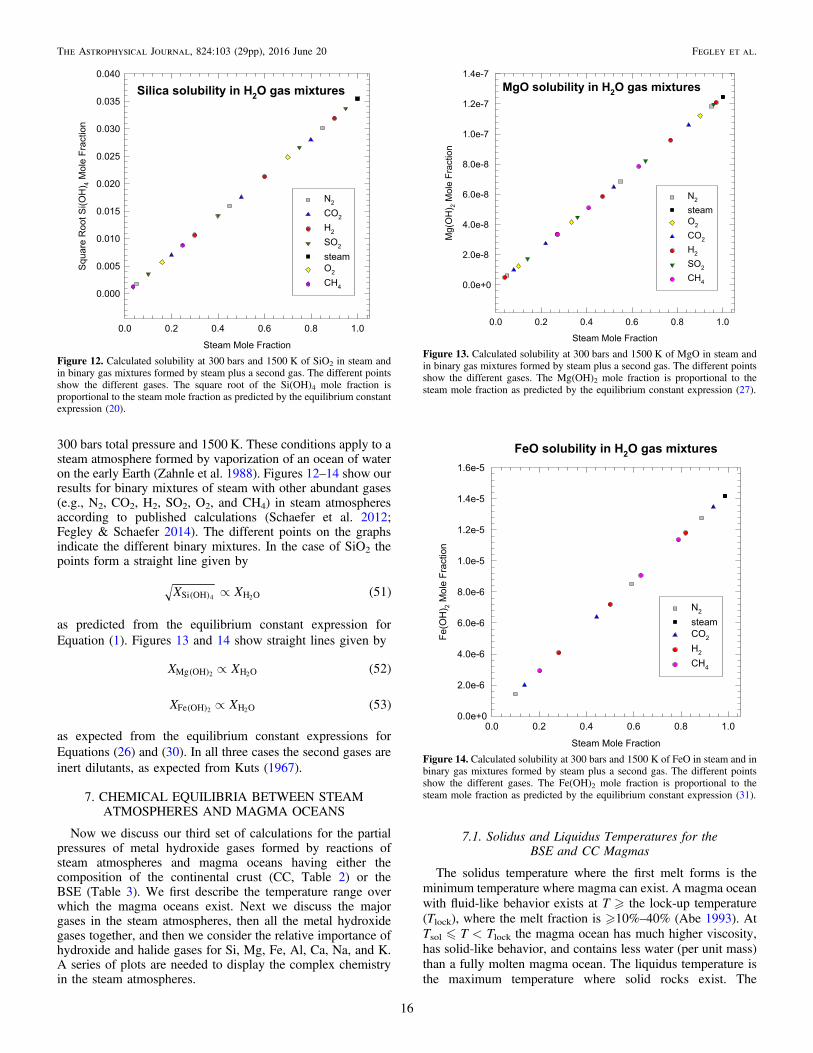
300 bars total pressure and 1500 K. These conditions apply to asteam atmosphere formed by vaporization of an ocean of wateron the early Earth (Zahnle et al. 1988). Figures 12–14 show ourresults for binary mixtures of steam with other abundant gases(e.g., N2, CO2, H2, SO2, O2, and CH4) in steam atmospheresaccording to published calculations (Schaefer et al. 2012;Fegley & Schaefer 2014). The different points on the graphsindicate the different binary mixtures. In the case of SiO2 thepoints form a straight line given by
( )( ) µX X 51Si OH H O4 2
as predicted from the equilibrium constant expression forEquation (1). Figures 13 and 14 show straight lines given by
( )( ) µX X 52Mg OH H O2 2
( )( ) µX X 53Fe OH H O2 2
as expected from the equilibrium constant expressions forEquations (26) and (30). In all three cases the second gases areinert dilutants, as expected from Kuts (1967).
7. CHEMICAL EQUILIBRIA BETWEEN STEAMATMOSPHERES AND MAGMA OCEANS
Now we discuss our third set of calculations for the partialpressures of metal hydroxide gases formed by reactions ofsteam atmospheres and magma oceans having either thecomposition of the continental crust (CC, Table 2) or theBSE (Table 3). We first describe the temperature range overwhich the magma oceans exist. Next we discuss the majorgases in the steam atmospheres, then all the metal hydroxidegases together, and then we consider the relative importance ofhydroxide and halide gases for Si, Mg, Fe, Al, Ca, Na, and K.A series of plots are needed to display the complex chemistryin the steam atmospheres.
7.1. Solidus and Liquidus Temperatures for theBSE and CC Magmas
The solidus temperature where the first melt forms is theminimum temperature where magma can exist. A magma oceanwith fluid-like behavior exists at T � the lock-up temperature(Tlock), where the melt fraction is �10%–40% (Abe 1993). AtTsol � T < Tlock the magma ocean has much higher viscosity,has solid-like behavior, and contains less water (per unit mass)than a fully molten magma ocean. The liquidus temperature isthe maximum temperature where solid rocks exist. The
Figure 12. Calculated solubility at 300 bars and 1500 K of SiO2 in steam andin binary gas mixtures formed by steam plus a second gas. The different pointsshow the different gases. The square root of the Si(OH)4 mole fraction isproportional to the steam mole fraction as predicted by the equilibrium constantexpression (20).
Figure 13. Calculated solubility at 300 bars and 1500 K of MgO in steam andin binary gas mixtures formed by steam plus a second gas. The different pointsshow the different gases. The Mg(OH)2 mole fraction is proportional to thesteam mole fraction as predicted by the equilibrium constant expression (27).
Figure 14. Calculated solubility at 300 bars and 1500 K of FeO in steam and inbinary gas mixtures formed by steam plus a second gas. The different pointsshow the different gases. The Fe(OH)2 mole fraction is proportional to thesteam mole fraction as predicted by the equilibrium constant expression (31).
16
The Astrophysical Journal, 824:103 (29pp), 2016 June 20 Fegley et al.
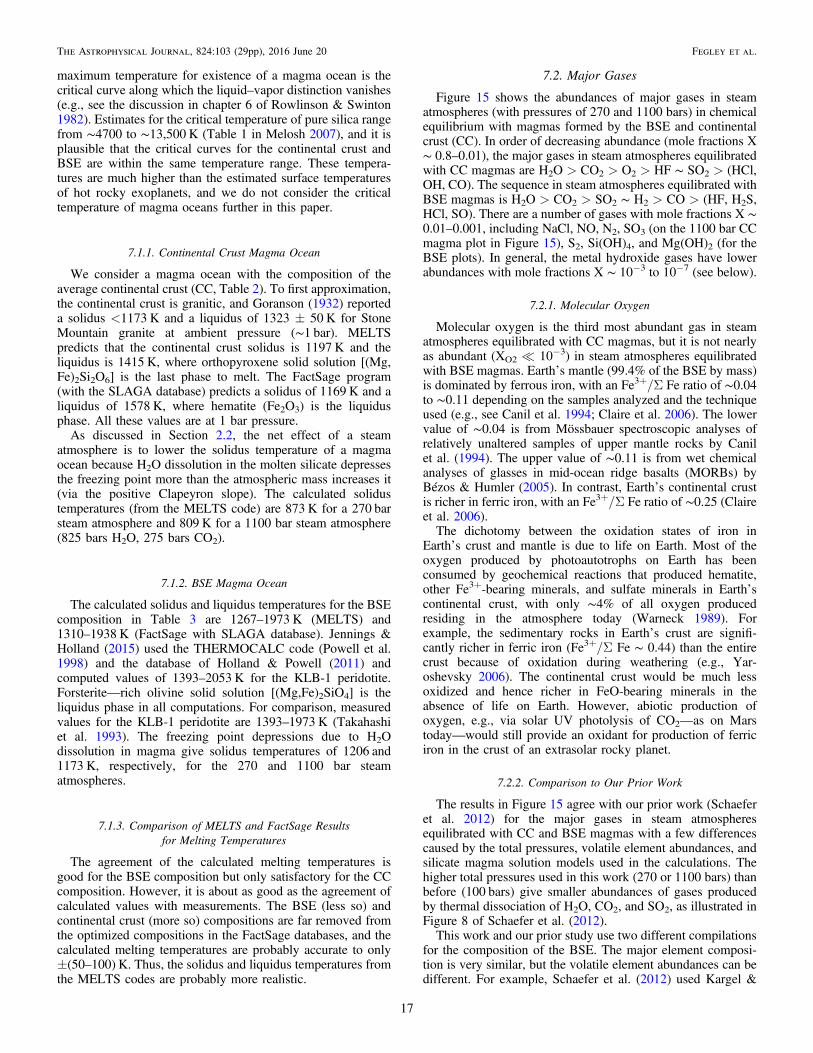
maximum temperature for existence of a magma ocean is thecritical curve along which the liquid–vapor distinction vanishes(e.g., see the discussion in chapter 6 of Rowlinson & Swinton1982). Estimates for the critical temperature of pure silica rangefrom ∼4700 to ∼13,500 K (Table 1 in Melosh 2007), and it isplausible that the critical curves for the continental crust andBSE are within the same temperature range. These tempera-tures are much higher than the estimated surface temperaturesof hot rocky exoplanets, and we do not consider the criticaltemperature of magma oceans further in this paper.
7.1.1. Continental Crust Magma Ocean
We consider a magma ocean with the composition of theaverage continental crust (CC, Table 2). To first approximation,the continental crust is granitic, and Goranson (1932) reporteda solidus <1173 K and a liquidus of 1323 ± 50 K for StoneMountain granite at ambient pressure (∼1 bar). MELTSpredicts that the continental crust solidus is 1197 K and theliquidus is 1415 K, where orthopyroxene solid solution [(Mg,Fe)2Si2O6] is the last phase to melt. The FactSage program(with the SLAGA database) predicts a solidus of 1169 K and aliquidus of 1578 K, where hematite (Fe2O3) is the liquidusphase. All these values are at 1 bar pressure.
As discussed in Section 2.2, the net effect of a steamatmosphere is to lower the solidus temperature of a magmaocean because H2O dissolution in the molten silicate depressesthe freezing point more than the atmospheric mass increases it(via the positive Clapeyron slope). The calculated solidustemperatures (from the MELTS code) are 873 K for a 270 barsteam atmosphere and 809 K for a 1100 bar steam atmosphere(825 bars H2O, 275 bars CO2).
7.1.2. BSE Magma Ocean
The calculated solidus and liquidus temperatures for the BSEcomposition in Table 3 are 1267–1973 K (MELTS) and1310–1938 K (FactSage with SLAGA database). Jennings &Holland (2015) used the THERMOCALC code (Powell et al.1998) and the database of Holland & Powell (2011) andcomputed values of 1393–2053 K for the KLB-1 peridotite.Forsterite—rich olivine solid solution [(Mg,Fe)2SiO4] is theliquidus phase in all computations. For comparison, measuredvalues for the KLB-1 peridotite are 1393–1973 K (Takahashiet al. 1993). The freezing point depressions due to H2Odissolution in magma give solidus temperatures of 1206 and1173 K, respectively, for the 270 and 1100 bar steamatmospheres.
7.1.3. Comparison of MELTS and FactSage Resultsfor Melting Temperatures
The agreement of the calculated melting temperatures isgood for the BSE composition but only satisfactory for the CCcomposition. However, it is about as good as the agreement ofcalculated values with measurements. The BSE (less so) andcontinental crust (more so) compositions are far removed fromthe optimized compositions in the FactSage databases, and thecalculated melting temperatures are probably accurate to only±(50–100)K. Thus, the solidus and liquidus temperatures fromthe MELTS codes are probably more realistic.
7.2. Major Gases
Figure 15 shows the abundances of major gases in steamatmospheres (with pressures of 270 and 1100 bars) in chemicalequilibrium with magmas formed by the BSE and continentalcrust (CC). In order of decreasing abundance (mole fractions X∼ 0.8–0.01), the major gases in steam atmospheres equilibratedwith CC magmas are H2O > CO2 > O2 > HF ∼ SO2 > (HCl,OH, CO). The sequence in steam atmospheres equilibrated withBSE magmas is H2O > CO2 > SO2 ∼ H2 > CO > (HF, H2S,HCl, SO). There are a number of gases with mole fractions X ∼0.01–0.001, including NaCl, NO, N2, SO3 (on the 1100 bar CCmagma plot in Figure 15), S2, Si(OH)4, and Mg(OH)2 (for theBSE plots). In general, the metal hydroxide gases have lowerabundances with mole fractions X ∼ 10−3 to 10−7 (see below).
7.2.1. Molecular Oxygen
Molecular oxygen is the third most abundant gas in steamatmospheres equilibrated with CC magmas, but it is not nearlyas abundant (XO2 = 10−3) in steam atmospheres equilibratedwith BSE magmas. Earthʼs mantle (99.4% of the BSE by mass)is dominated by ferrous iron, with an Fe3+/Σ Fe ratio of ∼0.04to ∼0.11 depending on the samples analyzed and the techniqueused (e.g., see Canil et al. 1994; Claire et al. 2006). The lowervalue of ∼0.04 is from Mössbauer spectroscopic analyses ofrelatively unaltered samples of upper mantle rocks by Canilet al. (1994). The upper value of ∼0.11 is from wet chemicalanalyses of glasses in mid-ocean ridge basalts (MORBs) byBézos & Humler (2005). In contrast, Earthʼs continental crustis richer in ferric iron, with an Fe3+/Σ Fe ratio of ∼0.25 (Claireet al. 2006).The dichotomy between the oxidation states of iron in
Earthʼs crust and mantle is due to life on Earth. Most of theoxygen produced by photoautotrophs on Earth has beenconsumed by geochemical reactions that produced hematite,other Fe3+-bearing minerals, and sulfate minerals in Earthʼscontinental crust, with only ∼4% of all oxygen producedresiding in the atmosphere today (Warneck 1989). Forexample, the sedimentary rocks in Earthʼs crust are signifi-cantly richer in ferric iron (Fe3+/Σ Fe ∼ 0.44) than the entirecrust because of oxidation during weathering (e.g., Yar-oshevsky 2006). The continental crust would be much lessoxidized and hence richer in FeO-bearing minerals in theabsence of life on Earth. However, abiotic production ofoxygen, e.g., via solar UV photolysis of CO2—as on Marstoday—would still provide an oxidant for production of ferriciron in the crust of an extrasolar rocky planet.
7.2.2. Comparison to Our Prior Work
The results in Figure 15 agree with our prior work (Schaeferet al. 2012) for the major gases in steam atmospheresequilibrated with CC and BSE magmas with a few differencescaused by the total pressures, volatile element abundances, andsilicate magma solution models used in the calculations. Thehigher total pressures used in this work (270 or 1100 bars) thanbefore (100 bars) give smaller abundances of gases producedby thermal dissociation of H2O, CO2, and SO2, as illustrated inFigure 8 of Schaefer et al. (2012).This work and our prior study use two different compilations
for the composition of the BSE. The major element composi-tion is very similar, but the volatile element abundances can bedifferent. For example, Schaefer et al. (2012) used Kargel &
17
The Astrophysical Journal, 824:103 (29pp), 2016 June 20 Fegley et al.
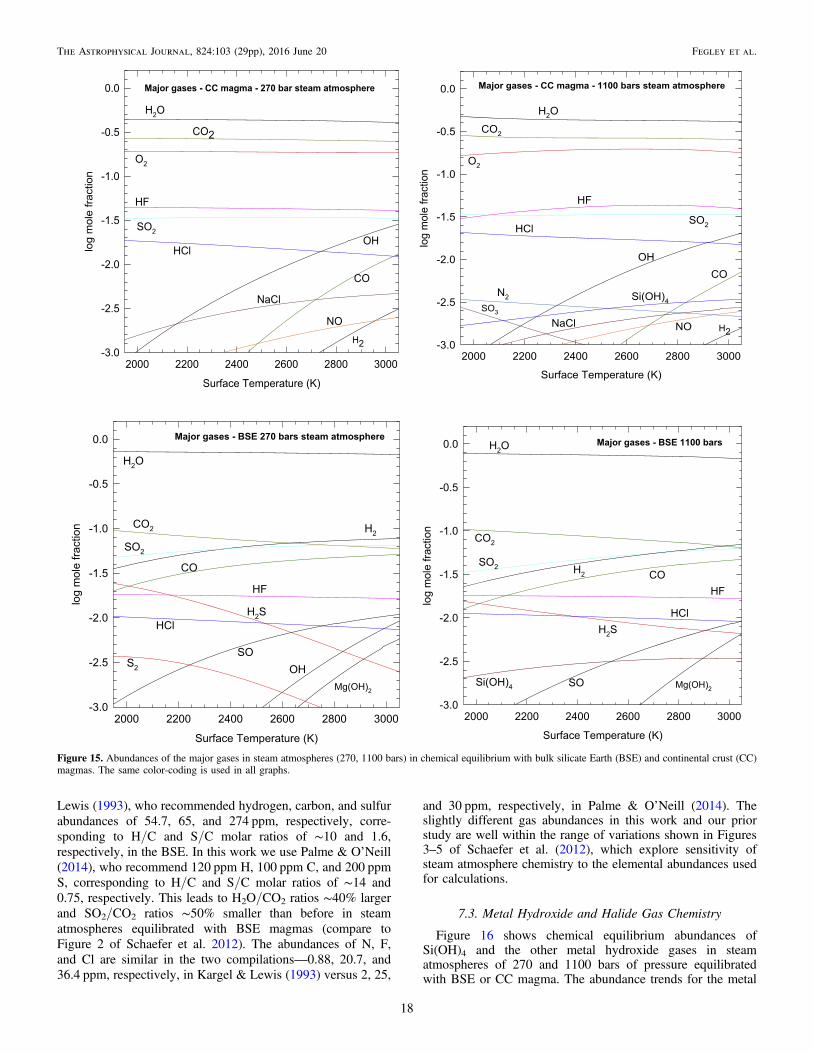
Lewis (1993), who recommended hydrogen, carbon, and sulfurabundances of 54.7, 65, and 274 ppm, respectively, corre-sponding to H/C and S/C molar ratios of ∼10 and 1.6,respectively, in the BSE. In this work we use Palme & O’Neill(2014), who recommend 120 ppm H, 100 ppm C, and 200 ppmS, corresponding to H/C and S/C molar ratios of ∼14 and0.75, respectively. This leads to H2O/CO2 ratios ∼40% largerand SO2/CO2 ratios ∼50% smaller than before in steamatmospheres equilibrated with BSE magmas (compare toFigure 2 of Schaefer et al. 2012). The abundances of N, F,and Cl are similar in the two compilations—0.88, 20.7, and36.4 ppm, respectively, in Kargel & Lewis (1993) versus 2, 25,
and 30 ppm, respectively, in Palme & O’Neill (2014). Theslightly different gas abundances in this work and our priorstudy are well within the range of variations shown in Figures3–5 of Schaefer et al. (2012), which explore sensitivity ofsteam atmosphere chemistry to the elemental abundances usedfor calculations.
7.3. Metal Hydroxide and Halide Gas Chemistry
Figure 16 shows chemical equilibrium abundances ofSi(OH)4 and the other metal hydroxide gases in steamatmospheres of 270 and 1100 bars of pressure equilibratedwith BSE or CC magma. The abundance trends for the metal
Figure 15. Abundances of the major gases in steam atmospheres (270, 1100 bars) in chemical equilibrium with bulk silicate Earth (BSE) and continental crust (CC)magmas. The same color-coding is used in all graphs.
18
The Astrophysical Journal, 824:103 (29pp), 2016 June 20 Fegley et al.
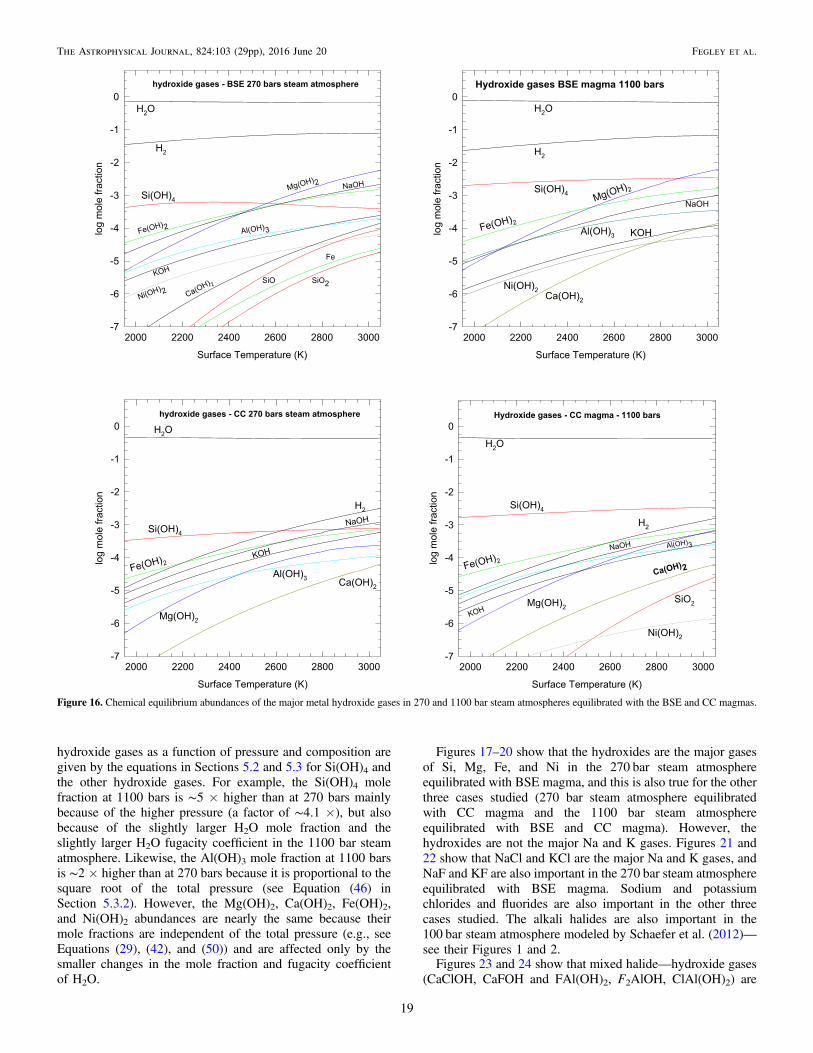
hydroxide gases as a function of pressure and composition aregiven by the equations in Sections 5.2 and 5.3 for Si(OH)4 andthe other hydroxide gases. For example, the Si(OH)4 molefraction at 1100 bars is ∼5 × higher than at 270 bars mainlybecause of the higher pressure (a factor of ∼4.1 ×), but alsobecause of the slightly larger H2O mole fraction and theslightly larger H2O fugacity coefficient in the 1100 bar steamatmosphere. Likewise, the Al(OH)3 mole fraction at 1100 barsis ∼2 × higher than at 270 bars because it is proportional to thesquare root of the total pressure (see Equation (46) inSection 5.3.2). However, the Mg(OH)2, Ca(OH)2, Fe(OH)2,and Ni(OH)2 abundances are nearly the same because theirmole fractions are independent of the total pressure (e.g., seeEquations (29), (42), and (50)) and are affected only by thesmaller changes in the mole fraction and fugacity coefficientof H2O.
Figures 17–20 show that the hydroxides are the major gasesof Si, Mg, Fe, and Ni in the 270 bar steam atmosphereequilibrated with BSE magma, and this is also true for the otherthree cases studied (270 bar steam atmosphere equilibratedwith CC magma and the 1100 bar steam atmosphereequilibrated with BSE and CC magma). However, thehydroxides are not the major Na and K gases. Figures 21 and22 show that NaCl and KCl are the major Na and K gases, andNaF and KF are also important in the 270 bar steam atmosphereequilibrated with BSE magma. Sodium and potassiumchlorides and fluorides are also important in the other threecases studied. The alkali halides are also important in the100 bar steam atmosphere modeled by Schaefer et al. (2012)—see their Figures 1 and 2.Figures 23 and 24 show that mixed halide—hydroxide gases
(CaClOH, CaFOH and FAl(OH)2, F2AlOH, ClAl(OH)2) are
Figure 16. Chemical equilibrium abundances of the major metal hydroxide gases in 270 and 1100 bar steam atmospheres equilibrated with the BSE and CC magmas.
19
The Astrophysical Journal, 824:103 (29pp), 2016 June 20 Fegley et al.
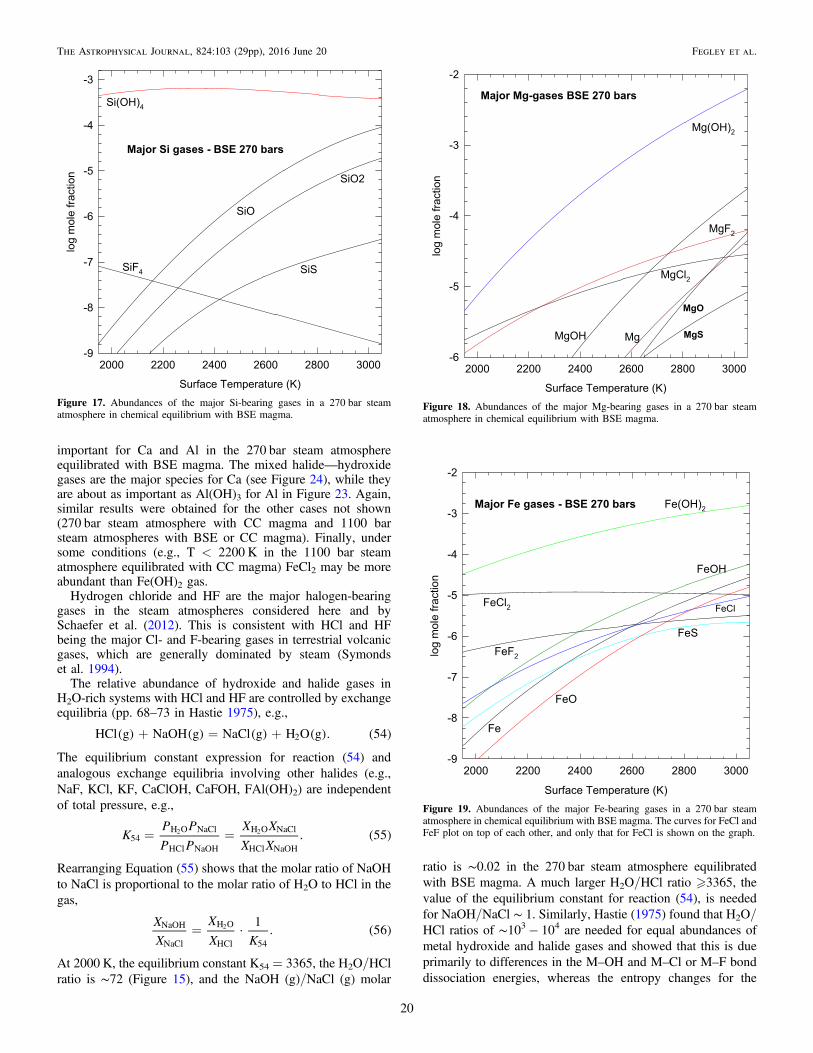
important for Ca and Al in the 270 bar steam atmosphereequilibrated with BSE magma. The mixed halide—hydroxidegases are the major species for Ca (see Figure 24), while theyare about as important as Al(OH)3 for Al in Figure 23. Again,similar results were obtained for the other cases not shown(270 bar steam atmosphere with CC magma and 1100 barsteam atmospheres with BSE or CC magma). Finally, undersome conditions (e.g., T < 2200 K in the 1100 bar steamatmosphere equilibrated with CC magma) FeCl2 may be moreabundant than Fe(OH)2 gas.
Hydrogen chloride and HF are the major halogen-bearinggases in the steam atmospheres considered here and bySchaefer et al. (2012). This is consistent with HCl and HFbeing the major Cl- and F-bearing gases in terrestrial volcanicgases, which are generally dominated by steam (Symondset al. 1994).
The relative abundance of hydroxide and halide gases inH2O-rich systems with HCl and HF are controlled by exchangeequilibria (pp. 68–73 in Hastie 1975), e.g.,
( ) ( ) ( ) ( ) ( )+ = +HCl g NaOH g NaCl g H O g . 542
The equilibrium constant expression for reaction (54) andanalogous exchange equilibria involving other halides (e.g.,NaF, KCl, KF, CaClOH, CaFOH, FAl(OH)2) are independentof total pressure, e.g.,
( )= =KP P
P P
X X
X X. 5554
H O NaCl
HCl NaOH
H O NaCl
HCl NaOH
2 2
Rearranging Equation (55) shows that the molar ratio of NaOHto NaCl is proportional to the molar ratio of H2O to HCl in thegas,
· ( )=X
X
X
X K
1. 56NaOH
NaCl
H O
HCl 54
2
At 2000 K, the equilibrium constant K54 = 3365, the H2O/HClratio is ∼72 (Figure 15), and the NaOH (g)/NaCl (g) molar
ratio is ∼0.02 in the 270 bar steam atmosphere equilibratedwith BSE magma. A much larger H2O/HCl ratio �3365, thevalue of the equilibrium constant for reaction (54), is neededfor NaOH/NaCl ∼ 1. Similarly, Hastie (1975) found that H2O/HCl ratios of ∼103− 104 are needed for equal abundances ofmetal hydroxide and halide gases and showed that this is dueprimarily to differences in the M–OH and M–Cl or M–F bonddissociation energies, whereas the entropy changes for the
Figure 17. Abundances of the major Si-bearing gases in a 270 bar steamatmosphere in chemical equilibrium with BSE magma.
Figure 18. Abundances of the major Mg-bearing gases in a 270 bar steamatmosphere in chemical equilibrium with BSE magma.
Figure 19. Abundances of the major Fe-bearing gases in a 270 bar steamatmosphere in chemical equilibrium with BSE magma. The curves for FeCl andFeF plot on top of each other, and only that for FeCl is shown on the graph.
20
The Astrophysical Journal, 824:103 (29pp), 2016 June 20 Fegley et al.
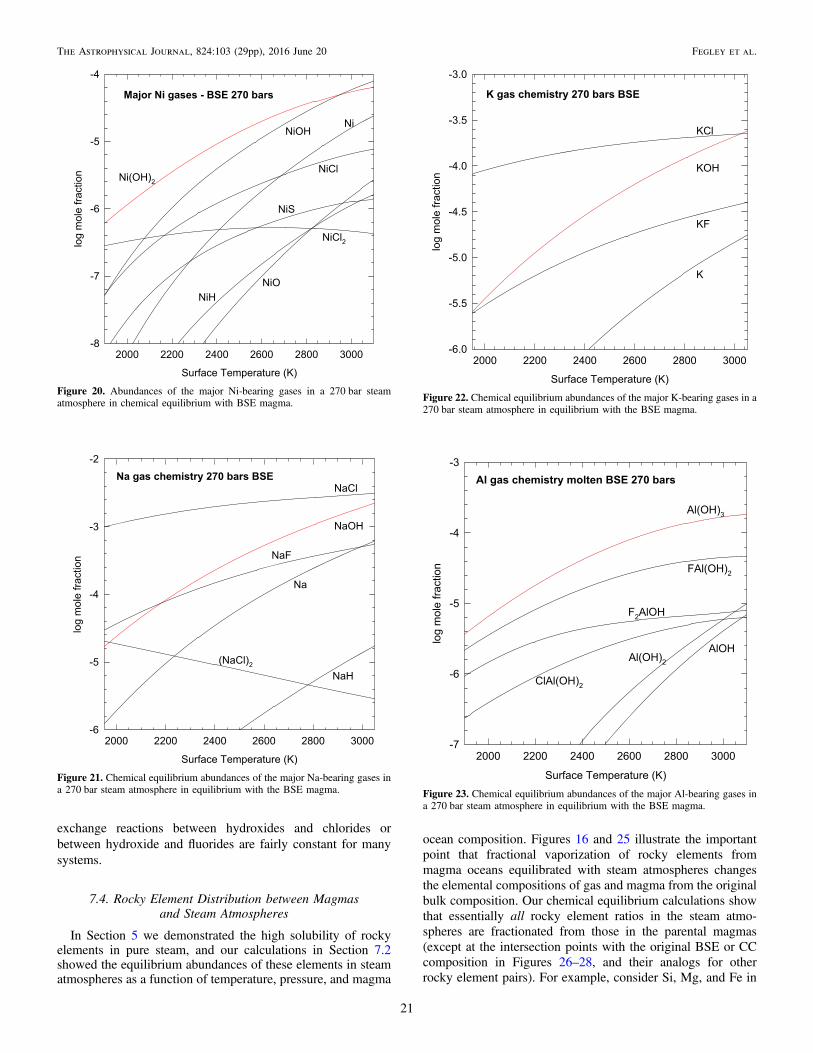
exchange reactions between hydroxides and chlorides orbetween hydroxide and fluorides are fairly constant for manysystems.
7.4. Rocky Element Distribution between Magmasand Steam Atmospheres
In Section 5 we demonstrated the high solubility of rockyelements in pure steam, and our calculations in Section 7.2showed the equilibrium abundances of these elements in steamatmospheres as a function of temperature, pressure, and magma
ocean composition. Figures 16 and 25 illustrate the importantpoint that fractional vaporization of rocky elements frommagma oceans equilibrated with steam atmospheres changesthe elemental compositions of gas and magma from the originalbulk composition. Our chemical equilibrium calculations showthat essentially all rocky element ratios in the steam atmo-spheres are fractionated from those in the parental magmas(except at the intersection points with the original BSE or CCcomposition in Figures 26–28, and their analogs for otherrocky element pairs). For example, consider Si, Mg, and Fe in
Figure 20. Abundances of the major Ni-bearing gases in a 270 bar steamatmosphere in chemical equilibrium with BSE magma.
Figure 21. Chemical equilibrium abundances of the major Na-bearing gases ina 270 bar steam atmosphere in equilibrium with the BSE magma.
Figure 22. Chemical equilibrium abundances of the major K-bearing gases in a270 bar steam atmosphere in equilibrium with the BSE magma.
Figure 23. Chemical equilibrium abundances of the major Al-bearing gases ina 270 bar steam atmosphere in equilibrium with the BSE magma.
21
The Astrophysical Journal, 824:103 (29pp), 2016 June 20 Fegley et al.
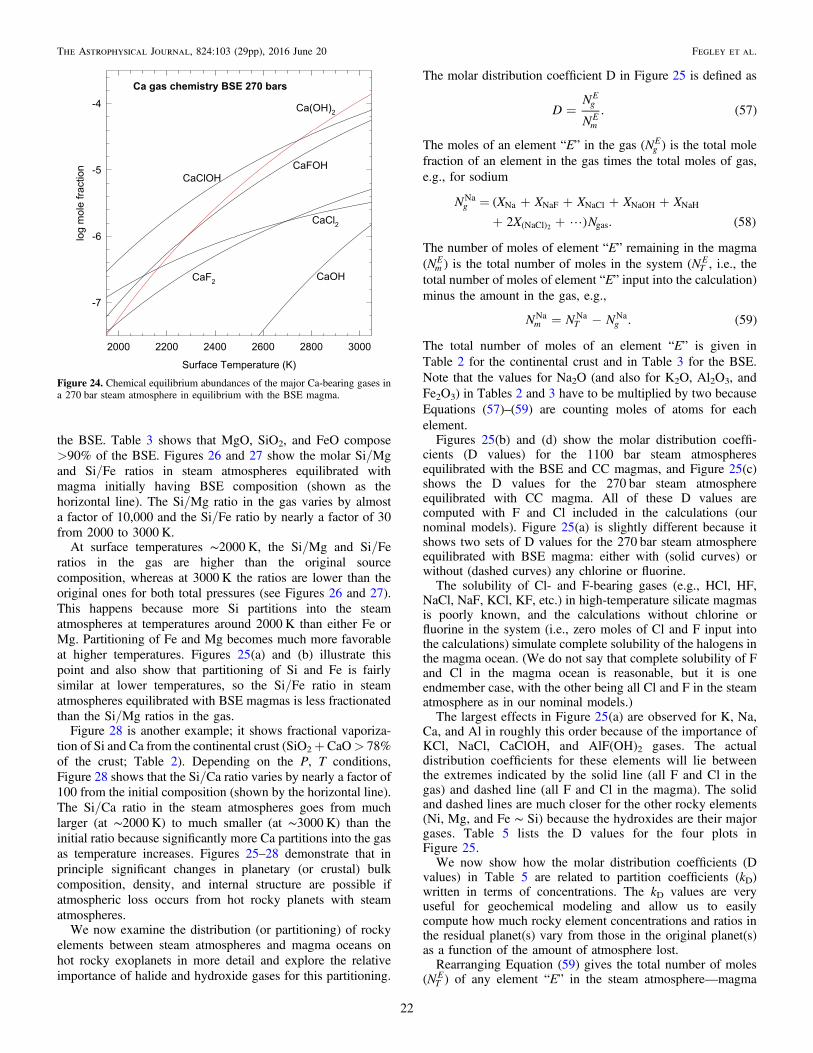
the BSE. Table 3 shows that MgO, SiO2, and FeO compose>90% of the BSE. Figures 26 and 27 show the molar Si/Mgand Si/Fe ratios in steam atmospheres equilibrated withmagma initially having BSE composition (shown as thehorizontal line). The Si/Mg ratio in the gas varies by almosta factor of 10,000 and the Si/Fe ratio by nearly a factor of 30from 2000 to 3000 K.
At surface temperatures ∼2000 K, the Si/Mg and Si/Feratios in the gas are higher than the original sourcecomposition, whereas at 3000 K the ratios are lower than theoriginal ones for both total pressures (see Figures 26 and 27).This happens because more Si partitions into the steamatmospheres at temperatures around 2000 K than either Fe orMg. Partitioning of Fe and Mg becomes much more favorableat higher temperatures. Figures 25(a) and (b) illustrate thispoint and also show that partitioning of Si and Fe is fairlysimilar at lower temperatures, so the Si/Fe ratio in steamatmospheres equilibrated with BSE magmas is less fractionatedthan the Si/Mg ratios in the gas.
Figure 28 is another example; it shows fractional vaporiza-tion of Si and Ca from the continental crust (SiO2+CaO> 78%of the crust; Table 2). Depending on the P, T conditions,Figure 28 shows that the Si/Ca ratio varies by nearly a factor of100 from the initial composition (shown by the horizontal line).The Si/Ca ratio in the steam atmospheres goes from muchlarger (at ∼2000 K) to much smaller (at ∼3000 K) than theinitial ratio because significantly more Ca partitions into the gasas temperature increases. Figures 25–28 demonstrate that inprinciple significant changes in planetary (or crustal) bulkcomposition, density, and internal structure are possible ifatmospheric loss occurs from hot rocky planets with steamatmospheres.
We now examine the distribution (or partitioning) of rockyelements between steam atmospheres and magma oceans onhot rocky exoplanets in more detail and explore the relativeimportance of halide and hydroxide gases for this partitioning.
The molar distribution coefficient D in Figure 25 is defined as
( )=DN
N. 57
gE
mE
The moles of an element “E” in the gas (NgE) is the total mole
fraction of an element in the gas times the total moles of gas,e.g., for sodium
() ( )( )
= + + + +
+ + N X X X X X
X N2 . 58gNa
Na NaF NaCl NaOH NaH
NaCl gas2
The number of moles of element “E” remaining in the magma(Nm
E) is the total number of moles in the system (NTE , i.e., the
total number of moles of element “E” input into the calculation)minus the amount in the gas, e.g.,
( )= -N N N . 59m T gNa Na Na
The total number of moles of an element “E” is given inTable 2 for the continental crust and in Table 3 for the BSE.Note that the values for Na2O (and also for K2O, Al2O3, andFe2O3) in Tables 2 and 3 have to be multiplied by two becauseEquations (57)–(59) are counting moles of atoms for eachelement.Figures 25(b) and (d) show the molar distribution coeffi-
cients (D values) for the 1100 bar steam atmospheresequilibrated with the BSE and CC magmas, and Figure 25(c)shows the D values for the 270 bar steam atmosphereequilibrated with CC magma. All of these D values arecomputed with F and Cl included in the calculations (ournominal models). Figure 25(a) is slightly different because itshows two sets of D values for the 270 bar steam atmosphereequilibrated with BSE magma: either with (solid curves) orwithout (dashed curves) any chlorine or fluorine.The solubility of Cl- and F-bearing gases (e.g., HCl, HF,
NaCl, NaF, KCl, KF, etc.) in high-temperature silicate magmasis poorly known, and the calculations without chlorine orfluorine in the system (i.e., zero moles of Cl and F input intothe calculations) simulate complete solubility of the halogens inthe magma ocean. (We do not say that complete solubility of Fand Cl in the magma ocean is reasonable, but it is oneendmember case, with the other being all Cl and F in the steamatmosphere as in our nominal models.)The largest effects in Figure 25(a) are observed for K, Na,
Ca, and Al in roughly this order because of the importance ofKCl, NaCl, CaClOH, and AlF(OH)2 gases. The actualdistribution coefficients for these elements will lie betweenthe extremes indicated by the solid line (all F and Cl in thegas) and dashed line (all F and Cl in the magma). The solidand dashed lines are much closer for the other rocky elements(Ni, Mg, and Fe ∼ Si) because the hydroxides are their majorgases. Table 5 lists the D values for the four plots inFigure 25.We now show how the molar distribution coefficients (D
values) in Table 5 are related to partition coefficients (kD)written in terms of concentrations. The kD values are veryuseful for geochemical modeling and allow us to easilycompute how much rocky element concentrations and ratios inthe residual planet(s) vary from those in the original planet(s)as a function of the amount of atmosphere lost.Rearranging Equation (59) gives the total number of moles
(NTE) of any element “E” in the steam atmosphere—magma
Figure 24. Chemical equilibrium abundances of the major Ca-bearing gases ina 270 bar steam atmosphere in equilibrium with the BSE magma.
22
The Astrophysical Journal, 824:103 (29pp), 2016 June 20 Fegley et al.
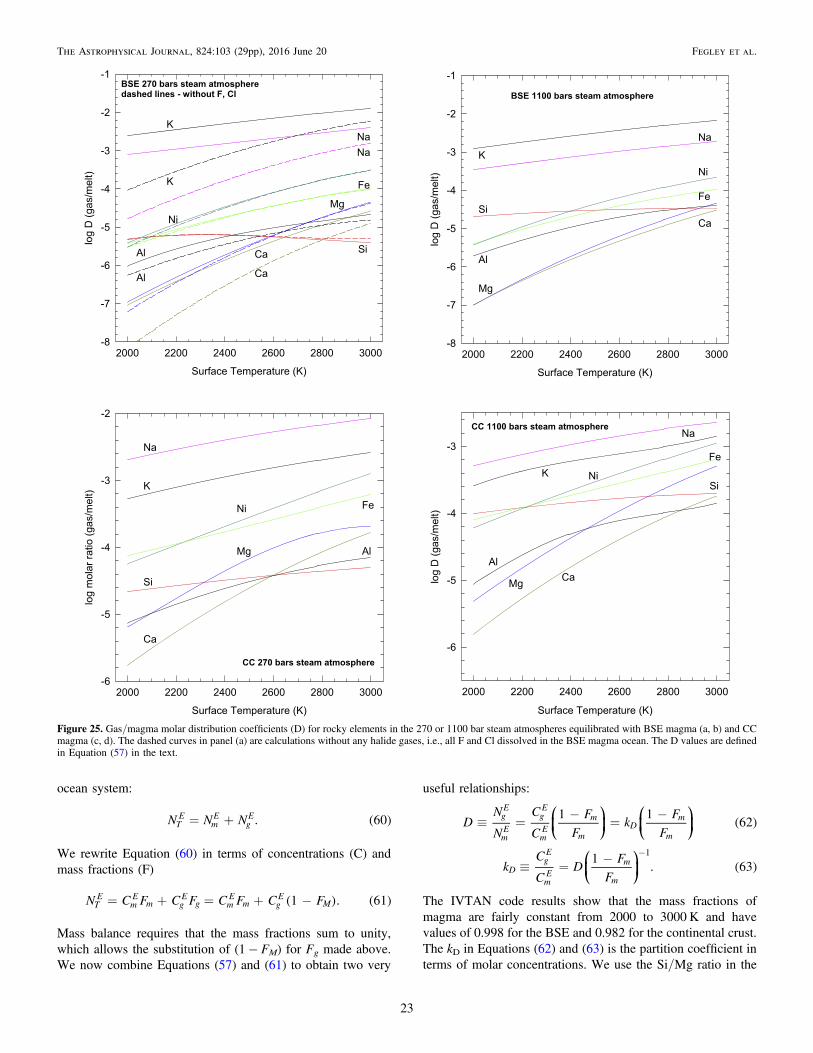
ocean system:
( )= +N N N . 60TE
mE
gE
We rewrite Equation (60) in terms of concentrations (C) andmass fractions (F)
( ) ( )= + = + -N C F C F C F C F1 . 61TE
mE
m gE
g mE
m gE
M
Mass balance requires that the mass fractions sum to unity,which allows the substitution of (1− FM) for Fg made above.We now combine Equations (57) and (61) to obtain two very
useful relationships:
( )º =-
=-⎛
⎝⎜⎞⎠⎟
⎛⎝⎜
⎞⎠⎟D
N
N
C
C
F
Fk
F
F
1 162
gE
mE
gE
mE
m
mD
m
m
( )º =- -⎛
⎝⎜⎞⎠⎟k
C
CD
F
F
1. 63D
gE
mE
m
m
1
The IVTAN code results show that the mass fractions ofmagma are fairly constant from 2000 to 3000 K and havevalues of 0.998 for the BSE and 0.982 for the continental crust.The kD in Equations (62) and (63) is the partition coefficient interms of molar concentrations. We use the Si/Mg ratio in the
Figure 25. Gas/magma molar distribution coefficients (D) for rocky elements in the 270 or 1100 bar steam atmospheres equilibrated with BSE magma (a, b) and CCmagma (c, d). The dashed curves in panel (a) are calculations without any halide gases, i.e., all F and Cl dissolved in the BSE magma ocean. The D values are definedin Equation (57) in the text.
23
The Astrophysical Journal, 824:103 (29pp), 2016 June 20 Fegley et al.
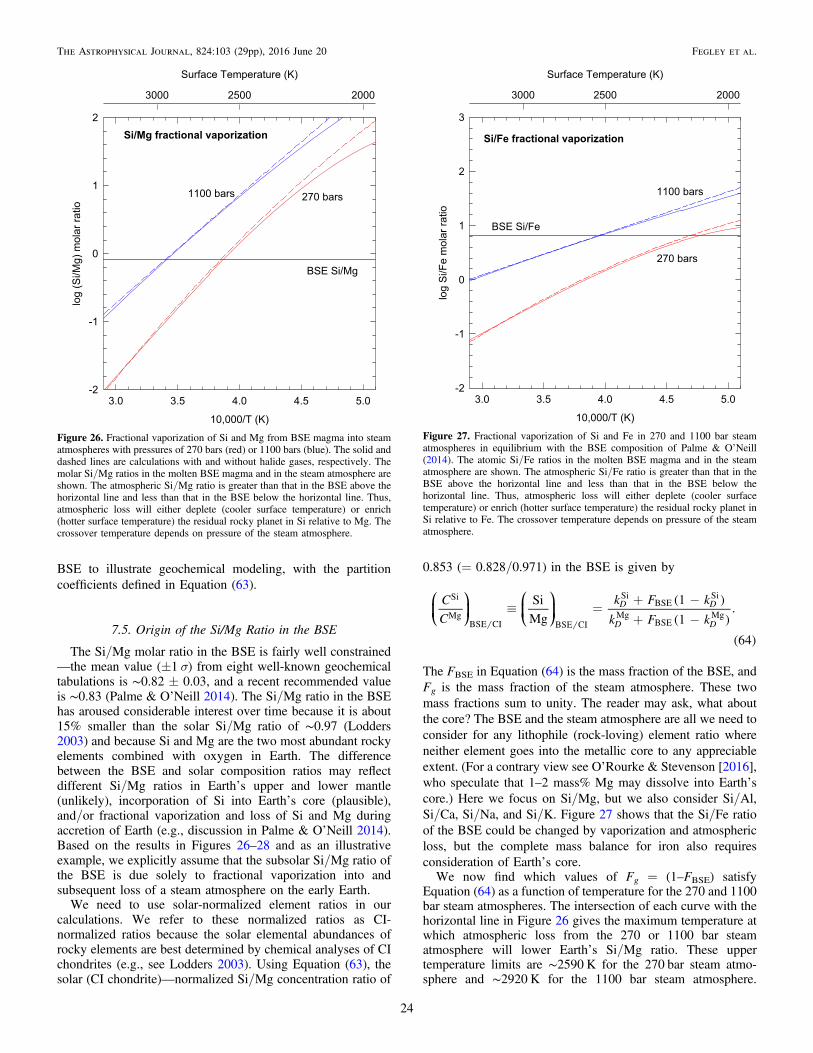
BSE to illustrate geochemical modeling, with the partitioncoefficients defined in Equation (63).
7.5. Origin of the Si/Mg Ratio in the BSE
The Si/Mg molar ratio in the BSE is fairly well constrained—the mean value (±1 σ) from eight well-known geochemicaltabulations is ∼0.82 ± 0.03, and a recent recommended valueis ∼0.83 (Palme & O’Neill 2014). The Si/Mg ratio in the BSEhas aroused considerable interest over time because it is about15% smaller than the solar Si/Mg ratio of ∼0.97 (Lodders2003) and because Si and Mg are the two most abundant rockyelements combined with oxygen in Earth. The differencebetween the BSE and solar composition ratios may reflectdifferent Si/Mg ratios in Earthʼs upper and lower mantle(unlikely), incorporation of Si into Earthʼs core (plausible),and/or fractional vaporization and loss of Si and Mg duringaccretion of Earth (e.g., discussion in Palme & O’Neill 2014).Based on the results in Figures 26–28 and as an illustrativeexample, we explicitly assume that the subsolar Si/Mg ratio ofthe BSE is due solely to fractional vaporization into andsubsequent loss of a steam atmosphere on the early Earth.
We need to use solar-normalized element ratios in ourcalculations. We refer to these normalized ratios as CI-normalized ratios because the solar elemental abundances ofrocky elements are best determined by chemical analyses of CIchondrites (e.g., see Lodders 2003). Using Equation (63), thesolar (CI chondrite)—normalized Si/Mg concentration ratio of
0.853 (= 0.828/0.971) in the BSE is given by
( )( )
( )
º =+ -+ -
⎛⎝⎜
⎞⎠⎟
⎛⎝⎜
⎞⎠⎟
C
C
k F k
k F k
Si
Mg
1
1.
64
D D
D D
Si
MgBSE CI BSE CI
SiBSE
Si
MgBSE
Mg
The FBSE in Equation (64) is the mass fraction of the BSE, andFg is the mass fraction of the steam atmosphere. These twomass fractions sum to unity. The reader may ask, what aboutthe core? The BSE and the steam atmosphere are all we need toconsider for any lithophile (rock-loving) element ratio whereneither element goes into the metallic core to any appreciableextent. (For a contrary view see O’Rourke & Stevenson [2016],who speculate that 1–2 mass% Mg may dissolve into Earthʼscore.) Here we focus on Si/Mg, but we also consider Si/Al,Si/Ca, Si/Na, and Si/K. Figure 27 shows that the Si/Fe ratioof the BSE could be changed by vaporization and atmosphericloss, but the complete mass balance for iron also requiresconsideration of Earthʼs core.We now find which values of Fg = (1–FBSE) satisfy
Equation (64) as a function of temperature for the 270 and 1100bar steam atmospheres. The intersection of each curve with thehorizontal line in Figure 26 gives the maximum temperature atwhich atmospheric loss from the 270 or 1100 bar steamatmosphere will lower Earthʼs Si/Mg ratio. These uppertemperature limits are ∼2590 K for the 270 bar steam atmo-sphere and ∼2920 K for the 1100 bar steam atmosphere.
Figure 26. Fractional vaporization of Si and Mg from BSE magma into steamatmospheres with pressures of 270 bars (red) or 1100 bars (blue). The solid anddashed lines are calculations with and without halide gases, respectively. Themolar Si/Mg ratios in the molten BSE magma and in the steam atmosphere areshown. The atmospheric Si/Mg ratio is greater than that in the BSE above thehorizontal line and less than that in the BSE below the horizontal line. Thus,atmospheric loss will either deplete (cooler surface temperature) or enrich(hotter surface temperature) the residual rocky planet in Si relative to Mg. Thecrossover temperature depends on pressure of the steam atmosphere.
Figure 27. Fractional vaporization of Si and Fe in 270 and 1100 bar steamatmospheres in equilibrium with the BSE composition of Palme & O’Neill(2014). The atomic Si/Fe ratios in the molten BSE magma and in the steamatmosphere are shown. The atmospheric Si/Fe ratio is greater than that in theBSE above the horizontal line and less than that in the BSE below thehorizontal line. Thus, atmospheric loss will either deplete (cooler surfacetemperature) or enrich (hotter surface temperature) the residual rocky planet inSi relative to Fe. The crossover temperature depends on pressure of the steamatmosphere.
24
The Astrophysical Journal, 824:103 (29pp), 2016 June 20 Fegley et al.
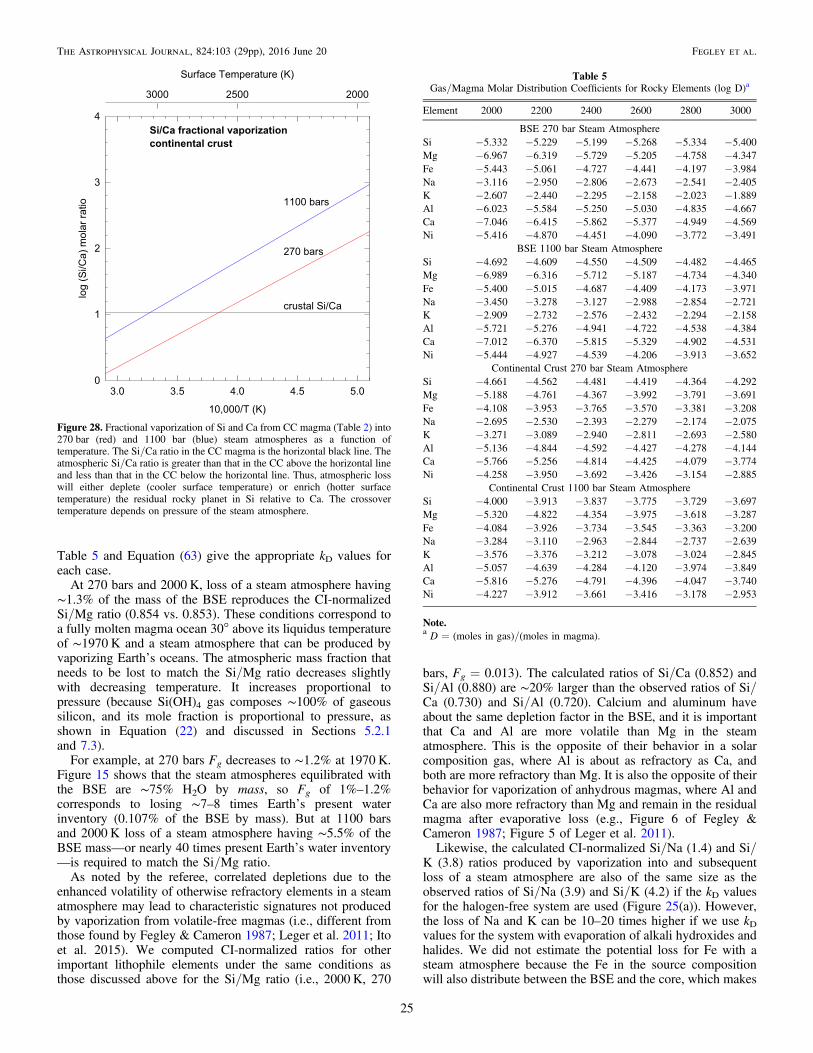
Table 5 and Equation (63) give the appropriate kD values foreach case.
At 270 bars and 2000 K, loss of a steam atmosphere having∼1.3% of the mass of the BSE reproduces the CI-normalizedSi/Mg ratio (0.854 vs. 0.853). These conditions correspond toa fully molten magma ocean 30° above its liquidus temperatureof ∼1970 K and a steam atmosphere that can be produced byvaporizing Earthʼs oceans. The atmospheric mass fraction thatneeds to be lost to match the Si/Mg ratio decreases slightlywith decreasing temperature. It increases proportional topressure (because Si(OH)4 gas composes ∼100% of gaseoussilicon, and its mole fraction is proportional to pressure, asshown in Equation (22) and discussed in Sections 5.2.1and 7.3).
For example, at 270 bars Fg decreases to ∼1.2% at 1970 K.Figure 15 shows that the steam atmospheres equilibrated withthe BSE are ∼75% H2O by mass, so Fg of 1%–1.2%corresponds to losing ∼7–8 times Earthʼs present waterinventory (0.107% of the BSE by mass). But at 1100 barsand 2000 K loss of a steam atmosphere having ∼5.5% of theBSE mass—or nearly 40 times present Earthʼs water inventory—is required to match the Si/Mg ratio.
As noted by the referee, correlated depletions due to theenhanced volatility of otherwise refractory elements in a steamatmosphere may lead to characteristic signatures not producedby vaporization from volatile-free magmas (i.e., different fromthose found by Fegley & Cameron 1987; Leger et al. 2011; Itoet al. 2015). We computed CI-normalized ratios for otherimportant lithophile elements under the same conditions asthose discussed above for the Si/Mg ratio (i.e., 2000 K, 270
bars, Fg = 0.013). The calculated ratios of Si/Ca (0.852) andSi/Al (0.880) are ∼20% larger than the observed ratios of Si/Ca (0.730) and Si/Al (0.720). Calcium and aluminum haveabout the same depletion factor in the BSE, and it is importantthat Ca and Al are more volatile than Mg in the steamatmosphere. This is the opposite of their behavior in a solarcomposition gas, where Al is about as refractory as Ca, andboth are more refractory than Mg. It is also the opposite of theirbehavior for vaporization of anhydrous magmas, where Al andCa are also more refractory than Mg and remain in the residualmagma after evaporative loss (e.g., Figure 6 of Fegley &Cameron 1987; Figure 5 of Leger et al. 2011).Likewise, the calculated CI-normalized Si/Na (1.4) and Si/
K (3.8) ratios produced by vaporization into and subsequentloss of a steam atmosphere are also of the same size as theobserved ratios of Si/Na (3.9) and Si/K (4.2) if the kD valuesfor the halogen-free system are used (Figure 25(a)). However,the loss of Na and K can be 10–20 times higher if we use kDvalues for the system with evaporation of alkali hydroxides andhalides. We did not estimate the potential loss for Fe with asteam atmosphere because the Fe in the source compositionwill also distribute between the BSE and the core, which makes
Figure 28. Fractional vaporization of Si and Ca from CC magma (Table 2) into270 bar (red) and 1100 bar (blue) steam atmospheres as a function oftemperature. The Si/Ca ratio in the CC magma is the horizontal black line. Theatmospheric Si/Ca ratio is greater than that in the CC above the horizontal lineand less than that in the CC below the horizontal line. Thus, atmospheric losswill either deplete (cooler surface temperature) or enrich (hotter surfacetemperature) the residual rocky planet in Si relative to Ca. The crossovertemperature depends on pressure of the steam atmosphere.
Table 5Gas/Magma Molar Distribution Coefficients for Rocky Elements (log D)a
Element 2000 2200 2400 2600 2800 3000
BSE 270 bar Steam AtmosphereSi −5.332 −5.229 −5.199 −5.268 −5.334 −5.400Mg −6.967 −6.319 −5.729 −5.205 −4.758 −4.347Fe −5.443 −5.061 −4.727 −4.441 −4.197 −3.984Na −3.116 −2.950 −2.806 −2.673 −2.541 −2.405K −2.607 −2.440 −2.295 −2.158 −2.023 −1.889Al −6.023 −5.584 −5.250 −5.030 −4.835 −4.667Ca −7.046 −6.415 −5.862 −5.377 −4.949 −4.569Ni −5.416 −4.870 −4.451 −4.090 −3.772 −3.491
BSE 1100 bar Steam AtmosphereSi −4.692 −4.609 −4.550 −4.509 −4.482 −4.465Mg −6.989 −6.316 −5.712 −5.187 −4.734 −4.340Fe −5.400 −5.015 −4.687 −4.409 −4.173 −3.971Na −3.450 −3.278 −3.127 −2.988 −2.854 −2.721K −2.909 −2.732 −2.576 −2.432 −2.294 −2.158Al −5.721 −5.276 −4.941 −4.722 −4.538 −4.384Ca −7.012 −6.370 −5.815 −5.329 −4.902 −4.531Ni −5.444 −4.927 −4.539 −4.206 −3.913 −3.652
Continental Crust 270 bar Steam AtmosphereSi −4.661 −4.562 −4.481 −4.419 −4.364 −4.292Mg −5.188 −4.761 −4.367 −3.992 −3.791 −3.691Fe −4.108 −3.953 −3.765 −3.570 −3.381 −3.208Na −2.695 −2.530 −2.393 −2.279 −2.174 −2.075K −3.271 −3.089 −2.940 −2.811 −2.693 −2.580Al −5.136 −4.844 −4.592 −4.427 −4.278 −4.144Ca −5.766 −5.256 −4.814 −4.425 −4.079 −3.774Ni −4.258 −3.950 −3.692 −3.426 −3.154 −2.885
Continental Crust 1100 bar Steam AtmosphereSi −4.000 −3.913 −3.837 −3.775 −3.729 −3.697Mg −5.320 −4.822 −4.354 −3.975 −3.618 −3.287Fe −4.084 −3.926 −3.734 −3.545 −3.363 −3.200Na −3.284 −3.110 −2.963 −2.844 −2.737 −2.639K −3.576 −3.376 −3.212 −3.078 −3.024 −2.845Al −5.057 −4.639 −4.284 −4.120 −3.974 −3.849Ca −5.816 −5.276 −4.791 −4.396 −4.047 −3.740Ni −4.227 −3.912 −3.661 −3.416 −3.178 −2.953
Note.a D = (moles in gas)/(moles in magma).
25
The Astrophysical Journal, 824:103 (29pp), 2016 June 20 Fegley et al.
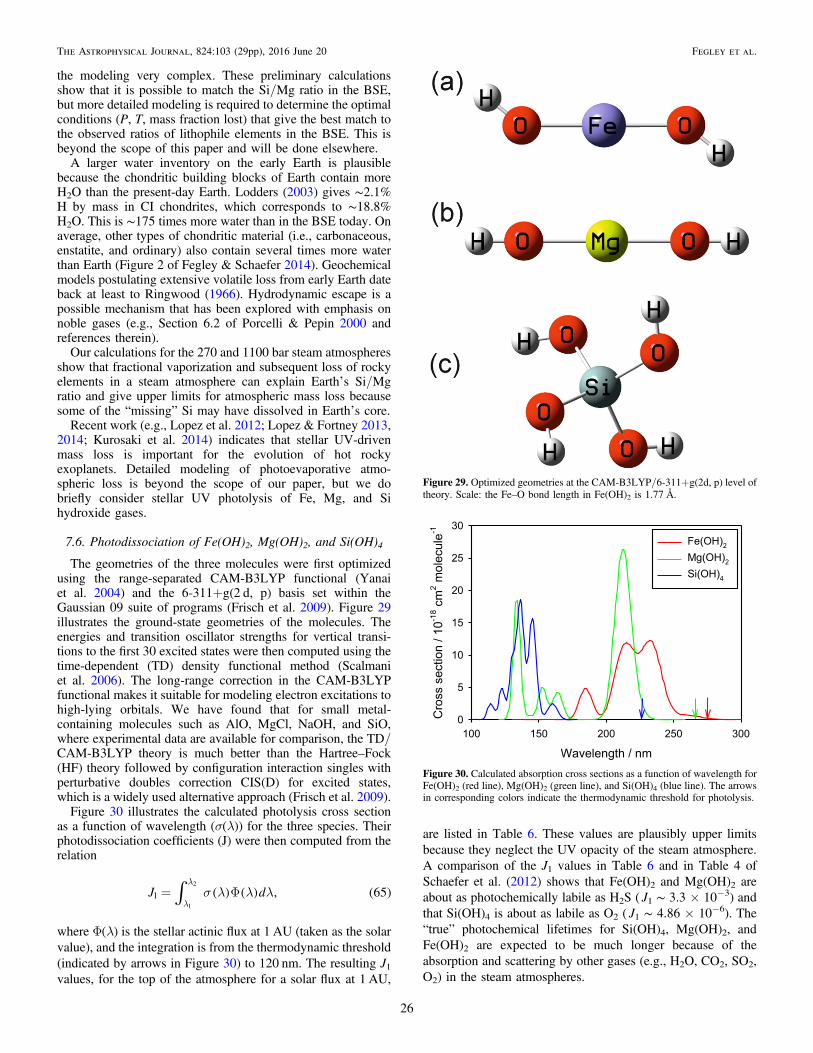
the modeling very complex. These preliminary calculationsshow that it is possible to match the Si/Mg ratio in the BSE,but more detailed modeling is required to determine the optimalconditions (P, T, mass fraction lost) that give the best match tothe observed ratios of lithophile elements in the BSE. This isbeyond the scope of this paper and will be done elsewhere.
A larger water inventory on the early Earth is plausiblebecause the chondritic building blocks of Earth contain moreH2O than the present-day Earth. Lodders (2003) gives ∼2.1%H by mass in CI chondrites, which corresponds to ∼18.8%H2O. This is ∼175 times more water than in the BSE today. Onaverage, other types of chondritic material (i.e., carbonaceous,enstatite, and ordinary) also contain several times more waterthan Earth (Figure 2 of Fegley & Schaefer 2014). Geochemicalmodels postulating extensive volatile loss from early Earth dateback at least to Ringwood (1966). Hydrodynamic escape is apossible mechanism that has been explored with emphasis onnoble gases (e.g., Section 6.2 of Porcelli & Pepin 2000 andreferences therein).
Our calculations for the 270 and 1100 bar steam atmospheresshow that fractional vaporization and subsequent loss of rockyelements in a steam atmosphere can explain Earthʼs Si/Mgratio and give upper limits for atmospheric mass loss becausesome of the “missing” Si may have dissolved in Earthʼs core.
Recent work (e.g., Lopez et al. 2012; Lopez & Fortney 2013,2014; Kurosaki et al. 2014) indicates that stellar UV-drivenmass loss is important for the evolution of hot rockyexoplanets. Detailed modeling of photoevaporative atmo-spheric loss is beyond the scope of our paper, but we dobriefly consider stellar UV photolysis of Fe, Mg, and Sihydroxide gases.
7.6. Photodissociation of Fe(OH)2, Mg(OH)2, and Si(OH)4
The geometries of the three molecules were first optimizedusing the range-separated CAM-B3LYP functional (Yanaiet al. 2004) and the 6-311+g(2 d, p) basis set within theGaussian 09 suite of programs (Frisch et al. 2009). Figure 29illustrates the ground-state geometries of the molecules. Theenergies and transition oscillator strengths for vertical transi-tions to the first 30 excited states were then computed using thetime-dependent (TD) density functional method (Scalmaniet al. 2006). The long-range correction in the CAM-B3LYPfunctional makes it suitable for modeling electron excitations tohigh-lying orbitals. We have found that for small metal-containing molecules such as AlO, MgCl, NaOH, and SiO,where experimental data are available for comparison, the TD/CAM-B3LYP theory is much better than the Hartree–Fock(HF) theory followed by configuration interaction singles withperturbative doubles correction CIS(D) for excited states,which is a widely used alternative approach (Frisch et al. 2009).
Figure 30 illustrates the calculated photolysis cross sectionas a function of wavelength (σ(λ)) for the three species. Theirphotodissociation coefficients (J) were then computed from therelation
( ) ( ) ( )ò s l l l= Fl
lJ d , 651
1
2
where Φ(λ) is the stellar actinic flux at 1 AU (taken as the solarvalue), and the integration is from the thermodynamic threshold(indicated by arrows in Figure 30) to 120 nm. The resulting J1values, for the top of the atmosphere for a solar flux at 1 AU,
are listed in Table 6. These values are plausibly upper limitsbecause they neglect the UV opacity of the steam atmosphere.A comparison of the J1 values in Table 6 and in Table 4 ofSchaefer et al. (2012) shows that Fe(OH)2 and Mg(OH)2 areabout as photochemically labile as H2S ( J1 ∼ 3.3 × 10⁻³) andthat Si(OH)4 is about as labile as O2 ( J1 ∼ 4.86 × 10⁻⁶). The“true” photochemical lifetimes for Si(OH)4, Mg(OH)2, andFe(OH)2 are expected to be much longer because of theabsorption and scattering by other gases (e.g., H2O, CO2, SO2,O2) in the steam atmospheres.
Figure 29. Optimized geometries at the CAM-B3LYP/6-311+g(2d, p) level oftheory. Scale: the Fe–O bond length in Fe(OH)2 is 1.77 Å.
Figure 30. Calculated absorption cross sections as a function of wavelength forFe(OH)2 (red line), Mg(OH)2 (green line), and Si(OH)4 (blue line). The arrowsin corresponding colors indicate the thermodynamic threshold for photolysis.
26
The Astrophysical Journal, 824:103 (29pp), 2016 June 20 Fegley et al.
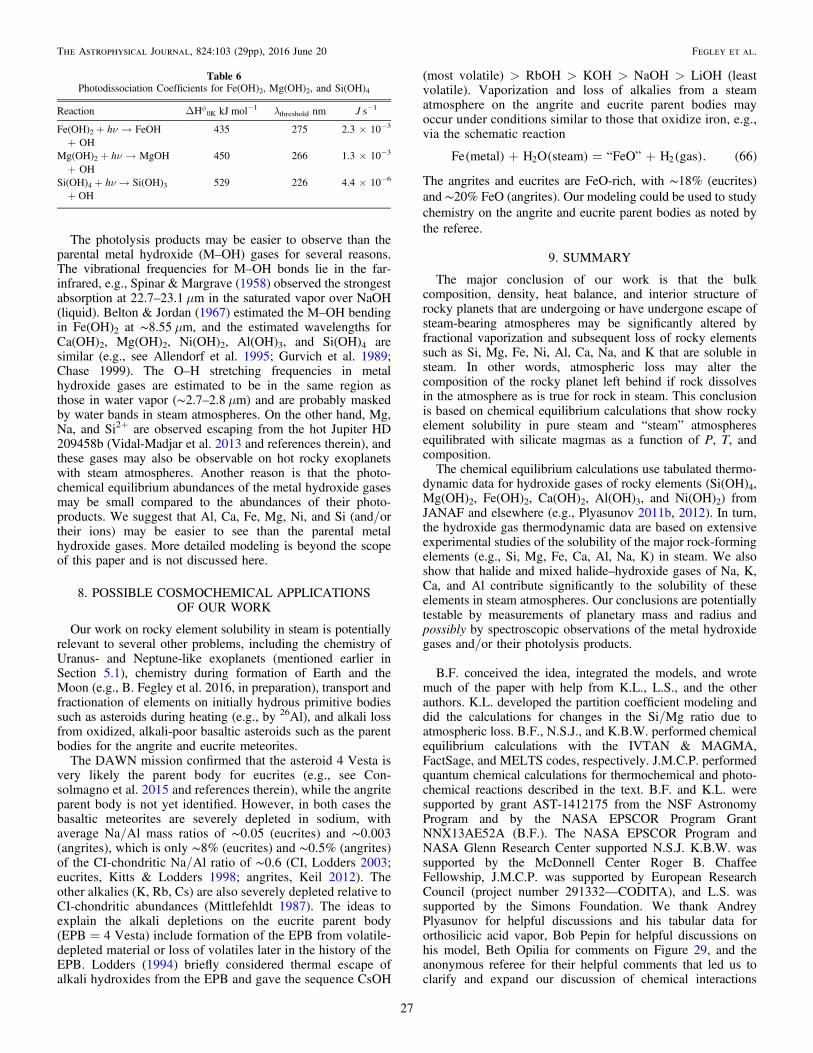
The photolysis products may be easier to observe than theparental metal hydroxide (M–OH) gases for several reasons.The vibrational frequencies for M–OH bonds lie in the far-infrared, e.g., Spinar & Margrave (1958) observed the strongestabsorption at 22.7–23.1 μm in the saturated vapor over NaOH(liquid). Belton & Jordan (1967) estimated the M–OH bendingin Fe(OH)2 at ∼8.55 μm, and the estimated wavelengths forCa(OH)2, Mg(OH)2, Ni(OH)2, Al(OH)3, and Si(OH)4 aresimilar (e.g., see Allendorf et al. 1995; Gurvich et al. 1989;Chase 1999). The O–H stretching frequencies in metalhydroxide gases are estimated to be in the same region asthose in water vapor (∼2.7–2.8 μm) and are probably maskedby water bands in steam atmospheres. On the other hand, Mg,Na, and Si2+ are observed escaping from the hot Jupiter HD209458b (Vidal-Madjar et al. 2013 and references therein), andthese gases may also be observable on hot rocky exoplanetswith steam atmospheres. Another reason is that the photo-chemical equilibrium abundances of the metal hydroxide gasesmay be small compared to the abundances of their photo-products. We suggest that Al, Ca, Fe, Mg, Ni, and Si (and/ortheir ions) may be easier to see than the parental metalhydroxide gases. More detailed modeling is beyond the scopeof this paper and is not discussed here.
8. POSSIBLE COSMOCHEMICAL APPLICATIONSOF OUR WORK
Our work on rocky element solubility in steam is potentiallyrelevant to several other problems, including the chemistry ofUranus- and Neptune-like exoplanets (mentioned earlier inSection 5.1), chemistry during formation of Earth and theMoon (e.g., B. Fegley et al. 2016, in preparation), transport andfractionation of elements on initially hydrous primitive bodiessuch as asteroids during heating (e.g., by 26Al), and alkali lossfrom oxidized, alkali-poor basaltic asteroids such as the parentbodies for the angrite and eucrite meteorites.
The DAWN mission confirmed that the asteroid 4 Vesta isvery likely the parent body for eucrites (e.g., see Con-solmagno et al. 2015 and references therein), while the angriteparent body is not yet identified. However, in both cases thebasaltic meteorites are severely depleted in sodium, withaverage Na/Al mass ratios of ∼0.05 (eucrites) and ∼0.003(angrites), which is only ∼8% (eucrites) and ∼0.5% (angrites)of the CI-chondritic Na/Al ratio of ∼0.6 (CI, Lodders 2003;eucrites, Kitts & Lodders 1998; angrites, Keil 2012). Theother alkalies (K, Rb, Cs) are also severely depleted relative toCI-chondritic abundances (Mittlefehldt 1987). The ideas toexplain the alkali depletions on the eucrite parent body(EPB = 4 Vesta) include formation of the EPB from volatile-depleted material or loss of volatiles later in the history of theEPB. Lodders (1994) briefly considered thermal escape ofalkali hydroxides from the EPB and gave the sequence CsOH
(most volatile) > RbOH > KOH > NaOH > LiOH (leastvolatile). Vaporization and loss of alkalies from a steamatmosphere on the angrite and eucrite parent bodies mayoccur under conditions similar to those that oxidize iron, e.g.,via the schematic reaction
( ) ( ) ( ) ( )+ = +Fe metal H O steam “FeO” H gas . 662 2
The angrites and eucrites are FeO-rich, with ∼18% (eucrites)and ∼20% FeO (angrites). Our modeling could be used to studychemistry on the angrite and eucrite parent bodies as noted bythe referee.
9. SUMMARY
The major conclusion of our work is that the bulkcomposition, density, heat balance, and interior structure ofrocky planets that are undergoing or have undergone escape ofsteam-bearing atmospheres may be significantly altered byfractional vaporization and subsequent loss of rocky elementssuch as Si, Mg, Fe, Ni, Al, Ca, Na, and K that are soluble insteam. In other words, atmospheric loss may alter thecomposition of the rocky planet left behind if rock dissolvesin the atmosphere as is true for rock in steam. This conclusionis based on chemical equilibrium calculations that show rockyelement solubility in pure steam and “steam” atmospheresequilibrated with silicate magmas as a function of P, T, andcomposition.The chemical equilibrium calculations use tabulated thermo-
dynamic data for hydroxide gases of rocky elements (Si(OH)4,Mg(OH)2, Fe(OH)2, Ca(OH)2, Al(OH)3, and Ni(OH)2) fromJANAF and elsewhere (e.g., Plyasunov 2011b, 2012). In turn,the hydroxide gas thermodynamic data are based on extensiveexperimental studies of the solubility of the major rock-formingelements (e.g., Si, Mg, Fe, Ca, Al, Na, K) in steam. We alsoshow that halide and mixed halide–hydroxide gases of Na, K,Ca, and Al contribute significantly to the solubility of theseelements in steam atmospheres. Our conclusions are potentiallytestable by measurements of planetary mass and radius andpossibly by spectroscopic observations of the metal hydroxidegases and/or their photolysis products.
B.F. conceived the idea, integrated the models, and wrotemuch of the paper with help from K.L., L.S., and the otherauthors. K.L. developed the partition coefficient modeling anddid the calculations for changes in the Si/Mg ratio due toatmospheric loss. B.F., N.S.J., and K.B.W. performed chemicalequilibrium calculations with the IVTAN & MAGMA,FactSage, and MELTS codes, respectively. J.M.C.P. performedquantum chemical calculations for thermochemical and photo-chemical reactions described in the text. B.F. and K.L. weresupported by grant AST-1412175 from the NSF AstronomyProgram and by the NASA EPSCOR Program GrantNNX13AE52A (B.F.). The NASA EPSCOR Program andNASA Glenn Research Center supported N.S.J. K.B.W. wassupported by the McDonnell Center Roger B. ChaffeeFellowship, J.M.C.P. was supported by European ResearchCouncil (project number 291332—CODITA), and L.S. wassupported by the Simons Foundation. We thank AndreyPlyasunov for helpful discussions and his tabular data fororthosilicic acid vapor, Bob Pepin for helpful discussions onhis model, Beth Opilia for comments on Figure 29, and theanonymous referee for their helpful comments that led us toclarify and expand our discussion of chemical interactions
Table 6Photodissociation Coefficients for Fe(OH)2, Mg(OH)2, and Si(OH)4
Reaction D fH 0K kJ mol−1 λthreshold nm J s−1
Fe(OH)2 + hν → FeOH+ OH
435 275 2.3 × 10⁻³
Mg(OH)2 + hν → MgOH+ OH
450 266 1.3 × 10⁻³
Si(OH)4 + hν → Si(OH)3+ OH
529 226 4.4 × 10⁻⁶
27
The Astrophysical Journal, 824:103 (29pp), 2016 June 20 Fegley et al.
between steam atmospheres and magma oceans and its possibleeffects for planetary compositions.
REFERENCES
Abe, Y. 1993, Litho, 30, 223Abe, Y., & Matsui, T. 1985, in Proc. 15th Lunar Planet. Sci. Conf., 90, C545Abe, Y., & Matsui, T. 1988, JAtS, 45, 3081Ackermann, R. J., Rauh, E. G., Thorn, R. J., & Cannon, M. C. 1963, JPhCh,
67, 762Akinfiev, N. N., & Plyasunov, A. V. 2013, Fluid Phase Equil., 338, 232Alexander, C. A., Ogden, J. S., & Levy, A. 1963, JChPh, 39, 3057Allendorf, M. D., Melius, C. F., Ho, P., & Zachariah, M. R. 1995, JPhCh, 99,
15285Anderson, G. M., & Burnham, C. W. 1965, AmJS, 263, 494Antignano, A., & Manning, C. E. 2008, ChGeo, 255, 283Arrhenius, G., De, B. R., & Alfvén, H. 1974, in The Sea, Vol. 5, ed.
E. D. Goldberg (New York: Wiley-Interscience), 839Bakker, R. J. 2009, Geofluids, 9, 63Bale, C. W., Chartrand, P., Degterov, S. A., et al. 2002, CALPHAD, 26, 189Belton, G. R., & Jordan, A. S. 1967, JPhCh, 71, 4114Belton, G. R., & Richardson, F. D. 1962, Trans. Faraday Soc., 58, 1562Berman, R. G. 1988, JPet, 29, 445Berta-Thompson, Z. K., Irwin, J., Charbonneau, D., et al. 2015, Natur, 527, 204Bézos, A., & Humler, E. 2005, GeCoA, 69, 711Blander, M., & Pelton, A. D. 1984, in 2nd Int. Symp. on Metallurgical Slags
and Fluxes, ed. H. A. Fine, & D. R. Gaskell (New York: MetallurgicalSociety of AIME), 295
Blumenthal, R. N., & Whitmore, D. H. 1961, JACS, 44, 508Bockris, J. O’M., Kitchener, J. A., & Davies, A. E. 1952a, Trans Far Soc,
48, 536Bockris, J. O’M., Kitchener, J. A., Ignatowicz, S., & Tomlinson, J. W. 1948,
Far Soc Disc, 4, 265Bockris, J. O’M., Kitchener, J. A., Ignatowicz, S., & Tomlinson, J. W. 1952b,
Trans Far Soc, 48, 75Brady, E. L. 1953, JPhCh, 57, 706Brewer, L., & Mastick, D. F. 1951, JChPh, 19, 834Bureau, H., & Keppler, H. 1999, E&PSL, 165, 187Canil, D., O’Neill, H. St. C., Pearson, D. G., et al. 1994, E&PSL, 123, 205Carmichael, I. S. E., Nicholls, J., Spera, F. J., et al. 1977, RSPTA, A286, 373Chase, M. W. 1998, in, J. Phys. Chem. Ref. Data Monograph, Vol. 9, NIST-
JANAF Thermochemical Tables, (4th ed.; Washington, DC: ACS andMelville, NY: AIP)
Chervonnyi, A. D., Piven, V. A., Kashireninov, O. E., & Manelis, G. B. 1977,HTemS, 9, 99
Chizikov, D. M., Tsvetkov, Y. V., & Kazenas, E. K. 1971, Metally, 3, 55Claire, M. W., Catling, D. C., & Zahnle, K. J. 2006, Geobiology, 4, 239Consolmagno, G. J., Golabek, G. J., Turrini, D., et al. 2015, Icar, 254, 190Cruz, M. F., & Manning, C. E. 2015, CoMP, 170, 35Dressing, C., Charbonneau, D., Dumusque, X., et al. 2015, ApJ, 800, 135Drowart, J., DeMaria, G., Burns, R. P., & Inghram, M. G. 1960, JChPh,
32, 1366Elkins-Tanton, L. 2008, E&PSL, 271, 181Elliot, G. R. B. 1952, PhD thesis, University of California, BerkleyFarber, M. S., Harris, S. P., & Srivastava, R. D. 1974, CoFl, 22, 191Fegley, B., Jr. 2013, Practical Chemical Thermodynamics for Geoscientists
(Amsterdam: Elsevier)Fegley, B., Jr. 2014, Goldschmidt Abstracts, 2014, 675Fegley, B., Jr., & Cameron, A. G. W. 1987, E&PSL, 82, 207Fegley, B., Jr., & Prinn, R. G. 1986, ApJ, 307, 852Fegley, B., Jr., & Schaefer, L. 2014, in Treatise on Geochemistry, ed.
H. D. Holland, & K. K. Turekian (Amsterdam: Elsevier), 71Fei, Y. 1995, in Global Earth Physics: A Handbook of Physical Constants, ed.
T. Ahrens (Washington, DC: AGU), 29Fournier, R. O., & Potter, R. W., II 1982, GeCoA, 46, 1969Frisch, M. J., et al. 2009, Gaussian 09, Revision A.1 (Wallingford, CT:
Gaussian, Inc.)Fyfe, W. S., & Hollander, M. A. 1964, AmJS, 262, 709Gerya, T. V., Maresch, W. V., Burchard, M., et al. 2005, Eur. J. Mineral.,
17, 269Gettel, S., Charbonneau, D., Dressing, C. D., Buchhave, L. A., &
Dumusque, X. 2015, ApJ, in press (arXiv:1511.09097)Ghiorso, M. S., & Carmichael, I. S. E. 1980, CoMP, 71, 323Ghiorso, M. S., Hirschmann, M. M., Riners, P. W., & Kress, V. C., III 2002,
GGG, 3, 5Ghiorso, M. S., & Sack, R. O. 1995, CoMP, 119, 197
Goranson, R. W. 1932, AmJS, 23, 227Green, D. H. 2015, PCM, 42, 95Grimley, R. T., Burns, R. P., & Ingrham, M. G. 1961, JChPh, 35, 551Gualda, G. A. R., Ghiorso, M. S., Lemons, R. V., & Carley, T. L. 2012, JPet,
53, 875Gunnarsson, I., & Arnórsson, S. 2000, GeCoA, 64, 2295Gurvich, L. V., Iorish, V. S., Chekhovskoi, D. V., & Yungman, V. S. 1983,
IVTANTHERMO–A Thermodynamic Database and Software System forthe Personal Computer, NIST Special Database 5
Gurvich, L. V., Veyts, I. V., & Alcock, C. B. 1989, Thermodynamic Propertiesof Individual Substances, Vol. 1 (1989), Vol. 2 (1991), Vol. 3 (1994) (BocaRaton, FL: CRC Press)
Haas, H. 1972, AmMin, 57, 1375Hamano, K., Abe, Y., & Genda, H. 2013, Natur, 497, 607Hamano, K., Kawahara, H., Abe, Y., Onishi, M., & Hashimoto, G. L. 2015,
arXiv:1505.03552Hashimoto, A. 1992, GeCoA, 56, 511Hastie, J. W. 1975, High Temperature Vapors (New York: Academic)Hastie, J. W., Bonnell, D. W., & Schenk, P. K. 2000, Pure Appl Chem,
72, 2111Hemingway, B. S. 1990, AmMin, 75, 781Hemingway, B. S., Bohlen, S. R., Hankins, W. B., Westrum, E. F., Jr., &
Kuskov, O. L. 1998, AmMin, 83, 409Hildenbrand, D. L., & Lau, K. H. 1994a, JChPh, 101, 6076Hildenbrand, D. L., & Lau, K. H. 1994b, JChPh, 108, 6535Hirschmann, M. M., & Dasgupta, R. 2009, ChGeo, 262, 4Holland, T. J. B., & Powell, R. 2011, J. Met. Geol., 29, 333Holzheid, A., Palme, H., & Chakraborty, S. 1997, ChGeo, 139, 21Hunt, J. D., & Manning, C. E. 2012, GeCoA, 86, 196Hunten, D. M., Pepin, R. O., & Walker, J. C. G. 1987, Icar, 69, 532Ito, Y., Ikoma, M., Kalahari, H., Nagahara, H., Kawashima, Y., &
Nakamoto, T. 2015, ApJ, 801, 144Jacobson, N. S., Opila, E. J., Myers., D. L., & Copland, E. H. 2005, J. Chem.
Thermo., 37, 1130Jacobsson, E 1985, Scand J Met, 14, 252Jennings, E. S., & Holland, T. J. B. 2015, JPet, 56, 869Kargel, J. S., & Lewis, J. S. 1993, Icar, 105, 1Kazenas, E. K., Samoilova, I. O, & Zviadadze, G. N. 1983, RJPCA, 57, 1571Kazenas, E. K., & Tagirov, V. K. 1995, Metally, 2, 27Kazenas, E. K., Zviadadze, G. N., & Bolʼshikh, M. A. 1985, Metally, 1, 46Keil, K. 2012, ChEG, 72, 191Kennedy, G. C. 1950, Econ. Geol., 45, 629Kennedy, G. C. 1956, AmJS, 254, 567Kennedy, G. C. 1959, AmJS, 257, 563Kennedy, G. C., Wasserburg, G. J., Heard, H. C., & Newton, R. C. 1962,
AmJS, 260, 501Kitahara, S. 1960, Rev Phys Chem Japan, 30, 109Kite, E. S., Fegley, B., Jr., Schaefer, L., & Gaidos, E. 2016, ApJ, submittedKitts, K., & Lodders, K. 1998, M&PS, 33, A197Korzhinskii, D. S. 1959, Physicochemical Basis of the Analysis of the
Paragenesis of Minerals (New York: Consultants Bureau)Krieger, F. J. 1965, Rand Corporation Memorandum RM-4804-PRKrieger, F. J. 1966a, Rand Corporation Memorandum RM-4943-PRKrieger, F. J. 1966b, Rand Corporation Memorandum RM-5042-PRKrieger, F. J. 1967, Rand Corporation Memorandum RM-5248-PRKrikorian, O. H. 1970, in Symp. on Engineering with Nuclear Explosives,
1, 481Kurosaki, K., Ikoma, M., & Hori, Y. 2014, A&A, 562, A80Kushiro, I., Syono, Y., & Akimoto, S. I. 1968, JGR, 73, 6023Kuts, S. M. 1967, Teplo, 14, 120Lange, M. A., & Ahrens, T. J. 1982, Icar, 51, 96LeBrun, T., Massol, H., Chassefiere, E., et al. 2013, JGR, 118, 1155Leger, A., Grasset, O., Fegley, B., et al. 2011, Icar, 213, 1Linard, Y., Nonnet, H., & Advocat, T. 2008, JNCS, 354, 4917Lodders, K. 1994, MAPS, 29, 492Lodders, K. 2003, ApJ, 591, 1220Lodders, K., & Fegley, B., Jr. 1998, The Planetary Scientistʼs Companion
(New York: Oxford Univ. Press)Lodders, K., Palme, H., & Gail, H. P. 2009, in Landolt-Börnstein, New Series,
Vol. VI/B, ed. J. E. Thünper (Berlin: Springer), 560Lopez, E. D., & Fortney, J. J. 2013, ApJ, 776, 2Lopez, E. D., & Fortney, J. J. 2014, ApJ, 792, 1Lopez, E. D., Fortney, J. J., & Miller, N. 2012, ApJ, 761, 59Maeda, E., Sasomoto, T., & Sata, T. 1978, Yogyo-Kyokai-Shi, 86, 492Manning, C. E. 1994, GeCoA, 58, 4831Matsui, T., & Abe, Y. 1986, Natur, 322, 526
28
The Astrophysical Journal, 824:103 (29pp), 2016 June 20 Fegley et al.
Matsumoto, K., & Sata, T. 1981, Bull Chem Soc Japan, 54, 674Melosh, H. J. 2007, MAPS, 42, 2079Meschter, P. J., Opila, E. J., & Jacobson, N. S. 2013, AnRMS, 3, 559Mittlefehldt, D. W. 1987, GeCoA, 51, 267Morey, G. W. 1957, Econ. Geol., 52, 225Morey, G. W., Fournier, R. O., & Rowe, J. J. 1962, GeCoA, 26, 1029Morey, G. W., & Hesselgesser, J. M. 1951a, Econ. Geol., 46, 821Morey, G. W., & Hesselgesser, J. M. 1951b, Trans AIME, 73, 865Mosebach, R. 1957, JG, 65, 347Motalebi, F., Udry, S., Gillon, M., et al. 2015, A&A, 584, A72Muan, A., & Osborn, E. F. 1965, Phase Equilibria among Oxides in
Steelmaking (Reading, MA: Addison-Wesley)Newton, R. C., & Manning, C. E. 2002, GeCoA, 66, 4165Newton, R. C., & Manning, C. E. 2003, CoMP, 146, 135Newton, R. C., & Manning, C. E. 2008, E&PSL, 274, 241Nguyen, Q. N., Myers, D. L., Jacobson, N. S., & Opila, E. J. 2014, NASA/
TM-2014-218372Nittler, L. R., Starr, R. D., Wider, S. Z., et al. 2011, Sci, 333, 1847O’Neill, H. St. C. 1988, AmMin, 73, 470O’Neill, H. St. C., & Pownceby, M. I. 1993, CoMP, 114, 296Opila, E. J., Fox, D. S., & Jacobson, N. S. 1997, JACS, 80, 1009Opila, E. J., & Myers, D. L. 2004, JACS, 87, 1701O’Rourke, J. G., & Stevenson, D. J. 2016, Natur, 529, 287Palme, H., & O’Neill, H. S. C. 2014, Cosmochemical Estimates of Mantle
Composition. Treatise on Geochemistry (2nd ed.; Amsterdam: Elsevier)Pawley, A. R., Redfern, S. A. T., & Holland, T. J. B. 1996, AmMin, 81, 335Pelton, A. D., & Blander, M. 1984, in 2nd Int. Symp. on Metallurgical Slags
and Fluxes, ed. H. A. Fine, & D. R. Gaskell (New York: MetallurgicalSociety of AIME), 281
Pepin, R. O. 1997, Icar, 126, 148Perkins, D., III, Essene, E. J., Westrum, E. F., Jr., & Wall, V. J. 1979, AmMin,
64, 1080Pitzer, K. S., & Brewer, L. 1961, Thermodynamics (2nd ed.; New York:
McGraw-Hill)Plyasunov, A. V. 2011a, Fluid Phase Equil, 305, 212Plyasunov, A. V. 2011b, GeCoA, 75, 3853Plyasunov, A. V. 2012, GeCoA, 77, 215Porcelli, D., & Pepin, R. O. 2000, in Origin of the Earth and Moon, ed.
R. M. Canup, & K. Righter (Tucson: University of Arizona Press), 435Powell, R., Holland, T. J. B., & Worley, B. 1998, J Met Geol, 16, 577Preston, E., & Turner, W. E. S. 1934, J Soc. Glass Tech., 18, 222Rimstidt, J. D. 1997, GeCoA, 61, 2553Ringwood, A. E. 1966, GeCoA, 30, 41Robie, R. A., & Hemingway, B. S. 1995, USGS Bulletin, 2131Rollason, R. J., & Plane, J. M. C. 2000, PCCP, 2, 2335Rowlinson, J. S., & Swinton, F. L. 1982, Liquids and Liquid Mixtures (3rd ed.;
London: Butterworths)Saal, A. E., Hauri, E. H., Langmuir, C. H., & Perfit, M. R. 2002, Natur,
419, 451
Salmon, O. N. 1961, JPhCh, 65, 550Samoilova, I. O., & Kazenas, E. K. 1995, Metally, #1, 33Scalmani, G., Frisch, M. J., Mennucci, B., et al. 2006, JChPh, 124,
094107Schaefer, L., & Fegley, B., Jr. 2007, Icar, 186, 462Schaefer, L., & Fegley, B., Jr. 2009, ApJL, 703, L113Schaefer, L., & Fegley, B., Jr. 2010, Icar, 205, 483Schaefer, L., Lodders, K., & Fegley, B. 2012, ApJ, 755, 41Shchedrin, W. M., Kulikov, I. S., Vas’kin, V. N., & Teleguin, A. A. 1978,
J Chem Thermo, 10, 9Shen, A. H., & Keppler, H. 1997, Natur, 385, 710Sleep, N. H., Zahnle, K., & Neuhoff, P. S. 2001, PNAS, 98, 3666Spencer, P. J., & Kubaschewski, O. 1978, CALPHAD, 2, 147Spinar, L. H., & Margrave, J. L. 1958, AcSpe, 12, 244Straub, F. G., & Grabowski, H. A. 1945, Trans AIME, 67, 309Symonds, R. B., Rose, W. I., Bluth, G. J. S., & Gerlach, T. M. 1994, in
Volatiles in Magmas, ed. M. R. Carroll, & J. R. Holloway (Washington,DC: Mineralogical Society of America), 1
Takahashi, E. 1986, JGR, 91, B9367Takahashi, E., Shimazaki, T., Tsuzaki, Y., & Yoshida, H. 1993, RSPTA,
342, 105Thompson, J. B. 1981, in Amphiboles and Other Hydrous Pyriboles–
Mineralogy, ed. D. R. Veblen (MSA), 141Tossell, J. A. 2005, GeCoA, 69, 283Tyburczy, J. A., Frisch, B., & Ahrens, T. J. 1986, E&PSL, 80, 201Van Nieuwenberg, C. J., & Blumendal, H. B. 1930, Rec Trav Aux Chim,
49, 857Van Nieuwenberg, C. J., & Blumendal, H. B. 1931a, Rec Trav Aux Chim,
50, 129Van Nieuwenberg, C. J., & Blumendal, H. B. 1931b, Rec Trav Aux Chim,
50, 989Van Zeggern, F., & Storey, F. H. 1970, The Computation of Chemical
Equilibria (Cambridge: Cambridge Univ. Press)Vanderburg, A., Latham, D., Bucchave, L. A., et al. 2015, ApJS, in pressVerhoogen, J. 1949, Thermodynamics of a Magmatic Gas Phase (Vol. 28;
Berkeley, CA: University of California Press)Vidal-Madjar, A., Huitson, C. M., Bourrier, V., et al. 2013, A&A,
560, A54Wagner, W., & Pruss, A. 2002, JPCRD, 31, 387Walther, J. V., & Helgeson, H. C. 1977, AmJS, 277, 1315Warneck, P. 1989, Chemistry of the Natural Atmosphere (San Diego, CA:
Academic)Wasserburg, G. J. 1958, JG, 66, 559Wedepohl, K. H. 1995, GeCoA, 59, 1217Weill, D. F., & Fyfe, W. S. 1964, GeCoA, 28, 1243Yanai, T., Tew, D., & Handy, N. 2004, CPL, 393, 51Yaroshevsky, A. A. 2006, GeocI, 44, 48Zahnle, K. J., Kasting, J. F., & Pollack, J. B. 1988, Icar, 74, 62Zotov, N., & Keppler, H. 2002, ChGeo, 184, 71
29
The Astrophysical Journal, 824:103 (29pp), 2016 June 20 Fegley et al.