solubility parameters of biopolymers
TRANSCRIPT

This article was downloaded by: [Åbo Akademis Bibliotek]On: 04 September 2014, At: 06:13Publisher: Taylor & FrancisInforma Ltd Registered in England and Wales Registered Number: 1072954 Registeredoffice: Mortimer House, 37-41 Mortimer Street, London W1T 3JH, UK
Physics and Chemistry of Liquids: AnInternational JournalPublication details, including instructions for authors andsubscription information:http://www.tandfonline.com/loi/gpch20
Solubility parameters of biopolymersNing He a b , Annika Smeds c , Rauno Friman a b & Jarl B.Rosenholm a ba Center of Excellence for Functional Materials, Åbo AkademiUniversity , Åbo , Finlandb Laboratory of Physical Chemistry , Åbo Akademi University ,Åbo , Finlandc Laboratory of Wood and Paper Chemistry , Åbo AkademiUniversity , Åbo , FinlandPublished online: 05 Oct 2012.
To cite this article: Ning He , Annika Smeds , Rauno Friman & Jarl B. Rosenholm (2013) Solubilityparameters of biopolymers, Physics and Chemistry of Liquids: An International Journal, 51:3,302-316, DOI: 10.1080/00319104.2012.713552
To link to this article: http://dx.doi.org/10.1080/00319104.2012.713552
PLEASE SCROLL DOWN FOR ARTICLE
Taylor & Francis makes every effort to ensure the accuracy of all the information (the“Content”) contained in the publications on our platform. However, Taylor & Francis,our agents, and our licensors make no representations or warranties whatsoever as tothe accuracy, completeness, or suitability for any purpose of the Content. Any opinionsand views expressed in this publication are the opinions and views of the authors,and are not the views of or endorsed by Taylor & Francis. The accuracy of the Contentshould not be relied upon and should be independently verified with primary sourcesof information. Taylor and Francis shall not be liable for any losses, actions, claims,proceedings, demands, costs, expenses, damages, and other liabilities whatsoever orhowsoever caused arising directly or indirectly in connection with, in relation to or arisingout of the use of the Content.
This article may be used for research, teaching, and private study purposes. Anysubstantial or systematic reproduction, redistribution, reselling, loan, sub-licensing,systematic supply, or distribution in any form to anyone is expressly forbidden. Terms &

Conditions of access and use can be found at http://www.tandfonline.com/page/terms-and-conditions
Dow
nloa
ded
by [
Åbo
Aka
dem
is B
iblio
tek]
at 0
6:13
04
Sept
embe
r 20
14
Solubility parameters of biopolymers
Ning Heab*, Annika Smedsc, Rauno Frimanab and Jarl B. Rosenholmab
aCenter of Excellence for Functional Materials, Abo Akademi University, Abo, Finland;bLaboratory of Physical Chemistry, Abo Akademi University, Abo, Finland;
cLaboratory of Wood and Paper Chemistry, Abo Akademi University, Abo, Finland
(Received 10 February 2012; final version received 15 July 2012)
Both unmodified and a range of hydrophobically modified (acetylated)polydextrose and spruce galactoglucomannan preparations have beencharacterised for their solubility and phase separation in a number ofsolvents. Intrinsic viscosity and aggregate size determinations were used toestablish the solubility parameters of polymers at 298K. A slightly differentpolymer solubility parameter was found when pure solvents or solventmixtures were used. This was interpreted as a difference in preferentialsolvation. The developed thermodynamic framework was successfully usedto calculate solubility parameters of polymers from matching solventsolubility parameter and critical solubility parameters determined at phaseboundary.
Keywords: polydextrose; galactoglucomannan; acetylation; solubilityparameter; intrinsic viscosity; Martin equation
1. Introduction
Polysaccharides derived from natural sources are to an ever growing extent utilisedto produce biodegradable and biocompatible new products or value-added materials.Renewable raw materials contain different polymeric structures, which makes themthe potential for self-assembled structures, such as foams and emulsions. In order tocontrol self-assembly, the physicochemical characterisation of biopolymers insolution is of crucial importance. The solubility parameter framework has beenfrequently used to normalise different polymer properties in contact with a solvent[1–3]. Most frequently they are related to the solvent dependent expansion orcontraction of the polymer network or polymer association or precipitation.
Solubility parameters provide a common scale for interaction between polymersand solvents [1,2]. The solubility parameter of polymers can be tuned by acetylation.Alternatively, the solubility parameter of the solvents can be changed by adjustingthe solubility parameter of a neat or mixed solvent. The smaller the differencebetween the solubility parameters of the polymer and the solvent, the better thesolubility is. In the present investigation, the solubility parameter of the polymer hasbeen determined from size measurements and from viscosity measurements [3]. Thismethod is based on matching of solubility parameters of the polymer and solvents.Alternatively, a phase separation is expected to express the solvency of polymer in
*Corresponding author. Email: [email protected]
Physics and Chemistry of Liquids, 2013Vol. 51, No. 3, 302–
© 2013 Taylor & Francis
316, http://dx.doi.org/10.1080/00319104.2012.713552
Dow
nloa
ded
by [
Åbo
Aka
dem
is B
iblio
tek]
at 0
6:13
04
Sept
embe
r 20
14

pure and mixed solvents. A mismatch of solubility parameters by only a few unitsproduces association and subsequent precipitation of the polymer at the solutionphase border.
Commercial and hydrophobically modified polydextrose (PD) and extractedspruce galactoglucomannan (GGM) have been characterised for their solubility andphase separation in a range of solvents. This is key information when judging theircapabilities as foam and emulsion stabilisers. Close to the phase border the affinityfor interfaces is expected to be the largest, resulting in maximum stabilising capacityof emulsions and foams. The range of solubility in terms of solubility parameters as afunction of acetylation degree has been established at 298K.
2. Experimental
2.1. Materials
Polydextrose (PD) was manufactured by Litesse, Danisco. According to themanufacturer, PD is a randomly bonded condensation polymer of D-glucose withsome bound sorbitol and a suitable acid, which is soluble in water at approximately80 g/100mL at 293K. The product was found according to a previously describedmethod to contain 94% polymeric glucose [4]. The weight average molar mass wasfound to be 1800 gmol�1 as determined by high-performance size-exclusionchromatography (HPSEC), coupled to a multi-angle laser light scattering(MALLS) instrument and an RI detector [5]. The acetylation of PD was performedto degrees of substitution (DS) of 0, 1.15 and 2.5.
GGM was extracted from spruce thermo-mechanical pulp and spray-dried [6]. Itis the primary hemi-cellulose in most softwood species. Spruce GGM consists ofa linear backbone of randomly distributed (1! 4)-linked �-D-mannopyranosyl(Manp) and (1! 4)-linked �-D-glucopyranosyl (Glcp) units, with �-D-galactopyr-anosyl (Galp) units as single side units mainly in the mannosyl units. The molar masswas found by (HPSEC-MALLS) to be 39,000 gmol�1 [4]. The native GGMsubstitution degree is 0.32. GGM was acetylated to DSs of 1.6 and 2.8.
The acetylations were performed by modifications of the method described by Xuet al. [7]. The DSs of acetylated GGM and PD were determined by titration [8].
The solvents used in these experiments were: acetone (Merck, Germany,499.5%), ethanol (EtOH) (Altia, 499.5%), dimethyl sulfoxide (DMSO)(J.T.Baker, 499.5%), ethylene glycol (EG) (Sigma Aldrich, 499%) and Milliporewater (H2O). All chemicals were used without further purification.
Polymer samples were prepared by weighing the components into glass bottleswith string caps, after which the samples were gently shaken. PD with DS¼ 0, 1.15was water soluble, but with DS¼ 2.5 soluble only in the water–acetone mixture.GGM with DS¼ 0.32 (native), 1.6 was water soluble, but with DS¼ 2.8 only indimethyl sulfoxide.
2.2. Methods
The hydrodynamic hard sphere-equivalent diameter (Z-average size, dp) of polymeraggregates in different solvents or solvent mixtures was measured by dynamic lightscattering (DLS) with a Malvern Nano ZS instrument at 298K. The aggregate size of
Physics and Chemistry of Liquids 303
Dow
nloa
ded
by [
Åbo
Aka
dem
is B
iblio
tek]
at 0
6:13
04
Sept
embe
r 20
14

polymers was also measured when a homogeneous polymer solution was titratedwith a non-solvent. The initial concentration of the polymer in the solvent was10 g dm�3 in the phase separation measurements and 1 g dm�3 in the solubilityparameter determinations. Due to the addition of the pure non-solvent, theconcentration of the polymer in the solution decreased during the measurement. Thesolvent pairs used were H2O–EtOH, H2O–acetone, DMSO–H2O and DMSO–acetone.
The densities of the samples were measured by an Anton Paar DMA 45densitometer. The measuring process is based on the change of frequency of a hollowoscillating tube when filled with different liquids or gases. The densitometer wascalibrated with air and water. The density measurements were performed at 298K.
The viscosity of the polymer solutions was determined by measuring the effluxtime of the polymer solution in an Ostwald viscometer at 298K. The dynamicviscosities can be calculated by Equation (1):
� ¼ K�ðtg � tHÞ�� ð1Þ
where tg is the measured flow time, and tH is the difference between the measuredand the theoretical flow time, referred as Hagenbach correction time [9,10]. Thekinematic viscosity equals dynamic viscosity divided by the density of the polymersolution.
3. Theoretical
3.1. Solubiltiy parameter
The internal energy and the enthalpy of vaporisation is directly related to thecohesive forces in the liquid. The solubility parameter can be defined based on theseparameters as [1–3]:
�2 ¼DHvap � RT
V¼
DUvap
Vð2Þ
where DHvap is the enthalpy of vapourisation, DUvap the internal energy ofvapourisation and V the molar volume of the neat liquid (substance). The units forsolubility parameter are cal1/2 cm�3/2, or in SI units, J1/2 cm�3/2 (�MPa1/2). Thesolubility parameter of the mixed solvent was calculated as [3]:
�t ¼ x1�1 þ x2�2 ð3Þ
where x is the mol fraction and � the solubility parameter of solvent component 1and 2.
3.2. Viscosity
The following viscosities are of importance [10,11]:
. Reduced viscosity:
�red ¼�� � 0ð Þ
�0cW¼�spcW
ð4Þ
N. He et al.304
Dow
nloa
ded
by [
Åbo
Aka
dem
is B
iblio
tek]
at 0
6:13
04
Sept
embe
r 20
14

. Intrinsic viscosity:
½�� ¼�spcW
� �cW¼0
¼ ln�relcW
� �cW¼0
ð5Þ
where the lower index on viscosity (o) relates to solution alone and (sp) indicates
specific viscosity. Instead of mass (weight, w), concentration (cW ¼ w=V) and volume
fraction ð�Þ can be utilised in the extrapolation.Several equations for extracting the intrinsic viscosity at cw¼ 0 and to describe
the dependency of viscosity on polymer concentration have been developed.
However, each equation have its limitations. For the applicability over a large
concentration range, Martin equation [12] was selected.
ln�� �0ð Þ
�0cW¼ ln
�spcW
� �¼ ln �½ � þ KM �½ �cW ð6Þ
where KM is the corresponding Martin constant, which depends on the solution state,
temperature and the polymer structure. It is assumed to reflect the interaction
between polymer and solvent and the enhanced polymer–polymer concentration with
concentration.
3.3. Solubility parameter of polymer from particle size and viscosity measurements
According to Flory–Huggins theory, the molar Gibbs excess free energy of
interaction can be defined as [1–3]:
Gexm �
x1V1x2V2
x1V1 þ x2V2�1 � �2ð Þ
2¼ �1�2 x1V1 þ x2V2ð Þ �1 � �2ð Þ
2ð7Þ
where x denotes mol fractions and � volume fractions. Partial differentiation with
respect to the amount of solvent (component 1) gives [1,3]:
Gex1 ¼ �
ex1 ¼
@G
@n1
� �n2,P,T
¼ RT ln 1 ¼ V1�22 �1 � �2ð Þ
2ð8Þ
Note that the activity coefficient is denoted (1) in order to distinguish it from
rational (mol fraction based) activity coefficients. The solubility parameters are
excluded from the differentiation. Frith and Wagner [13] has introduced a relation
between intrinsic viscosity and the activity coefficient of the solvent:
ln �½ � ¼ k� ln 1 ð9Þ
Note that k� includes the RT-term. Based on this thermodynamic formalism, it
can be assumed that intrinsic viscosity ratio and size ratio are proportional to the
ratio of activity coefficient. The relationship can be formalised as:
lnmax
1
� �/ ln
�½ �min =max
�½ �
� �/ ln
ðdpÞmin =max
dp
� �ð10Þ
Physics and Chemistry of Liquids 305
Dow
nloa
ded
by [
Åbo
Aka
dem
is B
iblio
tek]
at 0
6:13
04
Sept
embe
r 20
14

Based on these proportionalities the interaction parametermay be expressed by [3]:
1
V1� ln
�½��min =max
½��
�� �1=2
¼ K� � ð�1 � �2Þ ð11Þ
1
V1� ln
�ðdpÞmin =max
dp
�� �1=2
¼ Kd � ð�1 � �2Þ ð12Þ
where, K� ¼ k��22 and Kd ¼ kd�
22.
The solubility parameter can thus be determined by extrapolation of normalisedintrinsic or normalised size functions as a function of the solubility parameter of the(mixed) solvent (Equations (11) and (12), Figure 5).
3.4. Solubility parameter of polymer from phase separation composition
The Flory–Huggins combinatory model for interaction [1–3] can be extended toaccount for volume fraction based ideal entropy of mixing. The total combinatory(TC) molar Gibbs free energy of mixing becomes [1,14]:
GTCm ¼ RTðx1 ln�1 þ x2 ln�2Þ þ �1�2ðx1V1 þ x2V2Þð�1 � �2Þ
2ð13Þ
The thermodynamic condition for obtaining a phase separation is fulfilled bysetting the total molar Gibbs free energy (at equilibrium) equal to zero. Then thecritical solubility combinatorial parameter difference can be calculated as:
ð�crit1 � �crit2 Þ
2¼�RTðx1 ln�1 þ x2 ln�2Þ
�1�2ðx1V1 þ x2V2Þð14Þ
Rearranged, we obtain an expression for the critical solubility parameter of thepolymer:
�crit2 ¼ �crit1 �
ffiffiffiffiffiffiffiffiffiffiffiffiffiffiffiffiffiffiffiffiffiffiffiffiffiffiffiffiffiffiffiffiffiffiffiffiffiffiffiffiffiffiffiffiffiffiffiffiffi�RTðx1 ln�1 þ x2 ln�2Þ
�1�2ðx1V1 þ x2V2Þ
sð15Þ
Thus the solubility parameter of the polymer (�crit2 ) can be calculated when thesolvent solubility parameter of the mixed solvents (�crit1 ) at the phase separationboundary is known. The plus or minus sign depends on if the phase boundary istowards oil or water, respectively. If one wants to distinguish non-ideal enthalpy andentropic contributions, experiments as a function of temperature are needed [1,3].Obviously, a comparison between the solubility parameter of the polymerdetermined from size or viscosity measurements in ideal (D�¼ 0) homogeneoussolutions with the solubility parameter determined for phase separation composi-tions provides a criterion for intrinsic consistency of the methods.
4. Results and discussion
Polymer solubility is characterised in terms of solubility parameters of the mixedsolvents, polymer concentration and degree of substitution (Figure 1).
N. He et al.306
Dow
nloa
ded
by [
Åbo
Aka
dem
is B
iblio
tek]
at 0
6:13
04
Sept
embe
r 20
14
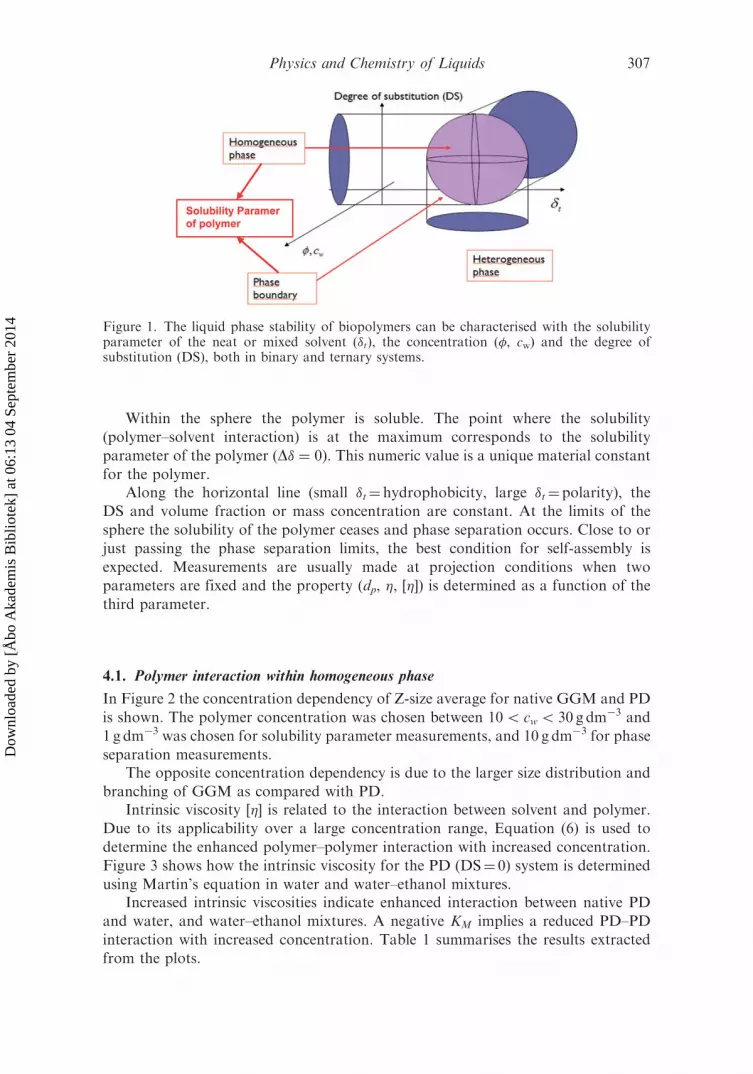
Within the sphere the polymer is soluble. The point where the solubility
(polymer–solvent interaction) is at the maximum corresponds to the solubility
parameter of the polymer (D� ¼ 0). This numeric value is a unique material constant
for the polymer.Along the horizontal line (small �t¼ hydrophobicity, large �t¼polarity), the
DS and volume fraction or mass concentration are constant. At the limits of the
sphere the solubility of the polymer ceases and phase separation occurs. Close to or
just passing the phase separation limits, the best condition for self-assembly is
expected. Measurements are usually made at projection conditions when twoparameters are fixed and the property (dp, �, [�]) is determined as a function of the
third parameter.
4.1. Polymer interaction within homogeneous phase
In Figure 2 the concentration dependency of Z-size average for native GGM and PD
is shown. The polymer concentration was chosen between 105 cw5 30 g dm�3 and
1 g dm�3 was chosen for solubility parameter measurements, and 10 g dm�3 for phase
separation measurements.The opposite concentration dependency is due to the larger size distribution and
branching of GGM as compared with PD.Intrinsic viscosity [�] is related to the interaction between solvent and polymer.
Due to its applicability over a large concentration range, Equation (6) is used to
determine the enhanced polymer–polymer interaction with increased concentration.
Figure 3 shows how the intrinsic viscosity for the PD (DS¼ 0) system is determined
using Martin’s equation in water and water–ethanol mixtures.Increased intrinsic viscosities indicate enhanced interaction between native PD
and water, and water–ethanol mixtures. A negative KM implies a reduced PD–PD
interaction with increased concentration. Table 1 summarises the results extracted
from the plots.
Figure 1. The liquid phase stability of biopolymers can be characterised with the solubilityparameter of the neat or mixed solvent (�t), the concentration (�, cw) and the degree ofsubstitution (DS), both in binary and ternary systems.
Physics and Chemistry of Liquids 307
Dow
nloa
ded
by [
Åbo
Aka
dem
is B
iblio
tek]
at 0
6:13
04
Sept
embe
r 20
14

Figure 4 illustrates how the intrinsic viscosity for the PD(1.15) system isdetermined using Martin’s equation in water, ethylene glycol and dimethylsulph-oxide (DMSO) liquids.
Table 2 summarises the results of ½�� and KM extracted from the Martin plots.
0.000 0.003 0.006 0.009 0.012 0.015 0.018 0.021 0.0240.0
0.5
1.0
1.5
2.0
2.5
3.0
3.5
4.0
4.5 PD (DS=0)
ln (
η red
)
Cw (g/cm3)
H2O H2O:EtOH 2:1 H2O:EtOH 1:2
Figure 3. Intrinsic viscosity ½�� determination using Martin equation for native PD (DS¼ 0) inwater and water–ethanol mixtures.
0
200
400
600
800
1000
1200 GGMSolvent: H2O
Z-a
vera
ge/n
m
0 2 4 68 10 12 14 16 18 20 22 24 26 28 30 32 8 10 12 14 16 18 20 22 24 26 28 30 320
50
100
150
200
250
300 Polydextrose
Solvent: H2OZ
-ave
rage
/nm
Cw/g dm-3 Cw/g dm-3
Figure 2. The influence of concentration on the Z-size average of PD and GGM in water.
Table 1. Extracted results of ½�� and KM from Martin equation for native polydextrose inwater and water–ethanol mixtures.
PD (DS¼ 0) WaterWater–ethanol
(2 : 1)Water–ethanol
(1 : 2)
½�� 38, 2 25, 5 23, 5KM 18.2 �51.9 �52.9�1= MPað Þ
0:5 47.8 40.7 33.6
N. He et al.308
Dow
nloa
ded
by [
Åbo
Aka
dem
is B
iblio
tek]
at 0
6:13
04
Sept
embe
r 20
14

For PD (DS¼ 1.15) the PD–solvent interaction is weaker and thePD–PD interaction is reduced more with concentration more as compared withPD (DS¼ 0).
4.2. Solubility parameter of polymer from particle size and viscosity measurements
The size and intrinsic viscosity of the PD in different solvent was measured first, andthen the calculation of normalised intrinsic viscosity and size was done accordingEquations (11) and (12), respectively. Hence a linearity relationship between thenormalised values and the solubility parameter can be found as shown in Figure 5.In Figure 5 the solubility parameter determined for PD (DS¼ 1.15) from intrinsicviscosity (Equation (11)) and size (Equation (12)) measurements are mutuallycompared.
0.000 0.002 0.004 0.006 0.008 0.010 0.012 0.014 0.016 0.018 0.020
0.0
0.5
1.0
1.5
2.0
2.5
3.0PD (DS=1.15)
H2O
EG DMSO
ln (
η red
)
Cw (g/cm3)
Figure 4. Intrinsic viscosity determination using Martin equation for PD (DS¼ 1.15) in water,ethylene glycol and DMSO.
Table 2. Extracted results of ½�� and KM from Martin equation for native Polydextrose inwater, ethylene glycol and DMSO liquids.
PD (DS¼ 1.15) Water Ethylene Glycol DMSO
½��/cm3 g�1 5.0 6.7 19.9KM �36.2 �61.5 �195.3�1= MPað Þ
0:5 47.8 32.9 26.7
Physics and Chemistry of Liquids 309
Dow
nloa
ded
by [
Åbo
Aka
dem
is B
iblio
tek]
at 0
6:13
04
Sept
embe
r 20
14

Due to the normalised equation, when it equals zero, the pointed solubilityparameter is the solubility parameter of the polymer. In Figure 5, the left side givesthe normalised intrinsic viscosity values and the right gives the normalised sizevalues. Figure 5 shows that the solubility parameter obtained by size measurementsdiffer somewhat from that obtained by viscosity measurements. However, due tothe small difference, the solubility parameters have been based only on sizemeasurements.
The determination of the solubility parameter of PD (DS¼ 1.15) by sizemeasurements in water–ethanol mixtures and the three pure solvents is shown inFigure 6.
Figure 6 confirms the interpretation of difference in the preferential solvency.The polymer swells at increasing polymer–solvent interaction in the ethanol–watermixture, which results in a maximum size at maximum interaction. The size in puresolvents over extended �t shows instead a minimum, indicating a reduction which isprobably due to disintegration of polymer oligomers. Nevertheless, the obtainedsolubility parameters determined from both measurements agree rather well. Thesolubility parameters determined by size measurements in this way for all PD andGGM polymers are listed in Table 3.
It is shown that acetylation (larger DS) decreases the solubility parameter. Thisconfirms that they become more hydrophobic. The DS¼ 0 (PD) and DS¼ 0.32(GGM) represent unmodified polymers. Figure 7 shows the changes of solubilityparameter for polymers as a function of their substitution degree.
24 26 28 30 32 34 36 38 40 42 44 46 48 50-0.175
-0.150
-0.125
-0.100
-0.075
-0.050
-0.025
0.000
0.025
0.050
0.075
0.100
0.125
0.150
0.175PD (DS=1.15) (cw=1g/dm-3)
δ1/MPa0,5
-0.225
-0.200
-0.175
-0.150
-0.125
-0.100
-0.075
-0.050
-0.025
0.000
0.025
0.050
0.075
0.100
-+((
1/V
1)ln
(dpm
in/d
p))0,
5 /(m
ol/d
m3 )
0,5
-+((
1/V
1)ln
(ηm
in/η
))0,
5 /(m
ol/d
m3 )
0,5
H2OEGDMSO
Figure 5. The normalised intrinsic viscosity and the normalised size functions of PD(DS¼ 1.15) vs. the solubility parameter of the solvents (water, ethylene glycol and dimethylsulfoxide).
N. He et al.310
Dow
nloa
ded
by [
Åbo
Aka
dem
is B
iblio
tek]
at 0
6:13
04
Sept
embe
r 20
14

It is found that when the degree of acetylation increases the solubility parameterdecreases. The influence of acetylation on solubility parameter is quite dramaticwhen the degree of substitution exceeds 2.1. This observation is in agreement withobservations made by other researchers [15]. This curve can be utilised to estimatethe solubility parameter at any degree of substitution.
80
100
120
140
160
180
200
220
240
PD (DS =1.15) (cw=1gdm-3) 0
PD (DS =1.15) (cw=1gdm-3) 0
d p/n
m
δ1/MPa0.5
δ1/MPa0.5
Solvent: H2O-EtOH
-0.10
-0.05
0.00
0.05
0.10
0.15
0.20
-+((
1/V
1)ln
(dpm
ax/d
p))0.
5 /(m
ol/d
m3 )
0.5
38.0 38.5 39.0 39.5 40.0 40.5 41.0 41.5 42.0
24 26 28 30 32 34 36 38 40 42 44 46 48 50
-200
-100
0
100
200
300
400
500
600
700
800
900
1000
-+((
1/V
1)ln
(dpm
in/d
p))0.
5 /(m
ol/d
m3 )
0.5
d p/n
m
-0.25
-0.20
-0.15
-0.10
-0.05
0.00
0.05
0.10
0.15
H2OEGDMSO
(a)
(b)
Figure 6. (a) The determination of the solubility parameter of PD (DS¼ 1.15) in water andwater–ethanol mixtures. (b) The determination of the solubility parameter of PD (DS¼ 1.15)in water, ethylene glycol and DMSO liquids.
Physics and Chemistry of Liquids 311
Dow
nloa
ded
by [
Åbo
Aka
dem
is B
iblio
tek]
at 0
6:13
04
Sept
embe
r 20
14

4.3. Solubility parameter of liquid mixtures at phase separation measurements
The phase boundary was determined from the aggregate size growth and enhancedscatter (instability). Such a plot is shown in Figure 8 for the native GGM (DS¼ 0.32)in water–ethanol mixtures. When the solubility parameter values is reduced belowabout 33.6 (MPa)0.5, the size and the standard deviation of GGM increasesdramatically.
As shown in Figure 8, a pre-aggregation stage may precede the phase boundaryat 33.6 (MPa)0.5. In such cases the location of phase boundary was confirmed usingkinematic viscosity (�/�) as shown in Figure 9.
Figure 9 illustrates how the kinematic viscosity increases towards the phaseboundary. The maximum and constant value is an indication of phase separation,since it should not change close to the phase boundary. Although the end of plateauis located at 34.6 (MPa)0.5, the more distinctive value 33.6 (MPa)0.5 was chosen as thephase boundary.
Figure 7. Solubility parameters of polydextrose and galactoglucomannan plotted against thedegree of substitution (DS).
Table 3. Solubility parameters for polydextrose and galactoglucomannan with differentdegrees of substitution determined in different solvent mixtures (Co
w¼ 10 g dm�3).
PD(DS¼ 0)
Water–ethanol(DS¼ 1.15)
Water–ethanol(DS¼ 2.5)
Water–acetone
�2=ðMPaÞ0:5 41.7 39.8 31.8GGM (DS¼ 0.32)
Water–ethanol(DS¼ 1.6)
Water–ethanol(DS¼ 2.8)
DMSO–acetone/DMSO–water
�2=ðMPaÞ0:5 40.7 39.3 26.4
N. He et al.312
Dow
nloa
ded
by [
Åbo
Aka
dem
is B
iblio
tek]
at 0
6:13
04
Sept
embe
r 20
14

The solubility parameters for the mixed solvents at phase boundary for PD inmixed solvents are given in Table 4.
The solubility parameters for the mixed solvents at phase boundary for GGM inmixed solvents are given in Table 5.
As shown in Tables 4 and 5, the critical solubility parameters of the mixedsolvents decreased as the acetylation degree of GGM and PD increases. The first
32 33 34 35 36 37 38 39 40 41 42 43 44 45 46 47 48 491.4
1.6
1.8
2.0
2.2
2.4
2.6
2.8
3.0
3.2
GGM (DS=0.32) (c0w =10gdm-3)
Solvent: H2O-EtOH
Kin
emat
ic v
isco
sity
10-6
m2 /
s
δ1/MPa0.5
Figure 9. Kinematic viscosity (�/�) for native galactoglucomannan vs. the solubilityparameter of the water–ethanol mixture at phase boundary.
33 34 35 36 37 38 39 40 41 42 43 44 45 46 47 48 490
500100015002000250030003500400045005000550060006500700075008000
Z-a
vera
ge/n
m
δ1/MPa0.5
GGM (DS=0.32)(c0w=10gdm-3)
Solvent: H2O-EtOH
Figure 8. Z-average size for native galactoglucomannan in water–ethanol mixture at phaseboundary.
Physics and Chemistry of Liquids 313
Dow
nloa
ded
by [
Åbo
Aka
dem
is B
iblio
tek]
at 0
6:13
04
Sept
embe
r 20
14

value for PD (DS¼ 2.5, �crit¼ 25.5 (MPa)0.5) and for GGM (DS¼ 2.8,�crit¼ 23.5 (MPa)0.5) provides the critical solubility parameter towards oil and thesecond value for PD (DS¼ 2.5, �crit¼ 42.7 (MPa)0.5) and for GGM (DS¼ 2.8,�crit¼ 29.0 (MPa)0.5) that towards water.
Figure 10 illustrates the dependency of phase boundaries on the solubilityparameter.
In Figure 10, it gives the solubility range of the bipolymers. Inside the dottedlines, the polymer is soluble in the solvents with a solubility parameter in the range.
4.4. Calculation of solubility parameter from phase separation point
The solubility parameter of the polymers can be determined at the phase separationpoint from the solubility parameters of the solvent mixture listed in Tables 4 and 5
δcrit/(MPa)0.5
GGMDS=2.8DMSO-Acetone/Water
PDDS=2.5Acetone-Water mixtures
22 24 26 28 30 32 34 36 38 40 42 44 26 28 30 32 34 36 38 40 42 44 46 48 50
Water
δcrit/(MPa)0.5
PDDS=0,1.15
GGMDS=0.52
GGMDS=0,32
Figure 10. Solubility range for native PD and GGM, as well as for acetylated PD and GGMplotted as a function of solubility parameter of mixed solvent.
Table 4. Solubility parameters for the mixed solvents at phase boundary as a function of thedegree of substitution of polydextrose (Cw¼ 10 g dm�3).
�crit1 (MPa)0.5Water–acetone
(DS¼ 0)Water–ethanol
(DS¼ 0)Water–ethanol(DS¼ 1.15)
Water–acetone(DS¼ 2.5)
PD 29.0 31.1 28.5 25.5/42.7
Table 5. Solubility parameters for mixed solvents at phase boundary as a function of thedegree of substitution of galactoglucomannan (Cw¼ 10 g dm�3).
�crit1(MPa)0.5
Water–acetone
(DS¼ 0.32)
Water–ethanol
(DS¼ 0.32)
Water–THF
(DS¼ 0.32)
Water–THF
(DS¼ 0.52)
Water–ethanol
(DS¼ 1.6)
DMSO–acetone/DMSO–water(DS¼ 2.8)
GGM 35.0 33.6 34.0 32.0 32.9 23.5/29.0
N. He et al.314
Dow
nloa
ded
by [
Åbo
Aka
dem
is B
iblio
tek]
at 0
6:13
04
Sept
embe
r 20
14

using Equation (15). The calculated solubility parameters for PD and GGM systemsare given in Table 6.
The calculated solubility parameter of PD and GGM are in acceptable agreementwith the values determined from size measurements in homogeneous solutions
(Table 3). The PD (DS¼ 2.5) has two critical points. The first value relates to thephase boundary towards oil and the second towards water and the average agreeswith previous values. The calculated solubility parameters for GGM (DS¼ 0.32 and
1.6) are also in acceptable agreement with those based on size measurements(Table 3). However, the solubility parameters for GGM (DS¼ 2.8) differ somewhatfrom each other. One has to consider that the measurements in the homogeneous
phase were done for two different solvent mixtures. By taking the mean value,agreement is restored.
Obviously, the agreement between the solubility parameter of the polymerdetermined from size or viscosity measurements in ideal (D�¼ 0) homogeneous
solutions and the solubility parameter determined at the phase separation compo-sition provides strong support for the intrinsic consistency of the methods.
5. Conclusions
The determination of the solubility parameter of dissolved biopolymers from
viscosity measurements and size measurements gave results in good agreement witheach other. The solubility parameters of polymer decrease with increasing substi-
tution degree. The decrease becomes dramatic for DS4 2.1.A method was developed to calculate solubility parameters of biopolymers also
from the critical solubility parameter of the mixed solvents at the phase boundary.The results coincide acceptably well with those determined from experimental size
measurements in ideal (D�¼ 0) homogeneous solutions. This provides a usefulcriterion of the intrinsic consistency of the methods.
Acknowledgements
This research was funded through the Biomass derived novel functional foamy material(BioFoam) project (40309/08) by Finnish Funding Agency for Technology and Innovations(TEKES).
Table 6. Calculated solubility parameter of polydextrose and galactoglucomannan(Equation (15)).
PD(DS¼ 0)
Water–ethanol(DS¼ 1.15)
Water–ethanol(DS¼ 2.5)
Water–acetone
�crit2 =ðMPaÞ0:5 39.2 36.3 32.7/32.7GGM (DS¼ 0.32)
Water–ethanol(DS¼ 1.6)
Water–ethanol(DS¼ 2.8)
DMSO–acetone/DMSO–water
�crit2 =ðMPaÞ0:5 42.0 40.3 29.4/22.8
Physics and Chemistry of Liquids 315
Dow
nloa
ded
by [
Åbo
Aka
dem
is B
iblio
tek]
at 0
6:13
04
Sept
embe
r 20
14

References
[1] J.B. Rosenholm, Adv. Colloid Interface Sci. 146, 31 (2009).[2] A.F.M. Barton, Handbook of Solubility Parameter and Other Cohesion
Parameters, 2nd ed. (CRC Press, Western Australia, 1999).[3] B. Johansson, R. Friman, H. Hakanpaa-Laitinen, and J.B. Rosenholm, Adv. Colloid
Interface Sci. 147–148, 132 (2009).
[4] A. Sundberg, K. Sundberg, C. Lillandt, and B. Holmbom, Nord. Pulp Paper Res. J. 11(216), 226 (1996).
[5] C. Xu, A. Pranovich, J. Hemming, B. Holmbom, S. Albrecht, H.A. Schols, and S. Wilfor,S. Holzforschung 63, 61 (2009).
[6] C. Xu, Ph.D. thesis, Abo Akademi University, 2008.[7] C. Xu, A.-S. Leppanen, P. Eklund, P. Holmlund, R. Sjoholm, K. Sundberg, and
S. Willfor, Carbohyd. Res. 345, 810 (2010).
[8] B. Laignel, C. Bliard, G. Massiot, and J.M. Nuzillard, Carbohyd. Res. 298, 251 (1997).[9] D. Wagner and D. Wagner, Theory Theory and Praxis of Capillary Viscometry (Manual,
Schott, Germany, 2008), p. 7.
[10] D.J. Shaw and D. Wagner, Theory Introduction to Colloid and Surface Chemistry(Butterworth Heinemann Ltd, Oxford, 1992).
[11] K. Holmberg, B. Jonsson, B. Kronberg, B. Lindman, and D. Wagner, Theory Surfactants
and Polymer in Aqueous Solution, 2nd ed. (Wiley, England, 2007), p. 197.[12] H.M. Kwaambva, J.W. Goodwin, R.W. Hughes, P.A. Reynolds, and D. Wagner, Theory
Colloids Surf. A 294, 14 (2007).[13] E.M. Frith and D. Wagner, Theory Trans. Faraday Soc. 41, 17 (1945).
[14] P.J. Flory and D. Wagner, Theory Principles of Polymer Chemistry (Cornell UniversityPress, Ithaca, 1975).
[15] D. Myers and D. Wagner, Theory Surfaces, Interfaces and Colloids: Principles and
Application, 2nd ed. (Wiley-VCH, New York, 1999), p. 279.
N. He et al.316
Dow
nloa
ded
by [
Åbo
Aka
dem
is B
iblio
tek]
at 0
6:13
04
Sept
embe
r 20
14