the multiple sclerosis visual pathway cohort: understanding neurodegeneration in ms
TRANSCRIPT

Martínez-Lapiscina et al. BMC Research Notes 2014, 7:910http://www.biomedcentral.com/1756-0500/7/910
PROJECT NOTE Open Access
The multiple sclerosis visual pathway cohort:understanding neurodegeneration in MSElena H Martínez-Lapiscina1, Elena Fraga-Pumar1, Iñigo Gabilondo1, Eloy Martínez-Heras1, Ruben Torres-Torres2,Santiago Ortiz-Pérez2, Sara Llufriu1, Ana Tercero3, Magi Andorra1, Marc Figueras Roca2, Erika Lampert1,Irati Zubizarreta1, Albert Saiz1,3, Bernardo Sanchez-Dalmau2 and Pablo Villoslada1*
Abstract
Background: Multiple Sclerosis (MS) is an immune-mediated disease of the Central Nervous System with two majorunderlying etiopathogenic processes: inflammation and neurodegeneration. The latter determines the prognosis ofthis disease. MS is the main cause of non-traumatic disability in middle-aged populations.
Findings: The MS-VisualPath Cohort was set up to study the neurodegenerative component of MS using advancedimaging techniques by focusing on analysis of the visual pathway in a middle-aged MS population in Barcelona, Spain.We started the recruitment of patients in the early phase of MS in 2010 and it remains permanently open. All patientsundergo a complete neurological and ophthalmological examination including measurements of physical anddisability (Expanded Disability Status Scale; Multiple Sclerosis Functional Composite and neuropsychological tests),disease activity (relapses) and visual function testing (visual acuity, color vision and visual field). The MS-VisualPathprotocol also assesses the presence of anxiety and depressive symptoms (Hospital Anxiety and Depression Scale),general quality of life (SF-36) and visual quality of life (25-Item National Eye Institute Visual Function Questionnaire withthe 10-Item Neuro-Ophthalmic Supplement). In addition, the imaging protocol includes both retinal (Optical CoherenceTomography and Wide-Field Fundus Imaging) and brain imaging (Magnetic Resonance Imaging). Finally, multifocalVisual Evoked Potentials are used to perform neurophysiological assessment of the visual pathway.
Discussion: The analysis of the visual pathway with advance imaging and electrophysilogical tools in parallel withclinical information will provide significant and new knowledge regarding neurodegeneration in MS and provide newclinical and imaging biomarkers to help monitor disease progression in these patients.
Keywords: Multiple Sclerosis, Visual pathway, Neurodegeneration, Cohort studies
FindingsBackgroundMultiple Sclerosis (MS) is a chronic immune-mediateddisease involving the Central Nervous System (CNS). Theprototypical lesions are acute inflammatory plaques, pri-marily in white matter, that cause demyelination and sec-ondary local axonal damage. These focal lesions areresponsible for clinical relapses, the hallmark of the dis-ease [1]. In fact, most patients have an initial relapsing-remitting (RR) course featuring clinical relapses followedby periods of clinical remission. However, after 15–20
* Correspondence: [email protected] of Neuroimmunology, Institut d’Investigacions Biomèdiques AugustPi i Sunyer (IDIBAPS) - Hospital Clinic of Barcelona, Casanova 145, Planta 3A,08036 Barcelona, SpainFull list of author information is available at the end of the article
© 2014 Martínez-Lapiscina et al.; licensee BioMCreative Commons Attribution License (http:/distribution, and reproduction in any mediumDomain Dedication waiver (http://creativecomarticle, unless otherwise stated.
years, 65% of patients develop a secondary progressive(SP) phase of the disease characterized by progressive dis-ability independent of relapses [2]. Moreover, some pa-tients experience a primary progressive (PP) form of thedisease with areas of inflammation visible on magneticresonance imaging (MRI) presenting as a gradual accumu-lation of disability without relapses [3]. As such, relapsescannot completely account for the disability seen in MS.Both histopathological and imaging studies have suggestedthat diffuse brain damage parallels focal brain damagefrom MS onset. Furthermore, inflammatory and neurode-generative mechanisms have been shown to explain dif-fuse brain damage that involves grey and white matter [4].Thus, the classical concept stating that focal inflammationleads to secondary axonal damage has been reconceived
ed Central. This is an Open Access article distributed under the terms of the/creativecommons.org/licenses/by/2.0), which permits unrestricted use,, provided the original work is properly credited. The Creative Commons Publicmons.org/publicdomain/zero/1.0/) applies to the data made available in this

Martínez-Lapiscina et al. BMC Research Notes 2014, 7:910 Page 2 of 11http://www.biomedcentral.com/1756-0500/7/910
and recent studies indicate that neurodegeneration occursindependently from inflammation in MS [5]. In fact, neu-roaxonal damage is considered to be the main cause ofprogressive and permanent disability in MS [6]. Immuno-modulatory treatments are useful for relapses in the acuteinflammatory phase; they prevent disability due to localneuroaxonal damage after relapses but not disability as aconsequence of the chronic diffuse neurodegeneration ofthe disease [3]. For this reason they are effective in the RRphase of MS but not in the SP phase and PP forms [5].Thus, it is important to consider MS as both an in-
flammatory and neurodegenerative disease and thereforecritical to clarify the mechanisms behind these processesto promote the development of neuroprotective and re-generative therapies. Biomarkers of axonal damage arealso needed to assess the efficacy of these new therapies.In the clinical setting, disability is evaluated by ExpandedDisability Status Scale (EDSS), which measures neuro-logic impairment across 8 functional systems. Theoretic-ally, neuroprotective drugs would provide higher benefitin the early phase of the disease because once significantdisability is present, corresponding to high EDSS scores(>4.0), it may be too late for protection. Consequently,the aims of this cohort are to evaluate neurodegenera-tion in MS and to develop clinical and imaging bio-markers of disease severity from the early to the latephases of the disease.
Rationale: studying neurodegeneration in MS by focusingin the visual pathwayWe decided to study neurodegeneration in MS by focusingon the visual pathway for several reasons. First, the visualsystem is highly susceptible to damage from MS. OpticNeuritis (ON) is a common ophthalmological disorder inthese patients [7] and 1 out of 3 MS patients suffer fromvisual impairment [8]. Moreover, the visual pathway canalso be targeted by MS despite a history of prior optic neur-itis [9]. Second, the visual pathway can be functionally eval-uated with Visual Evoked Potentials (VEP) [10] and visualfunction tests, namely visual acuity (VA), visual field andcolor vision. Structural damage to the anterior and poster-ior visual pathway can be evaluated by Optical CoherenceTomography [11-13] (OCT) and by optic nerve and brainMRI [14-17]. Third, some OCT parameters such as RetinalNerve Fiber Layer thickness have moderate to high correla-tions with brain atrophy [18,19]. Brain atrophy is the mostaccepted subrogate marker of neurodegeneration in MSand is a predictor for subsequent cognitive decline in MS[20]. The moderate correlation between the retinal nervefiber layer (RNFL thickness) and cognitive function [21] re-inforces the role of visual pathway outcomes as biomarkersof MS. Moreover, both axonal (RNFL) and neuronal com-ponents, usually estimated by quantifying the thickness ofthe Ganglion Cell layer and Inner plexiform layer (GCIP)
due to technical limitations to separate these two layers,can be used to monitor neurodegeneration since eachshowed appropriate correlations with cortical grey matter(p = 0.01 and p = 0.04, respectively) and caudate (p = 0.04and p = 0.03, respectively) volumes in the eyes of patientswith MS without a history of optic neuritis [13]. More re-cently, Saidha and colleagues presented moderate correla-tions between GCIP loss and whole brain atrophy (r: 0.44),atrophy in grey matter (r = 0.37), white matter (r = 0.28),and thalamic (r = 0.38) regions of the brain over a 4-yearfollow-up study [22].
The aim and objectivesWe aim to study neurodegeneration in MS because it de-termines prognosis and patients’ daily activity. We focuson the afferent visual pathway since it is frequently af-fected in MS and easily measurable both functionally andstructurally. The MS-VisualPath cohort has two main pur-poses. The first objective is to evaluate the diffuse axonaldamage in the early phase of RR-MS form. We aim to as-sess the role and interplay of different mechanisms includ-ing diffuse demyelination, neuroinflammation and axonaldegeneration due to acute inflammation, and diffusetrans-synaptic neuroaxonal damage development. Thesecond objective is to identify new biomarkers of neurode-generation, including brain and retina image biomarkers,as well as more robust clinical markers of disability. Sincewe began including mfVEP in February 2013, a limitednumber of participants have baseline values available. Forthis reason, the role of mfVEP as a biomarker will be eval-uated as an exploratory objective.
MethodsThe MS-VisualPath cohortThe MS-VisualPath cohort is an ongoing prospective co-hort study of patients with MS conducted at the HospitalClinic of Barcelona, Spain. This hospital provides health-care to nearly 300,000 habitants in Barcelona. Patientswith MS who are followed-up in the center are invited ifthey fulfil the study criteria. However, patients who are re-ferred to the neurologist of this center can also be in-cluded if they show interest in participating. This is anongoing prospective cohort that started in December2010 and has permanently open recruitment.The cohort includes preferentially men or women (age
18–55 years) with RRMS or Clinically Isolated Syndrome(CIS) accordingly to McDonalds criteria [23,24] with orwithout history of prior ON. Although the primary object-ive was to evaluate neuroaxonal damage in early MS (CISand RR), a group of patients with primary (PP) and second-ary (SP) progressive forms were recruited to evaluate differ-ences. Patients need to fulfil the minimum reliabilitycriteria for OCT and visual field. The reliability criteria forOCT includes a well-centered optic disc and fovea, well
Martínez-Lapiscina et al. BMC Research Notes 2014, 7:910 Page 3 of 11http://www.biomedcentral.com/1756-0500/7/910
defined RNFL and Retinal Pigment Epithelium, no artifacts,proper illumination of the fundus, signal strength >20 andno errors in the RNFL and macular automatic segmenta-tion algorithms, thereby fulfilling OSCAR-IB [(O) = obviousproblems including violation of the protocol; (S) poor signalstrength defined as <15 dB; (C) wrong centration of scan;(A) algorithm failure; (R) retinal pathology other than MSrelated; (I) illumination; and (B) beam placement] criteriafor OCT acquisition [25]. The criteria for visual field are aproportion of false positives and false negatives lower than20% and 33%, respectively, and fixation losses lower than20%.Exclusion criteria are: 1) any progressive neurological
disorder (other than MS), any medical condition or limit-ing psychiatric disease (including depression, bipolar andpsychosis) that may interfere with the subject’s ability tocooperate and comply with study procedures; 2) any stateof immunosuppression different from MS; 3) any ophthal-mological causes for retinal damage different from MS ormajor difficulties for OCT evaluation such as severerefractive defects [myopia > −6.0 dp or axial eye length>26 mm; hypermetropia > 5 dp; cylinder > 3 dp], optic diskdrusen, cataracts, glaucoma; 4) current or previous treat-ment with a drug involved in toxic neuropathy, such asethambutol, isoniazid, linezolid, gentamycin, chloram-phenicol, vincristine, penicilamine; 5) recent history ofacute optic neuritis (<6 months). Patients with ON can berecruited after 6 months of the acute episode; 6) previousdiagnosis of Diabetes Mellitus or impaired fasting glucose(≥126 mg/dL or ≥ 200 mg/dL after oral glucose tolerancetest); 7) inability to undergo MRI: reduced renal clearance(screening: GFR < 45 ml/min), history of severe hypersen-sitivity to gadolinium-DTPA, claustrophobia and 8) his-tory of substance abuse in the last 5 years includingalcoholism (>40 g/day for women and 60 g/day for men)and severe tobacco use (>20 cigarettes/day). Patients withacute relapses or systemic steroid treatment in the pre-vious month can be included 2 months after the acuteepisode.The selection process begins by extracting names of
potential participants from the electronic medicalrecords (EMR) of the Hospital Clinic. The EMR arechecked to corroborate that they meet study eligibilitycriteria. Candidates are approached during their clinicalvisits and if they show interest in enrolling in the cohort,an interview with the researcher is scheduled. The re-searcher explains the purpose, visits, and diagnostic toolsincluded in the protocol. If the patient agrees to partici-pate, he/she signs an informed consent and a screeningophthalmological visit is scheduled to evaluate if the par-ticipant fulfils the reliability criteria for OCT and visualfields. Most MS patients approached in this way agreedto enrol in the study (Figure 1). Baseline features of theparticipants are displayed in Table 1.
EthicsThe Research Ethics Committee approved the studyprotocol on April 7th, 2009 (Reference: 4905/2009). Datawill be kept in accordance with the Spanish Data Protec-tion Law 15/1999 to protect patient confidentially.
Data collectionNeurological assessment At baseline, we administer asurvey including a set of relevant demographic and clin-ical variables: sex, date of birth, education level, profes-sion, date of MS onset, date of MS diagnosis, diseasesubtype, history of prior ON, number of relapses in theprior 2 years before inclusion and disease-modifyingtherapies for MS.Disease activity is clinically measured by an annualized
rate of relapses and disease severity by EDSS [26] andMultiple Sclerosis Functional Composite (MSFC) [27].EDSS measures neurological impairment within 8 Func-tional Systems (pyramidal, cerebellar, brainstem, sensory,bowel & bladder, visual, cerebral, and other) to providean overall EDSS ranging from 0 (normal) to 10 (deathdue to MS) [26]. On the contrary, MSFC measuresneurological disability and focuses on three major clin-ical dimensions of MS, namely arm/hand function, legfunction/ambulation and cognitive function. MSFC in-cludes the timed 25-foot walk (T25FW) to evaluatelower extremity function, the timed nine-hole peg test(9HPT) to measure upper extremity function, and the 3-second version of the paced auditory serial addition test-3 (PASAT) to assess neuropsychological function [27].The PASAT test evaluates speed of information process-ing (executive function), which is the most common andearly sign of MS-related cognitive impairment [28]. Asthe MS Task Force recommends, each raw subscore isconverted to a Z-subscore by normalizing to a referencepopulation and then averaged to provide a normalizedoverall MSFC score [27]. Two-trained neurologists carryout the neurological examinations of participants. Wealso collect the annualized rate of relapse to clinicallymeasure the disease activity.In the MS-VisualPath cohort, we estimate cognitive
impairment using the Brief Repeatable Battery-Neuro-psychology (BRB-N) [29], which includes cognitive tasks toevaluate immediate and delayed verbal memory (SelectiveReminder Test - SRT), immediate and delayed visual mem-ory (10/36 Spatial Recall - SPART), executive function(Paced Auditory Serial Addition Test - PASAT - and theSymbol Digit Modality Test - SDMT) and verbal fluency(Word List Generation - WLG), using Spanish norma-tive cut-offs [30]. Two neurologists administer BRB-Nafter receiving additional training by an MS neurologistexperienced in the cognitive evaluation of MS usingneuropsychological batteries.

Figure 1 Displays the flow-chart of participants. It shows the participants dropped during the recruitment process as well as those droppedduring the follow-up.
Martínez-Lapiscina et al. BMC Research Notes 2014, 7:910 Page 4 of 11http://www.biomedcentral.com/1756-0500/7/910
Visual function testing We assess high contrast (HCVA)and low contrast visual acuity (LCVA). Since ON attacks(even subclinical episodes) are frequent in MS, we preferto evaluate monocular VA. Moreover, this approach facili-tates assessment of functional-structural correlations withOCT and VEP. After correcting for any refractive errors,including in patients with eyeglass prescriptions, we assessHCVA and LCVA with Early Treatment for Diabetic Ret-inopathy Study (ETDRS-Precision Vision, LaSalle, IL) vis-ual acuity charts and new Low-Contrast Sloan LetterCharts (LCSLC-Precision Vision, LaSalle, IL), respectively.ETDRS and LCSLC charts are printed on a 14 ½ × 13 1/2–inch durable laminated board. ETDRS charts haveblack letters of progressively smaller size on a white back-board, and each line represents a different VA. LCSLChave grey letters of progressively lower contrast on a whitebackboard and each line represents a certain amount ofcontrast sensitivity. We selected 2.5% and 1.25% contrastlevels as representative values of LCVA. These levels of
contrast have been successfully used in MS to assess visualfunction [31-33]. A lighting level of 80–100 foot-candlesmeasured at the white non-letter portions of the charts ismaintained during the visual acuity evaluation as has beenpreviously published [31-33]. A trained optometrist asksparticipants to read the charts from a distance of 4 meters.First, the optometrist evaluates monocular high visualacuity for each eye and after that, low visual acuity inde-pendently for each eye. The number of correctly identifiedletters is recorded for each eye of each participant. Scoresrange from 0 to 70 letters. Visual acuity is also scored as aLogarithm of the Minimum Angle of Resolution (log-MAR). The formula is VAlogMAR= 0.1 + LogMAR valueof the best line read - 0.02 X (number of letters). Sincesome authors suggested that binocular vision may betterreflect visual disability [34], we have added binocular 2.5%LCVA in the third year evaluation.Color vision is tested using Hardy, Rand and Rittler
(HRR) pseudoisochromatic plates. The HRR test has 24

Table 1 Baseline features of patients included in theMS-VisualPath cohort study
Demographic and clinical profile (N: 120)
Sex female n [%] 84 (70)
Age (years) 41.1 ± 9.4
Education >8 years n [%] 107 (89)
Disease duration years 8.6 ± 7.3
Disease Type
CIS n [%] 7 (6)
RRMS n [%] 103 (86)
SPMS n [%] 6 (5)
PPMS n [%] 4 (3)
Treatment at baseline: yes n [%] 90 (75)
Prior optic neuritis n [%] 52 (43.3)
EDSS 1.8 ± 1.2
ARR 2-year prior recruitment 0.4 ± 0.4
CIS: Clinically Isolated Syndrome; RRMS: Relapsing-Remitting MS; SPMS:Secondary Progressive MS; PPMS: Primary Progressive MS; EDSS: ExpandedDisability Status Scale; ARR: Annualized Relapse Rate.
Martínez-Lapiscina et al. BMC Research Notes 2014, 7:910 Page 5 of 11http://www.biomedcentral.com/1756-0500/7/910
plates with 0, 1 or 2 symbols depending of the plate. Thereare three types of plates: 4 non-scored demonstrationplates; 6 scored screening plates and 14 scored plates fortype and severity assessment. The first four plates (plates1–4) are used to ensure understanding and enough visualacuity to perform the task. The 6 screening plates (plates5–6 with 4 symbols for blue-yellow deficit and plates 7–10with 6 symbols for red-green) classify eyes as having dys-chromatopsia or normal color vision. An eye with lessthan two errors is considered normal. There is no need tocontinue the test if the HRR score is 35 (one error) or 36(zero errors). We used two errors as a cut-off point to en-sure a sensitivity of 1.0, as has been previously described[35]. An eye with two or more errors in the screeningplates has impaired color vision and plates 11–24 shouldbe administered to determine type and extent of the de-fect. Plates 11–20 (18 symbols) and plates 7–10 are usedto assess red-green defect with three levels of severities:mild (plates 7–10 with 6 symbols and plates 11–15 with 8symbols); moderate (plates 16–18; 6 symbols) and severe(plates 19–20, 4 symbols). Plates 21–24 (8 symbols) andplates 5–6 are used to evaluate blue/yellow defect withthree levels of severities: mild (plates 5–6); moderate(plates 21–22; 4 symbols) and severe (plates 23–24; 4 sym-bols). The last group of plates in which errors occur estab-lishes the extent of the color deficit. For instance, if thelast error occurs in either plates 7–10 or 11–15 and thereare no errors in plates 16–20 there is a mild red-green def-icit. In our study, color vision is evaluated qualitativelybased on the number of errors in the screening plates: aneye has a color vision deficit if it has at least two errors inthe screening plates. Moreover, color vision was measured
quantitatively based on the number of correctly identifiedsymbols in the 20 scored HRR plates with a maximum of36 symbols.Visual fields are evaluated with Humphrey Field
Analyzer 750 (Carl Zeiss Meditec, Inc) using SwedishInteractive Threshold Algorithm (SITA) - standard cen-tral 24–2 protocol. The stimulus is a Goldman size III(0.43 Deg) with a background luminance of 31.5 Apos-tlibs. We defined the reliability criteria for this test inthe previous section. Any visual field not matching thesecriteria is repeated or excluded after two failed repeti-tions. An abnormal visual field is defined by a mean de-viation of the total deviation plot with p < 0.05.
Quality of life assessment We evaluate the quality oflife of MS patients using the SF-36v2™ scale. This healthsurvey is a multi-purpose short-form scale that includesphysical, mental and social functional health measures[34]. We also assess the presence of anxiety and depres-sive symptoms in the cohort, even though we excludedparticipants with severe mood disorders. We use theHospital Anxiety and Depression Scale (HADS). Thisscale, originally proposed by Zigmond AS and SnaithRP for detecting depression and anxiety in the setting ofhospital medical outpatient clinic [36], has been suc-cessfully used for evaluating MS patients [37]. HADShas been validated in the Spanish population [38].Finally, we use the 25-Item National Eye Institute
Visual Function Questionnaire (NEI-VFQ-25) and the10-Item Neuro-Ophthalmic Supplement to specificallyassess visual disability. NEI-VFQ-25 includes questionsrepresenting 11 vision-related issues [general vision,ocular pain, difficulty with near activities, limitations indistance activities, vision specific limitations in socialfunctioning due to vision, role limitations due to vision,dependency on others due to vision, mental healthsymptoms due to vision, driving difficulties, color visionand peripheral vision limitations] and a single-item gen-eral health-rating question. Scores of NEI-VFQ-25range from 0 to 100 with higher scores indicating bettervisual functioning [39]. The 10-Item Neuro-OphthalmicSupplement was designed to target additional aspectsof visual disability among patients with neuro-ophthalmological conditions such as ON. Scores alsorange from 0 to 100 [40]. Both questionnaires have beenpreviously used in MS [41,42]. All health-related quality oflife surveys are suitable for self-reported administration.
Visual pathway electrophysiological assessment Multi-focal Visual Evoked Potentials (mfVEP) are recordedusing the monocular VisionSearch1 perimetry system(Vision Search, Sydney, Australia). The visual stimulusis generated on a high-resolution LCD display and thepatient should be comfortably seated 35 cm from the
Martínez-Lapiscina et al. BMC Research Notes 2014, 7:910 Page 6 of 11http://www.biomedcentral.com/1756-0500/7/910
screen. The stimulus is cortically scaled with an eccen-tricity dartboard pattern comprised of 56 segments.Each segment contains a 4×4 checkerboard pattern ofblack and white squares. The size of each square is pro-portional to the size of the segment and dependent oneccentricity. Stimulus conditions require luminance of146 candela (cd) per m2 for white squares and 1.1 cd/m2
for black squares with a contrast of 99%. Two oppositebinary reversal sequences occur at each of the 56 sitesin the visual field according to a pseudorandom se-quence. Each stimulation site is modulated in time ac-cording to a different sequence. The final signal iscomputed by cross-correlation of the response evokedby the sequence stimulation with the sequence itselffor each site or area of visual field. To record, we usefour gold-cup electrodes (Grass Technologies, WestWarwick, RI, USA) placed on the scalp (2 electrodes ei-ther side of the inion, one electrode 2.5 cm above andone 4.5 cm below the inion in the midline). Electrical sig-nals are recorded along 2 channels (differences betweensuperior and inferior and left and right electrodes). MfVEPare amplified 1 × 10⁵ times and band-pass filtered 1 Hz to20 Hz using a Grass 15LT amplifier. The recordings arecollected using monocular stimulation and repeated 6–10times in order to reduce the signal/noise ratio. Then, cor-relations between pattern reversal sequences and recordedelectrical signals are performed with Terra™ software (Vi-sion Search, Sydney, Australia) to obtain responses foreach segment.The largest peak-trough amplitude within the 70–
210 msec is determined for each channel. For ampli-tude analysis, the software automatically designatesthe wave of maximal amplitude between two channelsand a combined topographic map is created. For la-tency analysis, the second peak of the largest wavefrom two channels of a given visual field segment ofboth eyes is automatically selected by a specially de-signed algorithm. The same channel and same peakare then used to assess latency for a particularsegment in the other eye. Ultimately, mfVEP deter-mines inter-eye differences in the latency and ampli-tude of the cortical response in each segment. It isalso possible to compare latencies and amplitudes ofa patient’s eye and normative data of a healthypopulation.This method for mfVEP performance has shown good
technical feasibility and consistency in a study includinghealthy controls and ON patients from two differentcountries [43]. Latencies of mfVEP may be useful to dis-criminate patients with ON at risk of MS progression[44]. Moreover, some authors have found a strong cor-relation between latency delay of mfVEP and axonaldamage measured by RNFL [10] and mfVEP amplitudeand disability measured by EDSS [45].
Image assessmentWide-field fundus imaging A trained ophthalmologistperforms a complete indirect ophthalmoscopy after fullmydriasis at baseline. For follow-up assessment, we per-form wide-field fundus imaging using Optomap200(Optos®). This optical device consists of a scanning laserophthalmoscope that provides images of a 200° field ofthe retina without mydriasis. This system images 80% ofthe retina in a single shot [46]. Optomap200 has a mod-erate sensitivity for lesions located posterior to the equa-tor but low sensitivity for those situated anterior to theequator [47]. This limitation is explained by the lowimage quality in the far temporal and nasal peripheralretina and the fact that the peripheral superior and infer-ior peripheral retina cannot be scanned [48].
Optical coherence tomography Optical Coherence Tom-ography is performed for each eye by a trained optometristusing two OCT systems: the Blue Peak™ Spectral DomainOCT Spectralis® (Heidelberg Engineering, Germany) andthe 4000 Spectral Domain OCT Cirrus® (Carl Zeiss, Dublin,US). The protocol for Spectralis was as follows: (1) RNFLThickness: raster scan centered on the optic nerve head(ART = 100 frames; diameter 12°; which equals approxi-mately a 3.5 mm diameter ring in a normal sized eye) and(2) Macular Volume: raster scan centered on the fovea(ART > 9frames; matrix size 20 × 20; 25 sections of 240um;6 mm ring area; horizontal acquisition). The protocol forCirrus was as follows: an optic disc cube 200 × 200 cen-tered on the disk was used to measure RNFL thickness anda macular cube 512 × 128 centered on the fovea was usedto assess macular volume (MV) both with signal strength >5/10. Both optical devices have demonstrated adequate re-producibility of OCT [49,50] measures although Spectralisequipment provides TruTrack™ active eye tracking technol-ogy to further improve reproducibility of measurements.To be included in the study all OCT needs to fulfil
OSCAR-IB criteria: [(O) = obvious problems includingviolation of the protocol; (S) poor signal strength definedas <15 dB; (C) wrong centration of scan; (A) algorithmfailure; (R) retinal pathology other than MS related; (I)illumination; and (B) beam placement] [25]. A trainedoptometrist performs OCT and assesses whether eachfulfils the OSCAR-IB criteria in our cohort. In caseswhere OCT does not fulfil the criteria, acquisition is re-peated or the data is ultimately excluded. Our criteriafor exclusion includes any ophthalmological causes forretinal damage other than MS (R) as well as any majordifficulties in OCT evaluation including cataracts andother opacities leading to poor signal strength (O and S).Most of our patients have mild retinal atrophy in whichalgorithm failures are less probable (A). In our cohort,most rejections are due to patients moving their heads,
Martínez-Lapiscina et al. BMC Research Notes 2014, 7:910 Page 7 of 11http://www.biomedcentral.com/1756-0500/7/910
resulting in artifacts on peripapilar scans and missingslices on macular volume scans.
Brain magnetic resonance imaging Brain images areacquired using a Siemens Trim Trio® 3 Tesla with a 32-channel phased array coil. The following sequences areobtained at baseline: a) 3D structural T1-MPRAGE(Magnetization-Prepared Rapid-Gradient-Echo) [voxel size0.9 × 0.9 × 0.9 mm3, Field of View (FOV) 220 mm, Flipangle 9°, Repetition Time (TR): 1970 ms, Echo Time (TE):2.4 ms, Inversion recovery time (TI): 1050 ms]; b) 3DStructural FLAIR (Fluid Attenuated Inversion Recovery)[Voxel size 0,9 × 0,9 × 0,9 mm3, FOV 220 mm, TR:5000 ms, TE: 393 ms TI: 1800 ms]; c) 2D Axial T1 postgadolinium [Voxel Size: 0.7 × 0.6 × 3.0 mm3; FOV 240 mm,TR: 390 ms, TE: 2.65 ms]; d) Single voxel proton-spectroscopy (H1MRS) [TR 3000 ms, TE 144 ms, volumeof interest (VOI) size 20 × 30 × 20 mm3, including In-vivowater suppressed (128 averages) and water unsup-pressed (16 averages) acquisitions]. The H1MRS VOIwas positioned in the visual cortex (inter-hemisphericfissure, including both calcarine sulci) and in the pre-central cortex. The absolute N-Acetyl Aspartate [NAA]in the visual cortex was calculated using LCModel soft-ware 7; e) Diffusion Tensor Imaging (DTI) [Voxel Size2.5 × 2.5 × 2.5 mm3; FOV: 240 mm; b-val 1000 s/ mm2,NG: 30, Nb0: 1, TR: 6900; TE: 89] f ) Coronal T2 fatsaturated spin echo acquisitions for each optic nerve[Voxel Size 0.5 × 0.5 × 2 mm3, 20 parallel slices trans-versal to optic nerve, flip angle 120°, TR: 2600 ms andTE: 83 ms] and Coronal T1 for each optic nerve [VoxelSize 0.5 × 0.5 × 2 mm3, 20 parallel slices transversal tooptic nerve, flip angle 70°, TR: 483 ms and TE: 4.92 ms]before and after gadolinium. These sequences areacquired before GD injection.During the follow-up, we have made some changes: a)
exclusion of the optic nerve sequences: b) substitutingHARDI (High-Angular Resolution Diffusion Imaging) inplace of DTI scans [2 × 2 × 2 mm3; FOV: 240 mm; b-val1500 s/mm2, NG: 70, Nb0:6; TR: 12600 ms; TE:112 ms]because we have found a better track reconstructionwith HARDI (manuscript in preparation) c) adding Rest-ing State functional MRI (RS-fMRI) [Voxel Size 1.7 ×1.7 × 3 mm3; TR: 2000 ms; TE: 19 ms; Slices: 40; Flipangle 90]. The only sequences acquired after gadoliniuminjection are 2D Axial T1 post gadolinium and opticnerve sequences in the old protocol, and 2D Axial T1post gadolinium in the new one.
Follow-up assessmentPatients are examined yearly for 3 years, but 5-yearsfollow-up and thereafter are already considered. Afterthe third follow-up, patients will be asked to enrol in the2-year extension study. Table 2 shows the data collected
in each follow-up visit in the MS-VisualPath cohort.Figure 1 shows flow-chart of participants in the MS-VisualPath cohort. The attrition rate after 2 years offollow-up is 3.3%. In fact, half of these participantsdropped out because they moved to another region ofSpain (one patient) or another country (one patient).
StatisticsThis study collects a wide range of results that will be ex-amined using the following standard approach. First, wewill perform descriptive statistics to characterize the sampleusing absolute numbers and proportions for qualitative var-iables and mean and standard deviation for quantitativevariables. Data will be tested for normality, homoscedastic-ity and independence to test assumptions used for paramet-ric tests. Then, we will perform bivariate analyses using aX2 test or Fisher test (in case of small samples) for qualita-tive variables and independent 2-sample t-test or ANOVA(three or more groups) for quantitative variables. For datathat is not parametric, we will use the U-Mann–Whitneytest. Pearson’s Correlation test or the non-parametricanalogue, Spearman rank order correlation coefficient, willbe used to evaluate correlations. Finally, we will performmultivariate tests to rule out confusion that is inherent tocohort studies. Two-tailed p-values <0.05 will be consideredstatistically significant. All analyses will be performed withthe Statistical Package IBM-SPSS (SPSS Inc, Chicago, IL,USA) software version 20.0 or superior.
FindingsTransynaptic degeneration in MS patients: evidence fromthe MS-VisualPath cohortWe have evaluated transynaptic degeneration in a cross-sectional and short-term follow-up study including thefirst 100 consecutive MS patients in the MS-VisualPath.We found that visual cortex volume, NAA in the visualcortex, and lesion volume within optic radiations signifi-cantly influenced average RNFL thinning independentlyof other confounders, especially optic neuritis. Addition-ally, patients with severe prior ON had lower visual cor-tex volume than patients without ON [51].
Retinal periphlebitis is associated with disease severityConsidering our focus on development of biomarkers ofaxonal damage, we have found that patients with previousretinal periphlebitis had a tendency towards a higher disabil-ity at baseline and disability progression after a 1-year followup compared to patients without primary retinal inflamma-tion. Specifically, these patients showed higher lesion vol-ume, lower brain volume and lower RNFL thickness [all ofwhich are surrogate markers of axonal damage] than pa-tients without primary retinal inflammation [52]. We evalu-ated the association between periphlebitis and clinical andparaclinical markers of neurodegeneration, including RNFL
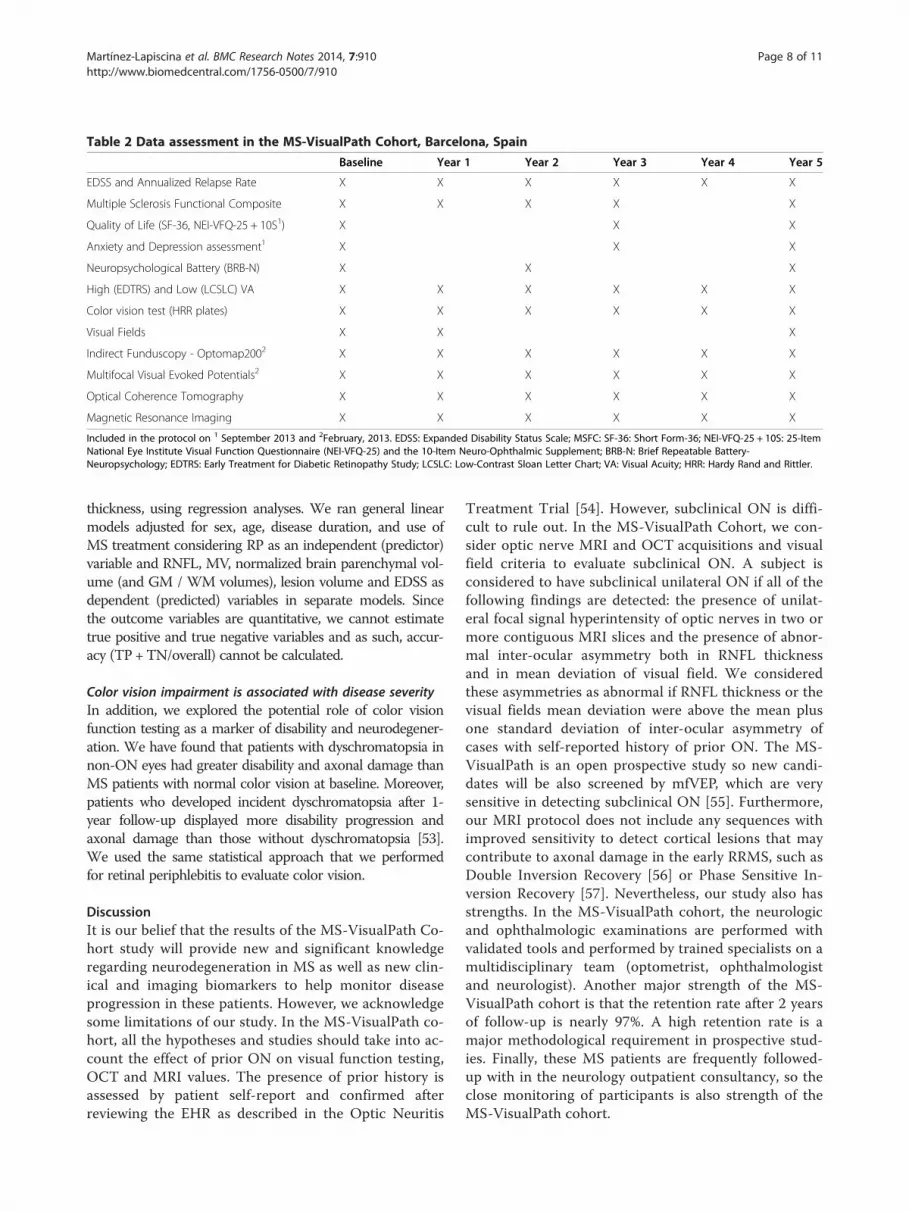
Table 2 Data assessment in the MS-VisualPath Cohort, Barcelona, Spain
Baseline Year 1 Year 2 Year 3 Year 4 Year 5
EDSS and Annualized Relapse Rate X X X X X X
Multiple Sclerosis Functional Composite X X X X X
Quality of Life (SF-36, NEI-VFQ-25 + 10S1) X X X
Anxiety and Depression assessment1 X X X
Neuropsychological Battery (BRB-N) X X X
High (EDTRS) and Low (LCSLC) VA X X X X X X
Color vision test (HRR plates) X X X X X X
Visual Fields X X X
Indirect Funduscopy - Optomap2002 X X X X X X
Multifocal Visual Evoked Potentials2 X X X X X X
Optical Coherence Tomography X X X X X X
Magnetic Resonance Imaging X X X X X X
Included in the protocol on 1 September 2013 and 2February, 2013. EDSS: Expanded Disability Status Scale; MSFC: SF-36: Short Form-36; NEI-VFQ-25 + 10S: 25-ItemNational Eye Institute Visual Function Questionnaire (NEI-VFQ-25) and the 10-Item Neuro-Ophthalmic Supplement; BRB-N: Brief Repeatable Battery-Neuropsychology; EDTRS: Early Treatment for Diabetic Retinopathy Study; LCSLC: Low-Contrast Sloan Letter Chart; VA: Visual Acuity; HRR: Hardy Rand and Rittler.
Martínez-Lapiscina et al. BMC Research Notes 2014, 7:910 Page 8 of 11http://www.biomedcentral.com/1756-0500/7/910
thickness, using regression analyses. We ran general linearmodels adjusted for sex, age, disease duration, and use ofMS treatment considering RP as an independent (predictor)variable and RNFL, MV, normalized brain parenchymal vol-ume (and GM / WM volumes), lesion volume and EDSS asdependent (predicted) variables in separate models. Sincethe outcome variables are quantitative, we cannot estimatetrue positive and true negative variables and as such, accur-acy (TP +TN/overall) cannot be calculated.
Color vision impairment is associated with disease severityIn addition, we explored the potential role of color visionfunction testing as a marker of disability and neurodegener-ation. We have found that patients with dyschromatopsia innon-ON eyes had greater disability and axonal damage thanMS patients with normal color vision at baseline. Moreover,patients who developed incident dyschromatopsia after 1-year follow-up displayed more disability progression andaxonal damage than those without dyschromatopsia [53].We used the same statistical approach that we performedfor retinal periphlebitis to evaluate color vision.
DiscussionIt is our belief that the results of the MS-VisualPath Co-hort study will provide new and significant knowledgeregarding neurodegeneration in MS as well as new clin-ical and imaging biomarkers to help monitor diseaseprogression in these patients. However, we acknowledgesome limitations of our study. In the MS-VisualPath co-hort, all the hypotheses and studies should take into ac-count the effect of prior ON on visual function testing,OCT and MRI values. The presence of prior history isassessed by patient self-report and confirmed afterreviewing the EHR as described in the Optic Neuritis
Treatment Trial [54]. However, subclinical ON is diffi-cult to rule out. In the MS-VisualPath Cohort, we con-sider optic nerve MRI and OCT acquisitions and visualfield criteria to evaluate subclinical ON. A subject isconsidered to have subclinical unilateral ON if all of thefollowing findings are detected: the presence of unilat-eral focal signal hyperintensity of optic nerves in two ormore contiguous MRI slices and the presence of abnor-mal inter-ocular asymmetry both in RNFL thicknessand in mean deviation of visual field. We consideredthese asymmetries as abnormal if RNFL thickness or thevisual fields mean deviation were above the mean plusone standard deviation of inter-ocular asymmetry ofcases with self-reported history of prior ON. The MS-VisualPath is an open prospective study so new candi-dates will be also screened by mfVEP, which are verysensitive in detecting subclinical ON [55]. Furthermore,our MRI protocol does not include any sequences withimproved sensitivity to detect cortical lesions that maycontribute to axonal damage in the early RRMS, such asDouble Inversion Recovery [56] or Phase Sensitive In-version Recovery [57]. Nevertheless, our study also hasstrengths. In the MS-VisualPath cohort, the neurologicand ophthalmologic examinations are performed withvalidated tools and performed by trained specialists on amultidisciplinary team (optometrist, ophthalmologistand neurologist). Another major strength of the MS-VisualPath cohort is that the retention rate after 2 yearsof follow-up is nearly 97%. A high retention rate is amajor methodological requirement in prospective stud-ies. Finally, these MS patients are frequently followed-up with in the neurology outpatient consultancy, so theclose monitoring of participants is also strength of theMS-VisualPath cohort.

Martínez-Lapiscina et al. BMC Research Notes 2014, 7:910 Page 9 of 11http://www.biomedcentral.com/1756-0500/7/910
ConclusionThis MS-VisualPath study has provided the opportunityto study the pathological mechanisms leading to neuro-degeneration and disability. We have also provided twoeasily assessed clinical biomarkers, namely periphlebitisand dyschromatopsia, related to neurodegeneration. Fu-ture analyses and results will further extend these objec-tives. However, we acknowledge that our results shouldbe externally validated in other cohorts. Thus, collabora-tions with national and international studies are wel-come and can be proposed to: [email protected] proposals must be satisfactorily peer-reviewedand ethically reviewed and approved. Contact details,publications and data request are available upon request(http://www.neuroimmunologybcn.org).
Abbreviations9HPT: 9 Hole Peg Test; BRB-N: Brief repeatable battery-neuropsychology;CIS: Clinically isolated syndrome; CNS: Central nervous system; DTI: Diffusiontensor imaging; EDSS: Expanded disability status scale; EHR: Electronic healthrecords; ETDRS: Early treatment for diabetic retinopathy study; FLAIR: Fluidattenuated inversion recovery; FOV: Field of view; HADS: Hospital anxiety anddepression scale; HARDI: High-Angular resolution diffusion imaging;HCVA: High contrast visual acuity; HRR: Hardy, rand and ritter; LCSLC:Low contrast sloan letter charts; LCVA: Low contrast visual acuity;LogMAR: Logarithm of the minimum angle resolution; mfVEP:Multifocal visual evoked potentials; MPRAGE: Magnetization-PreparedRapid-Gradient-Echo; MRI: Magnetic resonance imaging; MSFC: Multiplesclerosis functional composite; MS: Multiple sclerosis; MV: Macular volume;NAA: N-Acetyl-Aspartate.; NEI-VFQ-25: 25-Item National eye institute visualfunction questionnaire; OCT: Optical coherence tomography; ON: Opticneuritis; PASAT: Paced auditory serial addition test-3; PP: Primary progressive;RNFL: Retinal nerve fiber layer; RR: Relapsing-remitting; RS-fMRI: Resting statefunctional magnetic resonance imaging; SDMT: Symbol digit modality test;SITA: Swedish interactive threshold algorithm; SP: Secondary progressive;SPART: 10/36 Spatial Recall; SRT: Selective reminder test; TR: Repetition time;TE: Echo time; TI: Inversion recovery time; T25FW: Time 25-Foot Walk;VA: Visual acuity; VOI: Volume of interest; VEP: Visual evoked potentials;WLG: Word list generation.
Competing interestThe authors declare that they have no competing interests.
Authors’ contributionsEHML participated in the design of the cohort and acquisition of neurologicaldata, performed the statistical analyses and provided interpretation of the data.She has also drafted the manuscript. EFP participated in the design of thecohort and acquisition of ophthalmological data, coordinated the participantenrollment and follow-up and helped to draft the manuscript. IG participated inthe design of the cohort and acquisition of neurological data and helped todraft the manuscript. EMH and MA processed the MRI data, helped in thestatistical analyses and revised the manuscript. SOP, MFR and RTT participatedin the acquisition of ophthalmological data, provided interpretation ofophthalmological findings and revised the manuscript. SL participated in theacquisition of neurological data and revised the manuscript. AT participated inthe acquisition of electrophysiological data (mfVEP), analysed these data andrevised the manuscript. EL and IZ participated in the acquisition of neurologicaldata and revised the manuscript. AS participated in the design of the cohortand provided help to data interpretation and revised the manuscript. BSDparticipated in the design of the cohort and provided help to datainterpretation and revised the manuscript. PV conceived the MS VisualPathcohort and provided help to data interpretation and revised the manuscript. Allauthors read and approved the final manuscript.
AcknowledgementsWe are extremely grateful to the MS-VisualPath participants and fieldworkerswithout whose contribution, this study would not be possible.
FundingThis work was supported by grants to PV from the Instituto de Salud CarlosIII, Spain (FISPS09/00259 and RETICS program RD07/0060/01), Foundation Cellex and byan unrestrictedGrant from Roche Postdoctoral Fund (RPF-ID046). IG was supported by afellowship fromThe Instituto de Salud Carlos III, Spain (Rio Hortega Program: CM11/00240).Funding agencies had no role in design and conduct of the study;collection, management, analysis, and interpretation of the data; orpreparation, review, or approval of the manuscript.
Author details1Center of Neuroimmunology, Institut d’Investigacions Biomèdiques AugustPi i Sunyer (IDIBAPS) - Hospital Clinic of Barcelona, Casanova 145, Planta 3A,08036 Barcelona, Spain. 2Department of Ophthalmology, Institutd’Investigacions Biomèdiques August Pi i Sunyer (IDIBAPS) - Hospital Clinic ofBarcelona, Barcelona, Spain. 3Department of Neurology, Institutd’Investigacions Biomèdiques August Pi i Sunyer (IDIBAPS) - Hospital Clinic ofBarcelona, Barcelona, Spain.
Received: 13 December 2013 Accepted: 11 December 2014Published: 15 December 2014
References1. Hauser SL, Oksenberg JR: The neurobiology of multiple sclerosis: genes,
inflammation, and neurodegeneration. Neuron 2006, 52:61–76.2. Compston A, Coles A: Multiple sclerosis. Lancet 2008, 372:1502–1517.3. Hauser SL, Chan JR, Oksenberg JR: Multiple sclerosis: prospects and
promise. Ann Neurol 2013, 74:317–327.4. Filippi M, Rocca MA: MRI evidence for multiple sclerosis as a diffuse
disease of the central nervous system. J Neurol 2005,252(Suppl 5):v16–v24.
5. Losy J: Is MS an inflammatory or primary degenerative disease? J NeuralTransm 2013, 120:1459–1462.
6. Tallantyre EC, Bo L, Al-Rawashdeh O, Owens T, Polman CH, Lowe JS,Evangelou N: Clinico-pathological evidence that axonal loss underliesdisability in progressive multiple sclerosis. Mult Scler 2010, 16:406–411.
7. Chen L, Gordon LK: Ocular manifestations of multiple sclerosis. Curr OpinOphthalmol 2005, 16:315–320.
8. Jasse L, Vukusic S, Durand-Dubief F, Vartin C, Piras C, Bernard M, Pelisson D,Confavreux C, Vighetto A, Tilikete C: Persistent visual impairment inmultiple sclerosis: prevalence, mechanisms and resulting disability.Mult Scler 2013, 19:1618–1626.
9. Castro SM, Damasceno A, Damasceno BP, de Vasconcellos JP, Reis F, IyeyasuJN, de Carvalho KM: Visual pathway abnormalities were found in mostmultiple sclerosis patients despite history of previous optic neuritis.Arq Neuropsiquiatr 2013, 71:437–441.
10. Klistorner A, Garrick R, Barnett MH, Graham SL, Arvind H, Sriram P, YiannikasC: Axonal loss in non-optic neuritis eyes of patients with multiplesclerosis linked to delayed visual evoked potential. Neurology 2013,80:242–245.
11. Galetta KM, Calabresi PA, Frohman EM, Balcer LJ: Optical coherencetomography (OCT): imaging the visual pathway as a model forneurodegeneration. Neurotherapeutics 2011, 8:117–132.
12. Villoslada P, Cuneo A, Gelfand J, Hauser SL, Green A: Color vision isstrongly associated with retinal thinning in multiple sclerosis. Mult Scler2012, 18:991–999.
13. Saidha S, Sotirchos ES, Oh J, Syc SB, Seigo MA, Shiee N, Eckstein C, DurbinMK, Oakley JD, Meyer SA, Frohman TC, Newsome S, Ratchford JN, Balcer LJ,Pham DL, Crainiceanu CM, Frohman EM, Reich DS, Calabresi PA:Relationships between retinal axonal and neuronal measures and globalcentral nervous system pathology in multiple sclerosis. JAMA Neurol 2013,70:34–43.
14. Ciccarelli O, Toosy AT, Hickman SJ, Parker GJ, Wheeler-Kingshott CA, MillerDH, Thompson AJ: Optic radiation changes after optic neuritis detectedby tractography-based group mapping. Hum Brain Mapp 2005,25:308–316.
15. Sepulcre J, Goni J, Masdeu JC, Bejarano B, Velez de Mendizabal N, ToledoJB, Villoslada P: Contribution of white matter lesions to gray matter

Martínez-Lapiscina et al. BMC Research Notes 2014, 7:910 Page 10 of 11http://www.biomedcentral.com/1756-0500/7/910
atrophy in multiple sclerosis: evidence from voxel-based analysis of T1lesions in the visual pathway. Arch Neurol 2009, 66:173–179.
16. Reich DS, Smith SA, Gordon-Lipkin EM, Ozturk A, Caffo BS, Balcer LJ, Calabresi PA:Damage to the optic radiation in multiple sclerosis is associated with retinalinjury and visual disability. Arch Neurol 2009, 66:998–1006.
17. Kolbe S, Bajraszewski C, Chapman C, Nguyen T, Mitchell P, Paine M,Butzkueven H, Johnston L, Kilpatrick T, Egan G: Diffusion tensor imaging ofthe optic radiations after optic neuritis. Hum Brain Mapp 2012, 33:2047–2061.
18. Villoslada P, Sepulcre J, Toledo J, Bejarano B: Retinal nerve fiber layer isassociated with brain atrophy in multiple sclerosis. Neurology 2008,71:1747. author reply 1747–1748.
19. Siger M, Dziegielewski K, Jasek L, Bieniek M, Nicpan A, Nawrocki J, Selmaj K:Optical coherence tomography in multiple sclerosis: thickness of theretinal nerve fiber layer as a potential measure of axonal loss and brainatrophy. J Neurol 2008, 255:1555–1560.
20. Summers M, Fisniku L, Anderson V, Miller D, Cipolotti L, Ron M: Cognitiveimpairment in relapsing-remitting multiple sclerosis can be predicted byimaging performed several years earlier. Mult Scler 2008, 14:197–204.
21. Toledo J, Sepulcre J, Salinas-Alaman A, Garcia-Layana A, Murie-Fernandez M,Bejarano B, Villoslada P: Retinal nerve fiber layer atrophy is associatedwith physical and cognitive disability in multiple sclerosis. Mult Scler2008, 14(7):906–912.
22. Saidha S, Omar O, Al-Louzi J, Ratchford, Bhargava P, Oh J, Newsome S,Prince J, Pham D, Roy S, Van Zijl P, Balcer L, Frohman E, Reich D, CrainiceanuC, Calabresi P: Retinal measures reflect global neurodegeneration and in-flammation; a 4-year longitudinal study of optical coherence tomog-raphy and MRI in MS [abstract]. Mult Scler 2014, 20:Y12.2.
23. Polman CH, Reingold SC, Edan G, Filippi M, Hartung HP, Kappos L, LublinFD, Metz LM, McFarland HF, O'Connor PW, Sandberg-Wollheim M, Thomp-son AJ, Weinshenker BG, Wolinsky JS: Diagnostic criteria for multiplesclerosis: 2005 revisions to the "McDonald Criteria". Ann Neurol 2005,58:840–846.
24. Polman CH, Reingold SC, Banwell B, Clanet M, Cohen JA, Filippi M, FujiharaK, Havrdova E, Hutchinson M, Kappos L, Lublin FD, Montalban X, O'ConnorP, Sandberg-Wollheim M, Thompson AJ, Waubant E, Weinshenker B,Wolinsky JS: Diagnostic criteria for multiple sclerosis: 2010 revisions tothe McDonald criteria. Ann Neurol 2011, 69:292–302.
25. Tewarie P, Balk L, Costello F, Green A, Martin R, Schippling S, Petzold A: TheOSCAR-IB consensus criteria for retinal OCT quality assessment. PLoS One2012, 7:e34823.
26. Kurtzke JF: Rating neurologic impairment in multiple sclerosis: anexpanded disability status scale (EDSS). Neurology 1983, 33:1444–1452.
27. Rudick R, Antel J, Confavreux C, Cutter G, Ellison G, Fischer J, Lublin F, MillerA, Petkau J, Rao S, Reingold S, Syndulko K, Thompson A, Wallenberg J,Weinshenker B, Willoughby E: Recommendations from the NationalMultiple Sclerosis Society Clinical Outcomes Assessment Task Force. AnnNeurol 1997, 42:379–382.
28. Demaree HA, DeLuca J, Gaudino EA, Diamond BJ: Speed of informationprocessing as a key deficit in multiple sclerosis: implications forrehabilitation. J Neurol Neurosurg Psychiatry 1999, 67:661–663.
29. Bever CT Jr, Grattan L, Panitch HS, Johnson KP: The brief repeatablebattery of neuropsychological tests for multiple sclerosis: a preliminaryserial study. Mult Scler 1995, 1:165–169.
30. Sepulcre J, Vanotti S, Hernandez R, Sandoval G, Caceres F, Garcea O,Villoslada P: Cognitive impairment in patients with multiple sclerosisusing the Brief Repeatable Battery-Neuropsychology test. Mult Scler 2006,12:187–195.
31. Balcer LJ, Baier ML, Pelak VS, Fox RJ, Shuwairi S, Galetta SL, Cutter GR,Maguire MG: New low-contrast vision charts: reliability and test charac-teristics in patients with multiple sclerosis. Mult Scler 2000, 6:163–171.
32. Baier ML, Cutter GR, Rudick RA, Miller D, Cohen JA, Weinstock-Guttman B,Mass M, Balcer LJ: Low-contrast letter acuity testing captures visual dys-function in patients with multiple sclerosis. Neurology 2005, 64:992–995.
33. Balcer LJ, Galetta SL, Polman CH, Eggenberger E, Calabresi PA, Zhang A,Scanlon JV, Hyde R: Low-contrast acuity measures visual improvement inphase 3 trial of natalizumab in relapsing MS. J Neurol Sci 2012, 318:119–124.
34. Ware JE, Kosinski M, Dewey JE: How to Score Version Two of the SF-36 HealthSurvey. Lincoln: QualityMetric, Incorporated; 2000.
35. Cole BL, Lian KY, Lakkis C: The new Richmond HRR pseudoisochromatictest for colour vision is better than the Ishihara test. Clin Exp Optom 2006,89:73–80.
36. Zigmond AS, Snaith RP: The hospital anxiety and depression scale.Acta Psychiatr Scand 1983, 67:361–370.
37. Jones KH, Ford DV, Jones PA, John A, Middleton RM, Lockhart-Jones H,Osborne LA, Noble JG: A large-scale study of anxiety and depression inpeople with Multiple Sclerosis: a survey via the web portal of the UK MSRegister. PLoS One 2012, 7:e41910.
38. Tejero AG, Farré J: Uso clínico del HAD (Hospital Anxiety andDepression Scale) en población psiquiátrica: un estudio de susensibilidad, fiabilidad y validez. Rev Depto Psiquiatr Fac Med Barna1986, 13:233–238.
39. Mangione CM, Lee PP, Gutierrez PR, Spritzer K, Berry S, Hays RD:Development of the 25-item national eye institute visual functionquestionnaire. Arch Ophthalmol 2001, 119:1050–1058.
40. Raphael BA, Galetta KM, Jacobs DA, Markowitz CE, Liu GT, Nano-SchiaviML, Galetta SL, Maguire MG, Mangione CM, Globe DR, Balcer LJ:Validation and test characteristics of a 10-item neuro-ophthalmicsupplement to the NEI-VFQ-25. Am J Ophthalmol 2006, 142:1026–1035.
41. Balcer LJ, Baier ML, Kunkle AM, Rudick RA, Weinstock-Guttman B,Simonian N, Galetta SL, Cutter GR, Maguire MG: Self-reported visualdysfunction in multiple sclerosis: results from the 25-item nationaleye institute visual function questionnaire (VFQ-25). Mult Scler 2000,6:382–385.
42. Walter SD, Ishikawa H, Galetta KM, Sakai RE, Feller DJ, Henderson SB, WilsonJA, Maguire MG, Galetta SL, Frohman E, Calabresi PA, Schuman JS, Balcer LJ:Ganglion cell loss in relation to visual disability in multiple sclerosis.Ophthalmology 2012, 119:1250–1257.
43. Cadavid DLN, Costello F, Rahilly A, Klistorner A: Technical feasibility ofimplementing multifocal VEP for multicenter clinical trials [abstract].Neurology 2013, 80:IN4–1.004.
44. Fraser C, Klistorner A, Graham S, Garrick R, Billson F, Grigg J: Multifocalvisual evoked potential latency analysis: predicting progression tomultiple sclerosis. Arch Neurol 2006, 63:847–850.
45. Blanco R, Perez-Rico C, Puertas-Munoz I, Ayuso-Peralta L, Boquete L,Arevalo-Serrano J: Functional assessment of the visual pathway withmultifocal visual evoked potentials, and their relationship with disabilityin patients with multiple sclerosis. Mult Scler 2014, 20:183–191.
46. Atkinson A, Mazo C: Imaged Area of the Retina. http://www.optos.com/Global/documents/CaseStudies_ImagedAreaOfTheRetina.pdf.
47. Mackenzie PJ, Russell M, Ma PE, Isbister CM, Maberley DA: Sensitivity andspecificity of the optos optomap for detecting peripheral retinal lesions.Retina 2007, 27:1119–1124.
48. Witmer MT, Parlitsis G, Patel S, Kiss S: Comparison of ultra-widefieldfluorescein angiography with the Heidelberg Spectralis((R)) noncontactultra-widefield module versus the Optos((R)) Optomap((R)). ClinOphthalmol 2013, 7:389–394.
49. Serbecic N, Beutelspacher SC, Aboul-Enein FC, Kircher K, Reitner A,Schmidt-Erfurth U: Reproducibility of high-resolution optical coherencetomography measurements of the nerve fibre layer with the newHeidelberg Spectralis optical coherence tomography. Br J Ophthalmol2011, 95:804–810.
50. Pierro L, Gagliardi M, Iuliano L, Ambrosi A, Bandello F: Retinal nerve fiberlayer thickness reproducibility using seven different OCT instruments.Invest Ophthalmol Vis Sci 2012, 53:5912–5920.
51. Gabilondo I, Martinez-Lapiscina EH, Martinez-Heras E, Fraga-Pumar E,Llufriu S, Ortiz S, Bullich S, Sepulveda M, Falcon C, Berenguer J, Saiz A,Sanchez-Dalmau B, Villoslada P: Trans-synaptic axonal degeneration inthe visual pathway in multiple sclerosis. Ann Neurol 2014, 75:98–107.
52. Ortiz-Perez S, Martinez-Lapiscina EH, Gabilondo I, Fraga-Pumar E,Martinez-Heras E, Saiz A, Sanchez-Dalmau B, Villoslada P: Retinalperiphlebitis is associated with multiple sclerosis severity.Neurology 2013, 81:877–881.
53. Martinez-Lapiscina EH, Ortiz-Perez S, Fraga-Pumar E, Martinez-Heras E,Gabilondo I, Llufriu S, Bullich S, Figueras M, Saiz A, Sanchez-Dalmau B,Villoslada P: Colour vision impairment is associated with diseaseseverity in multiple sclerosis. Mult Scler 2014, 20:1207–1216.
54. Cleary PA, Beck RW, Anderson MM Jr, Kenny DJ, Backlund JY, Gilbert PR:Design, methods, and conduct of the Optic Neuritis Treatment Trial.Control Clin Trials 1993, 14:123–142.
55. Klistorner A, Arvind H, Nguyen T, Garrick R, Paine M, Graham S, O'Day J,Grigg J, Billson F, Yiannikas C: Axonal loss and myelin in early ON loss inpostacute optic neuritis. Ann Neurol 2008, 64:325–331.

Martínez-Lapiscina et al. BMC Research Notes 2014, 7:910 Page 11 of 11http://www.biomedcentral.com/1756-0500/7/910
56. Geurts JJ, Pouwels PJ, Uitdehaag BM, Polman CH, Barkhof F, Castelijns JA:Intracortical lesions in multiple sclerosis: improved detection with 3Ddouble inversion-recovery MR imaging. Radiology 2005, 236:254–260.
57. Sethi V, Yousry TA, Muhlert N, Ron M, Golay X, Wheeler-Kingshott C, MillerDH, Chard DT: Improved detection of cortical MS lesions with phase-sensitive inversion recovery MRI. J Neurol Neurosurg Psychiatry 2012,83:877–882.
doi:10.1186/1756-0500-7-910Cite this article as: Martínez-Lapiscina et al.: The multiple sclerosis visualpathway cohort: understanding neurodegeneration in MS. BMC ResearchNotes 2014 7:910.
Submit your next manuscript to BioMed Centraland take full advantage of:
• Convenient online submission
• Thorough peer review
• No space constraints or color figure charges
• Immediate publication on acceptance
• Inclusion in PubMed, CAS, Scopus and Google Scholar
• Research which is freely available for redistribution
Submit your manuscript at www.biomedcentral.com/submit