the modis fire products
TRANSCRIPT
The MODIS fire products
C.O. Justicea,*, L. Gigliob, S. Korontzia, J. Owensa, J.T. Morisettec, D. Roya,J. Descloitresb, S. Alleaumed, F. Petitcoline, Y. Kaufmanc
aDepartment of Geography, University of Maryland, 2181 LeFrak Hall, 20742 College Park, MD, USAbScience Systems and Applications, Inc., Lanham, MD, USAcNASA Goddard Space Flight Center, Greenbelt, MD, USA
dDepartment of Environmental Sciences, University of Virginia, Charlottesville, VA, USAeACRI-ST, Sophia Antipolis, France
Received 20 February 2002; received in revised form 17 April 2002; accepted 24 April 2002
Abstract
Fire products are now available from the Moderate Resolution Imaging Spectroradiometer (MODIS) including the only current global
daily active fire product. This paper describes the algorithm, the products and the associated validation activities. High-resolution ASTER
data, which are acquired simultaneously with MODIS, provide a unique opportunity for MODIS validation. Results are presented from a
preliminary active fire validation study in Africa. The prototype MODIS burned area product is described, and an example is given for
southern Africa of how this product can be used in modeling pyrogenic emissions. The MODIS Fire Rapid Response System and a web-
based mapping system for enhanced distribution are described and the next steps for the MODIS fire products are outlined.
D 2002 Elsevier Science Inc. All rights reserved.
1. Introduction
The Moderate Resolution Imaging Spectroradiometer
(MODIS) was launched on the Terra platform in December
of 1999, as part of NASA’s Earth Observing System (EOS).
The MODIS instrument, which began collecting image data
in February 2000, is generating a number of land surface
products to meet the goals of NASA’s Earth Science Enter-
prise (Justice et al., 1998). The MODIS Fire Products are
designed to provide information for both global change
science and practical applications (Justice & Korontzi,
2001; Kaufman, Justice et al., 1998; Kaufman, Kleidman,
& King, 1998). The MODIS Fire Team is developing and
testing two types of fire products: active fire products which
give the location of burning fires and a burned area product
which gives the extent of burn scars over a specified time
period.
Primary emphasis during the first 18 months since launch
has been given to generating and refining the MODIS active
fire products. This has involved extensive product quality
assessment and establishment of product accuracy by vali-
dation activities. The active fire algorithm uses multiple
channels to detect thermal anomalies on a per-pixel basis,
which in addition to fires, includes high-temperature point
sources, such as gas flares and power plants. Secondary
emphasis has been given to the development and testing of a
MODIS burned area algorithm (Roy, Lewis, & Justice,
2002, this issue). A prototype burned area algorithm, which
uses a multidate analysis approach, is currently being tested
for southern Africa in the context of the international
SAFARI 2000 campaign (Swap et al., 1999), in support of
fire emissions calculations.
2. Fire detection algorithm
Active fire detection for MODIS is based on heritage
algorithms developed for the AVHRR and TRMM VIRS
(Giglio, Kendall, & Justice, 1999; Giglio, Kendall, &
Mack, submitted for publication; Justice, Kendall, Dowty,
& Scholes, 1996; Kaufman et al., 1990). The algorithm
uses brightness temperatures derived from the MODIS 4
and 11 Am channels, denoted by T4 and T11, respectively.
0034-4257/02/$ - see front matter D 2002 Elsevier Science Inc. All rights reserved.
PII: S0034 -4257 (02 )00076 -7
* Corresponding author. Tel.: +1-301-405-1600; fax: +1-301-314-6503.
E-mail address: [email protected] (C.O. Justice).
www.elsevier.com/locate/rse
Remote Sensing of Environment 83 (2002) 244–262
The MODIS instrument has two 4-Am channels, numbered
21 and 22, both of which are used by the detection
algorithm. Channel 21 saturates at nearly 500 K; channel
22 saturates at 331 K. Since the low-saturation channel is
less noisy and has a smaller quantization error, T4 is
derived from this channel whenever possible. However,
when channel 22 saturates, or has missing data, it is
replaced with the high saturation channel to derive T4.
T11 is computed from the 11-Am channel (channel 31),
which saturates at approximately 400 K. The 250-m near-
infrared band (0.86 Am), averaged to 1-km resolution, is
also used to identify highly reflective surfaces that are
more likely to cause false alarms. This reflectance is
denoted by q2.
The fire detection strategy is based on absolute detection
of the fire, if the fire is strong enough, and on detection
relative to the thermal emission of surrounding pixels to
detect weaker fires. This latter test identifies pixels with
values elevated above a background thermal emission
obtained from the surrounding pixels. This method accounts
for variability of the surface temperature and reflection by
sunlight. The following are the steps in the algorithm.
To avoid false detection, all pixels for which T4 < 315 K
(305 K at night) or T4� T11 < 10 K (3 K at night) or q2>0.3
(daytime only) are immediately eliminated as possible fires.
For absolute fire detection, the algorithm requires that at
least one of two conditions be satisfied. These are:
1) T4>360 K (330 K at night)
2) T4>330 K (315 K at night) and T4� T11>25 K (10 K at
night)
If either of these absolute criteria is not met, the algorithm
pursues a relative fire detection in which the fire is distin-
guished from the mean background values by three standard
deviations in T4 and T4� T11:
T4 > meanðT4Þ þ 3stddevðT4Þ
and
T4 � T11 > medianðT4 � T11Þ þ 3stddevðT4 � T11Þ:
The mean, median, and standard deviations (denoted
by ‘‘mean’’, ‘‘median’’, and ‘‘stddev’’ above) are com-
puted for pixels within an expanding grid centered on the
candidate fire pixel until a sufficient number of cloud-,
water-, and fire-free pixels are identified. A ‘‘sufficient
number’’ is defined as 25% of all background pixels,
with a minimum of six. Water pixels are identified with
an external water mask, and cloud pixels are identified
with the MODIS cloud mask product (MOD35). Fire-free
background pixels are identified as those pixels for which
T4 < 325 K (315 K at night) and T4� T11 < 20 K (10 K at
night). If either standard deviation is below 2 K, a value
of 2 K is used instead.
The background window is allowed to grow up to
21� 21 pixels in size. If this limit is reached and the
previous criteria regarding the minimum number of valid
background pixels are not met, the relative detection tests
cannot be used. If the absolute tests do not indicate that
an active fire is present in this situation, the algorithm
flags the detection result as unknown.
Combining all tests into a single expression, a pixel is
classified as a fire pixel in daytime if the following
conditions are satisfied:
fT4 > meanðT4Þ þ 3stddevðT4Þ or T4 > 330 Kg
and
fT4 � T11 > medianðT4 � T11Þ þ 3stddevðT4 � T11Þor T4 � T11 > 25 Kg
or
T4 > 360 K
For the nighttime algorithm they become:
fT4 > meanðT4Þ þ 3stddevðT4Þ or T4 > 315 Kg
and
fT4 � T11 > medianðT4 � T11Þ þ 3stddevðT4 � T11Þor T4 � T11 > 10 Kg
or
T4 > 330 K
Finally, for daytime observations when sunglint may
cause false detections, a fire pixel is rejected if the MODIS
250 m red and near-infrared channels have a reflectance
above 30% and it lies within 40j of the specular reflection
position.
2.1. Fire detection confidence
A detection confidence estimate is provided as part of
the fire product to help users gauge the quality of
individual fire pixels, similar to the scheme described
by Giglio et al. (submitted for publication). This con-
fidence estimate is used to assign one of the three fire
classes (low-confidence fire, nominal-confidence fire, or
high-confidence fire) to all fire pixels within the fire
mask. Currently, while the product is in provisional
status, all detected fire pixels are assigned nominal
confidence.
C.O. Justice et al. / Remote Sensing of Environment 83 (2002) 244–262 245
2.2. Total emitted power
Total emitted power value is assigned to each fire pixel.
The total emitted power was deemed to be a useful quantity
in the estimation of fire emissions (Kaufman, Justice et al.,
1998). A relationship between the rate of emitted energy, Ef,
and the detected temperature difference in the 4-Am channel
was approximated by Kaufman, Justice et al. (1998) and
Kaufman, Kleidman et al. (1998):
Ef ¼ 4:34� 10�19½T84 �meanðT4Þ8
with units of W/m2, or, equivalently, MW per pixel.
3. Active fire products
The current MODIS fire products and their release dates
are listed in Table 1.
The standard MODIS fire products are distributed from
the Earth Resources Observation Systems Data Center
(EDC) Distributed Active Archive Center (DAAC) and
are defined in HDF-EOS format as Level 2, Level 2G,
and Level 3. A description of the different MODIS Land
product levels is found in Masuoka, Fleig, Wolfe, and Patt
(1998). In addition, a global browse product is generated,
primarily for quality assessment (QA), and a rapid response
fire product for operational near-real time fire data users.
The MODIS active fire products were designated a
provisional maturity status as of November 2000, following
adjustments to the instrument. The provisional status means
that the product is usable, although it has known problems
and validation is ongoing.
3.1. The Level 2 fire product (MOD14)
This is the most basic fire product in which active fires
and other thermal anomalies, such as volcanoes, are iden-
tified. The Level 2 product is defined in the MODIS orbit
geometry covering an area of approximately 2340� 2030
km in the across- and along-track directions, respectively. It
is used to generate all of the higher-level fire products, and
contains the following components: (1) an active fire mask
that flags fires and other relevant pixels (e.g. cloud); (2) a
pixel-level QA image that includes 19 bits of QA informa-
tion about each pixel; (3) a fire pixel table which provides
16 separate pieces of radiometric and internal-algorithm
information about each fire pixel detected within a granule;
(4) extensive mandatory and product-specific metadata.
Product specific metadata within the Level 2 fire product
includes the number of cloud, water, nonfire, fire, unknown,
and other pixels occurring within a granule to simplify
identification of granules containing fire activity. More
detail about these fields is provided in the MOD14 file
specification (ftp://modis-xl.gsfc.nasa.gov/pub/stig_temp/
mlinda/www/LatestFilespecs/).
3.2. The daytime and nighttime Level 2G fire products
(MOD14GD/MOD14GN)
The Level 2 active fire products sensed over a 12-h period
data are binned without resampling into an intermediate data
format referred to as Level 2G (Wolfe, Roy, & Vermote,
1998). The Level 2G format provides a convenient geocoded
data structure for storing granules and enables flexibility for
subsequent temporal compositing and data projection.
3.3. The daily and 8-day composited Level 3 fire products
(MOD14A1/MOD14A2)
The MODIS daily and 8-day Level 3 fire products are
tile-based products, with each product file spanning one of
the 460 MODIS tiles, of which 326 contain land pixels. The
product is a 1-km gridded composite of fire pixels detected
in each grid cell over 1–8 days which make up the
compositing periods. The 8-day composite represents the
maximum value of the individual Level 2 pixels that fell
into each 1-km grid cell over the 8-day compositing period.
3.4. Fire global browse product
Global browse images of the MODIS active fire product
are generated on a daily basis at 5- and 20-km spatial
resolution as Joint Photographic Experts Group (JPEG)
images (Fig. 1). These products show the global distribution
of fires for each day and have been useful for preliminary
QA, allowing easy identification of potential problems such
Table 1
MODIS current and planned fire products
MODIS fire product ESDT Release date
Level 2 fire product MOD14 February 2001
Rapid Response product – April 2001
Level 2G Daily
Daytime Fire Product
MOD14GD November 2000
Level 2D Daily
Nighttime Fire Product
MOD14GN November 2000
Level 3 Daily
Fire Product
MOD14A1 November 2000
Level 3 8-Day
Summary Fire Product
MOD14A2 August 2000
Global Daily Fire
QA Browse Imagery
– November 2000
1j Global Climate
Modeling Grid
Product (planned)
MOD14CMG1 Fall 2002
10-km Global Climate
Modeling Grid
Product (Planned)
MOD14CMG2 Fall 2002
The ESDT (‘‘Earth Science Data Type’’) is a unique descriptor assigned to
each MODIS product. As the rapid response and global browse fire
products are not distributed from the ECS DAACs, no ESDTs are necessary
for these products.
C.O. Justice et al. / Remote Sensing of Environment 83 (2002) 244–262246
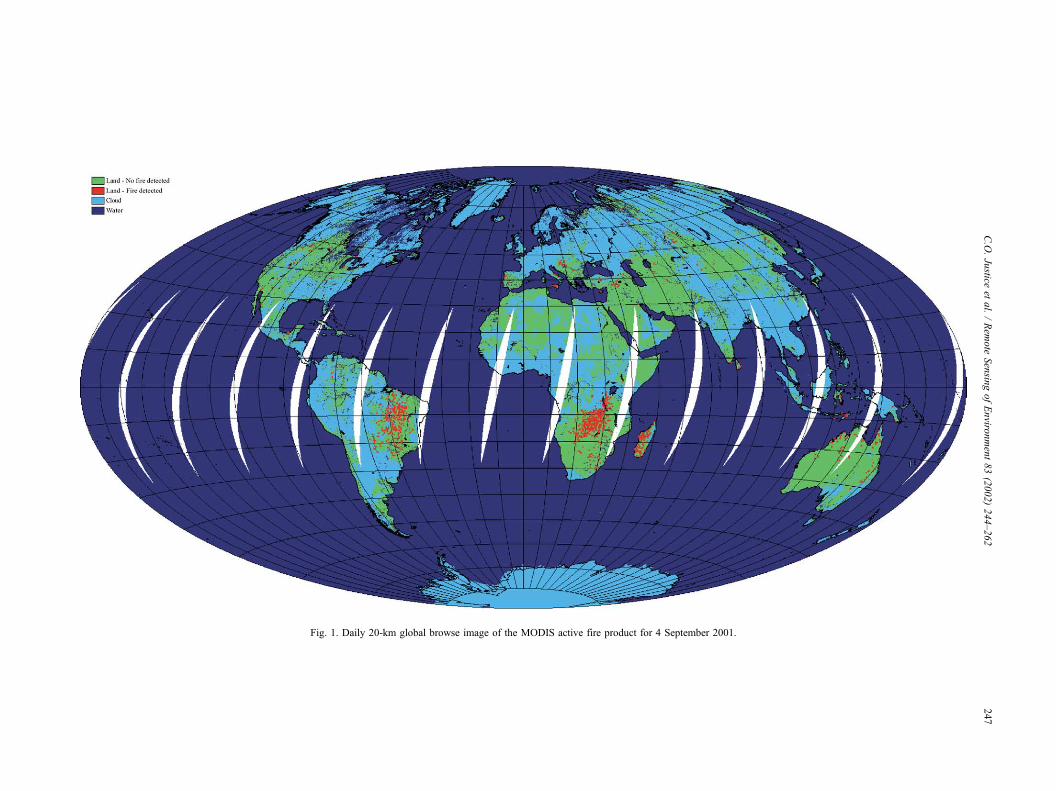
Fig. 1. Daily 20-km global browse image of the MODIS active fire product for 4 September 2001.
C.O.Justice
etal./Rem
ote
Sensin
gofEnviro
nment83(2002)244–262
247
as excessive false alarms in a particular region. The browse
product provides a convenient tool for quickly assessing
areas and changes in fire activity. The browse products for
all MODIS land products are available from the MODIS
Land Global Browse web site (http://modland.nascom.nasa.
gov/browse/).
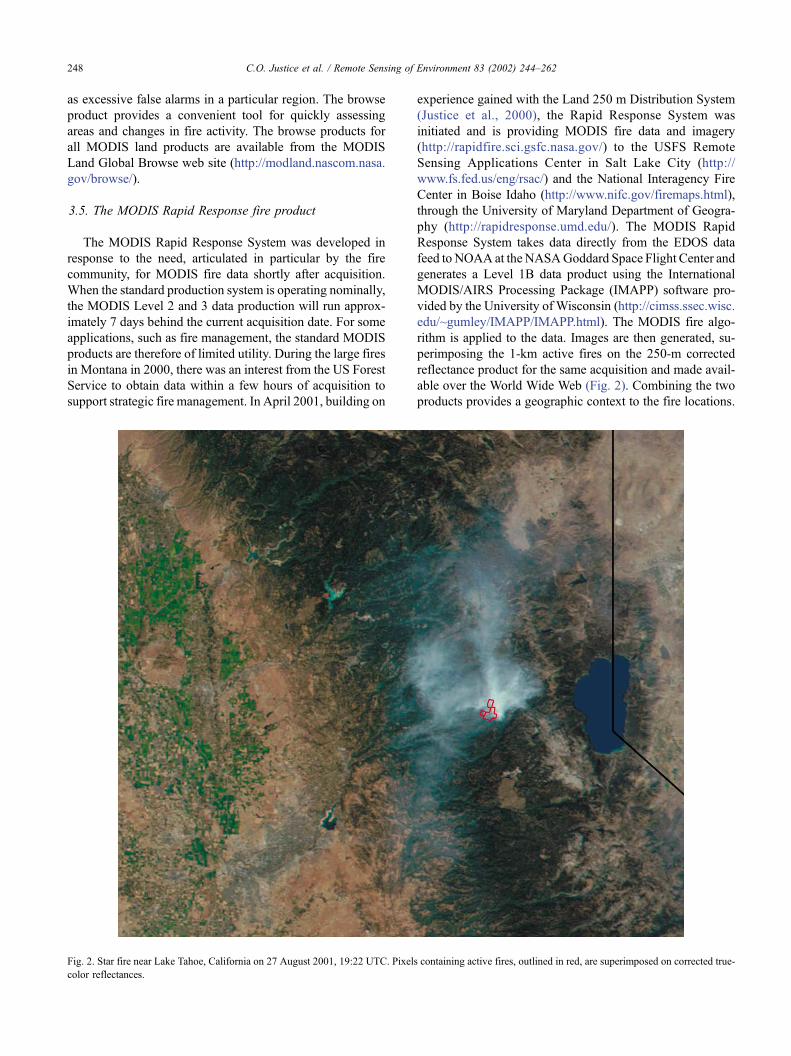
3.5. The MODIS Rapid Response fire product
The MODIS Rapid Response System was developed in
response to the need, articulated in particular by the fire
community, for MODIS fire data shortly after acquisition.
When the standard production system is operating nominally,
the MODIS Level 2 and 3 data production will run approx-
imately 7 days behind the current acquisition date. For some
applications, such as fire management, the standard MODIS
products are therefore of limited utility. During the large fires
in Montana in 2000, there was an interest from the US Forest
Service to obtain data within a few hours of acquisition to
support strategic fire management. In April 2001, building on
experience gained with the Land 250 m Distribution System
(Justice et al., 2000), the Rapid Response System was
initiated and is providing MODIS fire data and imagery
(http://rapidfire.sci.gsfc.nasa.gov/) to the USFS Remote
Sensing Applications Center in Salt Lake City (http://
www.fs.fed.us/eng/rsac/) and the National Interagency Fire
Center in Boise Idaho (http://www.nifc.gov/firemaps.html),
through the University of Maryland Department of Geogra-
phy (http://rapidresponse.umd.edu/). The MODIS Rapid
Response System takes data directly from the EDOS data
feed to NOAAat the NASAGoddard Space Flight Center and
generates a Level 1B data product using the International
MODIS/AIRS Processing Package (IMAPP) software pro-
vided by the University of Wisconsin (http://cimss.ssec.wisc.
edu/~gumley/IMAPP/IMAPP.html). The MODIS fire algo-
rithm is applied to the data. Images are then generated, su-
perimposing the 1-km active fires on the 250-m corrected
reflectance product for the same acquisition and made avail-
able over the World Wide Web (Fig. 2). Combining the two
products provides a geographic context to the fire locations.
Fig. 2. Star fire near Lake Tahoe, California on 27 August 2001, 19:22 UTC. Pixels containing active fires, outlined in red, are superimposed on corrected true-
color reflectances.
C.O. Justice et al. / Remote Sensing of Environment 83 (2002) 244–262248
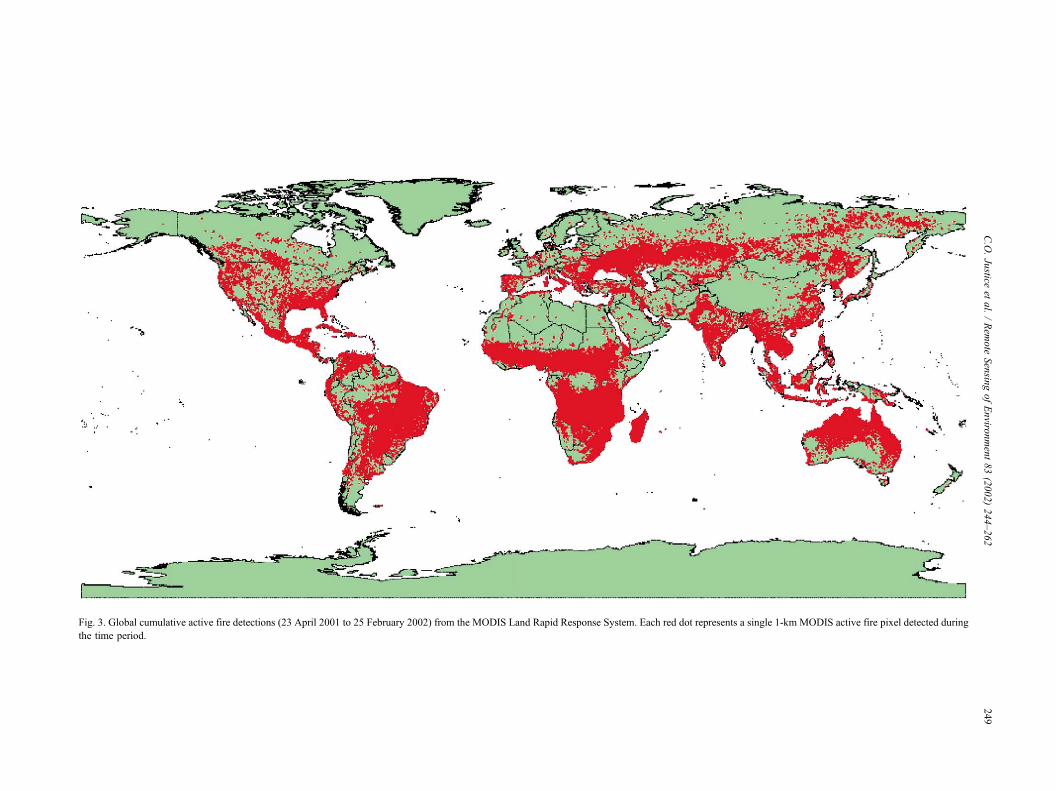
Fig. 3. Global cumulative active fire detections (23 April 2001 to 25 February 2002) from the MODIS Land Rapid Response System. Each red dot represents a single 1-km MODIS active fire pixel detected during
the time period.
C.O.Justice
etal./Rem
ote
Sensin
gofEnviro
nment83(2002)244–262
249
Daily distributions of active fire at 1 km are made available
within 2–4 h of acquisition. Active fire locations are sent to a
server for FTP distribution to a number of operational fire and
forest monitoring organizations around the world.
This international outreach activity, providing improved
data access, is being undertaken in the framework of the
Global Observation of Forest Cover/Global Observation of
Land Dynamics (GOFC/GOLD) Program (Ahern et al.,
2001; http://www.gofc.org). Fig. 3 shows the global distri-
bution of MODIS fire counts from April to February 2001.
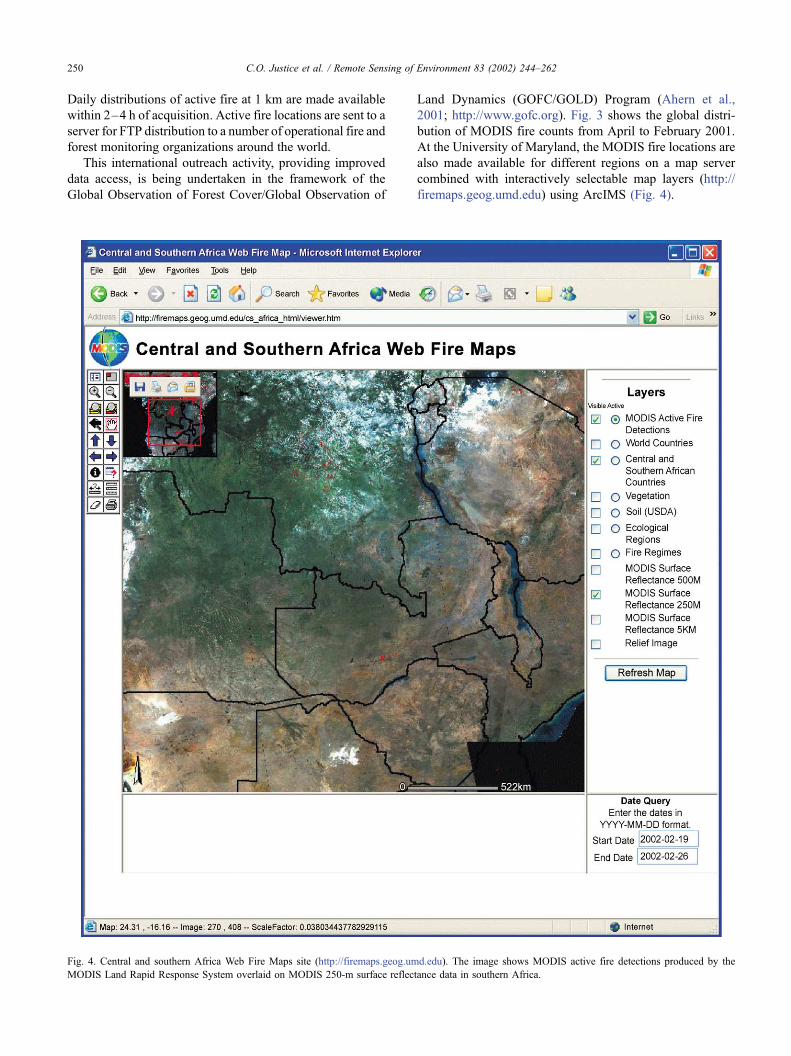
At the University of Maryland, the MODIS fire locations are
also made available for different regions on a map server
combined with interactively selectable map layers (http://
firemaps.geog.umd.edu) using ArcIMS (Fig. 4).
Fig. 4. Central and southern Africa Web Fire Maps site (http://firemaps.geog.umd.edu). The image shows MODIS active fire detections produced by the
MODIS Land Rapid Response System overlaid on MODIS 250-m surface reflectance data in southern Africa.
C.O. Justice et al. / Remote Sensing of Environment 83 (2002) 244–262250
4. Product quality assessment
4.1. Quality assessment activities
During the first several months following launch,
detailed product quality assurance activities were applied
to the MODIS fire products. These activities included daily
inspection of global browse imagery, automated inspection
of selected Level 2 product granules, and detailed exami-
nation of individual L1B orbit granules and the correspond-
ing fire product. This was appropriate given the relative
immaturity of both the 1B data and the higher-level derived
fire products. However, following revisions to the algo-
rithm, corrections to the production code made during 2000,
and the substantial improvement in data quality in Novem-
ber 2000, such an intensive QA effort became unnecessary.
Current QA activities consist of periodic inspection of the
active fire global browse and Rapid Response products and
investigation of the granules follows using one or more of
the other methods discussed above.
4.2. Instrument performance and fire detection
The instrument performance has had a direct effect on the
quality of the fire products. An ongoing issue affecting the
MODIS active fire product is the calibration of channel 21,
the principal fire band. The pre-launch saturation require-
ment for this band was 500 K. However, pre-launch testing
only involved temperatures up to 340 K, which is 3.5% of
the channel’s full radiance. Attempts will be made to use
observations of the moon and published mid-infrared lunar
radiances for in-orbit calibration. The actual saturation level
of channel 21 remains unknown and cannot be assumed to
be linear.
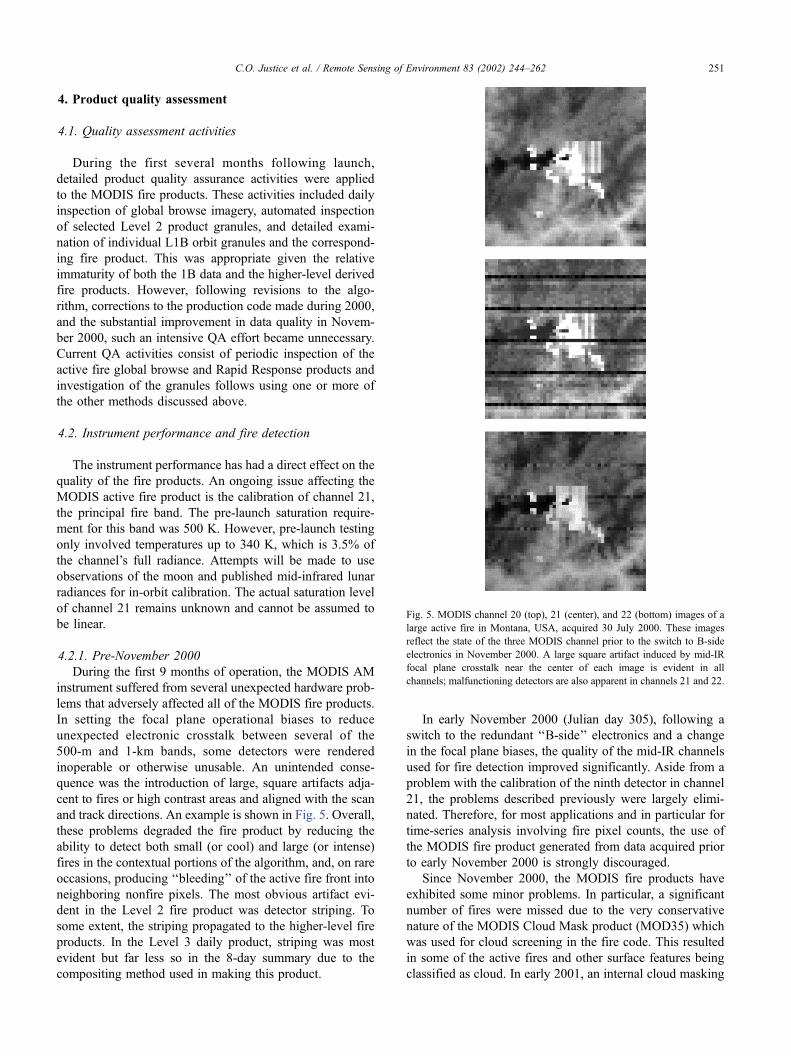
4.2.1. Pre-November 2000
During the first 9 months of operation, the MODIS AM
instrument suffered from several unexpected hardware prob-
lems that adversely affected all of the MODIS fire products.
In setting the focal plane operational biases to reduce
unexpected electronic crosstalk between several of the
500-m and 1-km bands, some detectors were rendered
inoperable or otherwise unusable. An unintended conse-
quence was the introduction of large, square artifacts adja-
cent to fires or high contrast areas and aligned with the scan
and track directions. An example is shown in Fig. 5. Overall,
these problems degraded the fire product by reducing the
ability to detect both small (or cool) and large (or intense)
fires in the contextual portions of the algorithm, and, on rare
occasions, producing ‘‘bleeding’’ of the active fire front into
neighboring nonfire pixels. The most obvious artifact evi-
dent in the Level 2 fire product was detector striping. To
some extent, the striping propagated to the higher-level fire
products. In the Level 3 daily product, striping was most
evident but far less so in the 8-day summary due to the
compositing method used in making this product.
In early November 2000 (Julian day 305), following a
switch to the redundant ‘‘B-side’’ electronics and a change
in the focal plane biases, the quality of the mid-IR channels
used for fire detection improved significantly. Aside from a
problem with the calibration of the ninth detector in channel
21, the problems described previously were largely elimi-
nated. Therefore, for most applications and in particular for
time-series analysis involving fire pixel counts, the use of
the MODIS fire product generated from data acquired prior
to early November 2000 is strongly discouraged.
Since November 2000, the MODIS fire products have
exhibited some minor problems. In particular, a significant
number of fires were missed due to the very conservative
nature of the MODIS Cloud Mask product (MOD35) which
was used for cloud screening in the fire code. This resulted
in some of the active fires and other surface features being
classified as cloud. In early 2001, an internal cloud masking
Fig. 5. MODIS channel 20 (top), 21 (center), and 22 (bottom) images of a
large active fire in Montana, USA, acquired 30 July 2000. These images
reflect the state of the three MODIS channel prior to the switch to B-side
electronics in November 2000. A large square artifact induced by mid-IR
focal plane crosstalk near the center of each image is evident in all
channels; malfunctioning detectors are also apparent in channels 21 and 22.
C.O. Justice et al. / Remote Sensing of Environment 83 (2002) 244–262 251
procedure was incorporated into the production code to
alleviate this problem. This procedure will remain in use
until improvements are made to the cloud mask product. A
complete summary of all known problems associated with
the fire products can be found on the MODLAND Quality
Assurance (QA) web site (http://landdb1.nascom.nasa.gov/
QA_WWW/qahome.html).
4.2.2. Post-July 2001
On 15 June 2001, the MODIS instrument was shut down
in response to a problem with the B-side electronics power
supply. On 2 July 2001, normal operations were restored
using the A-side electronics and associated power supply.
The decision was made to stay with the A-side. Although
the overall quality of MODIS data following this event is
good, significant striping is currently present in channels 21
and 22, resulting in some degradation of the fire products.
4.3. Current algorithm performance
The detection algorithm is currently functioning reason-
ably well following several post-launch revisions. Some
sensitivity to relatively small yet obvious fires has been
sacrificed to reduce persistent false detections occurring in
regions of hot, reflective exposed soil. Nevertheless, some of
these persistent false alarms remain, particularly in northern
Ethiopia. Not unexpectedly, most are caused by the algo-
rithm’s absolute threshold tests. To restore detection of these
small fires and reduce the persistent false alarms, a major
algorithm revision is under development and will be incor-
porated in the operational processing system in mid-2002
(Giglio, Descloitres, Justice, & Kaufman, in preparation).
5. MODIS fire validation
Validation requires an independent source with which to
compare the MODIS product. This source should have a
known level of accuracy and the comparison should be done
at a globally representative set of sites (Justice et al., 2000).
MODIS fire product validation is being undertaken through a
series of ongoing collaborative intercomparisons with other
fire products and with a global sample of ASTER data. In
addition, a number of field-based validation activities have
been established in collaboration with international fire
groups, through the GOFC/GOLD-Fire program and in
collaboration with the Land Product Validation (LPV) sub-
group of the Calibration and Validation Working Group of
the Committee on Earth Observation Satellites (CEOS)
(Morisette, Justice, Pereira, Gregoire, & Frost, 2001).
Table 2
Scene information for the MODIS to ASTER comparison
Scene
ID
# of MODIS
pixels
# of MODIS
fire pixels
(MOD14= 1)
# of MODIS
pixels containing
ASTER fire pixels
MODIS
granule ID
ASTER
granule ID
A 3881 5 19 A2000328.0920.002.2001008214203 pg-PR1B0000-2000120602_037_001
B 3923 13 52 A2000328.0920.002.2001008214203 pg-PR1B0000-2000120602_039_001
C 3890 14 46 A2000328.0920.002.2001008214203 pg-PR1B0000-2000120602_108_001
D 3865 4 14 A2000328.0925.002.2001008214916 pg-PR1B0000-2000120602_121_001
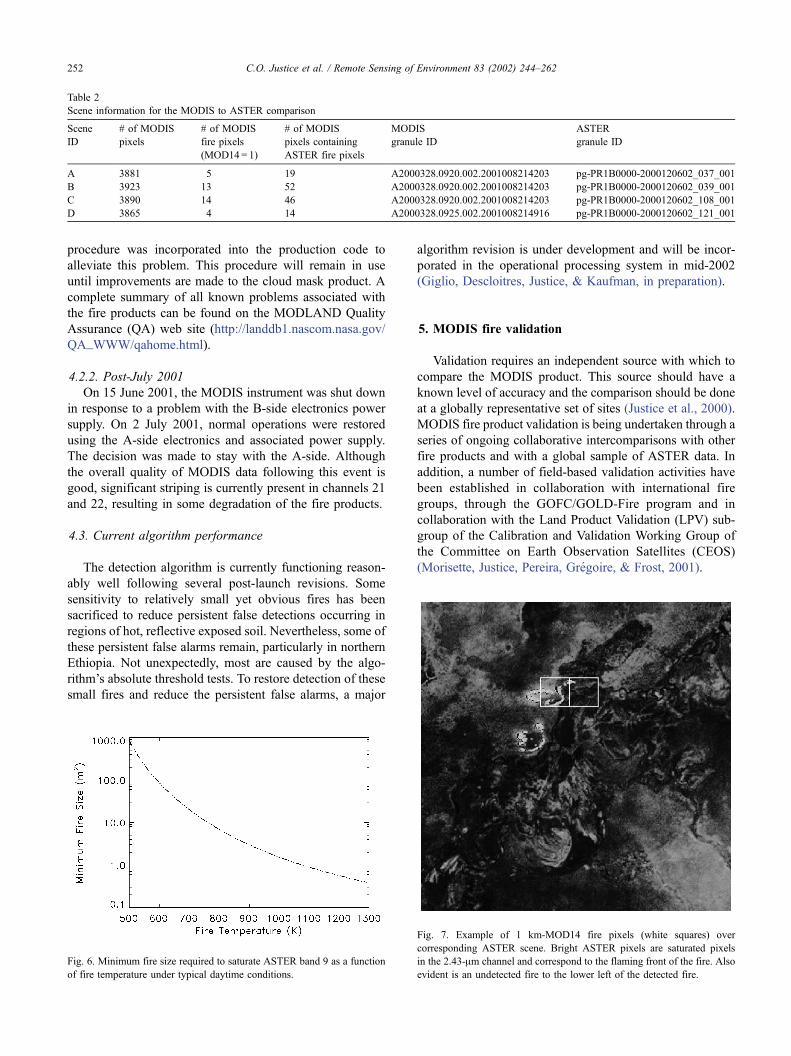
Fig. 6. Minimum fire size required to saturate ASTER band 9 as a function
of fire temperature under typical daytime conditions.
Fig. 7. Example of 1 km-MOD14 fire pixels (white squares) over
corresponding ASTER scene. Bright ASTER pixels are saturated pixels
in the 2.43-Am channel and correspond to the flaming front of the fire. Also
evident is an undetected fire to the lower left of the detected fire.
C.O. Justice et al. / Remote Sensing of Environment 83 (2002) 244–262252
Conventional approaches to the validation of satellite-
derived active fire products involve ground and aircraft
measurements of prescribed burns and opportunistic aircraft
measurements over wildfires. These approaches have here-
tofore been extremely difficult due to the dynamic and
transient nature of active fires, aircraft expense, and prac-
tical limitations of coordinating cloud-free satellite over-
passes with prescribed burns. However, simultaneous
acquisition of independent high spatial resolution observa-
tions of fires is now possible for MODIS. The ASTER
instrument, also on-board the Terra Platform, has 15 spectral
bands from 0.5 to 10 Am at resolutions from 15 to 90 m
(Yamaguchi, Kahle, Tsu, Kawakami, & Pniel, 1998). Using
ASTER data, we are able to obtain a global sample of high-
resolution fire detection. These are then projected onto the
coincident MODIS pixels for statistical comparison. Here
we describe initial validation results based on four ASTER
scenes falling within two MODIS granules over southern
Africa (Table 2). MODIS fire product validation is ongoing
and will build on the type of MODIS/ASTER comparison
described here, at more sites covering each continent and
major biome.
The ASTER data first were converted to a high-resolu-
tion fire map with a simple threshold. Fig. 6 shows that fires
less than 1000 m2 will saturate the ASTER band 9 (2.4 Am),
and that a simple saturation threshold for cloud-free scenes
can be used to identify fires in ASTER data. On these high-
resolution fire maps, fire pixels within 150 m of each other
were grouped together to form a single fire ‘‘cluster’’. The
ASTER fire clusters and MODIS pixels were then associ-
ated by mapping the 1 by 1 km square of each MODIS
pixels onto the ASTER data (Fig. 7). A registration accuracy
of better than 300 m can be estimated according to the
geolocation accuracy of both instruments; less than 100 m
for ASTER (Fujisada, Iwasaki, & Hara, 2001) and less than
200 m for MODIS (Wolfe et al., 2002, this issue).
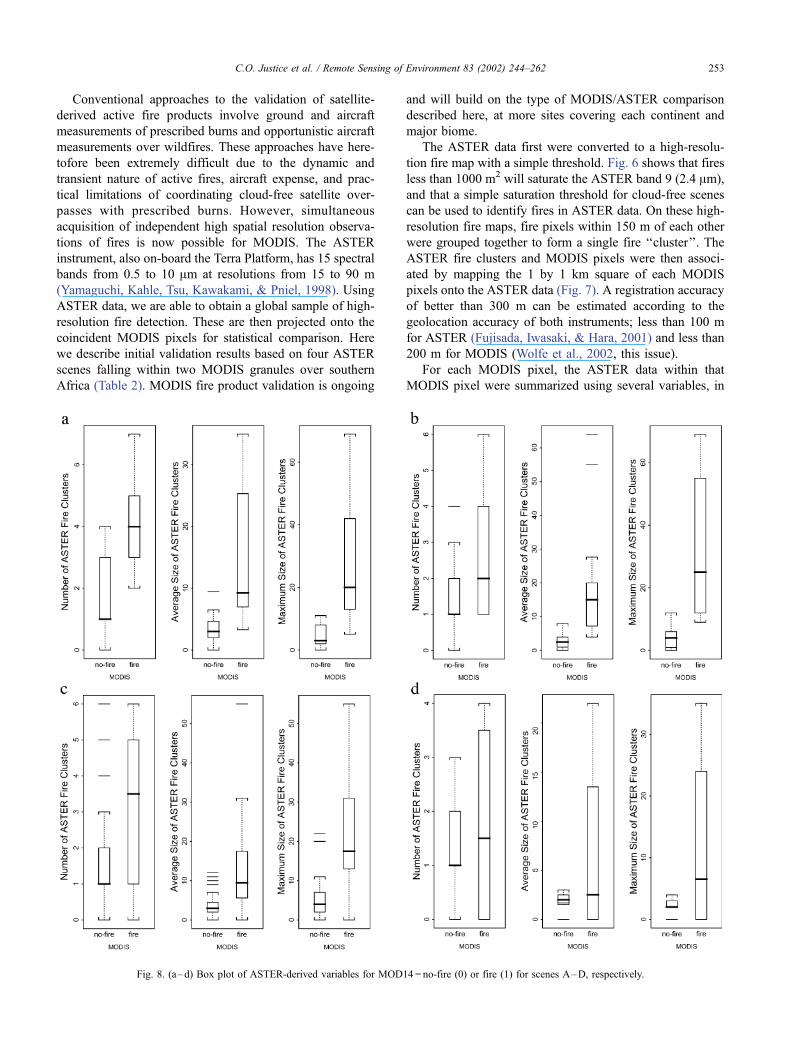
For each MODIS pixel, the ASTER data within that
MODIS pixel were summarized using several variables, in
Fig. 8. (a–d) Box plot of ASTER-derived variables for MOD14= no-fire (0) or fire (1) for scenes A–D, respectively.
C.O. Justice et al. / Remote Sensing of Environment 83 (2002) 244–262 253
particular: (1) the number of ASTER clusters within the
MODIS pixel, (2) the average size of those clusters, and (3)
the maximum size of the ASTER fire clusters. The distri-
butions of these variables were then separated into two
groups based on whether their corresponding MODIS pixel
was classified as no-fire or fire. The distributions are shown
as box plots in Fig. 8. The distributions for each of the three
ASTER-derived variables are higher for those pixels clas-
sified by MOD14 as fire. This indicates that the MOD14
product behaves appropriately with respect to the
observed ASTER data. That is, more and larger fire
clusters are associated with those MOD14 pixels classi-
fied as fire.
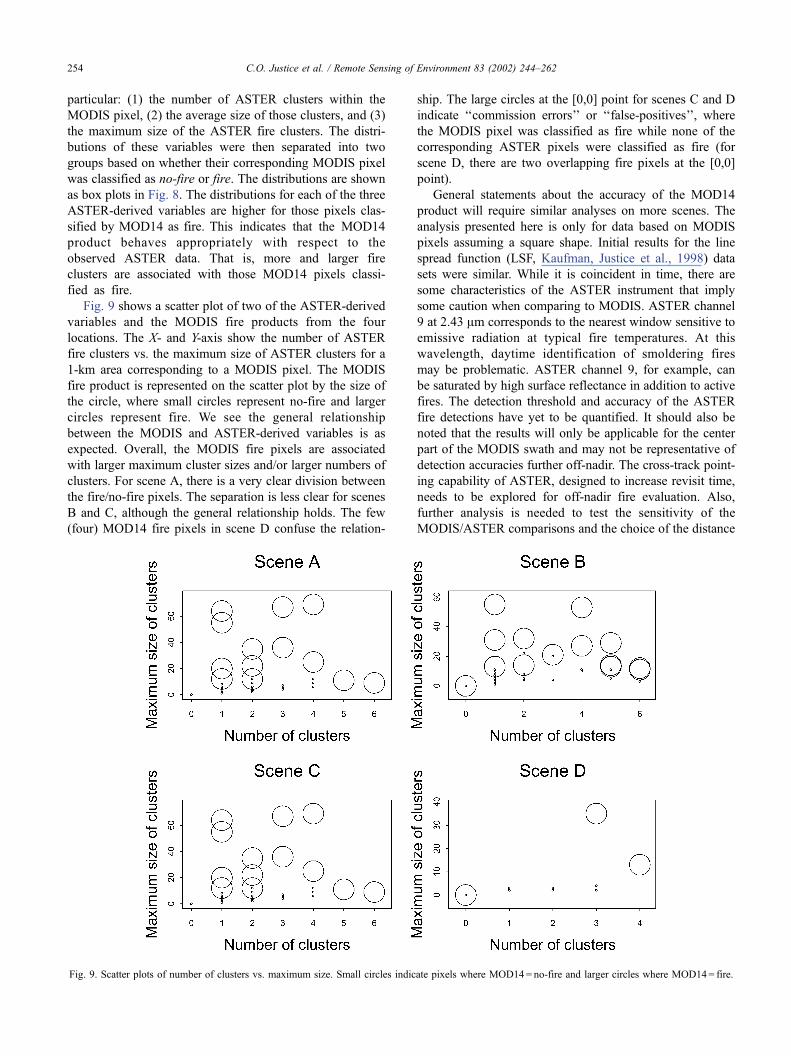
Fig. 9 shows a scatter plot of two of the ASTER-derived
variables and the MODIS fire products from the four
locations. The X- and Y-axis show the number of ASTER
fire clusters vs. the maximum size of ASTER clusters for a
1-km area corresponding to a MODIS pixel. The MODIS
fire product is represented on the scatter plot by the size of
the circle, where small circles represent no-fire and larger
circles represent fire. We see the general relationship
between the MODIS and ASTER-derived variables is as
expected. Overall, the MODIS fire pixels are associated
with larger maximum cluster sizes and/or larger numbers of
clusters. For scene A, there is a very clear division between
the fire/no-fire pixels. The separation is less clear for scenes
B and C, although the general relationship holds. The few
(four) MOD14 fire pixels in scene D confuse the relation-
ship. The large circles at the [0,0] point for scenes C and D
indicate ‘‘commission errors’’ or ‘‘false-positives’’, where
the MODIS pixel was classified as fire while none of the
corresponding ASTER pixels were classified as fire (for
scene D, there are two overlapping fire pixels at the [0,0]
point).
General statements about the accuracy of the MOD14
product will require similar analyses on more scenes. The
analysis presented here is only for data based on MODIS
pixels assuming a square shape. Initial results for the line
spread function (LSF, Kaufman, Justice et al., 1998) data
sets were similar. While it is coincident in time, there are
some characteristics of the ASTER instrument that imply
some caution when comparing to MODIS. ASTER channel
9 at 2.43 Am corresponds to the nearest window sensitive to
emissive radiation at typical fire temperatures. At this
wavelength, daytime identification of smoldering fires
may be problematic. ASTER channel 9, for example, can
be saturated by high surface reflectance in addition to active
fires. The detection threshold and accuracy of the ASTER
fire detections have yet to be quantified. It should also be
noted that the results will only be applicable for the center
part of the MODIS swath and may not be representative of
detection accuracies further off-nadir. The cross-track point-
ing capability of ASTER, designed to increase revisit time,
needs to be explored for off-nadir fire evaluation. Also,
further analysis is needed to test the sensitivity of the
MODIS/ASTER comparisons and the choice of the distance
Fig. 9. Scatter plots of number of clusters vs. maximum size. Small circles indicate pixels where MOD14= no-fire and larger circles where MOD14= fire.
C.O. Justice et al. / Remote Sensing of Environment 83 (2002) 244–262254
rule for clustering. A comparison using more ASTER scenes
from different fire regimes around the world is underway.
6. Planned products
The MODIS fire team strategy has been to phase-in the
various fire products. Starting with the Terra active fire
products once the instrument was characterized, progressing
to the burned area product as the geolocation accuracy of the
system was refined, and then to generate a coarse-Climate
Modeling fire product, as the fire algorithm becomes stable
and the data system has the capacity to reprocess data and
generate consistent time-series data sets.
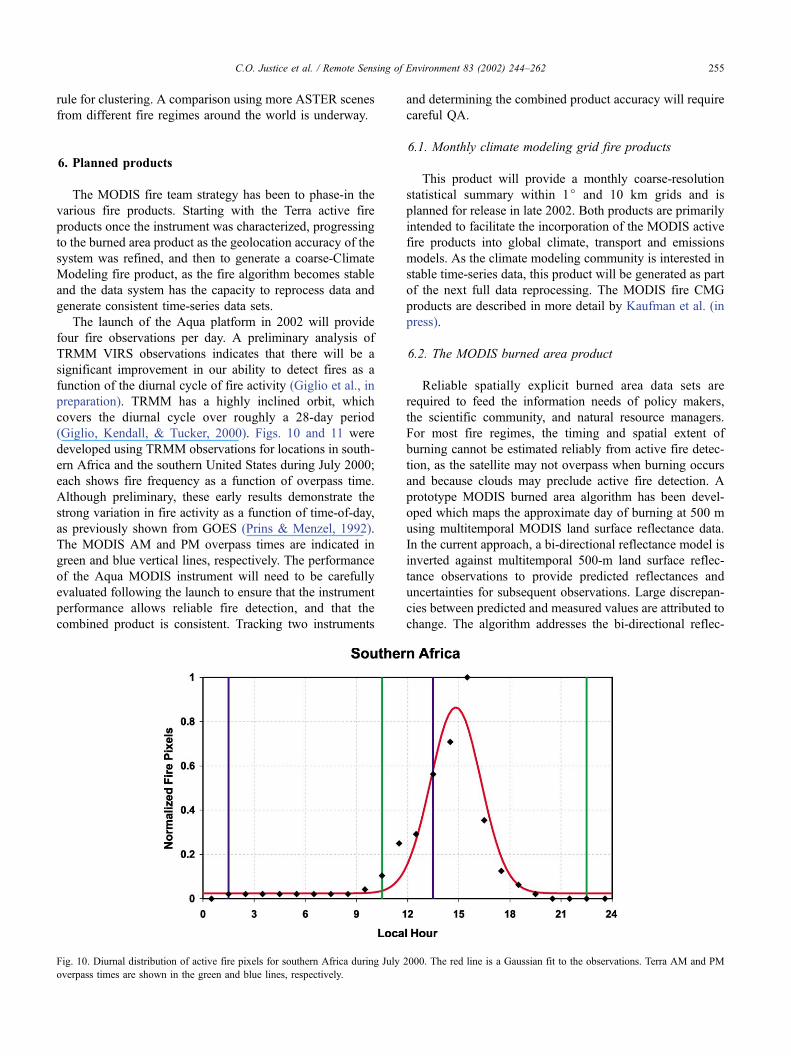
The launch of the Aqua platform in 2002 will provide
four fire observations per day. A preliminary analysis of
TRMM VIRS observations indicates that there will be a
significant improvement in our ability to detect fires as a
function of the diurnal cycle of fire activity (Giglio et al., in
preparation). TRMM has a highly inclined orbit, which
covers the diurnal cycle over roughly a 28-day period
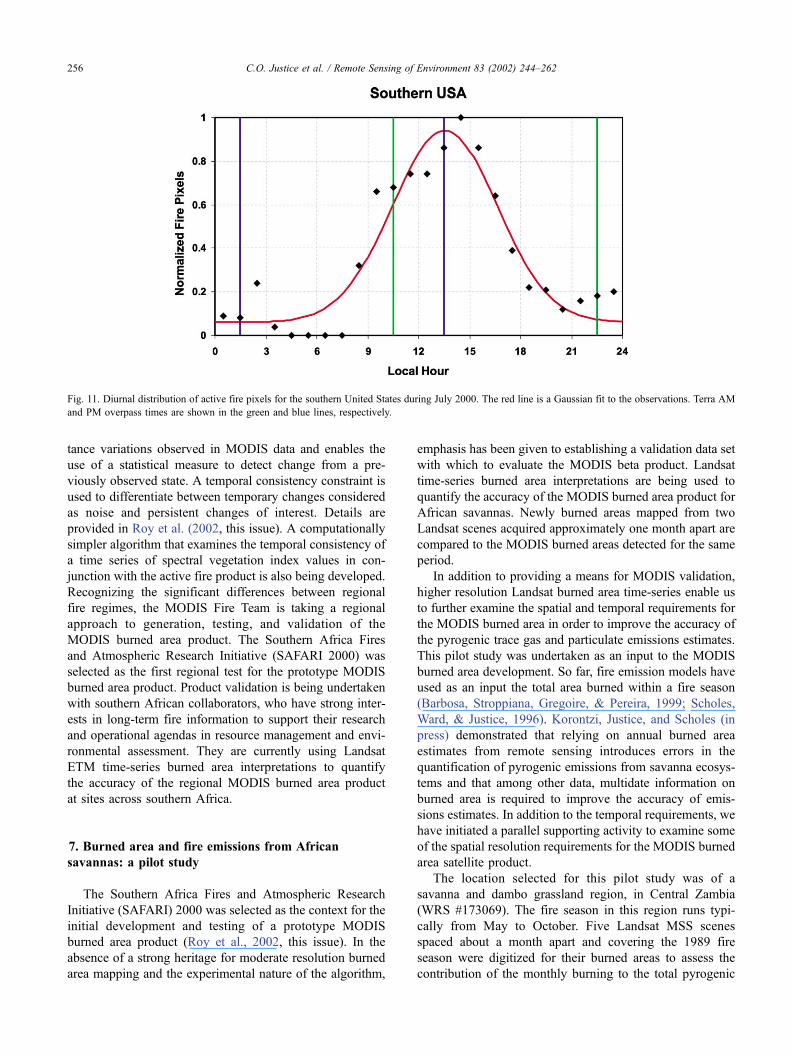
(Giglio, Kendall, & Tucker, 2000). Figs. 10 and 11 were
developed using TRMM observations for locations in south-
ern Africa and the southern United States during July 2000;
each shows fire frequency as a function of overpass time.
Although preliminary, these early results demonstrate the
strong variation in fire activity as a function of time-of-day,
as previously shown from GOES (Prins & Menzel, 1992).
The MODIS AM and PM overpass times are indicated in
green and blue vertical lines, respectively. The performance
of the Aqua MODIS instrument will need to be carefully
evaluated following the launch to ensure that the instrument
performance allows reliable fire detection, and that the
combined product is consistent. Tracking two instruments
and determining the combined product accuracy will require
careful QA.
6.1. Monthly climate modeling grid fire products
This product will provide a monthly coarse-resolution
statistical summary within 1j and 10 km grids and is
planned for release in late 2002. Both products are primarily
intended to facilitate the incorporation of the MODIS active
fire products into global climate, transport and emissions
models. As the climate modeling community is interested in
stable time-series data, this product will be generated as part
of the next full data reprocessing. The MODIS fire CMG
products are described in more detail by Kaufman et al. (in
press).
6.2. The MODIS burned area product
Reliable spatially explicit burned area data sets are
required to feed the information needs of policy makers,
the scientific community, and natural resource managers.
For most fire regimes, the timing and spatial extent of
burning cannot be estimated reliably from active fire detec-
tion, as the satellite may not overpass when burning occurs
and because clouds may preclude active fire detection. A
prototype MODIS burned area algorithm has been devel-
oped which maps the approximate day of burning at 500 m
using multitemporal MODIS land surface reflectance data.
In the current approach, a bi-directional reflectance model is
inverted against multitemporal 500-m land surface reflec-
tance observations to provide predicted reflectances and
uncertainties for subsequent observations. Large discrepan-
cies between predicted and measured values are attributed to
change. The algorithm addresses the bi-directional reflec-
Fig. 10. Diurnal distribution of active fire pixels for southern Africa during July 2000. The red line is a Gaussian fit to the observations. Terra AM and PM
overpass times are shown in the green and blue lines, respectively.
C.O. Justice et al. / Remote Sensing of Environment 83 (2002) 244–262 255
tance variations observed in MODIS data and enables the
use of a statistical measure to detect change from a pre-
viously observed state. A temporal consistency constraint is
used to differentiate between temporary changes considered
as noise and persistent changes of interest. Details are
provided in Roy et al. (2002, this issue). A computationally
simpler algorithm that examines the temporal consistency of
a time series of spectral vegetation index values in con-
junction with the active fire product is also being developed.
Recognizing the significant differences between regional
fire regimes, the MODIS Fire Team is taking a regional
approach to generation, testing, and validation of the
MODIS burned area product. The Southern Africa Fires
and Atmospheric Research Initiative (SAFARI 2000) was
selected as the first regional test for the prototype MODIS
burned area product. Product validation is being undertaken
with southern African collaborators, who have strong inter-
ests in long-term fire information to support their research
and operational agendas in resource management and envi-
ronmental assessment. They are currently using Landsat
ETM time-series burned area interpretations to quantify
the accuracy of the regional MODIS burned area product
at sites across southern Africa.
7. Burned area and fire emissions from African
savannas: a pilot study
The Southern Africa Fires and Atmospheric Research
Initiative (SAFARI) 2000 was selected as the context for the
initial development and testing of a prototype MODIS
burned area product (Roy et al., 2002, this issue). In the
absence of a strong heritage for moderate resolution burned
area mapping and the experimental nature of the algorithm,
emphasis has been given to establishing a validation data set
with which to evaluate the MODIS beta product. Landsat
time-series burned area interpretations are being used to
quantify the accuracy of the MODIS burned area product for
African savannas. Newly burned areas mapped from two
Landsat scenes acquired approximately one month apart are
compared to the MODIS burned areas detected for the same
period.
In addition to providing a means for MODIS validation,
higher resolution Landsat burned area time-series enable us
to further examine the spatial and temporal requirements for
the MODIS burned area in order to improve the accuracy of
the pyrogenic trace gas and particulate emissions estimates.
This pilot study was undertaken as an input to the MODIS
burned area development. So far, fire emission models have
used as an input the total area burned within a fire season
(Barbosa, Stroppiana, Gregoire, & Pereira, 1999; Scholes,
Ward, & Justice, 1996). Korontzi, Justice, and Scholes (in
press) demonstrated that relying on annual burned area
estimates from remote sensing introduces errors in the
quantification of pyrogenic emissions from savanna ecosys-
tems and that among other data, multidate information on
burned area is required to improve the accuracy of emis-
sions estimates. In addition to the temporal requirements, we
have initiated a parallel supporting activity to examine some
of the spatial resolution requirements for the MODIS burned
area satellite product.
The location selected for this pilot study was of a
savanna and dambo grassland region, in Central Zambia
(WRS #173069). The fire season in this region runs typi-
cally from May to October. Five Landsat MSS scenes
spaced about a month apart and covering the 1989 fire
season were digitized for their burned areas to assess the
contribution of the monthly burning to the total pyrogenic
Fig. 11. Diurnal distribution of active fire pixels for the southern United States during July 2000. The red line is a Gaussian fit to the observations. Terra AM
and PM overpass times are shown in the green and blue lines, respectively.
C.O. Justice et al. / Remote Sensing of Environment 83 (2002) 244–262256
emissions over the entire fire season and compare them with
the total burned area approach to estimate emissions. Fur-
thermore, the contribution of burn scars smaller than 1 km2
to the monthly and total emissions was calculated.
From Fig. 12, it can be seen that there was more than a
doubling in CO2 from June to July. After this time, CO2
emissions reached a plateau. This increase in CO2 as the dry
season progressed was primarily due to the higher combus-
tion completeness as the season progresses, and to a lesser
extent due to the small increase of area burned in July as
compared to June. The temporal distribution of area burned
was 20% May–June, 24% June–July, 24% July–August,
and 32% August–September. At the same time, emission
factors did not vary significantly from July to September
(Korontzi et al., in press), which in combination with the
almost even distribution of area burned could explain the
similarity in CO2 emissions from July through September.
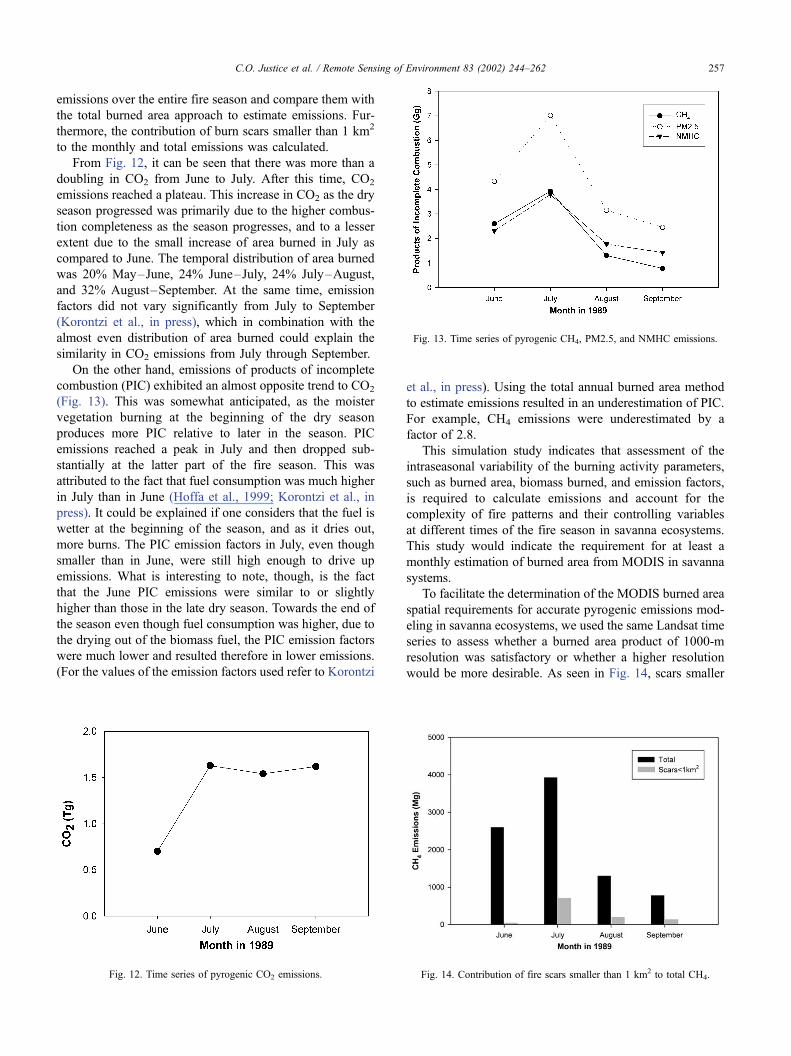
On the other hand, emissions of products of incomplete
combustion (PIC) exhibited an almost opposite trend to CO2
(Fig. 13). This was somewhat anticipated, as the moister
vegetation burning at the beginning of the dry season
produces more PIC relative to later in the season. PIC
emissions reached a peak in July and then dropped sub-
stantially at the latter part of the fire season. This was
attributed to the fact that fuel consumption was much higher
in July than in June (Hoffa et al., 1999; Korontzi et al., in
press). It could be explained if one considers that the fuel is
wetter at the beginning of the season, and as it dries out,
more burns. The PIC emission factors in July, even though
smaller than in June, were still high enough to drive up
emissions. What is interesting to note, though, is the fact
that the June PIC emissions were similar to or slightly
higher than those in the late dry season. Towards the end of
the season even though fuel consumption was higher, due to
the drying out of the biomass fuel, the PIC emission factors
were much lower and resulted therefore in lower emissions.
(For the values of the emission factors used refer to Korontzi
et al., in press). Using the total annual burned area method
to estimate emissions resulted in an underestimation of PIC.
For example, CH4 emissions were underestimated by a
factor of 2.8.
This simulation study indicates that assessment of the
intraseasonal variability of the burning activity parameters,
such as burned area, biomass burned, and emission factors,
is required to calculate emissions and account for the
complexity of fire patterns and their controlling variables
at different times of the fire season in savanna ecosystems.
This study would indicate the requirement for at least a
monthly estimation of burned area from MODIS in savanna
systems.
To facilitate the determination of the MODIS burned area
spatial requirements for accurate pyrogenic emissions mod-
eling in savanna ecosystems, we used the same Landsat time
series to assess whether a burned area product of 1000-m
resolution was satisfactory or whether a higher resolution
would be more desirable. As seen in Fig. 14, scars smaller
Fig. 12. Time series of pyrogenic CO2 emissions.
Fig. 13. Time series of pyrogenic CH4, PM2.5, and NMHC emissions.
Fig. 14. Contribution of fire scars smaller than 1 km2 to total CH4.
C.O. Justice et al. / Remote Sensing of Environment 83 (2002) 244–262 257
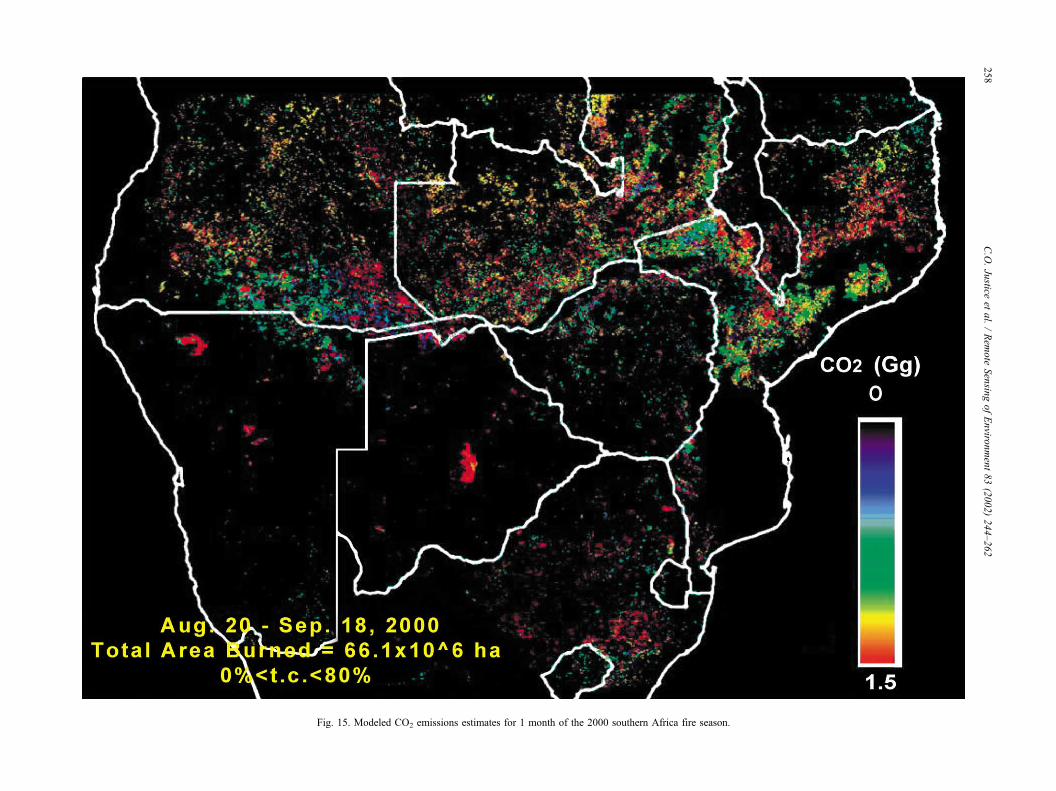
Fig. 15. Modeled CO2 emissions estimates for 1 month of the 2000 southern Africa fire season.
C.O.Justice
etal./Rem
ote
Sensin
gofEnviro
nment83(2002)244–262
258
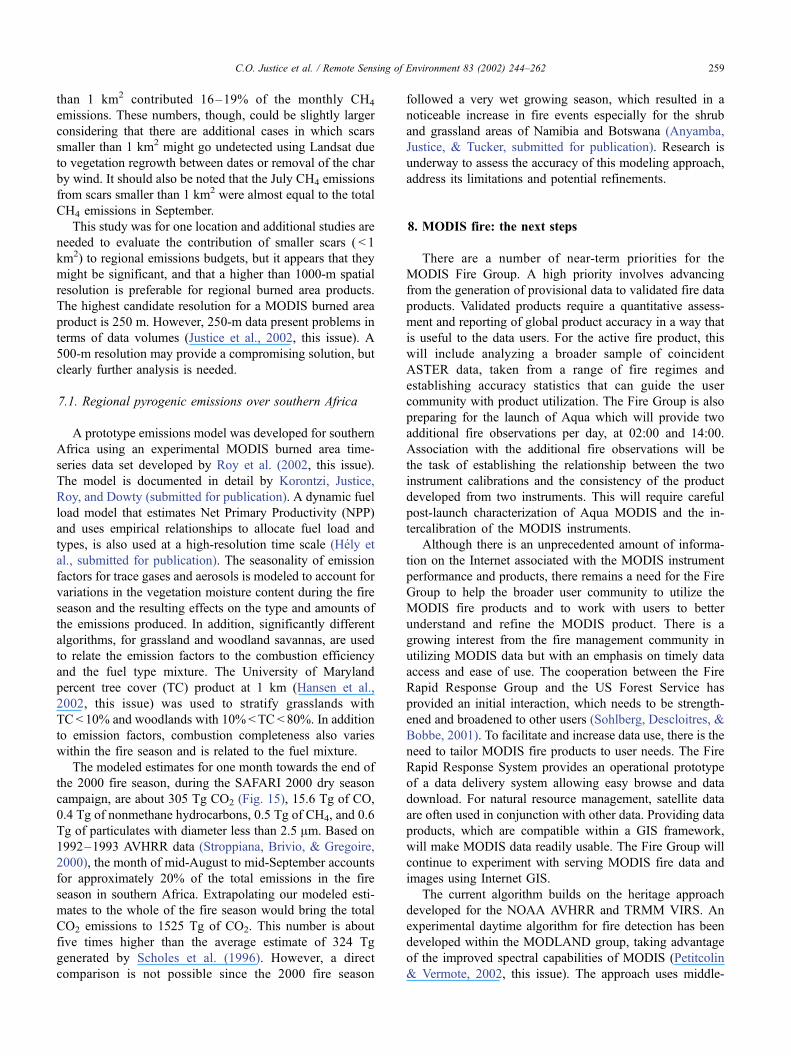
than 1 km2 contributed 16–19% of the monthly CH4
emissions. These numbers, though, could be slightly larger
considering that there are additional cases in which scars
smaller than 1 km2 might go undetected using Landsat due
to vegetation regrowth between dates or removal of the char
by wind. It should also be noted that the July CH4 emissions
from scars smaller than 1 km2 were almost equal to the total
CH4 emissions in September.
This study was for one location and additional studies are
needed to evaluate the contribution of smaller scars ( < 1
km2) to regional emissions budgets, but it appears that they
might be significant, and that a higher than 1000-m spatial
resolution is preferable for regional burned area products.
The highest candidate resolution for a MODIS burned area
product is 250 m. However, 250-m data present problems in
terms of data volumes (Justice et al., 2002, this issue). A
500-m resolution may provide a compromising solution, but
clearly further analysis is needed.
7.1. Regional pyrogenic emissions over southern Africa
A prototype emissions model was developed for southern
Africa using an experimental MODIS burned area time-
series data set developed by Roy et al. (2002, this issue).
The model is documented in detail by Korontzi, Justice,
Roy, and Dowty (submitted for publication). A dynamic fuel
load model that estimates Net Primary Productivity (NPP)
and uses empirical relationships to allocate fuel load and
types, is also used at a high-resolution time scale (Hely et
al., submitted for publication). The seasonality of emission
factors for trace gases and aerosols is modeled to account for
variations in the vegetation moisture content during the fire
season and the resulting effects on the type and amounts of
the emissions produced. In addition, significantly different
algorithms, for grassland and woodland savannas, are used
to relate the emission factors to the combustion efficiency
and the fuel type mixture. The University of Maryland
percent tree cover (TC) product at 1 km (Hansen et al.,
2002, this issue) was used to stratify grasslands with
TC < 10% and woodlands with 10%<TC< 80%. In addition
to emission factors, combustion completeness also varies
within the fire season and is related to the fuel mixture.
The modeled estimates for one month towards the end of
the 2000 fire season, during the SAFARI 2000 dry season
campaign, are about 305 Tg CO2 (Fig. 15), 15.6 Tg of CO,
0.4 Tg of nonmethane hydrocarbons, 0.5 Tg of CH4, and 0.6
Tg of particulates with diameter less than 2.5 Am. Based on
1992–1993 AVHRR data (Stroppiana, Brivio, & Gregoire,
2000), the month of mid-August to mid-September accounts
for approximately 20% of the total emissions in the fire
season in southern Africa. Extrapolating our modeled esti-
mates to the whole of the fire season would bring the total
CO2 emissions to 1525 Tg of CO2. This number is about
five times higher than the average estimate of 324 Tg
generated by Scholes et al. (1996). However, a direct
comparison is not possible since the 2000 fire season
followed a very wet growing season, which resulted in a
noticeable increase in fire events especially for the shrub
and grassland areas of Namibia and Botswana (Anyamba,
Justice, & Tucker, submitted for publication). Research is
underway to assess the accuracy of this modeling approach,
address its limitations and potential refinements.
8. MODIS fire: the next steps
There are a number of near-term priorities for the
MODIS Fire Group. A high priority involves advancing
from the generation of provisional data to validated fire data
products. Validated products require a quantitative assess-
ment and reporting of global product accuracy in a way that
is useful to the data users. For the active fire product, this
will include analyzing a broader sample of coincident
ASTER data, taken from a range of fire regimes and
establishing accuracy statistics that can guide the user
community with product utilization. The Fire Group is also
preparing for the launch of Aqua which will provide two
additional fire observations per day, at 02:00 and 14:00.
Association with the additional fire observations will be
the task of establishing the relationship between the two
instrument calibrations and the consistency of the product
developed from two instruments. This will require careful
post-launch characterization of Aqua MODIS and the in-
tercalibration of the MODIS instruments.
Although there is an unprecedented amount of informa-
tion on the Internet associated with the MODIS instrument
performance and products, there remains a need for the Fire
Group to help the broader user community to utilize the
MODIS fire products and to work with users to better
understand and refine the MODIS product. There is a
growing interest from the fire management community in
utilizing MODIS data but with an emphasis on timely data
access and ease of use. The cooperation between the Fire
Rapid Response Group and the US Forest Service has
provided an initial interaction, which needs to be strength-
ened and broadened to other users (Sohlberg, Descloitres, &
Bobbe, 2001). To facilitate and increase data use, there is the
need to tailor MODIS fire products to user needs. The Fire
Rapid Response System provides an operational prototype
of a data delivery system allowing easy browse and data
download. For natural resource management, satellite data
are often used in conjunction with other data. Providing data
products, which are compatible within a GIS framework,
will make MODIS data readily usable. The Fire Group will
continue to experiment with serving MODIS fire data and
images using Internet GIS.
The current algorithm builds on the heritage approach
developed for the NOAA AVHRR and TRMM VIRS. An
experimental daytime algorithm for fire detection has been
developed within the MODLAND group, taking advantage
of the improved spectral capabilities of MODIS (Petitcolin
& Vermote, 2002, this issue). The approach uses middle-
C.O. Justice et al. / Remote Sensing of Environment 83 (2002) 244–262 259
infrared reflectance and permits a direct per-pixel identifi-
cation of fires, rather than a contextual approach. The
contextual approach makes an assumption that the surround-
ing pixels have the same brightness temperature as the fire
pixel, which is problematic in highly heterogeneous areas.
The next step is to compare the performance of the standard
and experimental algorithm over a broad range of fire
regimes.
While we are in the process of evaluating the perform-
ance of MODIS for fire detection, the design for the next-
generation moderate resolution sensor is underway. The
National Polar Orbiting Environmental Satellite System
(NPOESS) Preparatory Project (NPP) will include the
Visible/Infrared Imager/Radiometer Suite (VIIRS), which
will replace the AVHRR as the operational moderate reso-
lution imager and include several of the characteristics of
MODIS (Townshend & Justice, 2002, this issue). An
intriguing aspect of the proposed VIIRS active fire product
is that instantaneous estimates of average fire temperature
and area must be provided (NPOESS Integrated Program
Office, 1999). Results of a recent analysis by Giglio and
Kendall (2001) indicate that this will be a formidable
challenge, especially given the 750-m nadir resolution of
the VIIRS fire bands. Unfortunately, monitoring fires was
not considered as a high-priority requirement for NPOESS
(Jacobowitz, 1997), and the current instrument specification
reflects this fact. The principal fire bands planned for the
VIIRS include a very high saturation 4-Am channel and a
low-saturation (f 340 K) 11-Am channel. Theoretical cal-
culations and analysis of MODIS data show that, when
observing large active fires, the 11-Am channel as planned
will saturate too frequently and thus significantly hamper
the ability to retrieve fire characteristics of temperature and
area. Methods for working around this limitation are
actively being pursued. At this time, however, the primary
proposal for bypassing this instrument limitation may intro-
duce nontrivial biases in the resulting area and temperature
estimates (Giglio & Justice, submitted for publication).
There are a number of satellite systems being used for
monitoring fires, supported by different space agencies.
These, together with ground-based fire-monitoring systems,
provide the foundation for an international global fire
observing system (Ahern et al., 2001). To realize this goal,
there are a number of areas that will require international
coordination and cooperation. The GOFC/GOLD-Fire pro-
gram has been established to address this need for interna-
tional coordination, with an emphasis on better articulating
user information requirements and working with the fire
data producers to meet those needs (Justice & Korontzi,
2001). GOFC/GOLD is developing observatories for carbon
studies, ecosystem assessment, and natural resource man-
agement, each of which require fire observations. The
MODIS Fire Team is playing an active role in this interna-
tional program. Among the priorities for GOFC/GOLD-Fire
are advocacy for the next generation of operational satellites
to include fire monitoring capabilities (both polar orbiting
and geostationary), coordination and cost sharing to develop
the infrastructure needed for global fire product validation,
improved access to current data sets, and increased involve-
ment of regional networks of fire scientists and managers to
evaluate and utilize the data. As part of this international
program, the MODIS group has been providing Rapid
Response data to international partners and proposing stand-
ards for other systems to provide similar access to fire
location data via the Internet, allowing users to merge fire
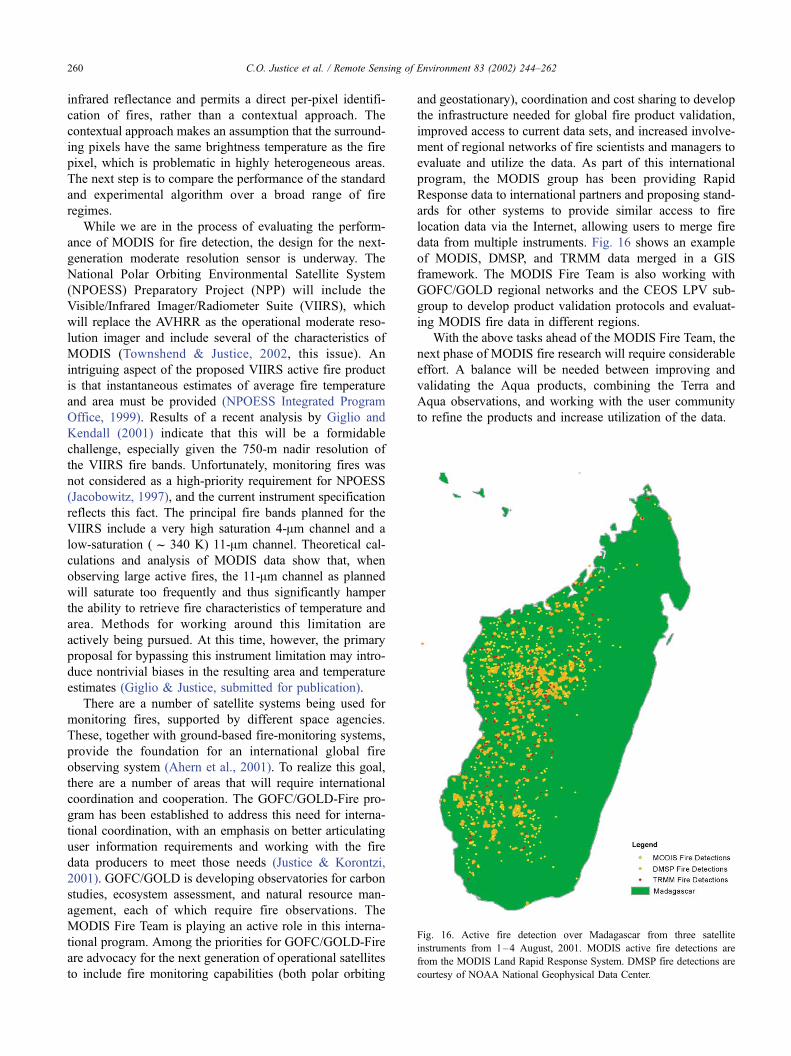
data from multiple instruments. Fig. 16 shows an example
of MODIS, DMSP, and TRMM data merged in a GIS
framework. The MODIS Fire Team is also working with
GOFC/GOLD regional networks and the CEOS LPV sub-
group to develop product validation protocols and evaluat-
ing MODIS fire data in different regions.
With the above tasks ahead of the MODIS Fire Team, the
next phase of MODIS fire research will require considerable
effort. A balance will be needed between improving and
validating the Aqua products, combining the Terra and
Aqua observations, and working with the user community
to refine the products and increase utilization of the data.
Fig. 16. Active fire detection over Madagascar from three satellite
instruments from 1–4 August, 2001. MODIS active fire detections are
from the MODIS Land Rapid Response System. DMSP fire detections are
courtesy of NOAA National Geophysical Data Center.
C.O. Justice et al. / Remote Sensing of Environment 83 (2002) 244–262260
Acknowledgements
We thank Pete Dowty and Christelle Hely at the
University of Virginia for providing the fuel load model
output within the context of the SAFARI 2000 project. We
thank Melissa S. Crisologo for assistance with many of the
figures, and four reviewers for many useful comments and
suggestions. This work was supported by MODIS, largely
through NASA Contract NAG 526759.
References
Ahern, F. J., Belward, A., Elvidge, C., Goldammer, J., Gregoire, J.-M.,
Justice, C. O., Pereira, J., Prins, E. M., & Stocks, B. (2001). The fire
component of Global Observation of Forest Cover: a plan of action. In
F. J. Ahern, J. Goldammer, & C. Justice (Eds.), Global and regional
wildland fire monitoring from space: planning a coordinated interna-
tional effort ( pp. 267–289). The Hague: SPB Academic Publishing.
Anyamba, A., Justice, C. O., & Tucker, C. J. Remote sensing of vegetation
and fire dynamics during SAFARI 2000. Journal of Geophysical Re-
search (submitted for publication).
Barbosa, P. M., Stroppiana, D., Gregoire, J.-M., & Pereira, J. M. C. (1999).
An assessment of vegetation fire in Africa (1981–1991): burned areas,
burned biomass, and atmospheric emissions. Global Biogeochemical
Cycles, 13, 933–950.
Fujisada, H., Iwasaki, A., & Hara, S. (2001). ASTER stereo system per-
formance. Proceedings of SPIE Vol. 4540, Toulouse 39, pp. 39–49.
Giglio, L., Descloitres, J., Justice, C. O., & Kaufman, Y. J. (2002). An
enhanced contextual fire detection algorithm forMODIS (in preparation).
Giglio, L., & Justice, C. O. Effect of wavelength selection on character-
ization of fire size and temperature (submitted for publication).
Giglio, L., & Kendall, J. D. (2001). Application of the Dozier retrieval to
wildfire characterization: a sensitivity analysis. Remote Sensing of En-
vironment, 77, 34–49.
Giglio, L., Kendall, J. D., & Justice, C. O. (1999). Evaluation of global fire
detection algorithms using simulated AVHRR infrared data. Interna-
tional Journal of Remote Sensing, 20, 1947–1985.
Giglio, L., Kendall, J. D., & Mack, R. A multi-year active fire data set for
the tropics derived from the TRMM VIRS (submitted for publication).
Giglio, L., Kendall, J. D., & Tucker, C. J. (2000). Remote sensing of fires
with TRMM VIRS. International Journal of Remote Sensing, 21,
203–207.
Hansen, M. C., DeFries, R. S., Townshend, J. R. G., Sohlberg, R., Dimiceli,
C., & Carroll, M. (2002). Towards an operational MODIS continuous
field of percent tree cover algorithm: examples using AVHRR and
MODIS data. Remote Sensing of Environment, 83, 304-320 (this issue).
Hely, C., Dowty, P., Caylor, K., Alleaume, S., Korontzi, S., Swap, R. J., &
Shugart, H. H. (2002). A temporal and spatially explicit primary pro-
duction model for savanna fuel load allocation over the southern Afri-
can region. Ecological Modeling (submitted for publication).
Hoffa, E. F., Wakimoto, R. H., Ward, D. E., Hao, W. M., & Susott, R. A.
(1999). Seasonality of carbon emissions from biomass burning in a Zam-
bian savanna. Journal of Geophysical Research, 104, 13841–13853.
Jacobowitz, H. (1997). Climate measurement requirements for the National
Polar-orbiting Operational Environmental Satellite System (NPOESS).
Workshop Report. NOAA/NESDIS/ORA, published by UCAR, 71 pp.
Justice, C. O., Kendall, J. D., Dowty, P. R., & Scholes, R. J. (1996). Satellite
remote sensing of fires during the SAFARI campaign using NOAA-
AVHRR data. Journal of Geophysical Research, 101, 23851–23863.
Justice, C. O., & Korontzi, S. (2001). A review of the status of satellite fire
monitoring and the requirements for global environmental change re-
search. In F. J. Ahern, J. Goldammer, & C. O. Justice (Eds.), Global and
regional wildland fire monitoring from space: planning a coordinated
international effort (pp. 1–18). The Hague: SPB Academic Publishing.
Justice, C. O., Townshend, J. R. G., Vermote, E., Masuoka, E., Wolfe, R.,
Saleous, N., Roy, D., & Morisette, J. (2002). An overview of MODIS
land data processing and product status. Remote Sensing of Environ-
ment, 83, 3-15 (this issue).
Justice, C. O., Vermote, E., Townshend, J. R. G., DeFries, R., Roy, D. P.,
Hall, D. P., Salomonson, V. V., Privette, J. L., Riggs, G., Strahler, A.,
Lucht, W., Myneni, R., Knyazikhin, Y., Running, S. W., Nemani, R. R.,
Wan, Z., Huete, A., van Leeuwen, W., Wolfe, R. E., Giglio, L., Muller,
J.-P., Lewis, P., & Barnsley, M. J. (1998). The moderate resolution
imaging spectroradiometer (MODIS): land remote sensing for global
change research. IEEE Transactions on Geoscience and Remote Sens-
ing, 36, 1228–1249.
Justice, C. O., Wolfe, R. E., El Saleous, N., Descloitres, J., Vermote, E.,
Roy, D., Owens, J., & Masuoka, E. (2000). The availability and status
of MODIS land products. The Earth Observer, 12 (6), 10–18.
Kaufman, Y. J., Ichoku, C., Giglio, L., Korontzi, S., Chu, D. A., Hao, W.
M., Li, R.-R., & Justice, C. O. (2002). Fire and smoke observed from
the Earth Observing System MODIS instrument—products, validation,
and operational use. International Journal of Remote Sensing (in press).
Kaufman, Y. J., Justice, C. O., Flynn, L., Kendall, J. D., Prins, E. M.,
Giglio, L., Ward, D. E., Menzel, W. P., & Setzer, A. W. (1998). Potential
global fire monitoring from EOS-MODIS. Journal of Geophysical Re-
search, 103, 32215–32238.
Kaufman, Y. J., Kleidman, R. G., & King, M. D. (1998). SCAR-B fires in
the tropics: properties and remote sensing from EOS-MODIS. Journal
of Geophysical Research, 103, 31955–31968.
Kaufman, Y. J., Setzer, A. W., Justice, C. O., Tucker, C. J., Pereira, M. C.,
& Fung, I. (1990). Remote sensing of biomass burning in the tropics. In
J. G. Goldammer (Ed.), Fire and the tropical biota: ecosystem pro-
cesses and global challenges (pp. 371–399). Berlin: Springer-Verlag.
Korontzi, S., Justice, C.O., Roy, D., & Dowty, P. Satellite derived seasonal
pyrogenic emissions over southern Africa. Atmospheric Environment
(submitted for publication).
Korontzi, S., Justice, C. O., & Scholes, R. (2002). The influence of timing
and spatial extent of vegetation fires in southern Africa on atmospheric
emissions. Journal of Arid Environments (in press).
Masuoka, E., Fleig, A., Wolfe, R. E., & Patt, F. (1998). Key characteristics
of MODIS data products. IEEE Transactions on Geoscience and Re-
mote Sensing, 36, 1313–1323.
Morisette, J. T., Justice, C. O., Pereira, J., Gregoire, J. M., & Frost, P.
(2001). Report from the GOFC—fire: satellite product validation work-
shop. The Earth Observer, 13 (5), 15–18.
NPOESS Integrated Program Office (1999). Visible/infrared imager/radio-
meter suite (VIIRS) sensor requirements document (SRD) for national
polar-orbiting environmental satellite system (NPOESS) spacecraft and
sensors. Version 2 (1 October).
Petitcolin, F., & Vermote, E. F. (2002). Land surface reflectance, emissivity,
and temperature from MODIS middle and thermal infrared data. Remote
Sensing of Environment, 83, 112-134 (this issue).
Prins, E. M., & Menzel, W. P. (1992). Geostationary satellite detection of
biomass burning in South America. International Journal of Remote
Sensing, 13, 2783–2799.
Roy, D. P., Lewis, P. E., & Justice, C. O. (2002). Burned area mapping
using multi-temporal moderate spatial resolution data—a bi-directional
reflectance model-based expectation approach. Remote Sensing of En-
vironment, 83, 264-287 (this issue).
Scholes, R. J., Ward, D. E., & Justice, C. O. (1996). Emissions of trace
gases and aerosol particles due to vegetation burning in southern hemi-
sphere Africa. Journal of Geophysical Research, 101, 23677–23682.
Sohlberg, R., Descloitres, J., & Bobbe, T. (2001). MODIS land rapid
response: operational use of terra data for USFS wildfire management.
The Earth Observer, 13, 8–14.
Stroppiana, D., Brivio, P. A., &Gregoire, J.-M. (2000).Modelling the impact
of vegetation fires, detected from NOAA-AVHRR data, on tropospheric
chemistry in tropical Africa. In J. L. Innes, M. Beniston, & M. M. Ver-
C.O. Justice et al. / Remote Sensing of Environment 83 (2002) 244–262 261

straete (Eds.), Biomass burning and its inter-relationships with the cli-
mate system. Dordrecht, The Netherlands: Kluwer Academic Publishing.
Swap, R., Suttles, T., King, M., Annegarn, H., Cook, R., Drummond, J.,
Emanuel, W., Gille, J., Hobbs, P., Justice, C. O., Otter, L., Piketh, S.,
Platnick, S., Privette, J., Remer, L., Shelton, G., & Shugart, H. (1999).
Summary of the NASA EOS SAFARI 2000 Workshop. The Earth
Observer, 11 (3), 32–35 (NASA/GSFC).
Townshend, J. R. G., & Justice, C. O. (2002). Towards operational mon-
itoring of terrestrial systems by moderate-resolution remote sensing.
Remote Sensing of Environment, 83, 352-360 (this issue).
Wolfe, R. E., Nishihama, M., Fleig, A. J., Kuyper, J. A., Roy, D. P., Storey,
J. C., & Patt, F. S. (2002). Achieving sub-pixel geolocation accuracy in
support of MODIS land science. Remote Sensing of Environment, 83,
31-49 (this issue).
Wolfe, R. E., Roy, D. P., & Vermote, E. F. (1998). The MODIS land data
storage, gridding and compositing methodology: L2 Grid. IEEE Trans-
actions on Geoscience and Remote Sensing, 36, 1324–1338.
Yamaguchi, U., Kahle, A. B., Tsu, H., Kawakami, T., & Pniel, M. (1998).
Overview of Advanded Spaceborne Thermal Emission and Reflection
Radiometer (ASTER). IEEE Transactions on Geoscience and Remote
Sensing, 36, 1062–1071.
C.O. Justice et al. / Remote Sensing of Environment 83 (2002) 244–262262