the millennium galaxy catalogue: the b-band attenuation of bulge and disc light and the implied...
TRANSCRIPT
Mon. Not. R. Astron. Soc. 379, 1022–1036 (2007) doi:10.1111/j.1365-2966.2007.11862.x
The Millennium Galaxy Catalogue: the B-band attenuation of bulge anddisc light and the implied cosmic dust and stellar mass densities
Simon P. Driver,1� Cristina C. Popescu,2 Richard J. Tuffs,2 Jochen Liske,3
Alister W. Graham,4 Paul D. Allen1 and Roberto De Propris5
1Scottish Universities Physics Alliance, School of Physics and Astronomy, University of St Andrews, North Haugh, St Andrews, Fife KY16 9SS2Max-Planck-Institut fur Kernphysik, Saupfercheckweg 1, 69117 Heidelberg, Germany3European Southern Observatory, Karl-Schwarzschild-Str. 2, 85748 Garching, Germany4Centre for Astrophysics and Supercomputing, Swinburne University of Technology, Hawthorn, Victoria 3122, Australia5Cerro Tololo Inter-American Observatory, Casilla 603, La Serena, Chile
Accepted 2007 April 15. Received 2007 March 21; in original form 2007 January 10
ABSTRACTBased on our sample of 10 095 galaxies with bulge–disc decompositions we derive the empir-ical BMGC-band internal attenuation–inclination relation for galaxy discs and their associated
central bulges. Our results agree well with the independently derived dust models of Tuffs
et al., leading to a direct constraint on the mean opacity of spiral discs of τ fB = 3.8 ± 0.7
(central face-on BMGC-band opacity). Depending on inclination, the BMGC-band attenuation
correction varies from 0.2 to 1.1 mag for discs and from 0.8 to 2.6 mag for bulges. We find that,
overall, 37 per cent of all BMGC-band photons produced in discs in the nearby Universe are
absorbed by dust, a figure that rises to 71 per cent for bulge photons. The severity of internaldust extinction is such that one must incorporate internal dust corrections in all optical studiesof large galaxy samples. This is particularly pertinent for optical Hubble Space Telescopecomparative evolutionary studies as the dust properties will also be evolving. We use the new
results to revise our recent estimates of the spheroid and disc luminosity functions. The implied
stellar mass densities at redshift zero are somewhat higher than our earlier estimates: ρdiscs =(3.8 ± 0.6) → (4.4 ± 0.6) × 108 h M� Mpc−3 and ρbulges = (1.6 ± 0.4) → (2.2 ± 0.4) ×108 h M� Mpc−3. From our best-fitting dust models we derive a redshift zero cosmic dust
density of ρdust ≈ (5.3 ± 1.7) × 105 h M� Mpc−3. This implies that (0.0083 ± 0.0027)
h per cent of the baryons in the Universe are in the form of dust and (11.9 ± 1.7) h per cent
(Salpeter-‘lite’ initial mass function) are in the form of stars (∼58 per cent reside in galaxy
discs, ∼10 per cent in red elliptical galaxies, ∼29 per cent in classical galaxy bulges and the
remainder in low-luminosity blue spheroid systems/components).
Key words: dust, extinction – galaxies: fundamental parameters – galaxies: photometry –
galaxies: spiral – galaxies: structure.
1 I N T RO D U C T I O N
Internal dust attenuation of the photon flux from galaxies is a se-
vere issue at optical wavelengths, reducing the total emergent lu-
minosity, introducing an inclination dependence of the observed
flux (e.g. Giovanelli et al. 1995; Masters, Giovanelli & Haynes
2003) and modifying the galaxy light-profile shape. Model predic-
tions of these effects have been given by many authors, including
(Kylafis & Bahcall 1987; Byun, Freeman & Kylafis 1994; Evans
1994; Bianchi, Ferrara & Giovanardi 1996; Kuchinski et al. 1998;
Ferrara et al. 1999; Baes & Dejonghe 2001; Cunow 2001; Tuffs
�E-mail: [email protected]
et al. 2004; Pierini et al. 2005; Mollenhoff, Popescu & Tuffs 2006).
Typically, spiral galaxies exhibit a radial gradient in opacity, with
higher opacities in the central regions (Boissier et al. 2004; Popescu
et al. 2005). The dust is also typically distributed in a thinner layer
than the stellar population(s) (Xilouris et al. 1999). Because of these
two properties of the dust distribution, the observed stellar profiles
appear less centrally concentrated (i.e. lower Sersic indices), scale-
lengths are overestimated, luminosities are underestimated and the
central surface brightness artificially dimmed. All of these effects
become more pronounced at higher inclinations1 (see Mollenhoff
et al. 2006, for detailed model predictions). Dust may also
1 Here we define inclination to run from face-on (low inclination, i = 0◦) to
edge-on (high inclination, i = 90◦).
C© 2007 The Authors. Journal compilation C© 2007 RAS

MGC: dust 1023
exacerbate the issue of inner disc truncation leading to Type II pro-
files (Freeman 1970) by preferentially suppressing core flux.
Bulges, even though they are assumed to contain minimal dust,
are still seen through the dust layer of the disc, and therefore also
suffer attenuation of their stellar light and modification of their sur-
face brightness distributions due to dust. In fact, these effects are
predicted to be even more pronounced for bulges than for the discs
(Tuffs et al. 2004), since bulges are concentrated towards the central
regions of galaxies, where the opacity is the highest.
In terms of obtaining statistical distributions for the disc and bulge
components (e.g. disc/bulge luminosity–size or luminosity–colour
distributions, see Driver et al. 2006), samples uncorrected for galaxy
inclination will have their intrinsic distributions broadened (and
skewed, see in particular the recent papers by Choi, Park & Vogeley
2007; Shao et al. 2007). Indeed, recent observational studies have
produced evidence that the size distribution of galaxies, at fixed
luminosity, is broader than that predicted from hierarchical simu-
lations (see Shen et al. 2003; Driver et al. 2005). In terms of the
total stellar mass the effect is less obvious. This quantity is usually
estimated by multiplying a galaxy’s luminosity by its stellar mass-
to-light ratio, which is in turn derived from the correlation between
mass-to-light ratio and colour (Bell & de Jong 2001). The point is
that the decrease in the estimated stellar mass due to attenuation will
be counteracted, at least to some extent, by the increase in the stellar
mass due to reddening. Bell & de Jong (2001) argue that these two
effects mostly cancel each other (see their fig. 1). We find that while
this is true for moderately inclined systems (i < 60◦) it does not
hold for highly inclined systems.
Historically, there has been some debate as to whether studies
of galaxies at various inclinations can be used to constrain the dust
distribution and opacity simultaneously (Holmberg 1958; Disney,
Davies & Phillipps 1989; Valentijn 1990; Disney et al. 1992). The
general consensus was that one could not (see Davies & Burstein
1995) and alternative paths to the dust distributions have now been
pursued (e.g. overlapping galaxies, Keel & White 2001; surface
brightness–scalelength relations, Graham 2001; quasar sightlines
through foreground galaxies, Ostman, Goobar & Mortsell 2006;
and self-consistent modelling of the UV/optical/FIR/submm emis-
sion from galaxies, Silva et al. 1998; Bianchi, Davies & Alton 2000;
Popescu et al. 2000; Popescu & Tuffs 2005). However, with the dust
models (including 3D distribution, clumpiness and grain composi-
tion) now constrained by independent methods, it should be possible
to revisit the use of large statistical catalogues to constrain the mean
opacity of discs.
In particular, given a complete galaxy sample with comprehen-
sive structural analysis and high-completeness redshift coverage one
should be able to determine, empirically, the attenuation–inclination
relation.2 This can be achieved if a characteristic feature can be iden-
tified in the galaxy population and this feature measured for subsam-
ples of varying inclination. One obvious feature is the turnover of
the luminosity function (LF), that is, L∗ or M∗, which in the absence
of dust should be inclination independent. Using large galaxy sam-
ples drawn from contemporary surveys M∗ can now be measured to
an accuracy of �M∗ < 0.1 mag (see e.g. Zucca et al. 1997; Norberg
et al. 2001; Blanton et al. 2003; Driver et al. 2005).
Predictions based on detailed dust models suggest that the total
B-band magnitude of a galaxy disc may be attenuated by up to 2 mag
2 We note that attenuation is an integral property of an extended distribution
of light and should not be confused with the extinction along a single line
of sight.
and that of a galaxy bulge by up to 2.5 mag, depending on opacity
and viewing angle (see Tuffs et al. 2004; Pierini et al. 2005). In this
paper we report our empirical estimate of the relationship between
attenuation and inclination, and use it to constrain the mean opacity
of discs by comparison to the model predictions of Tuffs et al. (2004;
which in turn are based on the dust model of Popescu et al. 2000).
Using a combination of (i) our empirical correction to remove the
inclination-dependent attenuation and (ii) the dust model to evaluate
and remove the face-on attenuation, we revise the LFs and total
stellar mass densities recently reported in Driver et al. (2007). We
also combine the mean opacity of discs and total disc stellar mass
to derive the cosmic dust density.
In Section 2 we review the data used in this investigation and in
Section 3 we describe our empirical analysis leading to a constraint
on the mean opacity of galaxies. In Section 4 we use our results to
constrain our adopted dust model (Tuffs et al. 2004). In Section 5 we
recover the spheroid and disc LFs through a variety of methods and
discuss the implications of our findings in the context of the cosmic
baryon budget. Throughout we adopt the following cosmological
parameters: �M = 0.3, �� = 0.7 and H0 = 100 h km s−1 Mpc−1.
2 T H E M I L L E N N I U M G A L A X Y C ATA L O G U E
The Millennium Galaxy Catalogue (MGC) spans a 37.5-deg2 region
of the vernal equatorial sky and contains 10 095 galaxies brighter
than BMGC = 20 mag with 96 per cent spectroscopic redshift com-
pleteness. The imaging catalogue is described in Liske et al. (2003),
the spectroscopic follow-up in Driver et al. (2005) and the photo-
metric accuracy and completeness in Cross et al. (2004), Driver et al.
(2005) and Liske et al. (2006). We have decomposed this sample
into bulges and discs with GIM2D (Simard et al. 2002), using an R1/n
Sersic profile for bulges and an exponential profile for discs (Allen
et al. 2006) and providing an extensive bulge–disc resource which is
publicly available at http://www.eso.org/∼jliske/mgc/. In this paper
we use the MGC structural catalogue MGC GIM2D.
We point out that not all galaxies in our catalogue are two-
component systems. Allen et al. (2006) divided those objects that
were best fitted with a single-component Sersic profile into pure
discs and pure bulges (i.e. ellipticals) according to their Sersic in-
dex. Note that we use the term ‘spheroid’ to mean both ellipticals
and bulges, and we reserve the term ‘bulge’ exclusively for the cen-
tral 3D structure of a two-component system. We further separate
our ellipticals into classical (red) and new (blue), as well as our
bulges into classical and pseudo at (u − r)core = 2 mag according to
the spheroidal colour bimodality found by Driver et al. (2007, see
their fig. 2). In Sections 3 and 4 we will use the classical bulges, but
not the ellipticals which are assumed dust-free, as well as all of the
discs, irrespective of whether they ‘contain’ a bulge or not.
The robustness of our catalogue has been quantified using in-
dependent repeat observations and GIM2D decompositions of 682
galaxies. These duplicate observations originate from the overlap
regions of neighbouring MGC fields and hence they include the
effects of varying observing conditions. This comparison sample
demonstrates that for components with MB < −17 mag our struc-
tural catalogue is accurate to better than ±0.1 mag for bulges and
±0.15 mag for discs, and that the disc inclination, i, has � cos (i) ∼0.05 (see fig. 15 of Allen et al. 2006). In our analysis we use bin sizes
of 0.1 for cos(i) and 0.5 mag for luminosity. Hence the errors are
smaller than the bin sizes in use and much smaller than the size of
the expected signal on the magnitudes due to dust (see Mollenhoff
et al. 2006).
C© 2007 The Authors. Journal compilation C© 2007 RAS, MNRAS 379, 1022–1036
1024 S. P. Driver et al.
3 A NA LY S I S
The MGC structural parameters we require are the GIM2D total lu-
minosity, the bulge-to-total flux ratio (B/T), the redshift, the redshift
quality, the disc inclination and the bulge and disc colours. Of these
parameters only the disc inclination requires some adjustment as
these were derived under the assumption that galaxy discs are in-
finitely thin [i.e. cos(i) = b/a, where a and b are the major and
minor axes, respectively]. In reality discs exhibit a finite thickness
preventing b from reaching a value of zero. To accommodate disc
thickness we adjust our inclinations according to Hubble (1926):
cos2(i) = [cos2(iGIM2D) − Q2]/(1 − Q2), where Q is the ratio be-
tween the disc scaleheight and the major axis, and is set here to
0.074 (Xilouris et al. 1999).
In the following we will often use the term ‘inclination’ in con-
nection with bulges. The ‘bulge inclination’ is simply the inclination
of the associated disc.
To derive the internal attenuation–inclination relation [i.e. �M∗
versus 1− cos (i)] we iteratively follow the procedure outlined below
for both bulges and discs. Iteration is required because any B/T and
magnitude cuts should be based on the intrinsic values rather than
the apparent values.
(i) Extract all discs and bulges and apply the current best esti-
mates of the disc and bulge attenuation–inclination corrections (no
correction is applied for the first iteration).
(ii) Recompute all B/T luminosity ratios.
(iii) Select components with BMGC < 20 mag and whose parent
galaxies have B/T < 0.8.3
(iv) Derive the luminosity distribution (LD) using step-wise max-
imum likelihood (SWML) for all discs and bulges with low inclina-
tion [1 − cos(i) < 0.3].
(v) Fit Schechter functions to the LDs (using only data down to
MB < −17 mag) in order to obtain the global value of the faint-end
slope, α, for discs and bulges of low inclination.
(vi) Derive the disc and bulge LDs for the full sample in uniform
cos (i) intervals.
(vii) Fit Schechter functions (MB < −17 mag) with α fixed to
the global value from step (v).
(viii) Plot the recovered M∗ (turnover luminosity) versus 1 −cos(i).
(ix) Determine the new inclination corrections by fitting equa-
tion (1) below to the bulge and disc data using the Levenberg–
Marquardt χ 2 minimization method.4
(x) Repeat the above until convergence.
In deriving the LDs using SWML we follow Driver et al. (2007)
(for full details of the SWML method consult Efstathiou, Ellis &
Peterson 1988). Briefly, we assume that discs evolve according to
Lz ∝ (1 + z)−1 and we use the globally derived k-corrections for
the disc components throughout. For the bulges we adopt a milder
evolution of Lz ∝ (1 + z)−0.5 and use a fixed red bulge k-correction
of k(z) = 3.86z + 12.13z2 − 50.14z3 which is the best fit to an
Sa 15.0-Gyr spectrum (see Poggianti 1997). For further details and
justification of these choices see Driver et al. (2007).
3 The fixed cut at B/T < 0.8 is necessary as the post-GIM2D processing of
our catalogue (see Allen et al. 2006, fig. 14) replaces all systems with higher
B/T values with single Sersic-only fits (as is common practice in detailed
surface photometry), thereby redefining them as ellipticals.4 During the fitting process the highest inclination bin is ignored as the
accuracy of the bulge–disc decomposition is susceptible to break down at
this limit and, as we shall see later, this bin remains incomplete.
Crucial to a correct implementation of SWML is the specifica-
tion of the appropriate flux limit to which each galaxy could have
been observed. The flux limit of the MGC spectroscopic survey
was BMGC = 20 mag, in Galactic-extinction-corrected Kron magni-
tudes, and normally this would be the appropriate limit. However, we
have since revised our photometry by replacing Kron with profile-
extrapolated GIM2D magnitudes. The difference between these is
generally small (see fig. 4 of Allen et al. 2006) but it necessitates
the introduction of an individual magnitude limit for each galaxy.
More significant is that in implementing our dust attenuation cor-
rection these magnitude limits must be further adjusted (in effect the
correction is analogous to a revision of the photometry). Hence the
appropriate magnitude limit to which each galaxy could have been
observed is given by Blim = 20 + MTB (GIM2D) − MT
B (Kron) + MCB
(dust corrected) − MCB , where the superscripts T and C refer to ‘total’
and ‘component’, respectively, and 20 mag is the sample’s original
limit in total-galaxy, dust-uncorrected Kron magnitudes. Due to the
bulge–disc decomposition it is possible, in fact frequently the case,
that a galaxy component may lie below its parent galaxy’s flux
limit. In these cases the component is rejected. Keeping these com-
ponents, that is, applying the flux limits only to the galaxies, but not
their components, would introduce a bias: for example, a bulge with
some apparent magnitude below its parent galaxy’s limit would still
be included in the sample if it were from a low-B/T system but not
if it were from a high-B/T system. Applying the flux limits to the
components significantly reduces the sample size but ensures that
it remains unbiased. A by-product is that all remaining components
will be of high signal-to-noise ratio.
For step (ix) above we arbitrarily choose a power law to
parametrize the attenuation–inclination relation:
M∗i − M∗
0 = k1[1 − cos(i)]k2 , (1)
where M∗i refers to the turnover magnitude at inclination i and M∗
0
refers to the face-on turnover magnitude.
Fig. 1 shows the initial and final iterations for bulges (panels
a and b) and discs (panels d and e), where the components have
been drawn from galaxies with B/T < 0.8 and have MB < −17
mag. From Fig. 1 we can see that both bulge and disc magnitudes
are severely underestimated in edge-on systems and a significant
correction is required. The final results (after 14 iterations) for the
attenuation–inclination relations are
(M∗
i − M∗0
)disc
= (0.99 ± 0.02)[1 − cos(i)](2.32±0.05) (2)
and
(M∗
i − M∗0
)bulge
= (2.16 ± 0.1)[1 − cos(i)](2.48±0.12). (3)
These relations are shown as solid lines in the central panels of
Fig. 1. We also show the initial relations (before any iteration) as
dotted lines. We can see that the iteration process actually has a
fairly small effect on both the disc and bulge solutions. Fig. 2 shows
the convergence path for the disc and bulge solutions. The discs
converge almost instantly whereas the bulge solution shows more
variation. This in part reflects the larger disc sample but may also
indicate more noise in the bulge data as one might expect for the less
well-resolved component. As the solutions are dependent on each
other it is reassuring that the disc solution is robust to the variations
in the bulge solution.
C© 2007 The Authors. Journal compilation C© 2007 RAS, MNRAS 379, 1022–1036

MGC: dust 1025
Figure 1. Panels (a) and (d) show the derived M∗ values for bulges and discs as a function of 1 − cos(i) based on the raw data. All components are drawn
from galaxies with B/T < 0.8 and have luminosities MB < −17 mag. The dotted line shows the best fit of equation (1) to these data, using only the points
at 1 − cos(i) < 0.9 (marked by the vertical dashed line). Panels (b) and (e) show the final results after applying the inclination corrections and rederiving the
attenuation–inclination relations repeatedly until stable solutions are reached. The solid lines show the final fits to these data, while the dashed lines are the
same as in panels (a) and (d). The disc relation is barely changed by the iteration and the bulge relation has evolved only mildly. The lower panels (c and f)
show the residuals between the data points and the solid line fits.
Figure 2. The paths of convergence for the iterative fitting of equation (1)
to the disc and bulge data as indicated. It is clear that the disc solution is ex-
tremely stable with the bulge solution drawing out a larger error distribution
in the two fitted parameters. The solid crosses mark the final solutions and
associated errors.
3.1 Robustness checks
As our result is fairly striking and the implications potentially far
reaching, it is important to ensure our interpretation is correct and
not due to some systematic artefact of the bulge–disc decomposi-
tion process. Below we outline a number of checks which we use
to reassure ourselves, and the reader, that the result is robust and
accurately described by the equations shown above.
3.1.1 The LF fits
Figs 3 and 4 show the individual LFs for discs and bulges for
each 1 − cos(i) interval before (dotted lines) and after (solid lines)
implementing the dust-induced inclination correction. To provide a
reference we show as long dashed lines the LFs derived from bulge
or disc components with 1 − cos(i) < 0.3, scaled down by a factor of
3 to account for the 3 times larger range in 1 − cos(i). In general the
LDs are well behaved and the Schechter function fits are all good.
The uncorrected data (open circles) show a significant and progres-
sive shift to fainter M∗ values at higher inclinations. The corrected
data (filled circles) show that the M∗ values are now consistent, as
required by the fitting process. However, we can also see that the
normalizations are also consistent (cf. dashed comparison line) for
C© 2007 The Authors. Journal compilation C© 2007 RAS, MNRAS 379, 1022–1036

1026 S. P. Driver et al.
Figure 3. Each panel shows the disc LD for an inclination-selected subsample (as indicated) before (open circles) and after (filled circles) attenuation–inclination
correction. The red solid and dotted lines show Schechter function fits to the corrected and uncorrected data, respectively. For reference, we also show as a blue
dashed line the Schechter function derived from all discs with 1 − cos (i) < 0.3, scaled down by a factor of 3.
both the bulge and disc populations. The only significant inconsis-
tency is in the final, highest inclination bin where the normalizations
are low, suggesting some residual incompleteness. As the highest
inclination bin was not used in the fitting process this does not affect
our attenuation–inclination solutions.
3.1.2 The 1 − cos(i) distribution
The upper panels of Fig. 5 show the 1 − cos(i) distributions before
and after implementing the attenuation–inclination corrections. For
a randomly orientated sample of thin discs the 1 − cos(i) distri-
butions should be constant. Note that the magnitude limits used in
these plots are dictated by the nominal limit of the MGC survey
(BMGC = 20 mag) minus the maximum bulge and disc corrections
(i.e. ∼1.5 and 1.0 mag, giving limits of 18.5 and 19.0 mag, respec-
tively). Fainter than these limits our samples become incomplete,
with the incompleteness depending on inclination.
From Fig. 5 we can see that the raw data (dotted lines) show a
strongly skewed distribution implying significant incompleteness
towards the high-inclination end, providing corroborating evidence
of the severe effect of dust attenuation. Furthermore, bulges show
a more extreme skew than discs implying that a larger correction
is required for the bulges as shown by equations (2) and (3). After
implementing the corrections described above, both distributions
are now flat. We consider both the flatness of the 1 − cos(i) dis-
tribution and the uniformity of the normalizations of the Schechter
function fits from Figs 3 and 4 to be extremely strong independent
evidence that our derived corrections are caused by dust attenuation
and that equations (2) and (3) are correctly accounting for this ef-
fect. Note that the 1 − cos(i) distributions also show some residual
incompleteness in the highest inclination bin, potentially requiring
the final space density of bulges and discs to be increased by factors
of 1.05 and 1.06, respectively.
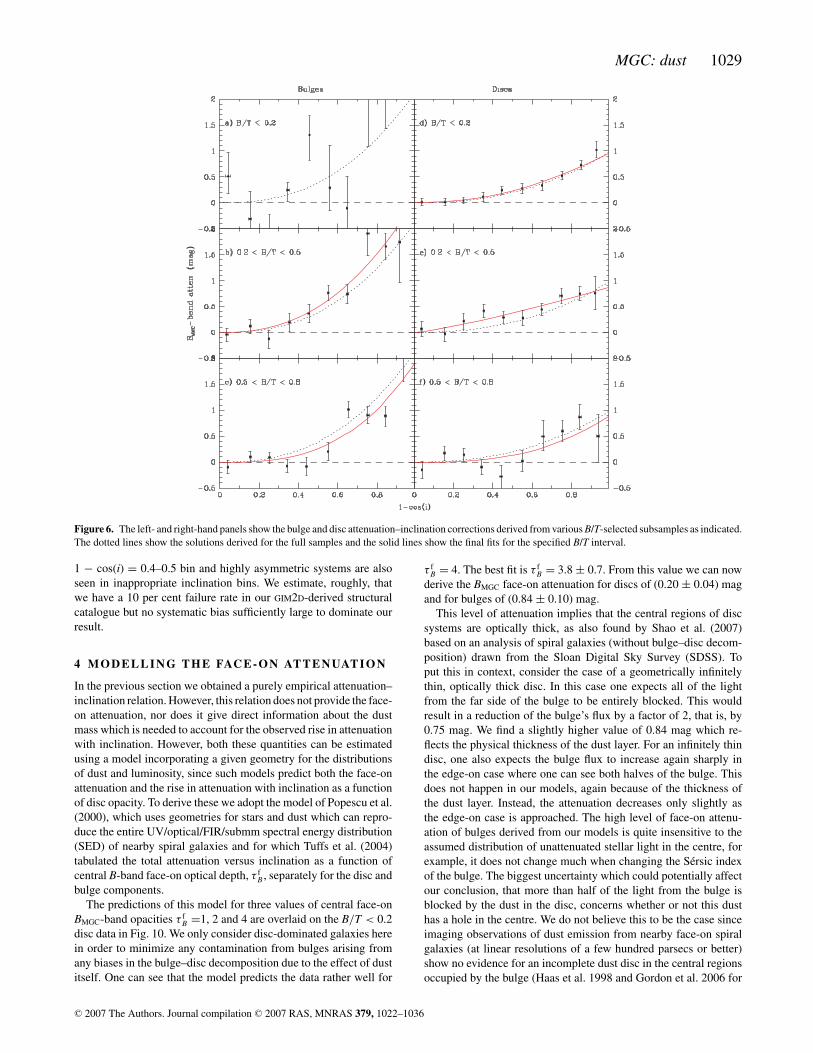
3.1.3 Solutions for restricted B/T ranges
An obvious concern is that the empirical correction may depend
on the bulge-to-total flux ratio, B/T. Fig. 6 shows the trends for
three different B/T ranges as defined by the horizontal bands shown
in the lower panels of Fig. 5. To construct these plots we ini-
tially adopted the solutions derived from the full sample and then
followed the iterative procedure outlined in Section 3. The data
for low-B/T bulges (Fig. 6a) is particularly sparse (see also lower
left-hand panel of Fig. 5) and therefore not particularly informa-
tive, while the worst statistics for discs are found in the high-B/Tsample (panel f). Hence we will only compare the results from
the intermediate and high-B/T bulge subsamples (panels b and c)
and from the low- and intermediate-B/T disc subsamples (panels d
and e).
The disc correction seems reasonably insensitive to B/T. For
bulges there may be a tendency towards a shallower attenuation–
inclination relation for higher B/T systems. Three potential
C© 2007 The Authors. Journal compilation C© 2007 RAS, MNRAS 379, 1022–1036

MGC: dust 1027
Figure 4. Each panel shows the bulge LD for an inclination-selected subsample (as indicated) before (open circles) and after (filled circles) attenuation–
inclination correction. The red solid and dotted lines show Schechter function fits to the corrected and uncorrected data, respectively. For reference, we also
show as a blue dashed line the Schechter function derived from all bulges with 1 − cos (i) < 0.3, scaled down by a factor of 3.
explanations for such a trend immediately come to mind: (i) an
intrinsic variation in the opacity of discs with B/T; (ii) a varia-
tion in the size of bulges relative to the scalelength of the dust
disc (such that the effective radius of the bulge becomes compara-
ble to the scalelength of the dust in high-B/T systems) and (iii) a
systematic error in our bulge–disc decompositions such that flux
is transferred from bulges to discs preferentially for lower B/Tsystems.
The uniformity of the disc relation argues against (i). One might
also expect it to rule out (iii). However, although the transfer of flux
from bulges to discs in low-B/T systems can significantly modify
the flux of the bulge, it will actually have a much smaller impact
on the disc fluxes (because the systems have low B/T). In Section 4
we will show that the dust model prediction for the low-B/T disc
sample actually reproduces the bulge trend for the high-B/T sample
reasonably well. This suggests that (ii) is unlikely to be the cor-
rect explanation. We therefore conclude that we may be slightly
underestimating the flux of the bulges of low-B/T systems due to
the bulge–disc decomposition, preferentially re-assigning flux from
the bulge to the disc at higher inclinations, although we cannot rule
out a real phenomenon, not predicted by models.
Arguably, the above implies that it may be better to construct
bulge LFs from face-on samples as opposed to implementing the
inclination correction. The disc sample on the other hand is robust
with respect to variations in B/T, indicating that dust properties scale
with the disc, as one would expect, and are entirely independent of
the bulge.5 For the discs our correction is therefore applicable over
the full B/T range. Hence we will continue to use the bulge correction
based on the full sample.
3.1.4 Comparison of attenuation-corrected LFs and uncorrectedface-on LFs
A further check is to rederive the bulge and disc LDs without ap-
plying the inclination-dependent dust correction but using face-on
systems only. These should agree with the full-sample, corrected
distributions provided the normalizations are adjusted appropriately
(although the errors of the scaled-up face-on sample are expected
to be higher). Fig. 7 shows the results which are also given in
Table 1. Rows 4 and 5 show the results for the disc LFs derived
from data restricted to 1 − cos(i) < 0.3 and scaled up by a factor
of 3.33. These face-on estimates essentially circumvent the entire
empirical attenuation–inclination fitting process. The two LF esti-
mates agree well with just a slight offset in normalization.6 Based
on the 1σ error contours (right-hand panels in Fig. 7) the face-on
data agree with the inclination-corrected data and both are formally
5 Note that we have already applied a colour cut to our bulge sample to
remove contaminating blue pseudo-bulges.6 The inclination-corrected LFs have been scaled slightly to account for the
residual incompleteness factors derived in Section 3.1.2.
C© 2007 The Authors. Journal compilation C© 2007 RAS, MNRAS 379, 1022–1036

1028 S. P. Driver et al.
0 0.2 0.4 0.6 0.8 10
10
20
30
40
50
60
70
80
90
100
1-cos(i)
After correction
Before correction
After correction
Before correction
0 0.2 0.4 0.6 0.8 10
100
200
300
400
500
600
700
1-cos(i)
0 0.2 0.4 0.6 0.8 1
0
0.2
0.4
0.6
0.8
1
1-cos(i)
Final bulge sample
0 0.2 0.4 0.6 0.8 1
0
0.2
0.4
0.6
0.8
1
1-cos(i)
Final disc sample
Figure 5. The upper panels show the 1 − cos(i) distributions of bulges (left-hand panels) and discs (right-hand panels) before (dotted lines) and after (solid
lines) applying the inclination-dependent magnitude correction. In the lower panels we plot B/T versus 1 − cos(i) for the corrected data.
inconsistent with the results from the full, uncorrected sample. Note
that the error contour for the face-on sample is larger than the others
as the sample is of course smaller.
3.1.5 GIM2D robustness
The general robustness of GIM2D has been extensively verified via
a number of studies, in particular Simard et al. (2002), who use de-
tailed simulations to verify the accuracy of the code. Comparisons
have also been made against other similar codes (e.g. Pignatelli,
Fasano & Cassata 2006). Generally GIM2D has no systematic bias,
except perhaps with the recovery of large Sersic indices (n > 4).
Overall it is generally considered a robust and reliable code. Here
we do not repeat these studies; however we do address the credibil-
ity of our measurements via repeat analyses for a subset of galaxies
which lie in the overlap regions (see Liske et al. 2003). From the
overlap regions we have 682 repeat observations for which identical
bulge disc decomposition analyses and logical filtering (see Allen
et al. 2006) have been carried out. In this paper we are only using
high signal-to-noise ratio components where the component magni-
tude is brighter than 20.0 mag, the absolute component magnitude
is brighter than −17.0 mag, and where the apparent B/T ratio is
less than 0.5. After implementing these cuts in both sets of analy-
ses we are left with a total of 20 bulges and 389 discs for which
repeat GIM2D measurements exist. Fig. 8 shows the stability of the
key measurements [1 − cos(i) and component magnitude] – note
that the inclination adopted for the bulge components is taken from
their associated discs. These data confirm the broader analysis of the
full catalogue by Allen et al. (2006) that our GIM2D measurements
are repeatable. The component magnitudes are robust to better than
±0.1 mag (for both bulges and discs) and that the 1 − cos(i) mea-
surement is robust to ∼0.05 for systems with high signal-to-noise
ratio bulges and ∼0.1 for disc systems. As the error in 1 − cos(i) is
comparable to our bin size, for discs, this may partially explain the
smooth trend where scattering between bins will correlate both the
measurements and errors. It is worth noting that the accuracy of the
disc inclination appears more robust for those systems with a high
signal-to-noise ratio bulge. This is to be expected as the B/T selec-
tion ensures that only very high signal-to-noise ratio discs contribute
to the bulge repeats naturally leading to a more accurate inclination
measurement. Our conclusion is that our GIM2D results are robust as
demonstrated by the repeatability of the measurements. However,
we cannot rule out certain limitations in the GIM2D software, for ex-
ample, non-exponential discs and disc truncation issues which are
not as yet incorporated in the GIM2D package.
3.1.6 Looking at images
A result as strong as that revealed above should be detectable by
directly inspecting the imaging data. Fig. 9 shows galaxies with
B/T < 0.2 drawn from a narrow redshift interval (0.05 < z < 0.07).
In each 1 − cos(i) bin (vertical axis) we show the eight brightest
galaxies, arranged along the horizontal axis by decreasing lumi-
nosity. All galaxies are displayed at the same contrast levels, and
even though trends will be to some extent masked by cosmic vari-
ance it is apparent that there is progressively less flux as one looks
down the sequence in inclination. Clearly, some objects lie in erro-
neous positions. For example, there is a highly inclined galaxy in the
C© 2007 The Authors. Journal compilation C© 2007 RAS, MNRAS 379, 1022–1036
MGC: dust 1029
Figure 6. The left- and right-hand panels show the bulge and disc attenuation–inclination corrections derived from various B/T-selected subsamples as indicated.
The dotted lines show the solutions derived for the full samples and the solid lines show the final fits for the specified B/T interval.
1 − cos(i) = 0.4–0.5 bin and highly asymmetric systems are also
seen in inappropriate inclination bins. We estimate, roughly, that
we have a 10 per cent failure rate in our GIM2D-derived structural
catalogue but no systematic bias sufficiently large to dominate our
result.
4 M O D E L L I N G T H E FAC E - O N AT T E N UAT I O N
In the previous section we obtained a purely empirical attenuation–
inclination relation. However, this relation does not provide the face-
on attenuation, nor does it give direct information about the dust
mass which is needed to account for the observed rise in attenuation
with inclination. However, both these quantities can be estimated
using a model incorporating a given geometry for the distributions
of dust and luminosity, since such models predict both the face-on
attenuation and the rise in attenuation with inclination as a function
of disc opacity. To derive these we adopt the model of Popescu et al.
(2000), which uses geometries for stars and dust which can repro-
duce the entire UV/optical/FIR/submm spectral energy distribution
(SED) of nearby spiral galaxies and for which Tuffs et al. (2004)
tabulated the total attenuation versus inclination as a function of
central B-band face-on optical depth, τ fB , separately for the disc and
bulge components.
The predictions of this model for three values of central face-on
BMGC-band opacities τ fB =1, 2 and 4 are overlaid on the B/T < 0.2
disc data in Fig. 10. We only consider disc-dominated galaxies here
in order to minimize any contamination from bulges arising from
any biases in the bulge–disc decomposition due to the effect of dust
itself. One can see that the model predicts the data rather well for
τ fB = 4. The best fit is τ f
B = 3.8 ± 0.7. From this value we can now
derive the BMGC face-on attenuation for discs of (0.20 ± 0.04) mag
and for bulges of (0.84 ± 0.10) mag.
This level of attenuation implies that the central regions of disc
systems are optically thick, as also found by Shao et al. (2007)
based on an analysis of spiral galaxies (without bulge–disc decom-
position) drawn from the Sloan Digital Sky Survey (SDSS). To
put this in context, consider the case of a geometrically infinitely
thin, optically thick disc. In this case one expects all of the light
from the far side of the bulge to be entirely blocked. This would
result in a reduction of the bulge’s flux by a factor of 2, that is, by
0.75 mag. We find a slightly higher value of 0.84 mag which re-
flects the physical thickness of the dust layer. For an infinitely thin
disc, one also expects the bulge flux to increase again sharply in
the edge-on case where one can see both halves of the bulge. This
does not happen in our models, again because of the thickness of
the dust layer. Instead, the attenuation decreases only slightly as
the edge-on case is approached. The high level of face-on attenu-
ation of bulges derived from our models is quite insensitive to the
assumed distribution of unattenuated stellar light in the centre, for
example, it does not change much when changing the Sersic index
of the bulge. The biggest uncertainty which could potentially affect
our conclusion, that more than half of the light from the bulge is
blocked by the dust in the disc, concerns whether or not this dust
has a hole in the centre. We do not believe this to be the case since
imaging observations of dust emission from nearby face-on spiral
galaxies (at linear resolutions of a few hundred parsecs or better)
show no evidence for an incomplete dust disc in the central regions
occupied by the bulge (Haas et al. 1998 and Gordon et al. 2006 for
C© 2007 The Authors. Journal compilation C© 2007 RAS, MNRAS 379, 1022–1036

1030 S. P. Driver et al.
-19.5 -19 -18.50
-0.2
-0.4
-0.6
-0.8
-1
-20 -19.5 -19
-0.6
-0.8
-1
-1.2
-1.4
Figure 7. The upper panel shows the bulge LD and function before (solid
line) and after (dotted line) applying the attenuation–inclination correction.
The dashed line shows the LF derived only from face-on [1 − cos(i) < 0.3]
data and scaled up by a factor of 3.33. The lower panel shows the same
for discs. The right-hand panels show the 1σ error contours in the M∗–α
plane.
Table 1. Schechter function parameters for various galaxy samples with varying degrees of dust attenuation corrections.
Component M∗ − 5 log h φ∗ α ja ρb
(mag) [10−2 h3 Mpc−3 (0.5 mag)−1] (108 h L� Mpc−3) (108 h M� Mpc−3)
Discs
Uncorrected −19.45 ± 0.04 1.8 ± 0.1d −1.16 ± 0.04 1.7 ± 0.2d 3.8 ± 0.4d
Inclination corrected −19.56 ± 0.04 2.1(2.2)c ± 0.1d −1.10 ± 0.03 2.1(2.2)c ± 0.2d 4.7(5.0)c ± 0.5d
Inclination and face-on corrected −19.76 ± 0.04 2.1(2.2)c ± 0.1d −1.11 ± 0.03 2.6(2.7)c ± 0.2d 4.1(4.4)c ± 0.3d
3.33 × [1 − cos(i) < 0.3] −19.44 ± 0.07 2.7 ± 0.2d −1.02 ± 0.06 2.3 ± 0.5d 5.3 ± 1.2d
3.33 × [1 − cos(i) < 0.3] and face-on corrected −19.64 ± 0.07 2.6 ± 0.2d −1.04 ± 0.05 2.7 ± 0.5d 4.7 ± 0.9d
Bulges
Uncorrected −19.11 ± 0.07 0.65 ± 0.05d −0.75 ± 0.08 0.37 ± 0.06d 1.6 ± 0.3d
Inclination corrected −19.18 ± 0.07 0.87(0.91)c ± 0.05d −0.49 ± 0.08 0.51(0.54)c ± 0.06d 2.3(2.4)c ± 0.3d
Inclination and face-on corrected −20.00 ± 0.07 0.97(1.03)c ± 0.05d −0.56 ± 0.08 1.22(1.29)c ± 0.15d 2.1(2.2)c ± 0.2d
1 − cos(i) < 0.3 −18.92 ± 0.11 1.23 ± 0.07d −0.19 ± 0.15 0.60 ± 0.08d 2.7 ± 0.4d
1 − cos(i) < 0.3 and face-on corrected −19.68 ± 0.10 1.27 ± 0.07d −0.19 ± 0.15 1.25 ± 0.15d 2.1 ± 0.3d
Spheroids (bulges + ellipticals)e
Uncorrected −19.15 ± 0.06 0.99 ± 0.05d −0.66 ± 0.07 0.57 ± 0.07d 2.4 ± 0.4d
Inclination corrected −19.15 ± 0.06 1.23 ± 0.05d −0.44 ± 0.07 0.71 ± 0.08d 3.1(3.2)c ± 0.4d
Inclination and face-on corrected −19.95 ± 0.06 1.37 ± 0.07d −0.76 ± 0.05 1.7 ± 0.2d 2.9(3.0)c ± 0.3d
3.33 × [1 − cos(i) < 0.3] −19.00 ± 0.05 1.53 ± 0.15d −0.31 ± 0.07 0.8 ± 0.1d 3.5 ± 0.5d
3.33 × [1 − cos(i) < 0.3] and face-on corrected −19.75 ± 0.04 1.61 ± 0.15d −0.52 ± 0.05 1.6 ± 0.2d 2.9 ± 0.4d
Ellipticals (no corrections) −19.02 ± 0.11 0.37 ± 0.03d −0.26 ± 0.14 0.20 ± 0.03d 0.8 ± 0.1d
aThe luminosity density is defined as j = φ∗L∗�(α + 2), where we use M� = 5.38 mag. To convert from the BMGC to the bJ band multiply all j values by 1.05.bThe stellar mass density is derived using equation (4). The colour corrections shown in Table 2 are only used when calculating face-on-corrected values. cAll
φ∗, j and ρ values for inclination-corrected data and inclination- and face-on-corrected data can arguably be scaled up by factors of 1.05 for bulges and 1.06
for discs if one wishes to compensate for the apparent incompleteness in the highest inclination bin of Fig. 5. dThe quoted errors on φ∗, j and ρ are the random
errors only. Based on mock 2dFGRS NGP catalogues (Cole et al. 1998) we estimate that the potential systematic error on these values due to cosmic variance
amounts to 13 per cent. eAll corrections and the cos(i) selection are only applied to the bulges. No corrections are applied to the ellipticals.
M31; Hippelein et al. 2003 and Hinz et al. 2004 for M33; Popescu
et al. 2005 for M101).
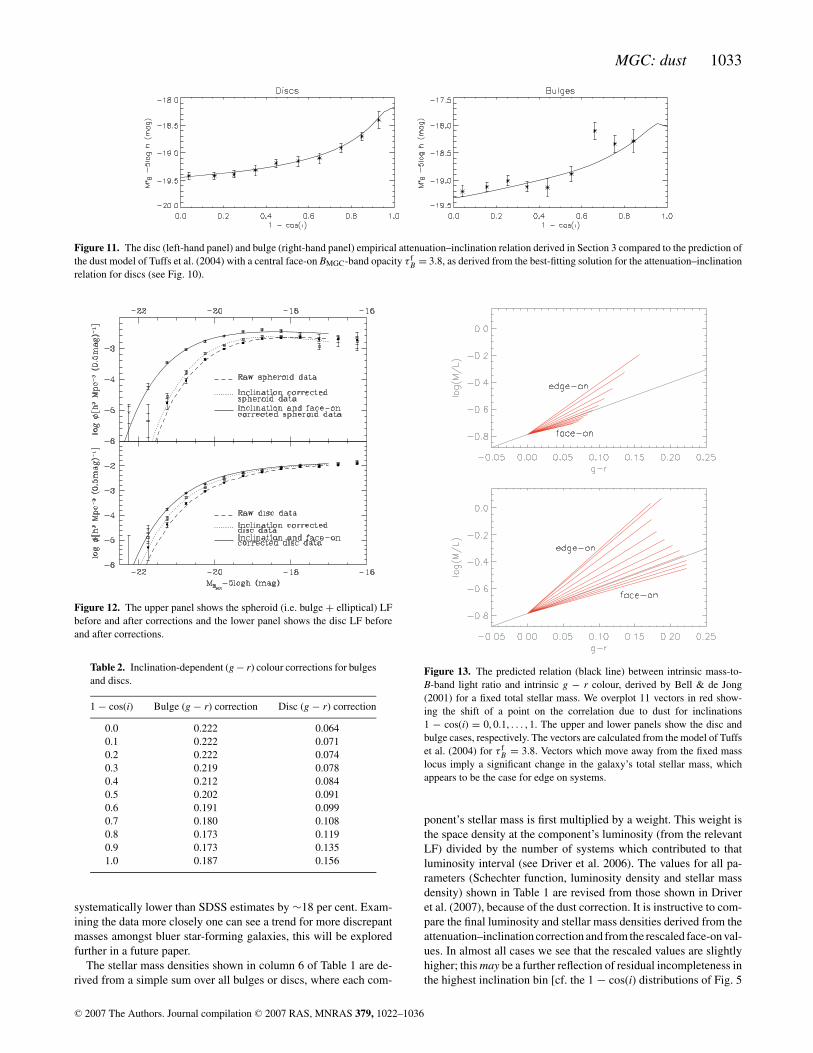
Fig. 11 shows the empirically determined attenuation–inclination
curve for the bulges of bulge-dominated galaxies, together with the
model prediction for τ fB = 3.8. The model is broadly consistent with
the data. As predicted by Tuffs et al. (2004), the curve is steeper for
bulges than for discs, even at low inclinations. It is worth highlight-
ing that the models used here incorporate only one free parameter,
τ fB , fitted to the discs which provides a satisfactory fit to the full
trend for both discs and bulges simultaneously. This suggests that
the large-scale geometry of dust in the MGC galaxies relative to the
stars is well described by that adopted a priori by the model. It also
follows that the basic model assumption, namely, that the effective
radius of the bulge is much smaller than the scalelength of the dust
disc, is indeed valid for the bulk of galaxies in the sample, irrespec-
tive of the value of B/T (cf. the discussion in Section 3.1.3). It also
begs the question as to whether entirely embedded bulges may exist
in some systems.
We also note that our conclusion that the measured attenuation–
inclination curves require galaxies with fairly opaque central regions
is qualitatively consistent with the lack of a strong increase in the
central surface brightness of the galaxies depicted in Fig. 9 as one
progresses from face-on to edge-on systems. Such an increase is
predicted for optically thin galaxies (Mollenhoff et al. 2006).
5 T H E C O S M I C S T E L L A R L U M I N O S I T Y,M A S S A N D D U S T D E N S I T I E S
5.1 Intrinsic LFs and the cosmic stellar luminosity density
Having derived the empirical attenuation–inclination relation and
the model-dependent face-on attenuation for both discs and bulges
C© 2007 The Authors. Journal compilation C© 2007 RAS, MNRAS 379, 1022–1036

MGC: dust 1031
-0.4 -0.2 0 0.2 0.40
2
4
6
8
(a)
-0.4 -0.2 0 0.2 0.40
2
4
6
8
(b)
-0.4 -0.2 0 0.2 0.40
10
20
30
40
50
60
(c)
-0.4 -0.2 0 0.2 0.40
10
20
30
40
50
60
(d)
Figure 8. The stability of the key GIM2D measurements of 1 − cos(i) (left-
hand panels) and component magnitude (right-hand panels) for bulges (upper
panels) and discs (lower panels) for which repeat measurements with GIM2D
exist. Note that the adopted inclination for bulge components is taken from
their associated discs.
we are now in a position to derive the LFs of the pre-attenuated BMGC
flux produced by the total stellar population (i.e. before any atten-
uation occurs). To do this we follow Driver et al. (2007) after first
applying our attenuation–inclination relation to all discs and bulges
derived from systems with post-corrected B/T values ranging up
to the relatively large value of 0.8. The validity of also correcting
bulge-dominated systems is demonstrated by our own data, which
show that galaxies with 0.5 < B/T < 0.8 are attenuated almost as
much by dust as galaxies with 0.2 < B/T < 0.5 (see Figs 6b and
c), and by the local examples of the Centaurus A and Sombrero
galaxies. Furthermore, many S0 galaxies obey the FIR–radio cor-
relation, showing that they have similar dust opacities in relation to
their star formation activity as spiral galaxies (Bally & Thronson
1989). Note that it is not clear, at this stage, whether the S0 galax-
ies in our sample are predominantly found among our high-B/T or
elliptical populations. Most likely they fall in both. Higher spatial
resolution imaging is required before they can be identified with
any confidence and hence at this point we cannot make any reliable
statements about their dust content.
Fig. 12 and Table 1 show the final results based on both the
inclination and the combined inclination and face-on corrections. In
making these corrections we assumed that opacity does not depend
on luminosity, that is, we applied the same correction for all galaxies.
The recent study by Shao et al. (2007) suggests this assumption is
reasonable as they find minimal change in opacity with luminosity.
We note that all three Schechter parameters have been substan-
tially modified by taking into account the effects of dust. This is
especially true for bulges, where L∗ is increased by a factor of 2.3,
φ∗ is increased by 58 per cent and α is increased by 0.19. This
change in α is caused by objects previously below the flux cut-off
being dust corrected into the sample. The luminosity densities cor-
responding to the various Schechter function fits are also given in
Table 1.
5.2 The cosmic stellar mass densities
In addition to the luminosity densities we also derive the stellar mass
densities (Table 1, column 6). We follow the procedure outlined in
Driver et al. (2006) which uses the (g − r) disc or bulge colour to
derive a mass-to-light ratio based on the prescription given by Bell
& de Jong (2001). The adopted equation (see Driver et al. 2006) is
M = 10[1.93(g−r )−0.79]10−0.4(MB −M�), (4)
whereMdenotes stellar mass, and g− r and MB refer to attenuation-
free quantities. Since we have already corrected the magnitudes for
attenuation we must now also correct the colour for the effect of
dust before we can apply this formula. Fig. 13 shows the combined
correction for attenuation and reddening for an example point on the
mass-to-B-band light ratio versus g − r colour relation, separately
for discs and bulges. This correction was derived from tables 4 and
6 of Tuffs et al. (2004) for τ fB = 3.8 and for 11 inclinations corre-
sponding to 1 − cos(i) = 0, 0.1, . . . , 1. One sees a strong dependence
of the corrections on inclination. The colour corrections are listed
in Table 2 and are derived from our disc opacity constraint on the
general dust models presented in Tuffs et al. (2004). Empirically
we cannot determine the absolute colour corrections to corroborate
these values, however we can compare the inclination-dependent
component. Fig. 14 shows the mean component (g − r) colour from
within each inclination bin. As can be seen from a comparison of
the models and data the inclination-dependent colour correction is
actually quite weak but in full agreement for discs across the entire
inclination range and for bulges with 1 − cos(i) < 0.6.
Bell & de Jong (2001) argue that the stellar masses derived from
their relation are robust against the effect of dust provided the dust
vectors are parallel to the relation. The reason is that the under-
prediction of stellar mass arising from the attenuation in lumi-
nosity will be compensated by the overprediction of stellar mass
arising from the reddening in colour. Inspection of Fig. 13 shows
that whereas this balance applies for face-on systems (both for discs
and bulges) this is not the case for highly inclined systems. Both
bulges and discs at higher inclinations show a systematically higher
ratio of attenuation to reddening. This situation arises because a
larger fraction of the lines of sight through both bulges and the cen-
tral regions of discs at all inclinations are optically thick, and in the
optically thick limit attenuation becomes saturated at a high level,
exhibiting only a small variation with wavelength (see Tuffs et al.
2004). The overall consequence is that stellar masses will be under-
predicted for a randomly oriented distribution by use of the Bell &
de Jong (2001) relation if dust is not taken into account.
The corrections shown in Fig. 13 were applied to each object
individually and the stellar masses were extracted using equation (4).
These estimates for the mass densities (as well as for the stellar
luminosity) will be valid if the efficiency of absorption of BMGC-band
photons by M∗ galaxies is representative of the galaxy population
at large.
In order to ascertain the credibility of our stellar mass estimates
we compare our masses to those derived for SDSS galaxies by
Kauffmann et al. (2003). The data were kindly provided by J. Brinch-
man (private communication) and were matched to the MGC cata-
logue, resulting in 1855 matched objects (using a 5 arcsec positional
tolerance). The relatively small number of matches is due to the
much brighter limit of the SDSS spectroscopic survey compared to
the MGC. The SDSS stellar mass-to-light ratios are derived from the
spectra, a dust attenuation correction from the colours and the final
masses from the z-band Petrosian fluxes (incorporating the derived
C© 2007 The Authors. Journal compilation C© 2007 RAS, MNRAS 379, 1022–1036

1032 S. P. Driver et al.
Figure 9. For each 1 − cos(i) bin along the vertical axis we show MGC postage stamp images of the eight brightest galaxies in a narrow redshift interval
(0.05 < z < 0.07) and with B/T < 0.2. Within each bin the galaxies are arranged along the horizontal axis according to their magnitude rank. On average,
and in the absence of dust, the galaxies should have the same intrinsic luminosity around the L∗ value, irrespective of their inclination. However, one can see a
general diminishing of flux towards higher inclination.
Figure 10. The empirical disc attenuation–inclination relation derived in
Section 3 (plotted as symbols) compared to the predictions of the dust model
of Tuffs et al. (2004) for discs with different central face-on BMGC-band
opacities, τ fB .
mass-to-light ratio and attenuation correction). Full details of this
process are given by Kauffmann et al. (2003).
Fig. 15 shows the comparison of the matched sample both with
and without dust correction (which applies to both the SDSS and
MGC data). Note that we are comparing total-galaxy stellar masses
here, that is, for two-component galaxies we have summed the
MGC disc and bulge estimates. The median stellar mass ratio is
found to be 1.18 (i.e. 0.073 dex) with SDSS masses being system-
atically higher. SDSS masses are based on a Kroupa (2001) initial
mass function (IMF) whereas the Bell & de Jong (2001) values
are based on a Salpeter-lite IMF but these should give compara-
ble masses. The dispersion is reasonable, implying an uncertainty
of � log(M) = ±0.16 (45 per cent) for individual galaxy mea-
surements which includes a contribution from the magnitude uncer-
tainty. If one assumes the stellar mass error is equally distributed
between the two surveys this implies individual mass uncertainties
of � log(M) ∼ ±0.11 (i.e. 30 per cent). We therefore conclude
that our mass estimates show a reasonable dispersion but are still
C© 2007 The Authors. Journal compilation C© 2007 RAS, MNRAS 379, 1022–1036
MGC: dust 1033
Figure 11. The disc (left-hand panel) and bulge (right-hand panel) empirical attenuation–inclination relation derived in Section 3 compared to the prediction of
the dust model of Tuffs et al. (2004) with a central face-on BMGC-band opacity τ fB = 3.8, as derived from the best-fitting solution for the attenuation–inclination
relation for discs (see Fig. 10).
Figure 12. The upper panel shows the spheroid (i.e. bulge + elliptical) LF
before and after corrections and the lower panel shows the disc LF before
and after corrections.
Table 2. Inclination-dependent (g − r) colour corrections for bulges
and discs.
1 − cos(i) Bulge (g − r) correction Disc (g − r) correction
0.0 0.222 0.064
0.1 0.222 0.071
0.2 0.222 0.074
0.3 0.219 0.078
0.4 0.212 0.084
0.5 0.202 0.091
0.6 0.191 0.099
0.7 0.180 0.108
0.8 0.173 0.119
0.9 0.173 0.135
1.0 0.187 0.156
systematically lower than SDSS estimates by ∼18 per cent. Exam-
ining the data more closely one can see a trend for more discrepant
masses amongst bluer star-forming galaxies, this will be explored
further in a future paper.
The stellar mass densities shown in column 6 of Table 1 are de-
rived from a simple sum over all bulges or discs, where each com-
Figure 13. The predicted relation (black line) between intrinsic mass-to-
B-band light ratio and intrinsic g − r colour, derived by Bell & de Jong
(2001) for a fixed total stellar mass. We overplot 11 vectors in red show-
ing the shift of a point on the correlation due to dust for inclinations
1 − cos(i) = 0, 0.1, . . . , 1. The upper and lower panels show the disc and
bulge cases, respectively. The vectors are calculated from the model of Tuffs
et al. (2004) for τ fB = 3.8. Vectors which move away from the fixed mass
locus imply a significant change in the galaxy’s total stellar mass, which
appears to be the case for edge on systems.
ponent’s stellar mass is first multiplied by a weight. This weight is
the space density at the component’s luminosity (from the relevant
LF) divided by the number of systems which contributed to that
luminosity interval (see Driver et al. 2006). The values for all pa-
rameters (Schechter function, luminosity density and stellar mass
density) shown in Table 1 are revised from those shown in Driver
et al. (2007), because of the dust correction. It is instructive to com-
pare the final luminosity and stellar mass densities derived from the
attenuation–inclination correction and from the rescaled face-on val-
ues. In almost all cases we see that the rescaled values are slightly
higher; this may be a further reflection of residual incompleteness in
the highest inclination bin [cf. the 1 − cos(i) distributions of Fig. 5
C© 2007 The Authors. Journal compilation C© 2007 RAS, MNRAS 379, 1022–1036

1034 S. P. Driver et al.
0 0.2 0.4 0.6 0.8 10.2
0.4
0.6
0.8
1
1-cos(i)
Figure 14. The component (g − r) colour versus inclination for bulges and
discs derived empirically (data points) and predicted by our dust models
(lines).
Figure 15. Comparison of the final dust-corrected SDSS stellar masses
(Kauffmann et al. 2003) and the MGC total-galaxy stellar masses for MGC
data with (dotted line) and without (solid line) our dust correction. The
corrected MGC data is shifted to higher masses, relative to SDSS values and
the final median offset is a factor of ∼1.18 (i.e. 0.073 dex).
and the LFs shown in Fig. 7]. One can estimate a correction factor to
apply to the attenuation-corrected data based on the incompleteness
of extreme inclination objects. These are 1.05 for bulges and 1.06
for discs resulting in final stellar mass density estimates, at redshift
zero, of
ρ(discs) = (4.4 ± 0.3) × 108 h M� Mpc−3,
ρ(bulges) = (2.2 ± 0.2) × 108 h M� Mpc−3,
ρ(ellipticals) = (0.8 ± 0.1) × 108 h M� Mpc−3. (5)
Hence we conclude that the combined stellar mass density based
on our empirical inclination plus model face-on correction is ρ =(7.6 ± 0.4 ± 1.0) × 108 h M� Mpc−3, where the second error is
due to cosmic variance. This should be modified downwards by
about a factor of 1.1 to get a Kroupa IMF based value (I. Baldry,
private communication). Note that this total value also includes the
stellar mass estimate, derived in Driver et al. (2007), for the low-
luminosity blue spheroid systems of ρ(blue spheroids) = (0.2 ±0.1) × 108 h M� Mpc−3.
5.3 The cosmic dust density
The derivation of the cosmic dust density from the MGC data is less
straightforward, as there is no obvious direct physical link between
the mass of dust in a galaxy and the B-band luminosity. Neither
is there direct empirical information linking these two quantities
over the luminosity range covered by the MGC due to the lack of
statistically significant FIR or submm measurements of galaxies less
luminous than M∗. Here we simply assume that there is a fixed ratio
between dust mass and BMGC-band intrinsic luminosity of discs, as
adopted for the canonical galaxy model used by Tuffs et al. (2004)
for M∗, and scale the cosmic BMGC-band luminosity density of discs,
as derived in Section 5.1, by this ratio.
As it is mainly discs close to M∗ which dominate the total disc
luminosity density, a luminosity-dependent dust mass-to-light ratio
would not actually be problematic as long as the dependency is not
extreme. In this context we note that our value for the opacity of
discs (τ fB = 3.8 ± 0.7) is comparable to that obtained from detailed
SED modelling of the components of stellar luminosity absorbed by
grains and reradiated in the FIR (Popescu et al. 2000; Misiriotis et al.
2001, 2004) of well-studied, relatively luminous L∗ spiral galaxies.
We augment this sample with data for spiral and dwarf galaxies with
ISO detections drawn from Tuffs et al. (2002), for which Popescu
et al. (2002) derive dust masses for 29 galaxies with FIR and B-
band luminosity measurements. In these systems, the ratio of dust
mass per B-band disc intrinsic luminosity is found to be (0.001 96
± 0.000 58) M� L−1� (note no h dependence). Multiplying this ratio
by the intrinsic BMGC luminosity density of discs of 2.7 × 10⁸ h L�Mpc−3 then yields a value of (5.3 ± 1.6 ± 0.7) × 105 h M� Mpc−3
for the cosmic dust density, where the second error is due to cosmic
variance.
5.4 Implications for the cosmic baryon budget
Adopting a value for the total cosmic baryon density of �baryon h2
= 0.023 (Tegmark et al. 2006) and ρcrit = 2.7755 ×10¹¹ h2 M� Mpc−3, we find the fraction of cosmic baryons in dust
and stars today is (0.0083 ± 0.0027) h per cent and (11.9 ± 1.7) hper cent (Salpeter-lite), respectively. This value for the stellar baryon
fraction is marginally (2σ ) higher than that previously derived by
Baldry & Glazebrook (2003) of (5–9) h per cent (marginalized over
a variety of IMFs). Our value is also slightly higher than the value
of (9 ± 1.3) h per cent derived by Cole et al. (2001) from the
2MASS/2dFGRS NIR LF (see also the summary of stellar masses
in Bell et al. 2003). We note that Cole et al. (2001) cite their values
as dust-free but acknowledge that if dust attenuation is severe this
could impact upon their estimates. Using our model we can explore
this by deriving dust attenuation values for the bulge and disc com-
ponents in the Ks band (see Fig. 16) which demonstrate that dust
attenuation remains non-negligible even at Ks.
6 S U M M A RY A N D D I S C U S S I O N
We have demonstrated that dust attenuation is a severe issue in
the B band, resulting in the magnitudes of both discs and bulge
C© 2007 The Authors. Journal compilation C© 2007 RAS, MNRAS 379, 1022–1036

MGC: dust 1035
Figure 16. Predicted attenuation–inclination curves in the B, I and Ks bands
for the bulge (top panel) and the disc (bottom panel) of a galaxy with a central
face-on optical depth in the BMGC band of τ fB = 3.8.
components being severely underestimated by factors of 0.20–1.1
and 0.84–2.6 mag, respectively. The direct implication is that only
63 and 29 per cent of the total B-band photons produced by stars
in discs and bulges, respectively, actually make it out of the galaxy
(as deduced from the luminosity densities with and without dust
corrections). The remainder are absorbed by the dust and presum-
ably reradiated in the FIR. As this reradiation is likely to be almost
perfectly isotropic and un-attenuated one might expect the optical
to FIR flux ratio to show some inclination dependence. We find that
the central face-on optical depth of discs is τ fB = 3.8 ± 0.7 which
implies that discs are optically thick in the centres. This conclusion
was also reached by Shao et al. (2007) who analysed the behaviour
of total-galaxy magnitudes of spiral galaxies drawn from the SDSS
as a function of inclination. We find that this conclusion holds re-
gardless of the bulge luminosity and it is hence independent of the
bulge-to-total flux ratio. Thus, dust appears to be inherently related
to the disc, with no physical connection to the bulges.
Our value for the opacity of discs (τ fB = 3.8 ± 0.7) is comparable
to that obtained from self-consistent SED modelling of the compo-
nents of stellar luminosity absorbed by grains and reradiated in the
FIR (Popescu et al. 2000; Misiriotis et al. 2001, 2004). This value for
central face-on opacity is however significantly higher than might
be expected on the basis of the extinction measurements towards
central stellar clusters in spiral galaxies by Sarzi et al. (2005). As
a possible explanation for this discrepancy, we note that our mea-
surement of τ fB (like that from the SED modelling) is derived from
the integrated properties of galaxies. It is therefore representative
of the global distribution of opacity over the whole disc, and is not
sensitive to opacity along individual lines of sight; in other words, it
is not sensitive to inhomogeneities in the dust distribution on scales
of 100 pc. Therefore, this difference may indicate that the dust den-
sity in the central 100 pc of spiral galaxies may be systematically
lower than that for the surrounding regions of the inner disc, and
that the central 100-pc region may have some specific properties,
for example, due to feedback in the form of dispersion of material
surrounding a central massive star cluster. Alternatively, it may sim-
ply be that the disc population has a large range of opacities, and
that central star clusters are only clearly identifiable in discs with
relatively low opacities.
Although this work quantifies the severity of the mean dust at-
tenuation in galaxy discs and bulges this method cannot constrain
the galaxy-to-galaxy variation. To address this it is imperative that
pointed FIR observations of large, optically selected galaxy samples
are undertaken with sufficient depth to detect systems over the full
luminosity range sampled by surveys such as the MGC.
In terms of the total B-band luminosity density of the Universe,
based on LF estimates, we infer that our previous estimates (Liske
et al. 2003; Driver et al. 2005, 2006; Liske et al. 2006; Driver et al.
2007) should be revised upwards by a factor of ∼1.8. In terms of
the stellar mass density the change amounts to an upward revision
of a factor of ∼1.2. Previous estimates of the B-band galaxy LF
which have neglected to correct for dust attenuation have underes-
timated M∗B by ∼0.6–1 mag. When comparing models of galaxy
formation and evolution to data one must therefore be careful to
either include realistic dust attenuation in the models or to compare
to dust-corrected data as provided here.
In Driver et al. (2007) we reported that the stellar mass was broken
down as 60:27:13 into discs:classical bulges:ellipticals (ignoring the
contribution from pseudo-bulges and blue ellipticals).
We can now revise these values, incorporating our dust correc-
tions for discs and bulges, to 59:30:11. Hence the stellar mass in
classical bulges is a factor of 2.7 higher than the mass in ellipticals.
Throughout this study we have assumed ellipticals to be dust-
free. Since ellipticals and bulges are known to have similar apparent
colours, the correction of our bulges for dust attenuation implies
that they will have significantly bluer intrinsic colours. It therefore
follows that they must be younger and/or metal-poorer which is con-
sistent with the spectroscopic studies of Proctor & Sansom (2002)
and Thomas & Davies (2006).
We also note that the high opacities leading to our conclusion that
the bulges have intrinsically bluer colours is not inconsistent with
the observations that bulges show a small spread in apparent colours
and exhibit small colour gradients (see review by Renzini 2006). Our
dust model predicts that for the high opacities found in this paper
the variation in bulge colour due to dust is almost independent of
inclination (see also Section 5.2), and that there should be very little
colour gradients in bulges due to dust.
Finally, our calibrated dust model predicts that dust will signifi-
cantly attenuate stellar light even at NIR wavelengths, particularly
for bulges. This is illustrated in Fig. 16 where predicted attenuation–
inclination curves are plotted for the bulge and disc components of
a τ fB = 3.8 ± 0.7 galaxy in the B, I and Ks bands. Hence even
the upcoming deep NIR surveys will need to manage internal dust
attenuation with care.
AC K N OW L E D G M E N T S
We thank Jarle Brinchman for providing SDSS stellar mass data
and Ivan Baldry for comments on earlier drafts. We would also
like to acknowledge enlightening discussions with Barry Madore,
Alan Dressler and Anne Sansom. The Millennium Galaxy Cata-
logue consists of imaging data from the Isaac Newton Telescope
and spectroscopic data from the Anglo-Australian Telescope, the
ANU 2.3 m, the ESO New Technology Telescope, the Telescopio
Nazionale Galileo and the Gemini North Telescope. The survey
has been supported through grants from the Particle Physics and
C© 2007 The Authors. Journal compilation C© 2007 RAS, MNRAS 379, 1022–1036

1036 S. P. Driver et al.
Astronomy Research Council (UK) and the Australian Research
Council (Australia). The data and data products are publicly avail-
able from http://www.eso.org/∼jliske/mgc/ or on request from JL
or SPD.
R E F E R E N C E S
Allen P., Driver S. P., Graham A. W., Cameron E., Liske J., Cross N. J. G.,
De Propris R., 2006, MNRAS, 371, 2
Baes M., Dejonghe H., 2001, MNRAS, 326, 733
Baldry I., Glazebrook K., 2003, ApJ, 593, 258
Bally J., Thronson H. A. Jr, 1989, AJ, 97, 69
Bell E. F., de Jong R. S., 2001, ApJ, 550, 212
Bell E. F., McIntosh D. H., Katz N., Weinberg M. D., 2003, ApJS, 149, 289
Bianchi S., Ferrara A., Giovanardi C., 1996, ApJ, 465, 127
Bianchi S., Davies J. I., Alton P. B., 2000, A&A, 359, 65
Blanton M. et al., 2003, ApJ, 592, 819
Boissier S., Boselli A., Buat V., Donas J., Milliard B., 2004, A&A, 424, 465
Byun Y. I., Freeman K. C., Kylafis N. D., 1994, ApJ, 432, 114
Choi Y., Park C., Vogeley M. S., 2007, ApJ, 658, 884
Cole S., Hatton S., Weinberg D. H., Frenk C. S., 1998, MNRAS, 300, 945
Cole S. et al., 2001, MNRAS, 326, 255
Cross N. J. G., Driver S. P., Liske J., Lemon D. J., Peacock J. A., Cole S.,
Norberg P., Sutherland W. J., 2004, MNRAS, 349, 576
Cunow B., 2001, MNRAS, 323, 130
Davies J. I., Burstein D., 1995, in NATA ASI, The Opacity of Spiral Discs.
Kluwer, Dordrecht
Disney M. J., Davies J. I., Phillipps S., 1989, MNRAS, 239, 939
Disney M. J., Burstein D., Haynes M. P., Faber S. M., 1992, Nat, 356,
114
Driver S. P., Liske J., Cross N. J. G., De Propris R., Allen P. D., 2005,
MNRAS, 360, 81
Driver S. P. et al., 2006, MNRAS, 368, 414
Driver S. P., Allen P., Liske J., Graham A. W. 2007, ApJ, 657, L85
Efstathiou G., Ellis R. S., Peterson B. A., 1988, MNRAS, 232, 431
Evans R., 1994, MNRAS, 266, 511
Ferrara A., Bianchi S., Cimatti A., Giovanardi C., 1999, ApJS, 123, 437
Freeman K. C., 1970, ApJ, 160, 81
Giovanelli R., Haynes M. P., Salzer J. J., Wegner G., da Costa L. N., Freudling
W., 1995, AJ, 110, 1059
Gordon K. D. et al., 2006, ApJ, 638, 87
Graham A. W., 2001, MNRAS, 326, 543
Graham A. W., Driver S. P., 2004, Publ. Astron. Soc. Aust., 22, 118
Graham A. W., Driver S. P., Petrosian V., Conselice C., Bershady M.,
Crawford S. M., Tomotsugu G., 2005, AJ, 130, 1535
Hass M., Lemke D., Stickel M., Hippelein H., Kunkel M., Herbstmeier U.,
Mattila K., 1998, A&A, 338, 33
Hinz J. L. et al., 2004, ApJS, 154, 259
Hippelein H., Haas M., Tuffs R. J., Lemke D., Stickel M., Klaas U., Volk,
H. J., 2003, A&A, 407, 137
Holmberg E., 1946, Medd. Lunds Obs. II, 117
Holmberg E., 1958, Medd. Lunds Obs. II, 136
Hubble E., 1926, ApJ, 64, 321
Kauffmann G. et al., 2003, MNRAS, 341, 33
Keel W. C., White R. E. III, 2001, AJ, 122, 1369
Kroupa P., 2001, MNRAS, 322, 231
Kuchinski L. E., Terndrup D. M., Gordon K. D., Witt A. N., 1998, AJ, 115,
1438
Kylafis N. D., Bahcall J. N., 1987, ApJ 317, 637
Liske J., Lemon D., Driver S. P., Cross N. J. G., Couch W. J., 2003, MNRAS,
344, 307
Liske J., Driver S. P., Allen P. D., Cross N. J. G., De Propris R., 2006,
MNRAS, 369, 1547
Masters K. L., Giovanelli R., Haynes M. P., 2003, AJ, 126, 158
Misiriotis A., Popescu C. C., Tuffs R. J., Kylafis N. D., 2001, A&A, 372,
775
Misiriotis A., Papadakis I. E., Kylafis N. D., Papamastorakis J., 2004, A&A,
417, 39
Mollenhoff C., Popescu C. C., Tuffs R. J., 2006, A&A, 456, 941
Norberg P. et al., 2001, MNRAS, 336, 907
Ostman L., Goobar A., Mortsell E., 2006, A&A, 450, 971
Pierini D., Maraston C., Gordon K. D., Witt A. N., 2005, MNRAS, 363, 131
Pignatelli E., Fasano E., Cassata P., 2006, A&A, 446, 373
Poggianti B., 1997, A&AS, 122, 399
Popescu C. C., Tuffs R. J., 2005, in Popescu C. C., Tuffs R. J., eds, AIP Conf.
Ser. Vol. 761, The Spectral Energy Distribution of Gas-Rich Galaxies:
Confronting Models with Data. Springer, Heidelberg, p. 155
Popescu C. C., Misiriotis A., Kylafis N. D., Tuffs R. J., Fischera J., 2000,
A&A, 362, 138
Popescu C. C., Tuffs R. J., Volk H. J., Pierini D., Madore B. F., 2002, ApJ,
567, 221
Popescu C. C. et al., 2005, ApJ, 619, L75
Proctor R. N., Sansom A. E., 2002, MNRAS, 333, 517
Renzini A., 2006, ARA&A, 44, 141
Sarzi M., Rix H.-W., Shields J. C., Ho L. C., Barth A. J., Rudnick G.,
Filippenko A. V., Sargent W. L. W., 2005, ApJ, 628, 169
Shao Z., Xiao W., Shen S., Mo H. J., Xia X., Deng Z., 2007, ApJ, 659, 1159
Shen S., Mo H. J., White S. D. M., Blanton M. R., Kauffmann G., Voges W.,
Brinkmann J., Csabai I., 2003, MNRAS, 343, 978
Silva L., Granato G. L., Bressan A., Danese L., 1998, A&A, 509, 103
Simard L. et al., 2002, ApJS, 142, 1
Tegmark M. et al., 2006, Phys. Rev. D, 74, 123507
Thomas D., Davies R. L., 2006, MNRAS, 366, 510
Tuffs R. J. et al., 2002, ApJS, 139, 37
Tuffs R. J., Popescu C. C., Volk H. J., Kylafis N. D., Dopita M. A., 2004,
A&A, 419, 835
Valentijn E. A., 1990, Nat, 346, 153
Xilouris E. M., Byun Y. I., Kylafis N. D., Paleologou E. V., Papamastorakis
J., 1999, A&A, 344, 868
Zucca E. et al., 1997, A&A, 326, 477
This paper has been typeset from a TEX/LATEX file prepared by the author.
C© 2007 The Authors. Journal compilation C© 2007 RAS, MNRAS 379, 1022–1036