the marches sector skills deep dive - agri-tech final report
TRANSCRIPT
1
The Marches Sector Skills Deep Dive -
Agri-tech
Final Report July 2020
2
Contents 1. Sector Context ................................................................................................................................. 3
2. Supply Side Analysis ........................................................................................................................ 7
2.1 Current Workforce Size ........................................................................................................... 7
2.2 Existing Training Provision ...................................................................................................... 8
2.2.1 Apprenticeship Provision .................................................................................................... 8
2.2.2 Further and Higher Education Provision ........................................................................... 10
3 Demand Side Analysis ................................................................................................................... 13
3.1 Occupational Forecasts ......................................................................................................... 15
3.2 Job Forecasts by Industry ...................................................................................................... 16
3.3 Sector Skill Shortages ............................................................................................................ 17
4 Supply vs Demand ......................................................................................................................... 20
4.1 Provision Review ................................................................................................................... 20
4.2 Future Drivers of Skills .......................................................................................................... 21
4.3 Impact of Brexit ..................................................................................................................... 22
4.4 Impact of Covid-19 ................................................................................................................ 22
5 Conclusions ................................................................................................................................... 23
5.1 Summary ............................................................................................................................... 23
5.2 Recommendations ................................................................................................................ 23
5.3 Action Planning ..................................................................................................................... 23
3
1. Sector Context
The agri-tech sector accounts for 4.6% of total GVA which equates to a value of £694m in the Marches.
With 3.7% of total jobs arising from the agri-tech sector, this equates to 10,730 jobs. While 17.5% of
all establishments in the Marches are in the agri-tech sector which is a total of 6,270 establishments.
The proportion of the total GVA, jobs and establishments is significantly higher than the national base,
emphasising the importance of this industry to the Marches economy.
The agri-tech sector plays an essential role in the Marches economy, and much of the work going on
across the Marches in this sector is both pioneering and world-leading. Agritech can be defined as
technological innovation to improve the efficiency and output of agriculture.
The Marches is home to Harper Adams University in Telford & Wrekin which is the world leader in
agri-tech research. The local industrial strategy makes clear that there will be future opportunities for
businesses to collaborate with the university in order to engage in new innovative techniques.
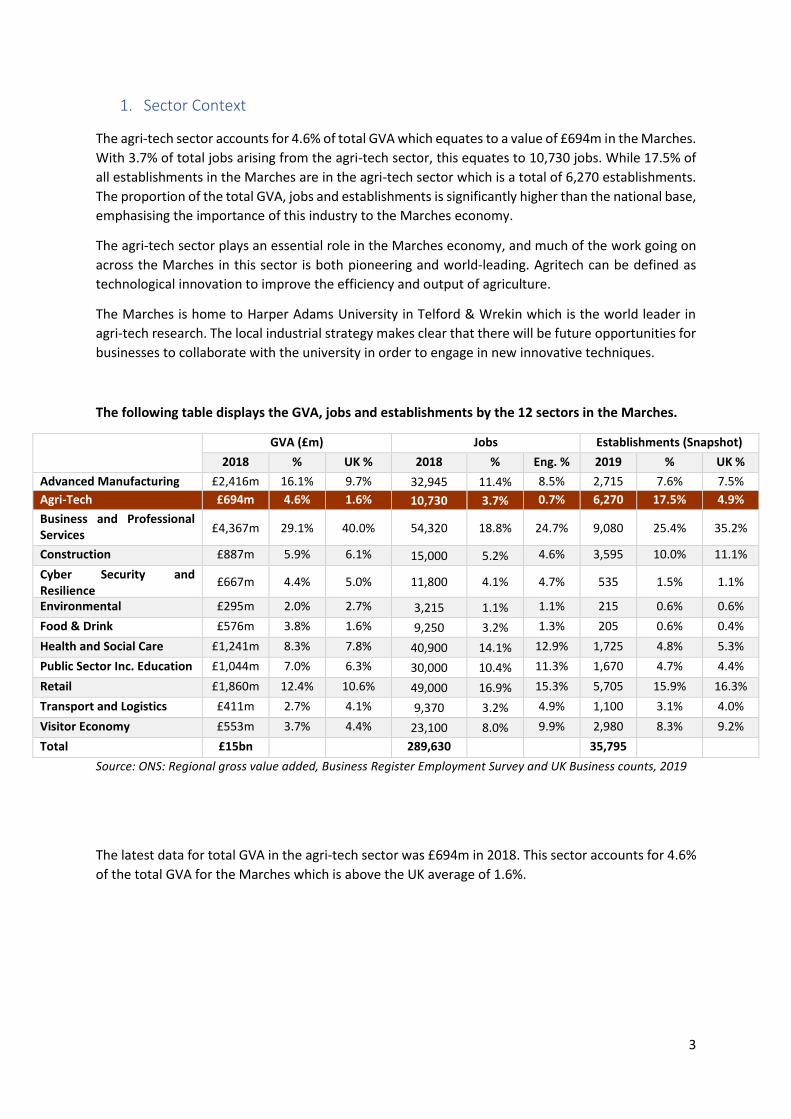
The following table displays the GVA, jobs and establishments by the 12 sectors in the Marches.
GVA (£m) Jobs Establishments (Snapshot)
2018 % UK % 2018 % Eng. % 2019 % UK %
Advanced Manufacturing £2,416m 16.1% 9.7% 32,945 11.4% 8.5% 2,715 7.6% 7.5%
Agri-Tech £694m 4.6% 1.6% 10,730 3.7% 0.7% 6,270 17.5% 4.9%
Business and Professional Services
£4,367m 29.1% 40.0% 54,320 18.8% 24.7% 9,080 25.4% 35.2%
Construction £887m 5.9% 6.1% 15,000 5.2% 4.6% 3,595 10.0% 11.1%
Cyber Security and Resilience
£667m 4.4% 5.0% 11,800 4.1% 4.7% 535 1.5% 1.1%
Environmental Technologies
£295m 2.0% 2.7% 3,215 1.1% 1.1% 215 0.6% 0.6%
Food & Drink £576m 3.8% 1.6% 9,250 3.2% 1.3% 205 0.6% 0.4%
Health and Social Care £1,241m 8.3% 7.8% 40,900 14.1% 12.9% 1,725 4.8% 5.3%
Public Sector Inc. Education £1,044m 7.0% 6.3% 30,000 10.4% 11.3% 1,670 4.7% 4.4%
Retail £1,860m 12.4% 10.6% 49,000 16.9% 15.3% 5,705 15.9% 16.3%
Transport and Logistics £411m 2.7% 4.1% 9,370 3.2% 4.9% 1,100 3.1% 4.0%
Visitor Economy £553m 3.7% 4.4% 23,100 8.0% 9.9% 2,980 8.3% 9.2%
Total £15bn
289,630
35,795
Source: ONS: Regional gross value added, Business Register Employment Survey and UK Business counts, 2019
The latest data for total GVA in the agri-tech sector was £694m in 2018. This sector accounts for 4.6%
of the total GVA for the Marches which is above the UK average of 1.6%.
4
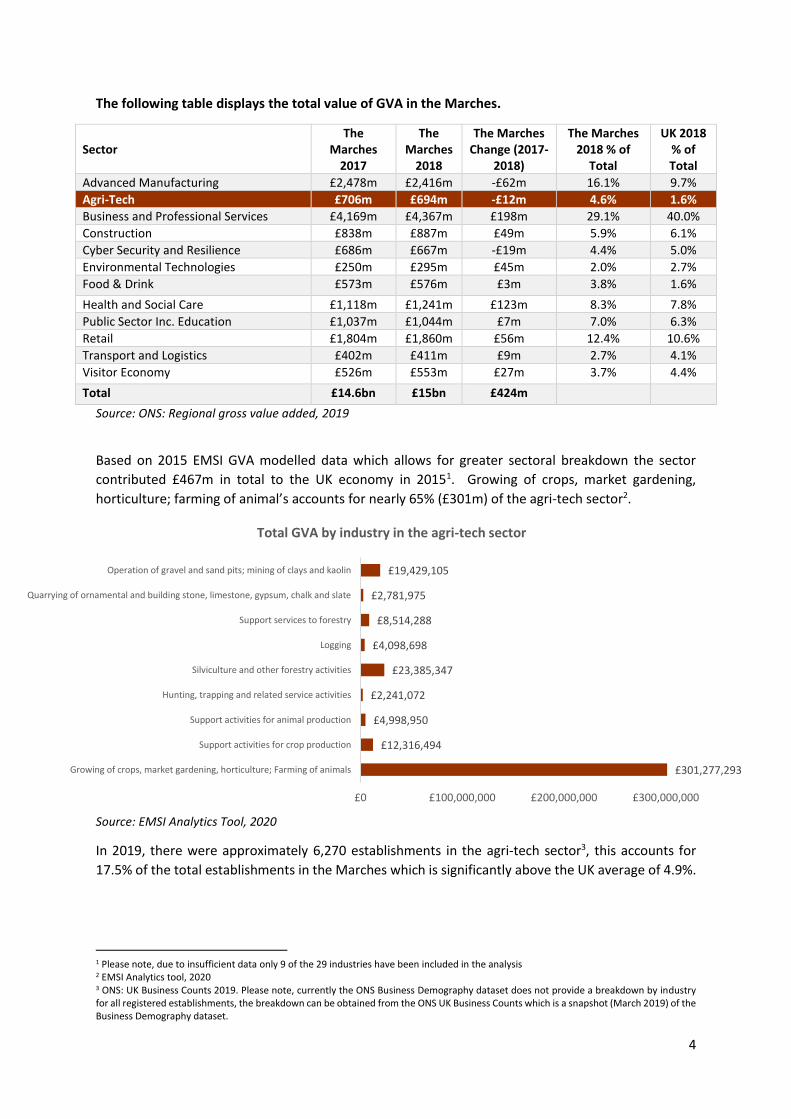
The following table displays the total value of GVA in the Marches.
Sector
The Marches
2017
The Marches
2018
The Marches Change (2017-
2018)
The Marches 2018 % of
Total
UK 2018 % of Total
Advanced Manufacturing £2,478m £2,416m -£62m 16.1% 9.7%
Agri-Tech £706m £694m -£12m 4.6% 1.6%
Business and Professional Services £4,169m £4,367m £198m 29.1% 40.0%
Construction £838m £887m £49m 5.9% 6.1%
Cyber Security and Resilience £686m £667m -£19m 4.4% 5.0%
Environmental Technologies £250m £295m £45m 2.0% 2.7%
Food & Drink £573m £576m £3m 3.8% 1.6%
Health and Social Care £1,118m £1,241m £123m 8.3% 7.8%
Public Sector Inc. Education £1,037m £1,044m £7m 7.0% 6.3%
Retail £1,804m £1,860m £56m 12.4% 10.6%
Transport and Logistics £402m £411m £9m 2.7% 4.1%
Visitor Economy £526m £553m £27m 3.7% 4.4%
Total £14.6bn £15bn £424m
Source: ONS: Regional gross value added, 2019
Based on 2015 EMSI GVA modelled data which allows for greater sectoral breakdown the sector
contributed £467m in total to the UK economy in 20151. Growing of crops, market gardening,
horticulture; farming of animal’s accounts for nearly 65% (£301m) of the agri-tech sector2.
Source: EMSI Analytics Tool, 2020
In 2019, there were approximately 6,270 establishments in the agri-tech sector3, this accounts for
17.5% of the total establishments in the Marches which is significantly above the UK average of 4.9%.
1 Please note, due to insufficient data only 9 of the 29 industries have been included in the analysis 2 EMSI Analytics tool, 2020 3 ONS: UK Business Counts 2019. Please note, currently the ONS Business Demography dataset does not provide a breakdown by industry for all registered establishments, the breakdown can be obtained from the ONS UK Business Counts which is a snapshot (March 2019) of the Business Demography dataset.
£301,277,293
£12,316,494
£4,998,950
£2,241,072
£23,385,347
£4,098,698
£8,514,288
£2,781,975
£19,429,105
£0 £100,000,000 £200,000,000 £300,000,000
Growing of crops, market gardening, horticulture; Farming of animals
Support activities for crop production
Support activities for animal production
Hunting, trapping and related service activities
Silviculture and other forestry activities
Logging
Support services to forestry
Quarrying of ornamental and building stone, limestone, gypsum, chalk and slate
Operation of gravel and sand pits; mining of clays and kaolin
Total GVA by industry in the agri-tech sector
5
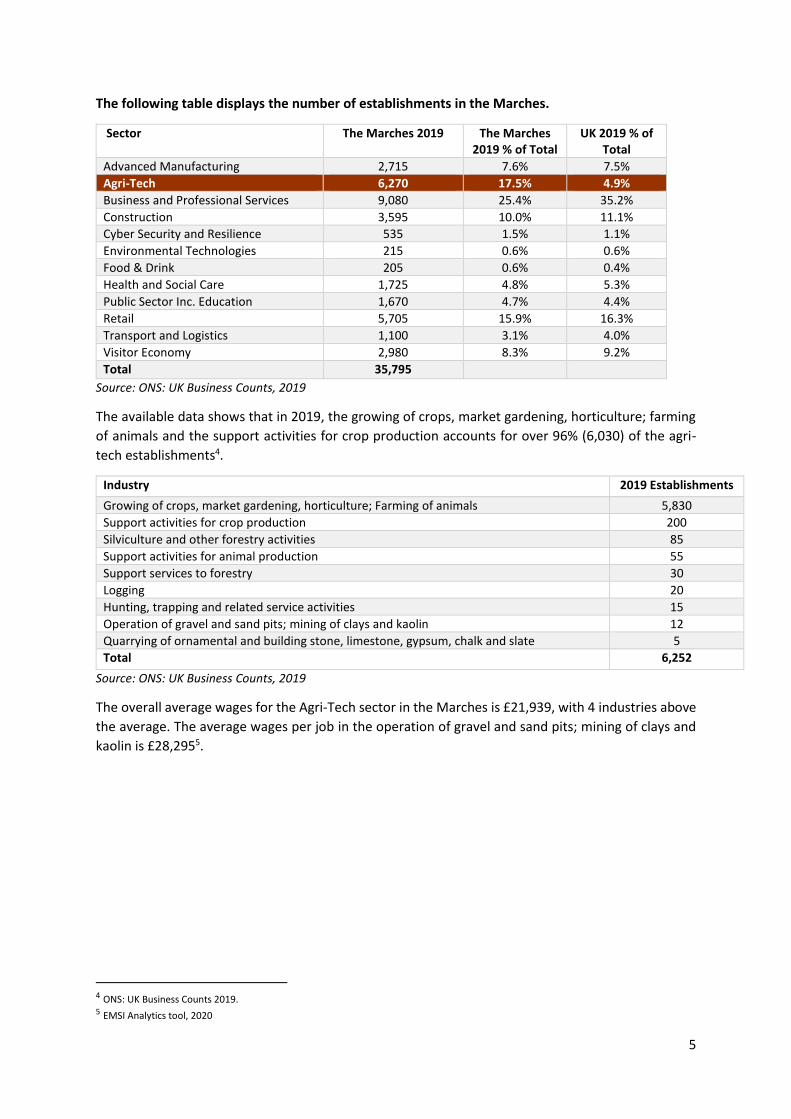
The following table displays the number of establishments in the Marches.
Sector The Marches 2019 The Marches 2019 % of Total
UK 2019 % of Total
Advanced Manufacturing 2,715 7.6% 7.5%
Agri-Tech 6,270 17.5% 4.9%
Business and Professional Services 9,080 25.4% 35.2%
Construction 3,595 10.0% 11.1%
Cyber Security and Resilience 535 1.5% 1.1%
Environmental Technologies 215 0.6% 0.6%
Food & Drink 205 0.6% 0.4%
Health and Social Care 1,725 4.8% 5.3%
Public Sector Inc. Education 1,670 4.7% 4.4%
Retail 5,705 15.9% 16.3%
Transport and Logistics 1,100 3.1% 4.0%
Visitor Economy 2,980 8.3% 9.2%
Total 35,795 Source: ONS: UK Business Counts, 2019
The available data shows that in 2019, the growing of crops, market gardening, horticulture; farming
of animals and the support activities for crop production accounts for over 96% (6,030) of the agri-
tech establishments4.
Industry 2019 Establishments
Growing of crops, market gardening, horticulture; Farming of animals 5,830
Support activities for crop production 200
Silviculture and other forestry activities 85
Support activities for animal production 55
Support services to forestry 30
Logging 20
Hunting, trapping and related service activities 15
Operation of gravel and sand pits; mining of clays and kaolin 12
Quarrying of ornamental and building stone, limestone, gypsum, chalk and slate 5
Total 6,252
Source: ONS: UK Business Counts, 2019
The overall average wages for the Agri-Tech sector in the Marches is £21,939, with 4 industries above
the average. The average wages per job in the operation of gravel and sand pits; mining of clays and
kaolin is £28,2955.
4 ONS: UK Business Counts 2019. 5 EMSI Analytics tool, 2020
6
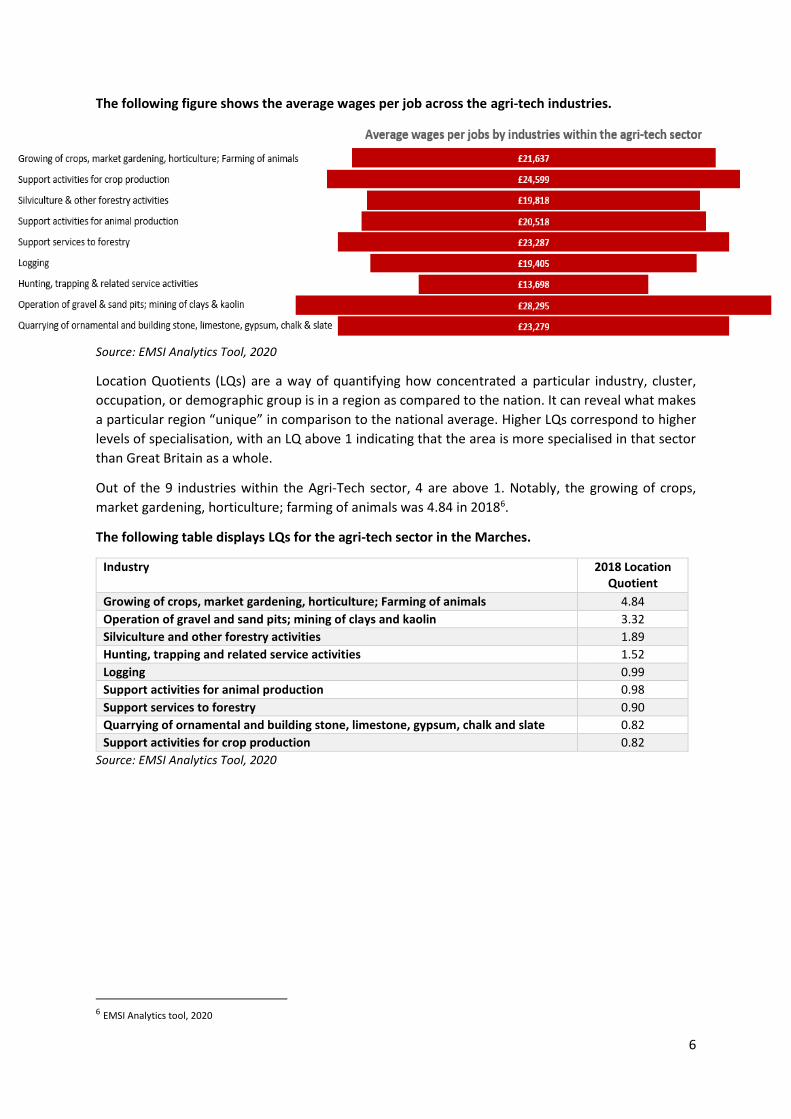
The following figure shows the average wages per job across the agri-tech industries.
Source: EMSI Analytics Tool, 2020
Location Quotients (LQs) are a way of quantifying how concentrated a particular industry, cluster,
occupation, or demographic group is in a region as compared to the nation. It can reveal what makes
a particular region “unique” in comparison to the national average. Higher LQs correspond to higher
levels of specialisation, with an LQ above 1 indicating that the area is more specialised in that sector
than Great Britain as a whole.
Out of the 9 industries within the Agri-Tech sector, 4 are above 1. Notably, the growing of crops,
market gardening, horticulture; farming of animals was 4.84 in 20186.
The following table displays LQs for the agri-tech sector in the Marches.
Industry 2018 Location Quotient
Growing of crops, market gardening, horticulture; Farming of animals 4.84
Operation of gravel and sand pits; mining of clays and kaolin 3.32
Silviculture and other forestry activities 1.89
Hunting, trapping and related service activities 1.52
Logging 0.99
Support activities for animal production 0.98
Support services to forestry 0.90
Quarrying of ornamental and building stone, limestone, gypsum, chalk and slate 0.82
Support activities for crop production 0.82
Source: EMSI Analytics Tool, 2020
6 EMSI Analytics tool, 2020
7
2. Supply Side Analysis
2.1 Current Workforce Size7
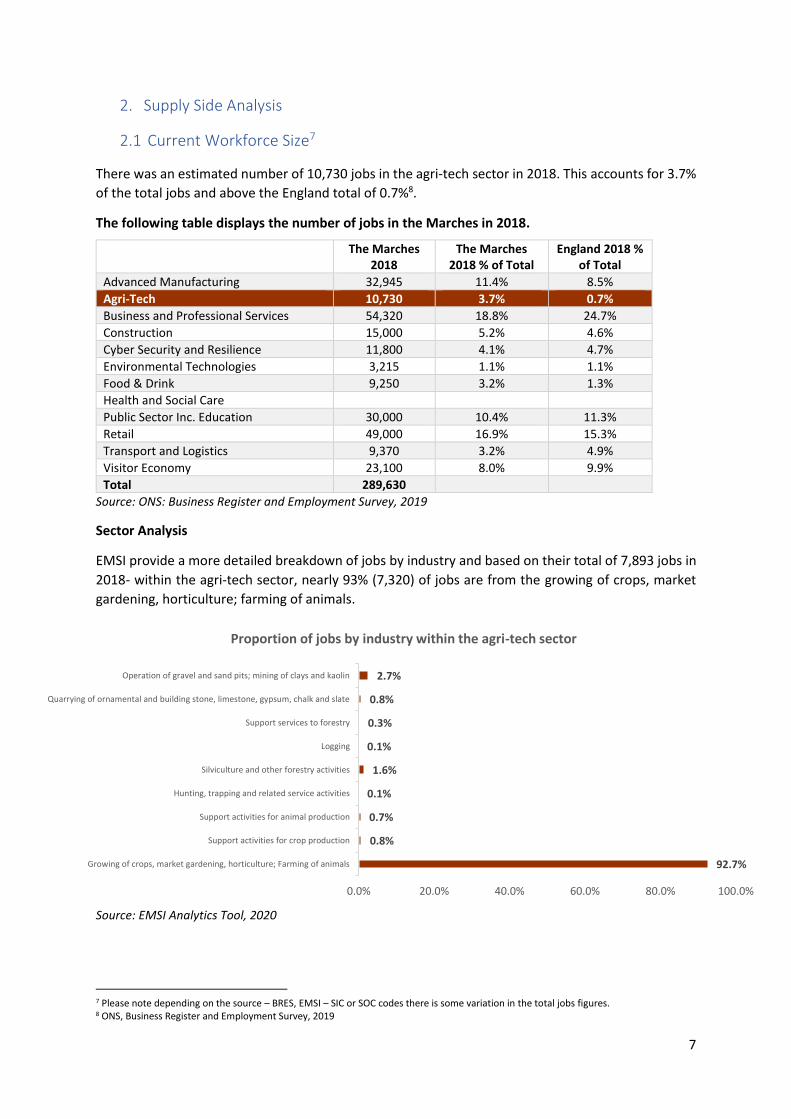
There was an estimated number of 10,730 jobs in the agri-tech sector in 2018. This accounts for 3.7%
of the total jobs and above the England total of 0.7%8.
The following table displays the number of jobs in the Marches in 2018.
Source: ONS: Business Register and Employment Survey, 2019
Sector Analysis
EMSI provide a more detailed breakdown of jobs by industry and based on their total of 7,893 jobs in
2018- within the agri-tech sector, nearly 93% (7,320) of jobs are from the growing of crops, market
gardening, horticulture; farming of animals.
Source: EMSI Analytics Tool, 2020
7 Please note depending on the source – BRES, EMSI – SIC or SOC codes there is some variation in the total jobs figures. 8 ONS, Business Register and Employment Survey, 2019
The Marches 2018
The Marches 2018 % of Total
England 2018 % of Total
Advanced Manufacturing 32,945 11.4% 8.5% Agri-Tech 10,730 3.7% 0.7% Business and Professional Services 54,320 18.8% 24.7%
Construction 15,000 5.2% 4.6%
Cyber Security and Resilience 11,800 4.1% 4.7%
Environmental Technologies 3,215 1.1% 1.1%
Food & Drink 9,250 3.2% 1.3%
Health and Social Care 40,900 14.1% 12.9%
Public Sector Inc. Education 30,000 10.4% 11.3%
Retail 49,000 16.9% 15.3%
Transport and Logistics 9,370 3.2% 4.9%
Visitor Economy 23,100 8.0% 9.9%
Total 289,630
92.7%
0.8%
0.7%
0.1%
1.6%
0.1%
0.3%
0.8%
2.7%
Growing of crops, market gardening, horticulture; Farming of animals
Support activities for crop production
Support activities for animal production
Hunting, trapping and related service activities
Silviculture and other forestry activities
Logging
Support services to forestry
Quarrying of ornamental and building stone, limestone, gypsum, chalk and slate
Operation of gravel and sand pits; mining of clays and kaolin
0.0% 20.0% 40.0% 60.0% 80.0% 100.0%
Proportion of jobs by industry within the agri-tech sector
8
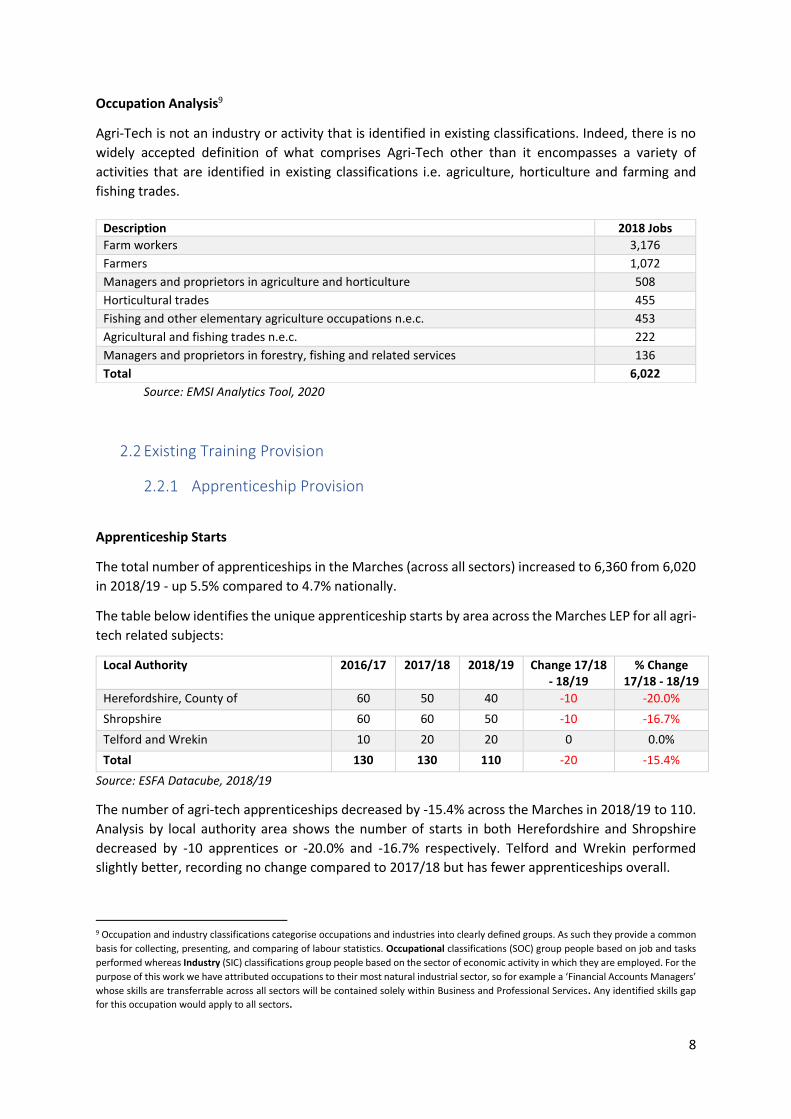
Occupation Analysis9
Agri-Tech is not an industry or activity that is identified in existing classifications. Indeed, there is no
widely accepted definition of what comprises Agri-Tech other than it encompasses a variety of
activities that are identified in existing classifications i.e. agriculture, horticulture and farming and
fishing trades.
Source: EMSI Analytics Tool, 2020
2.2 Existing Training Provision
2.2.1 Apprenticeship Provision
Apprenticeship Starts
The total number of apprenticeships in the Marches (across all sectors) increased to 6,360 from 6,020
in 2018/19 - up 5.5% compared to 4.7% nationally.
The table below identifies the unique apprenticeship starts by area across the Marches LEP for all agri-
tech related subjects:
Local Authority 2016/17 2017/18 2018/19 Change 17/18 - 18/19
% Change 17/18 - 18/19
Herefordshire, County of 60 50 40 -10 -20.0%
Shropshire 60 60 50 -10 -16.7%
Telford and Wrekin 10 20 20 0 0.0%
Total 130 130 110 -20 -15.4%
Source: ESFA Datacube, 2018/19
The number of agri-tech apprenticeships decreased by -15.4% across the Marches in 2018/19 to 110.
Analysis by local authority area shows the number of starts in both Herefordshire and Shropshire
decreased by -10 apprentices or -20.0% and -16.7% respectively. Telford and Wrekin performed
slightly better, recording no change compared to 2017/18 but has fewer apprenticeships overall.
9 Occupation and industry classifications categorise occupations and industries into clearly defined groups. As such they provide a common
basis for collecting, presenting, and comparing of labour statistics. Occupational classifications (SOC) group people based on job and tasks
performed whereas Industry (SIC) classifications group people based on the sector of economic activity in which they are employed. For the
purpose of this work we have attributed occupations to their most natural industrial sector, so for example a ‘Financial Accounts Managers’
whose skills are transferrable across all sectors will be contained solely within Business and Professional Services. Any identified skills gap
for this occupation would apply to all sectors.
Description 2018 Jobs
Farm workers 3,176
Farmers 1,072
Managers and proprietors in agriculture and horticulture 508
Horticultural trades 455
Fishing and other elementary agriculture occupations n.e.c. 453
Agricultural and fishing trades n.e.c. 222
Managers and proprietors in forestry, fishing and related services 136
Total 6,022
9
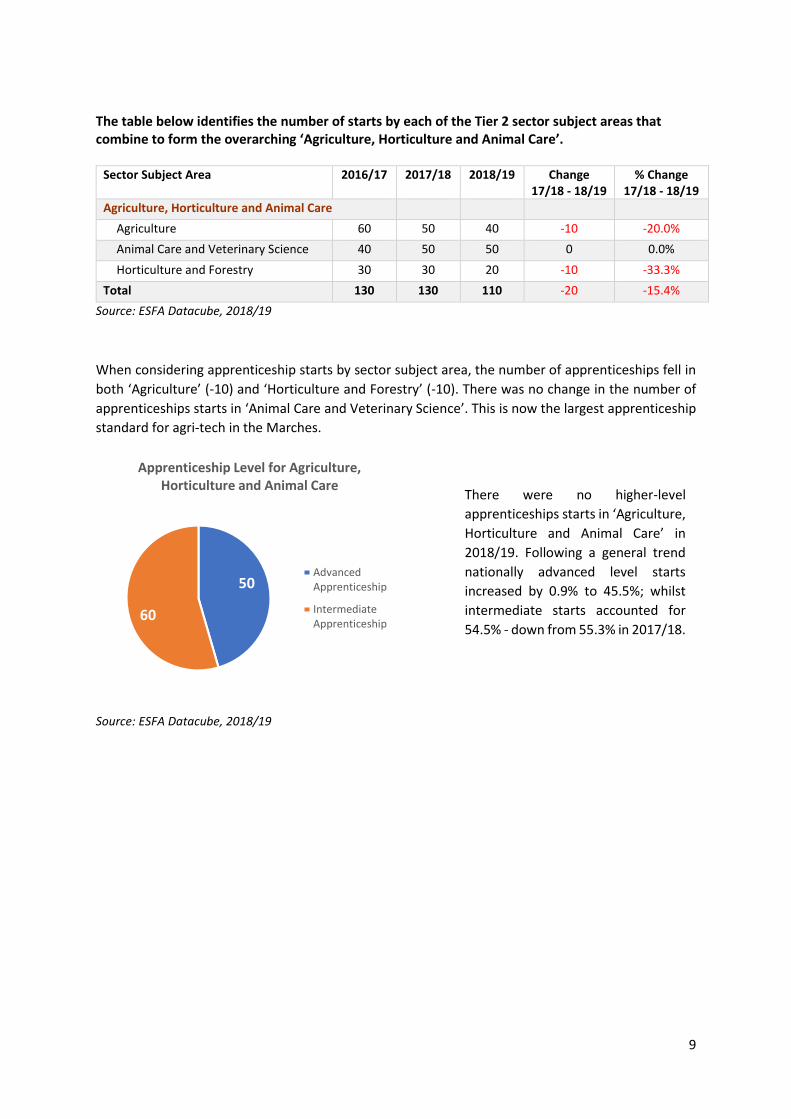
The table below identifies the number of starts by each of the Tier 2 sector subject areas that combine to form the overarching ‘Agriculture, Horticulture and Animal Care’.
Sector Subject Area 2016/17 2017/18 2018/19 Change
17/18 - 18/19 % Change
17/18 - 18/19
Agriculture, Horticulture and Animal Care
Agriculture 60 50 40 -10 -20.0%
Animal Care and Veterinary Science 40 50 50 0 0.0%
Horticulture and Forestry 30 30 20 -10 -33.3%
Total 130 130 110 -20 -15.4%
Source: ESFA Datacube, 2018/19
When considering apprenticeship starts by sector subject area, the number of apprenticeships fell in
both ‘Agriculture’ (-10) and ‘Horticulture and Forestry’ (-10). There was no change in the number of
apprenticeships starts in ‘Animal Care and Veterinary Science’. This is now the largest apprenticeship
standard for agri-tech in the Marches.
Source: ESFA Datacube, 2018/19
50
60
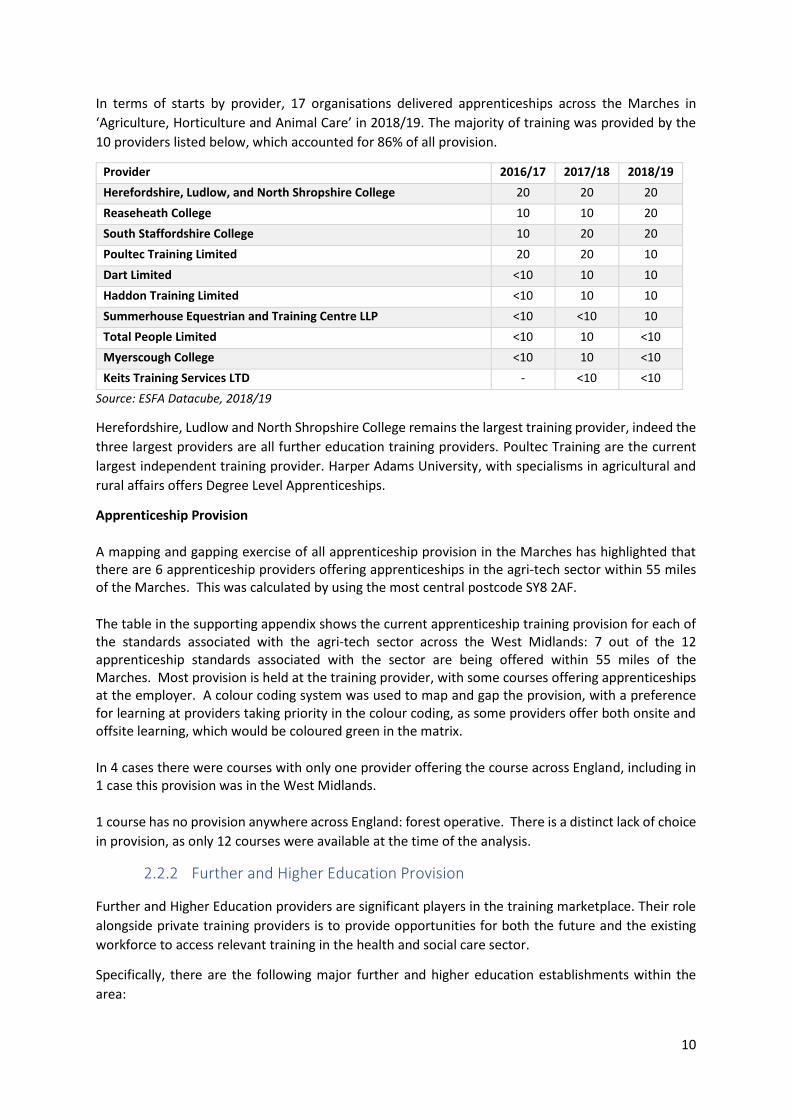
Apprenticeship Level for Agriculture, Horticulture and Animal Care
AdvancedApprenticeship
IntermediateApprenticeship
There were no higher-level
apprenticeships starts in ‘Agriculture,
Horticulture and Animal Care’ in
2018/19. Following a general trend
nationally advanced level starts
increased by 0.9% to 45.5%; whilst
intermediate starts accounted for
54.5% - down from 55.3% in 2017/18.
10
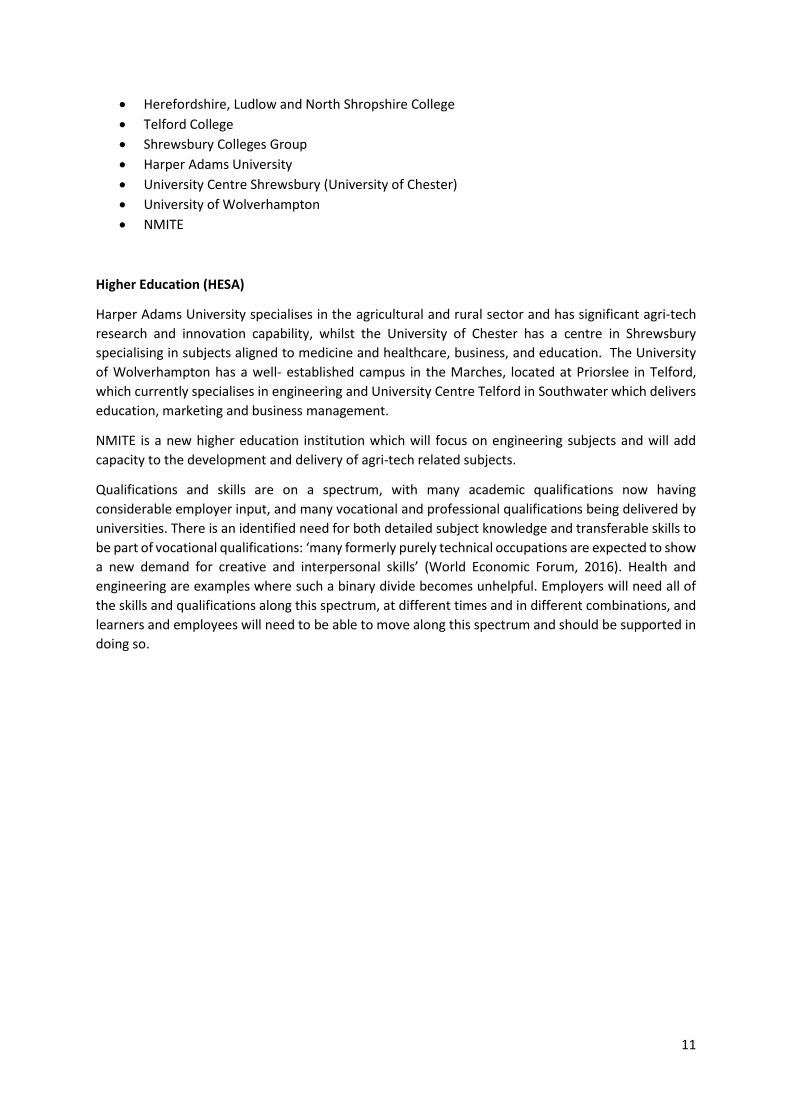
In terms of starts by provider, 17 organisations delivered apprenticeships across the Marches in
‘Agriculture, Horticulture and Animal Care’ in 2018/19. The majority of training was provided by the
10 providers listed below, which accounted for 86% of all provision.
Provider 2016/17 2017/18 2018/19
Herefordshire, Ludlow, and North Shropshire College 20 20 20
Reaseheath College 10 10 20
South Staffordshire College 10 20 20
Poultec Training Limited 20 20 10
Dart Limited <10 10 10
Haddon Training Limited <10 10 10
Summerhouse Equestrian and Training Centre LLP <10 <10 10
Total People Limited <10 10 <10
Myerscough College <10 10 <10
Keits Training Services LTD - <10 <10
Source: ESFA Datacube, 2018/19
Herefordshire, Ludlow and North Shropshire College remains the largest training provider, indeed the
three largest providers are all further education training providers. Poultec Training are the current
largest independent training provider. Harper Adams University, with specialisms in agricultural and
rural affairs offers Degree Level Apprenticeships.
Apprenticeship Provision
A mapping and gapping exercise of all apprenticeship provision in the Marches has highlighted that there are 6 apprenticeship providers offering apprenticeships in the agri-tech sector within 55 miles of the Marches. This was calculated by using the most central postcode SY8 2AF.
The table in the supporting appendix shows the current apprenticeship training provision for each of the standards associated with the agri-tech sector across the West Midlands: 7 out of the 12 apprenticeship standards associated with the sector are being offered within 55 miles of the Marches. Most provision is held at the training provider, with some courses offering apprenticeships at the employer. A colour coding system was used to map and gap the provision, with a preference for learning at providers taking priority in the colour coding, as some providers offer both onsite and offsite learning, which would be coloured green in the matrix.
In 4 cases there were courses with only one provider offering the course across England, including in 1 case this provision was in the West Midlands.
1 course has no provision anywhere across England: forest operative. There is a distinct lack of choice
in provision, as only 12 courses were available at the time of the analysis.
2.2.2 Further and Higher Education Provision
Further and Higher Education providers are significant players in the training marketplace. Their role
alongside private training providers is to provide opportunities for both the future and the existing
workforce to access relevant training in the health and social care sector.
Specifically, there are the following major further and higher education establishments within the
area:
11
• Herefordshire, Ludlow and North Shropshire College
• Telford College
• Shrewsbury Colleges Group
• Harper Adams University
• University Centre Shrewsbury (University of Chester)
• University of Wolverhampton
• NMITE
Higher Education (HESA)
Harper Adams University specialises in the agricultural and rural sector and has significant agri-tech
research and innovation capability, whilst the University of Chester has a centre in Shrewsbury
specialising in subjects aligned to medicine and healthcare, business, and education. The University
of Wolverhampton has a well- established campus in the Marches, located at Priorslee in Telford,
which currently specialises in engineering and University Centre Telford in Southwater which delivers
education, marketing and business management.
NMITE is a new higher education institution which will focus on engineering subjects and will add
capacity to the development and delivery of agri-tech related subjects.
Qualifications and skills are on a spectrum, with many academic qualifications now having
considerable employer input, and many vocational and professional qualifications being delivered by
universities. There is an identified need for both detailed subject knowledge and transferable skills to
be part of vocational qualifications: ‘many formerly purely technical occupations are expected to show
a new demand for creative and interpersonal skills’ (World Economic Forum, 2016). Health and
engineering are examples where such a binary divide becomes unhelpful. Employers will need all of
the skills and qualifications along this spectrum, at different times and in different combinations, and
learners and employees will need to be able to move along this spectrum and should be supported in
doing so.
12
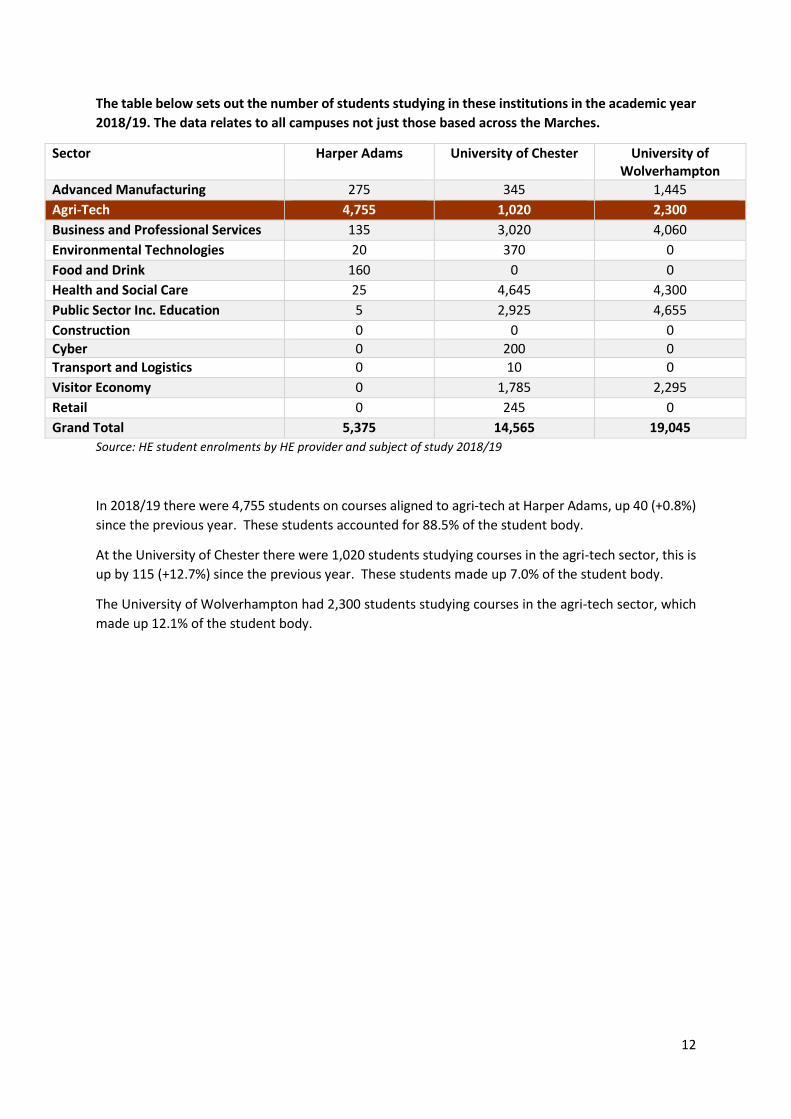
The table below sets out the number of students studying in these institutions in the academic year
2018/19. The data relates to all campuses not just those based across the Marches.
Sector Harper Adams University of Chester University of Wolverhampton
Advanced Manufacturing 275 345 1,445
Agri-Tech 4,755 1,020 2,300
Business and Professional Services 135 3,020 4,060
Environmental Technologies 20 370 0
Food and Drink 160 0 0
Health and Social Care 25 4,645 4,300
Public Sector Inc. Education 5 2,925 4,655
Construction 0 0 0
Cyber 0 200 0
Transport and Logistics 0 10 0
Visitor Economy 0 1,785 2,295
Retail 0 245 0
Grand Total 5,375 14,565 19,045
Source: HE student enrolments by HE provider and subject of study 2018/19
In 2018/19 there were 4,755 students on courses aligned to agri-tech at Harper Adams, up 40 (+0.8%)
since the previous year. These students accounted for 88.5% of the student body.
At the University of Chester there were 1,020 students studying courses in the agri-tech sector, this is
up by 115 (+12.7%) since the previous year. These students made up 7.0% of the student body.
The University of Wolverhampton had 2,300 students studying courses in the agri-tech sector, which
made up 12.1% of the student body.
13
3 Demand Side Analysis
Farming and food production is a global industry that is strategically and economically important. In
the UK, farming is the bedrock of the agri-food sector which is worth £122bn to the UK economy and
employs more than 4 million people, according to Defra.
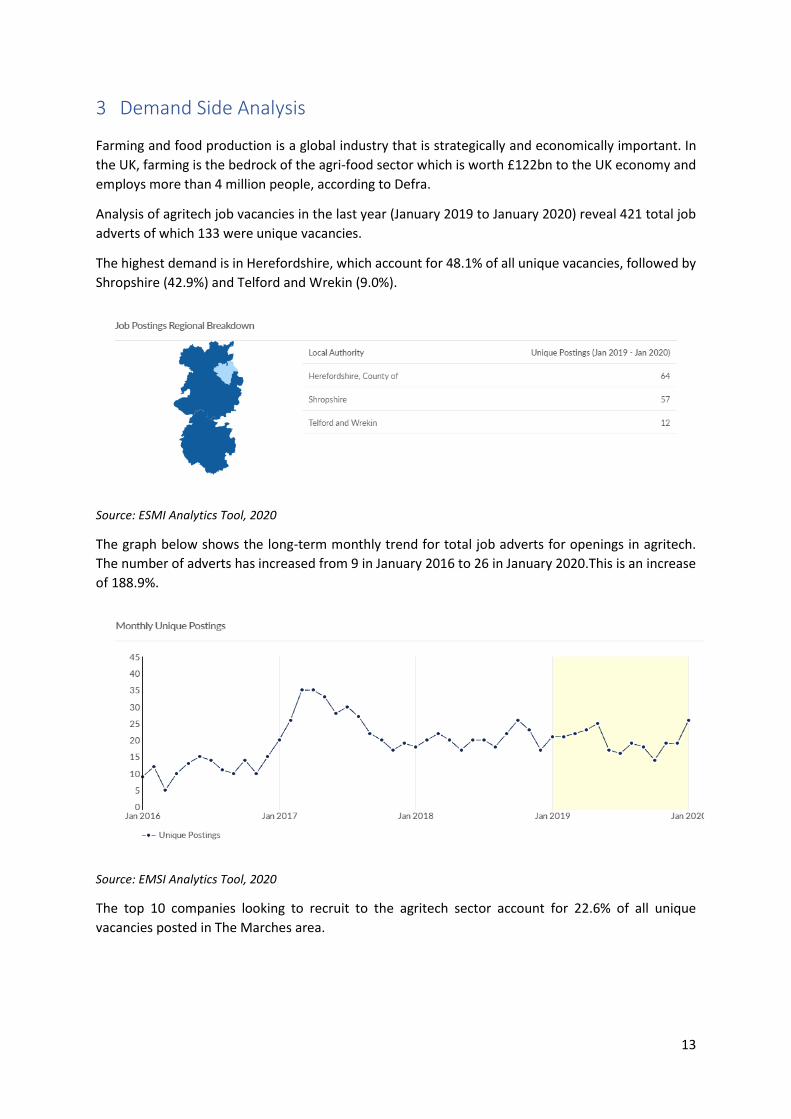
Analysis of agritech job vacancies in the last year (January 2019 to January 2020) reveal 421 total job
adverts of which 133 were unique vacancies.
The highest demand is in Herefordshire, which account for 48.1% of all unique vacancies, followed by
Shropshire (42.9%) and Telford and Wrekin (9.0%).
Source: ESMI Analytics Tool, 2020
The graph below shows the long-term monthly trend for total job adverts for openings in agritech.
The number of adverts has increased from 9 in January 2016 to 26 in January 2020.This is an increase
of 188.9%.
Source: EMSI Analytics Tool, 2020
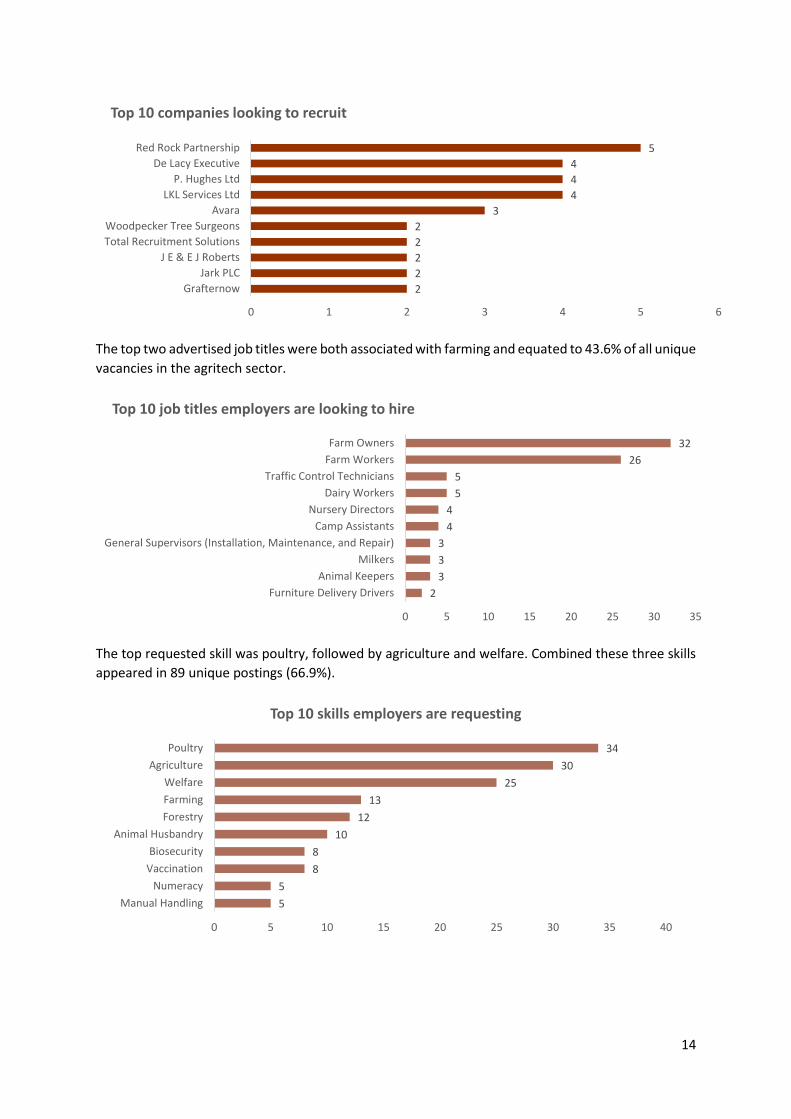
The top 10 companies looking to recruit to the agritech sector account for 22.6% of all unique
vacancies posted in The Marches area.
14
The top two advertised job titles were both associated with farming and equated to 43.6% of all unique
vacancies in the agritech sector.
The top requested skill was poultry, followed by agriculture and welfare. Combined these three skills
appeared in 89 unique postings (66.9%).
2
2
2
2
2
3
4
4
4
5
0 1 2 3 4 5 6
Grafternow
Jark PLC
J E & E J Roberts
Total Recruitment Solutions
Woodpecker Tree Surgeons
Avara
LKL Services Ltd
P. Hughes Ltd
De Lacy Executive
Red Rock Partnership
Top 10 companies looking to recruit
2
3
3
3
4
4
5
5
26
32
0 5 10 15 20 25 30 35
Furniture Delivery Drivers
Animal Keepers
Milkers
General Supervisors (Installation, Maintenance, and Repair)
Camp Assistants
Nursery Directors
Dairy Workers
Traffic Control Technicians
Farm Workers
Farm Owners
Top 10 job titles employers are looking to hire
5
5
8
8
10
12
13
25
30
34
0 5 10 15 20 25 30 35 40
Manual Handling
Numeracy
Vaccination
Biosecurity
Animal Husbandry
Forestry
Farming
Welfare
Agriculture
Poultry
Top 10 skills employers are requesting
15
3.1 Occupational Forecasts
In this section of the report we use UKSOC 4-digit 2010 classifications to understand at a granular level
the types of occupations and activities required for roles within the agri-tech sector.
Source: EMSI Analytics Tool, 2020
In total there are seven occupations associated with the agri-tech sector. The most jobs in the Marches
are contained within ‘Farm workers’, and ‘Farmers’. These two occupations account for 70% of all jobs
in the sector.
Of the seven occupations listed above, five are expected to contract and two are predicted to undergo
nominal change (+/- in absolute numbers).
Of the five occupations forecast to shrink, four employ fewer than 500 people. ‘Farm workers’ the
largest occupational group is expected to contract the most in absolute numbers, -28 jobs or -1%. In
percentage terms, jobs in ‘Agricultural and fishing trades n.e.c.’ are predicted to shrink by the largest
margin (-7%).
Description 2018 Jobs
2022 Jobs
2018 - 2022 % Change
2018 - 2022
Openings
Education Level Automation Index
Farm workers 3,176 3,148 -1% 467 Level 2 NVQ; GCSE at grades A*-C
64.8%
Farmers 1,072 1,076 0% 256 Level 2 NVQ; GCSE at grades A*-C
36.0%
Managers and proprietors in agriculture and horticulture
508 510 0% 110 Level 3 NVQ; A Levels
37.1%
Horticultural trades 455 441 -3% 104 Level 2 NVQ; GCSE at grades A*-C
37.3%
Fishing and other elementary agriculture occupations n.e.c.
453 430 -5% 64 Level 2 NVQ; GCSE at grades A*-C
68.8%
Agricultural and fishing trades n.e.c. 222 206 -7% 50 Level 2 NVQ; GCSE at grades A*-C
55.5%
Managers and proprietors in forestry, fishing and related services
136 132 -3% 27 Level 3 NVQ; A Levels
37.7%
Total 6,021 5,944 -1% 1,077
16
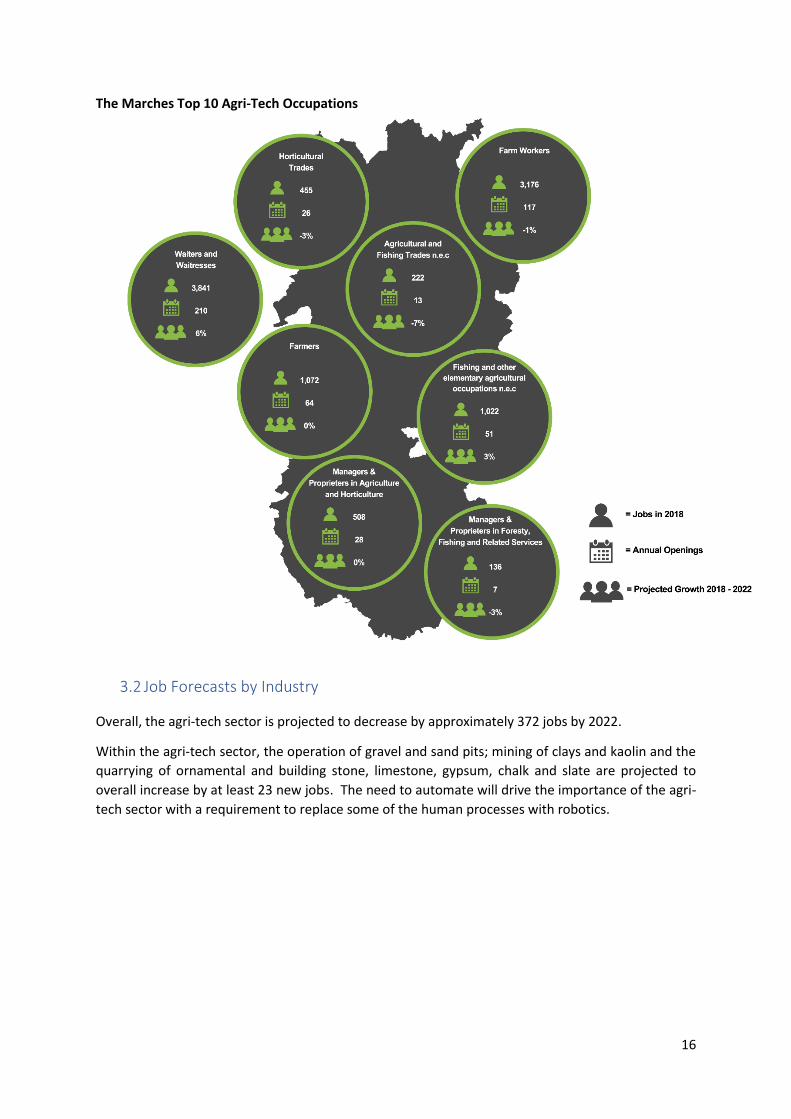
The Marches Top 10 Agri-Tech Occupations
3.2 Job Forecasts by Industry
Overall, the agri-tech sector is projected to decrease by approximately 372 jobs by 2022.
Within the agri-tech sector, the operation of gravel and sand pits; mining of clays and kaolin and the
quarrying of ornamental and building stone, limestone, gypsum, chalk and slate are projected to
overall increase by at least 23 new jobs. The need to automate will drive the importance of the agri-
tech sector with a requirement to replace some of the human processes with robotics.
17
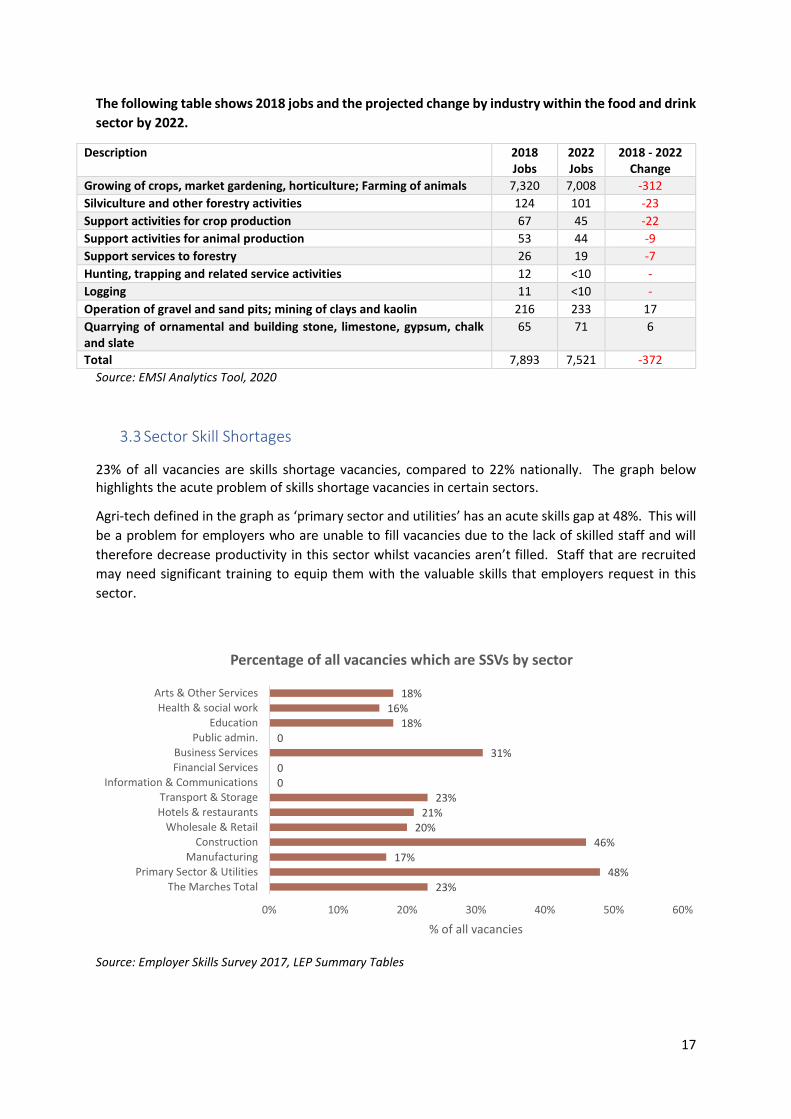
The following table shows 2018 jobs and the projected change by industry within the food and drink
sector by 2022.
Description 2018 Jobs
2022 Jobs
2018 - 2022 Change
Growing of crops, market gardening, horticulture; Farming of animals 7,320 7,008 -312
Silviculture and other forestry activities 124 101 -23
Support activities for crop production 67 45 -22
Support activities for animal production 53 44 -9
Support services to forestry 26 19 -7
Hunting, trapping and related service activities 12 <10 -
Logging 11 <10 -
Operation of gravel and sand pits; mining of clays and kaolin 216 233 17
Quarrying of ornamental and building stone, limestone, gypsum, chalk and slate
65 71 6
Total 7,893 7,521 -372
Source: EMSI Analytics Tool, 2020
3.3 Sector Skill Shortages
23% of all vacancies are skills shortage vacancies, compared to 22% nationally. The graph below highlights the acute problem of skills shortage vacancies in certain sectors.
Agri-tech defined in the graph as ‘primary sector and utilities’ has an acute skills gap at 48%. This will
be a problem for employers who are unable to fill vacancies due to the lack of skilled staff and will
therefore decrease productivity in this sector whilst vacancies aren’t filled. Staff that are recruited
may need significant training to equip them with the valuable skills that employers request in this
sector.
Source: Employer Skills Survey 2017, LEP Summary Tables
23%48%
17%46%
20%21%
23%00
31%0
18%16%
18%
0% 10% 20% 30% 40% 50% 60%
The Marches TotalPrimary Sector & Utilities
ManufacturingConstruction
Wholesale & RetailHotels & restaurantsTransport & Storage
Information & CommunicationsFinancial ServicesBusiness Services
Public admin.Education
Health & social workArts & Other Services
% of all vacancies
Percentage of all vacancies which are SSVs by sector
18
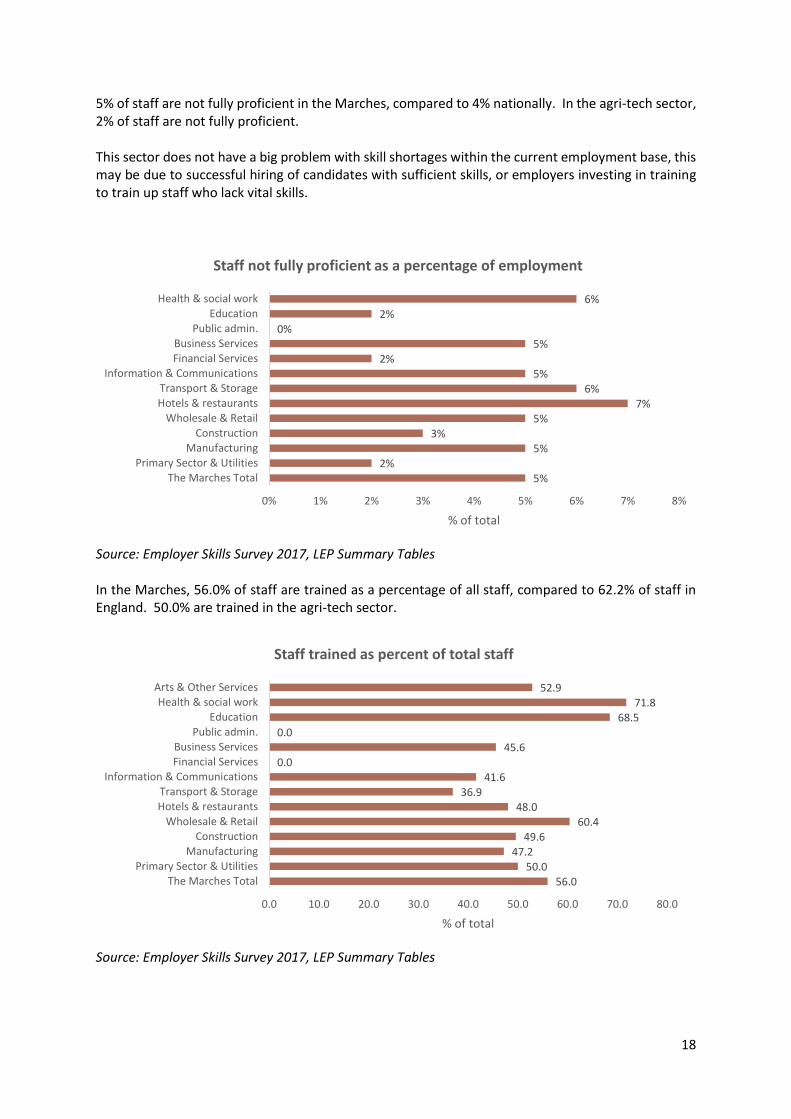
5% of staff are not fully proficient in the Marches, compared to 4% nationally. In the agri-tech sector, 2% of staff are not fully proficient. This sector does not have a big problem with skill shortages within the current employment base, this may be due to successful hiring of candidates with sufficient skills, or employers investing in training to train up staff who lack vital skills.
Source: Employer Skills Survey 2017, LEP Summary Tables
In the Marches, 56.0% of staff are trained as a percentage of all staff, compared to 62.2% of staff in England. 50.0% are trained in the agri-tech sector.
Source: Employer Skills Survey 2017, LEP Summary Tables
56.050.0
47.249.6
60.448.0
36.941.6
0.045.6
0.068.5
71.852.9
0.0 10.0 20.0 30.0 40.0 50.0 60.0 70.0 80.0
The Marches TotalPrimary Sector & Utilities
ManufacturingConstruction
Wholesale & RetailHotels & restaurantsTransport & Storage
Information & CommunicationsFinancial ServicesBusiness Services
Public admin.Education
Health & social workArts & Other Services
% of total
Staff trained as percent of total staff
5%2%
5%3%
5%7%
6%5%
2%5%
0%2%
6%
0% 1% 2% 3% 4% 5% 6% 7% 8%
The Marches TotalPrimary Sector & Utilities
ManufacturingConstruction
Wholesale & RetailHotels & restaurantsTransport & Storage
Information & CommunicationsFinancial ServicesBusiness Services
Public admin.Education
Health & social work
% of total
Staff not fully proficient as a percentage of employment
19
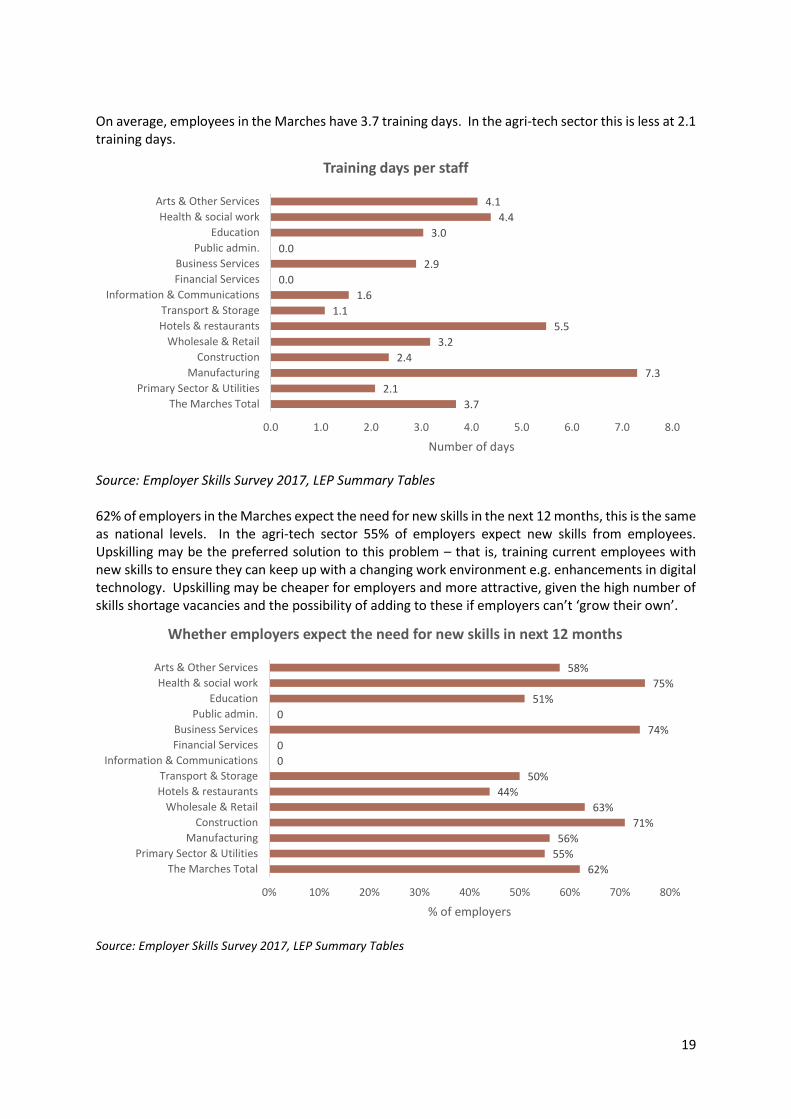
On average, employees in the Marches have 3.7 training days. In the agri-tech sector this is less at 2.1 training days.
Source: Employer Skills Survey 2017, LEP Summary Tables 62% of employers in the Marches expect the need for new skills in the next 12 months, this is the same as national levels. In the agri-tech sector 55% of employers expect new skills from employees. Upskilling may be the preferred solution to this problem – that is, training current employees with new skills to ensure they can keep up with a changing work environment e.g. enhancements in digital technology. Upskilling may be cheaper for employers and more attractive, given the high number of skills shortage vacancies and the possibility of adding to these if employers can’t ‘grow their own’.
Source: Employer Skills Survey 2017, LEP Summary Tables
3.7
2.1
7.3
2.4
3.2
5.5
1.1
1.6
0.0
2.9
0.0
3.0
4.4
4.1
0.0 1.0 2.0 3.0 4.0 5.0 6.0 7.0 8.0
The Marches Total
Primary Sector & Utilities
Manufacturing
Construction
Wholesale & Retail
Hotels & restaurants
Transport & Storage
Information & Communications
Financial Services
Business Services
Public admin.
Education
Health & social work
Arts & Other Services
Number of days
Training days per staff
62%
55%
56%
71%
63%
44%
50%
0
0
74%
0
51%
75%
58%
0% 10% 20% 30% 40% 50% 60% 70% 80%
The Marches Total
Primary Sector & Utilities
Manufacturing
Construction
Wholesale & Retail
Hotels & restaurants
Transport & Storage
Information & Communications
Financial Services
Business Services
Public admin.
Education
Health & social work
Arts & Other Services
% of employers
Whether employers expect the need for new skills in next 12 months
20
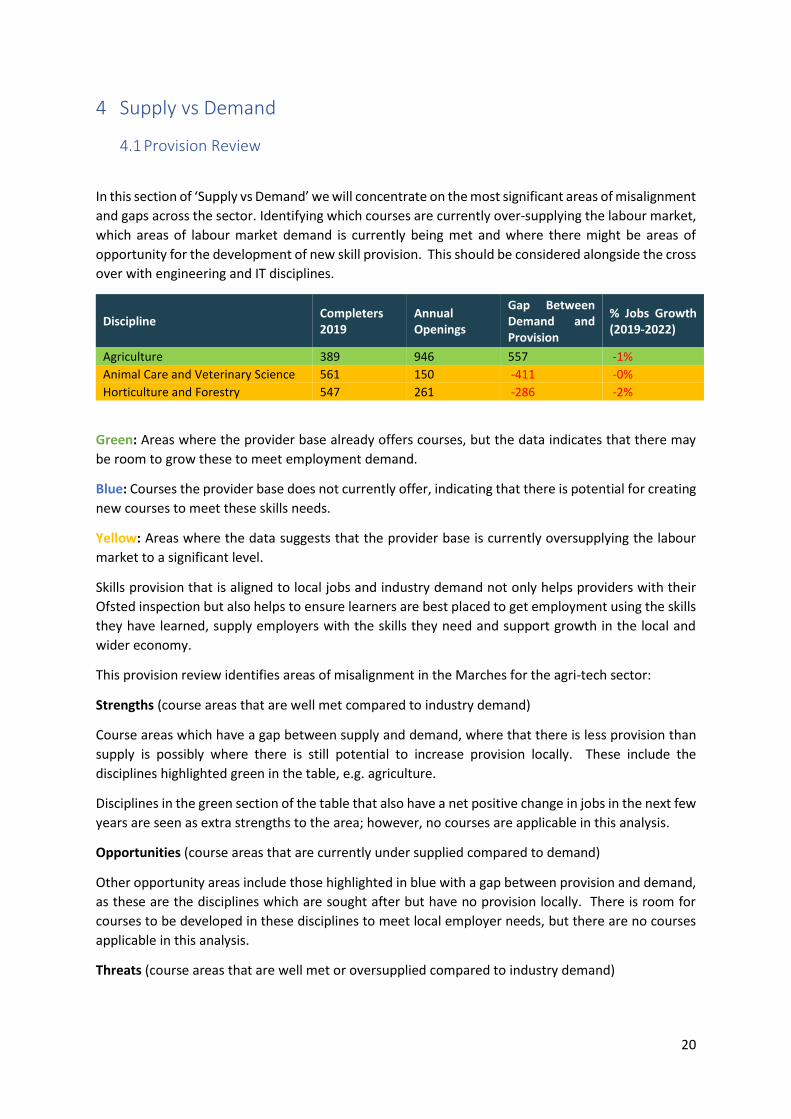
4 Supply vs Demand
4.1 Provision Review
In this section of ‘Supply vs Demand’ we will concentrate on the most significant areas of misalignment
and gaps across the sector. Identifying which courses are currently over-supplying the labour market,
which areas of labour market demand is currently being met and where there might be areas of
opportunity for the development of new skill provision. This should be considered alongside the cross
over with engineering and IT disciplines.
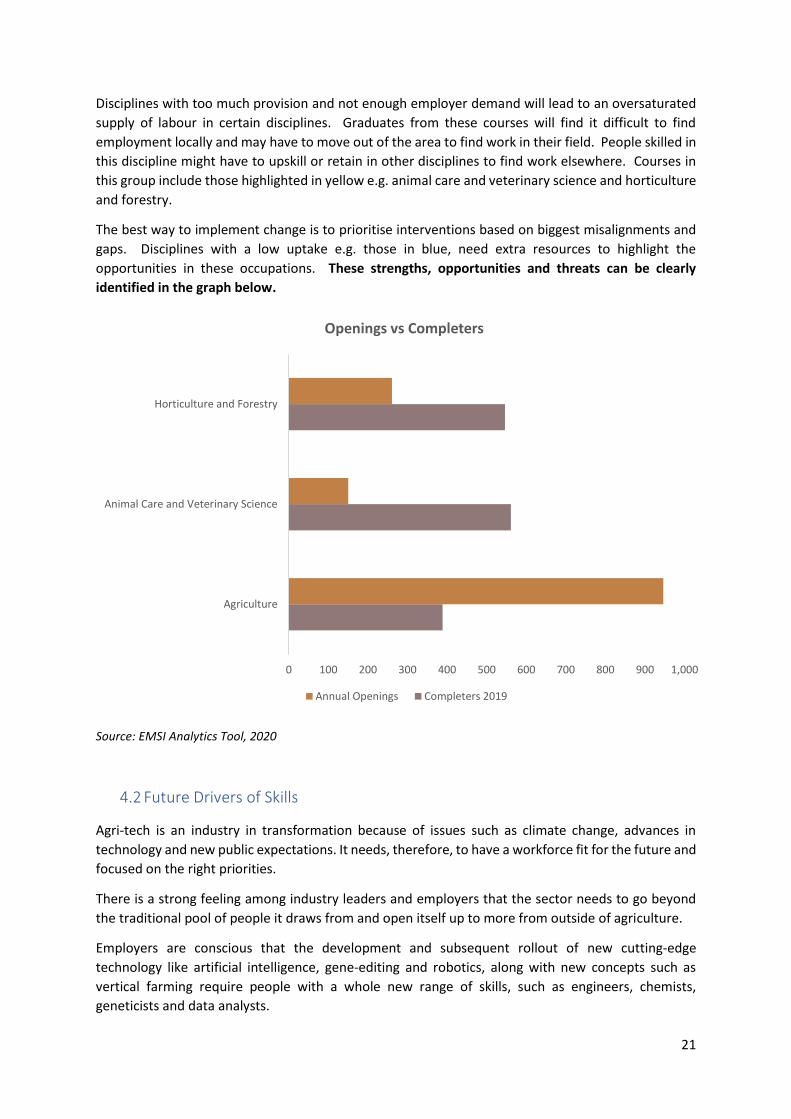
Discipline Completers 2019
Annual Openings
Gap Between Demand and Provision
% Jobs Growth (2019-2022)
Agriculture 389 946 557 -1%
Animal Care and Veterinary Science 561 150 -411 -0%
Horticulture and Forestry 547 261 -286 -2%
Green: Areas where the provider base already offers courses, but the data indicates that there may
be room to grow these to meet employment demand.
Blue: Courses the provider base does not currently offer, indicating that there is potential for creating
new courses to meet these skills needs.
Yellow: Areas where the data suggests that the provider base is currently oversupplying the labour
market to a significant level.
Skills provision that is aligned to local jobs and industry demand not only helps providers with their
Ofsted inspection but also helps to ensure learners are best placed to get employment using the skills
they have learned, supply employers with the skills they need and support growth in the local and
wider economy.
This provision review identifies areas of misalignment in the Marches for the agri-tech sector:
Strengths (course areas that are well met compared to industry demand)
Course areas which have a gap between supply and demand, where that there is less provision than
supply is possibly where there is still potential to increase provision locally. These include the
disciplines highlighted green in the table, e.g. agriculture.
Disciplines in the green section of the table that also have a net positive change in jobs in the next few
years are seen as extra strengths to the area; however, no courses are applicable in this analysis.
Opportunities (course areas that are currently under supplied compared to demand)
Other opportunity areas include those highlighted in blue with a gap between provision and demand,
as these are the disciplines which are sought after but have no provision locally. There is room for
courses to be developed in these disciplines to meet local employer needs, but there are no courses
applicable in this analysis.
Threats (course areas that are well met or oversupplied compared to industry demand)
21
Disciplines with too much provision and not enough employer demand will lead to an oversaturated
supply of labour in certain disciplines. Graduates from these courses will find it difficult to find
employment locally and may have to move out of the area to find work in their field. People skilled in
this discipline might have to upskill or retain in other disciplines to find work elsewhere. Courses in
this group include those highlighted in yellow e.g. animal care and veterinary science and horticulture
and forestry.
The best way to implement change is to prioritise interventions based on biggest misalignments and
gaps. Disciplines with a low uptake e.g. those in blue, need extra resources to highlight the
opportunities in these occupations. These strengths, opportunities and threats can be clearly
identified in the graph below.
Source: EMSI Analytics Tool, 2020
4.2 Future Drivers of Skills
Agri-tech is an industry in transformation because of issues such as climate change, advances in
technology and new public expectations. It needs, therefore, to have a workforce fit for the future and
focused on the right priorities.
There is a strong feeling among industry leaders and employers that the sector needs to go beyond
the traditional pool of people it draws from and open itself up to more from outside of agriculture.
Employers are conscious that the development and subsequent rollout of new cutting-edge
technology like artificial intelligence, gene-editing and robotics, along with new concepts such as
vertical farming require people with a whole new range of skills, such as engineers, chemists,
geneticists and data analysts.
0 100 200 300 400 500 600 700 800 900 1,000
Agriculture
Animal Care and Veterinary Science
Horticulture and Forestry
Openings vs Completers
Annual Openings Completers 2019
22
These new technologies are being developed to help agri-tech businesses become more efficient and
environmentally sustainable. The farming industry has been castigated in recent months for the role
that livestock plays in greenhouse emissions, and farm leaders have agreed that it needs to become
net zero in terms of emissions by 2040.
But if agriculture is to be part of the solution to this global problem, it will require people capable of
some smart thinking about how production systems can evolve, so they are more sustainable
environmentally. It will also require people on the ground with the practical skills and enthusiasm to
turn that theory into reality.
4.3 Impact of Brexit
There is little doubt that the UK agri‐tech sector will be one of the sectors most seriously affected by
Brexit. Not only is it dependent on trade relations with the European Union (EU), but it is also a sector
dependent on migrant labour and is heavily subsidised and regulated under the present Common
Agricultural Policy (CAP). The government response has been to try and reassure the sector,
guaranteeing UK farmers the same level of subsidy (as under the CAP) until the end of 2022. However,
until the country leaves the EU the economic and social implications of Brexit remain open to debate.
The findings of the recent Marches Growth Hub: Brexit Preparation Report, which surveyed 80
businesses from the agritech sector suggests that they have not prepared for Brexit as much as in
other sectors. Less than half of the 80 agritech businesses have considered the potential impact of a
change in the UK / EU trade relationship on suppliers and customers (41.3%). Overall, there was a
mixture of businesses who felt they would be hit hard by Brexit, and others who felt they wouldn’t be
affected – of which the latter were often small family run businesses.
4.4 Impact of Covid-19
Covid-19 is having and will continue to have an impact on all business sectors. Digital technology has
helped businesses continue to operate by enabling virtual working and addressing skills issues through
online tools and training opportunities where appropriate. Predicting how that might impact on
businesses in the future is difficult but methods of doing business will change and in some cases that
might alter the requirements on digital technology and change skills and training requirements.
Covid-19’s impact on global supply chains may encourage some businesses to consider diversification
and/or automation which could provide opportunities for the opportunities for the agri-tech sector.
23
5 Conclusions
5.1 Summary
As a major contributor to the Marches economy the agri-tech sector needs to rise to the well
documented and broadly recognised challenges it has in attracting the skills needed in the future. This
has been a sector based on traditional skills, systems and working practices. Yet, there is strong
evidence that new inventions and techniques are being willingly embraced. Not least as agri-tech
enterprises large and small can use emerging technology to do things faster, better and with less
waste.
The education institutes are a key strength for the Marches region in this sector. Whilst employers are
increasingly reporting they are struggling to find enough suitable candidates for specialist, skilled
roles, the solution for some might be to spread their net more widely than they have in the past. This
is best done in collaboration with FE and HE institutions to minimise areas of misalignment in skills
provision and to understand the need of agri-tech businesses.
5.2 Recommendations
Co-ordinate Sector Careers Promotion: In order to address skill shortages in agri-tech, the sector
should be promoted within schools as a career option. Particular focus should be on the breadth of
opportunities in agri-tech – science, business and finance, engineering, trades, environmental
management, ICT, agriculture, animal husbandry, etc.
Develop a Workforce Development Programme to Equip the Sector with the Skills Needed for
Growth: The existing Agri-tech workforce faces unprecedented challenges through the adoption of
new technology, pressures to raise labour productivity and to fill gaps in the workforce left by a fall in
migration. Industry growth needs a focus on skills for the existing workforce as well as attracting new
entrants.
Promote Collaboration between Businesses and Education Providers: The network of FE and HE institutions is a key asset of the Marches for this sector. Given the sector specialisms of these institutions, they are well placed to build partnerships with agri-tech businesses to understand the skills requirements of the new wave of technology and engage in new innovative techniques.
5.3 Action Planning
It will be the responsibility of the Marches Local Enterprise Partnership (LEP) and its key stakeholders
to review the recommendations, develop a strategy and agree an action plan to address the challenges
and opportunities identified within this report.