the influence of computer-mediated word-of-mouth communication on student perceptions of instructors...
TRANSCRIPT

The Influence of Computer-MediatedWord-of-Mouth Communication onStudent Perceptions of Instructors andAttitudes Toward Learning CourseContentChad Edwards, Autumn Edwards, Qingmei Qing &Shawn T. Wahl
The purpose of this study was to experimentally test the influence of computer-mediated
word-of-mouth communication (WOM) on student perceptions of instructors (attrac-
tiveness and credibility) and on student attitudes toward learning course content (affective
learning and state motivation). It was hypothesized that students who receive posi-
tive computer-mediated WOM about an instructor would perceive the instructor as more
credible and attractive than students who receive no information or negative information.
It was further hypothesized that students who receive positive computer-mediated WOM
about an instructor would report greater levels of affective learning and state motivation
to learn than students who receive no information or negative information. All hypotheses
were supported. Results are discussed in light of the heuristic�systematic processing model,
and the implications for instructional communication are addressed.
Keywords: Computer-Mediated Communication; Teacher Credibility; Attractiveness;
Affective Learning; State Motivation; RateMyProfessors.com; Student Evaluations
Many studies have shown that word-of-mouth communication (WOM) plays an
important role in shaping people’s attitudes and behaviors (Harrison-Walker, 2001).
Chad Edwards (Ph.D., University of Kansas, 2003) and Autumn Edwards (Ph.D., Ohio University, 2006) are
Assistant Professors of Communication in the School of Communication at Western Michigan University.
Qingmei Qing (BA, Northeast University at Qinhuangdao, 2005) is an M.A. student in the School of
Communication at Western Michigan University. Shawn T. Wahl (Ph.D., University of Nebraska, 2003) is an
Assistant Professor of Communication in the Department of Communication Studies at Texas A&M University
at Corpus Christi. Portions of an earlier draft were presented at the 2007 Central States Communication annual
meeting, Minneapolis, MN. Chad Edwards can be contacted at [email protected]
ISSN 0363-4523 (print)/ISSN 1479-5795 (online) # 2007 National Communication Association
DOI: 10.1080/03634520701236866
Communication Education
Vol. 56, No. 3, July 2007, pp. 255�277

Predominately, this research has focused on the role of WOM in shaping consumer
perceptions of products, services, and organizations (Herr, Kardes, & Kim, 1991).
Increasingly, college students are relying on computer-mediated WOM, through the
use of Internet sites like RateMyProfessors.com and PickAProf.com, to gather
information about prospective professors and make decisions about which courses to
take and what to expect. However, the effects of WOM in the educational context
have gone largely unexplored. Using the heuristic�systematic processing model as a
theoretical frame, the purpose of this study is to examine the influence of computer-
mediated WOM on students’ perceptions of instructors and their attitudes toward
course content. Specifically, Study 1 uses an experimental design to explore the effects
of an online instructor rating system (RateMyProfessors.com) on student perceptions
of instructor credibility and interpersonal attractiveness. Study 2 employs the same
design to investigate effects on affective learning and student state motivation to
learn.
Literature Review
Word-of-Mouth Communication (WOM)
At the broadest level, WOM includes any information about a target object
transferred from one person to another either face to face or via some other
communication medium (Brown, Barry, Dacin, & Gunst, 2005). Harrison-Walker
(2001) defined WOM as ‘‘informal, person-to-person communication between a
perceived noncommercial communicator and a receiver regarding a brand, a product,
an organization, or a service’’ (p. 63). Research on WOM has been long-running and
extensive. As early as 1955, Katz and Lazarsfeld demonstrated that WOM is seven
times more effective than print advertisements, and four times more effective than
personal sales pitches in terms of changing consumer attitudes and behavior
(Harrison-Walker, 2001). Numerous studies since have consistently demonst-
rated the links between WOM and consumer purchasing behavior (e.g., Arndt,
1967, 1968; Brown & Reingen, 1987; Engel, Blackwell, & Kegerreis, 1969; Howard &
Gengler, 2001; Richins, 1983), product success (e.g., Day, 1971; Katz & Lazarsfeld,
1955), satisfaction with experiences (e.g., Burzynski & Bayer, 1977; Harrison-Walker,
2001), diffusion of innovations (Arndt, 1967; Singhal, Rogers, & Mahajan, 1999;
Sultan, Farley, & Lehmann, 1990; Sun, Youn, Wu, & Kuntaraporn, 2006), perception
of risk (Shrum & Bischak, 2001), and persuasion (e.g., Bytwerk, 2005; Carl, 2006;
Compton & Pfau, 2004; Spangenberg & Giese, 1997).
In recent years, the Internet has emerged as a powerful medium for the
transmission of WOM, which is a significant form of online interpersonal
communication and serves as a critical tool for facilitating the diffusion of
information throughout online communities (Sun et al., 2006). According to
Bickart and Schindler (2001), traditional WOM has typically consisted of spoken
words exchanged face to face between friends or relatives. By contrast, computer-
mediated WOM typically involves the technology-facilitated transmission of written
256 C. Edwards et al.
personal opinions and experiences among acquaintances or strangers (Sun et al.,
2006). The growth of the Internet has expanded both the availability and the
importance of WOM in the marketplace (Pitt, Berthon, Watson, & Zinkhan, 2002;
Zinkhan, Kwak, Morrison, & Peters, 2003). Furthermore, because of the relative
speed, convenience, breadth of reach, and lack of face-to-face social pressure,
Phelps, Lewis, Mobilio, Perry, and Raman (2004) have argued that computer-
mediated WOM has surpassed traditional WOM in its influence on information
and decision-making processes.
In the educational context, the role of WOM has gone largely unexplored. In one
of few studies on the topic, Borgida and Nisbett (1977) found that college students
were influenced by WOM about college courses. Specifically, their results demon-
strated that vivid WOM delivered face-to-face by a single student had a greater
influence on student course choice than did extensive written course evaluations
from a large group of students. In the decades following Borgida and Nisbett’s
investigation, the evolution of computer technology has provided students with
expanded opportunities for accessing and participating in WOM about college
courses and instructors (Wilhelm & Comegys, 2004). This is evidenced in the
emergence and growing popularity of online instructor rating systems, which
generally present a collection of anonymous student reviews of faculty and courses
(Lewin, 2003).
Online Instructor Rating Systems
Over the past few years, numerous websites devoted to evaluations of college
instructors and their courses have emerged on the Internet. Included among the most
successful and widely used are sites like RateMyProfessors.com, PickAProf.com, and
ProfessorPerformance.com. Such sites are intended to aid in the process of course
selection by providing students a forum to anonymously post and view quantitative
and open-ended evaluations of teaching effectiveness (Kindred & Mohammed, 2005).
RateMyProfessors.com (RMP), founded in 1999, is arguably the largest and best-
known website of this type (Kindred & Mohammed, 2005). In December of 2006, over
6.2 million ratings had been posted, spanning over 770,000 instructors from 6,000
schools in the country (Statistics, RateMyProfessors.com). Student users may rate
instructors along three dimensions: easiness, helpfulness, and teaching clarity.
Helpfulness and teaching clarity ratings are averaged to provide an overall quality
rating, which is summarized numerically on a 1�5 scale and indicated visually with an
icon of a face displaying one of three expressions: smiling (good quality), neutral
expression (average quality), and frowning (poor quality). Users have the option of
indicating physical attractiveness by putting a ‘‘chili pepper’’ next to the name of the
instructor to signify them as ‘‘hot.’’ In addition, concise open-ended comments about
the instructor and course can be posted (Kindred & Mohammed, 2005). The ratings
and comments become immediately available for viewing by others. Access to the site
is unrestricted insofar as users do not have to pay a fee.
Computer-Mediated WOM and Student Perceptions 257

RMP has been the subject of several empirical investigations. Research has
demonstrated that instructor quality scores on RMP are strongly positively correla-
ted with perceived course easiness and professor sexiness (Felton, Mitchell, & Stinson,
2004, 2005). Kindred and Mohammed (2005) demonstrated that students’ motives
for accessing RMP included information-seeking (to aid in the process of course
selection), convenience, and interpersonal utility (curiosity about peer opinions
of the instructor and course). Additionally, Kindred and Mohammed’s (2005)
investigation found that issues of instructor competence and classroom experience
were the primary focus of comments posted on RMP. To date, however, there
has been no empirical investigation concerning whether and in what ways RMP
ratings actually affect student perceptions of their instructors or their attitudes
toward course content. Given the popularity of RMP and the increasing desire
of students to have information about instructors prior to enrolling in their
courses (Gilroy, 2003), examining the impact of such student ratings is timely
and important. According to RMP founder, John Swapceinski, students expect
more information than in previous times because they regard themselves as
customers seeking to maximize the value of their educational dollars (Gilroy,
2003). If this is the case, RMP, as an instance of computer-mediated WOM, should
influence the perceptions of instructors and college courses held by students.
Moreover, if students are influenced by information appearing on sites like RMP, part
of the explanation likely relates to the ways in which they process these types of
persuasive messages. A considerable body of communication research has examined
the role of information processing on the formation of attitudes and judgments
(Dillard & Pfau, 2002). The following section describes the heuristic�systematic
processing model.
Heuristic-Systematic Processing Model
The heuristic�systematic processing model was originally developed by Chaiken
(1980) and Chaiken and Eagly (1983) as an alternative to the elaboration-likelihood
model of persuasion. According to Eagly and Chaiken (1993), ‘‘the heuristic�systematic model was developed for application to validity-seeking persuasion
settings in which people’s primary motivational concern is to attain accurate
attitudes that square with relevant facts’’ (p. 326). The heuristic�systematic
processing model is a dual-process framework based on the assumption that
‘‘attitudes are formed and modified as people gain information about attitude
objects’’ (Eagly & Chaiken, 1993, p. 257). Heuristic processing refers to the relatively
effortless application of simple decision rules (e.g., expert opinions are correct; mass
consensus is reliable) (Trumbo, 1999, 2002). By contrast, systematic processing
requires greater cognitive effort and resources as individuals carefully examine
arguments and relate them to previously obtained information. Individuals may
engage in one or both types of processing modes to form a judgment about a
particular issue or person (Chaiken, Liberman, & Eagly, 1989). According to the
model, the mode of processing is best predicted by the sufficiency principle, which
258 C. Edwards et al.

maintains that the nature of processing reflects the effort to strike a balance between
minimizing cognitive effort while maximizing judgmental confidence (Chaiken,
1987; Chaiken et al., 1989; Maheswaran & Chaiken, 1991). The consequence of a
mode of processing is that judgments based on heuristic processing tend to be less
stable and less related to subsequent behavior than judgments based on systematic
processing (Trumbo, 1999).
Previous research has indicated that there are three primary antecedent variables
which influence the mode of processing: motivation, self-efficacy, and information
sufficiency (Eagly & Chaiken, 1993; Trumbo, 1999). Motivation refers to the
perceived importance of reaching a judgment and has been positively associated
with greater systematic processing, presumably because highly motivated indivi-
duals are willing to exert greater effort and resources in attaining judgmental
confidence (Trumbo, 1999). Self-efficacy refers to an individual’s self-perceived level
of ability to acquire and use information in a specific situation. According to the
heuristic�systematic processing model, because systematic processing is presumed
to be the more demanding of the two modes, its use should be associated with
situations in which individuals feel highly self-efficacious (Eagly & Chaiken, 1993).
However, previous research has established positive associations between self-
efficacy and both systematic and heuristic processing modes (Trumbo, 1999). The
final antecedent variable, information sufficiency, refers to an individual’s percep-
tion of having enough information to make a judgment and has been positively
associated with the use of the less effortful heuristic processing (Trumbo, 1999).
Using the heuristic�systematic processing model as a theoretical framework for
attitude formation, two studies were conducted to examine the influence of
computer-mediated WOM, contextualized as RMP, on perceptions of instructors
held by students.
Study 1: Student Perceptions of Instructors
The purpose of Study 1 is to experimentally test the influence of computer-mediated
WOM (RMP) on student perceptions of instructors. Among the most important
and likely influenced perceptions of instructors are those of their credibility and
attractiveness.
Credibility
Credibility is defined as ‘‘the attitude toward a source of communication at a given
time by a communicator’’ (McCroskey & Young, 1981, p. 24), and encompasses the
degree to which students consider their instructors to be competent, have character,
and demonstrate caring (McCroskey & Teven, 1999). According to Frymier and
Thompson (1992), whether held consciously or unconsciously, students’ perceptions
of teachers’ credibility can exert a significant influence on their reactions to teachers
and on the effectiveness of teachers in the classroom. Instructors who are perceived
as more credible have students who report greater levels of affective learning (Teven &
Computer-Mediated WOM and Student Perceptions 259
McCroskey, 1997) and satisfaction (Teven & Herring, 2005), feel better understood
(Schrodt, 2003), are more willing to talk in class (Myers, 2004), and are more likely to
recommend the instructor to a friend (Nadler & Nadler, 2001).
Previous research has demonstrated that impressions of instructor credibility are
linked to instructor verbal and nonverbal communicative behaviors (Hendrix, 1997;
Myers & Bryant, 2004). Aggressive communication on the part of instructors is
associated with low student perceptions of instructor credibility (Edwards & Myers,
in press), while nonverbally immediate communication on the part of instructors
is associated with high student perceptions of instructor credibility (Thweatt &
McCroskey, 1998). While previous research makes clear that student perceptions of
instructor credibility are influenced by various instructor behaviors, it is likely that
such perceptions are, in part, also shaped by WOM exchanged via online instructor
rating systems. Therefore, the following hypothesis is offered:
H1: Students who receive positive computer-mediated WOM (RMP ratings)
about an instructor will perceive the instructor as more credible (on
the dimensions of competence, character, and caring) than students
who receive no computer-mediated WOM or negative computer-mediated
WOM.
Attractiveness
McCroskey and McCain (1974) identified three dimensions of interpersonal
attraction: task, social, and physical. In order, these dimensions refer to a person’s
desire to work with another person, to socialize with another person, and attraction
to another person based on physical appearance. Individuals rated as highly attractive
(especially on all three dimensions) have been rated as more persuasive and credible
than less attractive individuals (McCroskey, Hamilton, & Weiner, 1974). Further-
more, interpersonal attraction has been linked both to the amount of communica-
tion people engage in and to the quality of their exchanges (McCroskey et al., 1974).
In the instructional communication context, student perceptions of instructor
attractiveness have been positively associated with instructor immediacy and with
perceptions of attitude and background similarity (Edwards & Edwards, 2001; Rocca
& McCroskey, 1999). It is reasonable to propose that student perceptions of
instructor attractiveness are also influenced by computer-mediated WOM. The
current study limits the assessment of instructor attractiveness to the task and social
dimensions because previous research has demonstrated that students’ evaluations of
instructors’ physical attractiveness are not a central and relevant dimension of
teaching effectiveness (cf. Nussbaum, 1992; Rice, Stewart, & Hujber, 2000).1 Thus, we
offer a second hypothesis.
H2: Students who receive positive computer-mediated WOM (RMP ratings)
about an instructor will perceive the instructor as more attractive (task and
social) than students who receive no computer-mediated WOM or negative
computer-mediated WOM.
260 C. Edwards et al.

Method
Participants
The convenience sample was composed of 309 undergraduate students enrolled in
one of three large lecture introductory communication courses at a large Midwestern
university. Participants included 185 females (59.90%), 115 males (37.20%), and
9 individuals who did not indicate sex. The majority self-identified as Caucasian/
White (69.90%, n�216). Participants’ ages ranged from 18 to 48 years, with a mean
of 20.90 (SD�2.66). The largest percentage of participants classified as juniors
(34.00%, n�105), followed by sophomores (23.90%, n�74), seniors (21.70%,
n�67), first-years (15.90%, n�49), and ‘‘others’’ (4.50%, n�14). Participants
received extra credit points in return for taking part in the study.
Procedures
Upon securing institutional review board approval, an experimental design consisting
of two treatment groups (positive and negative RMP ratings) and a control group (no
RMP ratings) was utilized (Kerlinger & Lee, 2000). The groups consisted of three
sophomore-level introductory communication courses of approximately 100 students
each. Each class was randomly assigned a condition (positive treatment, negative
treatment, or control). In all conditions, after reading a consent form, participants
were informed by the first author that they would be asked to view a 12 minute
videotape of an instructor delivering a lecture on the topic of computer-mediated
communication. Furthermore, participants were informed that they would be asked
to evaluate the instructor after viewing the presentation. At this point, students in the
two treatment groups were given a handout. The researcher described the handout as
a printout of the RMP results for the instructor appearing in the taped lecture and
asked participants to read the handout during the moments taken to set up the
videotape presentation. Positive RMP ratings were given to the first treatment group,
while negative RMP ratings were given to the second treatment group. The control
group did not receive a RMP ratings handout, but was given a fictitious name for
both the instructor and his institutional affiliation. At the completion of the
videotaped lecture, participants in all three conditions received a 2-page survey-
questionnaire comprising the following measures: (a) McCroskey and McCain’s
(1974) Measure of Interpersonal Attraction, (b) McCroskey and Teven’s (1999)
Measure of Source Credibility, and (c) a brief demographic survey. Finally,
participants were debriefed and thanked.
Independent Variable
To create the two treatment conditions, two 1-page handouts were produced,
showing simulated RMP ratings. Handouts were produced by using html code to
manipulate the content of an actual RMP results page. Appearing at the top of the
pages were realistic-sounding, but fictitious, names for both the instructor appearing
Computer-Mediated WOM and Student Perceptions 261
in the taped lecture and his institutional affiliation. The middle of the pages included
a face displaying an expression (either a smile or frown) and simulated quantitative
summaries of student-raters’ evaluations of the instructor’s easiness, helpfulness,
clarity, and overall quality (each based on a maximum score of 5.0 and a minimum of
1.0). The bottom third of the pages included five fabricated open-ended comments
from students regarding the instructor. These comments were modeled from student
comments appearing on actual RMP results pages. The posted dates assigned to the
five comments spanned the three academic semesters prior to that in which this study
was conducted. By listing the same fabricated course number next to each comment,
it was made to appear that all five comments pertained to the same course.
The positive RMP handout included a ‘‘smiley face’’ to indicate good overall
quality of the instructor. The average easiness rating was listed at 3.2 out of 5.0, with
1.0 representing difficult and 5.0 representing easy.2 The average helpfulness rating
was listed as 5.0, and the average clarity rating was listed as 4.8. These numbers were
averaged to provide an overall quality rating of 4.9 out of 5.0, with 5.0 representing
the highest possible overall quality rating. Five simulated open-ended comments
about the instructor were provided. For example: ‘‘If you want to learn something,
take him if at all possible. Things that I liked: He’s very prepared. He’s very
understanding and nice. He’s very good at using humor.’’
The negative RMP evaluation included a ‘‘frowny face’’ to indicate poor overall
quality of the instructor. The average easiness rating was again listed at 3.2 out of 5.0.
The average helpfulness rating was listed as 2.0, and the average clarity rating was
listed as 1.4, providing an overall quality rating of 1.7.3 Five simulated open-ended
comments about the instructor were provided. For example: ‘‘If you want to learn
something, don’t take him if at all possible. Things that annoyed me: He’s very under
prepared. He’s very rude. He’s very bad at using humor.’’
As evidenced in the sample provided above, negative comments were produced by
reversing the sentiments expressed in each of the five comments used on the positive
RMP evaluation.
Video Stimulus
The fourth author, a person unknown to student participants, developed and
rehearsed a short lecture on the topic of computer-mediated communication. He
was instructed to deliver a teaching performance of ‘‘average quality.’’4 He was kept
blind to the purposes of this study until all data collection was completed. The
resultant 12-minute lecture was recorded in front of a live classroom audience. The
video frame included the instructor from the waist up and a projection screen used to
display a basic PowerPoint outline of the lecture. The student audience was not visible.
Dependent Variables
The Measure of Source Credibility (McCroskey & Teven, 1999) is an 18-item
instrument designed to assess perceptions of an individual’s credibility across the
262 C. Edwards et al.
three dimensions of competence (6 items; e.g., ‘‘intelligent/unintelligent’’), character
(6 items; e.g., ‘‘trustworthy/untrustworthy’’), and caring (6 items; e.g., ‘‘cares about
me/doesn’t care about me’’). Participants were asked to rate the instructor appearing
in the videotaped lecture along a series of 7-point semantic differential scales. Past
studies have reported reliability coefficients ranging from .86 to .95 for the three
dimensions (Brann, Edwards, & Myers, 2005; Teven & McCroskey, 1997). In this
study, reliability coefficients of .87 for competence (M�27.20, SD�7.19), .79 for
character (M�26.48, SD�5.71), and .85 for caring (M�25.18, SD�6.71) were
obtained.
The Measure of Interpersonal Attraction (McCroskey & McCain, 1974) was
designed to assess a person’s attraction to another along three dimensions: task
(5 items; e.g., ‘‘I am confident with his or her capability to get the job done’’), social
(5 items; e.g., ‘‘I think she or he could be a friend of mine’’), and physical attra-
ction (5 items; e.g., ‘‘I find him or her very physically attractive’’). In this study, the
physical attraction dimension was not utilized. Participants were asked to indicate the
degree to which they agreed or disagreed with task and social attraction items on
Likert scales with response options ranging from 1 (strongly disagree) to 5 (strongly
agree). Past studies have shown this measure to be reliable (e.g., task a�.81, social
a�.84, McCroskey & McCain, 1974; task a�.69, social a�.78, Rocca & McCroskey,
1999). In this study, the following reliability coefficients were obtained: task�.82
(M�17.23, SD�4.12) and social�.80 (M�14.08, SD�4.07).
Results
A one-way K-group multivariate analysis of variance (MANOVA) was conducted to
determine the effects of computer-mediated WOM (positive, negative, or no RMP
ratings) on the five dependent variables of the competence, character, and caring
dimensions of credibility and the task and social dimensions of attraction. A
MANOVA was chosen because the dependent variables were related. Table 1 reports
the correlations among the dependent variables.
Significant differences were found among the positive, negative and control
computer-mediated WOM conditions on the dependent measures, Wilks’s l�.680,
F(10, 604)�12.85, p B.001. The multivariate h2 based on Wilks’s lambda was
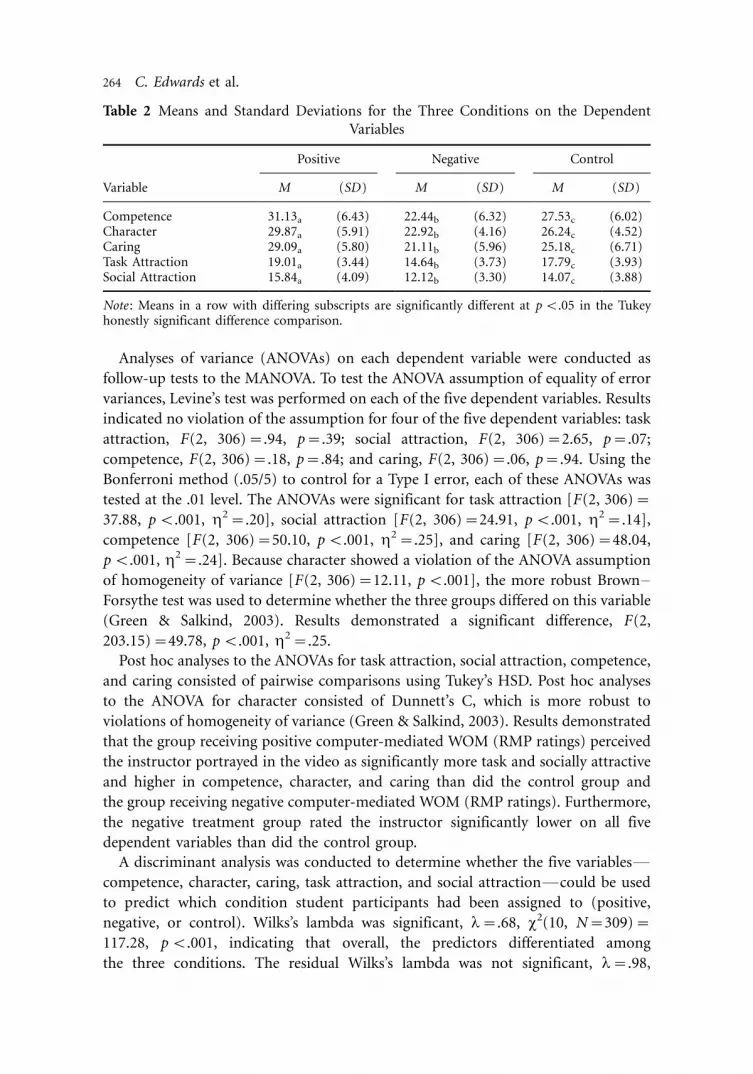
moderate, .18. Table 2 reports the means and standard deviations on the dependent
variables for the three groups.
Table 1 Correlations Among the Dependent Variables
Competence Character Caring Task Attraction Social Attraction
Competence � .74* .71* .73* .49*Character � � .78* .62* .55*Caring � � � .60* .57*Task Attraction � � � � .50*
*p B.01.
Computer-Mediated WOM and Student Perceptions 263
Analyses of variance (ANOVAs) on each dependent variable were conducted as
follow-up tests to the MANOVA. To test the ANOVA assumption of equality of error
variances, Levine’s test was performed on each of the five dependent variables. Results
indicated no violation of the assumption for four of the five dependent variables: task
attraction, F(2, 306)�.94, p�.39; social attraction, F(2, 306)�2.65, p�.07;
competence, F(2, 306)�.18, p�.84; and caring, F(2, 306)�.06, p�.94. Using the
Bonferroni method (.05/5) to control for a Type I error, each of these ANOVAs was
tested at the .01 level. The ANOVAs were significant for task attraction [F(2, 306)�37.88, p B.001, h2�.20], social attraction [F(2, 306)�24.91, p B.001, h2�.14],
competence [F(2, 306)�50.10, p B.001, h2�.25], and caring [F(2, 306)�48.04,
p B.001, h2�.24]. Because character showed a violation of the ANOVA assumption
of homogeneity of variance [F(2, 306)�12.11, p B.001], the more robust Brown�Forsythe test was used to determine whether the three groups differed on this variable
(Green & Salkind, 2003). Results demonstrated a significant difference, F(2,
203.15)�49.78, p B.001, h2�.25.
Post hoc analyses to the ANOVAs for task attraction, social attraction, competence,
and caring consisted of pairwise comparisons using Tukey’s HSD. Post hoc analyses
to the ANOVA for character consisted of Dunnett’s C, which is more robust to
violations of homogeneity of variance (Green & Salkind, 2003). Results demonstrated
that the group receiving positive computer-mediated WOM (RMP ratings) perceived
the instructor portrayed in the video as significantly more task and socially attractive
and higher in competence, character, and caring than did the control group and
the group receiving negative computer-mediated WOM (RMP ratings). Furthermore,
the negative treatment group rated the instructor significantly lower on all five
dependent variables than did the control group.
A discriminant analysis was conducted to determine whether the five variables*competence, character, caring, task attraction, and social attraction*could be used
to predict which condition student participants had been assigned to (positive,
negative, or control). Wilks’s lambda was significant, l�.68, x2(10, N�309)�117.28, p B.001, indicating that overall, the predictors differentiated among
the three conditions. The residual Wilks’s lambda was not significant, l�.98,
Table 2 Means and Standard Deviations for the Three Conditions on the Dependent
Variables
Positive Negative Control
Variable M (SD ) M (SD) M (SD )
Competence 31.13a (6.43) 22.44b (6.32) 27.53c (6.02)Character 29.87a (5.91) 22.92b (4.16) 26.24c (4.52)Caring 29.09a (5.80) 21.11b (5.96) 25.18c (6.71)Task Attraction 19.01a (3.44) 14.64b (3.73) 17.79c (3.93)Social Attraction 15.84a (4.09) 12.12b (3.30) 14.07c (3.88)
Note : Means in a row with differing subscripts are significantly different at p B.05 in the Tukeyhonestly significant difference comparison.
264 C. Edwards et al.

x2 (4, N�309)�7.75, p�.101. This test, thus, indicated that the predictors did not
differentiate significantly between the three conditions after partialling out the effects
of the first discriminant function. Therefore, we chose only to interpret the first
discriminant function.
In Table 3, we present the within-group correlations between the predictors and
the discriminant function, as well as the standardized weights. Based on these
coefficients, competence, character, and caring (the three dimensions of credibility)
demonstrate the strongest relationships with the discriminant function, whereas task
and social attraction show slightly weaker relationships. On the basis of the results,
we chose to label the discriminant function ‘‘perceived instructor desirability.’’
The means on the discriminant function are consistent with this interpretation.
The positive RMP rating condition (M�.75) had the highest mean on perceived
instructor desirability, whereas the negative RMP rating condition (M��.85) and
control condition (M�.01) had lower means. When we tried to predict condition,
we were able to correctly classify 56% of the individuals in this sample. To take into
account chance agreement, a kappa coefficient, which may range from �1 to �1,
was computed. The obtained value of .34 represents a moderate value. Finally, to
assess how well the classification procedure would predict in a new sample, we
estimated the percent of people accurately classified using the leave-one-out
technique (in which all cases are left out once and classified based on classification
functions for the N � 1 cases; Green & Salkind, 2003) and correctly classified 54% of
the cases.
Summary
The purpose of this study was to experimentally test the effects of computer-mediated
WOM on students’ perceptions of the credibility (competence, character, and caring)
and attractiveness (task and social) of instructors. Results supported hypotheses one
and two, demonstrating that students who receive positive computer-mediated WOM
about an instructor perceive the instructor as more credible and more attractive than
students who receive negative computer-mediated WOM about the instructor or
none at all.
Table 3 Standardized Coefficients and Correlations of Predictor Variables with the
Instructor Desirability Discriminant Function
PredictorsCorrelation Coefficients with
Discriminant FunctionStandardized Coefficients with
Discriminant Function
Competence .87 .33Character .87 .31Caring .85 .26Task Attraction .74 .17Social Attraction .61 .16
Computer-Mediated WOM and Student Perceptions 265
Study 2: Student Attitudes Toward Course Content
The findings from the first study demonstrate the importance of computer-mediated
WOM on student assessments of instructors. Given this, it is reasonable to wonder
whether computer-mediated WOM exerts an influence on student attitudes toward
learning the content of courses. Specifically, Study 2 was designed to experimentally
test the effect of computer-mediated WOM (RMP) on students’ levels of affective
learning and state motivation to learn. Brief descriptions of these variables follow.
Affective Learning
According to Kearney (1994), affective learning refers to ‘‘an increasing internaliza-
tion of positive attitudes toward the content or subject matter’’ (p. 81). Importantly,
affective learning is positively associated with student motivation to learn
(Christensen & Menzel, 1998; Christophel, 1990; Frymier, 1994; Frymier & Houser,
2000) and may serve as a precursor to cognitive learning (Rodriguez, Plax, & Kearney,
1996). Furthermore, affective learning on the part of students has been linked to
better instructor evaluations (Teven & McCroskey, 1997) and increased willingness to
enroll in future classes with the same instructor (Gorham & Christophel, 1990;
Kearney, Plax, & Wendt-Wasco, 1985; McCroskey, Fayer, Richmond, Sallinen, &
Barraclough, 1996). Previous research has demonstrated that affective learning is
positively related to a number of communication behaviors on the part of instructors,
including immediacy (Comstock, Rowell, & Bowers, 1995; Pogue & AhYun, 2006;
Witt & Schrodt, 2006), use of instructional technology (Turman & Schrodt, 2005;
Witt & Schrodt, 2006), clarity (Avtgis, 2001; Chesebro & McCroskey, 2001), and
humor (Gorham & Christophel, 1990), and is negatively related to instructor verbal
aggressiveness (Myers, 2002; Myers & Knox, 2000). In addition to being influenced by
instructor behavior, it also stands to reason that affective learning would be
influenced by information gathered through computer-mediated WOM. Therefore,
we pose the following hypothesis:
H3: Students who receive positive computer-mediated WOM (RMP ratings)about an instructor will report greater levels of affective learning thanstudents who receive no computer-mediated WOM or negative computer-mediated WOM.
Student State Motivation to Learn
Brophy (1987) characterized student motivation as the ‘‘tendency to find academic
activities meaningful and worthwhile’’ (p. 205). Whereas trait motivation refers to an
individual’s general level of motivation across situations, state motivation refers to
student behaviors or displays to complete a specific task (Frymier & Shulman, 1995).
In other words, state motivation ‘‘refers to a specific learning situation such as a
particular class, task, or content area’’ (Myers & Rocca, 2000, p. 291). Previous
research has established positive relationships between student state motivation and
266 C. Edwards et al.

student learning (Christophel, 1990) and public-speaking competence (Carrell &
Menzel, 1997). Moreover, student state motivation is related to behavior on the part
of instructors (Frymier & Shulman, 1995). Specifically, motivation is positively
associated with perceived instructor predictability (Avtgis, 2001), fairness (Chory-
Assad, 2002), and immediacy (Allen, Witt, & Wheeless, 2006; Kerssen-Griep, 2001;
Richmond, 1990) and is negatively associated with perceived instructor misbehaviors
(Wanzer & McCroskey, 1998) and verbal aggression (Myers, 2002). Computer-
mediated WOM figures as another likely source of influence on student levels of state
motivation to learn. The following hypothesis is offered:
H4: Students who receive positive computer-mediated WOM (RMP ratings)about an instructor will report greater levels of state motivation thanstudents who receive no computer-mediated WOM or negative computer-mediated WOM.
Method
Participants
Participants included 131 undergraduate students enrolled in one of two large-lecture
communication courses at the same large Midwestern university used in the first
study. Data collection for Study 2 occurred one semester after data collection for
Study 1. There were 87 females (66.40%), 43 males (32.80%), and 1 individual who
did not indicate their sex. The majority self-identified as Caucasian/White (75.60%,
n�99). Participants’ ages ranged from 18 to 40 years, with a mean of 21.59 (SD�2.74). The largest percentage of participants classified as seniors (39.70%, n�52),
followed by juniors (36.60%, n�48), sophomores (20.60%, n�27), first-years
(.80%, n�1), and ‘‘others’’ (2.30%, n�3). Student respondents received extra credit
points in return for their participation.
Procedures
Upon securing institutional review board approval, a second experiment consisting of
two treatment groups (positive and negative RMP ratings) and a control group (no
RMP ratings) was conducted to test hypotheses three and four. The groups were
drawn from two introductory communication courses. The smaller class (n�49) was
assigned to the control condition, while the larger (n�82) was assigned to the
treatment conditions (with approximately half of students receiving the positive
treatment and half receiving the negative treatment through a process of random
assignment). Following procedures identical to those described in Study 1,
participants read a consent form, received treatment according to condition (positive
RMP ratings, negative RMP ratings, or no RMP ratings) and viewed the video-taped
lecture. Upon completion of the taped presentation, participants in all three
conditions were asked to complete a four-page survey-questionnaire comprising
the following measures: (a) McCroskey’s (1994) Affective Learning Measure, (b)
Computer-Mediated WOM and Student Perceptions 267
Christophel’s (1990) Student Motivation Scale, and (c) a brief demographic survey.
Participants were then debriefed and thanked.
Dependent Variables
McCroskey’s (1994) Affective Learning Measure is an 8-item instrument designed to
assess students’ affect for course subject matter along a series of 7-point semantic
differential scales. The first four items address affect toward the course content (e.g.,
‘‘I feel that the class content is: valuable/worthless’’), while the last four items address
affect toward other classes in the content area (e.g., ‘‘My likelihood of taking future
courses in this content area is: improbable/probable’’). Past studies have reported
reliability coefficients exceeding .90 (McCroskey, 1994). In this study, a reliability
coefficient of .91 (M�33.69; SD�10.50) was obtained for affective learning.
Christophel’s (1990) Student Motivation Scale is a 12-item instrument designed to
assess students’ motivation to learn from a target instructor in a particular course.
Items are rated along 7-point semantic differential scales (e.g., ‘‘motivated/
unmotivated,’’ ‘‘inspired/uninspired’’). Past studies have reported reliability coeffi-
cients consistently higher than .90 (Christophel, 1990; Myers, 2002). A reliability
coefficient of .95 (M�35.69, SD�16.20) was obtained in the present study.
Results
A MANOVA was conducted to determine the effects of computer-mediated WOM
(positive, negative, or no RMP ratings) on the dependent variables of affective
learning and student state motivation to learn (which were significantly positively
correlated, r (129)�.57, p B.01). The MANOVA was significant, Wilks’s l�.803,
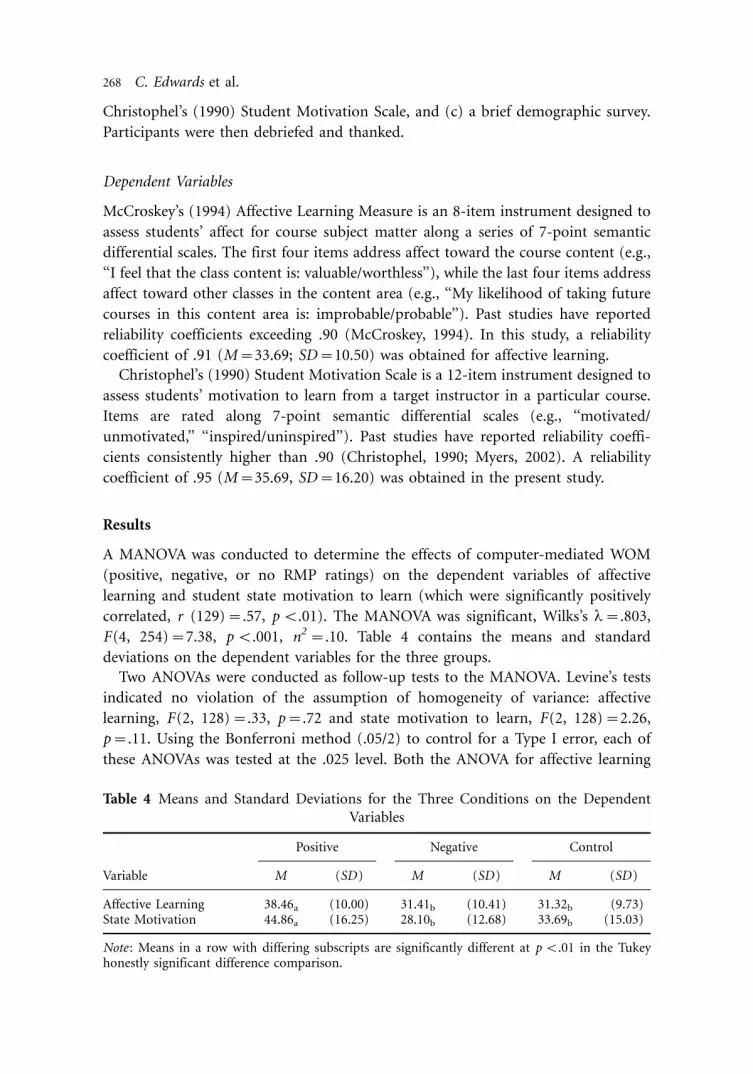
F(4, 254)�7.38, p B.001, n2 �.10. Table 4 contains the means and standard
deviations on the dependent variables for the three groups.
Two ANOVAs were conducted as follow-up tests to the MANOVA. Levine’s tests
indicated no violation of the assumption of homogeneity of variance: affective
learning, F(2, 128)�.33, p�.72 and state motivation to learn, F(2, 128)�2.26,
p�.11. Using the Bonferroni method (.05/2) to control for a Type I error, each of
these ANOVAs was tested at the .025 level. Both the ANOVA for affective learning
Table 4 Means and Standard Deviations for the Three Conditions on the Dependent
Variables
Positive Negative Control
Variable M (SD) M (SD) M (SD)
Affective Learning 38.46a (10.00) 31.41b (10.41) 31.32b (9.73)State Motivation 44.86a (16.25) 28.10b (12.68) 33.69b (15.03)
Note : Means in a row with differing subscripts are significantly different at p B.01 in the Tukeyhonestly significant difference comparison.
268 C. Edwards et al.
[F(2, 128)�7.25, p B.001, h2�.10] and the student state motivation to learn
[F(2, 128)�13.82, p B.001, h2�.18] achieved significance. Pairwise comparisons
using Tukey’s HSD revealed that the group receiving positive computer-mediated
WOM (RMP ratings) reported significantly higher levels of affective learning and
state motivation to learn than did the control group and the group receiving negative
computer-mediated WOM (RMP ratings). The latter two groups did not differ
significantly from one another on either variable.
To determine whether affective learning and state motivation to learn could be
used to predict the condition to which a participant had been assigned, a
discriminant analysis was performed. The predictors differentiated significantly
among the three conditions, Wilks’s l�.80, x2 (4, N�131)�28.04, p B.001. The
residual Wilks’s lambda was not significant, l�.98, x2 (1, N�131)�2.23, p�.14,
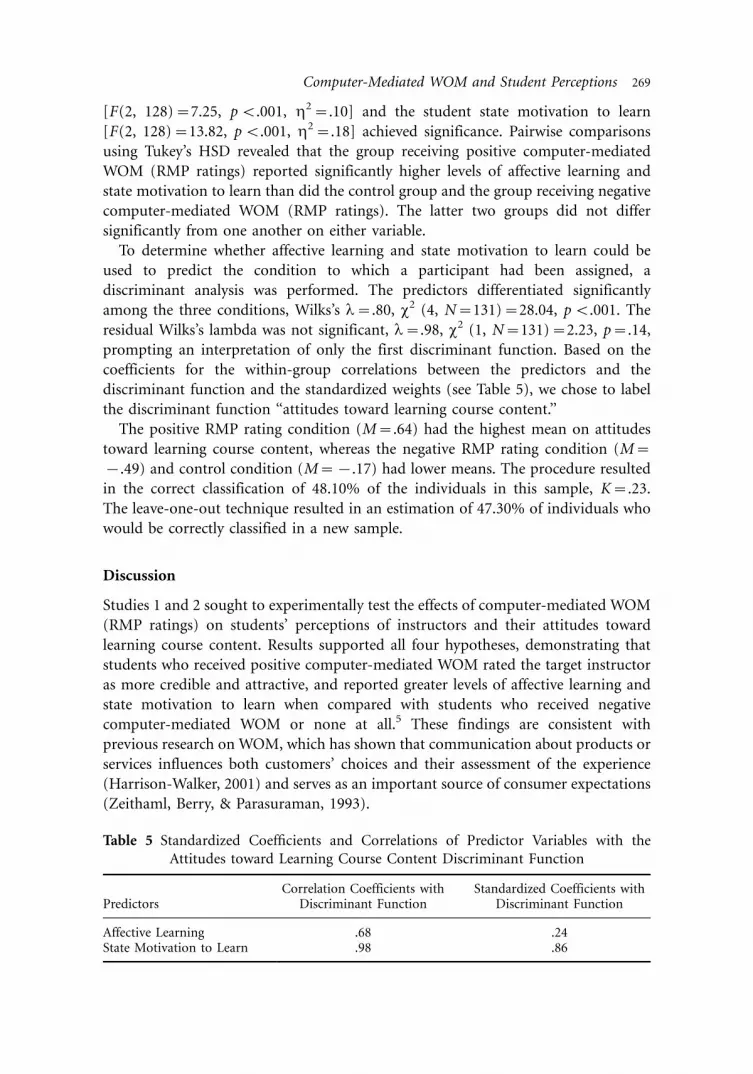
prompting an interpretation of only the first discriminant function. Based on the
coefficients for the within-group correlations between the predictors and the
discriminant function and the standardized weights (see Table 5), we chose to label
the discriminant function ‘‘attitudes toward learning course content.’’
The positive RMP rating condition (M�.64) had the highest mean on attitudes
toward learning course content, whereas the negative RMP rating condition (M��.49) and control condition (M��.17) had lower means. The procedure resulted
in the correct classification of 48.10% of the individuals in this sample, K�.23.
The leave-one-out technique resulted in an estimation of 47.30% of individuals who
would be correctly classified in a new sample.
Discussion
Studies 1 and 2 sought to experimentally test the effects of computer-mediated WOM
(RMP ratings) on students’ perceptions of instructors and their attitudes toward
learning course content. Results supported all four hypotheses, demonstrating that
students who received positive computer-mediated WOM rated the target instructor
as more credible and attractive, and reported greater levels of affective learning and
state motivation to learn when compared with students who received negative
computer-mediated WOM or none at all.5 These findings are consistent with
previous research on WOM, which has shown that communication about products or
services influences both customers’ choices and their assessment of the experience
(Harrison-Walker, 2001) and serves as an important source of consumer expectations
(Zeithaml, Berry, & Parasuraman, 1993).
Table 5 Standardized Coefficients and Correlations of Predictor Variables with the
Attitudes toward Learning Course Content Discriminant Function
PredictorsCorrelation Coefficients with
Discriminant FunctionStandardized Coefficients with
Discriminant Function
Affective Learning .68 .24State Motivation to Learn .98 .86
Computer-Mediated WOM and Student Perceptions 269

Importantly, these studies are the first to establish causal links between material
posted on RMP and student evaluations of instructors and courses. The results of
Study 1 demonstrate that computer-mediated WOM among students has a
significant impact on student perceptions of instructor credibility and attractiveness.
Based on the results of this study, it is reasonable to suggest that comments about
instructors posted on public websites may ultimately effect students’ perceptions
enough to influence university sanctioned student evaluations of teaching, which
often play a major role in tenure and promotion decisions (Emery, Kramer, & Tian,
2003; Marsh, 1987). Furthermore, the results of this study point to the difficulty
instructors may face in improving their evaluations. As students increasingly utilize
online rating systems to make decisions and form impressions, self-sustaining cycles
may form, in which prospective students view unfavorable ratings of an instructor,
lean on such ratings in evaluating the instructor, then pass along consistent ratings of
the instructor to future students. The newly available RMP ‘‘Tell a Friend!’’ feature, in
which student users are invited to share professor ratings via e-mail, further evidences
the ease and speed with which computer-mediated WOM travels.
Additionally, this study demonstrates that a significant proportion of variance in
student perceptions of an instructor’s credibility and attractiveness can be determined
by factors outside the instructor’s immediate realm of control. In this case, despite the
fact that instructional performance was held constant across conditions, student
computer-mediated WOM about the instructor accounted for almost 20 percent of
the variability in student evaluations of the instructor. Moreover, as evidenced by the
results of the discriminant analysis, students’ perceptions of the instructor’s level of
desirability could be used as a relatively reliable predictor of the type of WOM
(positive, negative, or none) students had been exposed to. Although the role of
student-to-student interaction is often overlooked in instructional communication
literature (Nussbaum & Friedrich, 2005), the current findings demonstrate its
consequentiality in educational encounters. Because it is clear that students take what
their peers say about instructors and courses seriously, WOM (whether traditional or
computer-mediated) provides one fruitful conceptual avenue from which to further
explore student-to-student communication in the instructional context.
The results of Study 2 demonstrate that in addition to influencing student
perceptions of instructors, computer-mediated WOM also impacts student respon-
siveness to course subject matter in terms of affective learning and state motivation to
learn. A sizeable portion of the variability in student attitudes toward the content of a
target course (10%) was accounted for by the type of WOM students were exposed to.
Interestingly, although student recipients of positive RMP ratings reported more
affective learning and motivation than the other two groups, student recipients of
negative RMP ratings and those who received none did not differ significantly from
one another on these variables. Thus, for affective learning and state motivation to
learn, it may be the case that positive computer-mediated WOM is more influential
than negative computer-mediated WOM. Previous research investigating the relative
influence of positive versus negative WOM has yielded mixed results (Ahluwalia,
2002; Fiske, 1980; Mizerski, 1982). At least one study, however, suggests that positive
270 C. Edwards et al.

WOM produces a stronger consumer response under certain conditions. Holmes and
Lett (1977) lent support to the ‘‘positivity bias’’ by demonstrating that customers
exposed to positive stimuli/events were more likely to communicate their feelings to
others than were customers exposed to negative stimuli/events. Perhaps educators can
be cautiously optimistic that while levels of affective learning and motivation are
heightened by positive RMP ratings, they are not adversely affected by negative RMP
ratings. However, an alternative interpretation might suggest that the nonsignificant
difference between the reported state motivation levels of the negative RMP group
and the control group is attributable to an issue with statistical power. With the use of
a larger sample, the state motivation level of the negative RMP group could emerge as
significantly lower than that of the control group.
Furthermore, because student participants rated the target instructor and course in
a manner that was consistent with the valence of information they received prior to
viewing the taped performance (and inconsistent with the more moderate ratings
given by the control group), findings are suggestive of an association between
exposure to information appearing on sites like RMP and the employment of the
heuristic mode of processing. Perhaps, in their effort to reduce cognitive effort while
maximizing judgmental confidence about the instructor and course, participants
applied simple decision rules to the process of evaluation (e.g., ‘‘statements of
consensus from peers are accurate’’ or ‘‘web-based reports of teaching effectiveness
can be trusted’’). Moreover, previous research on the antecedents of processing modes
indicates that the conditions of the experiments used in this study would facilitate the
use of heuristic, rather than systematic, processing. In specific, the scenario
manufactured for participants in treatment conditions was one characterized by
relatively low motivation (as participants had little at stake for producing an accurate
appraisal of the instructor/course), high self-efficacy (as most students are familiar
with the process of providing evaluations of their teachers and courses and feel
qualified to do so), and high information sufficiency (as students were provided with
a videotaped sample of instructional performance as well as quantitative and
qualitative summaries of prior teaching effectiveness from a well-known online
instructor rating site).
Limitations and Future Directions
The findings of these studies should be interpreted in light of several limitations. The
first of these pertains to the contrived nature of experimental designs. The videotape
shown to participants contained a 12-minute lecture delivered by an instructor
unknown to them. Thus, when rating the instructor’s credibility and attractiveness,
student participants were limited to early impressions, which may have caused them
to rely more heavily on the computer-mediated WOM (RMP ratings) than they
would if given the opportunity to get to know an instructor over the course of an
entire semester. Likewise, this reasoning extends to student ratings of the course
content. As such, future research should examine the relationships between these
variables in more naturalistic conditions.
Computer-Mediated WOM and Student Perceptions 271

The discrepancy between the experimental situation and naturally occurring
conditions also has implications for any claims regarding student processing of
material from online instructor rating systems. In reality, students use sites like RMP
to solicit information about prospective instructors and to aid in the process of
course selection (Kindred & Mohammed, 2005). Because the judgments students
form in such situations hold actual consequences for their academic success, their
motivation to be accurate in such situations is likely higher than it was for
participants in the study. This may mean that students expend greater cognitive
resources (i.e., process information more systematically) when they use sites like RMP
in their daily lives. Future research is needed to test the specific claims of the
heuristic�systematic processing model in the context of computer-mediated WOM
and instructional communication.
A second limitation concerns the operational overlap in the measures of credibility
and attractiveness used to assess student perceptions of the instructor and those of
state motivation and affective learning used to assess student perceptions of course
material. The high correlations among affect-based measures such as these speak to
the difficulty in establishing their conceptual distinctiveness. Third, caution should be
exercised in generalizing the findings from this experiment as the sample comprised
chiefly 18- to 22-year-old Caucasian sophomores and juniors enrolled in commu-
nication courses at a large public institution. Felton et al. (2005) demonstrated that
there are significant differences in the usage of web-based student evaluations of
teachers among institutions and disciplines. Therefore, the study could be replicated
in a diversity of education contexts. Future research is needed to better understand
the influence of computer-mediated WOM (especially from popular websites such as
RateMyProfessors.com) on additional classroom outcomes and facets of the student�teacher relationship. Finally, RMP continues to incorporate new on-line features.
Newly added tools, such as the option for students to upload a photograph of their
instructor and to report their grade in the course, may prove to be interesting
variables to consider in future studies.
Notes
[1] Student evaluations of instructor physical attractiveness may be indirectly related to
measures of quality teaching. Previous research has attributed this peripheral relationship
to the operation of a ‘‘halo effect’’ in student evaluations of communication instruction (cf.
Feeley, 2002).
[2] The average easiness rating of social science professors in the U.S. is 3.2 (Felton et al., 2005).
Because easiness is not factored into the overall quality rating assigned to professors by RMP,
we held the rating of 3.2 constant across conditions.
[3] Although the overall quality ratings of 1.7 and 4.9 used for the positive and negative RMP
evaluations are not equidistant from the scale midpoint of 3.0, they approximate equidistant
intervals from the average overall quality rating of social science professors in the U.S., which
is consistently several tenths higher than 3.0 (Felton et al., 2005).
[4] The fourth author/videotaped actor is an assistant professor of communication and is well
versed in the literature of instructional communication. To deliver a teaching performance of
‘‘average quality,’’ he sought to incorporate influential instructional behaviors at a moderate
272 C. Edwards et al.

level. One indicator of the ‘‘averageness’’ of the lecture is the ratings of attractiveness (3.2 on
a 1�5 scale) and credibility (4.37 on a 1�7 scale) provided by the control group, which
received no information about the previous performance of the instructor prior to viewing
the tape. Additionally, the video stimulus was subjected to a manipulation check employing
21 undergraduate students asked to rate the instructor and the lecture as ‘‘above average,’’
‘‘average,’’ or ‘‘below average.’’ The vast majority rated both the instructor and the lecture as
average.
[5] In addition to the analyses reported in the Results section, we also conducted a series of one-
sample t tests to determine whether mean scores for each of the seven dependent variables in
the positive and negative RMP treatment groups differed significantly from scale midpoints.
Generally speaking, dependent variable means for the positive RMP condition were
significantly higher than the scale midpoints, and those of the negative RMP condition
were significantly lower than the scale midpoints. Detailed results of these analyses are
available upon request from the first author.
References
Ahluwalia, R. (2002). How prevalent is the negativity effect in consumer environments? Journal of
Consumer Research , 29 , 270�279.
Allen, M., Witt, P. L., & Wheeless, L. R. (2006). The role of teacher immediacy as a motivational
factor in student learning: Using meta-analysis to test a causal model. Communication
Education , 55 , 21�31.
Arndt, J. (1967). Role of product-related conversations in the diffusion of a new product. Journal of
Marketing Research , 4 , 291�295.
Arndt, J. (1968). Selective process in word-of-mouth. Journal of Advertising Research , 8 , 19�22.
Avtgis, T. A. (2001). Affective learning, teacher clarity, and student motivation as a function of
attributional confidence. Communication Research Reports , 18 , 345�353.
Bickart, B., & Schindler, R. M. (2001). Internet forum as influential sources of consumer
information. Journal of Interactive Marketing , 15 , 31�40.
Borgida, E., & Nisbett, R. E. (1977). The differential impact of abstract vs. concrete information on
decisions. Journal of Applied Social Psychology, 7 , 258�271.
Brann, M., Edwards, C., & Myers, S. A. (2005). Perceived instructor credibility and teaching
philosophy. Communication Research Reports , 22 , 217�226.
Brophy, J. (1987). Synthesis of research on strategies for motivating students to learn. Educational
Leadership , 45 , 40�48.
Brown, J. J., & Reingen, P. H. (1987). Social ties and word-of-mouth referral behavior. Journal of
Consumer Research , 14 , 350�362.
Brown, T. J., Barry, T. E., Dacin, P. A., & Gunst, R. F. (2005). Spreading the word: Investigating
antecedents of consumers’ positive word-of-mouth intentions and behaviors in a retailing
context. Journal of the Academy of Marketing Science , 33 , 123�138.
Burzynski, M. H., & Bayer, D. J. (1977). The effect of positive and negative prior information on
motion picture appreciation. Journal of Social Psychology, 101 , 215�218.
Bytwerk, R. L. (2005). The argument for genocide in Nazi propaganda. Quarterly Journal of Speech ,
91 , 37�62.
Carl, W. J. (2006). What’s all the buzz about? Everyday communication and the relational basis of
word-of-mouth and buzz marketing practices. Management Communication Quarterly, 19 ,
601�634.
Carrell, L. J., & Menzel, K. E. (1997). The impact of preparation and motivation on learning
performance. Communication Education , 46 , 262�272.
Chaiken, S. (1980). Heuristic versus systematic information processing and the use of source versus
message cues in persuasion. Journal of Personality and Social Psychology, 39 , 752�766.
Computer-Mediated WOM and Student Perceptions 273
Chaiken, S. (1987). The heuristic model of persuasion. In M. P. Zanna, J. M. Olson, & C. P. Herman
(Eds.), Social influence: The Ontario symposium (Vol. 5, pp. 3�39). Hillsdale, NJ: Erlbaum.
Chaiken, S., & Eagly, A. H. (1983). Communication modality as a determinant of persuasion: The
role of communicator salience. Journal of Personality and Social Psychology, 45 , 241�256.
Chaiken, S., Liberman, A., & Eagly, A. H. (1989). Heuristic and systematic processing within and
beyond the persuasion context. In J. S. Uleman & J. A. Bargh (Eds.), Unintended thought (pp.
212�252). New York: Guildford Press.
Chesebro, J. L., & McCroskey, J. C. (2001). The relationship of teacher clarity and immediacy with
student state receiver apprehension, affect, and cognitive learning. Communication Educa-
tion , 50 , 59�68.
Chory-Assad, R. M. (2002). Classroom justice: Perceptions of fairness as a predictor of student
motivation, learning, and aggression. Communication Quarterly, 50 , 58�77.
Christensen, L. J., & Menzel, K. E. (1998). The linear relationship between student reports of teacher
immediacy behaviors and perceptions of state motivation, and of cognitive, affective, and
behavioral learning. Communication Education , 47 , 82�90.
Christophel, D. (1990). The relationships among teacher immediacy behaviors, student motivation
and learning. Communication Education , 39 , 323�340.
Compton, J. A., & Pfau, M. (2004). Use of inoculation to foster resistance to credit card marketing
targeting college students. Journal of Applied Communication Research , 32 , 343�364.
Comstock, J., Rowell, E., & Bowers, J. W. (1995). Food for thought: Teacher nonverbal immediacy,
student learning and curvilinearity. Communication Education , 44 , 251�266.
Day, G. S. (1971). Attitude change, media, and word of mouth. Journal of Advertising Research , 11 ,
31�40.
Dillard, J. P., & Pfau, M. (Eds.) (2002). The persuasion handbook: Developments in theory and
research . Thousand Oaks, CA: Sage.
Eagly, A. H., & Chaiken, S. (1993). The psychology of attitudes . Fort Worth, TX: Harcourt Brace
Jovanovich.
Edwards, A., & Edwards, C. (2001). The impact of instructor verbal and nonverbal immediacy on
student perceptions of attractiveness and homophily. Journal on Excellence in College
Teaching , 12 , 5�16.
Edwards, C., & Myers, S. A. (2007). Perceived instructor credibility as a function of instructor
aggressive communication. Communication Research Reports , 24 , 47�53.
Emery, C. R., Kramer, T. R., & Tian, R. G. (2003). Return to academic standards: A critique of
student evaluations of teaching effectiveness. Quality Assurance in Education , 11 , 37�46.
Engel, J. E., Blackwell, R. D., & Kegerreis, R. J. (1969). How information is used to adopt an
innovation. Journal of Adverting Research , 9 , 3�8.
Feeley, T. H. (2002). Evidence of halo effects in student evaluations of communication instruction.
Communication Education , 51 , 225�236.
Felton, J., Mitchell, J., & Stinson, M. (2004). Web-based student evaluations of professors: The
relations between perceived quality, easiness and sexiness. Assessment & Evaluation in Higher
Education , 29 , 91�108.
Felton, J., Mitchell, J., & Stinson, M. (2005). Cultural differences in student evaluations of
professors. Academy of Business Education Conference Proceedings . Retrieved September 8,
2006, from http://www.abe.villanova.edu/proc2004/felton2.pdf
Fiske, S. T. (1980). Attention and weight in person perception: The impact of negative and extreme
behavior. Journal of Personality and Social Psychology, 38 , 889�906.
Frymier, A. B. (1994). A model of immediacy in the classroom. Communication Quarterly, 42 ,
133�144.
Frymier, A. B., & Houser, M. L. (2000). The teacher�student relationship as an interpersonal
relationship. Communication Education , 49 , 207�219.
Frymier, A. B., & Shulman, G. M. (1995). What’s in it for me?’’: Increasing content relevance to
enhance students’ motivation. Communication Education , 44 , 40�50.
274 C. Edwards et al.

Frymier, A. B., & Thompson, C. A. (1992). Perceived teacher affinity-seeking in relation to
perceived teacher credibility. Communication Education , 41 , 388�399.
Gilroy, M. (2003). Rate-a-prof systems: Here to stay; venting, or valuable consumer feedback? The
Hispanic Outlook in Higher Education , 13 , 10�12.
Gorham, J., & Christophel, D. M. (1990). The relationship of teachers’ use of humor in the
classroom to immediacy and student learning. Communication Education , 30 , 46�62.
Green, S. B., & Salkind, N. J. (2003). Using SPSS for Windows and Macintosh: Analyzing and
understanding data (3rd ed). Upper Saddle River, NJ: Prentice-Hall.
Harrison-Walker, J. L. (2001). The measurement of word-of-mouth communication and an
investigation of service quality and customer commitment as potential antecedents. Journal
of Service Research , 4 , 60�75.
Hendrix, K. G. (1997). Student perceptions of verbal and nonverbal cues leading to images of black
and white professor credibility. Howard Journal of Communication , 8 , 251�274.
Herr, P. M., Kardes, F. R., & Kim, J. (1991). Effects of word-of-mouth and product-attribute
information on persuasion: An accessibility-diagnosticity perspective. Journal of Consumer
Research , 17 , 454�462.
Holmes, J. H., & Lett, J. D., Jr. (1977). Product sampling and word of mouth. Journal of Advertising ,
17 , 35�40.
Howard, D. J., & Gengler, C. (2001). Emotional contagion effects on product attitudes. Journal of
Consumer Research , 28 , 189�201.
Katz, E., & Lazarsfeld, P. F. (1955). Personal influence; the part played by people in the flow of mass
communications . Glencoe, IL: Free Press.
Kearney, P. (1994). Affective learning. In R. B. Rubin, P. Palmgreen, & H. E. Sypher (Eds.),
Communication research measures: A sourcebook (pp. 81�85). New York: Guilford Press.
Kearney, P., Plax, T. G., & Wendt-Wasco, N. J. (1985). Teacher immediacy for affective learning in
divergent college classes. Communication Quarterly, 33 , 61�71.
Kerlinger, F., & Lee, H. B. (2000). Foundations of behavioral research . Fort Worth, TX: Harcourt
College.
Kerssen-Griep, J. (2001). Teacher communication activities relevant to student motivation:
Classroom facework and instructional communication competence. Communication Educa-
tion , 50 , 256�273.
Kindred, J., & Mohammed, S. N. (2005). He will crush you like an academic ninja: Exploring
teacher ratings on RateMyProfessors.com. Journal of Computer-Mediated Communication,
10 . Retrieved February 13, 2006, from http://jcmc.indiana.edu/vol10/issue3/kindred.html
Lewin, T. (2003, March 24). New online guides allow college students to grade their professors. New
York Times , p. A11.
Maheswaran, D., & Chaiken, S. (1991). Promoting systematic processing in low-motivation settings:
Effect of incongruent information on processing and judgment. Journal of Personality and
Social Psychology, 61 , 13�25.
Marsh, H. W. (1987). Students’ evaluations of university teaching: Research findings, methodo-
logical issues, and directions for future research. International Journal of Educational
Research , 11 , 253�388.
McCroskey, J. C. (1994). Assessment of affect toward communication and affect toward instruction
in communication. In S. Morreale & M. Brooks (Eds.), 1994 SCA summer conference
proceedings and prepared remarks: Assessing college student competence in speech communica-
tion . Annandale, VA: Speech Communication Association.
McCroskey, J. C., Fayer, J. M., Richmond, V. P., Sallinen, A., & Barraclough, R. A. (1996). A multi-
cultural examination of the relationship between nonverbal immediacy and affective
learning. Communication Quarterly, 44 , 297�307.
McCroskey, J. C., Hamilton, P. R., & Weiner, A. N. (1974). The effect of interaction behavior on
source credibility, homophily, and interpersonal attraction. Human Communication
Research , 1 , 42�52.
Computer-Mediated WOM and Student Perceptions 275

McCroskey, J. C., & McCain, T. A. (1974). The measurement of interpersonal attraction. Speech
Monographs , 41 , 261�266.
McCroskey, J. C., & Teven, J. J. (1999). Goodwill: A reexamination of the construct and its
measurement. Communication Monographs , 66 , 90�103.
McCroskey, J. C., & Young, T. J. (1981). Ethos and credibility: The construct and its measurement
after three decades. Central States Speech Journal , 32 , 24�34.
Mizerski, R. W. (1982). An attributional explanation of the disproportionate influence of
unfavorable information. Journal of Consumer Research , 9 , 301�310.
Myers, S. A. (2002). Perceived aggressive instructor communication and student state motivation,
learning, and satisfaction. Communication Reports , 15 , 113�121.
Myers, S. A. (2004). The relationship between perceived instructor credibility and college student
in-class and out-of-class communication. Communication Reports , 17 , 129�137.
Myers, S. A., & Bryant, L. E. (2004). College students’ perceptions of how instructors convey
credibility. Qualitative Research Reports in Communication , 5 , 22�27.
Myers, S. A., & Knox, R. L. (2000, April). The relationship between instructor argumentativeness and
verbal aggressiveness, and student state motivation, relevance, affective learning, and
satisfaction . Paper presented at the meeting of the Central States Communication
Association, Detroit, MI.
Myers, S. A., & Rocca, K. A. (2000). Students’ state motivation and instructors’ use of verbally
aggressive messages. Psychological Reports , 87 , 291�294.
Nadler, M. K., & Nadler, L. B. (2001). The roles of sex, empathy, and credibility in out-of-class
communication between faculty and students. Women’s Studies in Communication , 24 ,
241�261.
Nussbaum, J. F. (1992). Effective teacher behaviors. Communication Education , 41 , 167�180.
Nussbaum, J. F., & Friedrich, G. (2005). Instructional/developmental communication: Current
theory, research, and future trends. The Journal of Communication , 55 , 578�593.
Phelps, J. E., Lewis, R., Mobilio, L., Perry, D., & Raman, N. (2004). Viral marketing or electronic
word-of-mouth advertising: Examining consumer responses and motivations to pass along
email. Journal of Advertising Research , 45 , 333�348.
Pitt, L., F., Berthon, P. R., Watson, R. T., & Zinkhan, G. M. (2002). The Internet and the birth of real
consumer power. Business Horizons , 45 , 7�14.
Pogue, L. L., & AhYun, K. (2006). The effect of teacher nonverbal immediacy and credibility on
student motivation and affective learning. Communication Education , 55 , 331�344.
Rice, R. E., Stewart, L. P., & Hujber, M. (2000). Extending the domain of instructional effectiveness
assessment in student evaluations of communication courses. Communication Education , 49 ,
253�266.
Richins, M. L. (1983). Negative word-of-mouth by dissatisfied consumers: A pilot study. Journal of
Marketing , 47 , 68�78.
Richmond, V. P. (1990). Communication in the classroom: Power and motivation. Communication
Education , 39 , 181�195.
Rocca, K. A., & McCroskey, J. C. (1999). The interrelationship of student ratings of instructors’
immediacy, verbal aggressiveness, homophily, and interpersonal attraction. Communication
Education , 48 , 308�316.
Rodriguez, J. I., Plax, T. G., & Kearney, P. (1996). Clarifying the relationship between teacher
nonverbal immediacy and student cognitive learning: Affective learning as the central causal
mediator. Communication Education , 45 , 293�305.
Schrodt, P. (2003). Students’ appraisals of instructors as a function of students’ perceptions of
instructors’ aggressive communication. Communication Education , 52 , 106�121.
Shrum, L. J., & Bischak, V. D. (2001). Mainstreaming, resonance, and impersonal impact: Testing
moderators of the cultivation effect for estimates of crime risk. Human Communication
Research , 27 , 187�215.
276 C. Edwards et al.

Singhal, A., Rogers, E., & Mahajan, M. (1999). The Gods are drinking milk! Asian Journal of
Communication , 9 , 86�107.
Spangenberg, E. R., & Giese, J. L. (1997). An exploratory study of word-of-mouth communication
in a hierarchy of effects contest. Communication Research Reports , 14 , 88�96.
Statistics. (n.d.). RateMyProfessor.com homepage. Retrieved December 13, 2006 from http://
www.ratemyprofessors.com
Sultan, F., Farley, J. U., & Lehmann, D. R. (1990). A meta-analysis of applications of diffusion
models. Journal of Marketing Research , 27 , 70�77.
Sun, T., Youn, S., Wu, G., & Kuntaraporn, M. (2006). Online word-of-mouth (or mouse): An
exploration of its antecedents and consequences. Journal of Computer-Mediated Commu-
nication, 11 . Retrieved September 6, 2006 from http://jcmc.indiana.edu/vol11/issue4/
sun.html
Teven, J. J., & Herring, J. E. (2005). Teacher influence in the classroom: A preliminary investigation
of perceived instructor power, credibility, and student satisfaction. Communication Research
Reports , 22 , 235�246.
Teven, J. J., & McCroskey, J. C. (1997). The relationship of perceived teacher caring with student
learning and teacher evaluation. Communication Education , 46 , 1�9.
Thweatt, K. S., & McCroskey, J. C. (1998). The impact of teacher immediacy and misbehaviors on
teacher credibility. Communication Education , 47 , 348�358.
Trumbo, C. W. (1999). Heuristic�systematic information processing and risk judgment. Risk
Analysis , 19 , 391�400.
Trumbo, C. W. (2002). Information processing and risk perceptions: An adaptation of the
heuristic�systematic model. Journal of Communication , 52 , 367�382.
Turman, P. D., & Schrodt, P. (2005). The influence of instructional technology use on students’
affect: Do course designs and biological sex make a difference? Communication Studies , 56 ,
109�129.
Wanzer, M. B., & McCroskey, J. C. (1998). Teacher socio-communicative style as a correlate of
student affect toward teacher and course material. Communication Education , 47 , 43�52.
Wilhelm, W. B., & Comegys, C. (2004). Course selection decisions by students on campuses with
and without published teaching evaluations. Practical Assessment, Research & Evaluation, 9 .
Retrieved September 8, 2006 from http://PAREonline.net/getvn.asp?v�9&n�16
Witt, P. L., & Schrodt, P. (2006). The influence of instructional technology use and teacher
immediacy on student affect for teacher and course. Communication Reports , 19 , 1�15.
Zeithaml, V. A., Berry, L. L., & Parasuraman, A. (1993). The nature and determinants of customer
expectations of service. Journal of the Academy of Marketing Science , 21 , 1�12.
Zinkhan, G. M., Kwak, H., Morrison, M., & Peters, C. O. (2003). Web-based chatting: Consumer
communication in cyberspace. Journal of Consumer Psychology, 13 , 17�27.
Received September 29, 2006
Accepted January 23, 2007
Computer-Mediated WOM and Student Perceptions 277