students... instructors
TRANSCRIPT

ISBN: 0078111005Author: GarrisonTitle: Managerial Accounting 14e
Front endsheetsColor: 4cPages: 2,3
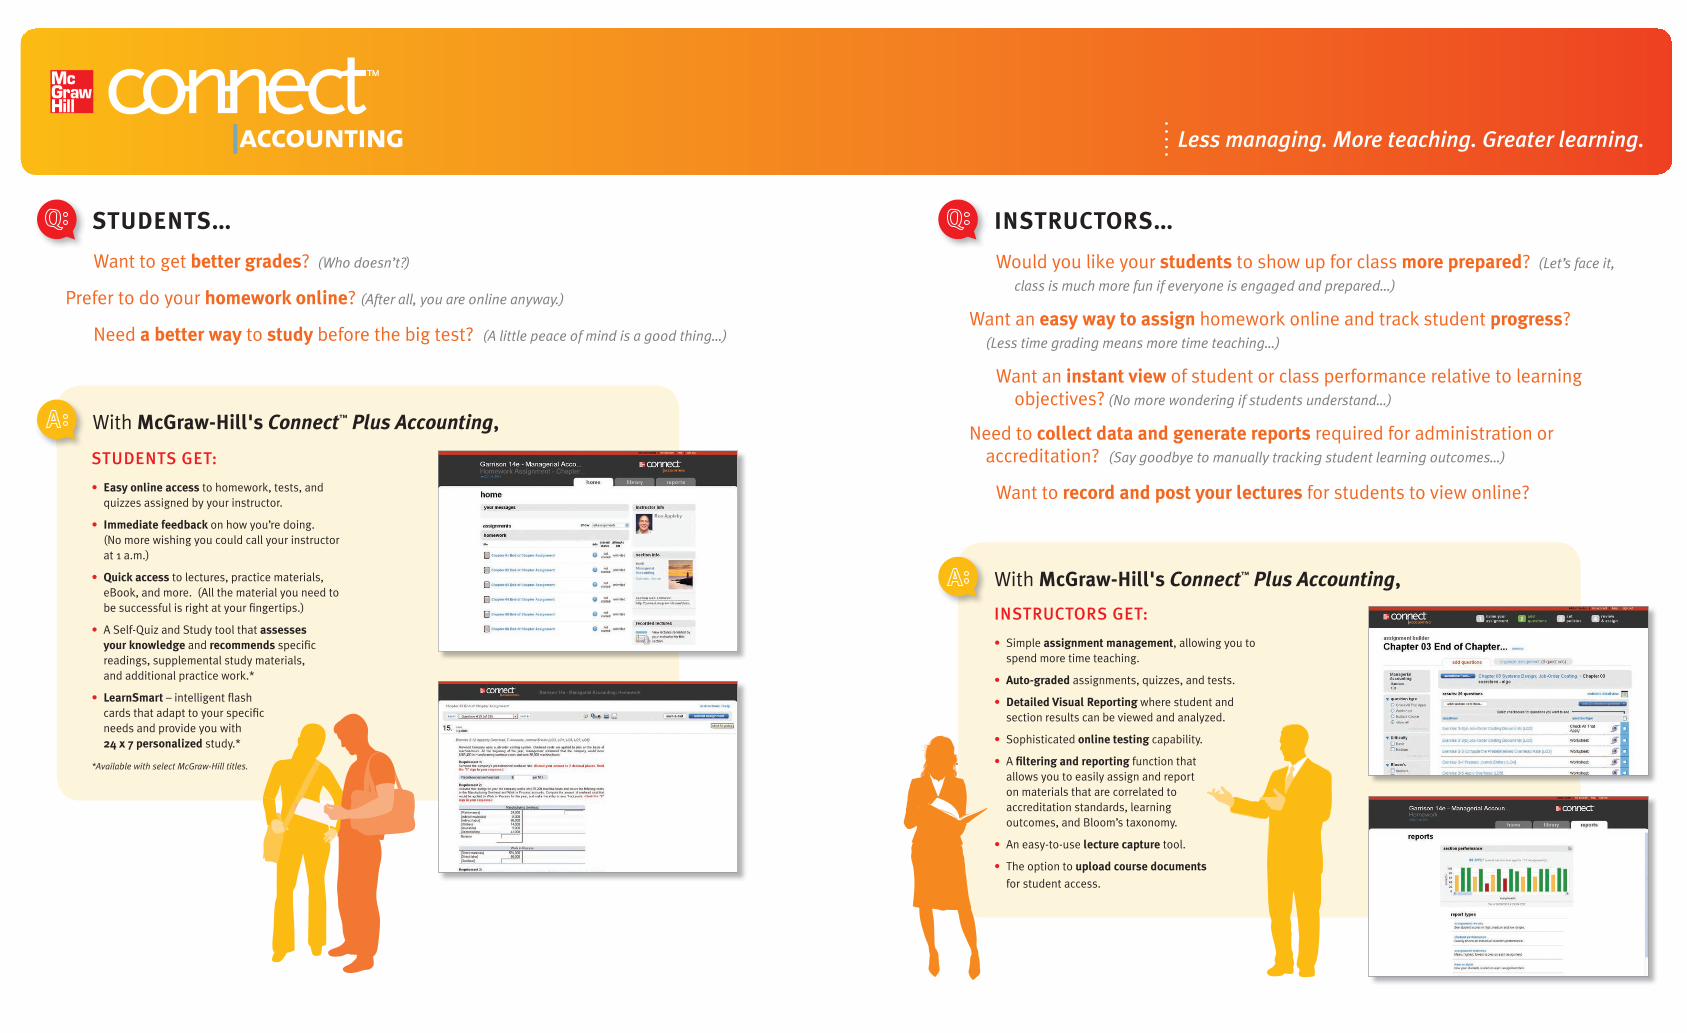
STUDENTS GET:
• Easy online access to homework, tests, and quizzes assigned by your instructor.
• Immediate feedback on how you’re doing. (No more wishing you could call your instructor at 1 a.m.)
• Quick access to lectures, practice materials, eBook, and more. (All the material you need to be successful is right at your fi ngertips.)
• A Self-Quiz and Study tool that assesses your knowledge and recommends specifi c readings, supplemental study materials, and additional practice work.*
• LearnSmart – intelligent fl ash cards that adapt to your specifi c needs and provide you with 24 x 7 personalized study.*
*Available with select McGraw-Hill titles.
With McGraw-Hill's Connect™ Plus Accounting,
INSTRUCTORS GET:
• Simple assignment management, allowing you to spend more time teaching.
• Auto-graded assignments, quizzes, and tests.
• Detailed Visual Reporting where student and section results can be viewed and analyzed.
• Sophisticated online testing capability.
• A fi ltering and reporting function that allows you to easily assign and report on materials that are correlated to accreditation standards, learning outcomes, and Bloom’s taxonomy.
• An easy-to-use lecture capture tool.
• The option to upload course documents
for student access.
With McGraw-Hill's Connect™ Plus Accounting,
Would you like your students to show up for class more prepared? (Let’s face it,
class is much more fun if everyone is engaged and prepared…)
Want an easy way to assign homework online and track student progress? (Less time grading means more time teaching…)
Want an instant view of student or class performance relative to learning objectives? (No more wondering if students understand…)
Need to collect data and generate reports required for administration or accreditation? (Say goodbye to manually tracking student learning outcomes…)
Want to record and post your lectures for students to view online?
Want to get better grades? (Who doesn’t?)
Prefer to do your homework online? (After all, you are online anyway.)
Need a better way to study before the big test? (A little peace of mind is a good thing…)
STUDENTS... INSTRUCTORS...
Less managing. More teaching. Greater learning.
ISBN: 0078111005Author: GarrisonTitle: Managerial Accounting
Front endsheetsColor: 4cPages: 4, Insert
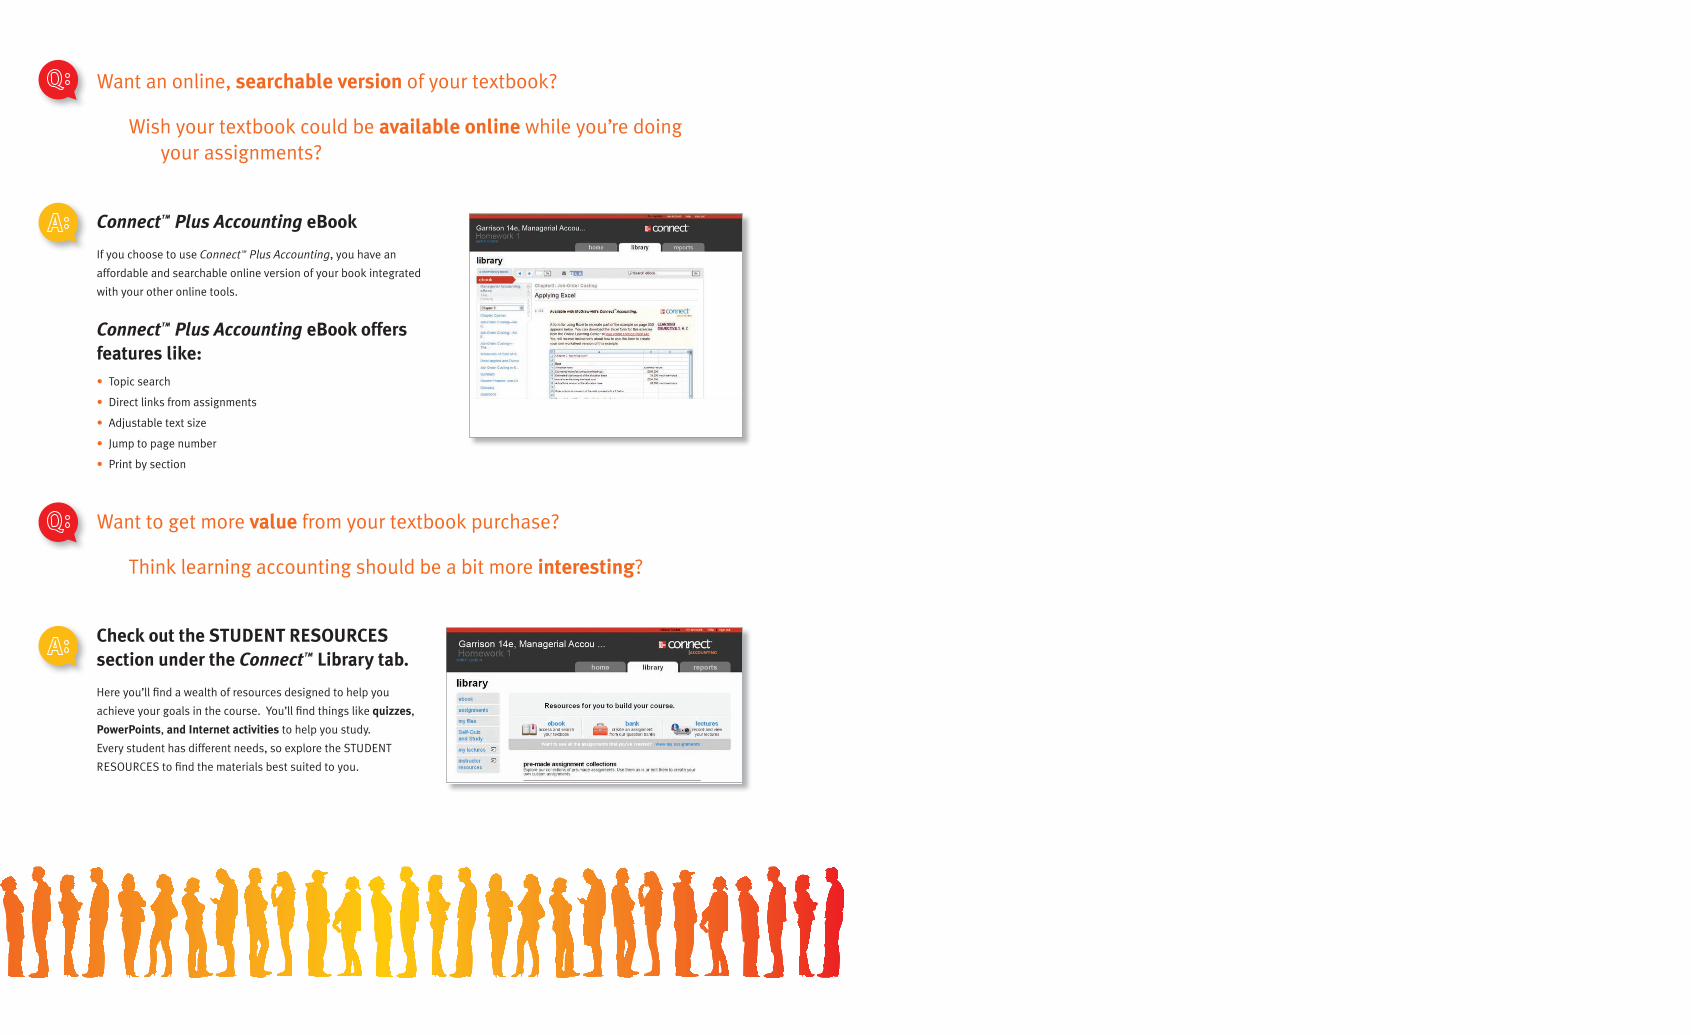
Want an online, searchable version of your textbook?
Wish your textbook could be available online while you’re doing your assignments?
Want to get more value from your textbook purchase?
Think learning accounting should be a bit more interesting?
Connect™ Plus Accounting eBook
If you choose to use Connect™ Plus Accounting, you have an
affordable and searchable online version of your book integrated
with your other online tools.
Connect™ Plus Accounting eBook offers features like:• Topic search
• Direct links from assignments
• Adjustable text size
• Jump to page number
• Print by section
Check out the STUDENT RESOURCES section under the Connect™ Library tab.
Here you’ll fi nd a wealth of resources designed to help you
achieve your goals in the course. You’ll fi nd things like quizzes,
PowerPoints, and Internet activities to help you study.
Every student has different needs, so explore the STUDENT
RESOURCES to fi nd the materials best suited to you.
Rev.Confi rming Pages
Managerial Accounting
gar11005_fm_i-xxxvi.indd igar11005_fm_i-xxxvi.indd i 27/11/10 3:20 PM27/11/10 3:20 PM

Rev.Confi rming Pages
gar11005_fm_i-xxxvi.indd iigar11005_fm_i-xxxvi.indd ii 27/11/10 3:20 PM27/11/10 3:20 PM

Rev.Confi rming Pages
Managerial Accounting
F o u r t e e n t h E d i t i o n
Ray H. Garrison , D.B.A., CPA Professor Emeritus Brigham Young University
Eric W. Noreen , Ph.D., CMA Professor Emeritus University of Washington
Peter C. Brewer , Ph.D., CPA Miami University—Oxford, Ohio
gar11005_fm_i-xxxvi.indd iiigar11005_fm_i-xxxvi.indd iii 27/11/10 3:21 PM27/11/10 3:21 PM
Rev.Confi rming Pages
MANAGERIAL ACCOUNTING
Published by McGraw-Hill/Irwin, a business unit of The McGraw-Hill Companies, Inc., 1221 Avenue
of the Americas, New York, NY, 10020. Copyright © 2012, 2010, 2008, 2006, 2003, 2000, 1997, 1994,
1991, 1988, 1985, 1982, 1979, 1976 by The McGraw-Hill Companies, Inc. All rights reserved. No part
of this publication may be reproduced or distributed in any form or by any means, or stored in a database
or retrieval system, without the prior written consent of The McGraw-Hill Companies, Inc., including,
but not limited to, in any network or other electronic storage or transmission, or broadcast for distance
learning.
Some ancillaries, including electronic and print components, may not be available to customers outside
the United States.
This book is printed on acid-free paper.
1 2 3 4 5 6 7 8 9 0 DOW/DOW 1 0 9 8 7 6 5 4 3 2 1
ISBN 978-0-07-811100-6
MHID 0-07-811100-5
Vice president and editor-in-chief: Brent Gordon Editorial director: Stewart MattsonPublisher: Tim VertovecSponsoring editor: Donna DillonExecutive director of development: Ann TorbertDevelopment editor: Katie JonesVice president and director of marketing: Robin J. ZwettlerMarketing director: Brad ParkinsSenior marketing manager: Kathleen KlehrVice president of editing, design, and production: Sesha BolisettyLead project manager: Pat FredericksonSenior buyer: Carol A. BielskiLead designer: Matthew BaldwinSenior photo research coordinator: Keri JohnsonSenior media project manager: Allison SouterMedia project manager: Cathy L. TepperCover image: © Getty ImagesTypeface: 10.5/12 Times RomanCompositor: Laserwords Private LimitedPrinter: R. R. Donnelley
Library of Congress Cataloging-in-Publication DataGarrison, Ray H.
Managerial accounting / Ray H. Garrison, Eric W. Noreen, Peter C. Brewer. — 14th ed.
p. cm.
Includes index.
ISBN-13: 978-0-07-811100-6 (alk. paper)
ISBN-10: 0-07-811100-5 (alk. paper)
1. Managerial accounting. I. Noreen, Eric W. II. Brewer, Peter C. III. Title.
HF5657.4.G37 2012
658.15’11—dc22 2010045770
www.mhhe.com
gar11005_fm_i-xxxvi.indd ivgar11005_fm_i-xxxvi.indd iv 27/11/10 3:22 PM27/11/10 3:22 PM

Rev.Confi rming Pages
Dedication To our families and to our many colleagues who use this book.
gar11005_fm_i-xxxvi.indd vgar11005_fm_i-xxxvi.indd v 27/11/10 3:22 PM27/11/10 3:22 PM

Rev.Confi rming Pages
Garrison Noreen Brewervi
Ray H. Garrison is emeritus professor of
accounting at Brigham Young University, Provo, Utah. He
received his BS and MS degrees from Brigham Young University
and his DBA degree from Indiana University.
As a certified public accountant, Professor Garrison has been
involved in management consulting work with both national
and regional accounting firms. He has published articles in
The Accounting Review, Management Accounting, and other
professional journals. Innovation in the classroom has earned Professor Garrison the
Karl G. Maeser Distinguished Teaching Award from Brigham Young University.
Eric W. Noreen has held appointments at
institutions in the United States, Europe, and Asia. He is emeritus
professor of accounting at the University of Washington.
He received his BA degree from the University of Washington
and MBA and PhD degrees from Stanford University. A
Certified Management Accountant, he was awarded a Certificate
of Distinguished Performance by the Institute of Certified
Management Accountants.
Professor Noreen has served as associate editor of The Accounting Review and the
Journal of Accounting and Economics. He has numerous articles in academic journals
including: the Journal of Accounting Research; The Accounting Review ; the Journal of Accounting and Economics; Accounting Horizons; Accounting, Organizations and Society; Contemporary Accounting Research; the Journal of Management Accounting Research; and the Review of Accounting Studies.
Professor Noreen has won a number of awards from students for his teaching.
About the Authors
gar11005_fm_i-xxxvi.indd vigar11005_fm_i-xxxvi.indd vi 27/11/10 3:22 PM27/11/10 3:22 PM

Rev.Confi rming Pages
viiManagerial Accounting Four teenth Edi t ion
Peter C. Brewer is a professor in the
Department of Accountancy at Miami University, Oxford, Ohio.
He holds a BS degree in accounting from Penn State University,
an MS degree in accounting from the University of Virginia, and
a PhD from the University of Tennessee. He has published more
than 30 articles in a variety of journals including: Management Accounting Research, the Journal of Information Systems, Cost Management, Strategic Finance, the Journal of Accountancy,
Issues in Accounting Education, and the Journal of Business Logistics.
Professor Brewer is a member of the editorial board of the Journal of Accounting Education and has served on the editorial board of Issues in Accounting Education. His
article “Putting Strategy into the Balanced Scorecard” won the 2003 International
Federation of Accountants’ Articles of Merit competition, and his articles “Using
Six Sigma to Improve the Finance Function” and “Lean Accounting: What’s It All
About?” were awarded the Institute of Management Accountants’ Lybrand Gold and
Silver Medals in 2005 and 2006. He has received Miami University’s Richard T.
Farmer School of Business Teaching Excellence Award and has been recognized on
two occasions by the Miami University Associated Student Government for “making
a remarkable commitment to students and their educational development.” He is a
leading thinker in undergraduate management accounting curriculum innovation and
is a frequent presenter at various professional and academic conferences.
Prior to joining the faculty at Miami University, Professor Brewer was employed
as an auditor for Touche Ross in the firm’s Philadelphia office. He also worked as
an internal audit manager for the Board of Pensions of the Presbyterian Church
(U.S.A.). He frequently collaborates with companies such as Harris Corporation,
Ghent Manufacturing, Cintas, Ethicon Endo-Surgery, Schneider Electric, Lenscrafters,
and Fidelity Investments in a consulting or case writing capacity.
gar11005_fm_i-xxxvi.indd viigar11005_fm_i-xxxvi.indd vii 27/11/10 3:22 PM27/11/10 3:22 PM

Rev.Confi rming Pages
Garrison Noreen Brewerviii
Let Garrison be Your Guide
For centuries, the lighthouse has provided guidance and safe passage
for sailors. Similarly, Garrison/Noreen/Brewer has successfully guided
millions of students through managerial accounting, helping them sail
smoothly through the course.
Decades ago, lighthouses were still being operated manually. In these
days of digital transformation, lighthouses are run using automatic lamp
changers and other modern devices. In much the same way, Garrison/
Noreen/Brewer has evolved over the years. Today, the Garrison book
not only guides students—accounting majors and other business majors
alike—safely through the course but is enhanced by a number of powerful
new tools to augment student learning and increase student motivation.
McGraw-Hill’s Connect™ Accounting offers a number of features to
facilitate student learning. Embedded within Connect Accounting, our NEW intelligent technology, LearnSmart, offers flashcards that personalize
the study experience by constantly adapting, emphasizing the concepts a
student still needs to master. NEW animated, narrated Guided Examples
connected to practice exercises within Connect Accounting provide a
step-by-step walkthrough of a similar exercise, assisting students when they
need it most. Connect Accounting’s NEW Self-Quiz and Study provides a
study plan that recommends specific readings from the text, supplemental
narrated PowerPoints, and practice exercises that will improve students’
understanding of each learning objective. Finally, the student library
within Connect gives students access to additional resources, such as
forms for the NEW Applying Excel feature, Interactive Presentations for
each learning objective, an electronic version of the textbook, and more.
Just as the lighthouse continues to provide reliable guidance to seafarers,
the Garrison/Noreen/Brewer book continues its tradition of helping students
sail successfully through managerial accounting by always focusing on
three important qualities: relevance, accuracy, and clarity.
It is the ‘Bible’ of Managerial Accounting.
Mark Motluck , Anderson University
An excellent choice for a fi rst course in
managerial accounting. Steven Huddart ,
Penn State
Garrison is the gold standard
of all accounting texts. Gene Johnson , Clark College
gar11005_fm_i-xxxvi.indd viiigar11005_fm_i-xxxvi.indd viii 27/11/10 3:22 PM27/11/10 3:22 PM
Rev.Confi rming Pages
ixManagerial Accounting Four teenth Edi t ion
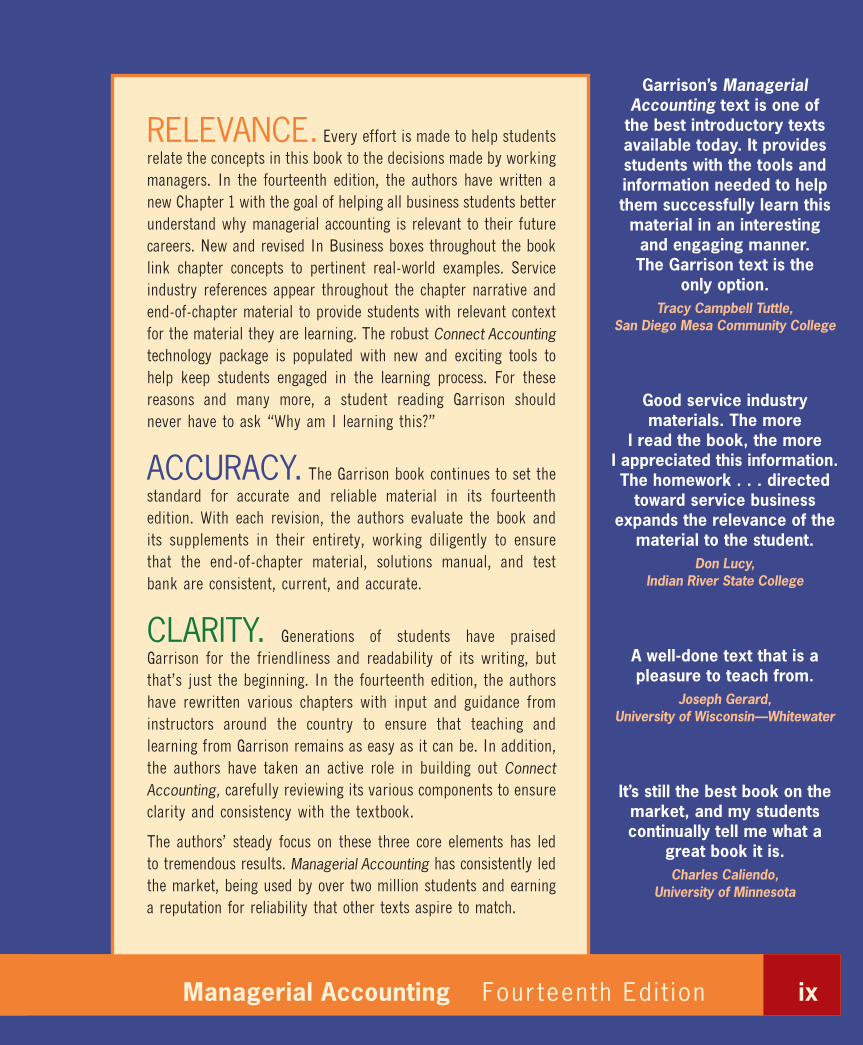
Garrison’s Managerial Accounting text is one of
the best introductory texts available today. It provides students with the tools and information needed to help them successfully learn this
material in an interesting and engaging manner. The Garrison text is the
only option. Tracy Campbell Tuttle ,
San Diego Mesa Community College
Good service industry materials. The more
I read the book, the more I appreciated this information. The homework . . . directed
toward service business expands the relevance of the
material to the student. Don Lucy ,
Indian River State College
A well-done text that is a pleasure to teach from.
Joseph Gerard , University of Wisconsin—Whitewater
It’s still the best book on the market, and my students continually tell me what a
great book it is. Charles Caliendo ,
University of Minnesota
RELEVANCE. Every effort is made to help students
relate the concepts in this book to the decisions made by working
managers. In the fourteenth edition, the authors have written a
new Chapter 1 with the goal of helping all business students better
understand why managerial accounting is relevant to their future
careers. New and revised In Business boxes throughout the book
link chapter concepts to pertinent real-world examples. Service
industry references appear throughout the chapter narrative and
end-of-chapter material to provide students with relevant context
for the material they are learning. The robust Connect Accounting
technology package is populated with new and exciting tools to
help keep students engaged in the learning process. For these
reasons and many more, a student reading Garrison should
never have to ask “Why am I learning this?”
ACCURACY. The Garrison book continues to set the
standard for accurate and reliable material in its fourteenth
edition. With each revision, the authors evaluate the book and
its supplements in their entirety, working diligently to ensure
that the end-of-chapter material, solutions manual, and test
bank are consistent, current, and accurate.
CLARITY. Generations of students have praised
Garrison for the friendliness and readability of its writing, but
that’s just the beginning. In the fourteenth edition, the authors
have rewritten various chapters with input and guidance from
instructors around the country to ensure that teaching and
learning from Garrison remains as easy as it can be. In addition,
the authors have taken an active role in building out Connect Accounting, carefully reviewing its various components to ensure
clarity and consistency with the textbook.
The authors’ steady focus on these three core elements has led
to tremendous results. Managerial Accounting has consistently led
the market, being used by over two million students and earning
a reputation for reliability that other texts aspire to match.
gar11005_fm_i-xxxvi.indd ixgar11005_fm_i-xxxvi.indd ix 27/11/10 3:23 PM27/11/10 3:23 PM

Rev.Confi rming Pages
Garrison Noreen Brewerx
Job-Order Costing 113
Applying Excel
Available with McGraw-Hill’s Connect™ Accounting .
The Excel worksheet form that appears below is to be used to recreate part of the example on
page 104. Download the workbook containing this form from the Online Learning Center at www.
mhhe.com/garrison14e. On the website you will also receive instructions about how to use this worksheet form.
You should proceed to the requirements below only after completing your worksheet.
Required: 1. Check your worksheet by changing the estimated total amount of the allocation base in the
Data area to 60,000 machine-hours, keeping all of the other data the same as in the original
example. If your worksheet is operating properly, the predetermined overhead rate should
now be $5.00 per machine-hour. If you do not get this answer, find the errors in your work-
sheet and correct them.
How much is the underapplied (overapplied) manufacturing overhead? Did it change?
Why or why not?
2. Determine the underapplied (overapplied) manufacturing overhead for a different company
with the following data:
Allocation base . . . . . . . . . . . . . . . . . . . . . . . . . . . . . . . . . . . Machine-hoursEstimated manufacturing overhead cost . . . . . . . . . . . . . . . . $100,000Estimated total amount of the allocation base . . . . . . . . . . . 50,000 machine-hoursActual manufacturing overhead cost . . . . . . . . . . . . . . . . . . $90,000Actual total amount of the allocation base . . . . . . . . . . . . . . 40,000 machine-hours
LEARNING OBJECTIVES 1, 4, 7
gar11005_ch03_083-140.indd 113 11/11/10 11:28 AM
Managerial Accounting includes pedagogical elements
that engage and instruct students without cluttering the pages or interrupting
student learning. Garrison’s key pedagogical tools enhance and support students’
understanding of the concepts rather than compete with the narrative for their
attention.
Garrison’s
NEW to the fourteenth edition of Garrison!
Applying Excel This NEW and exciting end-of-chapter feature links the power of Excel with managerial accounting concepts by illustrating how Excel functionality can
be used to better understand accounting data. Applying
Excel goes beyond plugging numbers into a template by
providing students with an opportunity to build their
own Excel worksheets and formulas. Students are then
asked “what if” questions in which they analyze not
only how related pieces of accounting data affect each
other but why they do. Applying Excel immediately
precedes the Exercises in twelve of the fifteen chapters
in the book and is also integrated with McGraw-Hill’s Connect™ Accounting, allowing students to
practice their skills online with algorithmically generated
datasets.
An excellent pedagogical feature that helps further reinforce students’ knowledge of key concepts in the text book, while strengthening students’ Excel skills that are so important in
the work place. This will further enhance an already excellent text. Marianne L. James , California State University, Los Angeles
[Applying Excel is] an excellent way for students to programmatically develop spreadsheet skills without having to be taught spreadsheet techniques by the
instructor. A signifi cant associated benefi t is that students gain more exposure to the dynamics of accounting information by working with what-if scenarios.
Earl Godfrey , Gardner–Webb University
gar11005_fm_i-xxxvi.indd xgar11005_fm_i-xxxvi.indd x 27/11/10 3:23 PM27/11/10 3:23 PM

Rev.Confi rming Pages
xiManagerial Accounting Four teenth Edi t ion
I like how you engage the reader with the “Business Focus” at the beginning
of the chapter. Kathy Crusto-Way ,
Tarrant County College
This textbook speaks to today’s student with
Excel-based visuals, discussions on hot topics, such as
corporate responsibility, and examples from recognizable companies. It also prepares students for business and
CPA and CMA examinations. Alison Jill Brock ,
Imperial Valley College
Opening Vignette Each chapter opens with a Business Focus feature that provides a real-world example
for students, allowing them to see how the
chapter’s information and insights apply to
the world outside the classroom. Learning Objectives alert students to what they
should expect as they progress through the
chapter.
335
Planning for a Crisis—Civil War Preservation Trust
The Civil War Preservation Trust (CWPT) is a private, nonprofit organization with 70,000 mem-bers that works to preserve the nation’s remaining Civil War battlefields—many of which are threatened by commercial devel-opment such as shopping cen-ters, houses, industrial parks, and casinos. To forestall devel-opment, the CWPT typically pur-chases the land or development
rights to the land. The CWPT has saved over 25,000 acres from development, includ-ing, for example, 698 acres of battlefield at Gettysburg.
CWPT’s management team was particularly concerned about the budget proposal for 2009, which was to be presented to the board of directors in the fall of 2008. The CWPT is wholly supported by contributions from its members and many of those members had been adversely affected by the ongoing financial crisis that followed the collapse of the subprime mortgage market. Consequently, the funds that would be available for operations in 2009 were particularly difficult to predict. Accordingly, the budget for 2009 contained three variations based on progressively pessimistic eco-nomic assumptions. The more pessimistic budgets were called contingent budgets. As 2008 progressed and member contributions declined somewhat from previous lev-els, CWPT switched to the first contingent budget. This contingent budget required a number of actions to reduce costs including a hiring freeze and a salary freeze, but maintained an aggressive program of protecting battlefield acreage through purchases of land and development rights. Fortunately, the CWPT did not have to switch to the most pessimistic budget—which would have involved layoffs and other extraordinary cost-saving measures.
Instead of reacting in a panic mode to unfavorable developments, CWPT used the budgeting process to carefully plan in advance for a number of possible contingencies. ■
Sources: Communications with James Lighthizer, president, and David Duncan, director of membership and development, Civil War Preservation Trust; and the CWPT website, civilwar.org.
Profit Planning
BU
SIN
ES
S F
OC
US
8
Ch
ap
te
r
After studying Chapter 8, you should be able to:
LO1 Understand why organizations budget and the processes they use to create budgets.
LO2 Prepare a sales budget, including a schedule of expected cash collections.
LO3 Prepare a production budget.
LO4 Prepare a direct materials budget, including a schedule of expected cash disbursements for purchases of materials.
LO5 Prepare a direct labor budget.
LO6 Prepare a manufacturing overhead budget.
LO7 Prepare a selling and administrative expense budget.
LO8 Prepare a cash budget.
LO9 Prepare a budgeted income statement.
LO10 Prepare a budgeted balance sheet.
LEARNING OBJECTIVES
gar11005_ch08_335-382.indd 335 18/11/10 4:37 PM
Powerful Pedagogy
A text the students will enjoy reading.
Ruth W. Epps , Virginia Commonwealth University
gar11005_fm_i-xxxvi.indd xigar11005_fm_i-xxxvi.indd xi 27/11/10 3:23 PM27/11/10 3:23 PM
Rev.Confi rming Pages
Garrison Noreen Brewerxii
In Business Boxes These helpful boxed features offer a glimpse
into how real companies use the managerial
accounting concepts discussed within the
chapter. Each chapter contains from three to
fourteen of these current examples.
Managerial Accounting in Action Vignettes These vignettes depict cross-
functional teams working
together in real-life settings,
working with the products
and services that students
recognize from their own
lives. Students are shown
step-by-step how accounting
concepts are implemented
in organizations and how these concepts are applied to solve everyday
business problems. First, “The Issue” is introduced through a dialogue;
the student then walks through the implementation process; finally, “The
Wrap-up” summarizes the big picture.
I found the text to be thorough and
well organized. I was particularly impressed
with the numerous real-world examples included in the “in business” boxes to make the topical discussions more
meaningful. Jerry Thorne , North Carolina
A & T State University
p
I N B U S I N E S S THE ZIPCAR COMES TO COLLEGE CAMPUSES Zipcar is a car sharing service based in Cambridge, Massachusetts. The company serves 13 cities and 120 university campuses. Members pay a $50 annual fee plus $7 an hour to rent a car. They can use their iPhones to rent a car, locate it in the nearest Zipcar parking lot, unlock it using an access code, and drive it off the lot. This mixed cost arrangement is attractive to customers who need a car infrequently and wish to avoid the large cash outlay that comes with buying or leasing a vehicle.
Source: Jefferson Graham, “An iPhone Gets Zipcar Drivers on Their Way,” USA Today, September 30, 2009, p. 3B.
gar11005_ch02_024-082.indd 42 02/11/10 4:31 PM
Flexible Budgets and Performance Analysis 393
Victoria: Let me show you what I’ve got. [Victoria shows Rick the flexible budget per-
formance report in Exhibit 9–7 .] I simply used the cost formulas to update the budget
to reflect the increase in client-visits you experienced in March. That allowed me to
come up with a better benchmark for what the costs should have been.
Rick: That’s what you labeled the “flexible budget based on 1,100 client-visits”?
Victoria: That’s right. Your original budget was based on 1,000 client-visits, so it
understated what some of the costs should have been when you actually served 1,100
customers.
Rick: That’s clear enough. These spending variances aren’t quite as shocking as the
variances on my first report.
Victoria: Yes, but you still have an unfavorable variance of $2,360 for client gratuities.
Rick: I know how that happened. In March there was a big Democratic Party fundrais-
ing dinner that I forgot about when I prepared the March budget. To fit all of our
regular clients in, we had to push them through here pretty fast. Everyone still got
top-rate service, but I felt bad about not being able to spend as much time with each
customer. I wanted to give my customers a little extra something to compensate them
for the less personal service, so I ordered a lot of flowers, which I gave away by the
bunch.
Victoria: With the prices you charge, Rick, I am sure the gesture was appreciated.
Rick: One thing bothers me about the report. When we discussed my costs before, you
called rent, liability insurance, and employee health insurance fixed costs. How can I
have a variance for a fixed cost? Doesn’t fixed mean that it doesn’t change?
Victoria: We call these costs fixed because they shouldn’t be affected by changes in the level of activity. However, that doesn’t mean that they can’t change for other
reasons. Also, the use of the term fixed also suggests to people that the cost can’t be
controlled, but that isn’t true. It is often easier to control fixed costs than variable
costs. For example, it would be fairly easy for you to change your insurance bill by
adjusting the amount of insurance you carry. It would be much more difficult for you
to significantly reduce your spending on hairstyling supplies—a variable cost that is
a necessary part of serving customers.
Rick: I think I understand, but it is confusing.
Victoria: Just remember that a cost is called variable if it is proportional to activity; it
is called fixed if it does not depend on the level of activity. However, fixed costs can
change for reasons unrelated to changes in the level of activity. And controllability
has little to do with whether a cost is variable or fixed. Fixed costs are often more
controllable than variable costs.
MANAGERIAL ACCOUNTING IN
ACTION The Wrap-up
I N B U S I N E S S HOTELS MANAGE REVENUE AND COST LEVERS AMID RECESSION When the economy spiraled downward in 2009, it forced hotel chains to make tough decisions in an effort to achieve their profit goals. For example, Wyndham Hotels and Resorts decided to take sewing kits, mouthwash, and showercaps out of its rooms—instead, requiring customers to ask for these amenities at the front desk. Intercontinental Hotels Group stopped delivering newspapers to loyalty-program members’ rooms; Marriott International cut back its breakfast offerings; and the Ritz-Carlton reduced operating hours at its restaurants, spas, and retail shops. In addition, many hotel chains reduced their rental rates.
A flexible budget performance report can help hotel managers analyze how the changes described above impact net operating income. It isolates activity, revenue, and spending variances that help identify the underlying reasons for differences between budgeted and actual net operating income.
Source: Sarah Nassauer, “No Showercaps at the Inn,” The Wall Street Journal, January 22, 2009, pp. D1–D2.
gar11005_ch09_383-417.indd 393 18/11/10 2:35 PM
gar11005_fm_i-xxxvi.indd xiigar11005_fm_i-xxxvi.indd xii 27/11/10 3:23 PM27/11/10 3:23 PM

Rev.Confi rming Pages
Applying Excel
Available with McGraw-Hill’s Connect™ Accounting.
The Excel worksheet form that appears on the next page is to be used to recreate the Review Prob-
lem on pages 398–399. Download the workbook containing this form from the Online Learning
Center at www.mhhe.com/garrison14e. On the website you will also receive instructions about how to use this worksheet form.
You should proceed to the requirements below only after completing your worksheet.
Required: 1. Check your worksheet by changing the revenue in cell D4 to $16.00; the cost of ingredients
in cell D5 to $6.50; and the wages and salaries in cell B6 to $10,000. The activity variance
for net operating income should now be $850 U and the spending variance for total expenses
should be $410 U If you do not get these answers find the errors in your worksheet and
LEARNING OBJECTIVES 1, 2, 3, 4
gar11005_ch09_383-417.indd 400 18/11/10 2:35 PM
in cell D5 to $6.50; and the wages and salaries in cell B6 to $10,000. The activity variance
$f i i h ld b $850 U d h di i f l
Exercises
All applicable exercises are available with McGraw-Hill’s Connect™ Accounting .
EXERCISE 9–1 Prepare a Flexible Budget [LO1] Gator Divers is a company that provides diving services such as underwater ship repairs to clients
in the Tampa Bay area. The company’s planning budget for March appears below:
Gator DiversPlanning Budget
For the Month Ended March 31
gar11005_ch09_383-417.indd 402 18/11/10 2:35 PM
Problems
All applicable problems are available with McGraw-Hill’s Connect™ Accounting .
PROBLEM 9–20 Activity and Spending Variances [LO1, LO2, LO3] You have just been hired by SecuriDoor Corporation, the manufacturer of a revolutionary new
garage door opening device. The president has asked that you review the company’s costing sys-
tem and “do what you can to help us get better control of our manufacturing overhead costs.” You
find that the company has never used a flexible budget, and you suggest that preparing such a
budget would be an excellent first step in overhead planning and control.
After much effort and analysis, you determined the following cost formulas and gathered the
following actual cost data for April:
gar11005_ch09_383-417.indd 410 18/11/10 2:38 PM
following actual cost data for April:
Cases
All applicable cases are available with McGraw-Hill’s Connect™ Accounting .
CASE 2–25 Scattergraph Analysis; Selection of an Activity Base [LO4] Mapleleaf Sweepers of Toronto manufactures replacement rotary sweeper brooms for the large
sweeper trucks that clear leaves and snow from city streets. The business is seasonal, with the largest
demand during and just preceding the fall and winter months. Because there are so many different
kinds of sweeper brooms used by its customers, Mapleleaf Sweepers makes all of its brooms to order.
gar11005_ch02_024-082.indd 65 02/11/10 4:33 PM
xiiiManagerial Accounting Four teenth Edi t ion
End-of-Chapter Material Managerial Accounting has earned a reputation for the best
end-of-chapter practice material of any text on the market.
Our problem and case material continues to conform to
AACSB recommendations and makes a great starting point
for class discussions and group projects. When Ray Garrison
first wrote Managerial Accounting, he started with the end-
of-chapter material, then wrote the narrative in support of it.
This unique approach to textbook authoring not only ensured
consistency between the end-of-chapter material and text
content but also underscored Garrison’s fundamental belief
in the importance of applying theory through practice. It
is not enough for students to read, they must also understand. To this
day, the guiding principle of that first edition remains, and Garrison’s
superior end-of-chapter material continues to provide accurate, current,
and relevant practice for students.
In this edition, the authors have added a NEW end-of-chapter feature called
Applying Excel. Applying Excel integrates key course concepts and Excel—a
software students will encounter in the workplace, whether they go into
accounting or any other business major. With Applying Excel, students not
only gain practice working with Excel software, they also learn how Excel
can be used to present accounting data and how that data is interrelated.
For more information on this exciting new feature, please see page x.
A proven, comprehensive text that effectively covers
important managerial accounting topics. [The]
end-of-chapter materials are second to none.
Jerry Kreuze , Western Michigan University
This text is a comprehensive and very readable
presentation of essential introductory managerial
accounting topics. The end-of-chapter materials are
excellent and enhance the chapter material.
Darlene Coarts , University of Northern Iowa
gar11005_fm_i-xxxvi.indd xiiigar11005_fm_i-xxxvi.indd xiii 27/11/10 3:23 PM27/11/10 3:23 PM

Rev.Confi rming Pages
Garrison Noreen Brewerxiv
Author-Written Supplements Unlike other managerial accounting texts, the book’s authors write
all of the major supplements, ensuring a perfect fit between text
and supplements. For more information on Managerial Accounting’ssupplements package, see page xxi.
• Instructor’s Manual
• Test bank
• Solutions Manual
• Workbook/Study Guide
Utilizing the Icons To reflect our service-based economy, the text is replete
with examples from service-based businesses. A helpful icon
distinguishes service-related examples in the text.
The IFRS icon highlights content that may be affected by
the impending change to IFRS and possible convergence
between U.S. GAAP and IFRS.
Ethics assignments and examples serve as a reminder that
good conduct is vital in business. Icons call out content
that relates to ethical behavior for students.
The writing icon denotes problems that require students to
use critical thinking as well as writing skills to explain their
decisions.
An Excel icon alerts students that spreadsheet templates are
available for use with select problems and cases.
Garrison’s Managerial Accounting is one of the most well-written
managerial accounting textbooks that I have
ever used or reviewed in my 30-year career as a
professor of management accounting. The problem
material is excellent, the ancillary material
is outstanding, and the publisher support is
unequaled. The on-line homework system is
superior to all that I have used or reviewed.
Olen L. Greer , Missouri State University
This is a tremendously well-organized and written text that is full of real world examples. Complex topics are explained in a simple and yet detailed fashion.
Matt Muller , Adirondack Community College
This is still the best managerial accounting
book out there for accounting and non-accounting students! Alfred C Greenfield , Jr.,
High Point University
gar11005_fm_i-xxxvi.indd xivgar11005_fm_i-xxxvi.indd xiv 27/11/10 3:24 PM27/11/10 3:24 PM

Rev.Confi rming Pages
xvManagerial Accounting Four teenth Edi t ion
New to the Fourteenth Edition
Faculty feedback helps us continue to improve Managerial Accounting. In response to reviewer suggestions, the
authors have made the following changes to the text:
• A NEW Applying Excel feature has been added to Chapters 2–13. Applying Excel gives students the
opportunity to practice using Excel formulas to build their own worksheets. They are then asked a series of
“what if” questions, all of which illustrate the relationship among various pieces of accounting data. The Applying
Excel feature links directly to the concepts introduced in the chapter, providing students with an invaluable
opportunity to apply what they have learned using a software they will use throughout their careers, whether
they become an accountant or not.
• Chapter 1 has been completely overhauled to help all business students better understand why managerial
accounting is relevant to their future careers.
• Chapter 2 has been extensively rewritten to include coverage of mixed costs and contribution format income
statements. The redundant coverage of the schedule of cost of goods manufactured has been eliminated so that
it is now only covered in the Job-Order Costing chapter. The comparison of financial and managerial accounting
has been moved to Chapter 1.
• Chapter 14 This chapter has been completely overhauled to simplify the process of creating a statement of
cash flows.
• New In Business boxes have been added throughout to provide relevant and updated real-world examples
for use in classroom discussion and to support student understanding of key concepts as they read through a
chapter.
• The end-of-chapter practice material has been updated throughout.
Chapter 1This chapter has been completely rewritten to better motivate all business students to take an interest in managerial accounting and to appreciate its relevance to their future careers. The new version of Chapter 1 answers three questions: (1) What is Managerial Accounting? (2) Why Does Managerial Accounting Matter to Your Career? and (3) What Skills Do Managers Need to Succeed? It also retains coverage of two topics important to all managers: (1) ethics in business and (2) corporate social responsibility.
Chapter 2This chapter has been completely revised to achieve three objectives. First, we eliminated redundant coverage of the schedule
of cost of goods manufactured, which in previous editions was covered in Chapter 2 as well as the Job-Order Costing chapter. Now this topic is covered only once in the Job-Order Costing chapter using normal costing principles. Second, we moved the coverage of mixed costs, scattergraph plots, and the high-low method from the Cost Behavior chapter to Chapter 2. This enables instructors to introduce cost estimation earlier in the course. The least-squares regression appendix has also been moved from the Cost Behavior chapter to Chapter 2. Third, we moved coverage of traditional and contribution format income statements for merchandising companies from the Cost Behavior chapter to Chapter 2. This enables instructors to introduce contribution format income statements earlier in the course. Using merchandising companies as the initial
gar11005_fm_i-xxxvi.indd xvgar11005_fm_i-xxxvi.indd xv 27/11/10 3:25 PM27/11/10 3:25 PM
Rev.Confi rming Pages
Garrison Noreen Brewerxvi
platform for comparing income statement formats provides an easily understood (student-friendly) introduction to this topic. The more complex arena of manufacturing cost accounting is covered in later chapters such as the Job-Order Costing and Variable Costing chapters. The Cost Behavior chapter has been completely eliminated given that its key learning objectives have been transferred to Chapter 2. The appendix dealing with further classification of labor costs has been moved from Chapter 2 to the Job-Order Costing chapter.
Chapter 3In this chapter, we adjusted the learning objectives to provide a more logical progression from computing an overhead rate (LO1), to applying overhead cost to jobs (LO2), and then to computing a job cost (LO3). We also added a cost formula approach to computing predetermined overhead rates. We were able to do this because the high-low method is now covered in Chapter 2. We deleted what were formerly learning objectives 1 and 2 from the prior edition of the book and incorporated an exhibit formerly from Chapter 2 that provides a conceptual overview of manufacturing cost flows.
Chapter 6The coverage of variable and absorption costing has been reorganized so that variable costing is discussed first, followed by absorption costing. Discussing variable costing first (rather than absorption costing) is consistent with the title of the chapter, which focuses on variable costing as a tool for management. The coverage of segmented income statements has been moved from Chapter 12 in the prior edition of the book to this chapter. The common theme that now joins together the chapter’s two main topics is the contribution format income statement. The chapter now demonstrates how the contribution format is used for Variable Costing income statements and how it can be used for segmented income statements.
Chapter 10This chapter’s general model for standard cost variance analysis has been reorganized to more clearly integrate with the variance analysis framework introduced in the prior chapter. The prior chapter introduces a framework for computing activity and spending variances within organizations that do not use standard costing. The revised general model in this chapter extends the
framework from the prior chapter and explains how it can be used to break down spending variances into quantity and price variances.
Chapter 11This chapter has been renamed and reorganized. The new title is Performance Measurement in Decentralized Organizations. It is now organized in three main sections. The first section discusses financial performance measures for investment centers. The second section discusses nonfinancial operating performance measures. The third section explains how the balanced scorecard framework can be used to pull together financial and nonfinancial measures into one strategy-driven performance measurement system. Also, the coverage of segmented income statements was moved to an earlier chapter.
Chapter 12The title of this chapter has been changed from Relevant Costs for Decision Making to Differential Analysis: The Key to Decision Making. This change acknowledges that revenues as well as costs can be relevant to decisions. We have also improved the discussion related to utilization of a constrained resource. The prior edition of the book had one learning objective related to this topic, whereas now we break down the discussion of this topic into two learning objectives. The first learning objective focuses on determining the most profitable use of a constraining resource, and the second learning objective focuses on calculating the value of obtaining more of the constrained resource. We expanded the discussion related to the latter learning objective.
Chapter 14The chapter has been rewritten to simplify the process of preparing a statement of cash flows. We have added Exhibit 14–4, which succinctly summarizes the main points that students need to understand to prepare a statement of cash flows and revised Exhibit 14–1 so that it provides a more student-friendly definition of operating, investing, and financing activities than in previous editions. We have replaced the worksheet method with an approach that students can use to more efficiently solve end-of-chapter problems and also replaced the two walkthroughs of the Nordstrom example (simplified and full-fledged) with one walkthrough. We have also expanded the discussion related to interpreting the statement of cash flows.
gar11005_fm_i-xxxvi.indd xvigar11005_fm_i-xxxvi.indd xvi 27/11/10 3:25 PM27/11/10 3:25 PM

Rev.Confi rming Pages
xviiManagerial Accounting Four teenth Edi t ion
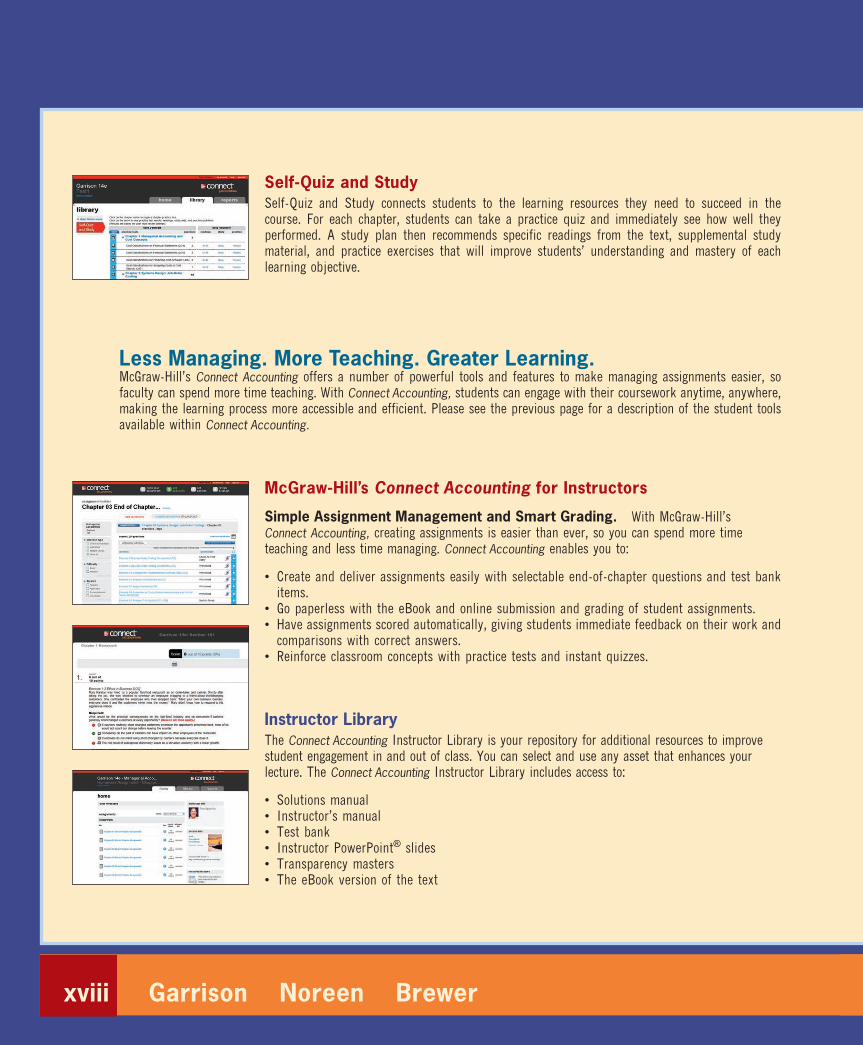
McGraw-Hill’s Connect™ Accounting McGraw-Hill’s Connect™ Accounting is an online assignment and assessment solution that connects you with the tools and resources necessary to achieve success through faster learning, more efficient studying, and higher retention of knowledge.
Online AssignmentsMcGraw-Hill’s Connect Accounting helps students learn more efficiently by providing feedback and practice material when and where they need it. Connect Accounting grades homework automatically and gives immediate feedback on any questions students may have missed.
Student LibraryThe Connect Accounting Student Library gives students access to additional resources such as recorded lectures, Self-Quiz and Study practice materials, an eBook, and more.
Guided ExamplesGuided Examples, embedded within Connect Accounting, provide a narrated, animated, step-by-step walkthrough of select exercises similar to those assigned. These short presentations provide reinforcement when students need it most.
LearnSmartLearnSmart, an adaptive self-study technology that is housed within Connect Accounting, helps students make the best use of their study time. It provides a seamless combination of practice, assessment, and remediation with a focus on the conceptual understanding students will need to succeed in the course. LearnSmart offers intelligent flashcards that personalize the study experience by constantly adapting, emphasizing the concepts the student still needs to master. LearnSmart can be assigned within Connect together with quantitative end-of-chapter material to provide comprehensive and balanced homework for students.
A Market-Leading Book Deserves Market-Leading Technology
gar11005_fm_i-xxxvi.indd xviigar11005_fm_i-xxxvi.indd xvii 27/11/10 3:25 PM27/11/10 3:25 PM
Rev.Confi rming Pages
Garrison Noreen Brewerxviii
Less Managing. More Teaching. Greater Learning. McGraw-Hill’s Connect Accounting offers a number of powerful tools and features to make managing assignments easier, so faculty can spend more time teaching. With Connect Accounting, students can engage with their coursework anytime, anywhere, making the learning process more accessible and efficient. Please see the previous page for a description of the student tools available within Connect Accounting.
McGraw-Hill’s Connect Accounting for Instructors
Simple Assignment Management and Smart Grading. With McGraw-Hill’s Connect Accounting, creating assignments is easier than ever, so you can spend more time teaching and less time managing. Connect Accounting enables you to:
• Create and deliver assignments easily with selectable end-of-chapter questions and test bank items.
• Go paperless with the eBook and online submission and grading of student assignments. • Have assignments scored automatically, giving students immediate feedback on their work and
comparisons with correct answers. • Reinforce classroom concepts with practice tests and instant quizzes.
Instructor Library The Connect Accounting Instructor Library is your repository for additional resources to improve student engagement in and out of class. You can select and use any asset that enhances your lecture. The Connect Accounting Instructor Library includes access to:
• Solutions manual • Instructor’s manual • Test bank • Instructor PowerPoint® slides • Transparency masters • The eBook version of the text
Self-Quiz and StudySelf-Quiz and Study connects students to the learning resources they need to succeed in the course. For each chapter, students can take a practice quiz and immediately see how well they performed. A study plan then recommends specific readings from the text, supplemental study material, and practice exercises that will improve students’ understanding and mastery of each learning objective.
gar11005_fm_i-xxxvi.indd xviiigar11005_fm_i-xxxvi.indd xviii 27/11/10 3:25 PM27/11/10 3:25 PM
Rev.Confi rming Pages
xixManagerial Accounting Four teenth Edi t ion
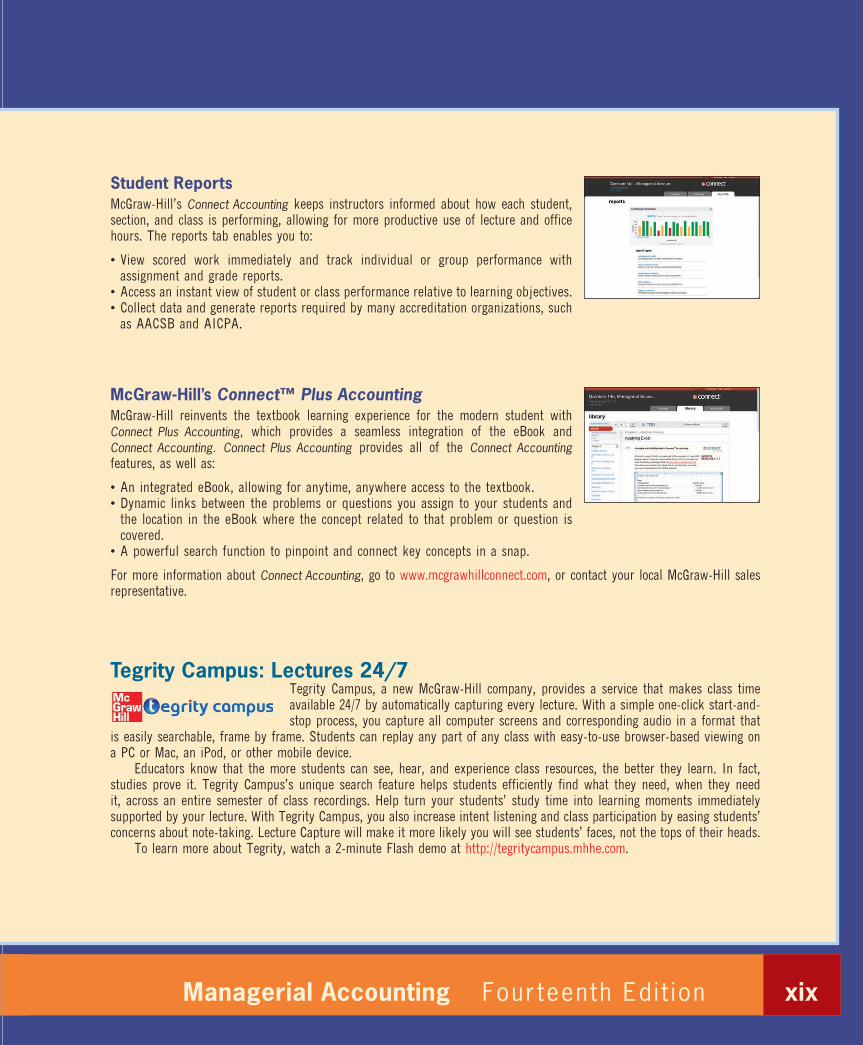
Student Reports McGraw-Hill’s Connect Accounting keeps instructors informed about how each student, section, and class is performing, allowing for more productive use of lecture and office hours. The reports tab enables you to:
• View scored work immediately and track individual or group performance with assignment and grade reports.
• Access an instant view of student or class performance relative to learning objectives. • Collect data and generate reports required by many accreditation organizations, such
as AACSB and AICPA.
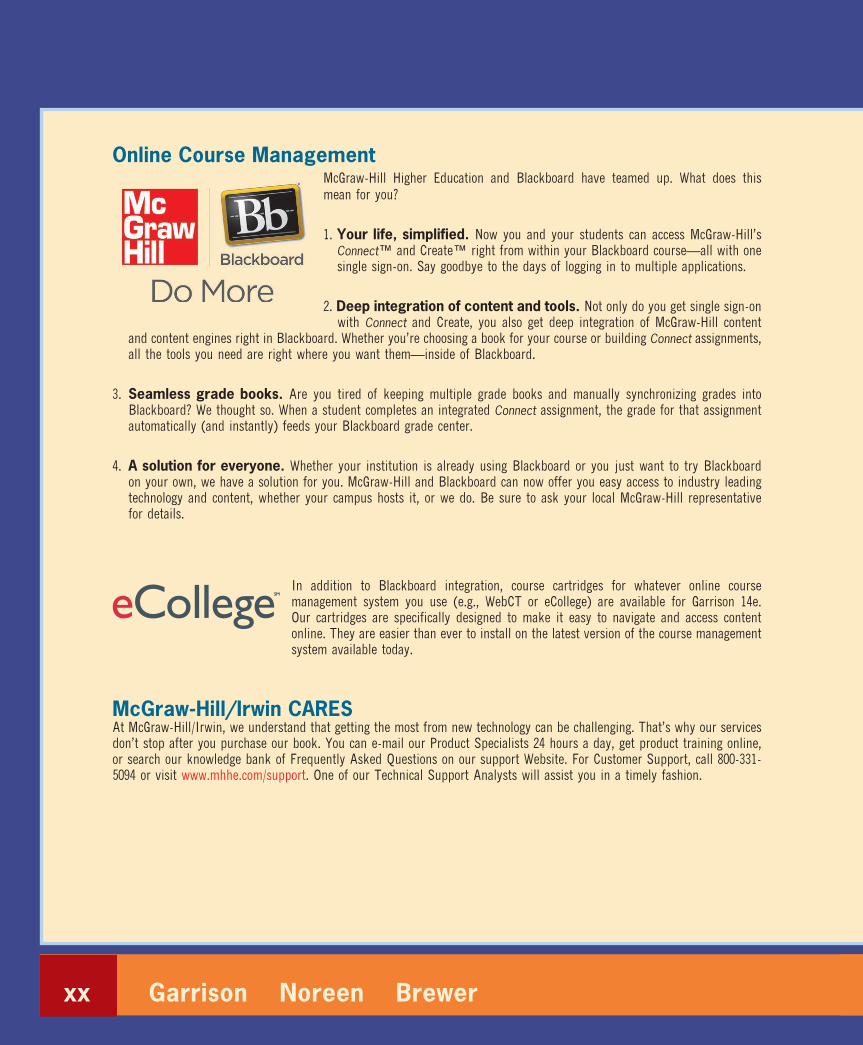
McGraw-Hill’s Connect™ Plus Accounting McGraw-Hill reinvents the textbook learning experience for the modern student with Connect Plus Accounting, which provides a seamless integration of the eBook and Connect Accounting. Connect Plus Accounting provides all of the Connect Accounting features, as well as:
• An integrated eBook, allowing for anytime, anywhere access to the textbook. • Dynamic links between the problems or questions you assign to your students and
the location in the eBook where the concept related to that problem or question is covered.
• A powerful search function to pinpoint and connect key concepts in a snap.
For more information about Connect Accounting, go to www.mcgrawhillconnect.com , or contact your local McGraw-Hill sales representative.
Tegrity Campus: Lectures 24/7 Tegrity Campus, a new McGraw-Hill company, provides a service that makes class time available 24/7 by automatically capturing every lecture. With a simple one-click start-and-stop process, you capture all computer screens and corresponding audio in a format that
is easily searchable, frame by frame. Students can replay any part of any class with easy-to-use browser-based viewing on a PC or Mac, an iPod, or other mobile device.
Educators know that the more students can see, hear, and experience class resources, the better they learn. In fact, studies prove it. Tegrity Campus’s unique search feature helps students efficiently find what they need, when they need it, across an entire semester of class recordings. Help turn your students’ study time into learning moments immediately supported by your lecture. With Tegrity Campus, you also increase intent listening and class participation by easing students’ concerns about note-taking. Lecture Capture will make it more likely you will see students’ faces, not the tops of their heads.
To learn more about Tegrity, watch a 2-minute Flash demo at http://tegritycampus.mhhe.com.
gar11005_fm_i-xxxvi.indd xixgar11005_fm_i-xxxvi.indd xix 27/11/10 3:25 PM27/11/10 3:25 PM
Rev.Confi rming Pages
Garrison Noreen Brewerxx
Online Course Management McGraw-Hill Higher Education and Blackboard have teamed up. What does this
mean for you?
1. Your life, simplified. Now you and your students can access McGraw-Hill’s Connect™ and Create™ right from within your Blackboard course—all with one single sign-on. Say goodbye to the days of logging in to multiple applications.
2. Deep integration of content and tools. Not only do you get single sign-on with Connect and Create, you also get deep integration of McGraw-Hill content
and content engines right in Blackboard. Whether you’re choosing a book for your course or building Connect assignments, all the tools you need are right where you want them—inside of Blackboard.
3. Seamless grade books. Are you tired of keeping multiple grade books and manually synchronizing grades into Blackboard? We thought so. When a student completes an integrated Connect assignment, the grade for that assignment automatically (and instantly) feeds your Blackboard grade center.
4. A solution for everyone. Whether your institution is already using Blackboard or you just want to try Blackboard on your own, we have a solution for you. McGraw-Hill and Blackboard can now offer you easy access to industry leading technology and content, whether your campus hosts it, or we do. Be sure to ask your local McGraw-Hill representative for details.
In addition to Blackboard integration, course cartridges for whatever online course management system you use (e.g., WebCT or eCollege) are available for Garrison 14e. Our cartridges are specifically designed to make it easy to navigate and access content online. They are easier than ever to install on the latest version of the course management system available today.
McGraw-Hill/Irwin CARES At McGraw-Hill/Irwin, we understand that getting the most from new technology can be challenging. That’s why our services don’t stop after you purchase our book. You can e-mail our Product Specialists 24 hours a day, get product training online, or search our knowledge bank of Frequently Asked Questions on our support Website. For Customer Support, call 800-331-5094 or visit www.mhhe.com/support. One of our Technical Support Analysts will assist you in a timely fashion.
gar11005_fm_i-xxxvi.indd xxgar11005_fm_i-xxxvi.indd xx 27/11/10 3:25 PM27/11/10 3:25 PM
Rev.Confi rming Pages
Assurance of Learning Ready Many educational institutions today are focused on the notion of
assurance of learning, an important element of some accreditation
standards. Managerial Accounting, 14e, is designed specifically to support your assurance of learning initiatives with a simple, yet
powerful, solution.
Each test bank question for Managerial Accounting, 14e, maps
to a specific chapter learning outcome/objective listed in the text.
You can use our test bank software, EZ Test, to easily query for
learning outcomes/objectives that directly relate to the learning
objectives for your course. You can then use the reporting
features of EZ Test to aggregate student results in similar
fashion, making the collection and presentation of assurance of
learning data simple and easy.
AACSB Statement The McGraw-Hill Companies, Inc., is a proud corporate member
of AACSB International. Recognizing the importance and value
of AACSB accreditation, we have sought to recognize the
curricula guidelines detailed in AACSB standards for business
accreditation by connecting selected questions in Managerial Accounting, 14e, to the general knowledge and skill guidelines
found in the AACSB standards. The statements contained in
Managerial Accounting, 14e, are provided only as a guide for
the users of this text. The AACSB leaves content coverage and
assessment clearly within the realm and control of individual
schools, the mission of the school, and the faculty. The AACSB
does also charge schools with the obligation of doing assessment
against their own content and learning goals. While Managerial Accounting, 14e, and its teaching package make no claim of
any specific AACSB qualification or evaluation, we have, within
Managerial Accounting, 14e, labeled selected questions according to the six general knowledge and skills areas. The labels or tags
within Managerial Accounting, 14e, are as indicated. There are,
of course, many more within the test bank, the text, and the
teaching package which might be used as a “standard” for your
course. However, the labeled questions are suggested for your
consideration.
McGraw-Hill’s Connect™ Accounting
McGraw-Hill’s Connect™ Accounting offers a number of powerful tools and features to
make managing your classroom easier. Connect Accounting with
Garrison 14e offers enhanced features and technology to help
both you and your students make the most of your time inside
and outside the classroom. See page xvii for more details.
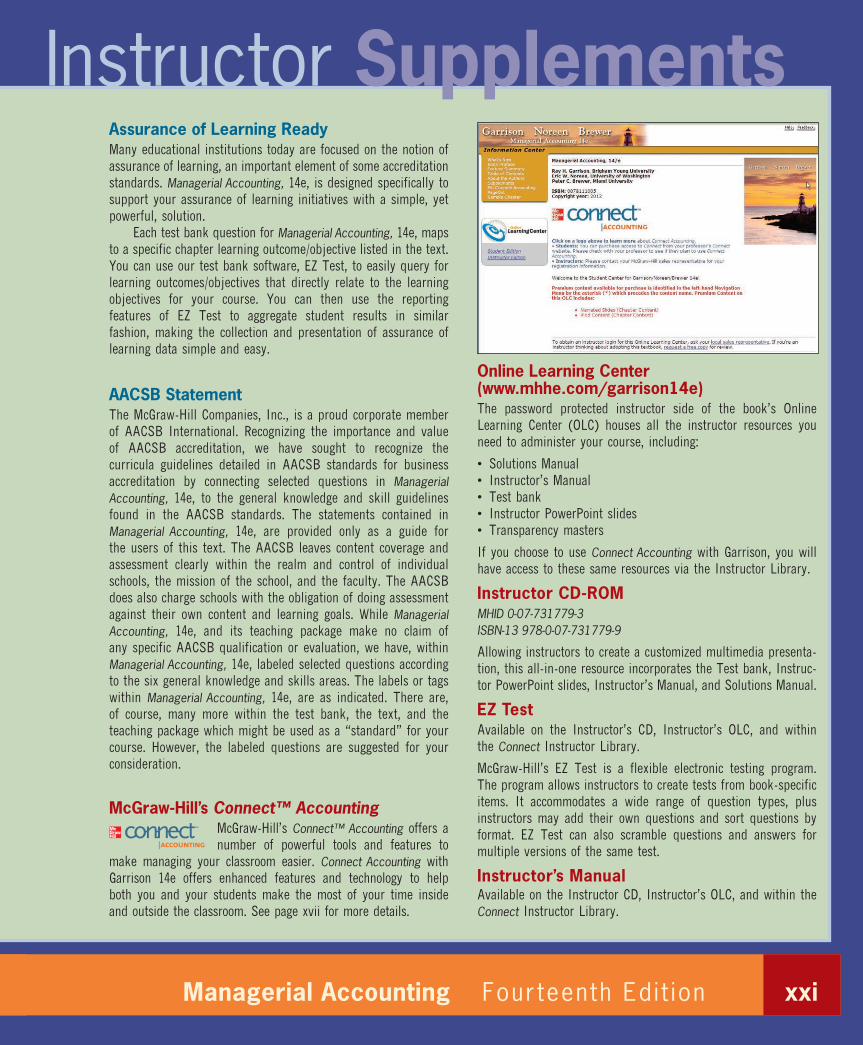
Online Learning Center ( www.mhhe.com/garrison14e ) The password protected instructor side of the book’s Online
Learning Center (OLC) houses all the instructor resources you
need to administer your course, including:
• Solutions Manual
• Instructor’s Manual
• Test bank
• Instructor PowerPoint slides
• Transparency masters
If you choose to use Connect Accounting with Garrison, you will
have access to these same resources via the Instructor Library.
Instructor CD-ROM MHID 0-07-731779-3
ISBN-13 978-0-07-731779-9
Allowing instructors to create a customized multimedia presenta-
tion, this all-in-one resource incorporates the Test bank, Instruc-
tor PowerPoint slides, Instructor’s Manual, and Solutions Manual.
EZ Test Available on the Instructor’s CD, Instructor’s OLC, and within
the Connect Instructor Library.
McGraw-Hill’s EZ Test is a flexible electronic testing program.
The program allows instructors to create tests from book-specific
items. It accommodates a wide range of question types, plus
instructors may add their own questions and sort questions by
format. EZ Test can also scramble questions and answers for
multiple versions of the same test.
Instructor’s Manual Available on the Instructor CD, Instructor’s OLC, and within the
Connect Instructor Library.
Instructor Supplements
xxiManagerial Accounting Four teenth Edi t ion
gar11005_fm_i-xxxvi.indd xxigar11005_fm_i-xxxvi.indd xxi 27/11/10 3:25 PM27/11/10 3:25 PM

Rev.Confi rming Pages
Extensive chapter-by-chapter lecture notes help with classroom
presentations and contain useful suggestions for presenting key
concepts and ideas. This manual is coordinated with the PowerPoint
slides, making lesson planning even easier.
Print Test Bank Volume 1:
MHID 0-07-731782-3 ISBN-13 978-0-07-731782-9
Volume 2:
MHID 0-07-731783-1 ISBN-13 978-0-07-731783-6
Over 2,000 questions are organized by chapter and include true/
false, multiple-choice, and problems. The test bank includes
Garrison Noreen Brewerxxii
worked-out solutions, and all items have been tied to AACSB-
AICPA standards and Bloom’s Taxonomy categories.
Solutions Manual Available on the Instructor’s CD, Instructor’s OLC, and within the
Connect Instructor Library.
This supplement contains completely worked-out solutions to all
assignment material. In addition, the manual contains suggested
course outlines and a listing of exercises, problems, and cases
scaled according to difficulty and estimated time for completion.
Solutions to the NEW Applying Excel feature are housed in the
same location as the Solutions Manual and include the completed
Excel forms.
gar11005_fm_i-xxxvi.indd xxiigar11005_fm_i-xxxvi.indd xxii 27/11/10 3:25 PM27/11/10 3:25 PM

Rev.Confi rming Pages
McGraw-Hill’s Connect™ Accounting McGraw-Hill’s Connect™ Accounting helps
prepare you for your future by enabling
faster learning, more efficient studying, and higher retention of
knowledge. See page xvii for more details.
CourseSmart CourseSmart is a new way to find and buy eTextbooks. At
CourseSmart you can save up to 45 percent off the cost of a
print textbook, reduce your impact on the environment, and
gain access to powerful Web tools for learning. CourseSmart
has the largest selection of eTextbooks available anywhere,
offering thousands of the most commonly adopted textbooks
from a wide variety of higher education publishers. CourseSmart
eTextbooks are available in one standard online reader with full
text search, notes and highlighting, and e-mail tools for sharing
notes between classmates.
Online Learning Center www.mhhe.com/garrison14e The Online Learning Center (OLC) follows Managerial Accounting chapter by chapter, offering all kinds of supplementary help for
you as you read.
The OLC includes the following resources to help you study more
efficiently:
• NEW Applying Excel Forms
• Online Quizzes
• Practice Tests
• Internet Exercises
• Check Figures
• Student PowerPoint slides
• Narrated PowerPoint lectures
• Excel Templates
• iPod Content
If your instructor chooses to use Connect Accounting in this
course, you will have access to these same resources via the
Student Library.
Applying Excel Forms available on the OLC and in the Connect Student Library.
This NEW and exciting feature has been added to Chapters
2-13 of the text. Applying Excel gives you the opportunity to
build your own Excel worksheet using Excel formulas. You are
then asked to answer “what if” questions, all of which illustrate
the relationship among various pieces of accounting data. The
Applying Excel feature links directly to the concepts introduced
in the chapter, providing you with an invaluable opportunity to
apply what you have learned utilizing an application you will use
throughout your career.
Workbook/Study Guide MHID: 0-07-731784-X ISBN-13: 978-0-07-731784-3
This printed study aid provides suggestions for studying chapter
material, summarizes essential points in each chapter, and tests
your knowledge using self-test questions and exercises.
Working Papers MHID: 0-07-731785-8 ISBN-13: 978-0-07-731785-0
This printed study aid contains forms that help you organize
your solutions to homework problems.
iPod Content Available on the OLC and in the Connect Student Library.
Students can visit the Online Learning Center at www.mhhe
.com/garrison14e to download our iPod content. For each chapter
of the book they will be able to download narrated lecture
presentations, managerial accounting videos, and even self-
quizzes designed for use on various versions of iPods. It makes
review and study time as easy as putting on earphones.
Check Figures Available on the OLC and in the Connect Student Library.
These provide key answers for selected problems and cases.
Student Supplements
xxiiiManagerial Accounting Four teenth Edi t ion
gar11005_fm_i-xxxvi.indd xxiiigar11005_fm_i-xxxvi.indd xxiii 27/11/10 3:25 PM27/11/10 3:25 PM
Rev.Confi rming Pages
Garrison Noreen Brewerxxiv
Acknowledgments Suggestions have been received from many of our colleagues throughout the world. Each of those who
have offered comments and suggestions has our thanks.
The efforts of many people are needed to develop and improve a text. Among these people are the reviewers
and consultants who point out areas of concern, cite areas of strength, and make recommendations
for change. In this regard, the following professors provided feedback that was enormously helpful in
preparing the fourteenth edition of Managerial Accounting:
Helen Adams, University of Washington Akinloye Akindayomi, University Of Massachusetts–Dartmouth David Albrecht, Bowling Green State University Natalie Allen, Texas A & M University Vern Allen, Central Florida Community College Shamir Ally, DeSales University Jane Austin, Oklahoma City University John Babich, Kankakee Community College Ibolya Balog, Cedar Crest College Scottie Barty, Northern Kentucky University Eric Bashaw, University of Nevada–Las Vegas Sharon Bell, University of North Carolina–Pembroke Scott Berube, University of New Hampshire Kelly Blacker, Mercy College Phillip Blanchard, The University of Arizona Charles Blumer, Saint Charles Community College Alison Jill Brock, Imperial Valley College Rada Brooks, University of California–Berkeley Myra Bruegger, Southeastern Community College Georgia Buckles, Manchester Community College Esther Bunn, Stephen S. Austin State University Laurie Burney, Mississippi State University Marci Butterfield, University of Utah–Salt Lake City Charles Caliendo, University of Minnesota Donald Campbell, Brigham Young University-Idaho Tracy Campbell Tuttle, San Diego Mesa Community College Don Campodonico, Notre Dame de Namur University Dana Carpenter, Madison Area Technical College Wanda Causseaux, Valdosta State University David Centers, Grand Valley State University Pamela Champeau, University of Wisconsin Whitewater Valerie Chau, Palomar College Star Ciccio, Johnson & Wales University Richard S. Claire, Canada College Robert Clarke, Brigham Young University–Idaho Curtis Clements, Abilene Christian University Darlene Coarts, University of Northern Iowa Carol Coman, California Lutheran University Jackie Conrecode, Florida Gulf Coast University Debora Constable, Georgia Perimeter College
Rita Cook, University of Delaware Wendy Coons, University of Maine Michael Cornick, Winthrop University Deb Cosgrove, University of Nebraska–Lincoln Kathy Crusto-Way, Tarrant County College Robin D’Agati, Palm Beach State College, Lake Worth Patricia Davis, Keystone College Kathleen Davisson, University of Denver Patricia Doherty, Boston University Nina Doherty, Arkansas Tech University Peter Dorff, Kent State University David Doyon, Southern New Hampshire University Emily Drogt, Grand Valley State University Rita Dufour, Northeast Wisconsin Technical College Barbara Durham, University of Central Florida Dean Edmiston, Emporia State University Barb Eide, University of Wisconsin–Lacrosse Rafik Elias, California State University–Los Angeles Richard F. Emery, Linfield College Ruth Epps, Virginia Commonwealth University John Eubanks, Independence Community College Christopher M. Fairchild, Southeastern University Jack Fatica, Terra Community College Christos Fatouros, Curry College Susan Ferguson, James Madison University Jerry Ferry, University of North Alabama Calvin Fink, Bethune Cookman University Virginia Fullwood, Texas A&M University–Commerce Robert Gannon, Alvernia University Joseph Gerard, University of Wisconsin Whitewater Frank Gersich, Monmouth College Hubert Gill, North Florida Jeff Gillespie, University of Delaware Earl Godfrey, Gardner-Webb University Nina Goza, Arkansas Tech University Marina Grau, HCC–Northwest College Alfred C. Greenfield, Jr., High Point University Olen Greer, Missouri State University Steve Groves, Ivy Tech Community College of Indiana–Kokomo Ty Handy, Vermont Technical College
gar11005_fm_i-xxxvi.indd xxivgar11005_fm_i-xxxvi.indd xxiv 27/11/10 3:26 PM27/11/10 3:26 PM
Rev.Confi rming Pages
xxvManagerial Accounting Four teenth Edi t ion
Susan Hass, Simmons College Candice Heino, Anoka Ramsey Community College Sueann Hely, West Kentucky Community & Technical College David Henderson, College of Charleston Donna Hetzel, Western Michigan University–Kalamazoo Cynthia Hollenbach, University of Denver Peg Horan, Wagner College Steven Huddart, Penn State George Hunt, Stephen F Austin State University Marianne James, California State University, Los Angeles Gene Johnson, Clark College Bill Joyce, Minnesota State University–Mankato Celina Jozsi, University of South Florida Robert L. Kachur, Richard Stockton College of New Jersey Sue Kattelus, Michigan State University–East Lansing
Nancy Kelly, Middlesex Community College Shirly Kleiner, Johnson County Community College Bill Knowles, University of New Hampshire Barbara Kren, Marquette University Jerry Kreuze, Western Michigan University Wikil Kwak, Nebraska Omaha Ron Lazer, University of Houston–Houston Dennis Lopez, University of Texas–San Antonio Don Lucy, Indian River State College Cathy Lumbattis, Southern Illinois University Joseph F. Lupino, St. Mary’s College of California Patrick M. Lynch, Loyola University of New Orleans Suneel Maheshwari, Marshall University Linda Malgeri, Kennesaw State University Carol Mannino, Milwaukee School of Engineering
Linda Marquis, Northern Kentucky University Melissa Martin, Arizona State University Michele Martinez, Hillsborough Community College Josephine Mathias, Mercer County Community College Annie McGowan, Texas A&M University Michael McLain, Hampton University Heidi Meier, Cleveland State University Edna Mitchell, Polk State College Kim Mollberg, Minnesota State University–Moorhead Shirley Montagne, Lyndon State College Andrew Morgret, Christian Brothers University Jennifer Moriarty, Hudson Valley Community College Mark Motluck, Anderson University Matt Muller, Adirondack Community College Michael Newman, University of Houston–Houston Tracie Nobles, Austin Community College Janet O’Tousa, University of Notre Dame Mehmet Ozbilgin, Bernard M. Baruch College
Abbie Gail Parham, Georgia Southern Mary Pearson, Southern Utah University Judy Peterson, Monmouth College Yvonne Phang, Bernard M. Baruch College Jo Ann Pinto, Montclair State University Janice Pitera, Broome Community College Matthew Probst, Ivy Tech Community College Laura Prosser, Black Hills State University Herbert Purick, Palm Beach State College–Lake Worth Marc B. Robinson, Richard Stockton College of New Jersey David Rogers, Mesa State College Lawrence A. Roman, Cuyahoga Community College Luther Ross, Sr., Central Piedmont Community College Amal Said, University of Toledo Rex Schildhouse, Miramar College Nancy Schrumpf, Parkland College Vineeta Sharma, Florida International University–Miami Franklin Shuman, Utah State University–Logan Lakshmy Sivaratnam, Kansas City Kansas Community College Talitha Smith, Auburn University–Auburn Diane Stark, Phoenix College Dennis Stovall, Grand Valley State University Suzy Summers, Furman University Scott Szilagyi, Fordham University–Bronx Rita Taylor, University of Cincinnati Lisa Tekmetarovic, Truman College Teresa Thamer, Brenau University Amanda Thompson-Abbott, Marshall University Jerry Thorne, North Carolina A&T State University Don Trippeer, SUNY College at Oneonta Robin Turner, Rowan-Cabarrus Community College Suneel Udpa, University of California–Berkeley Michael Van Breda, Southern Methodist University Jayaraman Vijayakumar, Virginia Commonwealth University Ron Vogel, College of Eastern Utah David Vyncke, Scott Community College Lorry Wasserman, University of Portland Richard Watson, University of California–Santa Barbara Betsy Wenz, Indiana University–Kokomo Robert Weprin, Lourdes College Gwendolen White, Ball State University Elizabeth Widdison, University Of Washington Janet Woods, Macon State College John Woodward, Polk State College Jia Wu, University OF Massachusetts–Dartmouth Emily Xu, University of New Hampshire Jeff Yu, Southern Methodist University Bert Zarb, Embry-Riddle Aeronautical University
gar11005_fm_i-xxxvi.indd xxvgar11005_fm_i-xxxvi.indd xxv 27/11/10 3:26 PM27/11/10 3:26 PM
Rev.Confi rming Pages
Garrison Noreen Brewerxxvi
We are grateful for the outstanding support from McGraw-Hill. In particular, we would like to thank
Stewart Mattson, Editorial Director; Tim Vertovec, Publisher; Donna Dillon, Sponsoring Editor; Emily Hatteberg and
Katie Jones, Developmental Editors; Kathleen Klehr, Marketing Manager; Pat Frederickson, Lead Project Manager;
Carol Bielski, Production Supervisor; Matthew Baldwin, Lead Designer; Cathy Tepper, Media Project Manager;
Allison Souter, Senior Media Project Manager; and Keri Johnson, Photo Research Coordinator.
A special thank you to the following individuals who helped develop the ancillary package: Jon A. Booker and
Charles W. Caldwell of Tennessee Technological University, Cynthia J. Rooney of the University of New Mexico,
and Susan C. Galbreath of Lipscomb University for crafting the Instructor and Student PowerPoint Slides; Jeannie
Folk of the College of DuPage for creating the working papers, online quizzes, online practice exams, and Internet
exercises; Patti Lopez of Valencia Community College–East, Aileen Ormiston of Mesa Community College, Christine
Denison of Iowa State University, Rebecca Lohmann of Southeast Missouri State University, Kathy Crusto-Way
of Tarrant County College–Southeast, Stacy Wade of Western Kentucky University, Deb Cosgrove of University of
Nebraska–Lincoln, Chuo-Hsuan Lee of SUNY Plattsburgh, Loretta Manktelow of James Madison University, Xiujun
Farrier of Tarrant County College–South, Diane Tanner of the University of North Florida, and Laurie Burney of
Mississippi State University for piloting development of our new adaptive, self-study technology, LearnSmart; John
Plouffe of California State University–Los Angeles for helping to generate the worked out solutions for the test
bank; and Jack Terry of ComSource Associates, Inc., for creating the Excel templates.
Finally, we would like to thank Beth Woods and Helen Roybark for working so hard to ensure an error-free
fourteenth edition.
We are grateful to the Institute of Certified Management Accountants for permission to use questions and/or
unofficial answers from past Certificate in Management Accounting (CMA) examinations. Likewise, we thank the
American Institute of Certified Public Accountants, the Society of Management Accountants of Canada, and the
Chartered Institute of Management Accountants (United Kingdom) for permission to use (or to adapt) selected
problems from their examinations. These problems bear the notations CPA, SMA, and CIMA respectively.
Ray H. Garrison • Eric Noreen • Peter Brewer
gar11005_fm_i-xxxvi.indd xxvigar11005_fm_i-xxxvi.indd xxvi 27/11/10 3:26 PM27/11/10 3:26 PM

Rev.Confi rming Pages
xxvii
Brief Contents
Chapter One Managerial Accounting: An Overview 1
Chapter Two Managerial Accounting and Cost Concepts 24
Chapter Three Job-Order Costing 83
Chapter Four Process Costing 141
Chapter Five Cost-Volume-Profit Relationships 183
Chapter Six Variable Costing and Segment Reporting: Tools for Management 229
Chapter Seven Activity-Based Costing: A Tool to Aid Decision Making 272
Chapter Eight Profit Planning 335
Chapter Nine Flexible Budgets and Performance Analysis 383
Chapter Ten Standard Costs and Variances 418
Chapter Eleven Performance Measurement in Decentralized Organizations 472
Chapter Twelve Differential Analysis: The Key to Decision Making 527
Chapter Thirteen Capital Budgeting Decisions 579
Chapter Fourteen Statement of Cash Flows 639
Chapter Fifteen Financial Statement Analysis 679
Appendix A Pricing Products and Services 715
Appendix B Profitability Analysis 731
Credits 745 Index 747
gar11005_fm_i-xxxvi.indd xxviigar11005_fm_i-xxxvi.indd xxvii 09/12/10 2:09 PM09/12/10 2:09 PM
Rev.Confi rming Pages
C h a p t e r
Managerial Accounting: An Overview 1
What Is Managerial Accounting? 2Planning 3
Controlling 3
Decision Making 4
Why Does Managerial Accounting Matter to Your Career? 5
Business Majors 5
Accounting Majors 7
Professional Certification—A Smart Investment 7
What Skills Do Managers Need to Succeed? 8Strategic Management Skills 8
Enterprise Risk Management Skills 9
Process Management Skills 11
Lean Production 11The Theory of Constraints (TOC) 12
Measurement Skills 13
Leadership Skills 14
The Importance of Ethics in Business 14Code of Conduct for Management Accountants 15
Corporate Social Responsibility 17
Summary 19Glossary 19Questions 19Appendix 1A: Corporate Governance 20
C h a p t e r
Managerial Accounting and Cost Concepts 24
General Cost Classifications 25Manufacturing Costs 25
Direct Materials 25Direct Labor 25Manufacturing Overhead 26
Nonmanufacturing Costs 26
Product Costs versus Period Costs 27Product Costs 27
Period Costs 27
Prime Cost and Conversion Cost 27
Cost Classifications for Predicting Cost Behavior 29Variable Cost 29
Fixed Cost 30
The Linearity Assumption and the Relevant Range 31
Mixed Costs 33
The Analysis of Mixed Costs 35Diagnosing Cost Behavior with a Scattergraph Plot 35
The High-Low Method 38
The Least-Squares Regression Method 40
Traditional and Contribution Format Income Statements 42
The Traditional Format Income Statement 42
The Contribution Format Income Statement 43
Cost Classifications for Assigning Costs to Cost Objects 43
Direct Cost 44
Indirect Cost 44
Cost Classifications for Decision Making 44Differential Cost and Revenue 44
Opportunity Cost 45
Sunk Cost 46
Summary 47Review Problem 1: Cost Terms 47Review Problem 2: High-Low Method 48Glossary 49Questions 51Applying Excel 51Exercises 53Problems 58Cases 65Appendix 2A: Least-Squares Regression Computations 67Appendix 2B: Cost of Quality 72
1
2
CONTENTS
gar11005_fm_i-xxxvi.indd xxviiigar11005_fm_i-xxxvi.indd xxviii 27/11/10 3:26 PM27/11/10 3:26 PM

Rev.Confi rming Pages
Contents xxix
Applying Excel 113Exercises 114Problems 122Cases 129
Appendix 3A: The Predetermined Overhead Rate and Capacity 131Appendix 3B: Further Classification of Labor Costs 137
C h a p t e r
Process Costing 141
Comparison of Job-Order and Process Costing 142Similarities between Job-Order and Process
Costing 142
Differences between Job-Order and Process
Costing 142
Cost Flows in Process Costing 143Processing Departments 143
The Flow of Materials, Labor, and Overhead Costs 144
Materials, Labor, and Overhead Cost Entries 145
Materials Costs 145Labor Costs 145Overhead Costs 145Completing the Cost Flows 146
Equivalent Units of Production 146Weighted-Average Method 148
Compute and Apply Costs 150Cost per Equivalent Unit—Weighted-Average
Method 150
Applying Costs—Weighted-Average Method 151
Cost Reconciliation Report 152
Operation Costing 152
Summary 153Review Problem: Process Cost Flows and Costing Units 153Glossary 156Questions 156Applying Excel 157Exercises 158Problems 162Cases 166
Appendix 4A: FIFO Method 167Appendix 4B: Service Department Allocations 176
4
C h a p t e r
Job-Order Costing 83
Job-Order Costing—An Overview 84Job-Order Costing—An Example 85
Measuring Direct Materials Cost 86
Job Cost Sheet 86
Measuring Direct Labor Cost 87
Computing Predetermined Overhead Rates 88
Applying Manufacturing Overhead 89
Manufacturing Overhead—A Closer Look 90
The Need for a Predetermined Rate 90
Choice of an Allocation Base for Overhead Cost 91
Computation of Unit Costs 92
Job-Order Costing—The Flow of Costs 93The Purchase and Issue of Materials 94
Issue of Direct and Indirect Materials 94
Labor Cost 95
Manufacturing Overhead Costs 96
Applying Manufacturing Overhead 97
The Concept of a Clearing Account 97
Nonmanufacturing Costs 98
Cost of Goods Manufactured 99
Cost of Goods Sold 99
Schedules of Cost of Goods Manufactured and Cost of Goods Sold 102
Underapplied and Overapplied Overhead—A Closer Look 103
Computing Underapplied and Overapplied
Overhead 103
Disposition of Underapplied or Overapplied Overhead
Balances 105
Closed Out to Cost of Goods Sold 105Allocated between Accounts 106
Which Method Should Be Used for Disposing of
Underapplied or Overapplied Overhead? 106
A General Model of Product Cost Flows 107
Multiple Predetermined Overhead Rates 107
Job-Order Costing in Service Companies 108Summary 108Review Problem: Job-Order Costing 109Glossary 111Questions 112
3
gar11005_fm_i-xxxvi.indd xxixgar11005_fm_i-xxxvi.indd xxix 27/11/10 3:26 PM27/11/10 3:26 PM
Rev.Confi rming Pages
xxx Contents
C h a p t e r
Variable Costing and Segment Reporting: Tools for Management 229
Overview of Variable and Absorption Costing 230Variable Costing 230
Absorption Costing 230
Selling and Administrative Expense 231
Summary of Differences 231
Variable and Absorption Costing—An Example 232Variable Costing Contribution Format Income
Statement 232
Absorption Costing Income Statement 234
Reconciliation of Variable Costing with Absorption Costing Income 235Advantages of Variable Costing and the Contribution Approach 238
Enabling CVP Analysis 238
Explaining Changes in Net Operating Income 239
Supporting Decision Making 239
Adapting to the Theory of Constraints 240
Segmented Income Statements and the Contribution Approach 240
Traceable and Common Fixed Costs and the Segment
Margin 240
Identifying Traceable Fixed Costs 241
Traceable Costs Can Become Common Costs 242
Segmented Income Statements—An Example 242Levels of Segmented Income Statements 243
Segmented Income Statements and Decision Making 245
Segmented Income Statements—Common Mistakes 245
Omission of Costs 246
Inappropriate Methods for Assigning Traceable Costs
among Segments 246
Failure to Trace Costs Directly 246Inappropriate Allocation Base 246
Arbitrarily Dividing Common Costs among
Segments 246
Income Statements—An External Reporting Perspective 247
Companywide Income Statements 247
Segmented Financial Information 248
6C h a p t e r
Cost-Volume-Profit Relationships 183
The Basics of Cost-Volume-Profit (CVP) Analysis 184Contribution Margin 185
CVP Relationships in Equation Form 187
CVP Relationships in Graphic Form 188
Preparing the CVP Graph 188Contribution Margin Ratio (CM Ratio) 190
Some Applications of CVP Concepts 192
Change in Fixed Cost and Sales Volume 192Change in Variable Costs and Sales Volume 193Change in Fixed Cost, Sales Price, and Sales Volume 194Change in Variable Cost, Fixed Cost, and Sales Volume 195Change in Selling Price 196
Target Profit and Break-Even Analysis 196Target Profit Analysis 196
The Equation Method 197The Formula Method 197Target Profit Analysis in Terms of Sales Dollars 197
Break-Even Analysis 198
Break-Even in Unit Sales 198Break-Even in Sales Dollars 199
The Margin of Safety 199
CVP Considerations in Choosing a Cost Structure 200
Cost Structure and Profit Stability 201
Operating Leverage 202
Structuring Sales Commissions 204Sales Mix 204
The Definition of Sales Mix 205
Sales Mix and Break-Even Analysis 205
Assumptions of CVP Analysis 207
Summary 207Review Problem: CVP Relationships 208Glossary 210Questions 211Applying Excel 211Exercises 213Problems 219Cases 227
5
gar11005_fm_i-xxxvi.indd xxxgar11005_fm_i-xxxvi.indd xxx 27/11/10 3:26 PM27/11/10 3:26 PM

Rev.Confi rming Pages
Contents xxxi
Glossary 300
Questions 301
Applying Excel 301
Exercises 304
Problems 312
Appendix 7A: ABC Action Analysis 317Appendix 7B: Using a Modified Form of Activity-Based Costing to Determine Product Costs for External Reports 328
C h a p t e r
Profit Planning 335
The Basic Framework of Budgeting 336
Advantages of Budgeting 336
Responsibility Accounting 337
Choosing a Budget Period 337
The Self-Imposed Budget 338
Human Factors in Budgeting 339
The Budget Committee 340
The Master Budget: An Overview 341
Preparing the Master Budget 342
The Sales Budget 343
The Production Budget 344
Inventory Purchases—Merchandising Company 346
The Direct Materials Budget 346
The Direct Labor Budget 348
The Manufacturing Overhead Budget 349
The Ending Finished Goods Inventory Budget 350
The Selling and Administrative Expense Budget 351
The Cash Budget 352
The Budgeted Income Statement 356
The Budgeted Balance Sheet 357
Summary 359
Review Problem: Budget Schedules 359
Glossary 361
Questions 362
Applying Excel 362
Exercises 364
Problems 370
Cases 380
8
Summary 249Review Problem 1: Contrasting Variable and Absorption Costing 249Review Problem 2: Segmented Income Statements 251Glossary 252Questions 252Applying Excel 253Exercises 255Problems 261Cases 269
C h a p t e r
Activity-Based Costing: A Tool to Aid Decision Making 272
Activity-Based Costing: An Overview 273Nonmanufacturing Costs and Activity-Based
Costing 273
Manufacturing Costs and Activity-Based
Costing 274
Cost Pools, Allocation Bases, and Activity-Based
Costing 274
Designing an Activity-Based Costing (ABC) System 277
Steps for Implementing Activity-Based Costing 279
Step 1: Define Activities, Activity Cost Pools, and
Activity Measures 279
The Mechanics of Activity-Based Costing 280Step 2: Assign Overhead Costs to Activity Cost
Pools 280
Step 3: Calculate Activity Rates 284
Step 4: Assign Overhead Costs to Cost Objects 285
Step 5: Prepare Management Reports 288
Comparison of Traditional and ABC Product Costs 291
Product Margins Computed Using the Traditional
Cost System 291
The Differences between ABC and Traditional
Product Costs 292
Targeting Process Improvements 296Activity-Based Costing and External Reports 296The Limitations of Activity-Based Costing 297
Summary 298Review Problem: Activity-Based Costing 298
7
gar11005_fm_i-xxxvi.indd xxxigar11005_fm_i-xxxvi.indd xxxi 27/11/10 3:27 PM27/11/10 3:27 PM
Rev.Confi rming Pages
xxxii Contents
Using Standard Costs—Direct Materials Variances 425The Materials Quantity Variance 426
The Materials Price Variance 427
Materials Quantity Variance—A Closer Look 427
Materials Price Variance—A Closer Look 429
Isolation of Variances 429Responsibility for the Variance 429
Using Standard Costs—Direct Labor Variances 430Labor Efficiency Variance—A Closer Look 430
Labor Rate Variance—A Closer Look 432
Using Standard Costs—Variable Manufacturing Overhead Variances 433
Manufacturing Overhead Variances—A Closer Look 433
An Important Subtlety in the Materials Variances 435Variance Analysis and Management by Exception 437International Uses of Standard Costs 439Evaluation of Controls Based on Standard Costs 439
Advantages of Standard Costs 439
Potential Problems with the Use of Standard Costs 440
Summary 440Review Problem: Standard Costs 441Glossary 443Questions 444Applying Excel 444Exercises 446Problems 448Cases 454
Appendix 10A: Predetermined Overhead Rates and Overhead Analysis in a Standard Costing System 454Appendix 10B: Journal Entries to Record Variances 467
C h a p t e r
Performance Measurement in Decentralized Organizations 472
Decentralization in Organizations 473Advantages and Disadvantages of Decentralization 473
Responsibility Accounting 474Cost, Profit, and Investment Centers 474
Cost Center 474Profit Center 474Investment Center 475
11
C h a p t e r
Flexible Budgets and Performance Analysis 383
Flexible Budgets 384Characteristics of a Flexible Budget 384
Deficiencies of the Static Planning Budget 385
How a Flexible Budget Works 387
Flexible Budget Variances 388Activity Variances 388
Revenue and Spending Variances 389
A Performance Report Combining Activity and Revenue
and Spending Variances 391
Performance Reports in Nonprofit Organizations 394
Performance Reports in Cost Centers 394
Flexible Budgets with Multiple Cost Drivers 394Some Common Errors 396
Summary 397Review Problem: Variance Analysis Using a Flexible Budget 398Glossary 399Questions 400Applying Excel 400Exercises 402Problems 410Cases 414
C h a p t e r
Standard Costs and Variances 418
Standard Costs—Setting the Stage 419Who Uses Standard Costs? 420
Setting Standard Costs 420
Setting Direct Materials Standards 421
Setting Direct Labor Standards 422
Setting Variable Manufacturing Overhead
Standards 422
Using Standards in Flexible Budgets 423
A General Model for Standard Cost Variance Analysis 424
9
10
gar11005_fm_i-xxxvi.indd xxxiigar11005_fm_i-xxxvi.indd xxxii 27/11/10 3:27 PM27/11/10 3:27 PM
Rev.Confi rming Pages
Contents xxxiii
Adding and Dropping Product Lines and Other Segments 535
An Illustration of Cost Analysis 535
A Comparative Format 537
Beware of Allocated Fixed Costs 537
The Make or Buy Decision 539Strategic Aspects of the Make or Buy Decision 539
An Example of Make or Buy 540
Opportunity Cost 541
Special Orders 542
Utilization of a Constrained Resource 543Contribution Margin per Unit of the Constrained
Resource 544
Managing Restraints 546
The Problem of Multiple Constraints 548
Joint Product Costs and the Contribution Approach 548
The Pitfalls of Allocation 550
Sell or Process Further Decisions 550
Activity-Based Costing and Relevant Costs 552
Summary 552Review Problem: Relevant Costs 553Glossary 554Questions 554Applying Excel 555Exercises 556Problems 564Cases 572
C h a p t e r
Capital Budgeting Decisions 579
Capital Budgeting—Planning Investments 580Typical Capital Budgeting Decisions 580
The Time Value of Money 580
Discounted Cash Flows—The Net Present Value Method 581
The Net Present Value Method Illustrated 581
Emphasis on Cash Flows 583
Typical Cash Outflows 583Typical Cash Inflows 583
13
Evaluating Investment Center Performance—Return on Investment 475
The Return on Investment (ROI) Formula 475
Net Operating Income and Operating Assets Defined 475
Understanding ROI 476
Criticisms of ROI 479
Residual Income 479Motivation and Residual Income 480
Divisional Comparison and Residual Income 481
Operating Performance Measures 482Delivery Cycle Time 482
Throughput (Manufacturing Cycle) Time 482
Manufacturing Cycle Efficiency (MCE) 483
Balanced Scorecard 485Common Characteristics of Balanced Scorecards 485
A Company’s Strategy and the Balanced Scorecard 487
Tying Compensation to the Balanced Scorecard 490
Advantages of Timely and Graphic Feedback 491
Summary 492Review Problem: Return on Investment (ROI) and Residual Income 492Glossary 493Questions 493Applying Excel 494Exercises 495Problems 500Cases 506
Appendix 11A: Transfer Pricing 507Appendix 11B: Service Department Charges 519
C h a p t e r
Differential Analysis: The Key to Decision Making 527
Cost Concepts for Decision Making 528Identifying Relevant Costs and Benefits 528
Different Costs for Different Purposes 529
An Example of Identifying Relevant Costs
and Benefits 529
Reconciling the Total and Differential Approaches 532
Why Isolate Relevant Costs? 534
12
gar11005_fm_i-xxxvi.indd xxxiiigar11005_fm_i-xxxvi.indd xxxiii 27/11/10 3:27 PM27/11/10 3:27 PM
Rev.Confi rming Pages
xxxiv Contents
C h a p t e r
Statement of Cash Flows 639
The Statement of Cash Flows: Key Concepts 641Organizing the Statement of Cash Flows 641
Operating Activities: Direct or Indirect Method? 642
The Indirect Method: A Three-Step Process 643
Investing and Financing Activities: Gross Cash Flows 645
Property, Plant, and Equipment 646Retained Earnings 647
Summary of Key Concepts 648
An Example of a Statement of Cash Flows 650Operating Activities 651
Investing Activities 652
Financing Activities 653
Seeing the Big Picture 654
Interpreting the Statement of Cash Flows 656Consider a Company’s Specific Circumstances 656
Consider the Relationships among Numbers 657
Free Cash Flow 657Earnings Quality 658
Summary 658Review Problem 659Glossary 663Questions 663Exercises 664Problems 667
Appendix 14A: The Direct Method of Determining the Net Cash Provided by Operating Activities 675
C h a p t e r
Financial Statement Analysis 679
Limitations of Financial Statement Analysis 680Comparing Financial Data across Companies 680
Looking beyond Ratios 680
Statements in Comparative and Common-Size Form 680Dollar and Percentage Changes on Statements 681
Common-Size Statements 683
Ratio Analysis—The Common Stockholder 685Earnings per Share 685
14
15
Recovery of the Original Investment 584
Simplifying Assumptions 585
Choosing a Discount Rate 585
An Extended Example of the Net Present Value
Method 586
Discounted Cash Flows—The Internal Rate of Return Method 587
The Internal Rate of Return Method Illustrated 587
Salvage Value and Other Cash Flows 588
Using the Internal Rate of Return 589
The Cost of Capital as a Screening Tool 589
Comparison of the Net Present Value and
Internal Rate of Return Methods 589
Expanding the Net Present Value Method 590The Total-Cost Approach 590
The Incremental-Cost Approach 591
Least-Cost Decisions 592
Uncertain Cash Flows 594An Example 594
Real Options 595
Preference Decisions—The Ranking of Investment Projects 595
Internal Rate of Return Method 595
Net Present Value Method 596
Other Approaches to Capital Budgeting Decisions 597
The Payback Method 597
Evaluation of the Payback Method 598
An Extended Example of Payback 599
Payback and Uneven Cash Flows 600
The Simple Rate of Return Method 601
Criticisms of the Simple Rate of Return 602
Postaudit of Investment Projects 602
Summary 603Review Problem: Comparison of Capital Budgeting Methods 603Glossary 605Questions 605Applying Excel 606Exercises 607Problems 611Cases 620
Appendix 13A: The Concept of Present Value 622Appendix 13B: Present Value Tables 629Appendix 13C: Income Taxes in Capital Budgeting Decisions 631
gar11005_fm_i-xxxvi.indd xxxivgar11005_fm_i-xxxvi.indd xxxiv 27/11/10 3:27 PM27/11/10 3:27 PM

Rev.Confi rming Pages
Contents xxxv
The Absorption Costing Approach to Cost-Plus Pricing 720
Setting a Target Selling Price Using the Absorption
Costing Approach 720
Determining the Markup Percentage 721
Problems with the Absorption Costing Approach 722
Target Costing 723Reasons for Using Target Costing 724
An Example of Target Costing 724
Summary 725Glossary 725Questions 725Exercises 726Problems 727
A p p e n d i x
Profitability Analysis 731
Introduction 732Absolute Profitability 732Relative Profitability 733Volume Trade-Off Decisions 736Managerial Implications 738
Summary 739Glossary 740Questions 740Exercises 740Problems 741Cases 744
Photo Credits 745Index 747
B
Price-Earnings Ratio 687
Dividend Payout and Yield Ratios 687
The Dividend Payout Ratio 687The Dividend Yield Ratio 687
Return on Total Assets 688
Return on Common Stockholders’ Equity 688
Financial Leverage 689
Book Value per Share 689
Ratio Analysis—The Short-Term Creditor 690Working Capital 690
Current Ratio 690
Acid-Test (Quick) Ratio 691
Accounts Receivable Turnover 691
Inventory Turnover 692
Ratio Analysis—The Long-Term Creditor 693Times Interest Earned Ratio 693
Debt-to-Equity Ratio 694
Summary of Ratios and Sources of Comparative Ratio Data 694
Summary 697Review Problem: Selected Ratios and Financial Leverage 697Glossary 699Questions 699Exercises 700Problems 705
A p p e n d i x
Pricing Products and Services 715
Introduction 716The Economists’ Approach to Pricing 717
Elasticity of Demand 717
The Profit-Maximizing Price 718
A
gar11005_fm_i-xxxvi.indd xxxvgar11005_fm_i-xxxvi.indd xxxv 27/11/10 3:28 PM27/11/10 3:28 PM

Rev.Confi rming Pages
gar11005_fm_i-xxxvi.indd xxxvigar11005_fm_i-xxxvi.indd xxxvi 27/11/10 3:28 PM27/11/10 3:28 PM
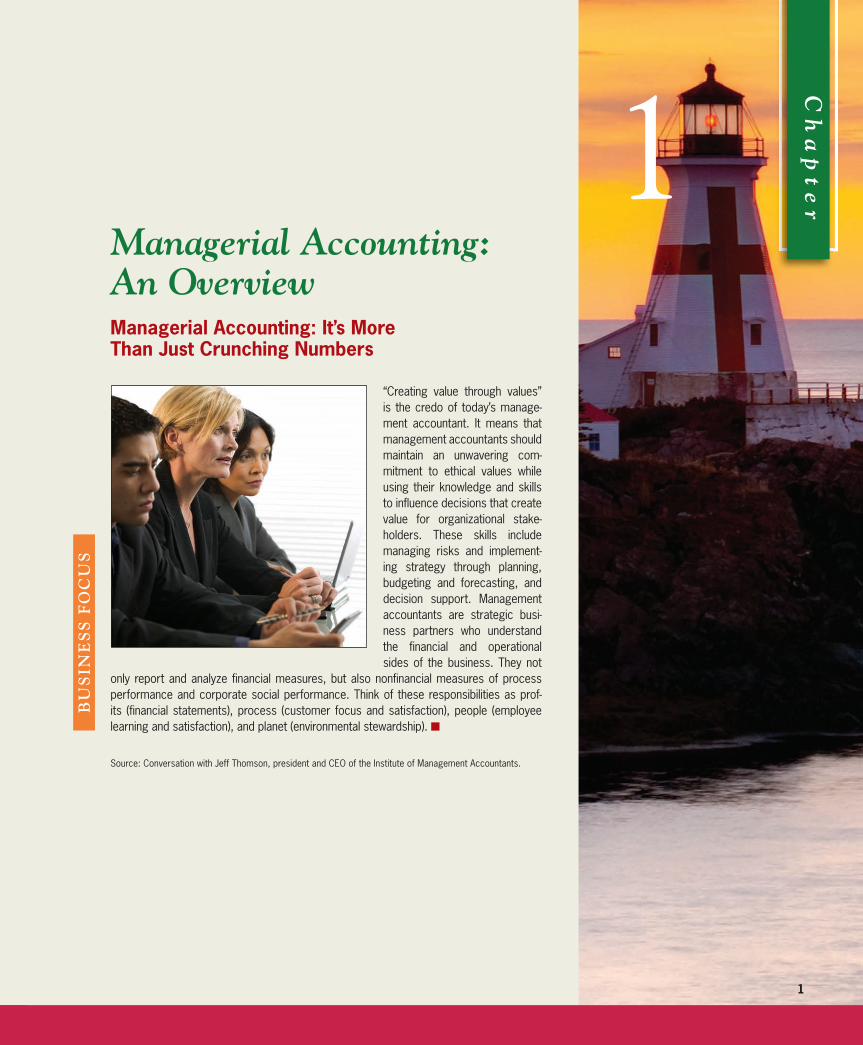
Confi rming Pages
1
1 C
ha
pt
er
Managerial Accounting: An Overview Managerial Accounting: It’s More Than Just Crunching Numbers
“Creating value through values” is the credo of today’s manage -ment accountant. It means that management accountants should maintain an unwavering com-mitment to ethical values while using their knowledge and skills to influence decisions that create value for organizational stake-holders. These skills include managing risks and implement-ing strategy through planning, budgeting and forecasting, and decision support. Management accountants are strategic busi-ness partners who understand the financial and operational sides of the business. They not
only report and analyze financial measures, but also nonfinancial measures of process performance and corporate social performance. Think of these responsibilities as prof-its (financial statements), process (customer focus and satisfaction), people (employee learning and satisfaction), and planet (environmental stewardship). ■
Source: Conversation with Jeff Thomson, president and CEO of the Institute of Management Accountants.
BU
SIN
ES
S F
OC
US
gar11005_ch01_001-023.indd 1gar11005_ch01_001-023.indd 1 02/11/10 3:43 PM02/11/10 3:43 PM
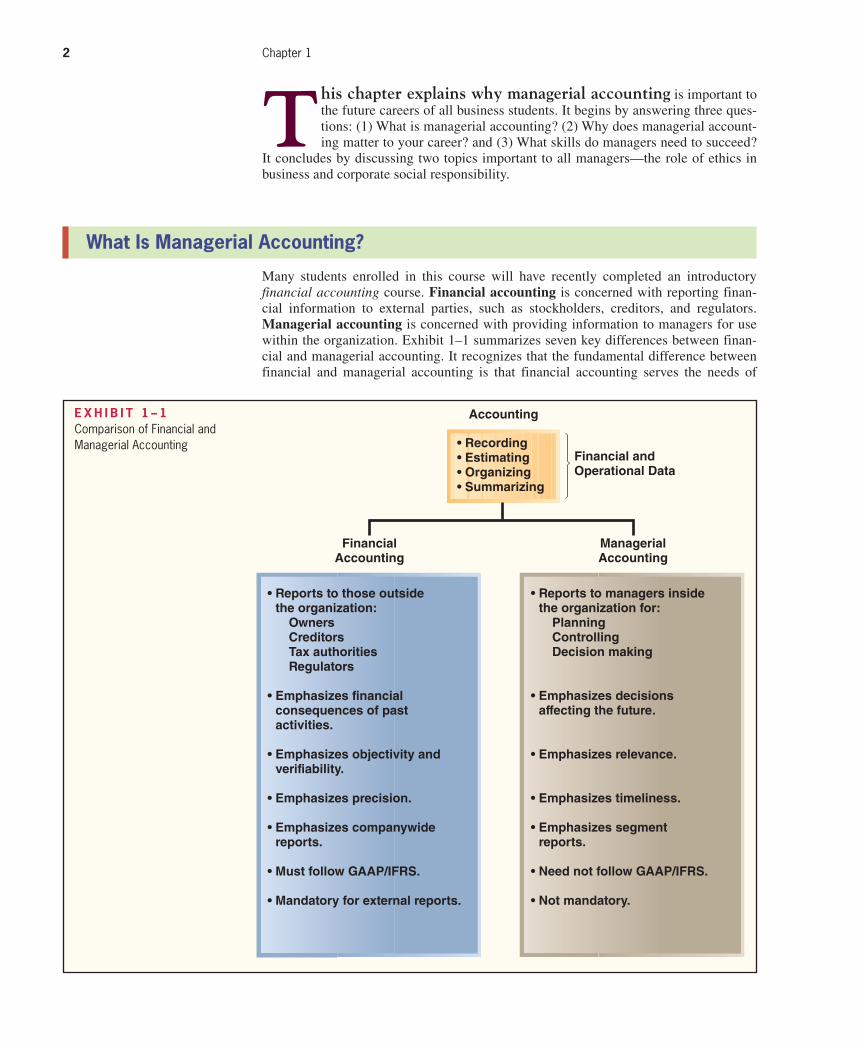
Confi rming Pages
2 Chapter 1
T his chapter explains why managerial accounting is important to
the future careers of all business students. It begins by answering three ques-
tions: (1) What is managerial accounting? (2) Why does managerial account-
ing matter to your career? and (3) What skills do managers need to succeed?
It concludes by discussing two topics important to all managers—the role of ethics in
business and corporate social responsibility.
• Reports to managers inside the organization for: Planning Controlling Decision making
• Emphasizes decisions affecting the future.
• Emphasizes relevance.
• Emphasizes timeliness.
• Emphasizes segment reports.
• Need not follow GAAP/IFRS.
• Not mandatory.
Accounting
Financial andOperational Data
ManagerialAccounting
• Reports to those outside the organization: Owners Creditors Tax authorities Regulators
• Emphasizes financial consequences of past activities.
• Emphasizes objectivity and verifiability.
• Emphasizes precision.
• Emphasizes companywide reports. • Must follow GAAP/IFRS.
• Mandatory for external reports.
FinancialAccounting
• Recording• Estimating• Organizing• Summarizing
What Is Managerial Accounting?
Many students enrolled in this course will have recently completed an introductory
financial accounting course. Financial accounting is concerned with reporting finan-
cial information to external parties, such as stockholders, creditors, and regulators.
Managerial accounting is concerned with providing information to managers for use
within the organization. Exhibit 1–1 summarizes seven key differences between finan-
cial and managerial accounting. It recognizes that the fundamental difference between
financial and managerial accounting is that financial accounting serves the needs of
E X H I B I T 1 – 1 Comparison of Financial and Managerial Accounting
gar11005_ch01_001-023.indd 2gar11005_ch01_001-023.indd 2 02/11/10 3:43 PM02/11/10 3:43 PM
Confi rming Pages
Managerial Accounting: An Overview 3
those outside the organization, whereas managerial accounting serves the needs of man-
agers employed inside the organization. Because of this fundamental difference in users,
financial accounting emphasizes the financial consequences of past activities, objec-
tivity and verifiability, precision, and companywide performance, whereas managerial
accounting emphasizes decisions affecting the future, relevance, timeliness, and segment performance. A segment is a part or activity of an organization about which managers
would like cost, revenue, or profit data. Examples of business segments include product
lines, customer groups (segmented by age, ethnicity, gender, volume of purchases, etc.),
geographic territories, divisions, plants, and departments. Finally, financial accounting
is mandatory for external reports and it needs to comply with rules, such as generally
accepted accounting principles (GAAP) and international financial reporting standards
(IFRS), whereas managerial accounting is not mandatory and it does not need to comply
with externally imposed rules.
As mentioned in Exhibit 1–1 , managerial accounting helps managers perform three
vital activities— planning, controlling, and decision making. Planning involves establish-
ing goals and specifying how to achieve them. Controlling involves gathering feedback
to ensure that the plan is being properly executed or modified as circumstances change.
Decision making involves selecting a course of action from competing alternatives. Now
let’s take a closer look at these three pillars of managerial accounting.
Planning
Assume that you work for Procter & Gamble (P&G) and that you are in charge of the
company’s campus recruiting for all undergraduate business majors. In this example,
your planning process would begin by establishing a goal such as: our goal is to recruit
the “best and brightest” college graduates. The next stage of the planning process
would require specifying how to achieve this goal by answering numerous questions
such as:
• How many students do we need to hire in total and from each major?
• What schools do we plan to include in our recruiting efforts?
• Which of our employees will be involved in each school’s recruiting activities?
• When will we conduct our interviews?
• How will we compare students to one another to decide who will be extended job offers?
• What salary will we offer our new hires? Will the salaries differ by major?
• How much money can we spend on our recruiting efforts?
As you can see, there are many questions that need to be answered as part of the plan-
ning process. Plans are often accompanied by a budget. A budget is a detailed plan for
the future that is usually expressed in formal quantitative terms. As the head of recruiting
at P&G, your budget would include two key components. First, you would have to work
with other senior managers inside the company to establish a budgeted amount of total
salaries that can be offered to all new hires. Second, you would have to create a budget
that quantifies how much you intend to spend on your campus recruiting activities.
Controlling
Once you established and started implementing P&G’s recruiting plan, you would
transition to the control process. This process would involve gathering, evaluating,
and responding to feedback to ensure that this year’s recruiting process meets expecta-
tions. It would also include evaluating the feedback in search of ways to run a more
effective recruiting campaign next year. The control process would involve answering
questions such as:
• Did we succeed in hiring the planned number of students within each major and at
each school?
• Did we lose too many exceptional candidates to competitors?
gar11005_ch01_001-023.indd 3gar11005_ch01_001-023.indd 3 02/11/10 3:43 PM02/11/10 3:43 PM
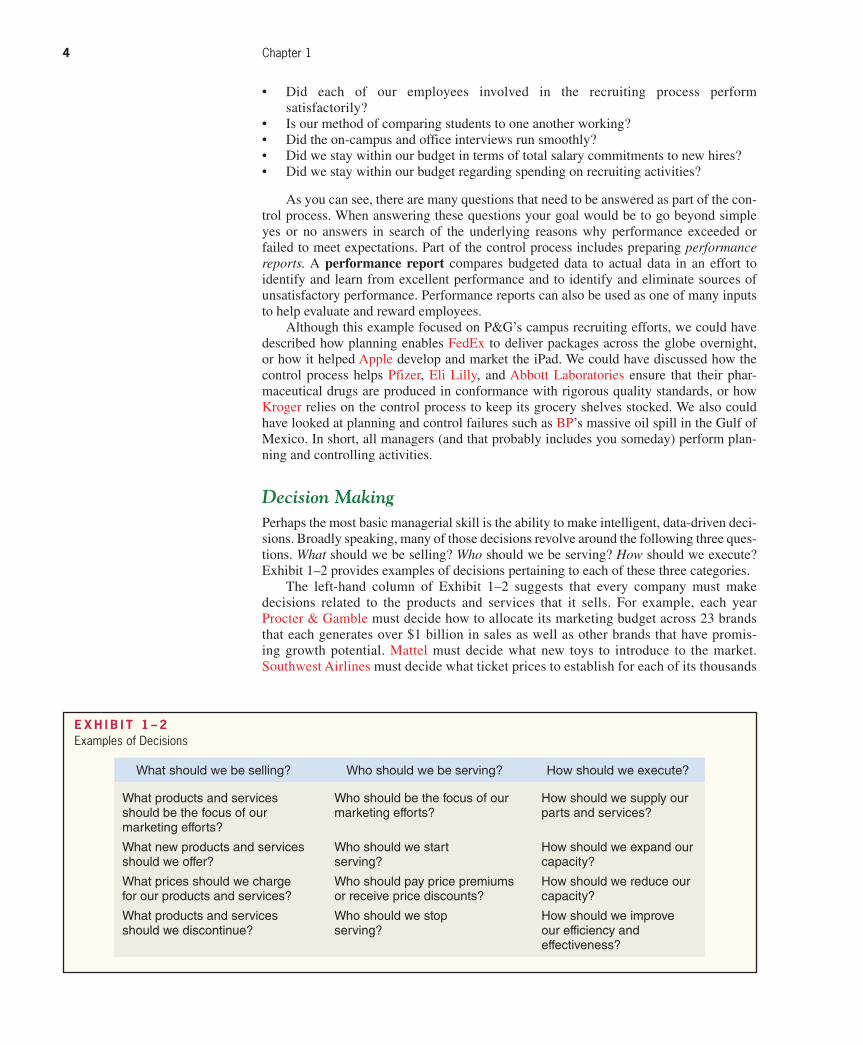
Confi rming Pages
4 Chapter 1
• Did each of our employees involved in the recruiting process perform
satisfactorily?
• Is our method of comparing students to one another working?
• Did the on-campus and office interviews run smoothly?
• Did we stay within our budget in terms of total salary commitments to new hires?
• Did we stay within our budget regarding spending on recruiting activities?
As you can see, there are many questions that need to be answered as part of the con-
trol process. When answering these questions your goal would be to go beyond simple
yes or no answers in search of the underlying reasons why performance exceeded or
failed to meet expectations. Part of the control process includes preparing performance reports. A performance report compares budgeted data to actual data in an effort to
identify and learn from excellent performance and to identify and eliminate sources of
unsatisfactory performance. Performance reports can also be used as one of many inputs
to help evaluate and reward employees.
Although this example focused on P&G’s campus recruiting efforts, we could have
described how planning enables FedEx to deliver packages across the globe overnight,
or how it helped Apple develop and market the iPad. We could have discussed how the
control process helps Pfizer, Eli Lilly, and Abbott Laboratories ensure that their phar-
maceutical drugs are produced in conformance with rigorous quality standards, or how
Kroger relies on the control process to keep its grocery shelves stocked. We also could
have looked at planning and control failures such as BP ’s massive oil spill in the Gulf of
Mexico. In short, all managers (and that probably includes you someday) perform plan-
ning and controlling activities.
Decision Making
Perhaps the most basic managerial skill is the ability to make intelligent, data-driven deci-
sions. Broadly speaking, many of those decisions revolve around the following three ques-
tions. What should we be selling? Who should we be serving? How should we execute?
Exhibit 1–2 provides examples of decisions pertaining to each of these three categories.
The left-hand column of Exhibit 1–2 suggests that every company must make
decisions related to the products and services that it sells. For example, each year
Procter & Gamble must decide how to allocate its marketing budget across 23 brands
that each generates over $1 billion in sales as well as other brands that have promis-
ing growth potential. Mattel must decide what new toys to introduce to the market.
Southwest Airlines must decide what ticket prices to establish for each of its thousands
What should we be selling? Who should we be serving? How should we execute?
What products and services should be the focus of our marketing efforts?
Who should be the focus of our marketing efforts?
How should we supply our parts and services?
What new products and services should we offer?
Who should we start serving?
How should we expand our capacity?
What prices should we charge for our products and services?
Who should pay price premiums or receive price discounts?
How should we reduce our capacity?
What products and services should we discontinue?
Who should we stop serving?
How should we improve our efficiency and effectiveness?
E X H I B I T 1 – 2Examples of Decisions
gar11005_ch01_001-023.indd 4gar11005_ch01_001-023.indd 4 02/11/10 3:43 PM02/11/10 3:43 PM
Confi rming Pages
Managerial Accounting: An Overview 5
of flights per day. General Motors must decide whether to discontinue certain models
of automobiles.
The middle column of Exhibit 1–2 indicates that all companies must make deci-
sions related to the customers that they serve. For example, Sears must decide how to
allocate its marketing budget between products that tend to appeal to male versus female
customers. FedEx must decide whether to expand its services into new markets across
the globe. Hewlett-Packard must decide what price discounts to offer corporate clients
that purchase large volumes of its products. A bank must decide whether to discontinue
customers that may be unprofitable.
The right-hand column of Exhibit 1–2 shows that companies also make decisions
related to how they execute. For example, Boeing must decide whether to rely on outside
vendors such as Goodrich, Saab, and Rolls-Royce to manufacture many of the parts used
to make its airplanes. Cintas must decide whether to expand its laundering and cleaning
capacity in a given geographic region by adding square footage to an existing facility or
by constructing an entirely new facility. In an economic downturn, a manufacturer might
have to decide whether to eliminate one 8-hour shift at three plants or to close one plant.
Finally, all companies have to decide among competing improvement opportunities. For
example, a company may have to decide whether to implement a new software system, to
upgrade a piece of equipment, or to provide extra training to its employees.
This portion of the chapter has explained that the three pillars of managerial account-
ing are planning, controlling, and decision making. This book helps prepare you to
become an effective manager by explaining how to make intelligent data-driven deci-
sions, how to create financial plans for the future, and how to continually make progress
toward achieving goals by obtaining, evaluating, and responding to feedback.
Why Does Managerial Accounting Matter to Your Career?
Many students feel anxious about choosing a major because they are unsure if it will
provide a fulfilling career. To reduce these anxieties, we recommend deemphasizing what
you cannot control about the future; instead focusing on what you can control right now.
More specifically, concentrate on answering the following question: What can you do
now to prepare for success in an unknown future career? The best answer is to learn
skills that will make it easier for you to adapt to an uncertain future. You need to become
adaptable!
Whether you end up working in the United States or abroad, for a large corpora-
tion, a small entrepreneurial company, a nonprofit organization, or a governmental entity,
you’ll need to know how to plan for the future, how to make progress toward achiev-
ing goals, and how to make intelligent decisions. In other words, managerial accounting
skills are useful in just about any career, organization, and industry. If you commit energy
to this course, you’ll be making a smart investment in your future—even though you can-
not clearly envision it. Next, we will elaborate on this point by explaining how manage-
rial accounting relates to the future careers of business majors and accounting majors.
Business Majors
Exhibit 1–3 provides examples of how planning, controlling, and decision making affect
three majors other than accounting—marketing, operations management, and human
resource management.
The left-hand column of Exhibit 1–3 describes some planning, controlling, and decision-
making applications in the marketing profession. For example, marketing managers make
planning decisions related to allocating advertising dollars across various communication
mediums and to staffing new sales territories. From a control standpoint, they may closely
track sales data to see if a budgeted price cut is generating an anticipated increase in unit
gar11005_ch01_001-023.indd 5gar11005_ch01_001-023.indd 5 02/11/10 3:43 PM02/11/10 3:43 PM

Confi rming Pages
6 Chapter 1
sales, or they may study inventory levels during the holiday shopping season so that they can
adjust prices as needed to optimize sales. Marketing managers also make many important
decisions such as whether to bundle services together and sell them for one price or to sell
each service separately. They may also decide whether to sell products directly to the cus-
tomer or to sell to a distributor, who then sells to the end consumer.
The middle column of Exhibit 1–3 states that operations managers have to plan how
many units to produce to satisfy anticipated customer demand. They also need to budget
for operating expenses such as utilities, supplies, and labor costs. In terms of control,
they monitor actual spending relative to the budget, and closely watch operational mea-
sures such as the number of defects produced relative to the plan. Operations managers
make numerous decisions, such as deciding whether to buy a new piece of equipment or
upgrade an existing piece of equipment. They also decide whether to invest in redesign-
ing a manufacturing process to reduce inventory levels.
The right-hand column of Exhibit 1–3 explains how human resource managers
make a variety of planning decisions, such as budgeting how much to spend on occu-
pational safety training and employee recruitment advertising. They monitor feedback
related to numerous management concerns, such as employee retention rates and the
timely completion of employee performance appraisals. They also help make many
important decisions such as whether to hire on-site medical staff in an effort to lower
health care costs, and whether to hire temporary workers or full-time employees in an
uncertain economy.
For brevity, Exhibit 1–3 does not include all business majors, such as finance, supply
chain management, management information systems, and economics. Can you explain
how planning, controlling, and decision-making activities would relate to these majors?
MarketingOperations
ManagementHuman Resource
Management
Planning How much should we budget for TV, print, and Internet advertising?
How many salespeople should we plan to hire to serve a new territory?
How many units should we plan to produce next period?
How much should we budget for next period’s utility expense?
How much should we plan to spend for occupational safety training?
How much should we plan to spend on employee recruitment advertising?
Controlling Is the budgeted price cut increasing unit sales as expected?
Are we accumulating too much inventory during the holiday shopping season?
Did we spend more or less than expected for the units we actually produced?
Are we achieving our goal of reducing the number of defective units produced?
Is our employee retention rate exceeding our goals?
Are we meeting our goal of completing timely performance appraisals?
Decision Making
Should we sell our services as one bundle or sell them separately?
Should we sell directly to customers or use a distributor?
Should we buy a new piece of equipment or upgrade our existing machine?
Should we redesign our manufacturing process to lower inventory levels?
Should we hire an on-site medical staff to lower our health care costs?
Should we hire temporary workers or full-time employees?
E X H I B I T 1 – 3 Relating Managerial Accounting to Three Business Majors
gar11005_ch01_001-023.indd 6gar11005_ch01_001-023.indd 6 02/11/10 3:43 PM02/11/10 3:43 PM

Confi rming Pages
Managerial Accounting: An Overview 7
Accounting Majors
Many accounting graduates begin their careers working for public accounting firms that
provide a variety of valuable services for their clients. Some of these graduates will build
successful and fulfilling careers in the public accounting industry; however, most will
leave public accounting at some point to work in other organizations. In fact, the Institute
of Management Accountants (IMA) estimates that more than 80% of professional accoun-
tants in the United States work in nonpublic accounting environments ( www.imanet.org/
about_ima/our_mission.aspx ).
The public accounting profession has a strong financial accounting orientation. Its
most important function is to protect investors and other external parties by assuring
them that companies are reporting historical financial results that comply with applicable
accounting rules. Managerial accountants also have strong financial accounting skills.
For example, they play an important role in helping their organizations design and main-
tain financial reporting systems that generate reliable financial disclosures. However, the
primary role of managerial accountants is to partner with their co-workers within the
organization to improve performance.
Given the 80% figure mentioned above, if you are an accounting major there is a
very high likelihood that your future will involve working for a nonpublic accounting
employer. Your employer will expect you to have strong financial accounting skills, but
more importantly, it will expect you to help improve organizational performance by
applying the planning, controlling, and decision-making skills that are the foundation of
managerial accounting.
I N B U S I N E S S A NETWORKING OPPORTUNITY The Institute of Management Accountants (IMA) is a network of more than 60,000 accounting and finance professionals from over 120 countries. Every year the IMA hosts a student lead-ership conference that attracts 300 students from over 50 colleges and universities. Guest speakers at past conferences have discussed topics such as leadership, advice for a successful career, how to market yourself in a difficult economy, and excelling in today’s multigenerational workforce. One student who attended the conference said, “I liked that I was able to interact with professionals who are in fields that could be potential career paths for me.” For more informa-tion on this worthwhile networking opportunity, contact the IMA at the phone number and website shown below .
Source: Conversation with Jodi Ryan, the Institute of Management Accountants’ Director of Alliances and Student/Academic Communities. (800) 638-4427 or visit its website at www.imanet.org.
Professional Certification—A Smart Investment If you plan to become an
accounting major, the Certified Management Accountant (CMA) designation is a glob-
ally respected credential (sponsored by the IMA) that will increase your credibility,
upward mobility, and compensation. Exhibit 1–4 summarizes the topics covered in the
two-part CMA exam. For brevity, we are not going to define all the terms included in
this exhibit. Its purpose is simply to emphasize that the CMA exam focuses on the plan-
ning, controlling, and decision-making skills that are critically important to nonpublic
accounting employers. The CMA’s internal management orientation is a complement to
the highly respected Certified Public Accountant (CPA) exam that focuses on rule-based
compliance—assurance standards, financial accounting standards, business law, and the
tax code. Information about becoming a CMA is available on the IMA’s website ( www.
imanet.org ) or by calling 1-800-638-4427.
gar11005_ch01_001-023.indd 7gar11005_ch01_001-023.indd 7 02/11/10 3:43 PM02/11/10 3:43 PM
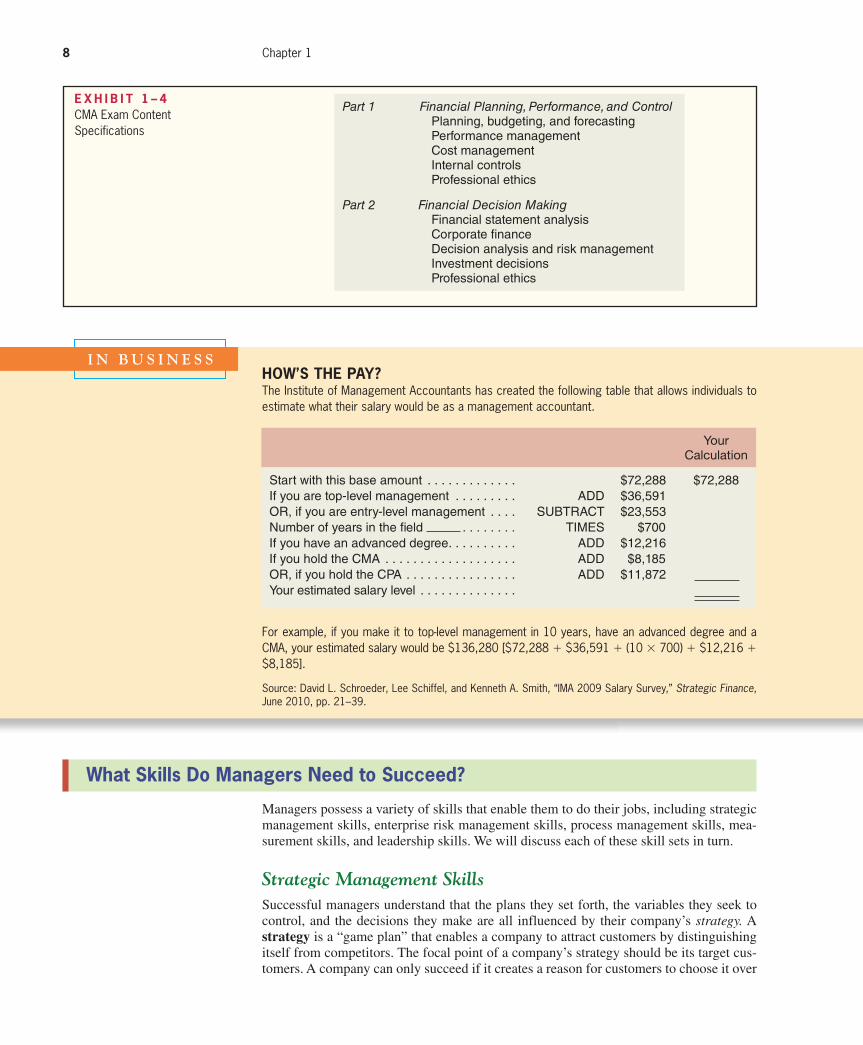
Confi rming Pages
8 Chapter 1
For example, if you make it to top-level management in 10 years, have an advanced degree and a CMA, your estimated salary would be $136,280 [$72,288 + $36,591 + (10 × 700) + $12,216 + $8,185].
Source: David L. Schroeder, Lee Schiffel, and Kenneth A. Smith, “IMA 2009 Salary Survey,” Strategic Finance, June 2010, pp. 21–39.
Part 1 Financial Planning, Performance, and Control Planning, budgeting, and forecasting Performance management Cost management Internal controls Professional ethics
Part 2 Financial Decision Making Financial statement analysis Corporate fi nance Decision analysis and risk management Investment decisions Professional ethics
E X H I B I T 1 – 4CMA Exam Content Specifications
I N B U S I N E S S HOW’S THE PAY? The Institute of Management Accountants has created the following table that allows individuals to estimate what their salary would be as a management accountant.
Your Calculation
Start with this base amount . . . . . . . . . . . . . $72,288 $72,288If you are top-level management . . . . . . . . . ADD $36,591OR, if you are entry-level management . . . . SUBTRACT $23,553Number of years in the fi eld . . . . . . . . TIMES $700If you have an advanced degree. . . . . . . . . . ADD $12,216If you hold the CMA . . . . . . . . . . . . . . . . . . . ADD $8,185OR, if you hold the CPA . . . . . . . . . . . . . . . . ADD $11,872 Your estimated salary level . . . . . . . . . . . . . .
What Skills Do Managers Need to Succeed?
Managers possess a variety of skills that enable them to do their jobs, including strategic
management skills, enterprise risk management skills, process management skills, mea-
surement skills, and leadership skills. We will discuss each of these skill sets in turn.
Strategic Management Skills
Successful managers understand that the plans they set forth, the variables they seek to
control, and the decisions they make are all influenced by their company’s strategy. A
strategy is a “game plan” that enables a company to attract customers by distinguishing
itself from competitors. The focal point of a company’s strategy should be its target cus-
tomers. A company can only succeed if it creates a reason for customers to choose it over
gar11005_ch01_001-023.indd 8gar11005_ch01_001-023.indd 8 02/11/10 3:43 PM02/11/10 3:43 PM
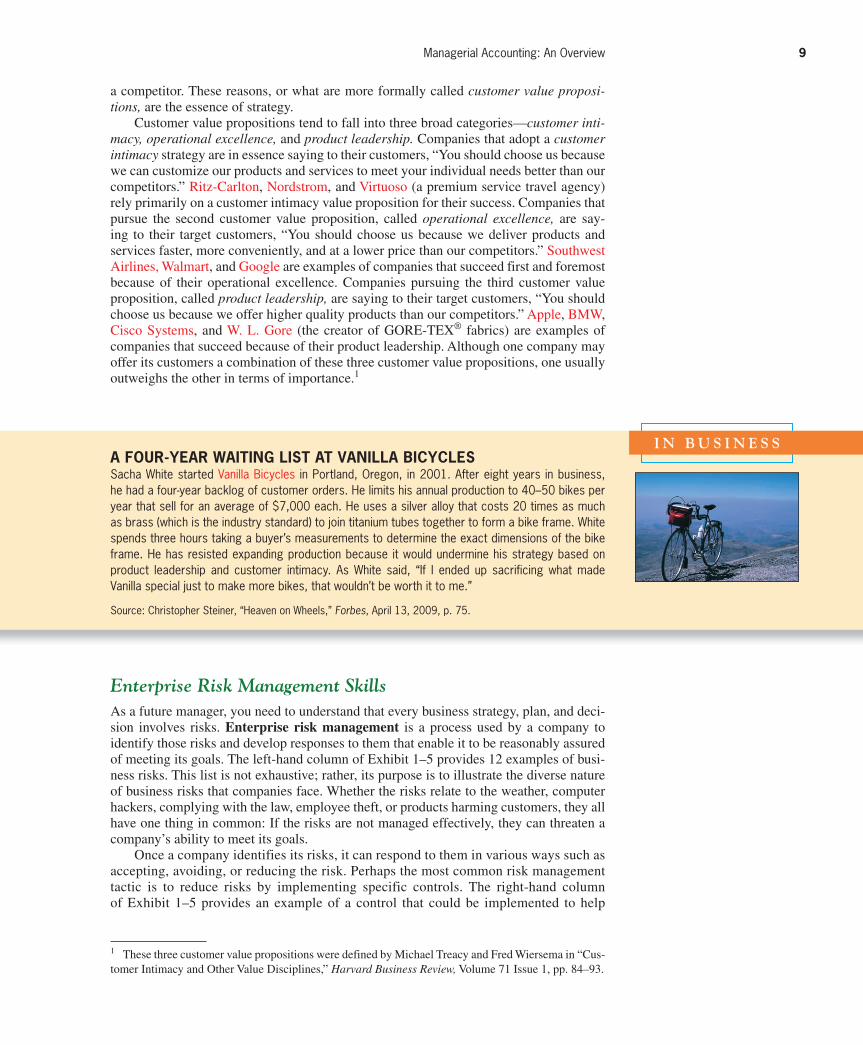
Confi rming Pages
Managerial Accounting: An Overview 9
a competitor. These reasons, or what are more formally called customer value proposi-tions, are the essence of strategy.
Customer value propositions tend to fall into three broad categories— customer inti-macy, operational excellence, and product leadership. Companies that adopt a customer intimacy strategy are in essence saying to their customers, “You should choose us because
we can customize our products and services to meet your individual needs better than our
competitors.” Ritz-Carlton, Nordstrom, and Virtuoso (a premium service travel agency)
rely primarily on a customer intimacy value proposition for their success. Companies that
pursue the second customer value proposition, called operational excellence, are say-
ing to their target customers, “You should choose us because we deliver products and
services faster, more conveniently, and at a lower price than our competitors.” Southwest
Airlines, Walmart, and Google are examples of companies that succeed first and foremost
because of their operational excellence. Companies pursuing the third customer value
proposition, called product leadership, are saying to their target customers, “You should
choose us because we offer higher quality products than our competitors.” Apple, BMW,
Cisco Systems, and W. L. Gore (the creator of GORE-TEX ® fabrics) are examples of
companies that succeed because of their product leadership. Although one company may
offer its customers a combination of these three customer value propositions, one usually
outweighs the other in terms of importance. 1
1 These three customer value propositions were defined by Michael Treacy and Fred Wiersema in “Cus-
tomer Intimacy and Other Value Disciplines,” Harvard Business Review, Volume 71 Issue 1, pp. 84–93.
I N B U S I N E S S A FOUR-YEAR WAITING LIST AT VANILLA BICYCLES Sacha White started Vanilla Bicycles in Portland, Oregon, in 2001. After eight years in business, he had a four-year backlog of customer orders. He limits his annual production to 40–50 bikes per year that sell for an average of $7,000 each. He uses a silver alloy that costs 20 times as much as brass (which is the industry standard) to join titanium tubes together to form a bike frame. White spends three hours taking a buyer’s measurements to determine the exact dimensions of the bike frame. He has resisted expanding production because it would undermine his strategy based on product leadership and customer intimacy. As White said, “If I ended up sacrificing what made Vanilla special just to make more bikes, that wouldn’t be worth it to me.”
Source: Christopher Steiner, “Heaven on Wheels,” Forbes, April 13, 2009, p. 75.
Enterprise Risk Management Skills
As a future manager, you need to understand that every business strategy, plan, and deci-
sion involves risks. Enterprise risk management is a process used by a company to
identify those risks and develop responses to them that enable it to be reasonably assured
of meeting its goals. The left-hand column of Exhibit 1–5 provides 12 examples of busi-
ness risks. This list is not exhaustive; rather, its purpose is to illustrate the diverse nature
of business risks that companies face. Whether the risks relate to the weather, computer
hackers, complying with the law, employee theft, or products harming customers, they all
have one thing in common: If the risks are not managed effectively, they can threaten a
company’s ability to meet its goals.
Once a company identifies its risks, it can respond to them in various ways such as
accepting, avoiding, or reducing the risk. Perhaps the most common risk management
tactic is to reduce risks by implementing specific controls. The right-hand column
of Exhibit 1–5 provides an example of a control that could be implemented to help
gar11005_ch01_001-023.indd 9gar11005_ch01_001-023.indd 9 02/11/10 3:43 PM02/11/10 3:43 PM
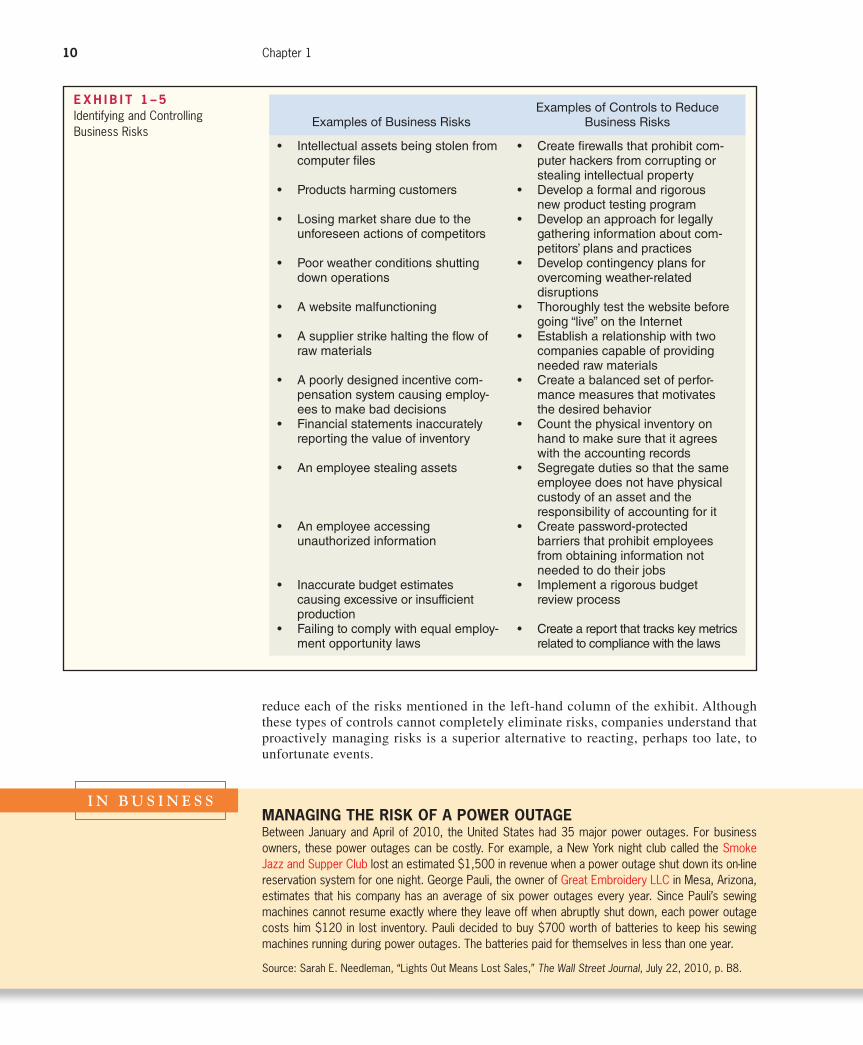
Confi rming Pages
10 Chapter 1
reduce each of the risks mentioned in the left-hand column of the exhibit. Although
these types of controls cannot completely eliminate risks, companies understand that
proactively managing risks is a superior alternative to reacting, perhaps too late, to
unfortunate events.
E X H I B I T 1 – 5Identifying and Controlling Business Risks
Examples of Business Risks
• Intellectual assets being stolen from computer fi les
• Products harming customers
• Losing market share due to the unforeseen actions of competitors
• Poor weather conditions shutting down operations
• A website malfunctioning
• A supplier strike halting the fl ow of raw materials
• A poorly designed incentive com-pensation system causing employ-ees to make bad decisions
• Financial statements inaccurately reporting the value of inventory
• An employee stealing assets
• An employee accessing unauthorized information
• Inaccurate budget estimates causing excessive or insufficient production
• Failing to comply with equal employ-ment opportunity laws
Examples of Controls to Reduce Business Risks
• Create fi rewalls that prohibit com-puter hackers from corrupting or stealing intellectual property
• Develop a formal and rigorous new product testing program
• Develop an approach for legally gathering information about com-petitors’ plans and practices
• Develop contingency plans for overcoming weather-related disruptions
• Thoroughly test the website before going “live” on the Internet
• Establish a relationship with two companies capable of providing needed raw materials
• Create a balanced set of perfor-mance measures that motivates the desired behavior
• Count the physical inventory on hand to make sure that it agrees with the accounting records
• Segregate duties so that the same employee does not have physical custody of an asset and the responsibility of accounting for it
• Create password-protected barriers that prohibit employees from obtaining information not needed to do their jobs
• Implement a rigorous budget review process
• Create a report that tracks key metrics related to compliance with the laws
I N B U S I N E S S MANAGING THE RISK OF A POWER OUTAGE Between January and April of 2010, the United States had 35 major power outages. For business owners, these power outages can be costly. For example, a New York night club called the Smoke Jazz and Supper Club lost an estimated $1,500 in revenue when a power outage shut down its on-line reservation system for one night. George Pauli, the owner of Great Embroidery LLC in Mesa, Arizona, estimates that his company has an average of six power outages every year. Since Pauli’s sewing machines cannot resume exactly where they leave off when abruptly shut down, each power outage costs him $120 in lost inventory. Pauli decided to buy $700 worth of batteries to keep his sewing machines running during power outages. The batteries paid for themselves in less than one year.
Source: Sarah E. Needleman, “Lights Out Means Lost Sales,” The Wall Street Journal, July 22, 2010, p. B8.
gar11005_ch01_001-023.indd 10gar11005_ch01_001-023.indd 10 02/11/10 3:43 PM02/11/10 3:43 PM
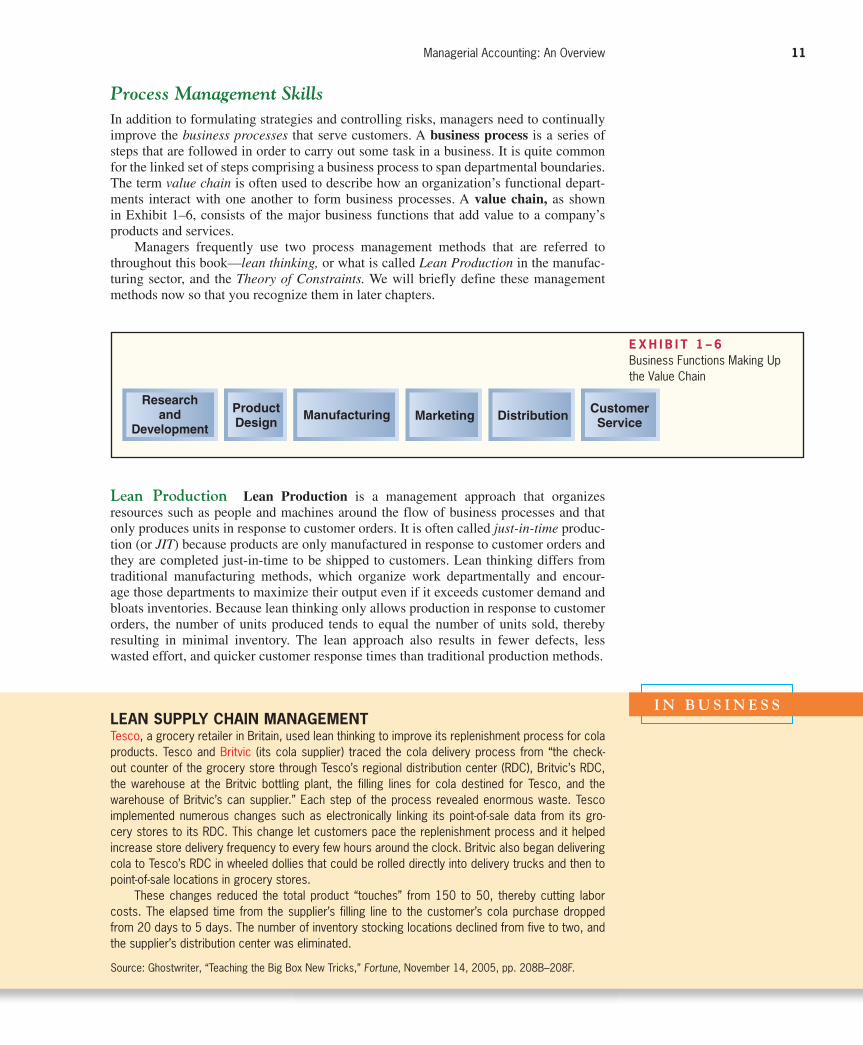
Confi rming Pages
Managerial Accounting: An Overview 11
Process Management Skills
In addition to formulating strategies and controlling risks, managers need to continually
improve the business processes that serve customers. A business process is a series of
steps that are followed in order to carry out some task in a business. It is quite common
for the linked set of steps comprising a business process to span departmental boundaries.
The term value chain is often used to describe how an organization’s functional depart-
ments interact with one another to form business processes. A value chain , as shown
in Exhibit 1–6 , consists of the major business functions that add value to a company’s
products and services.
Managers frequently use two process management methods that are referred to
throughout this book— lean thinking, or what is called Lean Production in the manufac-
turing sector, and the Theory of Constraints. We will briefly define these management
methods now so that you recognize them in later chapters.
ProductDesign
Manufacturing Marketing DistributionCustomerService
Researchand
Development
I N B U S I N E S S LEAN SUPPLY CHAIN MANAGEMENT Tesco, a grocery retailer in Britain, used lean thinking to improve its replenishment process for cola products. Tesco and Britvic (its cola supplier) traced the cola delivery process from “the check-out counter of the grocery store through Tesco’s regional distribution center (RDC), Britvic’s RDC, the warehouse at the Britvic bottling plant, the filling lines for cola destined for Tesco, and the warehouse of Britvic’s can supplier.” Each step of the process revealed enormous waste. Tesco implemented numerous changes such as electronically linking its point-of-sale data from its gro-cery stores to its RDC. This change let customers pace the replenishment process and it helped increase store delivery frequency to every few hours around the clock. Britvic also began delivering cola to Tesco’s RDC in wheeled dollies that could be rolled directly into delivery trucks and then to point-of-sale locations in grocery stores.
These changes reduced the total product “touches” from 150 to 50, thereby cutting labor costs. The elapsed time from the supplier’s filling line to the customer’s cola purchase dropped from 20 days to 5 days. The number of inventory stocking locations declined from five to two, and the supplier’s distribution center was eliminated.
Source: Ghostwriter, “Teaching the Big Box New Tricks,” Fortune, November 14, 2005, pp. 208B–208F.
E X H I B I T 1 – 6Business Functions Making Up the Value Chain
Lean Production Lean Production is a management approach that organizes
resources such as people and machines around the flow of business processes and that
only produces units in response to customer orders. It is often called just-in-time produc-
tion (or JIT ) because products are only manufactured in response to customer orders and
they are completed just-in-time to be shipped to customers. Lean thinking differs from
traditional manufacturing methods, which organize work departmentally and encour-
age those departments to maximize their output even if it exceeds customer demand and
bloats inventories. Because lean thinking only allows production in response to customer
orders, the number of units produced tends to equal the number of units sold, thereby
resulting in minimal inventory. The lean approach also results in fewer defects, less
wasted effort, and quicker customer response times than traditional production methods.
gar11005_ch01_001-023.indd 11gar11005_ch01_001-023.indd 11 02/11/10 3:43 PM02/11/10 3:43 PM
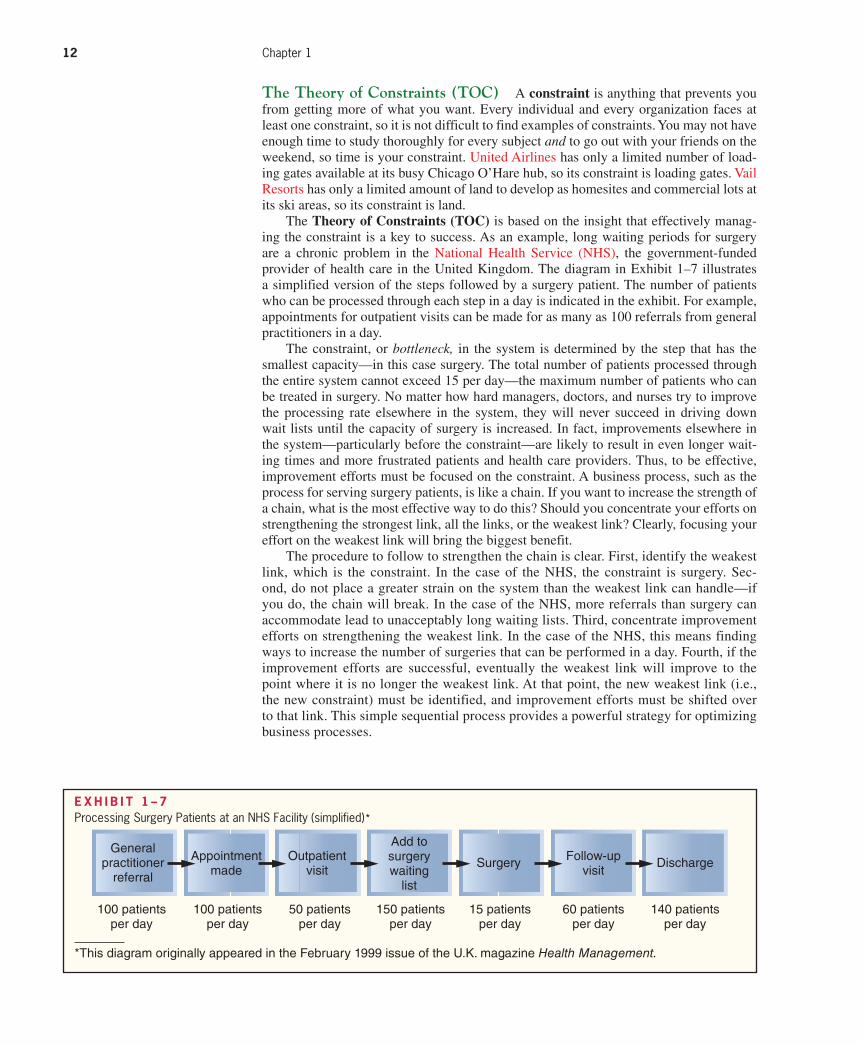
Confi rming Pages
12 Chapter 1
The Theory of Constraints (TOC) A constraint is anything that prevents you
from getting more of what you want. Every individual and every organization faces at
least one constraint, so it is not difficult to find examples of constraints. You may not have
enough time to study thoroughly for every subject and to go out with your friends on the
weekend, so time is your constraint. United Airlines has only a limited number of load-
ing gates available at its busy Chicago O’Hare hub, so its constraint is loading gates. Vail
Resorts has only a limited amount of land to develop as homesites and commercial lots at
its ski areas, so its constraint is land.
The Theory of Constraints (TOC) is based on the insight that effectively manag-
ing the constraint is a key to success. As an example, long waiting periods for surgery
are a chronic problem in the National Health Service (NHS), the government-funded
provider of health care in the United Kingdom. The diagram in Exhibit 1–7 illustrates
a simplified version of the steps followed by a surgery patient. The number of patients
who can be processed through each step in a day is indicated in the exhibit. For example,
appointments for outpatient visits can be made for as many as 100 referrals from general
practitioners in a day.
The constraint, or bottleneck, in the system is determined by the step that has the
smallest capacity—in this case surgery. The total number of patients processed through
the entire system cannot exceed 15 per day—the maximum number of patients who can
be treated in surgery. No matter how hard managers, doctors, and nurses try to improve
the processing rate elsewhere in the system, they will never succeed in driving down
wait lists until the capacity of surgery is increased. In fact, improvements elsewhere in
the system—particularly before the constraint—are likely to result in even longer wait-
ing times and more frustrated patients and health care providers. Thus, to be effective,
improvement efforts must be focused on the constraint. A business process, such as the
process for serving surgery patients, is like a chain. If you want to increase the strength of
a chain, what is the most effective way to do this? Should you concentrate your efforts on
strengthening the strongest link, all the links, or the weakest link? Clearly, focusing your
effort on the weakest link will bring the biggest benefit.
The procedure to follow to strengthen the chain is clear. First, identify the weakest
link, which is the constraint. In the case of the NHS, the constraint is surgery. Sec-
ond, do not place a greater strain on the system than the weakest link can handle—if
you do, the chain will break. In the case of the NHS, more referrals than surgery can
accommodate lead to unacceptably long waiting lists. Third, concentrate improvement
efforts on strengthening the weakest link. In the case of the NHS, this means finding
ways to increase the number of surgeries that can be performed in a day. Fourth, if the
improvement efforts are successful, eventually the weakest link will improve to the
point where it is no longer the weakest link. At that point, the new weakest link (i.e.,
the new constraint) must be identified, and improvement efforts must be shifted over
to that link. This simple sequential process provides a powerful strategy for optimizing
business processes.
Generalpractitioner
referral
100 patientsper day
100 patientsper day
50 patientsper day
150 patientsper day
15 patientsper day
60 patientsper day
140 patientsper day
Appointmentmade
Outpatientvisit
Add tosurgerywaiting
list
Surgery Follow-upvisit
Discharge
E X H I B I T 1 – 7Processing Surgery Patients at an NHS Facility (simplified)*
*This diagram originally appeared in the February 1999 issue of the U.K. magazine Health Management.
gar11005_ch01_001-023.indd 12gar11005_ch01_001-023.indd 12 02/11/10 3:43 PM02/11/10 3:43 PM
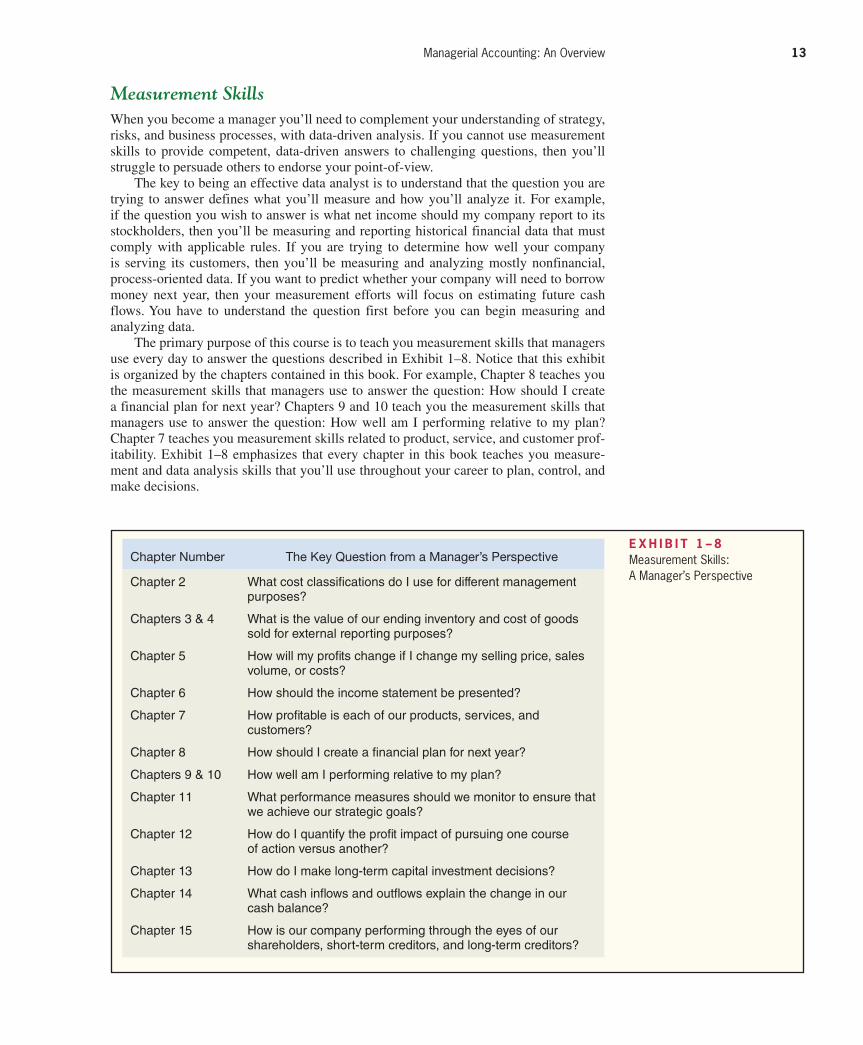
Confi rming Pages
Managerial Accounting: An Overview 13
Measurement Skills
When you become a manager you’ll need to complement your understanding of strategy,
risks, and business processes, with data-driven analysis. If you cannot use measurement
skills to provide competent, data-driven answers to challenging questions, then you’ll
struggle to persuade others to endorse your point-of-view.
The key to being an effective data analyst is to understand that the question you are
trying to answer defines what you’ll measure and how you’ll analyze it. For example,
if the question you wish to answer is what net income should my company report to its
stockholders, then you’ll be measuring and reporting historical financial data that must
comply with applicable rules. If you are trying to determine how well your company
is serving its customers, then you’ll be measuring and analyzing mostly nonfinancial,
process-oriented data. If you want to predict whether your company will need to borrow
money next year, then your measurement efforts will focus on estimating future cash
flows. You have to understand the question first before you can begin measuring and
analyzing data.
The primary purpose of this course is to teach you measurement skills that managers
use every day to answer the questions described in Exhibit 1–8 . Notice that this exhibit
is organized by the chapters contained in this book. For example, Chapter 8 teaches you
the measurement skills that managers use to answer the question: How should I create
a financial plan for next year? Chapters 9 and 10 teach you the measurement skills that
managers use to answer the question: How well am I performing relative to my plan?
Chapter 7 teaches you measurement skills related to product, service, and customer prof-
itability. Exhibit 1–8 emphasizes that every chapter in this book teaches you measure-
ment and data analysis skills that you’ll use throughout your career to plan, control, and
make decisions.
Chapter Number The Key Question from a Manager’s Perspective
Chapter 2 What cost classifi cations do I use for different management purposes?
Chapters 3 & 4 What is the value of our ending inventory and cost of goods sold for external reporting purposes?
Chapter 5 How will my profi ts change if I change my selling price, sales volume, or costs?
Chapter 6 How should the income statement be presented?
Chapter 7 How profi table is each of our products, services, and customers?
Chapter 8 How should I create a fi nancial plan for next year?
Chapters 9 & 10 How well am I performing relative to my plan?
Chapter 11 What performance measures should we monitor to ensure that we achieve our strategic goals?
Chapter 12 How do I quantify the profi t impact of pursuing one course of action versus another?
Chapter 13 How do I make long-term capital investment decisions?
Chapter 14 What cash infl ows and outfl ows explain the change in our cash balance?
Chapter 15 How is our company performing through the eyes of our shareholders, short-term creditors, and long-term creditors?
E X H I B I T 1 – 8Measurement Skills: A Manager’s Perspective
gar11005_ch01_001-023.indd 13gar11005_ch01_001-023.indd 13 02/11/10 3:43 PM02/11/10 3:43 PM

Confi rming Pages
14 Chapter 1
Leadership Skills
Leadership skills will be critical to your career development for the simple reason that
organizations are managed by people, not data and spreadsheets. These people have their
own personal interests, insecurities, beliefs, and data-supported conclusions that ensure
unanimous support for a given course of action is the exception rather than the rule.
Therefore, managers must possess strong leadership skills if they wish to channel their
co-workers’ efforts toward achieving organizational goals.
To become an effective leader, you’ll need to develop six skills. First, you’ll need
to be technically competent within your area of expertise and knowledgeable of your
company’s operations outside your functional area of expertise. You cannot lead others
(particularly those co-workers outside of your department) if they believe that you are
technically incompetent or unfamiliar with how the company actually operates. Second,
you must be a person of high integrity. This requires that you not only make ethically
grounded decisions yourself, but also that your words and actions help build a culture of
organizational integrity. We will have more to say about the importance of ethics shortly.
Third, you need to understand how to effectively implement organizational change. Peo-
ple tend to prefer the status quo, so it is often difficult to implement any type of change
in a company. To implement change, leaders need to define a vision for the future and be
able to motivate and enable others to achieve the vision.
Fourth, leaders need strong communication skills. This includes compelling presen-
tation skills and effective listening skills. They must be able to speak in operational terms
and financial terms to communicate effectively with co-workers across the organization.
Fifth, leaders must be capable of motivating and mentoring other individuals. As your
career evolves, if you cannot advance the skills of your subordinates, then you will not be
promoted to jobs that have increasing numbers of people reporting to you. Finally, lead-
ers need to effectively manage team-based decision processes. This requires motivating
the team to objectively synthesize data, weigh alternatives, and build consensus around
the chosen course of action.
The Importance of Ethics in Business
At the turn of this century, a series of major financial scandals involving Enron, Tyco
International, HealthSouth, Adelphia Communications, WorldCom, Global Crossing,
Rite Aid, and other companies raised deep concerns about ethics in business. The man-
agers and companies involved in these scandals suffered mightily—from huge fines to
jail terms and financial collapse. And the recognition that ethical behavior is absolutely
essential for the functioning of our economy led to numerous regulatory changes—some
of which we will discuss in a later appendix on corporate governance. But why is ethical
behavior so important? This is not a matter of just being “nice.” Ethical behavior is the
lubricant that keeps the economy running. Without that lubricant, the economy would
operate much less efficiently—less would be available to consumers, quality would be
lower, and prices would be higher. In other words, without fundamental trust in the integ-
rity of businesses, the economy would operate much less efficiently. James Surowiecki
summed up this point as follows:
[F]lourishing economies require a healthy level of trust in the reliability and
fairness of everyday transactions. If you assumed every potential deal was a
rip-off or that the products you were buying were probably going to be lem-
ons, then very little business would get done. More important, the costs of the
transactions that did take place would be exorbitant because you’d have to do
enormous work to investigate each deal and you’d have to rely on the threat
of legal action to enforce every contract. For an economy to prosper, what’s
needed is not a Pollyannaish faith that everyone else has your best interests at
gar11005_ch01_001-023.indd 14gar11005_ch01_001-023.indd 14 02/11/10 3:43 PM02/11/10 3:43 PM
Confi rming Pages
Managerial Accounting: An Overview 15
heart—“caveat emptor” [buyer beware] remains an important truth—but a basic
confidence in the promises and commitments that people make about their prod-
ucts and services. 2
Thus, for the good of everyone—including profit-making companies—it is vitally
important that business be conducted within an ethical framework that builds and
sustains trust.
The Institute of Management Accountants (IMA) of the United States has adopted an
ethical code called the Statement of Ethical Professional Practice that describes in some
detail the ethical responsibilities of management accountants. Even though the stan-
dards were specifically developed for management accountants, they have much broader
application.
Code of Conduct for Management Accountants
The IMA’s Statement of Ethical Professional Practice consists of two parts that are pre-
sented in full in Exhibit 1–9 (page 16). The first part provides general guidelines for ethi-
cal behavior. In a nutshell, a management accountant has ethical responsibilities in four
broad areas: first, to maintain a high level of professional competence; second, to treat
sensitive matters with confidentiality; third, to maintain personal integrity; and fourth,
to disclose information in a credible fashion. The second part of the standards specifies
what should be done if an individual finds evidence of ethical misconduct. We recom-
mend that you stop at this point and read all of Exhibit 1–9 .
The ethical standards provide sound, practical advice for management accountants
and managers. Most of the rules in the ethical standards are motivated by a very practical
consideration—if these rules were not generally followed in business, then the economy
and all of us would suffer. Consider the following specific examples of the consequences
of not abiding by the standards:
• Suppose employees could not be trusted with confidential information. Then top man-
agers would be reluctant to distribute such information within the company and, as
a result, decisions would be based on incomplete information and operations would
deteriorate.
• Suppose employees accepted bribes from suppliers. Then contracts would tend to go
to suppliers who pay the highest bribes rather than to the most competent suppliers.
Would you like to fly in aircraft whose wings were made by the subcontractor who
paid the highest bribe? Would you fly as often? What would happen to the airline
industry if its safety record deteriorated due to shoddy workmanship on contracted
parts and assemblies?
• Suppose the presidents of companies routinely lied in their annual reports and finan-
cial statements. If investors could not rely on the basic integrity of a company’s
financial statements, they would have little basis for making informed decisions.
Suspecting the worst, rational investors would pay less for securities issued by com-
panies and may not be willing to invest at all. As a consequence, companies would
have less money for productive investments—leading to slower economic growth,
fewer goods and services, and higher prices.
As these examples suggest, if ethical standards were not generally adhered to, everyone
would suffer—businesses as well as consumers. Essentially, abandoning ethical stan-
dards would lead to a lower standard of living with lower-quality goods and services, less
to choose from, and higher prices. In short, following ethical rules such as those in the
Statement of Ethical Professional Practice is absolutely essential for the smooth function-
ing of an advanced market economy.
2 James Surowiecki, “A Virtuous Cycle,” Forbes, December 23, 2002, pp. 248–256. Reprinted by Per-
mission of Forbes Magazine © 2006 Forbes Inc.
gar11005_ch01_001-023.indd 15gar11005_ch01_001-023.indd 15 02/11/10 3:43 PM02/11/10 3:43 PM

Confi rming Pages
Members of IMA shall behave ethically. A commitment to ethical professional practice inclu des: overarching principles that express our values, and standards that guide our conduct.
PRINCIPLES
IMA’s overarching ethical principles include: Honesty, Fairness, Objectivity, and Responsibility. Members shall act in accordance with these principles and shall encourage others within their organizations to adhere to them.
STANDARDS
A member’s failure to comply with the following standards may result in disciplinary action.
I. COMPETENCE
Each member has a responsibility to:1. Maintain an appropriate level of professional expertise by continually developing knowledge and skills.2. Perform professional duties in accordance with relevant laws, regulations, and
technical standards.3. Provide decision support information and recommendations that are accurate, clear, concise, and timely.4. Recognize and communicate professional limitations or other constraints that
would preclude responsible judgment or successful performance of an activity.
II. CONFIDENTIALITY
Each member has a responsibility to:1. Keep information confi dential except when disclosure is authorized or legally required.2. Inform all relevant parties regarding appropriate use of confi dential information. Monitor subordinates’ activities to
ensure compliance.3. Refrain from using confi dential information for unethical or illegal advantage.
III. INTEGRITY
Each member has a responsibility to:1. Mitigate actual confl icts of interest. Regularly communicate with business associates to avoid apparent confl icts of
interest. Advise all parties of any potential confl icts.2. Refrain from engaging in any conduct that would prejudice carrying out duties ethically.3. Abstain from engaging in or supporting any activity that might discredit the profession.
IV. CREDIBILITY
Each member has a responsibility to:1. Communicate information fairly and objectively.2. Disclose all relevant information that could reasonably be expected to infl uence an intended user’s understanding
of the reports, analyses, or recommendations.3. Disclose delays or defi ciencies in information, timeliness, processing, or internal controls in conformance with
organization policy and/or applicable law.
RESOLUTION OF ETHICAL CONFLICT
In applying the Standards of Ethical Professional Practice, you may encounter problems identifying unethical behavior or resolving an ethical confl ict. When faced with ethical issues, you should follow your organization’s established policies on the resolution of such confl ict. If these policies do not resolve the ethical confl ict, you should consider the following courses of action:1. Discuss the issue with your immediate supervisor except when it appears that the supervisor is involved. In that
case, present the issue to the next level. If you cannot achieve a satisfactory resolution, submit the issue to the next management level. If your immediate superior is the chief executive officer or equivalent, the acceptable reviewing authority may be a group such as the audit committee, executive committee, board of directors, board of trustees, or owners. Contact with levels above the immediate superior should be initiated only with your superior’s knowledge, assuming he or she is not involved. Communication of such problems to authorities or individuals not employed or engaged by the organization is not considered appropriate, unless you believe there is a clear viola-tion of the law.
2. Clarify relevant ethical issues by initiating a confi dential discussion with an IMA Ethics Counselor or other impartial advisor to obtain a better understanding of possible courses of action.
3. Consult your own attorney as to legal obligations and rights concerning the ethical confl ict.
E X H I B I T 1–9IMA Statement of Ethical Professional Practice
16
gar11005_ch01_001-023.indd 16gar11005_ch01_001-023.indd 16 02/11/10 3:43 PM02/11/10 3:43 PM
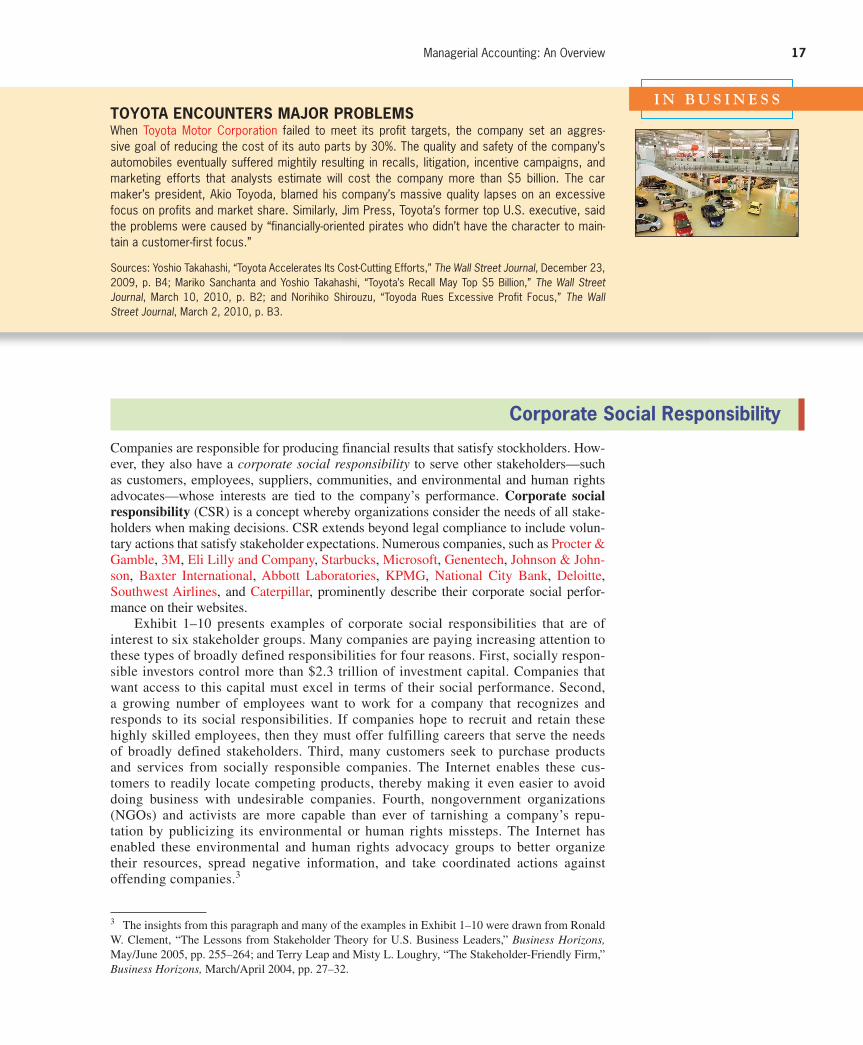
Confi rming Pages
Managerial Accounting: An Overview 17
Corporate Social Responsibility
Companies are responsible for producing financial results that satisfy stockholders. How-
ever, they also have a corporate social responsibility to serve other stakeholders—such
as customers, employees, suppliers, communities, and environmental and human rights
advocates—whose interests are tied to the company’s performance. Corporate social responsibility (CSR) is a concept whereby organizations consider the needs of all stake-
holders when making decisions. CSR extends beyond legal compliance to include volun-
tary actions that satisfy stakeholder expectations. Numerous companies, such as Procter &
Gamble, 3M, Eli Lilly and Company, Starbucks, Microsoft, Genentech, Johnson & John-
son, Baxter International, Abbott Laboratories, KPMG, National City Bank, Deloitte,
Southwest Airlines, and Caterpillar, prominently describe their corporate social perfor-
mance on their websites.
Exhibit 1–10 presents examples of corporate social responsibilities that are of
interest to six stakeholder groups. Many companies are paying increasing attention to
these types of broadly defined responsibilities for four reasons. First, socially respon-
sible investors control more than $2.3 trillion of investment capital. Companies that
want access to this capital must excel in terms of their social performance. Second,
a growing number of employees want to work for a company that recognizes and
responds to its social responsibilities. If companies hope to recruit and retain these
highly skilled employees, then they must offer fulfilling careers that serve the needs
of broadly defined stakeholders. Third, many customers seek to purchase products
and services from socially responsible companies. The Internet enables these cus-
tomers to readily locate competing products, thereby making it even easier to avoid
doing business with undesirable companies. Fourth, nongovernment organizations
(NGOs) and activists are more capable than ever of tarnishing a company’s repu-
tation by publicizing its environmental or human rights missteps. The Internet has
enabled these environmental and human rights advocacy groups to better organize
their resources, spread negative information, and take coordinated actions against
offending companies. 3
3 The insights from this paragraph and many of the examples in Exhibit 1–10 were drawn from Ronald
W. Clement, “The Lessons from Stakeholder Theory for U.S. Business Leaders,” Business Horizons,May/June 2005, pp. 255–264; and Terry Leap and Misty L. Loughry, “The Stakeholder-Friendly Firm,”
Business Horizons, March/April 2004, pp. 27–32.
I N B U S I N E S S TOYOTA ENCOUNTERS MAJOR PROBLEMS When Toyota Motor Corporation failed to meet its profit targets, the company set an aggres-sive goal of reducing the cost of its auto parts by 30%. The quality and safety of the company’s automobiles eventually suffered mightily resulting in recalls, litigation, incentive campaigns, and marketing efforts that analysts estimate will cost the company more than $5 billion. The car maker’s president, Akio Toyoda, blamed his company’s massive quality lapses on an excessive focus on profits and market share. Similarly, Jim Press, Toyota’s former top U.S. executive, said the problems were caused by “financially-oriented pirates who didn’t have the character to main-tain a customer-first focus.”
Sources: Yoshio Takahashi, “Toyota Accelerates Its Cost-Cutting Efforts,” The Wall Street Journal, December 23, 2009, p. B4; Mariko Sanchanta and Yoshio Takahashi, “Toyota’s Recall May Top $5 Billion,” The Wall Street Journal, March 10, 2010, p. B2; and Norihiko Shirouzu, “Toyoda Rues Excessive Profit Focus,” The Wall Street Journal, March 2, 2010, p. B3.
gar11005_ch01_001-023.indd 17gar11005_ch01_001-023.indd 17 02/11/10 3:43 PM02/11/10 3:43 PM
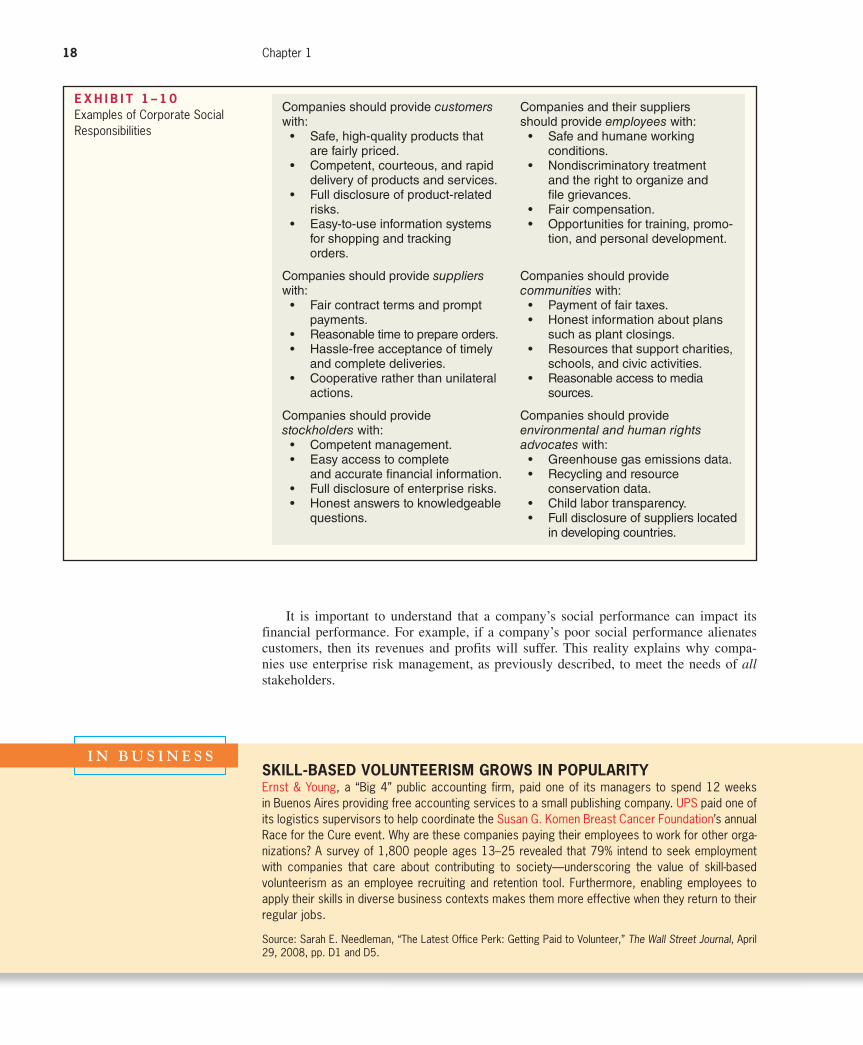
Confi rming Pages
18 Chapter 1
Companies should provide customers with:
• Safe, high-quality products that are fairly priced.
• Competent, courteous, and rapid delivery of products and services.
• Full disclosure of product-related risks.
• Easy-to-use information systems for shopping and tracking orders.
Companies should provide suppliers with:
• Fair contract terms and prompt payments.
• Reasonable time to prepare orders. • Hassle-free acceptance of timely
and complete deliveries. • Cooperative rather than unilateral
actions.
Companies should provide stockholders with:
• Competent management . • Easy access to complete
and accurate fi nancial information. • Full disclosure of enterprise risks. • Honest answers to knowledgeable
questions.
Companies and their suppliers should provide employees with:
• Safe and humane working conditions.
• Nondiscriminatory treatment and the right to organize and fi le grievances.
• Fair compensation. • Opportunities for training, promo-
tion, and personal development.
Companies should provide communities with:
• Payment of fair taxes. • Honest information about plans
such as plant closings. • Resources that support charities,
schools, and civic activities. • Reasonable access to media
sources.
Companies should provide environmental and human rights advocates with:
• Greenhouse gas emissions data. • Recycling and resource
conservation data. • Child labor transparency. • Full disclosure of suppliers located
in developing countries.
E X H I B I T 1 – 1 0Examples of Corporate Social Responsibilities
I N B U S I N E S S SKILL-BASED VOLUNTEERISM GROWS IN POPULARITY Ernst & Young, a “Big 4” public accounting firm, paid one of its managers to spend 12 weeks in Buenos Aires providing free accounting services to a small publishing company. UPS paid one of its logistics supervisors to help coordinate the Susan G. Komen Breast Cancer Foundation ’s annual Race for the Cure event. Why are these companies paying their employees to work for other orga-nizations? A survey of 1,800 people ages 13–25 revealed that 79% intend to seek employment with companies that care about contributing to society—underscoring the value of skill-based volunteerism as an employee recruiting and retention tool. Furthermore, enabling employees to apply their skills in diverse business contexts makes them more effective when they return to their regular jobs.
Source: Sarah E. Needleman, “The Latest Office Perk: Getting Paid to Volunteer,” The Wall Street Journal, April 29, 2008, pp. D1 and D5.
It is important to understand that a company’s social performance can impact its
financial performance. For example, if a company’s poor social performance alienates
customers, then its revenues and profits will suffer. This reality explains why compa-
nies use enterprise risk management, as previously described, to meet the needs of allstakeholders.
gar11005_ch01_001-023.indd 18gar11005_ch01_001-023.indd 18 02/11/10 3:44 PM02/11/10 3:44 PM
Confi rming Pages
Managerial Accounting: An Overview 19
Summary
This chapter defined managerial accounting, explained why it is relevant to business and account-
ing majors, and described various skills that managers need to do their jobs. It also discussed the
importance of ethics in business and corporate social responsibility. The most important goal of
this chapter was to help you understand that managerial accounting matters to your future career,
regardless of your major. Accounting is the language of business and you’ll need to speak this lan-
guage to communicate effectively with and influence fellow managers.
Glossary
Budget A detailed plan for the future that is usually expressed in formal quantitative terms.
(p. 3)
Business process A series of steps that are followed in order to carry out some task in a business.
(p. 11)
Constraint Anything that prevents you from getting more of what you want. (p. 12)
Controlling The process of gathering feedback to ensure that a plan is being properly executed or
modified as circumstances change. (p. 3)
Corporate social responsibility A concept whereby organizations consider the needs of all stake-
holders when making decisions. (p. 17)
Decision making Selecting a course of action from competing alternatives. (p. 3)
Enterprise risk management A process used by a company to identify its risks and develop
responses to them that enable it to be reasonably assured of meeting its goals. (p. 9)
Financial accounting The phase of accounting that is concerned with reporting historical finan-
cial information to external parties, such as stockholders, creditors, and regulators. (p. 2)
Lean Production A management approach that organizes resources such as people and machines
around the flow of business processes and that only produces units in response to customer
orders. (p. 11)
Managerial accounting The phase of accounting that is concerned with providing information to
managers for use within the organization. (p. 2)
Performance report A report that compares budgeted data to actual data to highlight instances of
excellent and unsatisfactory performance. (p. 4)
Planning The process of establishing goals and specifying how to achieve them. (p. 3)
Segment A part or activity of an organization about which managers would like cost, revenue, or
profit data. (p. 3)
Strategy A company’s “game plan” for attracting customers by distinguishing itself from
competitors. (p. 8)
Theory of Constraints A management approach that emphasizes the importance of managing
constraints. (p. 12)
Value chain The major business functions that add value to a company’s products and services,
such as research and development, product design, manufacturing, marketing, distribution,
and customer service. (p. 11)
Questions
1–1 How does managerial accounting differ from financial accounting?
1–2 Pick any major television network and describe some planning and control activities that
its managers would engage in.
1–3 If you had to decide whether to continue making a component part or to begin buying
the part from an overseas supplier, what quantitative and qualitative factors would influ-
ence your decision?
1–4 Why do companies prepare budgets?
1–5 Why is managerial accounting relevant to business majors and their future careers?
1–6 Why is managerial accounting relevant to accounting majors and their future careers?
1–7 Pick any large company and describe its strategy using the framework in the chapter.
gar11005_ch01_001-023.indd 19gar11005_ch01_001-023.indd 19 02/11/10 3:44 PM02/11/10 3:44 PM
Confi rming Pages
20 Chapter 1
1–8 Why do management accountants need to understand their company’s strategy?
1–9 Pick any large company and describe three risks that it faces and how it responds to those
risks.
1–10 Provide three examples of how a company’s risks can influence its planning, controlling,
and decision-making activities.
1–11 Pick any large company and explain three ways that it could segment its companywide
performance.
1–12 Locate the website of any company that publishes a corporate social responsibility report
(also referred to as a sustainability report). Describe three nonfinancial performance mea-
sures included in the report. Why do you think the company publishes this report?
1 –13 Why do companies that implement Lean Production tend to have minimal inventories?
1–14 Why are leadership skills important to managers?
1–15 Why is ethics important to business?
Multiple-choice questions are provided on the text website at www.mhhe.com/garrison14e.
Appendix 1A: Corporate Governance
Effective corporate governance enhances stockholders’ confidence that a com-
pany is being run in their best interests rather than in the interests of top managers.
Corporate governance is the system by which a company is directed and controlled. If
properly implemented, the corporate governance system should provide incentives
for the board of directors and top management to pursue objectives that are in the
interests of the company’s owners and it should provide for effective monitoring of
performance. 1
Unfortunately, history has repeatedly shown that unscrupulous top managers,
if unchecked, can exploit their power to defraud stockholders. This unpleasant real-
ity became all too clear in 2001 when the fall of Enron kicked off a wave of corporate
scandals. These scandals were characterized by financial reporting fraud and misuse of
corporate funds at the very highest levels—including CEOs and CFOs. While this was
disturbing in itself, it also indicated that the institutions intended to prevent such abuses
weren’t working, thus raising fundamental questions about the adequacy of the existing
corporate governance system. In an attempt to respond to these concerns, the U.S. Con-
gress passed the most important reform of corporate governance in many decades— The Sarbanes-Oxley Act of 2002.
The Sarbanes-Oxley Act of 2002
The Sarbanes-Oxley Act of 2002 was intended to protect the interests of those who
invest in publicly traded companies by improving the reliability and accuracy of corpo-
rate financial reports and disclosures. We would like to highlight six key aspects of the
legislation. 2
First, the Act requires that both the CEO and CFO certify in writing that their com-
pany’s financial statements and accompanying disclosures fairly represent the results of
operations—with possible jail time if a CEO or CFO certifies results that they know
are false. This creates very powerful incentives for the CEO and CFO to ensure that the
financial statements contain no misrepresentations.
Second, the Act established the Public Company Accounting Oversight Board to
provide additional oversight over the audit profession. The Act authorizes the Board
1 This definition of corporate governance was adapted from the 2004 report titled OECD Principles of
Corporate Governance published by the Organization for Economic Co-Operation and Development. 2 A summary of the Sarbanes-Oxley Act of 2002 can be obtained from the American Institute of Certi-
fied Public Accountants (AICPA) website http://thecaq.aicpa.org/Resources/Sarbanes + Oxley .
gar11005_ch01_001-023.indd 20gar11005_ch01_001-023.indd 20 02/11/10 3:44 PM02/11/10 3:44 PM

Confi rming Pages
Managerial Accounting: An Overview 21
to conduct investigations, to take disciplinary actions against audit firms, and to enact
various standards and rules concerning the preparation of audit reports.
Third, the Act places the power to hire, compensate, and terminate the public
accounting firm that audits a company’s financial reports in the hands of the audit com-
mittee of the board of directors. Previously, management often had the power to hire and
fire its auditors. Furthermore, the Act specifies that all members of the audit committee
must be independent, meaning that they do not have an affiliation with the company they
are overseeing, nor do they receive any consulting or advisory compensation from the
company.
Fourth, the Act places important restrictions on audit firms. Historically, public
accounting firms earned a large part of their profits by providing consulting services to
the companies that they audited. This provided the appearance of a lack of independence
because a client that was dissatisfied with an auditor’s stance on an accounting issue
might threaten to stop using the auditor as a consultant. To avoid this possible conflict
of interests, the Act prohibits a public accounting firm from providing a wide variety of
nonauditing services to an audit client.
Fifth, the Act requires that a company’s annual report contain an internal control report. Internal controls are put in place by management to provide assurance to inves-
tors that financial disclosures are reliable. The report must state that it is management’s
responsibility to establish and maintain adequate internal controls and it must contain an
assessment by management of the effectiveness of its internal control structure. The internal
control report is accompanied by an opinion from the company’s audit firm as to whether
management has maintained effective internal control over its financial reporting process.
Finally, the Act establishes severe penalties of as many as 20 years in prison for
altering or destroying any documents that may eventually be used in an official proceed-
ing and as many as 10 years in prison for managers who retaliate against a so-called
whistle-blower who goes outside the chain of command to report misconduct. Collec-
tively, these six aspects of the Sarbanes-Oxley Act of 2002 should help reduce the inci-
dence of fraudulent financial reporting.
Internal Control—A Closer Look
Internal control is an important concept for all managers to understand and, although
you may not be aware of it, it also plays an important role in your personal life. Internal control is a process designed to provide reasonable assurance that objectives are being
achieved. For example, one objective for your personal life is to live to a ripe old age.
Unfortunately, there are risks that we all encounter that may prohibit us from achieving
this objective. For example, we may die prematurely due to a heart attack, a car accident,
or a house fire. To reduce the risk of these unfortunate events occurring, we implement
controls in our lives. We may exercise regularly and make nutritional food choices to
reduce the likelihood of a heart attack. We always wear seat belts and instruct our friends
to prohibit us from drinking alcohol and driving a vehicle to reduce the risk of a fatal car
crash. We install fire detectors in our homes to reduce the risk of a fatal fire. In short,
internal controls are an integral part of our daily lives.
A company uses internal controls to provide reasonable assurance that its financial
reports are reliable. 3 Its financial statements may contain intentional or unintentional
errors for three reasons. First, the statements may erroneously exclude some transactions.
For example, the income statement may fail to include legitimate expenses. Second, the
statements may improperly include some transactions. For example, the income state-
ment may include sales revenue that was not earned during the current period. Third, the
statements may include transactions that have been recorded erroneously. For example,
an expense or sales transaction may be recorded at the wrong amount.
3 Companies also use internal controls to achieve efficient and effective operations and to ensure com-
pliance with applicable laws and regulations.
gar11005_ch01_001-023.indd 21gar11005_ch01_001-023.indd 21 02/11/10 3:44 PM02/11/10 3:44 PM
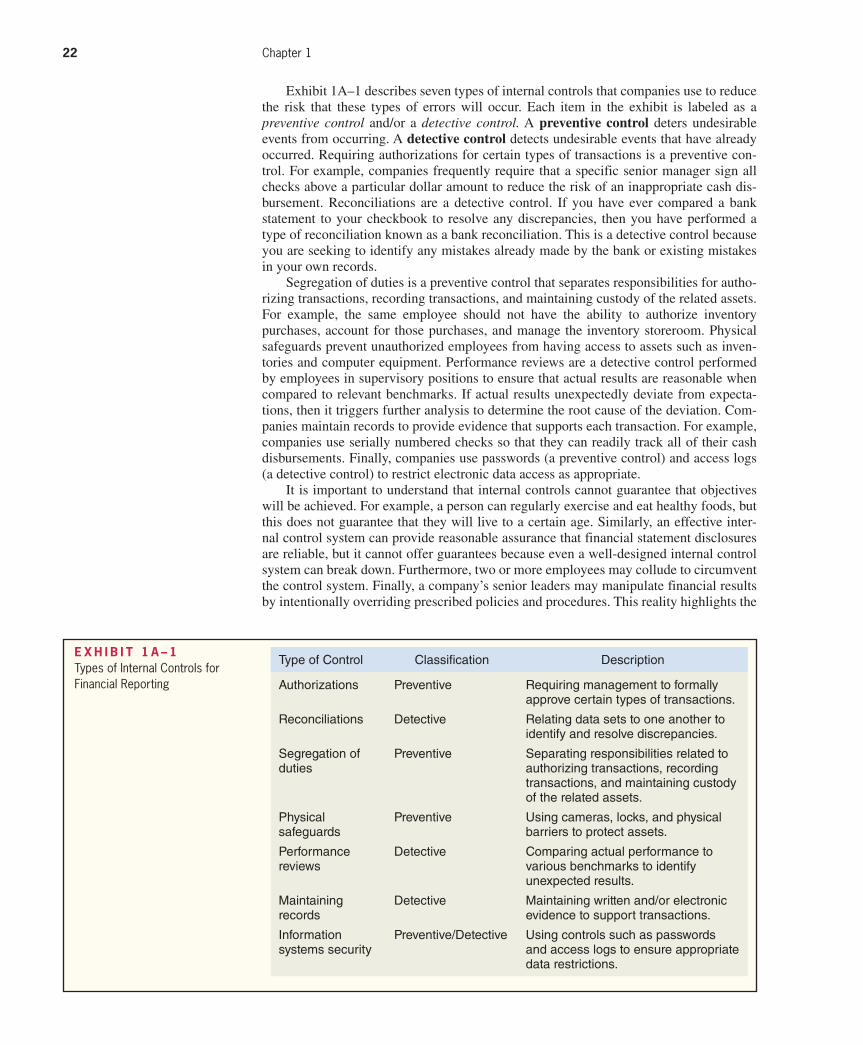
Rev.Confi rming Pages
22 Chapter 1
Exhibit 1A–1 describes seven types of internal controls that companies use to reduce
the risk that these types of errors will occur. Each item in the exhibit is labeled as a
preventive control and/or a detective control. A preventive control deters undesirable
events from occurring. A detective control detects undesirable events that have already
occurred. Requiring authorizations for certain types of transactions is a preventive con-
trol. For example, companies frequently require that a specific senior manager sign all
checks above a particular dollar amount to reduce the risk of an inappropriate cash dis-
bursement. Reconciliations are a detective control. If you have ever compared a bank
statement to your checkbook to resolve any discrepancies, then you have performed a
type of reconciliation known as a bank reconciliation. This is a detective control because
you are seeking to identify any mistakes already made by the bank or existing mistakes
in your own records.
Segregation of duties is a preventive control that separates responsibilities for autho-
rizing transactions, recording transactions, and maintaining custody of the related assets.
For example, the same employee should not have the ability to authorize inventory
purchases, account for those purchases, and manage the inventory storeroom. Physical
safeguards prevent unauthorized employees from having access to assets such as inven-
tories and computer equipment. Performance reviews are a detective control performed
by employees in supervisory positions to ensure that actual results are reasonable when
compared to relevant benchmarks. If actual results unexpectedly deviate from expecta-
tions, then it triggers further analysis to determine the root cause of the deviation. Com-
panies maintain records to provide evidence that supports each transaction. For example,
companies use serially numbered checks so that they can readily track all of their cash
disbursements. Finally, companies use passwords (a preventive control) and access logs
(a detective control) to restrict electronic data access as appropriate.
It is important to understand that internal controls cannot guarantee that objectives
will be achieved. For example, a person can regularly exercise and eat healthy foods, but
this does not guarantee that they will live to a certain age. Similarly, an effective inter-
nal control system can provide reasonable assurance that financial statement disclosures
are reliable, but it cannot offer guarantees because even a well-designed internal control
system can break down. Furthermore, two or more employees may collude to circumvent
the control system. Finally, a company’s senior leaders may manipulate financial results
by intentionally overriding prescribed policies and procedures. This reality highlights the
Type of Control Classifi cation Description
Authorizations Preventive Requiring management to formally approve certain types of transactions.
Reconciliations Detective Relating data sets to one another to identify and resolve discrepancies.
Segregation of duties
Preventive Separating responsibilities related to authorizing transactions, recording transactions, and maintaining custody of the related assets.
Physical safeguards
Preventive Using cameras, locks, and physical barriers to protect assets.
Performance reviews
Detective Comparing actual performance to various benchmarks to identify unexpected results.
Maintaining records
Detective Maintaining written and/or electronic evidence to support transactions.
Information systems security
Preventive/Detective Using controls such as passwords and access logs to ensure appropriate data restrictions.
E X H I B I T 1 A – 1Types of Internal Controls for Financial Reporting
gar11005_ch01_001-023.indd 22gar11005_ch01_001-023.indd 22 10/11/10 3:38 PM10/11/10 3:38 PM
Confi rming Pages
Managerial Accounting: An Overview 23
importance of having senior leaders (including the chief executive officer, the chief finan-
cial officer, and the audit committee of the board of directors) who value the importance
of effective internal controls and are committed to creating an ethical “tone at the top” of
the organization.
Glossary
Corporate governance The system by which a company is directed and controlled. (p. 20)
Detective control A control that detects undesirable events that have already occurred. (p. 22)
Internal control A process designed to provide reasonable assurance that objectives are being
achieved. (p. 21)
Preventive control A control that deters undesirable events from occurring. (p. 22)
Sarbanes-Oxley Act of 2002 A law intended to protect the interests of those who invest in pub-
licly traded companies by improving the reliability and accuracy of corporate financial reports
and discloures. (p. 20)
Questions
1A–1 Imagine that you are the head coach of a college sports team. One of your most impor-
tant objectives is to win as many games as possible. Describe some controls that you
would implement to help achieve the objective of winning as many games as possible.
1A–2 Perhaps your most important post-graduation objective is to get a job. Describe some
control activities that you would pursue to help achieve this objective.
1A–3 Describe some controls that parents use to keep their homes safe for themselves and their
children.
gar11005_ch01_001-023.indd 23gar11005_ch01_001-023.indd 23 02/11/10 3:44 PM02/11/10 3:44 PM
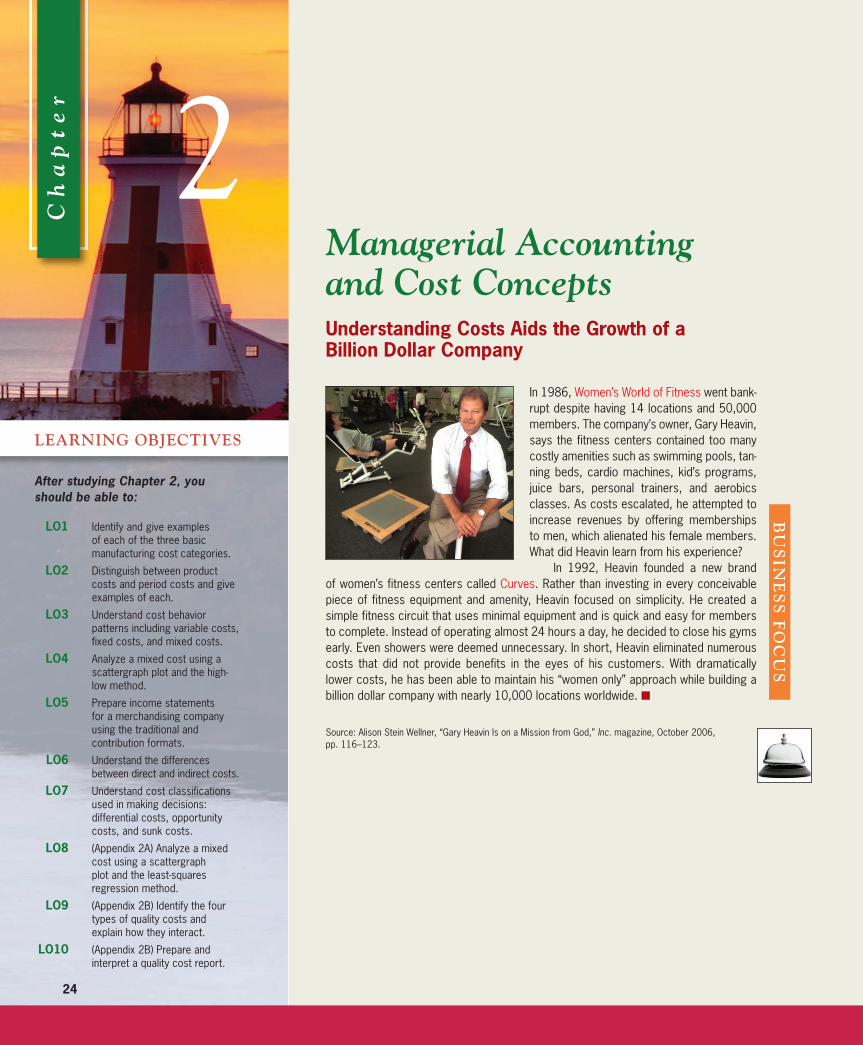
Rev.Confi rming Pages
24
BU
SIN
ES
S F
OC
US
2
After studying Chapter 2, you should be able to:
LO1 Identify and give examples of each of the three basic manufacturing cost categories.
LO2 Distinguish between product costs and period costs and give examples of each.
LO3 Understand cost behavior patterns including variable costs, fixed costs, and mixed costs.
LO4 Analyze a mixed cost using a scattergraph plot and the high-low method.
LO5 Prepare income statements for a merchandising company using the traditional and contribution formats.
LO6 Understand the differences between direct and indirect costs.
LO7 Understand cost classifications used in making decisions: differential costs, opportunity costs, and sunk costs.
LO8 (Appendix 2A) Analyze a mixed cost using a scattergraph plot and the least-squares regression method.
LO9 (Appendix 2B) Identify the four types of quality costs and explain how they interact.
LO10 (Appendix 2B) Prepare and interpret a quality cost report.
Managerial Accounting and Cost Concepts
Ch
ap
te
r
LEARNING OBJECTIVES
Understanding Costs Aids the Growth of a Billion Dollar Company
In 1986, Women’s World of Fitness went bank-rupt despite having 14 locations and 50,000 members. The company’s owner, Gary Heavin, says the fitness centers contained too many costly amenities such as swimming pools, tan-ning beds, cardio machines, kid’s programs, juice bars, personal trainers, and aerobics classes. As costs escalated, he attempted to increase revenues by offering memberships to men, which alienated his female members. What did Heavin learn from his experience?
In 1992, Heavin founded a new brand of women’s fitness centers called Curves . Rather than investing in every conceivable piece of fitness equipment and amenity, Heavin focused on simplicity. He created a simple fitness circuit that uses minimal equipment and is quick and easy for members to complete. Instead of operating almost 24 hours a day, he decided to close his gyms early. Even showers were deemed unnecessary. In short, Heavin eliminated numerous costs that did not provide benefits in the eyes of his customers. With dramatically lower costs, he has been able to maintain his “women only” approach while building a billion dollar company with nearly 10,000 locations worldwide. ■
Source: Alison Stein Wellner, “Gary Heavin Is on a Mission from God,” Inc. magazine, October 2006, pp. 116–123.
gar11005_ch02_024-082.indd 24gar11005_ch02_024-082.indd 24 17/11/10 11:31 AM17/11/10 11:31 AM
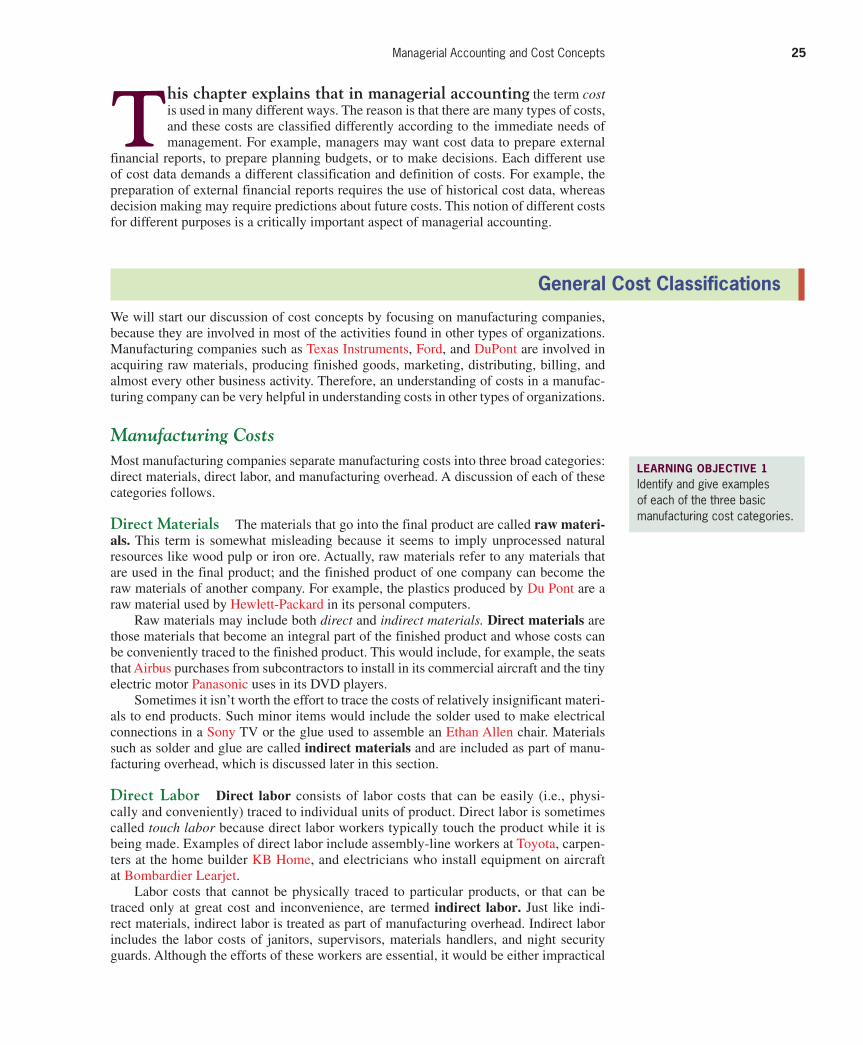
Confi rming Pages
Managerial Accounting and Cost Concepts 25
T his chapter explains that in managerial accounting the term cost is used in many different ways. The reason is that there are many types of costs,
and these costs are classified differently according to the immediate needs of
management. For example, managers may want cost data to prepare external
financial reports, to prepare planning budgets, or to make decisions. Each different use
of cost data demands a different classification and definition of costs. For example, the
preparation of external financial reports requires the use of historical cost data, whereas
decision making may require predictions about future costs. This notion of different costs
for different purposes is a critically important aspect of managerial accounting.
General Cost Classifications
We will start our discussion of cost concepts by focusing on manufacturing companies,
because they are involved in most of the activities found in other types of organizations.
Manufacturing companies such as Texas Instruments , Ford , and DuPont are involved in
acquiring raw materials, producing finished goods, marketing, distributing, billing, and
almost every other business activity. Therefore, an understanding of costs in a manufac-
turing company can be very helpful in understanding costs in other types of organizations.
Manufacturing Costs
Most manufacturing companies separate manufacturing costs into three broad categories:
direct materials, direct labor, and manufacturing overhead. A discussion of each of these
categories follows.
Direct Materials The materials that go into the final product are called raw materi-als . This term is somewhat misleading because it seems to imply unprocessed natural
resources like wood pulp or iron ore. Actually, raw materials refer to any materials that
are used in the final product; and the finished product of one company can become the
raw materials of another company. For example, the plastics produced by Du Pont are a
raw material used by Hewlett-Packard in its personal computers.
Raw materials may include both direct and indirect materials. Direct materials are
those materials that become an integral part of the finished product and whose costs can
be conveniently traced to the finished product. This would include, for example, the seats
that Airbus purchases from subcontractors to install in its commercial aircraft and the tiny
electric motor Panasonic uses in its DVD players.
Sometimes it isn’t worth the effort to trace the costs of relatively insignificant materi-
als to end products. Such minor items would include the solder used to make electrical
connections in a Sony TV or the glue used to assemble an Ethan Allen chair. Materials
such as solder and glue are called indirect materials and are included as part of manu-
facturing overhead, which is discussed later in this section.
Direct Labor Direct labor consists of labor costs that can be easily (i.e., physi-
cally and conveniently) traced to individual units of product. Direct labor is sometimes
called touch labor because direct labor workers typically touch the product while it is
being made. Examples of direct labor include assembly-line workers at Toyota , carpen-
ters at the home builder KB Home, and electricians who install equipment on aircraft
at Bombardier Learjet .
Labor costs that cannot be physically traced to particular products, or that can be
traced only at great cost and inconvenience, are termed indirect labor . Just like indi-
rect materials, indirect labor is treated as part of manufacturing overhead. Indirect labor
includes the labor costs of janitors, supervisors, materials handlers, and night security
guards. Although the efforts of these workers are essential, it would be either impractical
LEARNING OBJECTIVE 1 Identify and give examples of each of the three basic manufacturing cost categories.
gar11005_ch02_024-082.indd 25gar11005_ch02_024-082.indd 25 02/11/10 4:29 PM02/11/10 4:29 PM
Confi rming Pages
26 Chapter 2
or impossible to accurately trace their costs to specific units of product. Hence, such
labor costs are treated as indirect labor.
Manufacturing Overhead Manufacturing overhead , the third element of manu-
facturing cost, includes all manufacturing costs except direct materials and direct labor.
Manufacturing overhead includes items such as indirect materials; indirect labor; main-
tenance and repairs on production equipment; and heat and light, property taxes, depre-
ciation, and insurance on manufacturing facilities. A company also incurs costs for heat
and light, property taxes, insurance, depreciation, and so forth, associated with its selling
and administrative functions, but these costs are not included as part of manufacturing
overhead. Only those costs associated with operating the factory are included in manu-
facturing overhead.
Various names are used for manufacturing overhead, such as indirect manufacturing cost, factory overhead, and factory burden. All of these terms are synonyms for manufac-turing overhead.
Nonmanufacturing Costs
Nonmanufacturing costs are often divided into two categories: (1) selling costs and
(2) administrative costs. Selling costs include all costs that are incurred to secure cus-
tomer orders and get the finished product to the customer. These costs are sometimes
called order-getting and order-filling costs. Examples of selling costs include advertis-
ing, shipping, sales travel, sales commissions, sales salaries, and costs of finished goods
warehouses.
Administrative costs include all costs associated with the general management of
an organization rather than with manufacturing or selling. Examples of administrative
costs include executive compensation, general accounting, secretarial, public relations,
and similar costs involved in the overall, general administration of the organization as a whole.
Nonmanufacturing costs are also often called selling, general, and administrative
(SG&A) costs or just selling and administrative costs.
I N B U S I N E S S IS SENDING JOBS OVERSEAS ALWAYS A GOOD IDEA? M any companies send jobs from high labor-cost countries such as the United States to lower labor-cost countries such as India and China. But is chasing labor cost savings always the right thing to do? In manufacturing, the answer is no. Typically, total direct labor costs are around 7% to 15% of cost of goods sold. Because direct labor is such a small part of overall costs, the labor savings real-ized by “offshoring” jobs can easily be overshadowed by a decline in efficiency that occurs simply because production facilities are located farther from the ultimate customers. The increase in inven-tory carrying costs and obsolescence costs coupled with slower response to customer orders, not to mention foreign currency exchange risks, can more than offset the benefits of employing geographically dispersed low-cost labor.
One manufacturer of casual wear in Los Angeles, California, understands the value of keeping jobs close to home in order to improve performance. The company can fill orders for as many as 160,000 units in 24 hours. In fact, the company carries less than 30 days’ inventory and is consid-ering fabricating clothing only after orders are received from customers rather than attempting to forecast what items will sell and making them in advance. How would they do this? The company’s entire manufacturing process—including weaving, dyeing, and sewing—is located in downtown Los Angeles, eliminating shipping delays.
Source: Robert Sternfels and Ronald Ritter, “When Offshoring Doesn’t Make Sense,” The Wall Street Journal,October 19, 2004, p. B8.
gar11005_ch02_024-082.indd 26gar11005_ch02_024-082.indd 26 02/11/10 4:29 PM02/11/10 4:29 PM
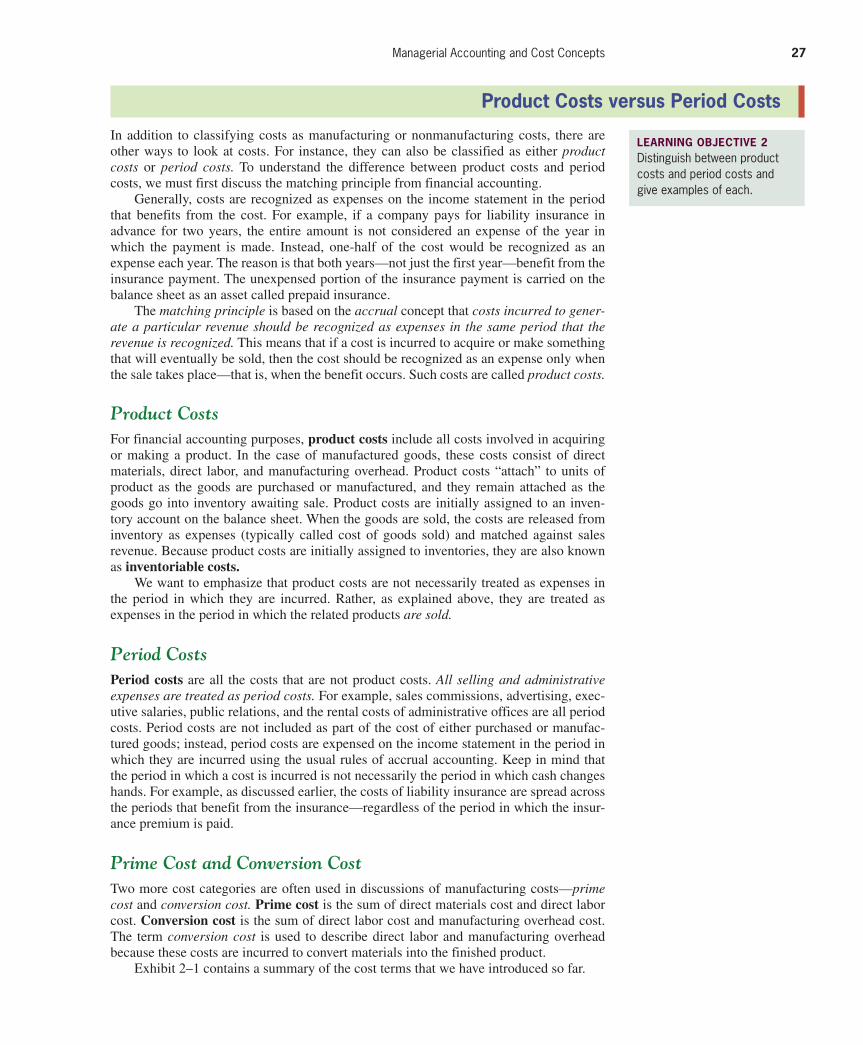
Confi rming Pages
Managerial Accounting and Cost Concepts 27
In addition to classifying costs as manufacturing or nonmanufacturing costs, there are
other ways to look at costs. For instance, they can also be classified as either product costs or period costs. To understand the difference between product costs and period
costs, we must first discuss the matching principle from financial accounting.
Generally, costs are recognized as expenses on the income statement in the period
that benefits from the cost. For example, if a company pays for liability insurance in
advance for two years, the entire amount is not considered an expense of the year in
which the payment is made. Instead, one-half of the cost would be recognized as an
expense each year. The reason is that both years—not just the first year—benefit from the
insurance payment. The unexpensed portion of the insurance payment is carried on the
balance sheet as an asset called prepaid insurance.
The matching principle is based on the accrual concept that costs incurred to gener-ate a particular revenue should be recognized as expenses in the same period that the revenue is recognized. This means that if a cost is incurred to acquire or make something
that will eventually be sold, then the cost should be recognized as an expense only when
the sale takes place—that is, when the benefit occurs. Such costs are called product costs.
Product Costs
For financial accounting purposes, product costs include all costs involved in acquiring
or making a product. In the case of manufactured goods, these costs consist of direct
materials, direct labor, and manufacturing overhead. Product costs “attach” to units of
product as the goods are purchased or manufactured, and they remain attached as the
goods go into inventory awaiting sale. Product costs are initially assigned to an inven-
tory account on the balance sheet. When the goods are sold, the costs are released from
inventory as expenses (typically called cost of goods sold) and matched against sales
revenue. Because product costs are initially assigned to inventories, they are also known
as inventoriable costs . We want to emphasize that product costs are not necessarily treated as expenses in
the period in which they are incurred. Rather, as explained above, they are treated as
expenses in the period in which the related products are sold.
Period Costs
Period costs are all the costs that are not product costs. All selling and administrative expenses are treated as period costs. For example, sales commissions, advertising, exec-
utive salaries, public relations, and the rental costs of administrative offices are all period
costs. Period costs are not included as part of the cost of either purchased or manufac-
tured goods; instead, period costs are expensed on the income statement in the period in
which they are incurred using the usual rules of accrual accounting. Keep in mind that
the period in which a cost is incurred is not necessarily the period in which cash changes
hands. For example, as discussed earlier, the costs of liability insurance are spread across
the periods that benefit from the insurance—regardless of the period in which the insur-
ance premium is paid.
Prime Cost and Conversion Cost
Two more cost categories are often used in discussions of manufacturing costs— prime cost and conversion cost. Prime cost is the sum of direct materials cost and direct labor
cost. Conversion cost is the sum of direct labor cost and manufacturing overhead cost.
The term conversion cost is used to describe direct labor and manufacturing overhead
because these costs are incurred to convert materials into the finished product.
Exhibit 2–1 contains a summary of the cost terms that we have introduced so far.
Product Costs versus Period Costs
LEARNING OBJECTIVE 2 Distinguish between product costs and period costs and give examples of each.
gar11005_ch02_024-082.indd 27gar11005_ch02_024-082.indd 27 02/11/10 4:29 PM02/11/10 4:29 PM
Confi rming Pages
28 Chapter 2
E X H I B I T 2 – 1 Summary of Cost Terms
Administrative CostsSelling Costs
Prime Cost Conversion Cost
Nonmanufacturing Costs(Also called Period Costs
or Selling andAdministrative Costs)
All costs necessary to secure customer orders and get the finished product or service to the customer (such as salescommissions, advertising, and depreciation of deliveryequipment and finished goodswarehouses).
All costs associated with the gen-eral management of the company as a whole (such as executive compensation, executive travel costs, secretarial salaries, and depreciation of office buildings and equipment).
Manufacturing OverheadDirect LaborDirect Materials
Materials that can be conveniently traced to aproduct (such as wood ina table).
Labor cost that can be physically and conveniently traced to a product (such as assembly-line workers in a plant). Direct labor is sometimes called touch labor.
All costs of manufacturing a product other than direct materials and direct labor (suchas indirect materials, indirect labor, factory utilities, and depreciation of factory buildings and equipment).
Manufacturing Costs(Also called Product Costs
for financial accounting purposes)
I N B U S I N E S S THE CHALLENGES OF MANAGING CHARITABLE ORGANIZATIONS Charitable organizations, such as Harlem Children’s Zone, Sports4Kids , and Citizen Schools , are facing a difficult situation. Many donors—aware of stories involving charities that spent excessively on themselves while losing sight of their mission—have started prohibiting their charity of choice from using donated funds to pay for administrative costs. However, even the most efficient charitable organizations find it difficult to expand without making additions to their infrastructure. For example, Sports4Kids’ nationwide expansion of its sports programs drove up administrative costs from 5.6% to 14.7% of its total budget. The organization claims that this cost increase was necessary to build a more experienced management team to oversee the dramatically increased scale of operations.
Many charitable organizations are starting to seek gifts explicitly to fund administrative expenses. Their argument is simple—they cannot do good deeds for other people without incurring such costs.
Source: Rachel Emma Silverman and Sally Beatty, “Save the Children (But Pay the Bills, Too),” The Wall Street Journal, December 26, 2006, pp. D1–D2.
gar11005_ch02_024-082.indd 28gar11005_ch02_024-082.indd 28 02/11/10 4:29 PM02/11/10 4:29 PM
Confi rming Pages
Managerial Accounting and Cost Concepts 29
LEARNING OBJECTIVE 3 Understand cost behavior patterns including variable costs, fixed costs, and mixed costs.
Cost Classifications for Predicting Cost Behavior
It is often necessary to predict how a certain cost will behave in response to a change in ac -
tivity. For example, a manager at Qwest , a telephone company, may want to estimate the
impact a 5 percent increase in long-distance calls by customers would have on Qwest’s total
electric bill. Cost behavior refers to how a cost reacts to changes in the level of activity. As
the activity level rises and falls, a particular cost may rise and fall as well—or it may remain
constant. For planning purposes, a manager must be able to anticipate which of these will
happen; and if a cost can be expected to change, the manager must be able to estimate how
much it will change. To help make such distinctions, costs are often categorized as variable, fixed, or mixed. The relative proportion of each type of cost in an organization is known as its
cost structure . For example, an organization might have many fixed costs but few variable
or mixed costs. Alternatively, it might have many variable costs but few fixed or mixed costs.
Variable Cost
A variable cost varies, in total, in direct proportion to changes in the level of activity.
Common examples of variable costs include cost of goods sold for a merchandising com-
pany, direct materials, direct labor, variable elements of manufacturing overhead, such as
indirect materials, supplies, and power, and variable elements of selling and administra-
tive expenses, such as commissions and shipping costs. 1
For a cost to be variable, it must be variable with respect to something. That “some-
thing” is its activity base. An activity base is a measure of whatever causes the incurrence
of a variable cost. An activity base is sometimes referred to as a cost driver. Some of the
most common activity bases are direct labor-hours, machine-hours, units produced, and
units sold. Other examples of activity bases (cost drivers) include the number of miles
driven by salespersons, the number of pounds of laundry cleaned by a hotel, the number
of calls handled by technical support staff at a software company, and the number of beds
occupied in a hospital. While there are many activity bases within organizations, through-out this textbook, unless stated otherwise, you should assume that the activity base under consideration is the total volume of goods and services provided by the organization. We will specify the activity base only when it is something other than total output.
1 Direct labor costs often can be fixed instead of variable for a variety of reasons. For example, in some
countries, such as France, Germany, and Japan, labor regulations and cultural norms may limit manage-
ment’s ability to adjust the labor force in response to changes in activity. In this textbook, always assume
that direct labor is a variable cost unless you are explicitly told otherwise.
I N B U S I N E S S COST DRIVERS IN THE ELECTRONICS INDUSTRY Accenture Ltd. estimates that the U.S. electronics industry spends $13.8 billion annually to rebox, restock, and resell returned products. Conventional wisdom is that customers only return products when they are defective, but the data shows that this explanation only accounts for 5% of customer returns. The biggest cost drivers that cause product returns are that customers often inadvertently buy the wrong products and that they cannot understand how to use the products that they have pur-chased. Television manufacturer Vizio Inc. has started including more information on its packaging to help customers avoid buying the wrong product. Seagate Technologies is replacing thick instruc-tion manuals with simpler guides that make it easier for customers to begin using their products.
Source: Christopher Lawton, “The War on Returns,” The Wall Street Journal, May 8, 2008, pp. D1 and D6.
To provide an example of a variable cost, consider Nooksack Expeditions, a small
company that provides daylong whitewater rafting excursions on rivers in the North Cas-
cade Mountains. The company provides all of the necessary equipment and experienced
gar11005_ch02_024-082.indd 29gar11005_ch02_024-082.indd 29 02/11/10 4:30 PM02/11/10 4:30 PM
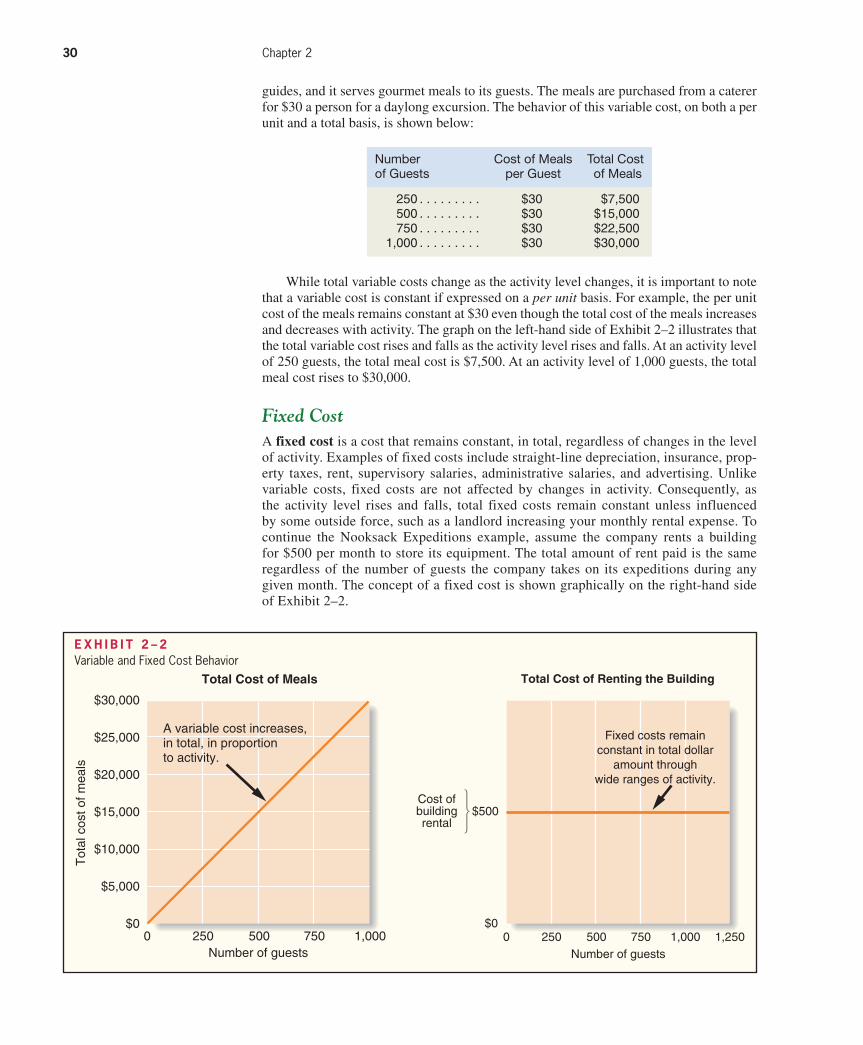
Confi rming Pages
30 Chapter 2
guides, and it serves gourmet meals to its guests. The meals are purchased from a caterer
for $30 a person for a daylong excursion. The behavior of this variable cost, on both a per
unit and a total basis, is shown below:
Number Cost of Meals Total Cost of Guests per Guest of Meals
250 . . . . . . . . . $30 $7,500 500 . . . . . . . . . $30 $15,000 750 . . . . . . . . . $30 $22,500 1,000 . . . . . . . . . $30 $30,000
While total variable costs change as the activity level changes, it is important to note
that a variable cost is constant if expressed on a per unit basis. For example, the per unit
cost of the meals remains constant at $30 even though the total cost of the meals increases
and decreases with activity. The graph on the left-hand side of Exhibit 2–2 illustrates that
the total variable cost rises and falls as the activity level rises and falls. At an activity level
of 250 guests, the total meal cost is $7,500. At an activity level of 1,000 guests, the total
meal cost rises to $30,000.
Fixed Cost
A fixed cost is a cost that remains constant, in total, regardless of changes in the level
of activity. Examples of fixed costs include straight-line depreciation, insurance, prop-
erty taxes, rent, supervisory salaries, administrative salaries, and advertising. Unlike
variable costs, fixed costs are not affected by changes in activity. Consequently, as
the activity level rises and falls, total fixed costs remain constant unless influenced
by some outside force, such as a landlord increasing your monthly rental expense. To
continue the Nooksack Expeditions example, assume the company rents a building
for $500 per month to store its equipment. The total amount of rent paid is the same
regardless of the number of guests the company takes on its expeditions during any
given month. The concept of a fixed cost is shown graphically on the right-hand side
of Exhibit 2–2 .
E X H I B I T 2 – 2 Variable and Fixed Cost Behavior
$30,000
$25,000
$20,000
$15,000
$10,000
$5,000
$0
Tot
al c
ost o
f mea
ls
0 250 500 750 1,000Number of guests
Total Cost of Meals
A variable cost increases,in total, in proportion to activity.
Cost ofbuildingrental
$500
$00 250 500 750 1,000 1,250
Number of guests
Total Cost of Renting the Building
Fixed costs remainconstant in total dollar
amount throughwide ranges of activity.
gar11005_ch02_024-082.indd 30gar11005_ch02_024-082.indd 30 02/11/10 4:30 PM02/11/10 4:30 PM
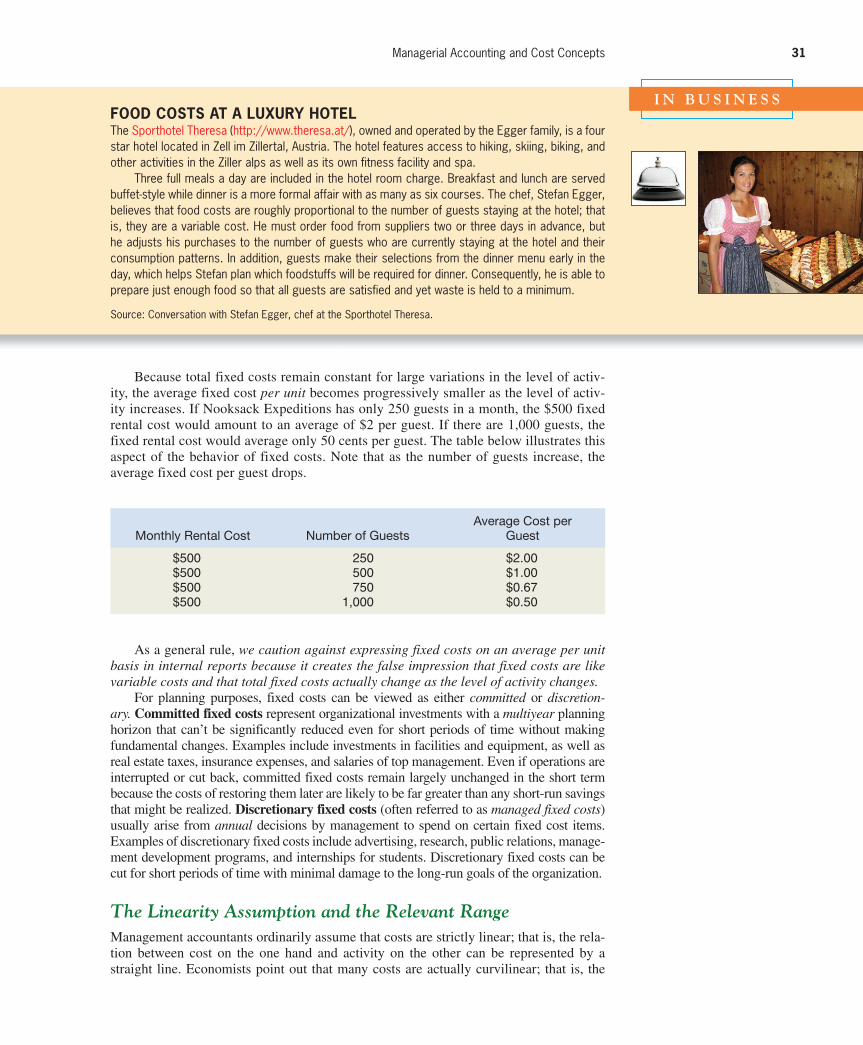
Confi rming Pages
Managerial Accounting and Cost Concepts 31
As a general rule, we caution against expressing fixed costs on an average per unit basis in internal reports because it creates the false impression that fixed costs are like variable costs and that total fixed costs actually change as the level of activity changes.
For planning purposes, fixed costs can be viewed as either committed or discretion-ary. Committed fixed costs represent organizational investments with a multiyear planning
horizon that can’t be significantly reduced even for short periods of time without making
fundamental changes. Examples include investments in facilities and equipment, as well as
real estate taxes, insurance expenses, and salaries of top management. Even if operations are
interrupted or cut back, committed fixed costs remain largely unchanged in the short term
because the costs of restoring them later are likely to be far greater than any short-run savings
that might be realized. Discretionary fixed costs (often referred to as managed fixed costs ) usually arise from annual decisions by management to spend on certain fixed cost items.
Examples of discretionary fixed costs include advertising, research, public relations, manage-
ment development programs, and internships for students. Discretionary fixed costs can be
cut for short periods of time with minimal damage to the long-run goals of the organization.
The Linearity Assumption and the Relevant Range
Management accountants ordinarily assume that costs are strictly linear; that is, the rela-
tion between cost on the one hand and activity on the other can be represented by a
straight line. Economists point out that many costs are actually curvilinear; that is, the
Monthly Rental Cost Number of GuestsAverage Cost per
Guest
$500 250 $2.00$500 500 $1.00$500 750 $0.67$500 1,000 $0.50
Because total fixed costs remain constant for large variations in the level of activ-
ity, the average fixed cost per unit becomes progressively smaller as the level of activ-
ity increases. If Nooksack Expeditions has only 250 guests in a month, the $500 fixed
rental cost would amount to an average of $2 per guest. If there are 1,000 guests, the
fixed rental cost would average only 50 cents per guest. The table below illustrates this
aspect of the behavior of fixed costs. Note that as the number of guests increase, the
average fixed cost per guest drops.
I N B U S I N E S S FOOD COSTS AT A LUXURY HOTEL The Sporthotel Theresa ( http://www.theresa.at/ ), owned and operated by the Egger family, is a four star hotel located in Zell im Zillertal, Austria. The hotel features access to hiking, skiing, biking, and other activities in the Ziller alps as well as its own fitness facility and spa.
Three full meals a day are included in the hotel room charge. Breakfast and lunch are served buffet-style while dinner is a more formal affair with as many as six courses. The chef, Stefan Egger, believes that food costs are roughly proportional to the number of guests staying at the hotel; that is, they are a variable cost. He must order food from suppliers two or three days in advance, but he adjusts his purchases to the number of guests who are currently staying at the hotel and their consumption patterns. In addition, guests make their selections from the dinner menu early in the day, which helps Stefan plan which foodstuffs will be required for dinner. Consequently, he is able to prepare just enough food so that all guests are satisfied and yet waste is held to a minimum.
Source: Conversation with Stefan Egger, chef at the Sporthotel Theresa.
gar11005_ch02_024-082.indd 31gar11005_ch02_024-082.indd 31 02/11/10 4:30 PM02/11/10 4:30 PM

Confi rming Pages
32 Chapter 2
relation between cost and activity is a curve. Nevertheless, even if a cost is not strictly lin-
ear, it can be approximated within a narrow band of activity known as the relevant range
by a straight line as illustrated in Exhibit 2–3 . The relevant range is the range of activ-
ity within which the assumption that cost behavior is strictly linear is reasonably valid.
Outside of the relevant range, a fixed cost may no longer be strictly fixed or a variable
cost may not be strictly variable. Managers should always keep in mind that assumptions
made about cost behavior may be invalid if activity falls outside of the relevant range.
The concept of the relevant range is important in understanding fixed costs. For
example, suppose the Mayo Clinic rents a machine for $20,000 per month that tests blood
samples for the presence of leukemia cells. Furthermore, suppose that the capacity of the
leukemia diagnostic machine is 3,000 tests per month. The assumption that the rent for
the diagnostic machine is $20,000 per month is only valid within the relevant range of
0 to 3,000 tests per month. If the Mayo Clinic needed to test 5,000 blood samples per
month, then it would need to rent another machine for an additional $20,000 per month. It
would be difficult to rent half of a diagnostic machine; therefore, the step pattern depicted
in Exhibit 2–4 is typical for such costs. This exhibit shows that the fixed rental expense
E X H I B I T 2 – 3 Curvilinear Costs and the Relevant Range
E X H I B I T 2 – 4 Fixed Costs and the Relevant Range
Relevantrange
Cos
tVolume
Economist’scurvilinear
cost function
Accountant’sstraight-line
approximation
Number of Tests
Cos
t
$20,000
$40,000
$60,000
0 3,000 6,000 9,000
gar11005_ch02_024-082.indd 32gar11005_ch02_024-082.indd 32 02/11/10 4:30 PM02/11/10 4:30 PM

Rev.Confi rming Pages
Managerial Accounting and Cost Concepts 33
Behavior of the Cost (within the relevant range)
Cost In Total Per Unit
Variable cost Total variable cost increases Variable cost per unit remains and decreases in proportion to constant. changes in the activity level.Fixed cost Total fi xed cost is not affected Fixed cost per unit decreases by changes in the activity level as the activity level rises and within the relevant range. increases as the activity level falls.
E X H I B I T 2 – 5 Summary of Variable and Fixed Cost Behavior
is $20,000 for a relevant range of 0 to 3,000 tests. The fixed rental expense increases to
$40,000 within the relevant range of 3,001 to 6,000 tests. The rental expense increases in
discrete steps or increments of 3,000 tests, rather than increasing in a linear fashion per test.
This step-oriented cost behavior pattern can also be used to describe other costs, such
as some labor costs. For example, salaried employee expenses can be characterized using
a step pattern. Salaried employees are paid a fixed amount, such as $40,000 per year, for
providing the capacity to work a prespecified amount of time, such as 40 hours per week
for 50 weeks a year ( = 2,000 hours per year). In this example, the total salaried employee
expense is $40,000 within a relevant range of 0 to 2,000 hours of work. The total salaried
employee expense increases to $80,000 (or two employees) if the organization’s work
requirements expand to a relevant range of 2,001 to 4,000 hours of work. Cost behavior
patterns such as salaried employees are often called step-variable costs. Step-variable
costs can often be adjusted quickly as conditions change. Furthermore, the width of the
steps for step-variable costs is generally so narrow that these costs can be treated essen-
tially as variable costs for most purposes. The width of the steps for fixed costs, on the
other hand, is so wide that these costs should be treated as entirely fixed within the rel-
evant range.
Exhibit 2–5 summarizes four key concepts related to variable and fixed costs. Study
it carefully before reading further.
I N B U S I N E S S HOW MANY GUIDES? Majestic Ocean Kayaking , of Ucluelet, British Columbia, is owned and operated by Tracy Morben-Eeftink. The company offers a number of guided kayaking excursions ranging from three-hour tours of the Ucluelet harbor to six-day kayaking and camping trips in Clayoquot Sound. One of the com-pany’s excursions is a four-day kayaking and camping trip to The Broken Group Islands in the Pacific Rim National Park. Special regulations apply to trips in the park—including a requirement that one certified guide must be assigned for every five guests or fraction thereof. For example, a trip with 12 guests must have at least three certified guides. Guides are not salaried and are paid on a per-day basis. Therefore, the cost to the company of the guides for a trip is a step-variable cost rather than a fixed cost or a strictly variable cost. One guide is needed for 1 to 5 guests, two guides for 6 to 10 guests, three guides for 11 to 15 guests, and so on.
Sources: Tracy Morben-Eeftink, owner, Majestic Ocean Kayaking. For more information about the company, see www.oceankayaking.com .
Mixed Costs
A mixed cost contains both variable and fixed cost elements. Mixed costs are also known
as semivariable costs. To continue the Nooksack Expeditions example, the company
incurs a mixed cost called fees paid to the state. It includes a license fee of $25,000 per
year plus $3 per rafting party paid to the state’s Department of Natural Resources. If the
gar11005_ch02_024-082.indd 33gar11005_ch02_024-082.indd 33 11/11/10 11:35 AM11/11/10 11:35 AM

Confi rming Pages
34 Chapter 2
company runs 1,000 rafting parties this year, then the total fees paid to the state would
be $28,000, made up of $25,000 in fixed cost plus $3,000 in variable cost. Exhibit 2–6
depicts the behavior of this mixed cost.
Even if Nooksack fails to attract any customers, the company will still have to pay
the license fee of $25,000. This is why the cost line in Exhibit 2–6 intersects the vertical
cost axis at the $25,000 point. For each rafting party the company organizes, the total cost
of the state fees will increase by $3. Therefore, the total cost line slopes upward as the
variable cost of $3 per party is added to the fixed cost of $25,000 per year.
Because the mixed cost in Exhibit 2–6 is represented by a straight line, the following
equation for a straight line can be used to express the relationship between a mixed cost
and the level of activity:
Y = a + bX
In this equation,
Y = The total mixed cost
a = The total fixed cost (the vertical intercept of the line)
b = The variable cost per unit of activity (the slope of the line)
X = The level of activity
Because the variable cost per unit equals the slope of the straight line, the steeper the
slope, the higher the variable cost per unit.
In the case of the state fees paid by Nooksack Expeditions, the equation is written as
follows:
E X H I B I T 2 – 6 Mixed Cost Behavior
$30,000
$29,000
$28,000
$27,000
$26,000
$25,000
$00 1,000500
Number of rafting parties
Cos
t of s
tate
lice
nse
fees
Variablecost
element
Fixedcost
element
Intercept = Total fixed cost
Slope = Variable cost per unit of activity
Y = $25,000 + $3.00X
Total Total Variable Activity
mixed fixed cost per level
cost cost unit of
activity
This equation makes it easy to calculate the total mixed cost for any level of activity
within the relevant range. For example, suppose that the company expects to organize
800 rafting parties in the next year. The total state fees would be calculated as follows:
Y = $25,000 + ($3.00 per rafting party × 800 rafting parties)
= $27,400
gar11005_ch02_024-082.indd 34gar11005_ch02_024-082.indd 34 02/11/10 4:30 PM02/11/10 4:30 PM
Confi rming Pages
Managerial Accounting and Cost Concepts 35
The Analysis of Mixed Costs
Mixed costs are very common. For example, the overall cost of providing X-ray services
to patients at the Harvard Medical School Hospital is a mixed cost. The costs of equipment
depreciation and radiologists’ and technicians’ salaries are fixed, but the costs of X-ray film,
power, and supplies are variable. At Southwest Airlines , maintenance costs are a mixed cost.
The company incurs fixed costs for renting maintenance facilities and for keeping skilled
mechanics on the payroll, but the costs of replacement parts, lubricating oils, tires, and so
forth, are variable with respect to how often and how far the company’s aircraft are flown.
The fixed portion of a mixed cost represents the minimum cost of having a service
ready and available for use. The variable portion represents the cost incurred for actual consumption of the service, thus it varies in proportion to the amount of service actually
consumed.
Managers can use a variety of methods to estimate the fixed and variable compo-
nents of a mixed cost such as account analysis, the engineering approach, the high-low method, and least-squares regression analysis. In account analysis , an account is classi-
fied as either variable or fixed based on the analyst’s prior knowledge of how the cost in
the account behaves. For example, direct materials would be classified as variable and a
building lease cost would be classified as fixed because of the nature of those costs. The
engineering approach to cost analysis involves a detailed analysis of what cost behavior
should be, based on an industrial engineer’s evaluation of the production methods to be
used, the materials specifications, labor requirements, equipment usage, production effi-
ciency, power consumption, and so on.
The high-low and least-squares regression methods estimate the fixed and variable
elements of a mixed cost by analyzing past records of cost and activity data. We will use
an example from Brentline Hospital to illustrate the high-low method calculations and
to compare the resulting high-low method cost estimates to those obtained using least-
squares regression. Appendix 2A demonstrates how to use Microsoft Excel to perform
least-squares regression computations.
Diagnosing Cost Behavior with a Scattergraph Plot
Assume that Brentline Hospital is interested in predicting future monthly maintenance
costs for budgeting purposes. The senior management team believes that maintenance
cost is a mixed cost and that the variable portion of this cost is driven by the number of
patient-days. Each day a patient is in the hospital counts as one patient-day. The hospital’s
chief financial officer gathered the following data for the most recent seven-month period:
LEARNING OBJECTIVE 4 Analyze a mixed cost using a scattergraph plot and the high-low method.
Activity Level: MaintenanceMonth Patient-Days Cost Incurred
January . . . . . . . . 5,600 $7,900February . . . . . . 7,100 $8,500March . . . . . . . . . 5,000 $7,400April . . . . . . . . . . . 6,500 $8,200May . . . . . . . . . . 7,300 $9,100June . . . . . . . . . . 8,000 $9,800July . . . . . . . . . . 6,200 $7,800
The first step in applying the high-low method or the least-squares regression method
is to diagnose cost behavior with a scattergraph plot. The scattergraph plot of mainte-
nance costs versus patient-days at Brentline Hospital is shown in Exhibit 2–7 . Two things
should be noted about this scattergraph:
1. The total maintenance cost, Y, is plotted on the vertical axis. Cost is known as the
dependent variable because the amount of cost incurred during a period depends on
gar11005_ch02_024-082.indd 35gar11005_ch02_024-082.indd 35 02/11/10 4:30 PM02/11/10 4:30 PM

Confi rming Pages
36 Chapter 2
the level of activity for the period. (That is, as the level of activity increases, total cost
will also ordinarily increase.)
2. The activity, X (patient-days in this case), is plotted on the horizontal axis. Activity is
known as the independent variable because it causes variations in the cost.
From the scattergraph plot, it is evident that maintenance costs do increase with the num-
ber of patient-days in an approximately linear fashion. In other words, the points lie
more or less along a straight line that slopes upward and to the right. Cost behavior is
considered linear whenever a straight line is a reasonable approximation for the relation
between cost and activity.
Plotting the data on a scattergraph is an essential diagnostic step that should be per-
formed before performing the high-low method or least-squares regression calculations.
If the scattergraph plot reveals linear cost behavior, then it makes sense to perform the
high-low or least-squares regression calculations to separate the mixed cost into its vari-
able and fixed components. If the scattergraph plot does not depict linear cost behavior,
then it makes no sense to proceed any further in analyzing the data.
For example, suppose that Brentline Hospital’s management is interested in the rela-
tion between the hospital’s telephone costs and patient-days. Patients are billed directly for
their use of telephones, so those costs do not appear on the hospital’s cost records. Rather,
management is concerned about the charges for the staff’s use of telephones. The data for
this cost are plotted in Exhibit 2–8 . It is evident from the nonlinear data pattern that while
the telephone costs do vary from month to month, they are not related to patient-days.
Something other than patient-days is driving the telephone bills. Therefore, it would not
make sense to analyze this cost any further by attempting to estimate a variable cost per
patient-day for telephone costs. Plotting the data helps diagnose such situations.
Plotting the data on a scattergraph can also reveal nonlinear cost behavior patterns
that warrant further data analysis. For example, assume that Brentline Hospital’s managers
were interested in the relation between total nursing wages and the number of patient-days
at the hospital. The permanent, full-time nursing staff can handle up to 7,000 patient-days
in a month. Beyond that level of activity, part-time nurses must be called in to help out.
The cost and activity data for nurses are plotted on the scattergraph in Exhibit 2–9 (see
page 38). Looking at that scattergraph, it is evident that two straight lines would do a much
better job of fitting the data than a single straight line. Up to 7,000 patient-days, total nurs-
ing wages are essentially a fixed cost. Above 7,000 patient-days, total nursing wages are a
E X H I B I T 2 – 7 Scattergraph Method of Cost Analysis
$12,000Plotting the Data
$10,000
$8,000
$6,000
$4,000
$2,000
$0
Mai
nten
ance
cos
t
0 2,000 4,000 6,000 8,000 10,000
Patient-days
Y
X
gar11005_ch02_024-082.indd 36gar11005_ch02_024-082.indd 36 02/11/10 4:30 PM02/11/10 4:30 PM
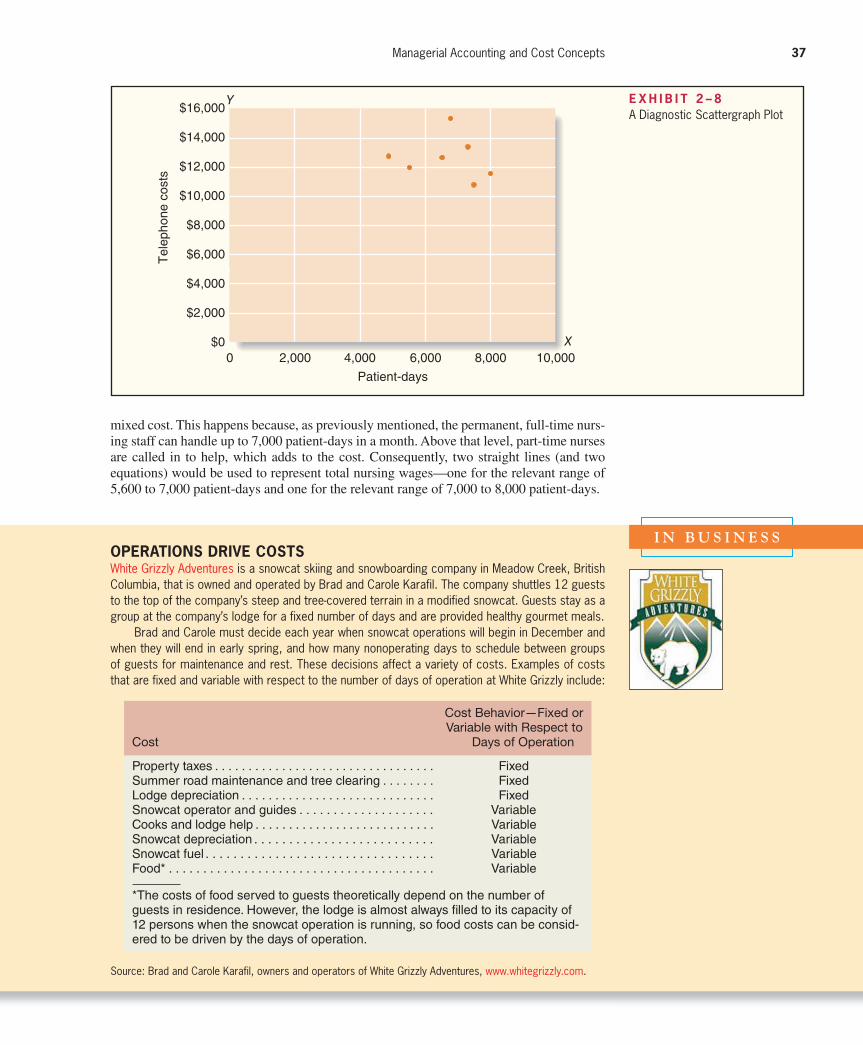
Confi rming Pages
Managerial Accounting and Cost Concepts 37
E X H I B I T 2 – 8 A Diagnostic Scattergraph Plot $16,000
$14,000
$12,000
$10,000
$8,000
$6,000
$4,000
$2,000
$0
Tel
epho
ne c
osts
0 2,000 4,000 6,000 8,000 10,000
Patient-days
Y
X
mixed cost. This happens because, as previously mentioned, the permanent, full-time nurs-
ing staff can handle up to 7,000 patient-days in a month. Above that level, part-time nurses
are called in to help, which adds to the cost. Consequently, two straight lines (and two
equations) would be used to represent total nursing wages—one for the relevant range of
5,600 to 7,000 patient-days and one for the relevant range of 7,000 to 8,000 patient-days.
I N B U S I N E S S OPERATIONS DRIVE COSTS White Grizzly Adventures is a snowcat skiing and snowboarding company in Meadow Creek, British Columbia, that is owned and operated by Brad and Carole Karafil. The company shuttles 12 guests to the top of the company’s steep and tree-covered terrain in a modified snowcat. Guests stay as a group at the company’s lodge for a fixed number of days and are provided healthy gourmet meals.
Brad and Carole must decide each year when snowcat operations will begin in December and when they will end in early spring, and how many nonoperating days to schedule between groups of guests for maintenance and rest. These decisions affect a variety of costs. Examples of costs that are fixed and variable with respect to the number of days of operation at White Grizzly include:
Source: Brad and Carole Karafil, owners and operators of White Grizzly Adventures, www.whitegrizzly.com.
Cost Behavior—Fixed or Variable with Respect to Cost Days of Operation
Property taxes . . . . . . . . . . . . . . . . . . . . . . . . . . . . . . . . . FixedSummer road maintenance and tree clearing . . . . . . . . FixedLodge depreciation . . . . . . . . . . . . . . . . . . . . . . . . . . . . . FixedSnowcat operator and guides . . . . . . . . . . . . . . . . . . . . VariableCooks and lodge help . . . . . . . . . . . . . . . . . . . . . . . . . . . VariableSnowcat depreciation . . . . . . . . . . . . . . . . . . . . . . . . . . VariableSnowcat fuel . . . . . . . . . . . . . . . . . . . . . . . . . . . . . . . . . VariableFood* . . . . . . . . . . . . . . . . . . . . . . . . . . . . . . . . . . . . . . . Variable
*The costs of food served to guests theoretically depend on the number of guests in residence. However, the lodge is almost always fi lled to its capacity of 12 persons when the snowcat operation is running, so food costs can be consid-ered to be driven by the days of operation.
gar11005_ch02_024-082.indd 37gar11005_ch02_024-082.indd 37 02/11/10 4:30 PM02/11/10 4:30 PM
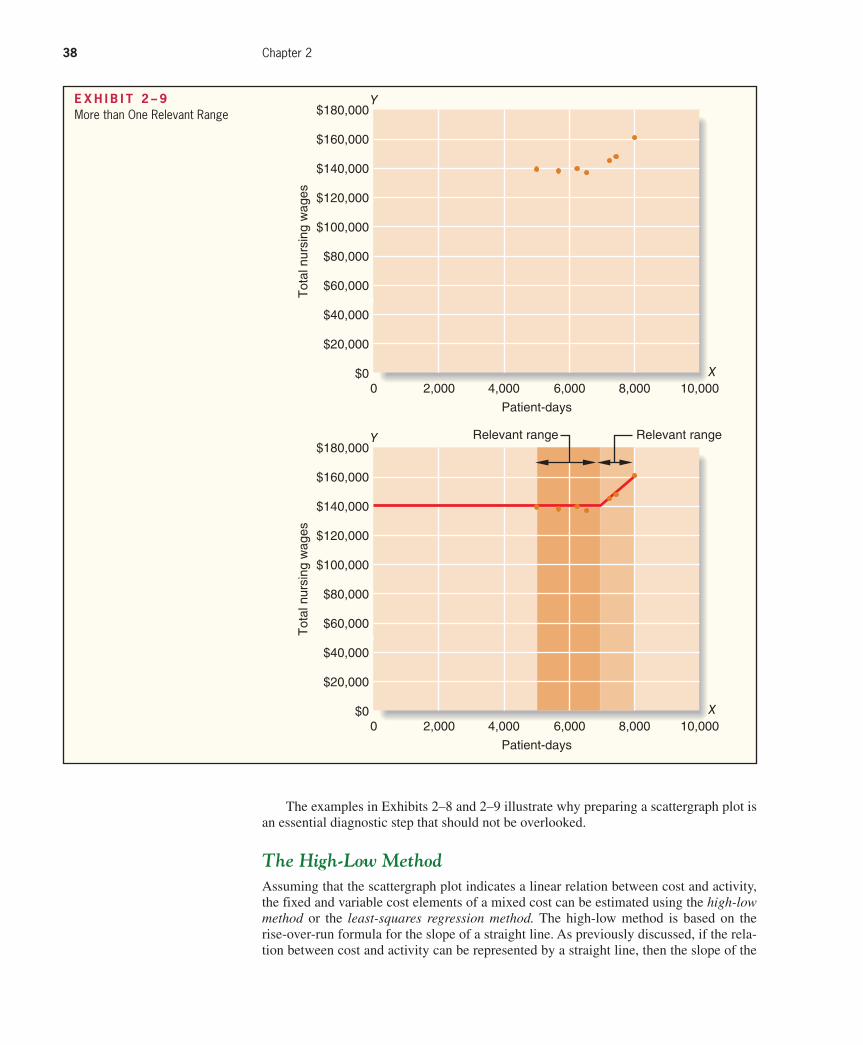
Confi rming Pages
38 Chapter 2
The examples in Exhibits 2–8 and 2–9 illustrate why preparing a scattergraph plot is
an essential diagnostic step that should not be overlooked.
The High-Low Method
Assuming that the scattergraph plot indicates a linear relation between cost and activity,
the fixed and variable cost elements of a mixed cost can be estimated using the high-low method or the least-squares regression method. The high-low method is based on the
rise-over-run formula for the slope of a straight line. As previously discussed, if the rela-
tion between cost and activity can be represented by a straight line, then the slope of the
$180,000
$160,000
$140,000
$120,000
$100,000
$80,000
$60,000
$40,000
$20,000
$0
Tot
al n
ursi
ng w
ages
0 2,000 4,000 6,000 8,000 10,000
Patient-days
Relevant range Relevant range
Y
X
$180,000
$160,000
$140,000
$120,000
$100,000
$80,000
$60,000
$40,000
$20,000
$0
Tot
al n
ursi
ng w
ages
0 2,000 4,000 6,000 8,000 10,000
Patient-days
Y
X
E X H I B I T 2 – 9 More than One Relevant Range
gar11005_ch02_024-082.indd 38gar11005_ch02_024-082.indd 38 02/11/10 4:31 PM02/11/10 4:31 PM
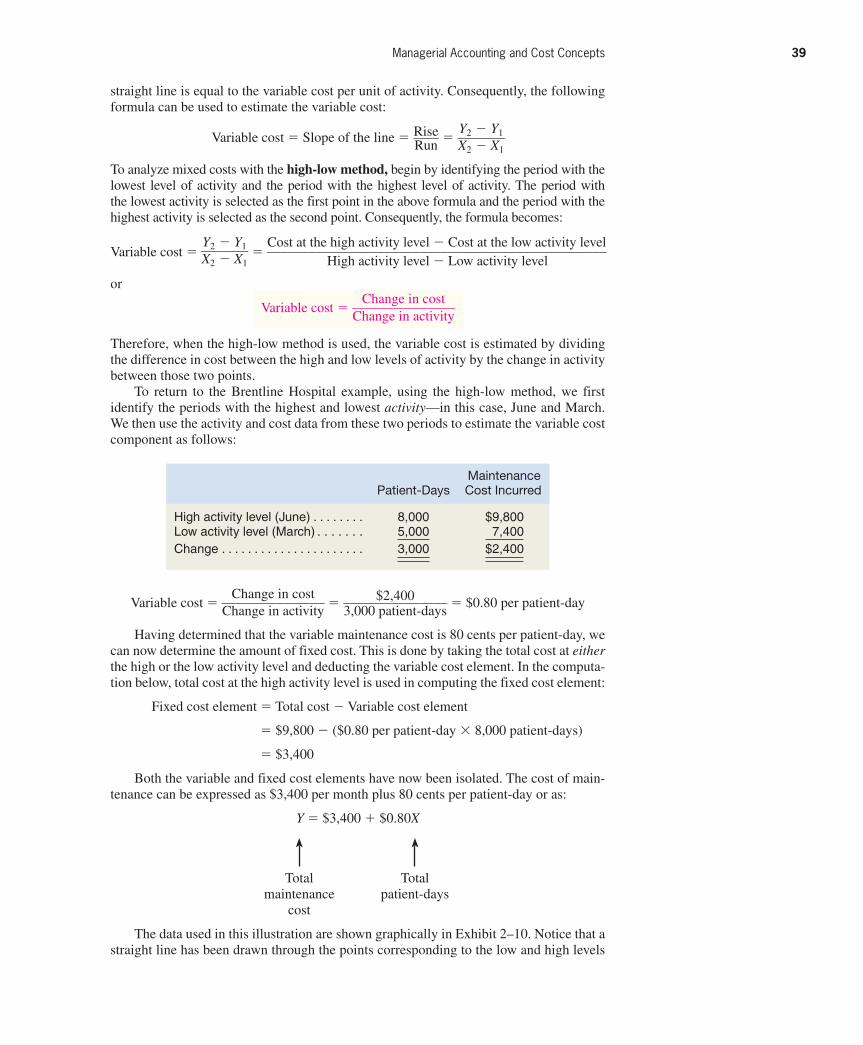
Rev.Confi rming Pages
Managerial Accounting and Cost Concepts 39
straight line is equal to the variable cost per unit of activity. Consequently, the following
formula can be used to estimate the variable cost:
Variable cost = Slope of the line = Rise ____ Run
= Y 2 − Y 1 _______ X 2 − X 1
To analyze mixed costs with the high-low method , begin by identifying the period with the
lowest level of activity and the period with the highest level of activity. The period with
the lowest activity is selected as the first point in the above formula and the period with the
highest activity is selected as the second point. Consequently, the formula becomes:
Variable cost = Y 2 − Y 1
_______
X 2 − X 1 =
Cost at the high activity level − Cost at the low activity level _________________________________________________
High activity level − Low activity level
or
Variable cost = Change in cost
_______________ Change in activity
Therefore, when the high-low method is used, the variable cost is estimated by dividing
the difference in cost between the high and low levels of activity by the change in activity
between those two points.
To return to the Brentline Hospital example, using the high-low method, we first
identify the periods with the highest and lowest activity —in this case, June and March.
We then use the activity and cost data from these two periods to estimate the variable cost
component as follows:
Variable cost = Change in cost
_______________ Change in activity
= $2,400 _______________
3,000 patient-days = $0.80 per patient-day
Having determined that the variable maintenance cost is 80 cents per patient-day, we
can now determine the amount of fixed cost. This is done by taking the total cost at either
the high or the low activity level and deducting the variable cost element. In the computa-
tion below, total cost at the high activity level is used in computing the fixed cost element:
Fixed cost element = Total cost − Variable cost element
= $9,800 − ($0.80 per patient-day × 8,000 patient-days)
= $3,400
Both the variable and fixed cost elements have now been isolated. The cost of main-
tenance can be expressed as $3,400 per month plus 80 cents per patient-day or as:
Y = $3,400 + $0.80X
Total Total
maintenance patient-days
cost
The data used in this illustration are shown graphically in Exhibit 2–10 . Notice that a
straight line has been drawn through the points corresponding to the low and high levels
Maintenance Patient-Days Cost Incurred
High activity level (June) . . . . . . . . 8,000 $9,800Low activity level (March) . . . . . . . 5,000 7,400Change . . . . . . . . . . . . . . . . . . . . . . 3,000 $2,400
gar11005_ch02_024-082.indd 39gar11005_ch02_024-082.indd 39 11/11/10 11:35 AM11/11/10 11:35 AM
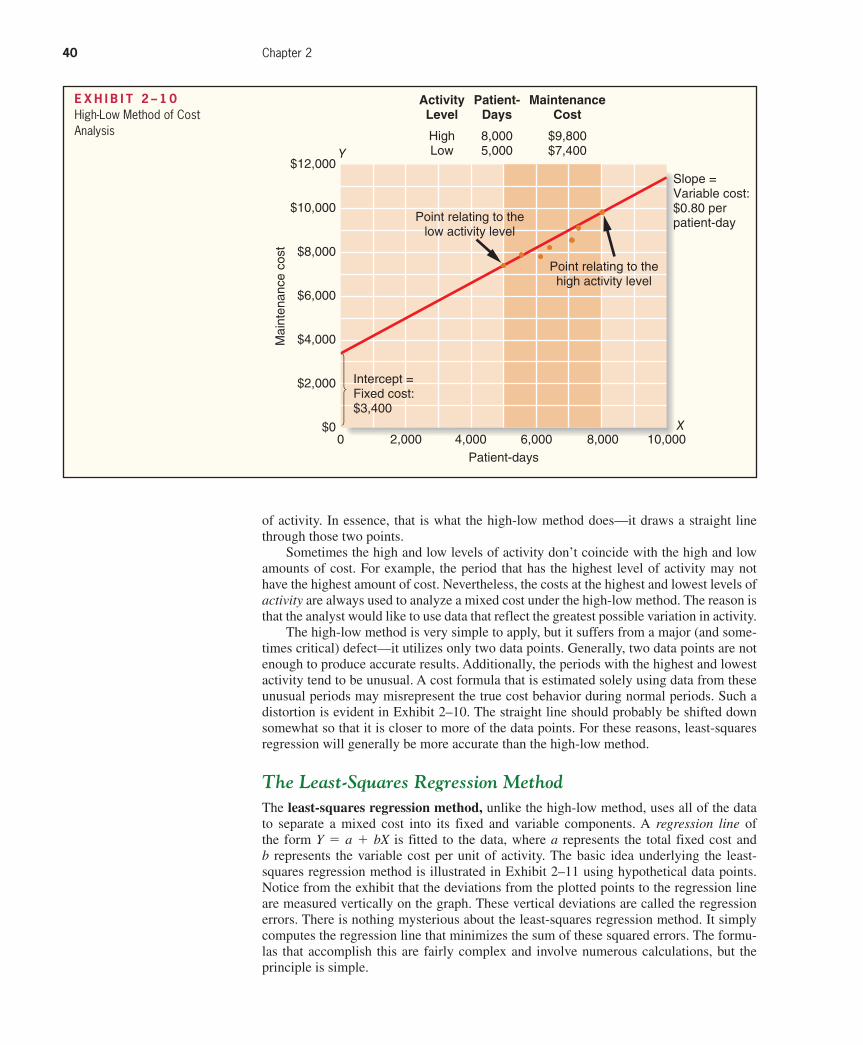
Confi rming Pages
40 Chapter 2
of activity. In essence, that is what the high-low method does—it draws a straight line
through those two points.
Sometimes the high and low levels of activity don’t coincide with the high and low
amounts of cost. For example, the period that has the highest level of activity may not
have the highest amount of cost. Nevertheless, the costs at the highest and lowest levels of
activity are always used to analyze a mixed cost under the high-low method. The reason is
that the analyst would like to use data that reflect the greatest possible variation in activity.
The high-low method is very simple to apply, but it suffers from a major (and some-
times critical) defect—it utilizes only two data points. Generally, two data points are not
enough to produce accurate results. Additionally, the periods with the highest and lowest
activity tend to be unusual. A cost formula that is estimated solely using data from these
unusual periods may misrepresent the true cost behavior during normal periods. Such a
distortion is evident in Exhibit 2–10 . The straight line should probably be shifted down
somewhat so that it is closer to more of the data points. For these reasons, least-squares
regression will generally be more accurate than the high-low method.
The Least-Squares Regression Method
The least-squares regression method , unlike the high-low method, uses all of the data
to separate a mixed cost into its fixed and variable components. A regression line of
the form Y = a + bX is fitted to the data, where a represents the total fixed cost and
b represents the variable cost per unit of activity. The basic idea underlying the least-
squares regression method is illustrated in Exhibit 2–11 using hypothetical data points.
Notice from the exhibit that the deviations from the plotted points to the regression line
are measured vertically on the graph. These vertical deviations are called the regression
errors. There is nothing mysterious about the least-squares regression method. It simply
computes the regression line that minimizes the sum of these squared errors. The formu-
las that accomplish this are fairly complex and involve numerous calculations, but the
principle is simple.
E X H I B I T 2 – 1 0 High-Low Method of Cost Analysis
$12,000
$10,000
$8,000
$6,000
$4,000
$2,000
$0
Mai
nten
ance
cos
t
0 2,000 4,000 6,000 8,000 10,000Patient-days
Y
X
Slope =Variable cost:$0.80 perpatient-day
Intercept =Fixed cost:$3,400
Point relating to thehigh activity level
Point relating to thelow activity level
ActivityLevel
HighLow
Patient-Days
8,0005,000
MaintenanceCost
$9,800$7,400
gar11005_ch02_024-082.indd 40gar11005_ch02_024-082.indd 40 02/11/10 4:31 PM02/11/10 4:31 PM
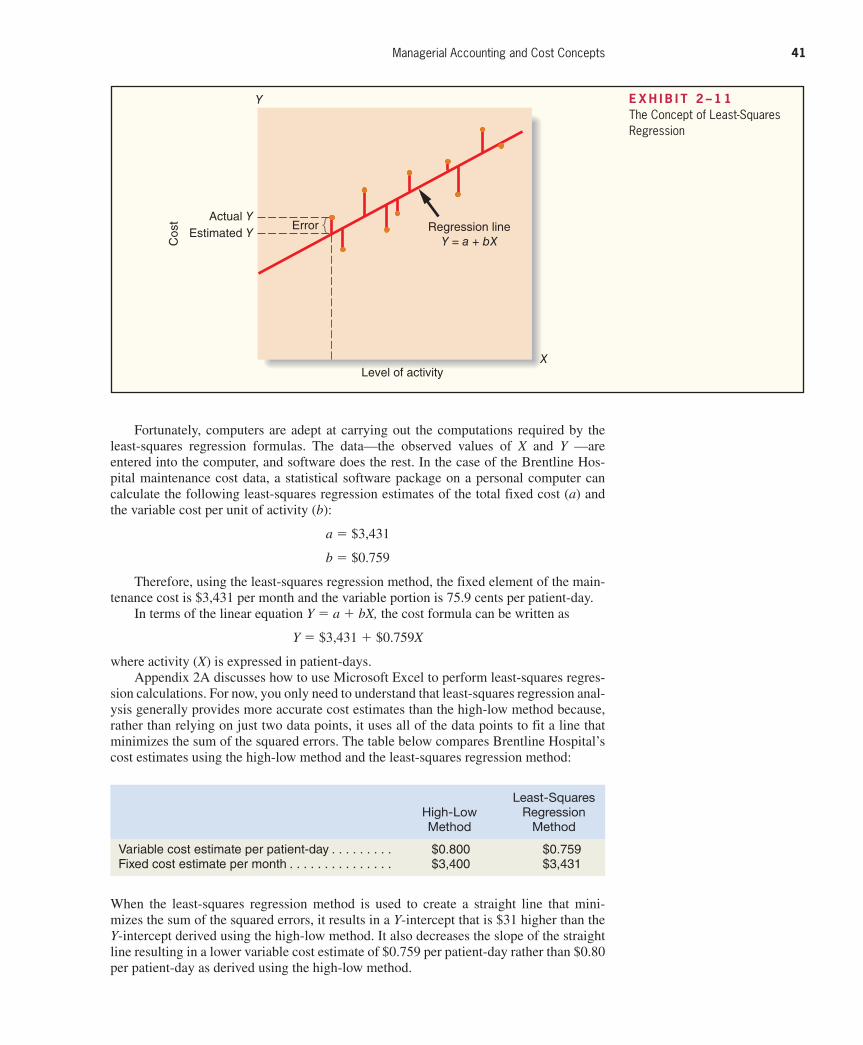
Confi rming Pages
Managerial Accounting and Cost Concepts 41
Fortunately, computers are adept at carrying out the computations required by the
least-squares regression formulas. The data—the observed values of X and Y —are
entered into the computer, and software does the rest. In the case of the Brentline Hos-
pital maintenance cost data, a statistical software package on a personal computer can
calculate the following least-squares regression estimates of the total fixed cost ( a ) and
the variable cost per unit of activity ( b ):
a = $3,431
b = $0.759
Therefore, using the least-squares regression method, the fixed element of the main-
tenance cost is $3,431 per month and the variable portion is 75.9 cents per patient-day.
In terms of the linear equation Y = a + bX, the cost formula can be written as
Y = $3,431 + $0.759X
where activity ( X ) is expressed in patient-days.
Appendix 2A discusses how to use Microsoft Excel to perform least-squares regres-
sion calculations. For now, you only need to understand that least-squares regression anal-
ysis generally provides more accurate cost estimates than the high-low method because,
rather than relying on just two data points, it uses all of the data points to fit a line that
minimizes the sum of the squared errors. The table below compares Brentline Hospital’s
cost estimates using the high-low method and the least-squares regression method:
E X H I B I T 2 – 1 1 The Concept of Least-Squares Regression
Error Regression lineY = a + bX
Y
XLevel of activity
Actual YEstimated Y
Cos
t
High-Low Method
Least-Squares Regression
Method
Variable cost estimate per patient-day . . . . . . . . . $0.800 $0.759Fixed cost estimate per month . . . . . . . . . . . . . . . $3,400 $3,431
When the least-squares regression method is used to create a straight line that mini-
mizes the sum of the squared errors, it results in a Y -intercept that is $31 higher than the
Y -intercept derived using the high-low method. It also decreases the slope of the straight
line resulting in a lower variable cost estimate of $0.759 per patient-day rather than $0.80
per patient-day as derived using the high-low method.
gar11005_ch02_024-082.indd 41gar11005_ch02_024-082.indd 41 02/11/10 4:31 PM02/11/10 4:31 PM
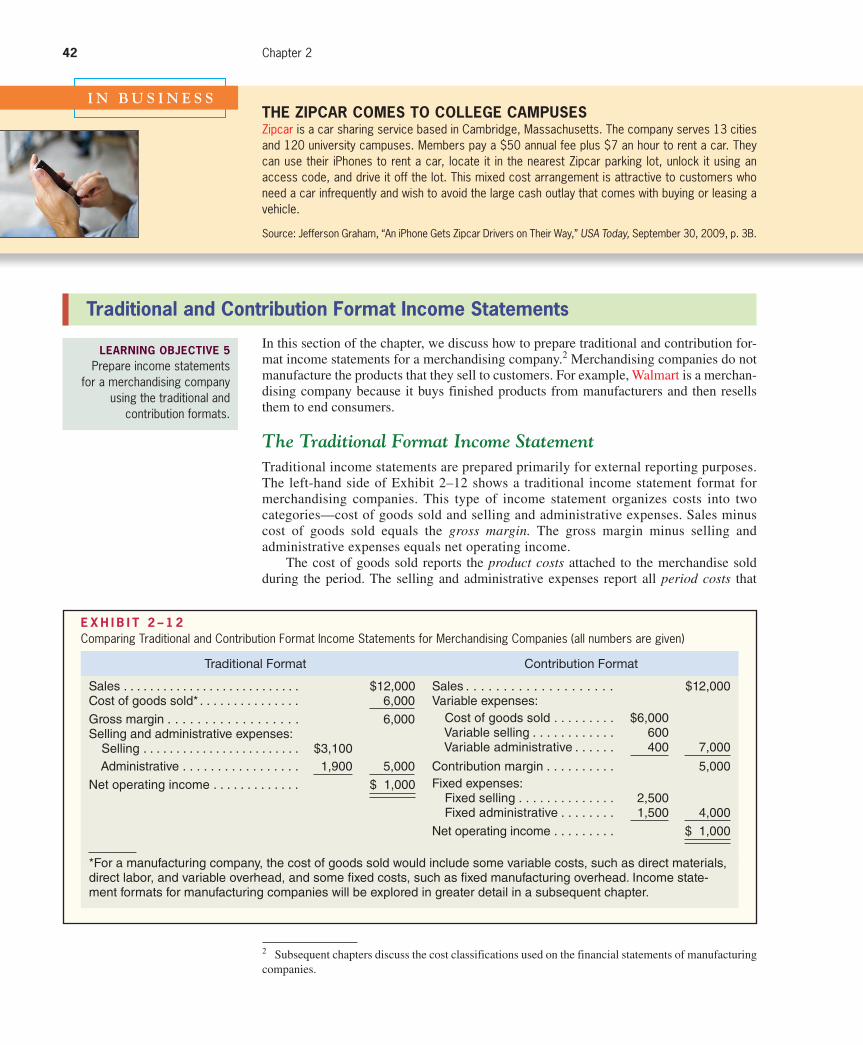
Confi rming Pages
42 Chapter 2
Traditional and Contribution Format Income Statements
I N B U S I N E S S THE ZIPCAR COMES TO COLLEGE CAMPUSES Zipcar is a car sharing service based in Cambridge, Massachusetts. The company serves 13 cities and 120 university campuses. Members pay a $50 annual fee plus $7 an hour to rent a car. They can use their iPhones to rent a car, locate it in the nearest Zipcar parking lot, unlock it using an access code, and drive it off the lot. This mixed cost arrangement is attractive to customers who need a car infrequently and wish to avoid the large cash outlay that comes with buying or leasing a vehicle.
Source: Jefferson Graham, “An iPhone Gets Zipcar Drivers on Their Way,” USA Today, September 30, 2009, p. 3B.
In this section of the chapter, we discuss how to prepare traditional and contribution for-
mat income statements for a merchandising company. 2 Merchandising companies do not
manufacture the products that they sell to customers. For example, Walmart is a merchan-
dising company because it buys finished products from manufacturers and then resells
them to end consumers.
The Traditional Format Income Statement
Traditional income statements are prepared primarily for external reporting purposes.
The left-hand side of Exhibit 2–12 shows a traditional income statement format for
merchandising companies. This type of income statement organizes costs into two
categories—cost of goods sold and selling and administrative expenses. Sales minus
cost of goods sold equals the gross margin. The gross margin minus selling and
administrative expenses equals net operating income.
The cost of goods sold reports the product costs attached to the merchandise sold
during the period. The selling and administrative expenses report all period costs that
LEARNING OBJECTIVE 5 Prepare income statements
for a merchandising company using the traditional and
contribution formats.
2 Subsequent chapters discuss the cost classifications used on the financial statements of manufacturing
companies.
E X H I B I T 2 – 1 2 Comparing Traditional and Contribution Format Income Statements for Merchandising Companies (all numbers are given)
Contribution Format
Sales . . . . . . . . . . . . . . . . . . . . $12,000Variable expenses: Cost of goods sold . . . . . . . . . $6,000 Variable selling . . . . . . . . . . . . 600 Variable administrative . . . . . . 400 7,000
Contribution margin . . . . . . . . . . 5,000Fixed expenses: Fixed selling . . . . . . . . . . . . . . 2,500 Fixed administrative . . . . . . . . 1,500 4,000
Net operating income . . . . . . . . . $ 1,000
Traditional Format
Sales . . . . . . . . . . . . . . . . . . . . . . . . . . . $12,000Cost of goods sold* . . . . . . . . . . . . . . . 6,000
Gross margin . . . . . . . . . . . . . . . . . . 6,000Selling and administrative expenses: Selling . . . . . . . . . . . . . . . . . . . . . . . . $3,100 Administrative . . . . . . . . . . . . . . . . . 1,900 5,000
Net operating income . . . . . . . . . . . . . $ 1,000
* For a manufacturing company, the cost of goods sold would include some variable costs, such as direct materials, direct labor, and variable overhead, and some fi xed costs, such as fi xed manufacturing overhead. Income state-ment formats for manufacturing companies will be explored in greater detail in a subsequent chapter.
gar11005_ch02_024-082.indd 42gar11005_ch02_024-082.indd 42 02/11/10 4:31 PM02/11/10 4:31 PM
Confi rming Pages
Managerial Accounting and Cost Concepts 43
have been expensed as incurred. The cost of goods sold for a merchandising company
can be computed directly by multiplying the number of units sold by their unit cost or
indirectly using the equation below:
Cost of goods sold
= Beginning
merchandise
inventory
+ Purchases − Ending
merchandise
inventory
For example, let’s assume that the company depicted in Exhibit 2–12 purchased $3,000
of merchandise inventory during the period and had beginning and ending merchandise
inventory balances of $7,000 and $4,000, respectively. The equation above could be used
to compute the cost of goods sold as follows:
Cost of goods
sold
= Beginning
merchandise
inventory
+ Purchases − Ending
merchandise
inventory
= $7,000 + $3,000 − $4,000
= $6,000
Although the traditional income statement is useful for external reporting purposes, it
has serious limitations when used for internal purposes. It does not distinguish between fixed
and variable costs. For example, under the heading “Selling and administrative expenses,”
both variable administrative costs ($400) and fixed administrative costs ($1,500) are lumped
together ($1,900). Internally, managers need cost data organized by cost behavior to aid in
planning, controlling, and decision making. The contribution format income statement has
been developed in response to these needs.
The Contribution Format Income Statement
The crucial distinction between fixed and variable costs is at the heart of the contribution approach to constructing income statements. The unique thing about the contribution
approach is that it provides managers with an income statement that clearly distinguishes
between fixed and variable costs and therefore aids planning, controlling, and decision
making. The right-hand side of Exhibit 2–12 shows a contribution format income state-
ment for merchandising companies.
The contribution approach separates costs into fixed and variable categories, first
deducting variable expenses from sales to obtain the contribution margin. For a merchan-
dising company, cost of goods sold is a variable cost that gets included in the “Variable
expenses” portion of the contribution format income statement. The contribution margin is
the amount remaining from sales revenues after variable expenses have been deducted. This
amount contributes toward covering fixed expenses and then toward profits for the period.
The contribution format income statement is used as an internal planning and
decision-making tool. Its emphasis on cost behavior aids cost-volume-profit analysis
(such as we shall be doing in a subsequent chapter), management performance apprais-
als, and budgeting. Moreover, the contribution approach helps managers organize data
pertinent to numerous decisions such as product-line analysis, pricing, use of scarce
resources, and make or buy analysis. All of these topics are covered in later chapters.
Cost Classifications for Assigning Costs to Cost Objects
Costs are assigned to cost objects for a variety of purposes including pricing, prepar-
ing profitability studies, and controlling spending. A cost object is anything for which
cost data are desired—including products, customers, jobs, and organizational subunits.
For purposes of assigning costs to cost objects, costs are classified as either direct or
indirect.
LEARNING OBJECTIVE 6Understand the differences between direct and indirect costs.
gar11005_ch02_024-082.indd 43gar11005_ch02_024-082.indd 43 02/11/10 4:31 PM02/11/10 4:31 PM
Confi rming Pages
44 Chapter 2
Direct Cost
A direct cost is a cost that can be easily and conveniently traced to a specified cost object.
The concept of direct cost extends beyond just direct materials and direct labor. For exam-
ple, if Reebok is assigning costs to its various regional and national sales offices, then the
salary of the sales manager in its Tokyo office would be a direct cost of that office.
Indirect Cost
An indirect cost is a cost that cannot be easily and conveniently traced to a specified cost
object. For example, a Campbell Soup factory may produce dozens of varieties of canned
soups. The factory manager’s salary would be an indirect cost of a particular variety such
as chicken noodle soup. The reason is that the factory manager’s salary is incurred as a
consequence of running the entire factory—it is not incurred to produce any one soup
variety. To be traced to a cost object such as a particular product, the cost must be caused by the cost object. The factory manager’s salary is called a common cost of producing
the various products of the factory. A common cost is a cost that is incurred to support
a number of cost objects but cannot be traced to them individually. A common cost is a
type of indirect cost.
A particular cost may be direct or indirect, depending on the cost object. While the
Campbell Soup factory manager’s salary is an indirect cost of manufacturing chicken
noodle soup, it is a direct cost of the manufacturing division. In the first case, the cost
object is chicken noodle soup. In the second case, the cost object is the entire manufactur-
ing division.
Cost Classifications for Decision Making
Costs are an important feature of many business decisions. In making decisions, it is essen-
tial to have a firm grasp of the concepts differential cost, opportunity cost, and sunk cost.
Differential Cost and Revenue
Decisions involve choosing between alternatives. In business decisions, each alternative
will have costs and benefits that must be compared to the costs and benefits of the other
available alternatives. A difference in costs between any two alternatives is known as
a differential cost . A difference in revenues between any two alternatives is known as
differential revenue . A differential cost is also known as an incremental cost , although technically an
incremental cost should refer only to an increase in cost from one alternative to another;
decreases in cost should be referred to as decremental costs. Differential cost is a broader
term, encompassing both cost increases (incremental costs) and cost decreases (decre-
mental costs) between alternatives.
The accountant’s differential cost concept can be compared to the economist’s mar-
ginal cost concept. In speaking of changes in cost and revenue, the economist uses the
terms marginal cost and marginal revenue. The revenue that can be obtained from selling
one more unit of product is called marginal revenue, and the cost involved in producing
one more unit of product is called marginal cost. The economist’s marginal concept is basi-
cally the same as the accountant’s differential concept applied to a single unit of output.
Differential costs can be either fixed or variable. To illustrate, assume that Nature
Way Cosmetics, Inc. , is thinking about changing its marketing method from distribution
LEARNING OBJECTIVE 7 Understand cost classifications
used in making decisions: differential costs, opportunity
costs, and sunk costs.
gar11005_ch02_024-082.indd 44gar11005_ch02_024-082.indd 44 02/11/10 4:31 PM02/11/10 4:31 PM
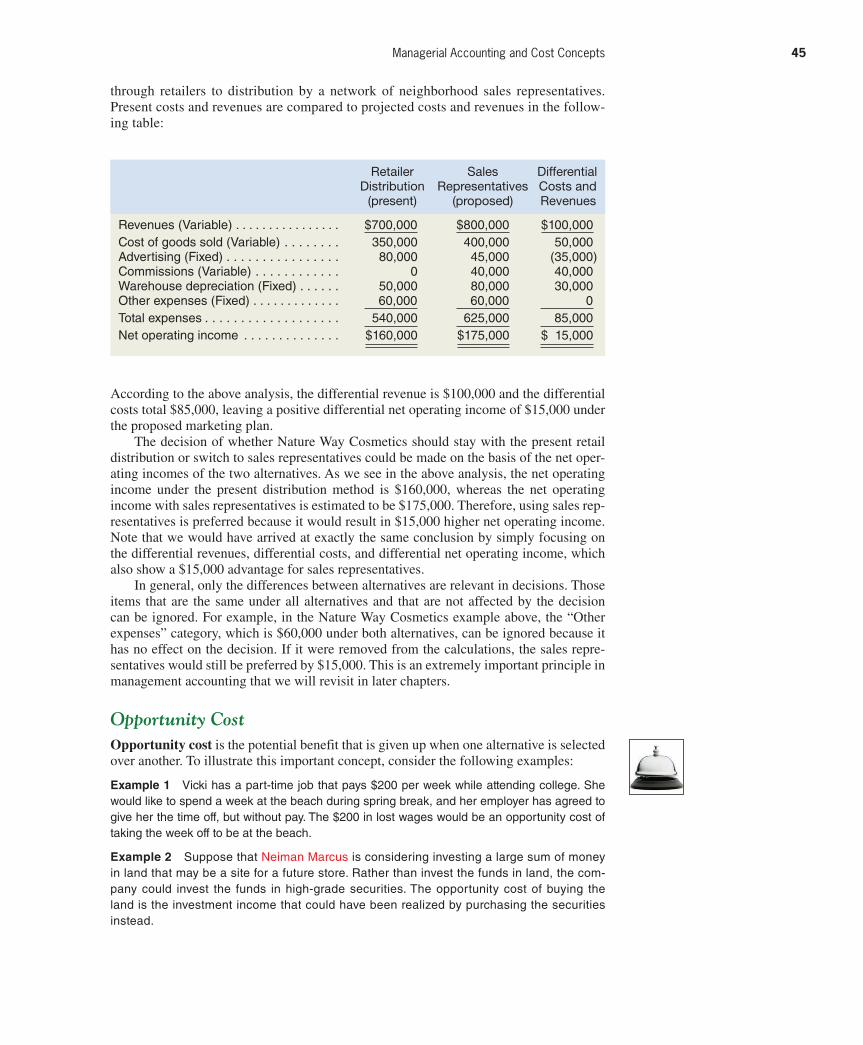
Confi rming Pages
Managerial Accounting and Cost Concepts 45
According to the above analysis, the differential revenue is $100,000 and the differential
costs total $85,000, leaving a positive differential net operating income of $15,000 under
the proposed marketing plan.
The decision of whether Nature Way Cosmetics should stay with the present retail
distribution or switch to sales representatives could be made on the basis of the net oper-
ating incomes of the two alternatives. As we see in the above analysis, the net operating
income under the present distribution method is $160,000, whereas the net operating
income with sales representatives is estimated to be $175,000. Therefore, using sales rep-
resentatives is preferred because it would result in $15,000 higher net operating income.
Note that we would have arrived at exactly the same conclusion by simply focusing on
the differential revenues, differential costs, and differential net operating income, which
also show a $15,000 advantage for sales representatives.
In general, only the differences between alternatives are relevant in decisions. Those
items that are the same under all alternatives and that are not affected by the decision
can be ignored. For example, in the Nature Way Cosmetics example above, the “Other
expenses” category, which is $60,000 under both alternatives, can be ignored because it
has no effect on the decision. If it were removed from the calculations, the sales repre-
sentatives would still be preferred by $15,000. This is an extremely important principle in
management accounting that we will revisit in later chapters.
Opportunity Cost
Opportunity cost is the potential benefit that is given up when one alternative is selected
over another. To illustrate this important concept, consider the following examples:
Example 1 Vicki has a part-time job that pays $200 per week while attending college. She would like to spend a week at the beach during spring break, and her employer has agreed to give her the time off, but without pay. The $200 in lost wages would be an opportunity cost of taking the week off to be at the beach.
Example 2 Suppose that Neiman Marcus is considering investing a large sum of money in land that may be a site for a future store. Rather than invest the funds in land, the com-pany could invest the funds in high-grade securities. The opportunity cost of buying the land is the investment income that could have been realized by purchasing the securities instead.
Retailer Sales Differential Distribution Representatives Costs and (present) (proposed) Revenues
Revenues (Variable) . . . . . . . . . . . . . . . . $700,000 $800,000 $100,000Cost of goods sold (Variable) . . . . . . . . 350,000 400,000 50,000Advertising (Fixed) . . . . . . . . . . . . . . . . 80,000 45,000 (35,000)Commissions (Variable) . . . . . . . . . . . . 0 40,000 40,000Warehouse depreciation (Fixed) . . . . . . 50,000 80,000 30,000Other expenses (Fixed) . . . . . . . . . . . . . 60,000 60,000 0Total expenses . . . . . . . . . . . . . . . . . . . 540,000 625,000 85,000Net operating income . . . . . . . . . . . . . . $160,000 $175,000 $ 15,000
through retailers to distribution by a network of neighborhood sales representatives.
Present costs and revenues are compared to projected costs and revenues in the follow-
ing table:
gar11005_ch02_024-082.indd 45gar11005_ch02_024-082.indd 45 02/11/10 4:31 PM02/11/10 4:31 PM
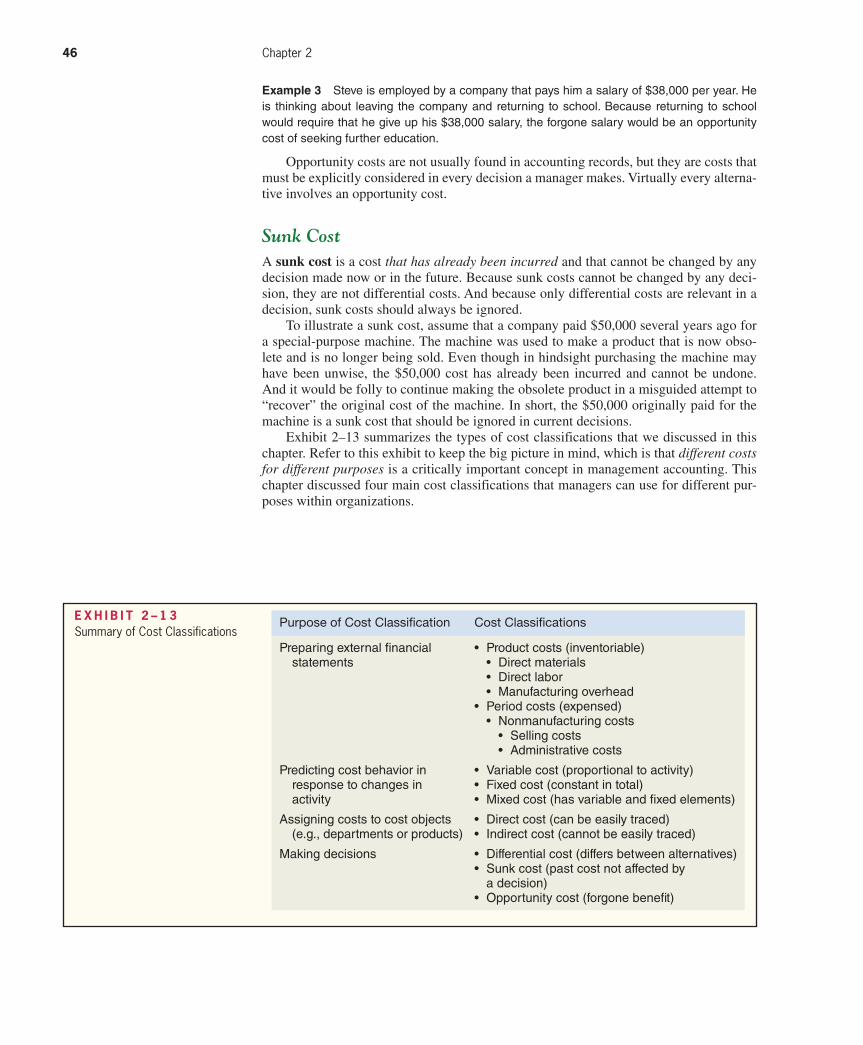
Confi rming Pages
46 Chapter 2
Example 3 Steve is employed by a company that pays him a salary of $38,000 per year. He is thinking about leaving the company and returning to school. Because returning to school would require that he give up his $38,000 salary, the forgone salary would be an opportunity cost of seeking further education.
Opportunity costs are not usually found in accounting records, but they are costs that
must be explicitly considered in every decision a manager makes. Virtually every alterna-
tive involves an opportunity cost.
Sunk Cost
A sunk cost is a cost that has already been incurred and that cannot be changed by any
decision made now or in the future. Because sunk costs cannot be changed by any deci-
sion, they are not differential costs. And because only differential costs are relevant in a
decision, sunk costs should always be ignored.
To illustrate a sunk cost, assume that a company paid $50,000 several years ago for
a special-purpose machine. The machine was used to make a product that is now obso-
lete and is no longer being sold. Even though in hindsight purchasing the machine may
have been unwise, the $50,000 cost has already been incurred and cannot be undone.
And it would be folly to continue making the obsolete product in a misguided attempt to
“recover” the original cost of the machine. In short, the $50,000 originally paid for the
machine is a sunk cost that should be ignored in current decisions.
Exhibit 2–13 summarizes the types of cost classifications that we discussed in this
chapter. Refer to this exhibit to keep the big picture in mind, which is that different costs for different purposes is a critically important concept in management accounting. This
chapter discussed four main cost classifications that managers can use for different pur-
poses within organizations.
Purpose of Cost Classification
Preparing external fi nancial statements
Predicting cost behavior in response to changes in activity
Assigning costs to cost objects (e.g., departments or products)
Making decisions
Cost Classifications
• Product costs (inventoriable)• Direct materials• Direct labor• Manufacturing overhead
• Period costs (expensed)• Nonmanufacturing costs
• Selling costs• Administrative costs
• Variable cost (proportional to activity)• Fixed cost (constant in total)• Mixed cost (has variable and fi xed elements)
• Direct cost (can be easily traced)• Indirect cost (cannot be easily traced)
• Differential cost (differs between alternatives)• Sunk cost (past cost not affected by
a decision)• Opportunity cost (forgone benefi t)
E X H I B I T 2 – 1 3 Summary of Cost Classifications
gar11005_ch02_024-082.indd 46gar11005_ch02_024-082.indd 46 02/11/10 4:31 PM02/11/10 4:31 PM
Confi rming Pages
Managerial Accounting and Cost Concepts 47
Review Problem 1: Cost Terms
Many new cost terms have been introduced in this chapter. It will take you some time to learn what
each term means and how to properly classify costs in an organization. Consider the following
example: Porter Company manufactures furniture, including tables. Selected costs are given below:
1. The tables are made of wood that costs $100 per table.
2. The tables are assembled by workers, at a wage cost of $40 per table.
3. Workers assembling the tables are supervised by a factory supervisor who is paid $38,000
per year.
4. Electrical costs are $2 per machine-hour. Four machine-hours are required to produce a table.
5. The depreciation on the machines used to make the tables totals $10,000 per year. The
machines have no resale value and do not wear out through use.
6. The salary of the president of the company is $100,000 per year.
7. The company spends $250,000 per year to advertise its products.
8. Salespersons are paid a commission of $30 for each table sold.
9. Instead of producing the tables, the company could rent its factory space for $50,000 per year.
Required: Classify these costs according to the various cost terms used in the chapter. Carefully study the classification of each cost. If you don’t understand why a particular cost is classified the way it is,
Summary
In this chapter, we have discussed ways in which managers classify costs. How the costs will be
used—for preparing external reports, predicting cost behavior, assigning costs to cost objects, or
decision making—will dictate how the costs are classified.
For external reporting purposes, costs are classified as either product costs or period costs.
Product costs are assigned to inventories and are considered assets until the products are sold.
At the point of sale, product costs become cost of goods sold on the income statement. In con-
trast, period costs are taken directly to the income statement as expenses in the period in which
they are incurred.
For purposes of predicting how costs will react to changes in activity, costs are classified into
three categories—variable, fixed, and mixed. Variable costs, in total, are strictly proportional to
activity. The variable cost per unit is constant. Fixed costs, in total, remain the same as the activity
level changes within the relevant range. The average fixed cost per unit decreases as the activity
level increases. Mixed costs consist of variable and fixed elements and can be expressed in equa-
tion form as Y = a + bX, where X is the activity, Y is the cost, a is the fixed cost element, and b is
the variable cost per unit of activity.
If the relation between cost and activity appears to be linear based on a scattergraph plot, then
the variable and fixed components of a mixed cost can be estimated using the high-low method,
which implicitly draws a straight line through the points of lowest activity and highest activity, or
the least-squares regression method, which uses all of the data points to compute a regression line
that minimizes the sum of the squares errors.
The traditional income statement format is used primarily for external reporting purposes. It
organizes costs using product and period cost classifications. The contribution format income state-
ment aids decision making because it organizes costs using variable and fixed cost classifications.
For purposes of assigning costs to cost objects such as products or departments, costs are clas-
sified as direct or indirect. Direct costs can be conveniently traced to cost objects. Indirect costs
cannot be conveniently traced to cost objects.
For purposes of making decisions, the concepts of differential cost and revenue, opportunity
cost, and sunk cost are vitally important. Differential costs and revenues are the costs and revenues
that differ between alternatives. Opportunity cost is the benefit that is forgone when one alternative
is selected over another. Sunk cost is a cost that occurred in the past and cannot be altered. Dif-
ferential costs and opportunity costs should be carefully considered in decisions. Sunk costs are
always irrelevant in decisions and should be ignored.
gar11005_ch02_024-082.indd 47gar11005_ch02_024-082.indd 47 02/11/10 4:31 PM02/11/10 4:31 PM
Confi rming Pages
48 Chapter 2
reread the section of the chapter discussing the particular cost term. The terms variable cost and
fixed cost refer to how costs behave with respect to the number of tables produced in a year.
Solution to Review Problem 1
Period
(Selling and
Variable Fixed Administrative) Direct Direct Manufacturing Sunk Opportunity
Cost Cost Cost Materials Labor Overhead Cost Cost
1. Wood used in a table ($100 per table) . . . . . . . . . . X X2. Labor cost to assemble a table ($40 per table) . . . . . X X3. Salary of the factory supervisor ($38,000 per year) . . . . . . . . . . . . . . . . . . . . X X4. Cost of electricity to produce tables ($2 per machine-hour) . . . . . . . . . . . X X5. Depreciation of machines used to produce tables ($10,000 per year) . . . . . . . . X X X*6. Salary of the company president ($100,000 per year) . . . . . . . . . . . . . . . . . . . . X X7. Advertising expense ($250,000 per year) . . . . . . . . . . . . . . . . . . X X8. Commissions paid to salespersons ($30 per table sold) . . . . . . . X X9. Rental income forgone on factory space . . . . . . . . . . . . X†
*This is a sunk cost because the outlay for the equipment was made in a previous period.†This is an opportunity cost because it represents the potential benefit that is lost or sacrificed as a result of using the factory space to produce tables. Opportunity cost is a special category of cost that is not ordinarily recorded in an organization’s accounting records. To avoid possible confusion with other costs, we will not attempt to classify this cost in any other way except as an opportunity cost.
Product Cost
Review Problem 2: High-Low Method
The administrator of Azalea Hills Hospital would like a cost formula linking the administrative
costs involved in admitting patients to the number of patients admitted during a month. The Admit-
ting Department’s costs and the number of patients admitted during the immediately preceding
eight months are given in the following table:
Number of Admitting
Month Patients Admitted Department Costs
May . . . . . . . . . . . . . . . 1,800 $14,700June . . . . . . . . . . . . . . 1,900 $15,200July . . . . . . . . . . . . . . 1,700 $13,700August . . . . . . . . . . . . 1,600 $14,000September . . . . . . . . . 1,500 $14,300October . . . . . . . . . . . . 1,300 $13,100November . . . . . . . . . . 1,100 $12,800December . . . . . . . . . . 1,500 $14,600
gar11005_ch02_024-082.indd 48gar11005_ch02_024-082.indd 48 02/11/10 4:31 PM02/11/10 4:31 PM
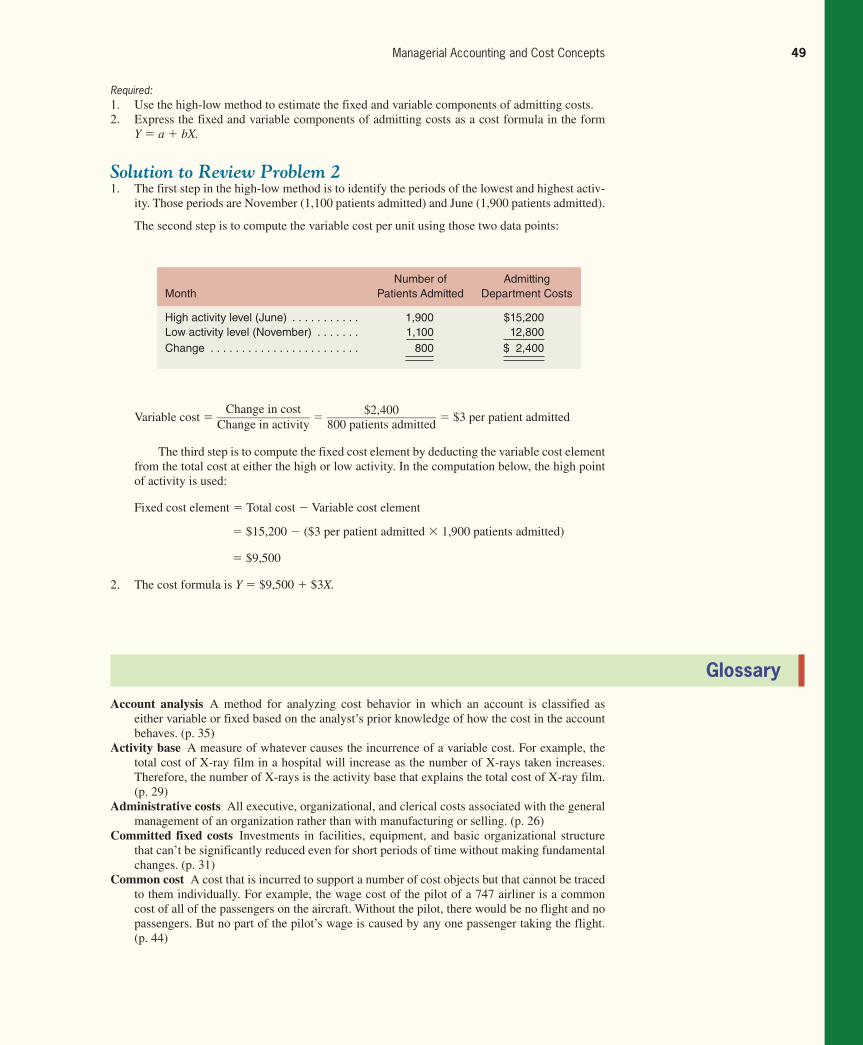
Confi rming Pages
Managerial Accounting and Cost Concepts 49
Required: 1. Use the high-low method to estimate the fixed and variable components of admitting costs.
2. Express the fixed and variable components of admitting costs as a cost formula in the form
Y = a + bX.
Solution to Review Problem 2 1. The first step in the high-low method is to identify the periods of the lowest and highest activ-
ity. Those periods are November (1,100 patients admitted) and June (1,900 patients admitted).
The second step is to compute the variable cost per unit using those two data points:
Number of AdmittingMonth Patients Admitted Department Costs
High activity level (June) . . . . . . . . . . . 1,900 $15,200Low activity level (November) . . . . . . . 1,100 12,800Change . . . . . . . . . . . . . . . . . . . . . . . . 800 $ 2,400
Variable cost = Change in cost
_______________ Change in activity
= $2,400
__________________ 800 patients admitted
= $3 per patient admitted
The third step is to compute the fixed cost element by deducting the variable cost element
from the total cost at either the high or low activity. In the computation below, the high point
of activity is used:
Fixed cost element = Total cost − Variable cost element
= $15,200 − ($3 per patient admitted × 1,900 patients admitted)
= $9,500
2. The cost formula is Y = $9,500 + $3 X.
Glossary
Account analysis A method for analyzing cost behavior in which an account is classified as
either variable or fixed based on the analyst’s prior knowledge of how the cost in the account
behaves. (p. 35)
Activity base A measure of whatever causes the incurrence of a variable cost. For example, the
total cost of X-ray film in a hospital will increase as the number of X-rays taken increases.
Therefore, the number of X-rays is the activity base that explains the total cost of X-ray film.
(p. 29)
Administrative costs All executive, organizational, and clerical costs associated with the general
management of an organization rather than with manufacturing or selling. (p. 26)
Committed fixed costs Investments in facilities, equipment, and basic organizational structure
that can’t be significantly reduced even for short periods of time without making fundamental
changes. (p. 31)
Common cost A cost that is incurred to support a number of cost objects but that cannot be traced
to them individually. For example, the wage cost of the pilot of a 747 airliner is a common
cost of all of the passengers on the aircraft. Without the pilot, there would be no flight and no
passengers. But no part of the pilot’s wage is caused by any one passenger taking the flight.
(p. 44)
gar11005_ch02_024-082.indd 49gar11005_ch02_024-082.indd 49 02/11/10 4:31 PM02/11/10 4:31 PM
Confi rming Pages
50 Chapter 2
Contribution approach An income statement format that organizes costs by their behavior. Costs
are separated into variable and fixed categories rather than being separated into product and
period costs for external reporting purposes. (p. 43)
Contribution margin The amount remaining from sales revenues after all variable expenses have
been deducted. (p. 43)
Conversion cost Direct labor cost plus manufacturing overhead cost. (p. 27)
Cost behavior The way in which a cost reacts to changes in the level of activity. (p. 29)
Cost object Anything for which cost data are desired. Examples of cost objects are products, cus-
tomers, jobs, and parts of the organization such as departments or divisions. (p. 43)
Cost structure The relative proportion of fixed, variable, and mixed costs in an organization.
(p. 29)
Dependent variable A variable that responds to some causal factor; total cost is the dependent
variable, as represented by the letter Y, in the equation Y = a + bX. (p. 35)
Differential cost A difference in cost between two alternatives. Also see Incremental cost. (p. 44)
Differential revenue The difference in revenue between two alternatives. (p. 44)
Direct cost A cost that can be easily and conveniently traced to a specified cost object. (p. 44)
Direct labor Factory labor costs that can be easily traced to individual units of product. Also
called touch labor. (p. 25)
Direct materials Materials that become an integral part of a finished product and whose costs can
be conveniently traced to it. (p. 25)
Discretionary fixed costs Those fixed costs that arise from annual decisions by management to
spend on certain fixed cost items, such as advertising and research. (p. 31)
Engineering approach A detailed analysis of cost behavior based on an industrial engineer’s
evaluation of the inputs that are required to carry out a particular activity and of the prices of
those inputs. (p. 35)
Fixed cost A cost that remains constant, in total, regardless of changes in the level of activity
within the relevant range. If a fixed cost is expressed on a per unit basis, it varies inversely
with the level of activity. (p. 30)
High-low method A method of separating a mixed cost into its fixed and variable elements by
analyzing the change in cost between the high and low activity levels. (p. 39)
Incremental cost An increase in cost between two alternatives. Also see Differential cost. (p. 44)
Independent variable A variable that acts as a causal factor; activity is the independent variable,
as represented by the letter X, in the equation Y = a + bX. (p. 36)
Indirect cost A cost that cannot be easily and conveniently traced to a specified cost object.
(p. 44)
Indirect labor The labor costs of janitors, supervisors, materials handlers, and other factory
workers that cannot be conveniently traced to particular products. (p. 25)
Indirect materials Small items of material such as glue and nails that may be an integral part of a
finished product, but whose costs cannot be easily or conveniently traced to it. (p. 25)
Inventoriable costs Synonym for product costs. (p. 27)
Least-squares regression method A method of separating a mixed cost into its fixed and variable
elements by fitting a regression line that minimizes the sum of the squared errors. (p. 40)
Linear cost behavior Cost behavior is said to be linear whenever a straight line is a reasonable
approximation for the relation between cost and activity. (p. 36)
Manufacturing overhead All manufacturing costs except direct materials and direct labor.
(p. 26)
Mixed cost A cost that contains both variable and fixed cost elements. (p. 33)
Opportunity cost The potential benefit that is given up when one alternative is selected over
another. (p. 45)
Period costs Costs that are taken directly to the income statement as expenses in the period in
which they are incurred or accrued. (p. 27)
Prime cost Direct materials cost plus direct labor cost. (p. 27)
Product costs All costs that are involved in acquiring or making a product. In the case of manufac-
tured goods, these costs consist of direct materials, direct labor, and manufacturing overhead.
Also see Inventoriable costs. (p. 27)
gar11005_ch02_024-082.indd 50gar11005_ch02_024-082.indd 50 02/11/10 4:31 PM02/11/10 4:31 PM

Rev.Confi rming Pages
Managerial Accounting and Cost Concepts 51
2–1 What are the three major elements of product costs in a manufacturing company?
2–2 Define the following: (a) direct materials, (b) indirect materials, (c) direct labor,
(d) indirect labor, and (e) manufacturing overhead.
2–3 Explain the difference between a product cost and a period cost.
2–4 Distinguish between ( a ) a variable cost, ( b ) a fixed cost, and ( c ) a mixed cost.
2–5 What effect does an increase in volume have on—
a. Unit fixed costs?
b. Unit variable costs?
c. Total fixed costs?
d. Total variable costs?
2–6 Define the following terms: ( a ) cost behavior and ( b ) relevant range.
2–7 What is meant by an activity base when dealing with variable costs? Give several exam-
ples of activity bases.
2–8 Managers often assume a strictly linear relationship between cost and volume. How can
this practice be defended in light of the fact that many costs are curvilinear?
2–9 Distinguish between discretionary fixed costs and committed fixed costs.
2–10 Does the concept of the relevant range apply to fixed costs? Explain.
2–11 What is the major disadvantage of the high-low method?
2–12 Give the general formula for a mixed cost. Which term represents the variable cost? The
fixed cost?
2–13 What is meant by the term least-squares regression?
2–14 What is the difference between a contribution format income statement and a traditional
format income statement?
2–15 What is the contribution margin?
2–16 Define the following terms: differential cost, opportunity cost, and sunk cost.
2–17 Only variable costs can be differential costs. Do you agree? Explain.
Multiple-choice questions are provided on the text website at www.mhhe.com/garrison14e .
Raw materials Any materials that go into the final product. (p. 25)
Relevant range The range of activity within which assumptions about variable and fixed cost
behavior are valid. (p. 32)
Selling costs All costs that are incurred to secure customer orders and get the finished product or
service into the hands of the customer. (p. 26)
Sunk cost A cost that has already been incurred and that cannot be changed by any decision made
now or in the future. (p. 46)
Variable cost A cost that varies, in total, in direct proportion to changes in the level of activity.
A variable cost is constant per unit. (p. 29)
Questions
Applying Excel
Available with McGraw-Hill’s Connect™ Accounting.
The Excel worksheet form that appears on the next page is to be used to recreate Exhibit 2–12 on
page 42. Download the workbook containing this form from the Online Learning Center at www.
mhhe.com/garrison14e. On the website you will also receive instructions about how to use this worksheet form.
LEARNING OBJECTIVE 5
gar11005_ch02_024-082.indd 51gar11005_ch02_024-082.indd 51 11/11/10 11:35 AM11/11/10 11:35 AM
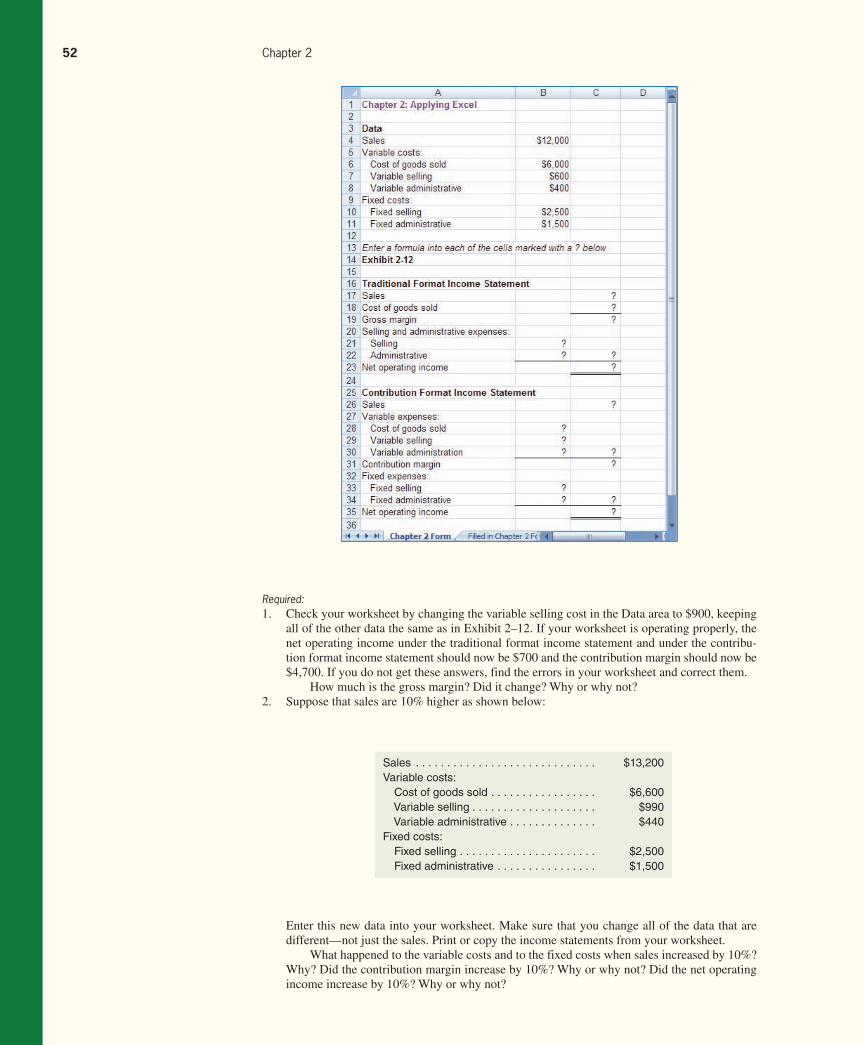
Confi rming Pages
52 Chapter 2
Required:1. Check your worksheet by changing the variable selling cost in the Data area to $900, keeping
all of the other data the same as in Exhibit 2–12. If your worksheet is operating properly, the
net operating income under the traditional format income statement and under the contribu-
tion format income statement should now be $700 and the contribution margin should now be
$4,700. If you do not get these answers, find the errors in your worksheet and correct them.
How much is the gross margin? Did it change? Why or why not?
2. Suppose that sales are 10% higher as shown below:
Enter this new data into your worksheet. Make sure that you change all of the data that are
different—not just the sales. Print or copy the income statements from your worksheet.
What happened to the variable costs and to the fixed costs when sales increased by 10%?
Why? Did the contribution margin increase by 10%? Why or why not? Did the net operating
income increase by 10%? Why or why not?
Sales . . . . . . . . . . . . . . . . . . . . . . . . . . . . . $13,200Variable costs: Cost of goods sold . . . . . . . . . . . . . . . . . $6,600 Variable selling . . . . . . . . . . . . . . . . . . . . $990 Variable administrative . . . . . . . . . . . . . . $440Fixed costs: Fixed selling . . . . . . . . . . . . . . . . . . . . . . $2,500 Fixed administrative . . . . . . . . . . . . . . . . $1,500
gar11005_ch02_024-082.indd 52gar11005_ch02_024-082.indd 52 02/11/10 4:31 PM02/11/10 4:31 PM
Confi rming Pages
Managerial Accounting and Cost Concepts 53
All applicable exercises are available with McGraw-Hill’s Connect™ Accounting .
EXERCISE 2–1 Classifying Manufacturing Costs [LO1] Your Boat, Inc., assembles custom sailboats from components supplied by various manufacturers.
The company is very small and its assembly shop and retail sales store are housed in a Gig Harbor,
Washington, boathouse. Below are listed some of the costs that are incurred at the company.
Required: For each cost, indicate whether it would most likely be classified as direct labor, direct materials,
manufacturing overhead, selling, or an administrative cost.
1. The wages of employees who build the sailboats.
2. The cost of advertising in the local newspapers.
3. The cost of an aluminum mast installed in a sailboat.
4. The wages of the assembly shop’s supervisor.
5. Rent on the boathouse.
6. The wages of the company’s bookkeeper.
7. Sales commissions paid to the company’s salespeople.
8. Depreciation on power tools.
EXERCISE 2–2 Classification of Costs as Period or Product Costs [LO2] Suppose that you have been given a summer job at Fairwings Avionics, a company that manufac-
tures sophisticated radar sets for commercial aircraft. The company, which is privately owned, has
approached a bank for a loan to help finance its tremendous growth. The bank requires financial
statements before approving such a loan.
Required: Classify each cost listed below as either a product cost or a period cost for purposes of preparing
the financial statements for the bank.
1. The cost of the memory chips used in a radar set.
2. Factory heating costs.
3. Factory equipment maintenance costs.
4. Training costs for new administrative employees.
5. The cost of the solder that is used in assembling the radar sets.
6. The travel costs of the company’s salespersons.
7. Wages and salaries of factory security personnel.
8. The cost of air-conditioning executive offices.
9. Wages and salaries in the department that handles billing customers.
10. Depreciation on the equipment in the fitness room used by factory workers.
11. Telephone expenses incurred by factory management.
12. The costs of shipping completed radar sets to customers.
13. The wages of the workers who assemble the radar sets.
14. The president’s salary.
15. Health insurance premiums for factory personnel.
EXERCISE 2–3 Fixed and Variable Cost Behavior [LO3] Koffee Express operates a number of espresso coffee stands in busy suburban malls. The fixed
weekly expense of a coffee stand is $1,100 and the variable cost per cup of coffee served is $0.26.
Required: 1. Fill in the following table with your estimates of total costs and average cost per cup of coffee
at the indicated levels of activity for a coffee stand. Round off the cost of a cup of coffee to the
nearest tenth of a cent.
Cups of Coffee Served in a Week
1,800 1,900 2,000
Fixed cost . . . . . . . . . . . . . . . . . . . . . . . . . . ? ? ?Variable cost . . . . . . . . . . . . . . . . . . . . . . . . ? ? ?Total cost . . . . . . . . . . . . . . . . . . . . . . . . . . . . . ? ? ?Average cost per cup of coffee served . . . . ? ? ?
Exercises
gar11005_ch02_024-082.indd 53gar11005_ch02_024-082.indd 53 02/11/10 4:31 PM02/11/10 4:31 PM
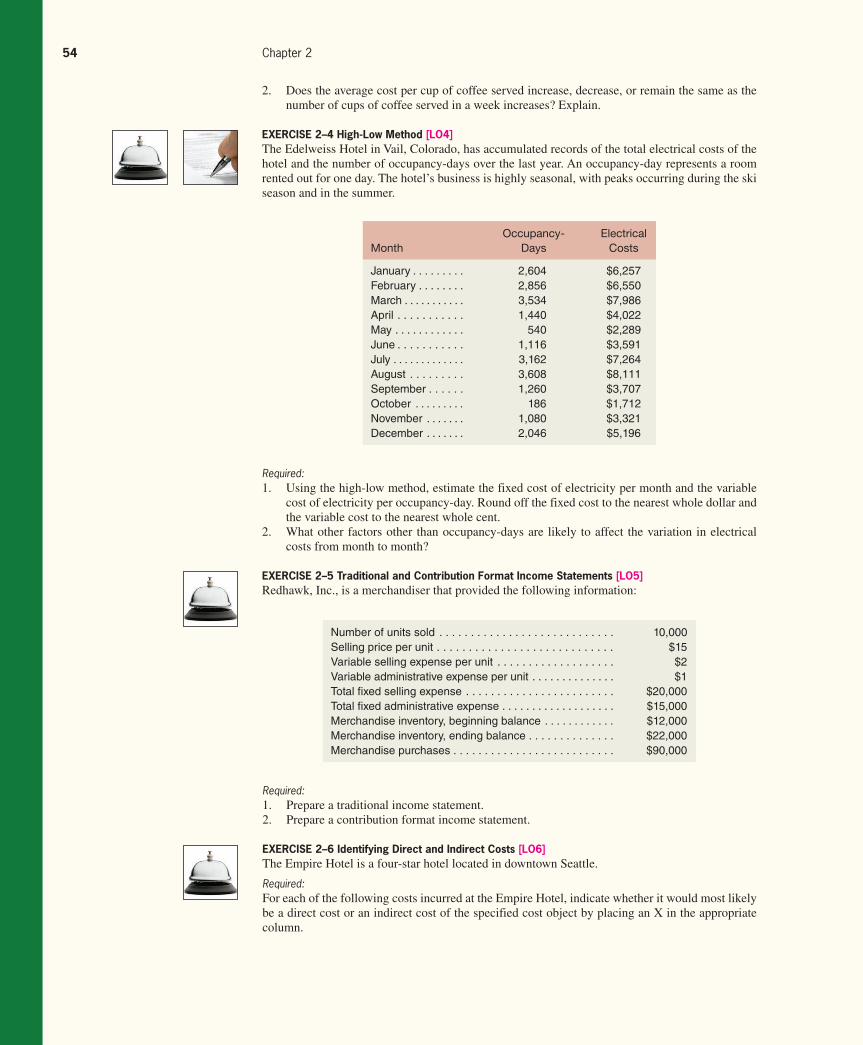
Confi rming Pages
54 Chapter 2
2. Does the average cost per cup of coffee served increase, decrease, or remain the same as the
number of cups of coffee served in a week increases? Explain.
EXERCISE 2–4 High-Low Method [LO4] The Edelweiss Hotel in Vail, Colorado, has accumulated records of the total electrical costs of the
hotel and the number of occupancy-days over the last year. An occupancy-day represents a room
rented out for one day. The hotel’s business is highly seasonal, with peaks occurring during the ski
season and in the summer.
Month
Occupancy-
Days
Electrical
Costs
January . . . . . . . . . 2,604 $6,257February . . . . . . . . 2,856 $6,550March . . . . . . . . . . . 3,534 $7,986April . . . . . . . . . . . 1,440 $4,022May . . . . . . . . . . . . 540 $2,289June . . . . . . . . . . . 1,116 $3,591July . . . . . . . . . . . . . 3,162 $7,264August . . . . . . . . . 3,608 $8,111September . . . . . . 1,260 $3,707October . . . . . . . . . 186 $1,712November . . . . . . . 1,080 $3,321December . . . . . . . 2,046 $5,196
Required: 1. Using the high-low method, estimate the fixed cost of electricity per month and the variable
cost of electricity per occupancy-day. Round off the fixed cost to the nearest whole dollar and
the variable cost to the nearest whole cent.
2. What other factors other than occupancy-days are likely to affect the variation in electrical
costs from month to month?
EXERCISE 2–5 Traditional and Contribution Format Income Statements [LO5] Redhawk, Inc., is a merchandiser that provided the following information:
Number of units sold . . . . . . . . . . . . . . . . . . . . . . . . . . . . 10,000Selling price per unit . . . . . . . . . . . . . . . . . . . . . . . . . . . . $15Variable selling expense per unit . . . . . . . . . . . . . . . . . . . $2Variable administrative expense per unit . . . . . . . . . . . . . . $1Total fi xed selling expense . . . . . . . . . . . . . . . . . . . . . . . . $20,000Total fi xed administrative expense . . . . . . . . . . . . . . . . . . . $15,000Merchandise inventory, beginning balance . . . . . . . . . . . . $12,000Merchandise inventory, ending balance . . . . . . . . . . . . . . $22,000Merchandise purchases . . . . . . . . . . . . . . . . . . . . . . . . . . $90,000
Required: 1. Prepare a traditional income statement.
2. Prepare a contribution format income statement.
EXERCISE 2–6 Identifying Direct and Indirect Costs [LO6] The Empire Hotel is a four-star hotel located in downtown Seattle.
Required: For each of the following costs incurred at the Empire Hotel, indicate whether it would most likely
be a direct cost or an indirect cost of the specified cost object by placing an X in the appropriate
column.
gar11005_ch02_024-082.indd 54gar11005_ch02_024-082.indd 54 02/11/10 4:31 PM02/11/10 4:31 PM
Confi rming Pages
Managerial Accounting and Cost Concepts 55
EXERCISE 2–7 Differential, Opportunity, and Sunk Costs [LO7] The Sorrento Hotel is a four-star hotel located in downtown Seattle. The hotel’s operations vice
president would like to replace the hotel’s antiquated computer terminals at the registration desk
with attractive state-of-the-art flat-panel displays. The new displays would take less space, would
consume less power than the old computer terminals, and would provide additional security since
they can only be viewed from a restrictive angle. The new computer displays would not require
any new wiring. The hotel’s chef believes the funds would be better spent on a new bulk freezer
for the kitchen.
Required: For each of the items below, indicate by placing an X in the appropriate column whether it should
be considered a differential cost, an opportunity cost, or a sunk cost in the decision to replace the
old computer terminals with new flat-panel displays. If none of the categories apply for a particular
item, leave all columns blank.
Cost Cost Object
Direct
Cost
Indirect
Cost
Ex. Room service beverages A particular hotel guest X 1. The salary of the head chef The hotel’s restaurant 2. The salary of the head chef A particular restaurant customer 3. Room cleaning supplies A particular hotel guest 4. Flowers for the reception desk A particular hotel guest 5. The wages of the doorman A particular hotel guest 6. Room cleaning supplies The housecleaning department 7. Fire insurance on the hotel building The hotel’s gym 8. Towels used in the gym The hotel’s gym
Item
Differential
Cost
Opportunity
Cost
Sunk
Cost
Ex. Cost of electricity to run the terminals . . . . . . . . . . . . . . . X 1. Cost of the new fl at-panel displays . . . . . . . . . . . . . . . . . 2. Cost of the old computer terminals . . . . . . . . . . . . . . . . . 3. Rent on the space occupied by the registration desk . . . 4. Wages of registration desk personnel . . . . . . . . . . . . . . . 5. Benefi ts from a new freezer . . . . . . . . . . . . . . . . . . . . . . . . 6. Costs of maintaining the old computer terminals . . . . . . . 7. Cost of removing the old computer terminals . . . . . . . . . 8. Cost of existing registration desk wiring . . . . . . . . . . . . .
EXERCISE 2–8 Cost Behavior; Contribution Format Income Statement [LO3, LO5] Parker Company manufactures and sells a single product. A partially completed schedule of the
company’s total and per unit costs over a relevant range of 60,000 to 100,000 units produced and
sold each year is given below:
Units Produced and Sold
60,000 80,000 100,000
Total costs: Variable costs . . . . . . . . . $150,000 ? ? Fixed costs . . . . . . . . . . . 360,000 ? ?
Total costs . . . . . . . . . . . . . $510,000 ? ?
Cost per unit: Variable cost . . . . . . . . . . ? ? ? Fixed cost . . . . . . . . . . . . ? ? ?
Total cost per unit . . . . . . . . ? ? ?
gar11005_ch02_024-082.indd 55gar11005_ch02_024-082.indd 55 02/11/10 4:31 PM02/11/10 4:31 PM

Confi rming Pages
56 Chapter 2
Required: 1. Complete the schedule of the company’s total and unit costs.
2. Assume that the company produces and sells 90,000 units during the year at the selling price
of $7.50 per unit. Prepare a contribution format income statement for the year.
EXERCISE 2–9 Cost Classification [LO1, LO2, LO3, LO7] Several years ago Medex Company purchased a small building adjacent to its manufacturing plant
in order to have room for expansion when needed. Since the company had no immediate need for
the extra space, the building was rented out to another company for rental revenue of $40,000 per
year. The renter’s lease will expire next month, and rather than renewing the lease, Medex Com-
pany has decided to use the building itself to manufacture a new product.
Direct materials cost for the new product will total $40 per unit. It will be necessary to hire
a supervisor to oversee production. Her salary will be $2,500 per month. Workers will be hired
to manufacture the new product, with direct labor cost amounting to $18 per unit. Manufacturing
operations will occupy all of the building space, so it will be necessary to rent space in a warehouse
nearby in order to store finished units of product. The rental cost will be $1,000 per month. In addi-
tion, the company will need to rent equipment for use in producing the new product; the rental cost
will be $3,000 per month. The company will continue to depreciate the building on a straight-line
basis, as in past years. Depreciation on the building is $10,000 per year.
Advertising costs for the new product will total $50,000 per year. Costs of shipping the new
product to customers will be $10 per unit. Electrical costs of operating machines will be $2 per unit.
To have funds to purchase materials, meet payrolls, and so forth, the company will have to liqui-
date some temporary investments. These investments are presently yielding a return of $6,000 per year.
Required: Prepare an answer sheet with the following column headings:
Product Cost
Direct Direct Manufacturing
Materials Labor Overhead
Name
of the
Cost
Variable
Cost
Fixed
Cost
Period (Selling and
Administrative) Cost
Opportunity
Cost
Sunk
Cost
List the different costs associated with the new product decision down the extreme left col-
umn (under Name of the Cost). Then place an X under each heading that helps to describe the type
of cost involved. There may be X’s under several column headings for a single cost. (For example,
a cost may be a fixed cost, a period cost, and a sunk cost; you would place an X under each of these
column headings opposite the cost.)
EXERCISE 2–10 High-Low Method; Scattergraph Analysis [LO4] Zerbel Company, a wholesaler of large, custom-built air conditioning units for commercial buildings,
has noticed considerable fluctuation in its shipping expense from month to month, as shown below:
Month
Units
Shipped
Total Shipping
Expense
January . . . . . . . . . . 4 $2,200February . . . . . . . . . 7 $3,100March . . . . . . . . . . . . 5 $2,600April . . . . . . . . . . . . 2 $1,500May . . . . . . . . . . . . . 3 $2,200June . . . . . . . . . . . . . 6 $3,000July . . . . . . . . . . . . . . 8 $3,600
Required: 1. Prepare a scattergraph using the data given above. Plot cost on the vertical axis and activity
on the horizontal axis. Is there an approximately linear relationship between shipping expense
and the number of units shipped?
gar11005_ch02_024-082.indd 56gar11005_ch02_024-082.indd 56 02/11/10 4:31 PM02/11/10 4:31 PM
Confi rming Pages
Managerial Accounting and Cost Concepts 57
2. Using the high-low method, estimate the cost formula for shipping expense. Draw a straight
line through the high and low data points shown in the scattergraph that you prepared in
requirement 1. Make sure your line intersects the Y axis.
3. Comment on the accuracy of your high-low estimates assuming a least-squares regression
analysis estimated the total fixed costs to be $1,010.71 per month and the variable cost to be
$317.86 per unit. How would the straight line that you drew in requirement 2 differ from a
straight line that minimizes the sum of the squared errors?
4. What factors, other than the number of units shipped, are likely to affect the company’s ship-
ping expense? Explain.
EXERCISE 2–11 Traditional and Contribution Format Income Statements [LO5] Haaki Shop, Inc., is a large retailer of surfboards. The company assembled the information shown
below for the quarter ended May 31:
Amount
Total sales revenue . . . . . . . . . . . . . . . . . . . . . . . . . . . $800,000Selling price per surfboard . . . . . . . . . . . . . . . . . . . . . . . $400Variable selling expense per surfboard . . . . . . . . . . . . $50Variable administrative expense per surfboard . . . . . . $20Total fi xed selling expense . . . . . . . . . . . . . . . . . . . . . . $150,000Total fi xed administrative expense . . . . . . . . . . . . . . . . $120,000Merchandise inventory, beginning balance . . . . . . . . . $80,000Merchandise inventory, ending balance . . . . . . . . . . . . $100,000Merchandise purchases . . . . . . . . . . . . . . . . . . . . . . . . $320,000
Required: 1. Prepare a traditional income statement for the quarter ended May 31.
2. Prepare a contribution format income statement for the quarter ended May 31.
3. What was the contribution toward fixed expenses and profits for each surfboard sold during
the quarter? (State this figure in a single dollar amount per surfboard.)
EXERCISE 2–12 Cost Behavior; High-Low Method [LO3, LO4] Speedy Parcel Service operates a fleet of delivery trucks in a large metropolitan area. A careful
study by the company’s cost analyst has determined that if a truck is driven 120,000 miles during a
year, the average operating cost is 11.6 cents per mile. If a truck is driven only 80,000 miles during
a year, the average operating cost increases to 13.6 cents per mile.
Required: 1. Using the high-low method, estimate the variable and fixed cost elements of the annual cost of
truck operation.
2. Express the variable and fixed costs in the form Y = a + bX. 3. If a truck were driven 100,000 miles during a year, what total cost would you expect to be
incurred?
EXERCISE 2–13 High-Low Method; Predicting Cost [LO3, LO4] The number of X-rays taken and X-ray costs over the last nine months in Beverly Hospital are
given below:
Month X-Rays Taken X-Ray Costs
January . . . . . . . . . . . 6,250 $28,000February . . . . . . . . . . . 7,000 $29,000March . . . . . . . . . . . . . . 5,000 $23,000April . . . . . . . . . . . . . . 4,250 $20,000May . . . . . . . . . . . . . . . 4,500 $22,000June . . . . . . . . . . . . . . 3,000 $17,000July . . . . . . . . . . . . . . . . 3,750 $18,000August . . . . . . . . . . . . 5,500 $24,000September . . . . . . . . . 5,750 $26,000
gar11005_ch02_024-082.indd 57gar11005_ch02_024-082.indd 57 02/11/10 4:32 PM02/11/10 4:32 PM
Confi rming Pages
58 Chapter 2
Required: 1. Using the high-low method, estimate the cost formula for X-ray costs.
2. Using the cost formula you derived above, what X-ray costs would you expect to be incurred
during a month in which 4,600 X-rays are taken?
3. Prepare a scattergraph using the data given above. Plot X-ray costs on the vertical axis and
the number of X-rays taken on the horizontal axis. Draw a straight line through the two data
points that correspond to the high and low levels of activity. Make sure your line intersects
the Y -axis.
4. Comment on the accuracy of your high-low estimates assuming a least-squares regression
analysis estimated the total fixed costs to be $6,529.41 per month and the variable cost to be
$3.29 per X-ray taken. How would the straight line that you drew in requirement 3 differ from
a straight line that minimizes the sum of the squared errors?
5. Using the least-squares regression estimates given in requirement 4, what X-ray costs would
you expect to be incurred during a month in which 4,600 X-rays are taken?
Problems
All applicable problems are available with McGraw-Hill’s Connect™ Accounting .
PROBLEM 2–14 Contribution Format versus Traditional Income Statement [LO5] House of Organs, Inc., purchases organs from a well-known manufacturer and sells them at the
retail level. The organs sell, on the average, for $2,500 each. The average cost of an organ from the
manufacturer is $1,500. The costs that the company incurs in a typical month are presented below:
Costs Cost Formula
Selling: Advertising . . . . . . . . . . . . . . . . . . . . . . . $950 per month Delivery of organs . . . . . . . . . . . . . . . $60 per organ sold Sales salaries and commissions . . . . . . $4,800 per month, plus 4% of sales Utilities . . . . . . . . . . . . . . . . . . . . . . . . . . $650 per month Depreciation of sales facilities . . . . . . . . $5,000 per monthAdministrative: Executive salaries . . . . . . . . . . . . . . . $13,500 per month Depreciation of office equipment . . . . . . $900 per month Clerical . . . . . . . . . . . . . . . . . . . . . . . . . . $2,500 per month, plus $40 per organ sold Insurance . . . . . . . . . . . . . . . . . . . . . . . . $700 per month
During November, the company sold and delivered 60 organs.
Required: 1. Prepare a traditional income statement for November.
2. Prepare a contribution format income statement for November. Show costs and revenues on
both a total and a per unit basis down through contribution margin.
3. Refer to the income statement you prepared in (2) above. Why might it be misleading to show
the fixed costs on a per unit basis?
PROBLEM 2–15 Identifying Cost Behavior Patterns [LO3] A number of graphs displaying cost behavior patterns are shown on the next page. The vertical axis
on each graph represents total cost and the horizontal axis represents the level of activity (volume).
Required: 1. For each of the following situations, identify the graph that illustrates the cost behavior pat-
tern involved. Any graph may be used more than once.
a. Electricity bill—a flat fixed charge, plus a variable cost after a certain number of kilowatt-
hours are used.
gar11005_ch02_024-082.indd 58gar11005_ch02_024-082.indd 58 02/11/10 4:32 PM02/11/10 4:32 PM

Rev.Confi rming Pages
Managerial Accounting and Cost Concepts 59
c. Depreciation of equipment, where the amount is computed by the straight-line method.
When the depreciation rate was established, it was anticipated that the obsolescence fac-
tor would be greater than the wear and tear factor.
d. Rent on a factory building donated by the city, where the agreement calls for a fixed fee
payment unless 200,000 labor-hours or more are worked, in which case no rent need be
paid.
e. Cost of raw materials, where the cost starts at $7.50 per unit and then decreases by
5 cents per unit for each of the first 100 units purchased, after which it remains constant
at $2.50 per unit.
f. Salaries of maintenance workers, where one maintenance worker is needed for every
1,000 hours of machine-hours or less (that is, 0 to 1,000 hours requires one maintenance
worker, 1,001 to 2,000 hours requires two maintenance workers, etc.).
g. Cost of raw material used.
h. Rent on a factory building donated by the county, where the agreement calls for rent of
$100,000 less $1 for each direct labor-hour worked in excess of 200,000 hours, but a
minimum rental payment of $20,000 must be paid.
i. Use of a machine under a lease, where a minimum charge of $1,000 is paid for up to 400
hours of machine time. After 400 hours of machine time, an additional charge of $2 per
hour is paid up to a maximum charge of $2,000 per period.
1 2 3 4
9 10 11 12
5 6 7 8
First 1,000,000 gallons or less . . . . . . $1,000 fl at feeNext 10,000 gallons . . . . . . . . . . . . . . $0.003 per gallon usedNext 10,000 gallons . . . . . . . . . . . . . . $0.006 per gallon usedNext 10,000 gallons . . . . . . . . . . . . . . $0.009 per gallon usedEtc. . . . . . . . . . . . . . . . . . . . . . . . . . . . . . Etc.
b. City water bill, which is computed as follows:
gar11005_ch02_024-082.indd 59gar11005_ch02_024-082.indd 59 11/11/10 11:36 AM11/11/10 11:36 AM
Confi rming Pages
60 Chapter 2
2. How would a knowledge of cost behavior patterns such as those above be of help to a manager
in analyzing the cost structure of his or her company?
(CPA, adapted)
PROBLEM 2–16 Variable and Fixed Costs; Subtleties of Direct and Indirect Costs [LO3, LO6] The Central Area Well-Baby Clinic provides a variety of health services to newborn babies and
their parents. The clinic is organized into a number of departments, one of which is the Immuniza-
tion Center. A number of costs of the clinic and the Immunization Center are listed below.
Example: The cost of polio immunization tablets
a. The salary of the head nurse in the Immunization Center.
b. Costs of incidental supplies consumed in the Immunization Center, such as paper towels.
c. The cost of lighting and heating the Immunization Center.
d. The cost of disposable syringes used in the Immunization Center.
e. The salary of the Central Area Well-Baby Clinic’s information systems manager.
f. The costs of mailing letters soliciting donations to the Central Area Well-Baby Clinic.
g. The wages of nurses who work in the Immunization Center.
h. The cost of medical malpractice insurance for the Central Area Well-Baby Clinic.
i. Depreciation on the fixtures and equipment in the Immunization Center.
Required: For each cost listed above, indicate whether it is a direct or indirect cost of the Immunization
Center, whether it is a direct or indirect cost of immunizing particular patients, and whether it is
variable or fixed with respect to the number of immunizations administered. Use the form shown
below for your answer.
The factory overhead costs above consist of indirect materials, rent, and maintenance. The com-
pany has analyzed these costs at the 60,000 machine-hours level of activity as follows:
Direct or
Indirect Cost of
the Immunization
Center
Direct or
Indirect Cost
of Particular
Patients
Variable or Fixed
with Respect
to the Number
of Immunizations
Administered
Item Description Direct Indirect Direct Indirect Variable Fixed
Example: The cost of polio immunization tablets . . . . . . . . . . . X X X
PROBLEM 2–17 High-Low Method; Predicting Cost [LO3, LO4] Echeverria SA is an Argentinian manufacturing company whose total factory overhead costs fluc-
tuate somewhat from year to year according to the number of machine-hours worked in its produc-
tion facility. These costs (in Argentinian pesos) at high and low levels of activity over recent years
are given below:
Level of Activity
Low High
Machine-hours . . . . . . . . . . . . . . . . 60,000 80,000Total factory overhead costs . . . . . 274,000 pesos 312,000 pesos
Indirect materials (variable) . . . . . . . . . . . 90,000 pesosRent (fi xed) . . . . . . . . . . . . . . . . . . . . . . . 130,000Maintenance (mixed) . . . . . . . . . . . . . . . . 54,000Total factory overhead costs . . . . . . . . . . . 274,000 pesos
gar11005_ch02_024-082.indd 60gar11005_ch02_024-082.indd 60 02/11/10 4:32 PM02/11/10 4:32 PM
Confi rming Pages
Managerial Accounting and Cost Concepts 61
For planning purposes, the company wants to break down the maintenance cost into its variable
and fixed cost elements.
Required: 1. Estimate how much of the factory overhead cost of 312,000 pesos at the high level of activity
consists of maintenance cost. (Hint: To do this, it may be helpful to first determine how much
of the 312,000 pesos cost consists of indirect materials and rent. Think about the behavior of
variable and fixed costs.)
2. Using the high-low method, estimate a cost formula for maintenance.
3. What total overhead costs would you expect the company to incur at an operating level of
65,000 machine-hours?
PROBLEM 2–18 Cost Behavior; High-Low Method; Contribution Format Income Statement [LO3, LO4, LO5] Frankel Ltd. , a British merchandising company, is the exclusive distributor of a product that is
gaining rapid market acceptance. The company’s revenues and expenses (in British pounds) for the
last three months are given below:
Frankel Ltd.
Comparative Income Statements
For the Three Months Ended June 30
April May June
Sales in units . . . . . . . . . . . . . . . . . . . . . . . . . . . . 3,000 3,750 4,500
Sales revenue . . . . . . . . . . . . . . . . . . . . . . . . . . . . £420,000 £525,000 £630,000Cost of goods sold . . . . . . . . . . . . . . . . . . . . . . . . 168,000 210,000 252,000Gross margin . . . . . . . . . . . . . . . . . . . . . . . . . . . . 252,000 315,000 378,000Selling and administrative expenses: Shipping expense . . . . . . . . . . . . . . . . . . . . . . . 44,000 50,000 56,000 Advertising expense . . . . . . . . . . . . . . . . . . . . . 70,000 70,000 70,000 Salaries and commissions . . . . . . . . . . . . . . . . 107,000 125,000 143,000 Insurance expense . . . . . . . . . . . . . . . . . . . . . . 9,000 9,000 9,000 Depreciation expense . . . . . . . . . . . . . . . . . . . . 42,000 42,000 42,000Total selling and administrative expenses . . . . . . 272,000 296,000 320,000Net operating income (loss) . . . . . . . . . . . . . . . . . £ (20,000) £ 19,000 £ 58,000
(Note: Frankel Ltd.’s income statement has been recast in the functional format common in the United States. The British currency is the pound, denoted by £.)
Required: 1. Identify each of the company’s expenses (including cost of goods sold) as either variable,
fixed, or mixed.
2. Using the high-low method, separate each mixed expense into variable and fixed elements.
State the cost formula for each mixed expense.
3. Redo the company’s income statement at the 4,500-unit level of activity using the contribution
format.
PROBLEM 2–19 High-Low and Scattergraph Analysis [LO4] Sebolt Wire Company heats copper ingots to very high temperatures by placing the ingots in a
large heat coil. The heated ingots are then run through a shaping machine that shapes the soft ingot
into wire. Due to the long heat-up time, the coil is never turned off. When an ingot is placed in
the coil, the temperature is raised to an even higher level, and then the coil is allowed to drop to
the “waiting” temperature between ingots. Management needs to know the variable cost of power
gar11005_ch02_024-082.indd 61gar11005_ch02_024-082.indd 61 02/11/10 4:32 PM02/11/10 4:32 PM
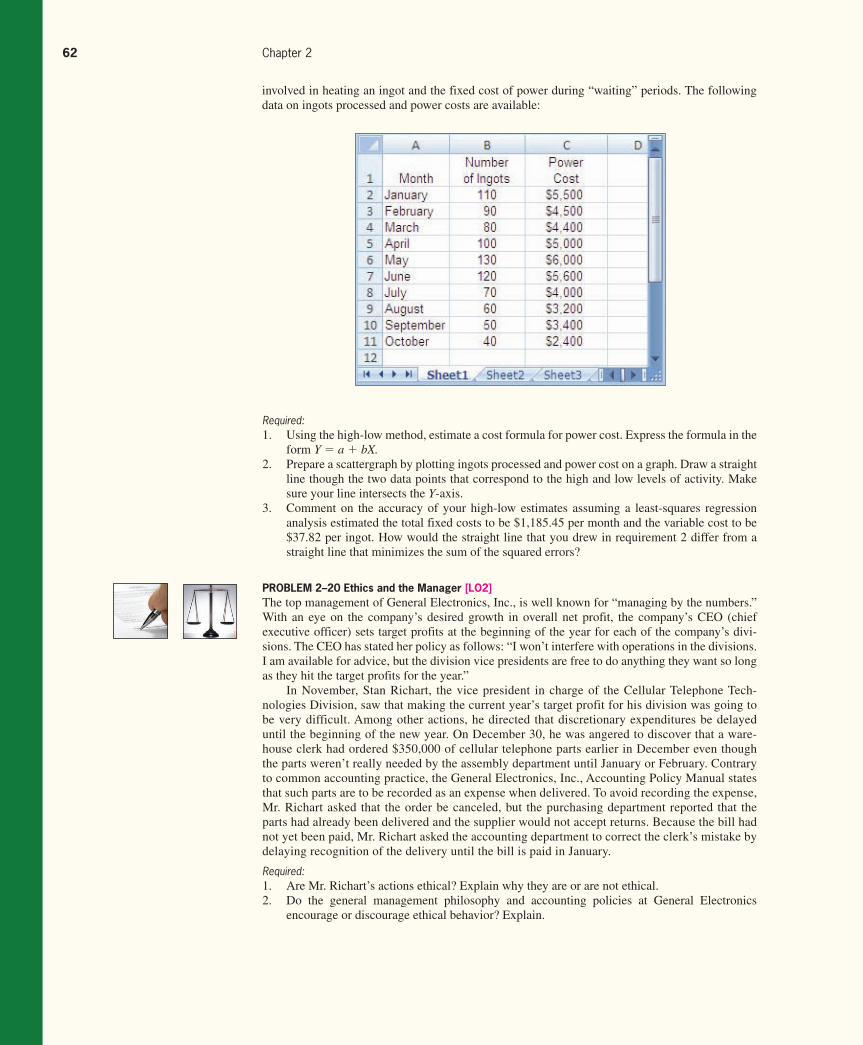
Confi rming Pages
62 Chapter 2
involved in heating an ingot and the fixed cost of power during “waiting” periods. The following
data on ingots processed and power costs are available:
Required: 1. Using the high-low method, estimate a cost formula for power cost. Express the formula in the
form Y = a + bX. 2. Prepare a scattergraph by plotting ingots processed and power cost on a graph. Draw a straight
line though the two data points that correspond to the high and low levels of activity. Make
sure your line intersects the Y -axis.
3. Comment on the accuracy of your high-low estimates assuming a least-squares regression
analysis estimated the total fixed costs to be $1,185.45 per month and the variable cost to be
$37.82 per ingot. How would the straight line that you drew in requirement 2 differ from a
straight line that minimizes the sum of the squared errors?
PROBLEM 2–20 Ethics and the Manager [LO2] The top management of General Electronics, Inc., is well known for “managing by the numbers.”
With an eye on the company’s desired growth in overall net profit, the company’s CEO (chief
executive officer) sets target profits at the beginning of the year for each of the company’s divi-
sions. The CEO has stated her policy as follows: “I won’t interfere with operations in the divisions.
I am available for advice, but the division vice presidents are free to do anything they want so long
as they hit the target profits for the year.”
In November, Stan Richart, the vice president in charge of the Cellular Telephone Tech-
nologies Division, saw that making the current year’s target profit for his division was going to
be very difficult. Among other actions, he directed that discretionary expenditures be delayed
until the beginning of the new year. On December 30, he was angered to discover that a ware-
house clerk had ordered $350,000 of cellular telephone parts earlier in December even though
the parts weren’t really needed by the assembly department until January or February. Contrary
to common accounting practice, the General Electronics, Inc., Accounting Policy Manual states
that such parts are to be recorded as an expense when delivered. To avoid recording the expense,
Mr. Richart asked that the order be canceled, but the purchasing department reported that the
parts had already been delivered and the supplier would not accept returns. Because the bill had
not yet been paid, Mr. Richart asked the accounting department to correct the clerk’s mistake by
delaying recognition of the delivery until the bill is paid in January.
Required: 1. Are Mr. Richart’s actions ethical? Explain why they are or are not ethical.
2. Do the general management philosophy and accounting policies at General Electronics
encourage or discourage ethical behavior? Explain.
gar11005_ch02_024-082.indd 62gar11005_ch02_024-082.indd 62 02/11/10 4:32 PM02/11/10 4:32 PM
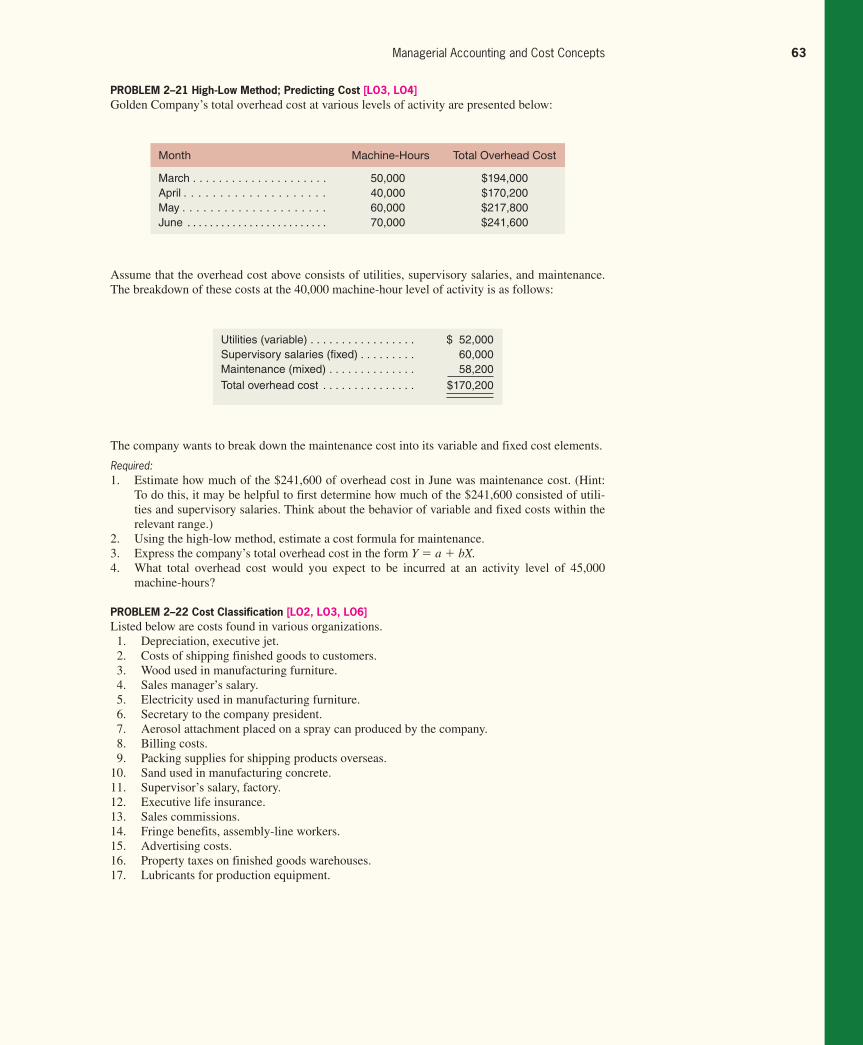
Confi rming Pages
Managerial Accounting and Cost Concepts 63
PROBLEM 2–21 High-Low Method; Predicting Cost [LO3, LO4] Golden Company’s total overhead cost at various levels of activity are presented below:
Month Machine-Hours Total Overhead Cost
March . . . . . . . . . . . . . . . . . . . . . 50,000 $194,000April . . . . . . . . . . . . . . . . . . . . 40,000 $170,200May . . . . . . . . . . . . . . . . . . . . . 60,000 $217,800June . . . . . . . . . . . . . . . . . . . . . . . . . 70,000 $241,600
Assume that the overhead cost above consists of utilities, supervisory salaries, and maintenance.
The breakdown of these costs at the 40,000 machine-hour level of activity is as follows:
Utilities (variable) . . . . . . . . . . . . . . . . . $ 52,000Supervisory salaries (fi xed) . . . . . . . . . 60,000Maintenance (mixed) . . . . . . . . . . . . . . 58,200Total overhead cost . . . . . . . . . . . . . . . $170,200
The company wants to break down the maintenance cost into its variable and fixed cost elements.
Required: 1. Estimate how much of the $241,600 of overhead cost in June was maintenance cost. (Hint:
To do this, it may be helpful to first determine how much of the $241,600 consisted of utili-
ties and supervisory salaries. Think about the behavior of variable and fixed costs within the
relevant range.)
2. Using the high-low method, estimate a cost formula for maintenance.
3. Express the company’s total overhead cost in the form Y = a + bX. 4. What total overhead cost would you expect to be incurred at an activity level of 45,000
machine-hours?
PROBLEM 2–22 Cost Classification [LO2, LO3, LO6] Listed below are costs found in various organizations.
1. Depreciation, executive jet.
2. Costs of shipping finished goods to customers.
3. Wood used in manufacturing furniture.
4. Sales manager’s salary.
5. Electricity used in manufacturing furniture.
6. Secretary to the company president.
7. Aerosol attachment placed on a spray can produced by the company.
8. Billing costs.
9. Packing supplies for shipping products overseas.
10. Sand used in manufacturing concrete.
11. Supervisor’s salary, factory.
12. Executive life insurance.
13. Sales commissions.
14. Fringe benefits, assembly-line workers.
15. Advertising costs.
16. Property taxes on finished goods warehouses.
17. Lubricants for production equipment.
gar11005_ch02_024-082.indd 63gar11005_ch02_024-082.indd 63 02/11/10 4:33 PM02/11/10 4:33 PM
Confi rming Pages
64 Chapter 2
PROBLEM 2–23 High-Low Method; Contribution Format Income Statement [LO4, LO5] Alden Company has decided to use a contribution format income statement for internal planning
purposes. The company has analyzed its expenses and has developed the following cost formulas:
Manufacturing
(Product) Cost
Direct IndirectCost Item
Variable
or Fixed
Selling
Cost
Administrative
Cost
Direct labor . . . . . . . . . . . . . . . . V XExecutive salaries . . . . . . . . . . . F XFactory rent . . . . . . . . . . . . . . . . . F X
Cost Cost Formula
Cost of goods sold . . . . . . . . . . . . . . . . $20 per unit soldAdvertising expense . . . . . . . . . . . . . . . $170,000 per quarterSales commissions . . . . . . . . . . . . . . . . 5% of salesAdministrative salaries . . . . . . . . . . . . . $80,000 per quarterShipping expense . . . . . . . . . . . . . . . . . ?Depreciation expense . . . . . . . . . . . . . . $50,000 per quarter
Management has concluded that shipping expense is a mixed cost, containing both variable
and fixed cost elements. Units sold and the related shipping expense over the last eight quarters
are given below:
Quarter Units Sold Shipping Expense
Year 1: First . . . . . . . . . . . . . . . . . 16,000 $160,000 Second . . . . . . . . . . . . . 18,000 $175,000 Third . . . . . . . . . . . . . . . 23,000 $217,000 Fourth . . . . . . . . . . . . . . 19,000 $180,000Year 2: First . . . . . . . . . . . . . . . . . 17,000 $170,000 Second . . . . . . . . . . . . . 20,000 $185,000 Third . . . . . . . . . . . . . . . 25,000 $232,000 Fourth . . . . . . . . . . . . . . 22,000 $208,000
Management would like a cost formula derived for shipping expense so that a budgeted con-
tribution format income statement can be prepared for the next quarter.
Required: 1. Using the high-low method, estimate a cost formula for shipping expense.
2. In the first quarter of Year 3, the company plans to sell 21,000 units at a selling price of $50
per unit. Prepare a contribution format income statement for the quarter.
PROBLEM 2–24 Cost Classification and Cost Behavior [LO2, LO3, LO6] Heritage Company manufactures a beautiful bookcase that enjoys widespread popularity. The
company has a backlog of orders that is large enough to keep production going indefinitely at the
plant’s full capacity of 4,000 bookcases per year. Annual cost data at full capacity follow:
Required: Prepare an answer sheet with column headings as shown below. For each cost item, indicate
whether it would be variable or fixed with respect to the number of units produced and sold; and
then whether it would be a selling cost, an administrative cost, or a manufacturing cost. If it is a
manufacturing cost, indicate whether it would typically be treated as a direct or indirect cost with
respect to units of product. Three sample answers are provided for illustration.
gar11005_ch02_024-082.indd 64gar11005_ch02_024-082.indd 64 02/11/10 4:33 PM02/11/10 4:33 PM

Confi rming Pages
Managerial Accounting and Cost Concepts 65
Required: 1. Prepare an answer sheet with the column headings shown below. Enter each cost item on your
answer sheet, placing the dollar amount under the appropriate headings. As examples, this has
been done already for the first two items in the list above. Note that each cost item is classified
in two ways: first, as either variable or fixed with respect to the number of units produced and
sold; and second, as either a selling and administrative cost or a product cost. (If the item is a
product cost, it should also be classified as either direct or indirect as shown.)
Direct materials used (wood and glass) . . . . . . . . . . . $430,000Administrative office salaries . . . . . . . . . . . . . . . . . . . $110,000Factory supervision . . . . . . . . . . . . . . . . . . . . . . . . . . $70,000Sales commissions . . . . . . . . . . . . . . . . . . . . . . . . . . $60,000Depreciation, factory building . . . . . . . . . . . . . . . . . . . $105,000Depreciation, administrative office equipment . . . . . . $2,000Indirect materials, factory . . . . . . . . . . . . . . . . . . . . . . $18,000Factory labor (cutting and assembly) . . . . . . . . . . . . . $90,000Advertising . . . . . . . . . . . . . . . . . . . . . . . . . . . . . . . . . $100,000Insurance, factory . . . . . . . . . . . . . . . . . . . . . . . . . . . . $6,000Administrative office supplies (billing) . . . . . . . . . . . . $4,000Property taxes, factory . . . . . . . . . . . . . . . . . . . . . . . . $20,000Utilities, factory . . . . . . . . . . . . . . . . . . . . . . . . . . . . . . $45,000
Cost BehaviorSelling or
Administrative
Cost
Product Cost
Cost Item Variable Fixed Direct Indirect*
Materials used . . . . . . . . . $430,000 $430,000Administrative office salaries . . . . . . . . . . . . . $110,000 $110,000*To units of product.
2. Total the dollar amounts in each of the columns in (1) above. Compute the average product
cost per bookcase.
3. Due to a recession, assume that production drops to only 2,000 bookcases per year. Would
you expect the average product cost per bookcase to increase, decrease, or remain unchanged?
Explain. No computations are necessary.
4. Refer to the original data. The president’s next-door neighbor has considered making himself
a bookcase and has priced the necessary materials at a building supply store. He has asked the
president whether he could purchase a bookcase from the Heritage Company “at cost,” and the
president has agreed to let him do so.
a. Would you expect any disagreement between the two men over the price the neighbor
should pay? Explain. What price does the president probably have in mind? The neighbor?
b. Because the company is operating at full capacity, what cost term used in the chapter
might be justification for the president to charge the full, regular price to the neighbor and
still be selling “at cost”? Explain.
Cases
All applicable cases are available with McGraw-Hill’s Connect™ Accounting .
CASE 2–25 Scattergraph Analysis; Selection of an Activity Base [LO4] Mapleleaf Sweepers of Toronto manufactures replacement rotary sweeper brooms for the large
sweeper trucks that clear leaves and snow from city streets. The business is seasonal, with the largest
demand during and just preceding the fall and winter months. Because there are so many different
kinds of sweeper brooms used by its customers, Mapleleaf Sweepers makes all of its brooms to order.
gar11005_ch02_024-082.indd 65gar11005_ch02_024-082.indd 65 02/11/10 4:33 PM02/11/10 4:33 PM
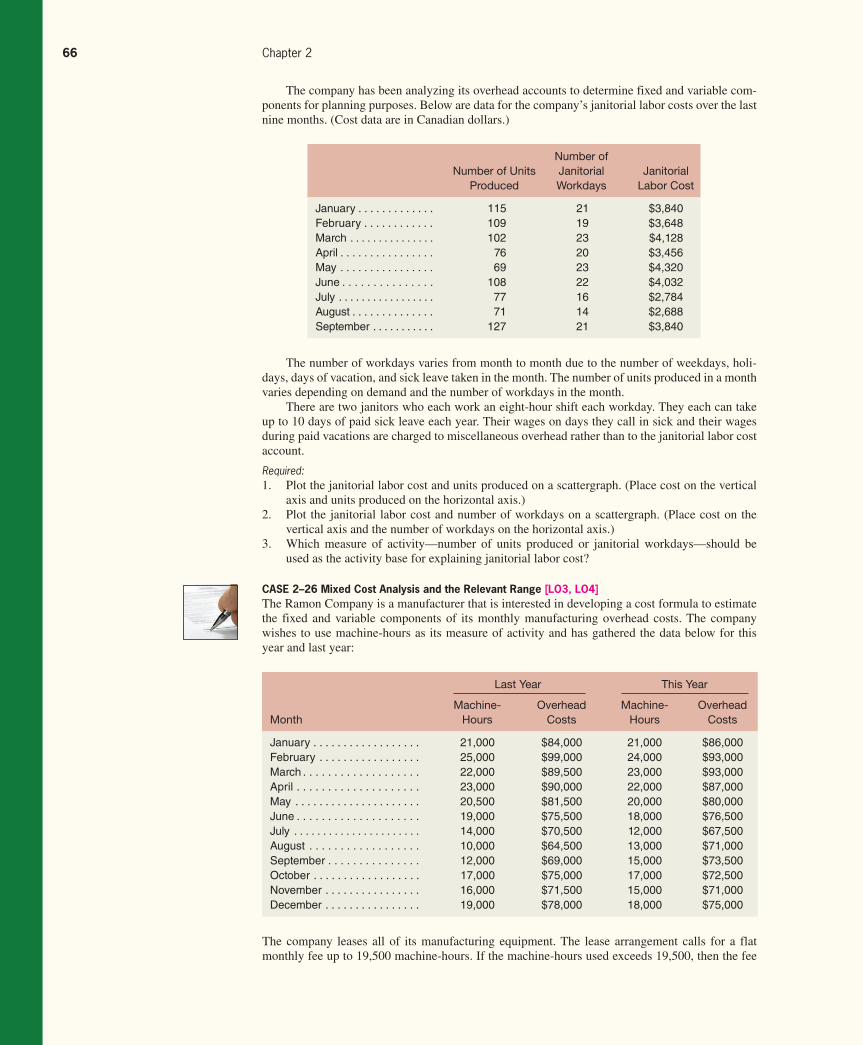
Confi rming Pages
66 Chapter 2
Number of Units
Produced
Number of
Janitorial
Workdays
Janitorial
Labor Cost
January . . . . . . . . . . . . . 115 21 $3,840February . . . . . . . . . . . . 109 19 $3,648March . . . . . . . . . . . . . . . 102 23 $4,128April . . . . . . . . . . . . . . . . 76 20 $3,456May . . . . . . . . . . . . . . . . 69 23 $4,320June . . . . . . . . . . . . . . . 108 22 $4,032July . . . . . . . . . . . . . . . . . 77 16 $2,784August . . . . . . . . . . . . . . 71 14 $2,688September . . . . . . . . . . . 127 21 $3,840
The number of workdays varies from month to month due to the number of weekdays, holi-
days, days of vacation, and sick leave taken in the month. The number of units produced in a month
varies depending on demand and the number of workdays in the month.
There are two janitors who each work an eight-hour shift each workday. They each can take
up to 10 days of paid sick leave each year. Their wages on days they call in sick and their wages
during paid vacations are charged to miscellaneous overhead rather than to the janitorial labor cost
account.
Required: 1. Plot the janitorial labor cost and units produced on a scattergraph. (Place cost on the vertical
axis and units produced on the horizontal axis.)
2. Plot the janitorial labor cost and number of workdays on a scattergraph. (Place cost on the
vertical axis and the number of workdays on the horizontal axis.)
3. Which measure of activity—number of units produced or janitorial workdays—should be
used as the activity base for explaining janitorial labor cost?
CASE 2–26 Mixed Cost Analysis and the Relevant Range [LO3, LO4] The Ramon Company is a manufacturer that is interested in developing a cost formula to estimate
the fixed and variable components of its monthly manufacturing overhead costs. The company
wishes to use machine-hours as its measure of activity and has gathered the data below for this
year and last year:
Last Year This Year
Month
Machine-
Hours
Overhead
Costs
Machine-
Hours
Overhead
Costs
January . . . . . . . . . . . . . . . . . . 21,000 $84,000 21,000 $86,000February . . . . . . . . . . . . . . . . . 25,000 $99,000 24,000 $93,000March . . . . . . . . . . . . . . . . . . . 22,000 $89,500 23,000 $93,000April . . . . . . . . . . . . . . . . . . . . 23,000 $90,000 22,000 $87,000May . . . . . . . . . . . . . . . . . . . . . 20,500 $81,500 20,000 $80,000June . . . . . . . . . . . . . . . . . . . . 19,000 $75,500 18,000 $76,500July . . . . . . . . . . . . . . . . . . . . . . 14,000 $70,500 12,000 $67,500August . . . . . . . . . . . . . . . . . . 10,000 $64,500 13,000 $71,000September . . . . . . . . . . . . . . . 12,000 $69,000 15,000 $73,500October . . . . . . . . . . . . . . . . . . 17,000 $75,000 17,000 $72,500November . . . . . . . . . . . . . . . . 16,000 $71,500 15,000 $71,000December . . . . . . . . . . . . . . . . 19,000 $78,000 18,000 $75,000
The company has been analyzing its overhead accounts to determine fixed and variable com-
ponents for planning purposes. Below are data for the company’s janitorial labor costs over the last
nine months. (Cost data are in Canadian dollars.)
The company leases all of its manufacturing equipment. The lease arrangement calls for a flat
monthly fee up to 19,500 machine-hours. If the machine-hours used exceeds 19,500, then the fee
gar11005_ch02_024-082.indd 66gar11005_ch02_024-082.indd 66 02/11/10 4:33 PM02/11/10 4:33 PM
Rev.Confi rming Pages
Managerial Accounting and Cost Concepts 67
becomes strictly variable with respect to the total number of machine-hours consumed during the
month. Lease expense is a major element of overhead cost.
Required: 1. Using the high-low method, estimate a manufacturing overhead cost formula.
2. Prepare a scattergraph using all of the data for the two-year period. Fit a straight line or lines
to the plotted points using a ruler. Describe the cost behavior pattern revealed by your scat-
tergraph plot.
3. Assume a least-squares regression analysis using all of the given data points estimated the
total fixed costs to be $40,102 and the variable costs to be $2.13 per machine-hour. Do you
have any concerns about the accuracy of the high-low estimates that you have computed or the
least-squares regression estimates that have been provided?
4. Assume that the company consumes 22,500 machine-hours during a month. Using the high-
low method, estimate the total overhead cost that would be incurred at this level of activity. Be
sure to consider only the data points contained in the relevant range of activity when perform-
ing your computations.
5. Comment on the accuracy of your high-low estimates assuming a least-squares regression
analysis using only the data points in the relevant range of activity estimated the total fixed
costs to be $10,090 and the variable costs to be $3.53 per machine-hour.
Appendix 2A: Least-Squares Regression Computations
The least-squares regression method for estimating a linear relationship is based on the
equation for a straight line:
Y = a + bX
As explained in the chapter, least-squares regression selects the values for the intercept
a and the slope b that minimize the sum of the squared errors. The following formulas,
which are derived in statistics and calculus texts, accomplish that objective:
b = n(ΣXY) − (ΣX)(ΣY)
______________ n( ΣX 2 ) − (ΣX) 2
a = (ΣY) − b(ΣX)
____________ n
where:
X = The level of activity (independent variable)
Y = The total mixed cost (dependent variable)
a = The total fixed cost (the vertical intercept of the line)
b = The variable cost per unit of activity (the slope of the line)
n = Number of observations
∑ = Sum across all n observations
Manually performing the calculations required by the formulas is tedious at best.
Fortunately, statistical software packages are widely available that perform the calcula-
tions automatically. Spreadsheet software, such as Microsoft ® Excel, can also be used to
do least-squares regression—although it requires a little more work than using a special-
ized statistical application.
In addition to estimates of the intercept (fixed cost) and slope (variable cost per unit),
Excel also provides a statistic called the R 2 , which is a measure of “goodness of fit.” The
R 2 tells us the percentage of the variation in the dependent variable (cost) that is explained
by variation in the independent variable (activity). The R 2 varies from 0% to 100%, and
the higher the percentage, the better. You should always plot the data in a scattergraph,
LEARNING OBJECTIVE 8 Analyze a mixed cost using a scattergraph plot and the least-squares regression method.
gar11005_ch02_024-082.indd 67gar11005_ch02_024-082.indd 67 11/11/10 11:37 AM11/11/10 11:37 AM

Confi rming Pages
68 Chapter 2
but it is particularly important to check the data visually when the R 2 is low. A quick look
at the scattergraph can reveal that there is little relation between the cost and the activity
or that the relation is something other than a simple straight line. In such cases, additional
analysis would be required.
To illustrate how Excel can be used to calculate the intercept a, the slope b, and the
R 2 , we will use the Brentline Hospital data for maintenance costs on page 35. The work-
sheet in Exhibit 2A–1 contains the data and the calculations.
As you can see, the X values (the independent variable) have been entered in cells B4
through B10. The Y values (the dependent variable) have been entered in cells C4 through
C10. The slope, intercept, and R 2 are computed using the Excel functions INTERCEPT,
SLOPE, and RSQ. You must specify the range of cells for the Y values and for the X
values.
In Exhibit 2A–1 , cell B12 contains the formula = INTERCEPT(C4:C10,B4:B10); cell
B13 contains the formula = SLOPE(C4:C10,B4:B10); and cell B14 contains the formula
= RSQ(C4:C10,B4:B10).
According to the calculations carried out by Excel, the fixed maintenance cost (the
intercept) is $3,431 per month and the variable cost (the slope) is $0.759 per patient-day.
Therefore, the cost formula for maintenance cost is:
Y = a + bX
Y = $3,431 + $0.759X
Note that the R 2 (i.e., RSQ) is 0.90, which is quite good and indicates that 90% of the
variation in maintenance costs is explained by the variation in patient-days.
Plotting the data is easy in Excel. Select the range of values that you would like
to plot—in this case, cells B4:C10. Then select the Chart Wizard tool on the toolbar
and make the appropriate choices in the various dialogue boxes that appear. When you
are finished, you should have a scattergraph that looks like the plot in Exhibit 2A–2 .
Note that the relation between cost and activity is approximately linear, so it is reason-
able to fit a straight line to the data as we have implicitly done with the least-squares
regression.
E X H I B I T 2 A – 1 The Least-Squares Regression Worksheet for Brentline Hospital
gar11005_ch02_024-082.indd 68gar11005_ch02_024-082.indd 68 02/11/10 4:33 PM02/11/10 4:33 PM
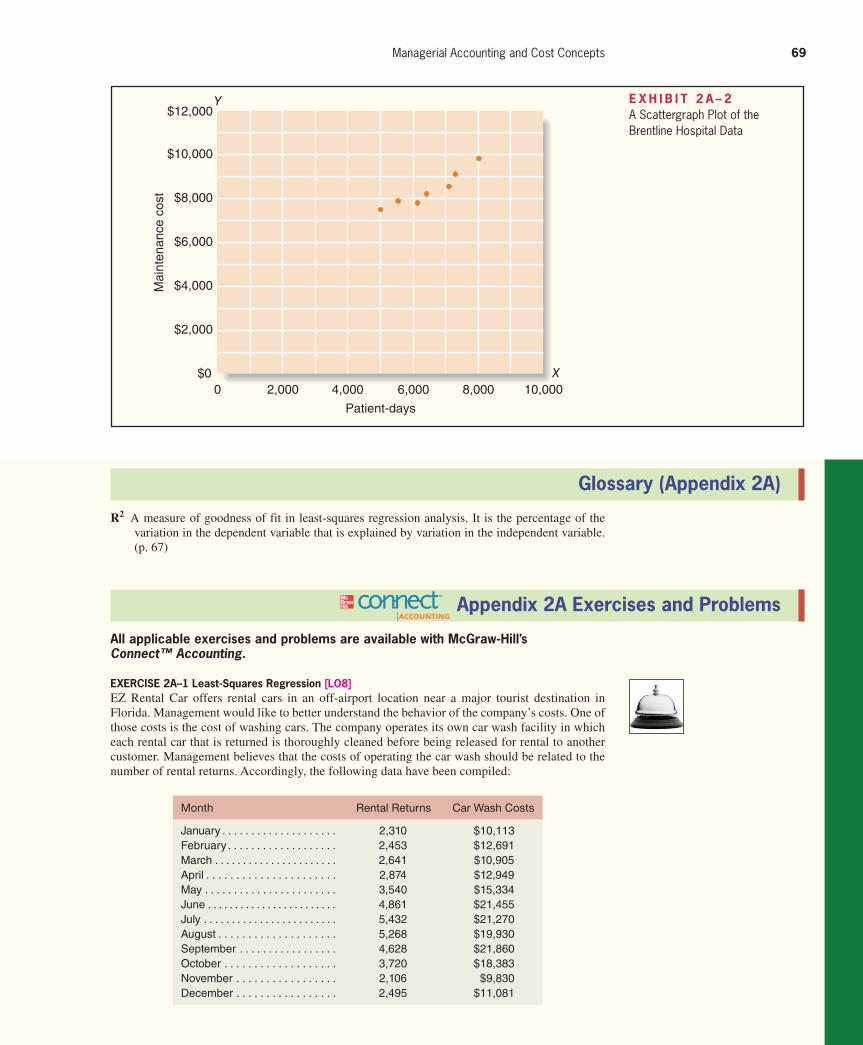
Confi rming Pages
Managerial Accounting and Cost Concepts 69
R 2 A measure of goodness of fit in least-squares regression analysis. It is the percentage of the
variation in the dependent variable that is explained by variation in the independent variable.
(p. 67)
Glossary (Appendix 2A)
E X H I B I T 2 A – 2 A Scattergraph Plot of the Brentline Hospital Data
$12,000
$10,000
$8,000
$6,000
$4,000
$2,000
$0
Mai
nten
ance
cos
t
0 2,000 4,000 6,000 8,000 10,000
Patient-days
Y
X
Appendix 2A Exercises and Problems
All applicable exercises and problems are available with McGraw-Hill’s Connect™ Accounting.
EXERCISE 2A–1 Least-Squares Regression [LO8] EZ Rental Car offers rental cars in an off-airport location near a major tourist destination in
Florida. Management would like to better understand the behavior of the company’s costs. One of
those costs is the cost of washing cars. The company operates its own car wash facility in which
each rental car that is returned is thoroughly cleaned before being released for rental to another
customer. Management believes that the costs of operating the car wash should be related to the
number of rental returns. Accordingly, the following data have been compiled:
Month Rental Returns Car Wash Costs
January . . . . . . . . . . . . . . . . . . . . 2,310 $10,113February . . . . . . . . . . . . . . . . . . . 2,453 $12,691March . . . . . . . . . . . . . . . . . . . . . . 2,641 $10,905April . . . . . . . . . . . . . . . . . . . . . . 2,874 $12,949May . . . . . . . . . . . . . . . . . . . . . . . 3,540 $15,334June . . . . . . . . . . . . . . . . . . . . . . . . 4,861 $21,455July . . . . . . . . . . . . . . . . . . . . . . . . 5,432 $21,270August . . . . . . . . . . . . . . . . . . . . 5,268 $19,930September . . . . . . . . . . . . . . . . . 4,628 $21,860October . . . . . . . . . . . . . . . . . . . 3,720 $18,383November . . . . . . . . . . . . . . . . . 2,106 $9,830December . . . . . . . . . . . . . . . . . 2,495 $11,081
gar11005_ch02_024-082.indd 69gar11005_ch02_024-082.indd 69 02/11/10 4:33 PM02/11/10 4:33 PM
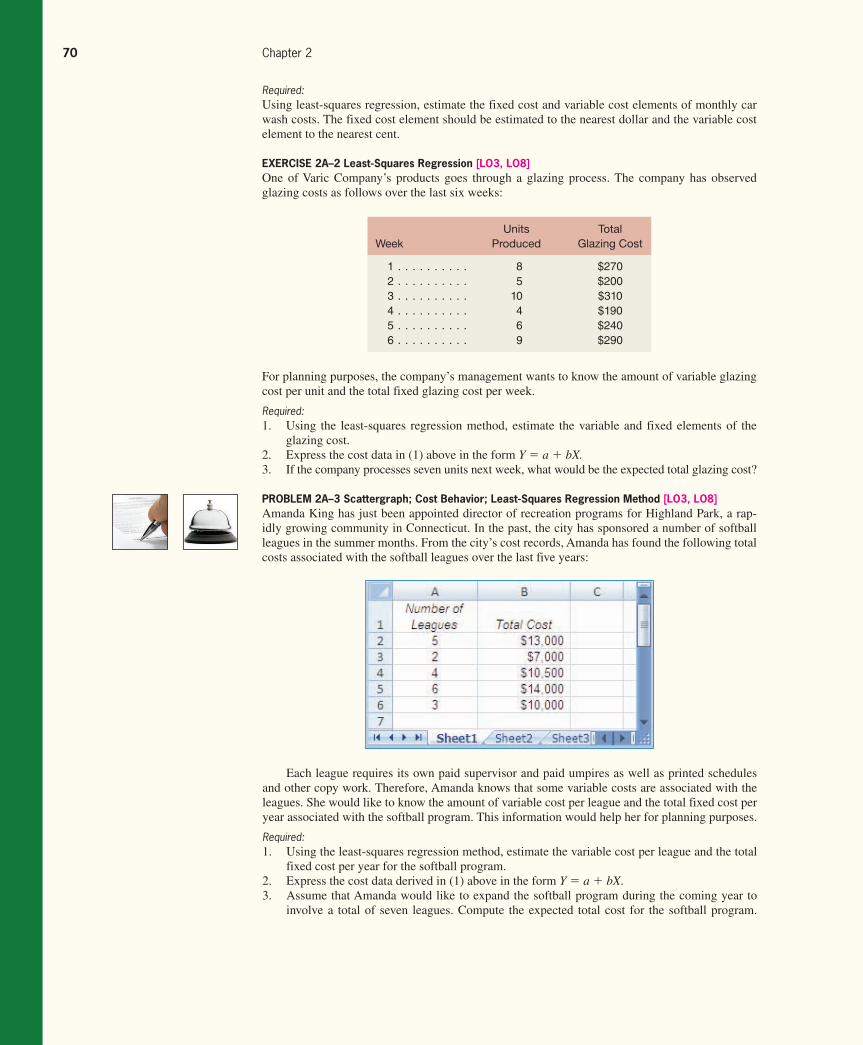
Confi rming Pages
70 Chapter 2
Required: Using least-squares regression, estimate the fixed cost and variable cost elements of monthly car
wash costs. The fixed cost element should be estimated to the nearest dollar and the variable cost
element to the nearest cent.
EXERCISE 2A–2 Least-Squares Regression [LO3, LO8] One of Varic Company’s products goes through a glazing process. The company has observed
glazing costs as follows over the last six weeks:
Week
Units
Produced
Total
Glazing Cost
1 . . . . . . . . . . 8 $2702 . . . . . . . . . . 5 $2003 . . . . . . . . . . 10 $3104 . . . . . . . . . . 4 $1905 . . . . . . . . . . 6 $2406 . . . . . . . . . . 9 $290
For planning purposes, the company’s management wants to know the amount of variable glazing
cost per unit and the total fixed glazing cost per week.
Required: 1. Using the least-squares regression method, estimate the variable and fixed elements of the
glazing cost.
2. Express the cost data in (1) above in the form Y = a + bX. 3. If the company processes seven units next week, what would be the expected total glazing cost?
PROBLEM 2A–3 Scattergraph; Cost Behavior; Least-Squares Regression Method [LO3, LO8] Amanda King has just been appointed director of recreation programs for Highland Park, a rap-
idly growing community in Connecticut. In the past, the city has sponsored a number of softball
leagues in the summer months. From the city’s cost records, Amanda has found the following total
costs associated with the softball leagues over the last five years:
Each league requires its own paid supervisor and paid umpires as well as printed schedules
and other copy work. Therefore, Amanda knows that some variable costs are associated with the
leagues. She would like to know the amount of variable cost per league and the total fixed cost per
year associated with the softball program. This information would help her for planning purposes.
Required: 1. Using the least-squares regression method, estimate the variable cost per league and the total
fixed cost per year for the softball program.
2. Express the cost data derived in (1) above in the form Y = a + bX.
3. Assume that Amanda would like to expand the softball program during the coming year to
involve a total of seven leagues. Compute the expected total cost for the softball program.
gar11005_ch02_024-082.indd 70gar11005_ch02_024-082.indd 70 02/11/10 4:33 PM02/11/10 4:33 PM
Confi rming Pages
Managerial Accounting and Cost Concepts 71
Can you see any problem with using the cost formula from (2) above to derive this total cost
figure? Explain.
4. Prepare a scattergraph, and fit a line to the plotted points using the cost formula expressed in
(2) above.
PROBLEM 2A–4 Least-Squares Regression; Scattergraph; Comparison of Activity Bases [LO3, LO8] The Hard Rock Mining Company is developing cost formulas for management planning and
decision-making purposes. The company’s cost analyst has concluded that utilities cost is a mixed
cost, and he is attempting to find a base with which the cost might be closely correlated. The con-
troller has suggested that tons mined might be a good base to use in developing a cost formula.
The production superintendent disagrees; she thinks that direct labor-hours would be a better
base. The cost analyst has decided to try both bases and has assembled the following information:
Quarter
Tons
Mined
Direct
Labor-Hours
Utilities
Cost
Year 1: First . . . . . . . . . . . . . . . . . . . 15,000 5,000 $50,000 Second . . . . . . . . . . . . . . . . 11,000 3,000 $45,000 Third . . . . . . . . . . . . . . . . . 21,000 4,000 $60,000 Fourth . . . . . . . . . . . . . . . . . 12,000 6,000 $75,000Year 2: First . . . . . . . . . . . . . . . . . . . 18,000 10,000 $100,000 Second . . . . . . . . . . . . . . . . 25,000 9,000 $105,000 Third . . . . . . . . . . . . . . . . . 30,000 8,000 $85,000 Fourth . . . . . . . . . . . . . . . . 28,000 11,000 $120,000
Required: 1. Using tons mined as the independent ( X ) variable:
a. Determine a cost formula for utilities cost using the least-squares regression method.
b. Prepare a scattergraph and plot the tons mined and utilities cost. (Place cost on the verti-
cal axis and tons mined on the horizontal axis.) Fit a straight line to the plotted points
using the cost formula determined in ( a ) above.
2. Using direct labor-hours as the independent ( X ) variable, repeat the computations in ( a ) and
( b ) above.
3. Would you recommend that the company use tons mined or direct labor-hours as a base for
planning utilities cost?
CASE 2A–5 Analysis of Mixed Costs in a Pricing Decision [LO3, LO8] Jasmine Lee owns a catering company that serves food and beverages at exclusive parties and busi-
ness functions. Lee’s business is seasonal, with a heavy schedule during the summer months and
holidays and a lighter schedule at other times.
One of the major events that Lee’s customers request is a cocktail party. She offers a standard
cocktail party and has estimated the cost per guest for this party as follows:
Food and beverages . . . . . . . . . . . . . . . . . . . . . . . . . . . $17.00Labor (0.5 hour @ $10.00 per hour) . . . . . . . . . . . . . . . 5.00Overhead (0.5 hour @ $18.63 per hour) . . . . . . . . . . . . 9.32
Total cost per guest . . . . . . . . . . . . . . . . . . . . . . . . . . . . $31.32
This standard cocktail party lasts three hours and Lee hires one worker for every six guests,
which is one-half hour of labor per guest. These workers are hired only as needed and are paid only
for the hours they actually work.
Lee ordinarily charges $45 per guest. She is confident about her estimates of the costs of food
and beverages and labor, but is not as comfortable with the estimate of overhead cost. The $18.63
gar11005_ch02_024-082.indd 71gar11005_ch02_024-082.indd 71 02/11/10 4:33 PM02/11/10 4:33 PM

Rev.Confi rming Pages
72 Chapter 2
overhead cost per labor-hour was determined by dividing total overhead expenses for the last
12 months by total labor-hours for the same period. Monthly data concerning overhead costs and
labor-hours appear below:
Month
Labor
Hours
Overhead
Expenses
January . . . . . . . . . . . . . . . . 1,500 $ 44,000February . . . . . . . . . . . . . . . 1,680 47,200March . . . . . . . . . . . . . . . . . 1,800 48,000April . . . . . . . . . . . . . . . . . . . 2,520 51,200May . . . . . . . . . . . . . . . . . . . 2,700 53,600June . . . . . . . . . . . . . . . . . . 3,300 56,800July . . . . . . . . . . . . . . . . . . 3,900 59,200August . . . . . . . . . . . . . . . . . 4,500 61,600September . . . . . . . . . . . . . 4,200 60,000October . . . . . . . . . . . . . . . . 2,700 54,400November . . . . . . . . . . . . . . 1,860 49,600December . . . . . . . . . . . . . . 3,900 58,400Total . . . . . . . . . . . . . . . . . . 34,560 $644,000
Lee has received a request to bid on a 120-guest fund-raising cocktail party to be given next
month by an important local charity. (The party would last the usual three hours.) She would like to
win this contract because the guest list for this charity event includes many prominent individuals
that she would like to land as future clients. Lee is confident that these potential customers would
be favorably impressed by her company’s services at the charity event.
Required: 1. Prepare a scattergraph plot that puts labor-hours on the X-axis and overhead expenses on the
Y-axis. What insights are revealed by your scattergraph?
2. Use the least-squares regression method to estimate the fixed and variable components of over-
head expenses.
3. Estimate the contribution to profit of a standard 120-guest cocktail party if Lee charges her
usual price of $45 per guest. (In other words, by how much would her overall profit increase?)
4. How low could Lee bid for the charity event, in terms of a price per guest, and still not lose
money on the event itself?
5. The individual who is organizing the charity’s fund-raising event has indicated that he has
already received a bid under $42 from another catering company. Do you think Lee should bid
below her normal $45 per guest price for the charity event? Why or why not?
(CMA, adapted)
Appendix 2B: Cost of Quality
A company may have a product with a high-quality design that uses high-quality com-
ponents, but if the product is poorly assembled or has other defects, the company will
have high warranty repair costs and dissatisfied customers. People who are dissatisfied
with a product are unlikely to buy the product again. They often tell others about their
bad experiences. This is the worst possible sort of advertising. To prevent such problems,
companies expend a great deal of effort to reduce defects. The objective is to have high
quality of conformance.
Quality of Conformance
A product that meets or exceeds its design specifications and is free of defects that mar
its appearance or degrade its performance is said to have high quality of conformance . Note that if an economy car is free of defects, it can have a quality of conformance
gar11005_ch02_024-082.indd 72gar11005_ch02_024-082.indd 72 11/11/10 11:38 AM11/11/10 11:38 AM
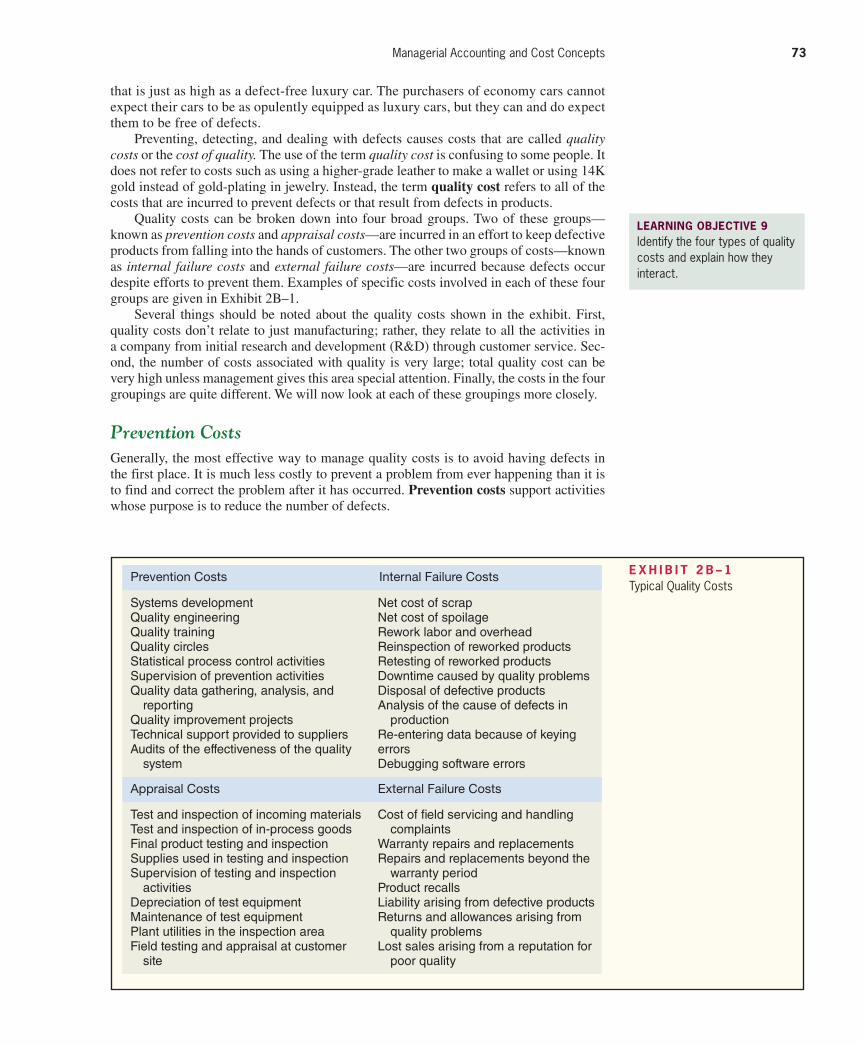
Confi rming Pages
Managerial Accounting and Cost Concepts 73
that is just as high as a defect-free luxury car. The purchasers of economy cars cannot
expect their cars to be as opulently equipped as luxury cars, but they can and do expect
them to be free of defects.
Preventing, detecting, and dealing with defects causes costs that are called quality costs or the cost of quality. The use of the term quality cost is confusing to some people. It
does not refer to costs such as using a higher-grade leather to make a wallet or using 14K
gold instead of gold-plating in jewelry. Instead, the term quality cost refers to all of the
costs that are incurred to prevent defects or that result from defects in products.
Quality costs can be broken down into four broad groups. Two of these groups—
known as prevention costs and appraisal costs —are incurred in an effort to keep defective
products from falling into the hands of customers. The other two groups of costs—known
as internal failure costs and external failure costs —are incurred because defects occur
despite efforts to prevent them. Examples of specific costs involved in each of these four
groups are given in Exhibit 2B–1 .
Several things should be noted about the quality costs shown in the exhibit. First,
quality costs don’t relate to just manufacturing; rather, they relate to all the activities in
a company from initial research and development (R&D) through customer service. Sec-
ond, the number of costs associated with quality is very large; total quality cost can be
very high unless management gives this area special attention. Finally, the costs in the four
groupings are quite different. We will now look at each of these groupings more closely.
Prevention Costs
Generally, the most effective way to manage quality costs is to avoid having defects in
the first place. It is much less costly to prevent a problem from ever happening than it is
to find and correct the problem after it has occurred. Prevention costs support activities
whose purpose is to reduce the number of defects.
Systems developmentQuality engineeringQuality trainingQuality circlesStatistical process control activitiesSupervision of prevention activitiesQuality data gathering, analysis, and reportingQuality improvement projectsTechnical support provided to suppliersAudits of the effectiveness of the quality system
Net cost of scrapNet cost of spoilageRework labor and overheadReinspection of reworked productsRetesting of reworked productsDowntime caused by quality problemsDisposal of defective productsAnalysis of the cause of defects in productionRe-entering data because of keying errorsDebugging software errors
Prevention Costs Internal Failure Costs
Appraisal Costs External Failure Costs
Test and inspection of incoming materialsTest and inspection of in-process goodsFinal product testing and inspectionSupplies used in testing and inspectionSupervision of testing and inspection activitiesDepreciation of test equipmentMaintenance of test equipmentPlant utilities in the inspection areaField testing and appraisal at customer site
Cost of fi eld servicing and handling complaintsWarranty repairs and replacementsRepairs and replacements beyond the warranty periodProduct recallsLiability arising from defective productsReturns and allowances arising from quality problemsLost sales arising from a reputation for poor quality
E X H I B I T 2 B – 1 Typical Quality Costs
LEARNING OBJECTIVE 9 Identify the four types of quality costs and explain how they interact.
gar11005_ch02_024-082.indd 73gar11005_ch02_024-082.indd 73 02/11/10 4:34 PM02/11/10 4:34 PM

Confi rming Pages
74 Chapter 2
Note from Exhibit 2B–1 that prevention costs include activities relating to quality
circles and statistical process control. Quality circles consist of small groups of employ-
ees that meet on a regular basis to discuss ways to improve quality. Both management and
workers are included in these circles. Quality circles are widely used and can be found
in manufacturing companies, utilities, health care organizations, banks, and many other
organizations.
Statistical process control is a technique that is used to detect whether a process
is in or out of control. An out-of-control process results in defective units and may be
caused by a miscalibrated machine or some other factor. In statistical process control,
workers use charts to monitor the quality of units that pass through their workstations.
With these charts, workers can quickly spot processes that are out of control and that are
creating defects. Problems can be immediately corrected and further defects prevented
rather than waiting for an inspector to catch the defects later.
Note also from the list of prevention costs in Exhibit 2B–1 that some companies
provide technical support to their suppliers as a way of preventing defects. Particularly
in just-in-time (JIT) systems, such support to suppliers is vital. In a JIT system, parts
are delivered from suppliers just in time and in just the correct quantity to fill customer
orders. There are no parts stockpiles. If a defective part is received from a supplier, the
part cannot be used and the order for the ultimate customer cannot be filled on time.
Hence, every part received from a supplier must be free of defects. Consequently, com-
panies that use JIT often require that their suppliers use sophisticated quality control
programs such as statistical process control and that their suppliers certify that they will
deliver parts and materials that are free of defects.
Appraisal Costs
Any defective parts and products should be caught as early as possible in the production
process. Appraisal costs , which are sometimes called inspection costs, are incurred to
identify defective products before the products are shipped to customers. Unfortunately,
performing appraisal activities doesn’t keep defects from happening again, and most
managers now realize that maintaining an army of inspectors is a costly (and ineffec-
tive) approach to quality control. Therefore, employees are increasingly being asked to be
responsible for their own quality control. This approach, along with designing products to
be easy to manufacture properly, allows quality to be built into products rather than relying
on inspection to get the defects out.
Internal Failure Costs
Failure costs are incurred when a product fails to conform to its design specifications.
Failure costs can be either internal or external. Internal failure costs result from iden-
tifying defects before they are shipped to customers. These costs include scrap, rejected
products, reworking of defective units, and downtime caused by quality problems. In
some companies, as little as 10% of the company’s products make it through the produc-
tion process without rework of some kind. Of course, the more effective a company’s
appraisal activities, the greater the chance of catching defects internally and the greater
the level of internal failure costs. This is the price that is paid to avoid incurring external
failure costs, which can be devastating.
External Failure Costs
External failure costs result when a defective product is delivered to a customer. As
shown in Exhibit 2B–1 , external failure costs include warranty repairs and replacements,
product recalls, liability arising from legal action against a company, and lost sales aris-
ing from a reputation for poor quality. Such costs can decimate profits.
gar11005_ch02_024-082.indd 74gar11005_ch02_024-082.indd 74 02/11/10 4:34 PM02/11/10 4:34 PM
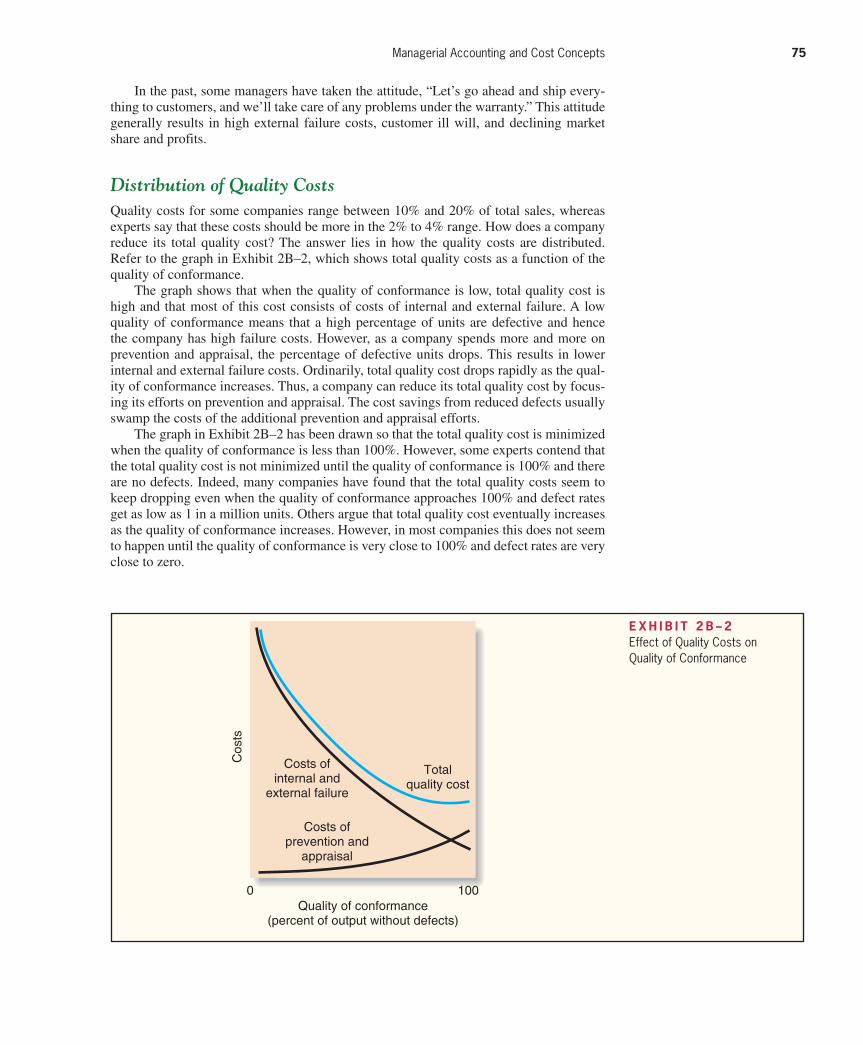
Confi rming Pages
Managerial Accounting and Cost Concepts 75
In the past, some managers have taken the attitude, “Let’s go ahead and ship every-
thing to customers, and we’ll take care of any problems under the warranty.” This attitude
generally results in high external failure costs, customer ill will, and declining market
share and profits.
Distribution of Quality Costs
Quality costs for some companies range between 10% and 20% of total sales, whereas
experts say that these costs should be more in the 2% to 4% range. How does a company
reduce its total quality cost? The answer lies in how the quality costs are distributed.
Refer to the graph in Exhibit 2B–2 , which shows total quality costs as a function of the
quality of conformance.
The graph shows that when the quality of conformance is low, total quality cost is
high and that most of this cost consists of costs of internal and external failure. A low
quality of conformance means that a high percentage of units are defective and hence
the company has high failure costs. However, as a company spends more and more on
prevention and appraisal, the percentage of defective units drops. This results in lower
internal and external failure costs. Ordinarily, total quality cost drops rapidly as the qual-
ity of conformance increases. Thus, a company can reduce its total quality cost by focus-
ing its efforts on prevention and appraisal. The cost savings from reduced defects usually
swamp the costs of the additional prevention and appraisal efforts.
The graph in Exhibit 2B–2 has been drawn so that the total quality cost is minimized
when the quality of conformance is less than 100%. However, some experts contend that
the total quality cost is not minimized until the quality of conformance is 100% and there
are no defects. Indeed, many companies have found that the total quality costs seem to
keep dropping even when the quality of conformance approaches 100% and defect rates
get as low as 1 in a million units. Others argue that total quality cost eventually increases
as the quality of conformance increases. However, in most companies this does not seem
to happen until the quality of conformance is very close to 100% and defect rates are very
close to zero.
E X H I B I T 2 B – 2 Effect of Quality Costs on Quality of Conformance
Cos
ts
0 100
Costs ofprevention and
appraisal
Quality of conformance(percent of output without defects)
Totalquality cost
Costs ofinternal and
external failure
gar11005_ch02_024-082.indd 75gar11005_ch02_024-082.indd 75 02/11/10 4:34 PM02/11/10 4:34 PM
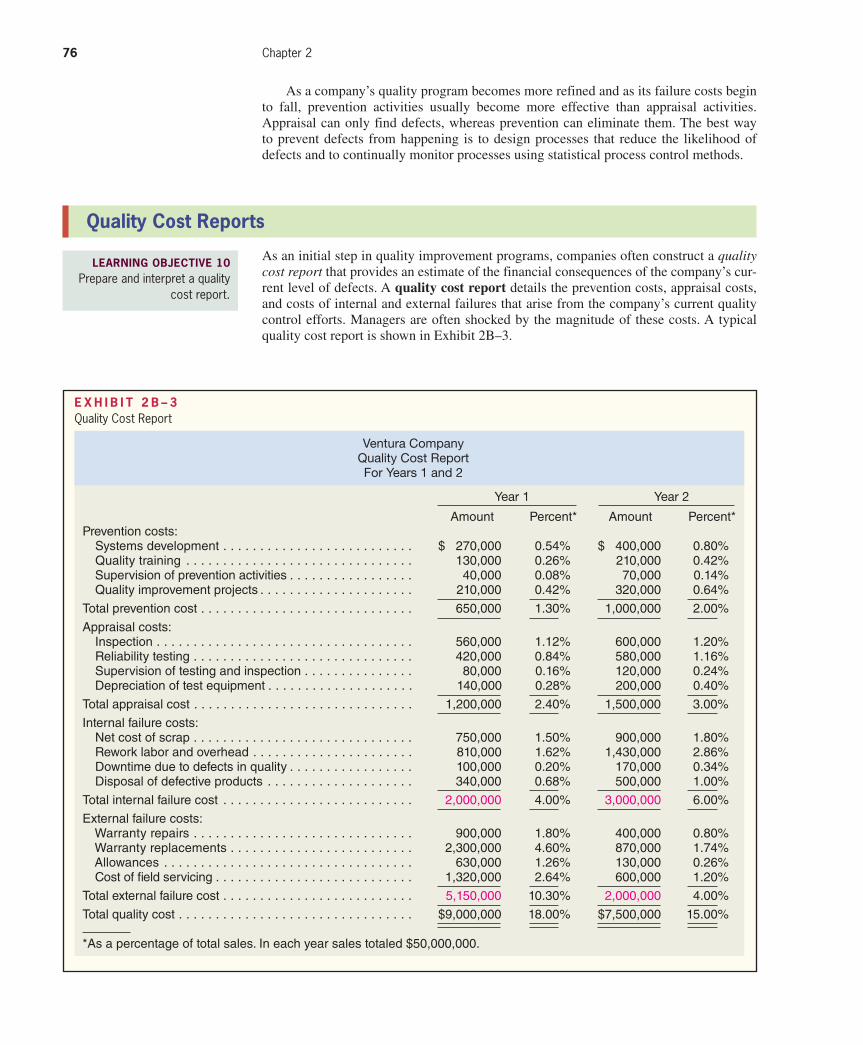
Confi rming Pages
76 Chapter 2
As a company’s quality program becomes more refined and as its failure costs begin
to fall, prevention activities usually become more effective than appraisal activities.
Appraisal can only find defects, whereas prevention can eliminate them. The best way
to prevent defects from happening is to design processes that reduce the likelihood of
defects and to continually monitor processes using statistical process control methods.
Quality Cost Reports
LEARNING OBJECTIVE 10 Prepare and interpret a quality
cost report.
As an initial step in quality improvement programs, companies often construct a quality cost report that provides an estimate of the financial consequences of the company’s cur-
rent level of defects. A quality cost report details the prevention costs, appraisal costs,
and costs of internal and external failures that arise from the company’s current quality
control efforts. Managers are often shocked by the magnitude of these costs. A typical
quality cost report is shown in Exhibit 2B–3 .
E X H I B I T 2 B – 3 Quality Cost Report
Ventura CompanyQuality Cost ReportFor Years 1 and 2
Year 1 Year 2
Amount Percent* Amount Percent*Prevention costs: Systems development . . . . . . . . . . . . . . . . . . . . . . . . . . $ 270,000 0.54% $ 400,000 0.80% Quality training . . . . . . . . . . . . . . . . . . . . . . . . . . . . . . . 130,000 0.26% 210,000 0.42% Supervision of prevention activities . . . . . . . . . . . . . . . . . 40,000 0.08% 70,000 0.14% Quality improvement projects . . . . . . . . . . . . . . . . . . . . . 210,000 0.42% 320,000 0.64%
Total prevention cost . . . . . . . . . . . . . . . . . . . . . . . . . . . . . 650,000 1.30% 1,000,000 2.00%
Appraisal costs: Inspection . . . . . . . . . . . . . . . . . . . . . . . . . . . . . . . . . . . 560,000 1.12% 600,000 1.20% Reliability testing . . . . . . . . . . . . . . . . . . . . . . . . . . . . . . 420,000 0.84% 580,000 1.16% Supervision of testing and inspection . . . . . . . . . . . . . . . 80,000 0.16% 120,000 0.24% Depreciation of test equipment . . . . . . . . . . . . . . . . . . . . 140,000 0.28% 200,000 0.40%
Total appraisal cost . . . . . . . . . . . . . . . . . . . . . . . . . . . . . . 1,200,000 2.40% 1,500,000 3.00%
Internal failure costs: Net cost of scrap . . . . . . . . . . . . . . . . . . . . . . . . . . . . . . 750,000 1.50% 900,000 1.80% Rework labor and overhead . . . . . . . . . . . . . . . . . . . . . . 810,000 1.62% 1,430,000 2.86% Downtime due to defects in quality . . . . . . . . . . . . . . . . . 100,000 0.20% 170,000 0.34% Disposal of defective products . . . . . . . . . . . . . . . . . . . . 340,000 0.68% 500,000 1.00%
Total internal failure cost . . . . . . . . . . . . . . . . . . . . . . . . . . 2,000,000 4.00% 3,000,000 6.00%
External failure costs: Warranty repairs . . . . . . . . . . . . . . . . . . . . . . . . . . . . . . 900,000 1.80% 400,000 0.80% Warranty replacements . . . . . . . . . . . . . . . . . . . . . . . . . 2,300,000 4.60% 870,000 1.74% Allowances . . . . . . . . . . . . . . . . . . . . . . . . . . . . . . . . . . 630,000 1.26% 130,000 0.26% Cost of fi eld servicing . . . . . . . . . . . . . . . . . . . . . . . . . . . 1,320,000 2.64% 600,000 1.20%
Total external failure cost . . . . . . . . . . . . . . . . . . . . . . . . . . 5,150,000 10.30% 2,000,000 4.00%
Total quality cost . . . . . . . . . . . . . . . . . . . . . . . . . . . . . . . . $9,000,000 18.00% $7,500,000 15.00%
*As a percentage of total sales. In each year sales totaled $50,000,000.
gar11005_ch02_024-082.indd 76gar11005_ch02_024-082.indd 76 02/11/10 4:34 PM02/11/10 4:34 PM
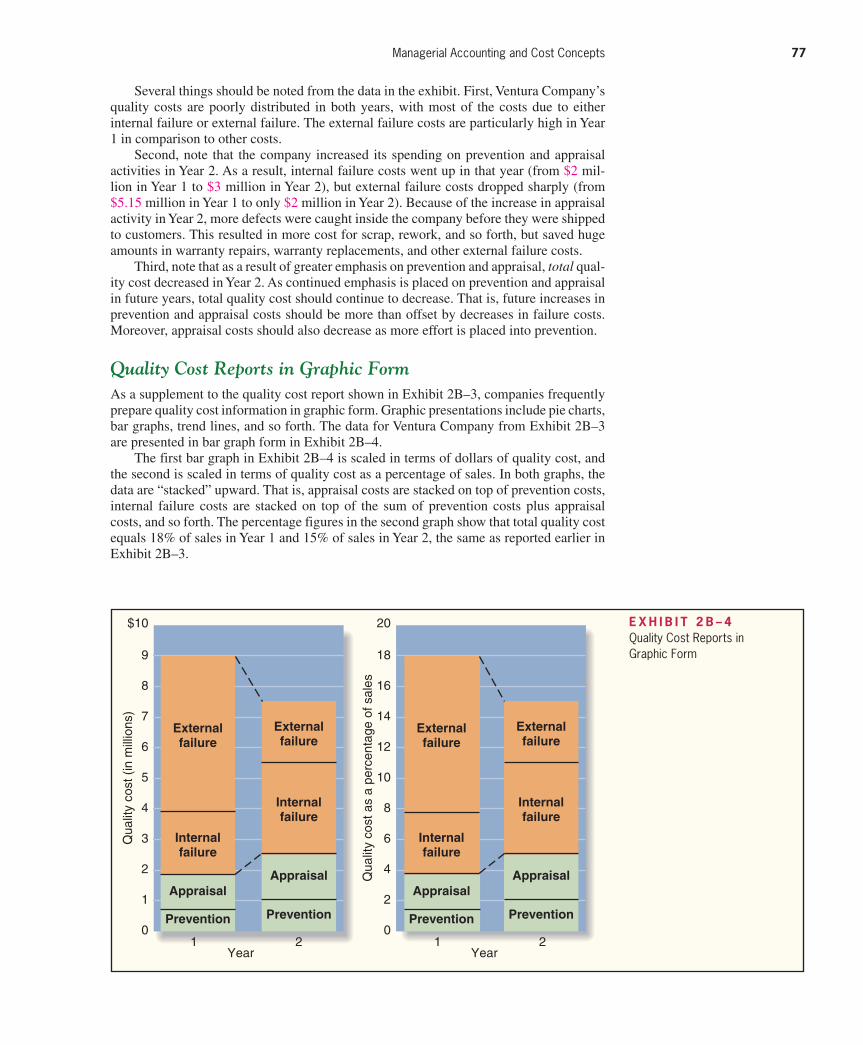
Confi rming Pages
Managerial Accounting and Cost Concepts 77
Several things should be noted from the data in the exhibit. First, Ventura Company’s
quality costs are poorly distributed in both years, with most of the costs due to either
internal failure or external failure. The external failure costs are particularly high in Year
1 in comparison to other costs.
Second, note that the company increased its spending on prevention and appraisal
activities in Year 2. As a result, internal failure costs went up in that year (from $2 mil-
lion in Year 1 to $3 million in Year 2), but external failure costs dropped sharply (from
$5.15 million in Year 1 to only $2 million in Year 2). Because of the increase in appraisal
activity in Year 2, more defects were caught inside the company before they were shipped
to customers. This resulted in more cost for scrap, rework, and so forth, but saved huge
amounts in warranty repairs, warranty replacements, and other external failure costs.
Third, note that as a result of greater emphasis on prevention and appraisal, total qual-
ity cost decreased in Year 2. As continued emphasis is placed on prevention and appraisal
in future years, total quality cost should continue to decrease. That is, future increases in
prevention and appraisal costs should be more than offset by decreases in failure costs.
Moreover, appraisal costs should also decrease as more effort is placed into prevention.
Quality Cost Reports in Graphic Form
As a supplement to the quality cost report shown in Exhibit 2B–3 , companies frequently
prepare quality cost information in graphic form. Graphic presentations include pie charts,
bar graphs, trend lines, and so forth. The data for Ventura Company from Exhibit 2B–3
are presented in bar graph form in Exhibit 2B–4 .
The first bar graph in Exhibit 2B–4 is scaled in terms of dollars of quality cost, and
the second is scaled in terms of quality cost as a percentage of sales. In both graphs, the
data are “stacked” upward. That is, appraisal costs are stacked on top of prevention costs,
internal failure costs are stacked on top of the sum of prevention costs plus appraisal
costs, and so forth. The percentage figures in the second graph show that total quality cost
equals 18% of sales in Year 1 and 15% of sales in Year 2, the same as reported earlier in
Exhibit 2B–3 .
E X H I B I T 2 B – 4 Quality Cost Reports in Graphic Form
$10
9
8
7
6
5
4
3
2
1
0
Qua
lity
cost
(in
mill
ions
)
1 2Year
20
18
16
14
12
10
8
6
4
2
0
Qua
lity
cost
as
a pe
rcen
tage
of s
ales
1 2Year
Externalfailure
Internalfailure
Appraisal
Prevention
Externalfailure
Internalfailure
Appraisal
Prevention
Externalfailure
Internalfailure
Appraisal
Prevention
Externalfailure
Internalfailure
Appraisal
Prevention
gar11005_ch02_024-082.indd 77gar11005_ch02_024-082.indd 77 02/11/10 4:34 PM02/11/10 4:34 PM
Confi rming Pages
78 Chapter 2
Data in graphic form help managers to see trends more clearly and to see the magni-
tude of the various costs in relation to each other. Such graphs are easily prepared using
computer graphics and spreadsheet applications.
Uses of Quality Cost Information
A quality cost report has several uses. First, quality cost information helps managers see
the financial significance of defects. Managers usually are not aware of the magnitude of
their quality costs because these costs cut across departmental lines and are not normally
tracked and accumulated by the cost system. Thus, when first presented with a quality cost
report, managers often are surprised by the amount of cost attributable to poor quality.
Second, quality cost information helps managers identify the relative importance of
the quality problems faced by their companies. For example, the quality cost report may
show that scrap is a major quality problem or that the company is incurring huge warranty
costs. With this information, managers have a better idea of where to focus their efforts.
Third, quality cost information helps managers see whether their quality costs are
poorly distributed. In general, quality costs should be distributed more toward prevention
and appraisal activities and less toward failures.
Counterbalancing these uses, three limitations of quality cost information should
be recognized. First, simply measuring and reporting quality costs does not solve qual-
ity problems. Problems can be solved only by taking action. Second, results usually lag
behind quality improvement programs. Initially, total quality cost may even increase as
quality control systems are designed and installed. Decreases in quality costs may not
begin to occur until the quality program has been in effect for some time. And third, the
most important quality cost, lost sales arising from customer ill will, is usually omitted
from the quality cost report because it is difficult to estimate.
Typically, during the initial years of a quality improvement program, the benefits
of compiling a quality cost report outweigh the costs and limitations of the reports. As
managers gain experience in balancing prevention and appraisal activities, the need for
quality cost reports often diminishes.
International Aspects of Quality
Many of the tools used in quality management today were developed in Japan after World
War II. In statistical process control, Japanese companies borrowed heavily from the
work of W. Edwards Deming. However, Japanese companies are largely responsible for
quality circles, JIT, the idea that quality is everyone’s responsibility, and the emphasis on
prevention rather than on inspection.
In the 1980s, quality reemerged as a pivotal factor in the market. Many companies now
find that it is impossible to effectively compete without a very strong quality program in
place. This is particularly true of companies that wish to compete in the European market.
The ISO 9000 Standards
The International Organization for Standardization (ISO), based in Geneva, Switzerland,
has established quality control guidelines known as the ISO 9000 standards . Many com-
panies and organizations in Europe will buy only from ISO 9000-certified suppliers. This
means that the suppliers must demonstrate to a certifying agency that:
1. A quality control system is in use, and the system clearly defines an expected level of
quality.
2. The system is fully operational and is backed up with detailed documentation of
quality control procedures.
3. The intended level of quality is being achieved on a sustained, consistent basis.
gar11005_ch02_024-082.indd 78gar11005_ch02_024-082.indd 78 02/11/10 4:34 PM02/11/10 4:34 PM
Confi rming Pages
Managerial Accounting and Cost Concepts 79
Defects cause costs, which can be classified into prevention costs, appraisal costs, internal failure
costs, and external failure costs. Prevention costs are incurred to keep defects from happening.
Appraisal costs are incurred to ensure that defective products, once made, are not shipped to cus-
tomers. Internal failure costs are incurred as a consequence of detecting defective products before
they are shipped to customers. External failure costs are the consequences (in terms of repairs, ser-
vicing, and lost future business) of delivering defective products to customers. Most experts agree
that management effort should be focused on preventing defects. Small investments in prevention
can lead to dramatic reductions in appraisal costs and costs of internal and external failure.
Quality costs are summarized on a quality cost report. This report shows the types of quality
costs being incurred and their significance and trends. The report helps managers understand the
importance of quality costs, spot problem areas, and assess the way in which the quality costs are
distributed.
Summary (Appendix 2B)
The key to receiving certification under the ISO 9000 standards is documentation. It’s
one thing for a company to say that it has a quality control system in operation, but it’s
quite a different thing to be able to document the steps in that system. Under ISO 9000,
this documentation must be so detailed and precise that if all the employees in a com-
pany were suddenly replaced, the new employees could use the documentation to make
the product exactly as it was made by the old employees. Even companies with good
quality control systems find that it takes up to two years of painstaking work to develop
this detailed documentation. But companies often find that compiling this documentation
results in improvements in their quality systems.
The ISO 9000 standards have become an international measure of quality. Although
the standards were developed to control the quality of goods sold in European countries,
they have become widely accepted elsewhere as well. Companies in the United States
that export to Europe often expect their own suppliers to comply with ISO 9000 standards
because these exporters must document the quality of the materials going into their prod-
ucts as part of their own ISO 9000 certification.
The ISO program for certification of quality management programs is not limited to
manufacturing companies. The American Institute of Certified Public Accountants was
the first professional membership organization in the United States to win recognition
under an ISO certification program.
Glossary (Appendix 2B)
Appraisal costs Costs that are incurred to identify defective products before the products are
shipped to customers. (p. 74)
External failure costs Costs that are incurred when a product or service that is defective is deliv-
ered to a customer. (p. 74)
Internal failure costs Costs that are incurred as a result of identifying defective products before
they are shipped to customers. (p. 74)
ISO 9000 standards Quality control requirements issued by the International Organization for
Standardization that relate to products sold in European countries. (p. 78)
Prevention costs Costs that are incurred to keep defects from occurring. (p. 73)
Quality circles Small groups of employees that meet on a regular basis to discuss ways of improv-
ing quality. (p. 74)
Quality cost Costs that are incurred to prevent defective products from falling into the hands of
customers or that are incurred as a result of defective units. (p. 73)
Quality cost report A report that details prevention costs, appraisal costs, and the costs of inter-
nal and external failures. (p. 76)
gar11005_ch02_024-082.indd 79gar11005_ch02_024-082.indd 79 02/11/10 4:34 PM02/11/10 4:34 PM
Confi rming Pages
80 Chapter 2
Quality of conformance The degree to which a product or service meets or exceeds its design
specifications and is free of defects or other problems that mar its appearance or degrade its
performance. (p. 72)
Statistical process control A charting technique used to monitor the quality of work being done
in a workstation for the purpose of immediately correcting any problems. (p. 74)
Appendix 2B Exercises and Problems
All applicable exercises and problems are available with McGraw-Hill’s Connect™ Accounting.
EXERCISE 2B–1 Using Quality Management Terms [LO9] Listed below are terms relating to quality management.
Appraisal costs Quality circles
Quality cost report Prevention costs
Quality External failure costs
Internal failure costs Quality of conformance
Choose the term or terms that most appropriately complete the following statements. The terms
can be used more than once. (Note that a blank can hold more than one word.)
1. When a product or service does not conform to customer expectations in terms of features or
performance, it is viewed as being poor in .
2. A product or service will have a low if it does not function the way its
designers intended, or if it has many defects as a result of sloppy manufacture.
3. A company incurs and in an effort to keep poor
quality of conformance from occurring.
4. A company incurs and because poor quality of
conformance has occurred.
5. Of the four groups of costs associated with quality of conformance, are
generally the most damaging to a company.
6. Inspection, testing, and other costs incurred to keep defective products from being shipped to
customers are known as .
7. are incurred in an effort to eliminate poor product design, defective
manufacturing practices, and the providing of substandard service.
8. The costs relating to defects, rejected products, and downtime caused by quality problems
are known as .
9. When a product that is defective in some way is delivered to a customer, then are
incurred.
10. Over time, a company’s total quality costs should decrease if it redistributes its quality costs
by placing its greatest emphasis on and .
11. In many companies, small groups of employees, known as , meet on a
regular basis to discuss ways to improve the quality of output.
12. The way to ensure that management is aware of the costs associated with quality is to sum-
marize such costs on a .
EXERCISE 2B–2 Classification of Quality Costs [LO9] A number of activities that are part of a company’s quality control system are listed below:
a. Repairs of goods still under warranty.
b. Customer returns due to defects.
c. Statistical process control.
d. Disposal of spoiled goods.
e. Maintaining testing equipment.
f. Inspecting finished goods.
g. Downtime caused by quality problems.
h. Debugging errors in software.
i. Recalls of defective products.
j. Training quality engineers.
k. Re-entering data due to typing errors.
l. Inspecting materials received from suppliers.
m. Audits of the quality system.
n. Supervision of testing personnel.
o. Rework labor.
Required: 1. Classify the costs associated with each of these activities into one of the following categories:
prevention cost, appraisal cost, internal failure cost, or external failure cost.
gar11005_ch02_024-082.indd 80gar11005_ch02_024-082.indd 80 02/11/10 4:34 PM02/11/10 4:34 PM

Confi rming Pages
Managerial Accounting and Cost Concepts 81
2. Which of the four types of costs listed in (1) above are incurred to keep poor quality of con-
formance from occurring? Which of the four types of costs are incurred because poor quality
of conformance has occurred?
PROBLEM 2B–3 Quality Cost Report [LO9, LO10] Yedder Enterprises was a pioneer in designing and producing precision surgical lasers. Yedder’s
product was brilliantly designed, but the manufacturing process was neglected by management
with a consequence that quality problems have been chronic. When customers complained about
defective units, Yedder would simply send out a repairperson or replace the defective unit with a
new one. Recently, several competitors came out with similar products without Yedder’s quality
problems, and as a consequence Yedder’s sales have declined.
To rescue the situation, Yedder embarked on an intensive campaign to strengthen its quality
control at the beginning of the current year. These efforts met with some success—the downward
slide in sales was reversed, and sales grew from $95 million last year to $100 million this year. To
help monitor the company’s progress, costs relating to quality and quality control were compiled
for last year and for the first full year of the quality campaign this year. The costs, which do not
include the lost sales due to a reputation for poor quality, appear below:
Costs (in thousands)
Last Year This Year
Product recalls . . . . . . . . . . . . . . . . . . . . . . . $3,500 $600Systems development . . . . . . . . . . . . . . . . . $120 $680Inspection . . . . . . . . . . . . . . . . . . . . . . . . . . $1,700 $2,770Net cost of scrap . . . . . . . . . . . . . . . . . . . . . $800 $1,300Supplies used in testing . . . . . . . . . . . . . . . . $30 $40Warranty repairs . . . . . . . . . . . . . . . . . . . . . $3,300 $2,800Rework labor . . . . . . . . . . . . . . . . . . . . . . . . $1,400 $1,600Statistical process control . . . . . . . . . . . . . . $0 $270Customer returns of defective goods . . . . . . $3,200 $200Cost of testing equipment . . . . . . . . . . . . . . $270 $390Quality engineering . . . . . . . . . . . . . . . . . . . $1,080 $1,650Downtime due to quality problems . . . . . . . . $600 $1,100
Required: 1. Prepare a quality cost report for both this year and last year. Carry percentage computations to
two decimal places.
2. Prepare a bar graph showing the distribution of the various quality costs by category.
3. Prepare a written evaluation to accompany the reports you have prepared in (1) and (2) above.
This evaluation should discuss the distribution of quality costs in the company, changes in
the distribution over the last year, and any other information you believe would be useful to
management.
PROBLEM 2B–4 Analyzing a Quality Cost Report [LO10] Bergen, Inc. , produces telephone equipment at its Georgia plant. In recent years, the company’s
market share has been eroded by stiff competition from Asian and European competitors. Price and
product quality are the two key areas in which companies compete in this market.
Two years ago, Jerry Holman, Bergen’s president, decided to devote more resources to
improving product quality after learning that his company’s products had been ranked fourth in
quality in a survey of telephone equipment users. He believed that Bergen could no longer afford
to ignore the importance of product quality. Holman set up a task force that he headed to imple-
ment a formal quality improvement program. Included on this task force were representatives from
engineering, sales, customer service, production, and accounting. This broad representation was
needed because Holman believed that this was a companywide program, and that all employees
should share the responsibility for its success.
After the first meeting of the task force, Sheila Haynes, manager of sales, asked Tony Reese,
production manager, what he thought of the proposed program. Reese replied, “I have reservations.
Quality is too abstract to be attaching costs to it and then to be holding you and me responsible for
cost improvements. I like to work with goals that I can see and count! I’m nervous about having
my annual bonus based on a decrease in quality costs; there are too many variables that we have
no control over.”
gar11005_ch02_024-082.indd 81gar11005_ch02_024-082.indd 81 02/11/10 4:34 PM02/11/10 4:34 PM
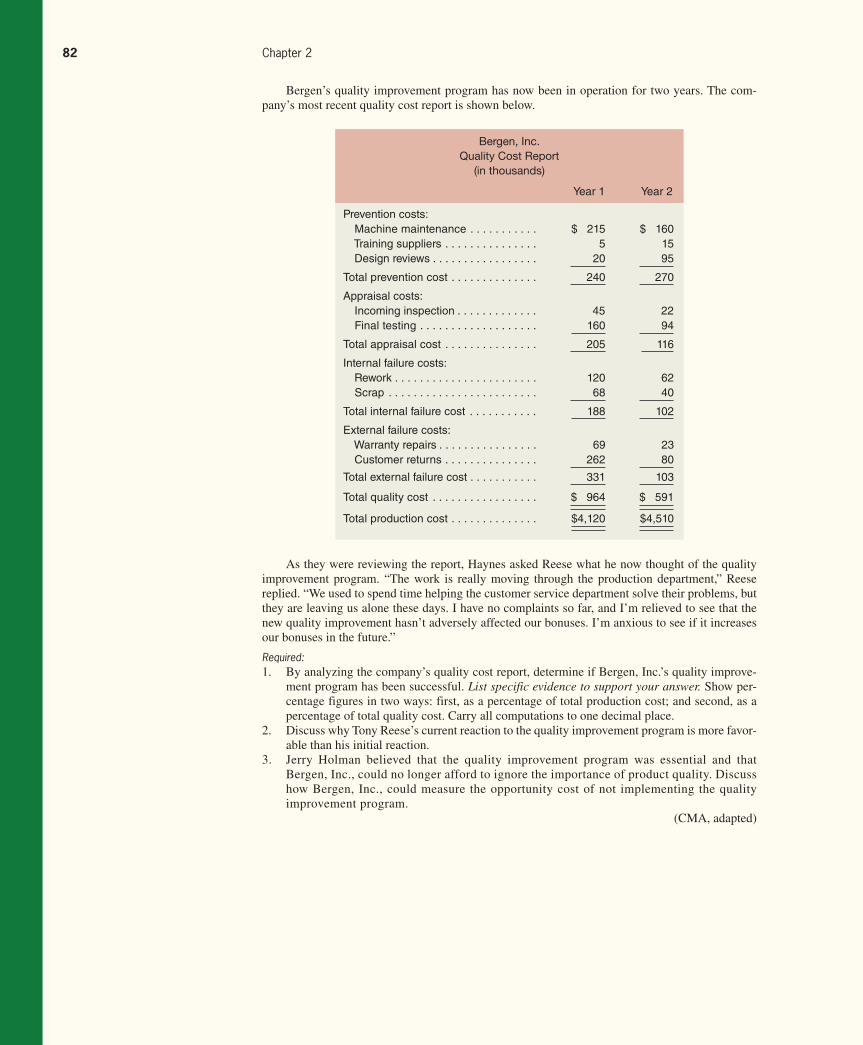
Confi rming Pages
82 Chapter 2
As they were reviewing the report, Haynes asked Reese what he now thought of the quality
improvement program. “The work is really moving through the production department,” Reese
replied. “We used to spend time helping the customer service department solve their problems, but
they are leaving us alone these days. I have no complaints so far, and I’m relieved to see that the
new quality improvement hasn’t adversely affected our bonuses. I’m anxious to see if it increases
our bonuses in the future.”
Required: 1. By analyzing the company’s quality cost report, determine if Bergen, Inc. ’s quality improve-
ment program has been successful. List specific evidence to support your answer. Show per-
centage figures in two ways: first, as a percentage of total production cost; and second, as a
percentage of total quality cost. Carry all computations to one decimal place.
2. Discuss why Tony Reese’s current reaction to the quality improvement program is more favor-
able than his initial reaction.
3. Jerry Holman believed that the quality improvement program was essential and that
Bergen, Inc. , could no longer afford to ignore the importance of product quality. Discuss
how Bergen, Inc. , could measure the opportunity cost of not implementing the quality
improvement program.
(CMA, adapted)
Bergen, Inc.
Quality Cost Report
(in thousands)
Year 1 Year 2
Prevention costs: Machine maintenance . . . . . . . . . . . $ 215 $ 160 Training suppliers . . . . . . . . . . . . . . . 5 15 Design reviews . . . . . . . . . . . . . . . . . 20 95
Total prevention cost . . . . . . . . . . . . . . 240 270
Appraisal costs: Incoming inspection . . . . . . . . . . . . . 45 22 Final testing . . . . . . . . . . . . . . . . . . . 160 94
Total appraisal cost . . . . . . . . . . . . . . . 205 116
Internal failure costs: Rework . . . . . . . . . . . . . . . . . . . . . . . 120 62 Scrap . . . . . . . . . . . . . . . . . . . . . . . . 68 40
Total internal failure cost . . . . . . . . . . . 188 102
External failure costs: Warranty repairs . . . . . . . . . . . . . . . . 69 23 Customer returns . . . . . . . . . . . . . . . 262 80
Total external failure cost . . . . . . . . . . . 331 103
Total quality cost . . . . . . . . . . . . . . . . . $ 964 $ 591
Total production cost . . . . . . . . . . . . . . $4,120 $4,510
Bergen’s quality improvement program has now been in operation for two years. The com-
pany’s most recent quality cost report is shown below.
gar11005_ch02_024-082.indd 82gar11005_ch02_024-082.indd 82 02/11/10 4:34 PM02/11/10 4:34 PM
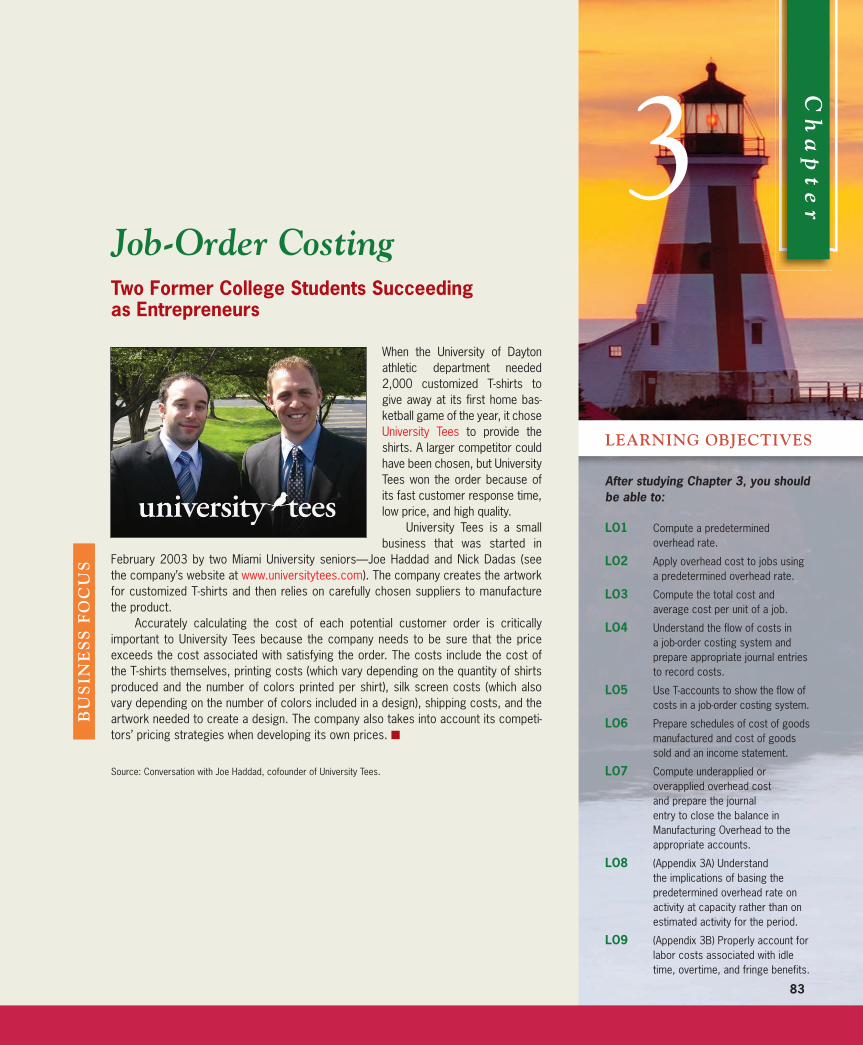
Rev.Confi rming Pages
83
Two Former College Students Succeeding as Entrepreneurs
When the University of Dayton athletic department needed 2,000 customized T-shirts to give away at its first home bas-ketball game of the year, it chose University Tees to provide the shirts. A larger competitor could have been chosen, but University Tees won the order because of its fast customer response time, low price, and high quality.
University Tees is a small business that was started in
February 2003 by two Miami University seniors—Joe Haddad and Nick Dadas (see the company’s website at www.universitytees.com ). The company creates the artwork for customized T-shirts and then relies on carefully chosen suppliers to manufacture the product.
Accurately calculating the cost of each potential customer order is critically important to University Tees because the company needs to be sure that the price exceeds the cost associated with satisfying the order. The costs include the cost of the T-shirts themselves, printing costs (which vary depending on the quantity of shirts produced and the number of colors printed per shirt), silk screen costs (which also vary depending on the number of colors included in a design), shipping costs, and the artwork needed to create a design. The company also takes into account its competi-tors’ pricing strategies when developing its own prices. ■
Source: Conversation with Joe Haddad, cofounder of University Tees.
3 C
ha
pt
er
After studying Chapter 3, you should be able to:
LO1 Compute a predetermined overhead rate .
LO2 Apply overhead cost to jobs using a predetermined overhead rate.
LO3 Compute the total cost and average cost per unit of a job.
LO4 Understand the flow of costs in a job-order costing system and prepare appropriate journal entries to record costs.
LO5 Use T-accounts to show the flow of costs in a job-order costing system.
LO6 Prepare schedules of cost of goods manufactured and cost of goods sold and an income statement.
LO7 Compute underapplied or overapplied overhead cost and prepare the journal entry to close the balance in Manufacturing Overhead to the appropriate accounts.
LO8 (Appendix 3A) Understand the implications of basing the predetermined overhead rate on activity at capacity rather than on estimated activity for the period.
LO9 (Appendix 3B) Properly account for labor costs associated with idle time, overtime, and fringe benefits.
LEARNING OBJECTIVES
BU
SIN
ES
S F
OC
US
Job-Order Costing
gar11005_ch03_083-140.indd 83gar11005_ch03_083-140.indd 83 17/11/10 11:18 AM17/11/10 11:18 AM
Rev.Confi rming Pages
84 Chapter 3
U nderstanding how products and services are costed is vital to man-
agers because the way in which these costs are determined can have a sub-
stantial impact on reported profits, as well as on key management decisions.
A managerial costing system should provide cost data to help manag-
ers plan, control, and make decisions. Nevertheless, external financial reporting and tax
reporting requirements often heavily influence how costs are accumulated and summa-
rized on managerial reports. This is true of product costing. In this chapter we use absorp-tion costing to determine product costs. In absorption costing , all manufacturing costs,
both fixed and variable, are assigned to units of product—units are said to fully absorb manufacturing costs. In later chapters we look at alternatives to absorption costing such
as variable costing and activity-based costing.
Most countries—including the United States—require some form of absorption
costing for both external financial reports and for tax reports. In addition, the vast
majority of companies throughout the world also use absorption costing in their man-
agement reports. Because absorption costing is the most common approach to product
costing throughout the world, we discuss it first and then discuss the alternatives in sub-
sequent chapters.
Job-Order Costing—An Overview
Under absorption costing, product costs include all manufacturing costs. Some manu-
facturing costs, such as direct materials, can be directly traced to particular products.
For example, the cost of the airbags installed in a Toyota Camry can be easily traced
to that particular auto. But what about manufacturing costs like factory rent? Such
costs do not change from month to month, whereas the number and variety of products
made in the factory may vary dramatically from one month to the next. Because these
costs remain unchanged from month to month regardless of what products are made,
they are clearly not caused by—and cannot be directly traced to—any particular prod-
uct. Therefore, these types of costs are assigned to products and services by averaging
across time and across products. The type of production process influences how this
averaging is done.
Job-order costing is used in situations where many different products are produced
each period. For example, a Levi Strauss clothing factory would typically make many dif-
ferent types of jeans for both men and women during a month. A particular order might
consist of 1,000 boot-cut men’s blue denim jeans, style number A312. This order of 1,000
jeans is called a job. In a job-order costing system, costs are traced and allocated to jobs
and then the costs of the job are divided by the number of units in the job to arrive at an
average cost per unit.
Other examples of situations where job-order costing would be used include large-
scale construction projects managed by Bechtel International , commercial aircraft pro-
duced by Boeing , greeting cards designed and printed by Hallmark , and airline meals
prepared by LSG SkyChefs. All of these examples are characterized by diverse out-
puts. Each Bechtel project is unique and different from every other—the company may
be simultaneously constructing a dam in Zaire and a bridge in Indonesia. Likewise,
each airline orders a different type of meal from LSG SkyChefs’ catering service.
Job-order costing is also used extensively in service industries. For example, hos-
pitals, law firms, movie studios, accounting firms, advertising agencies, and repair
shops all use a variation of job-order costing to accumulate costs. Although the detailed
example of job-order costing provided in the following section deals with a manufac-
turing company, the same basic concepts and procedures are used by many service
organizations.
gar11005_ch03_083-140.indd 84gar11005_ch03_083-140.indd 84 11/11/10 11:27 AM11/11/10 11:27 AM
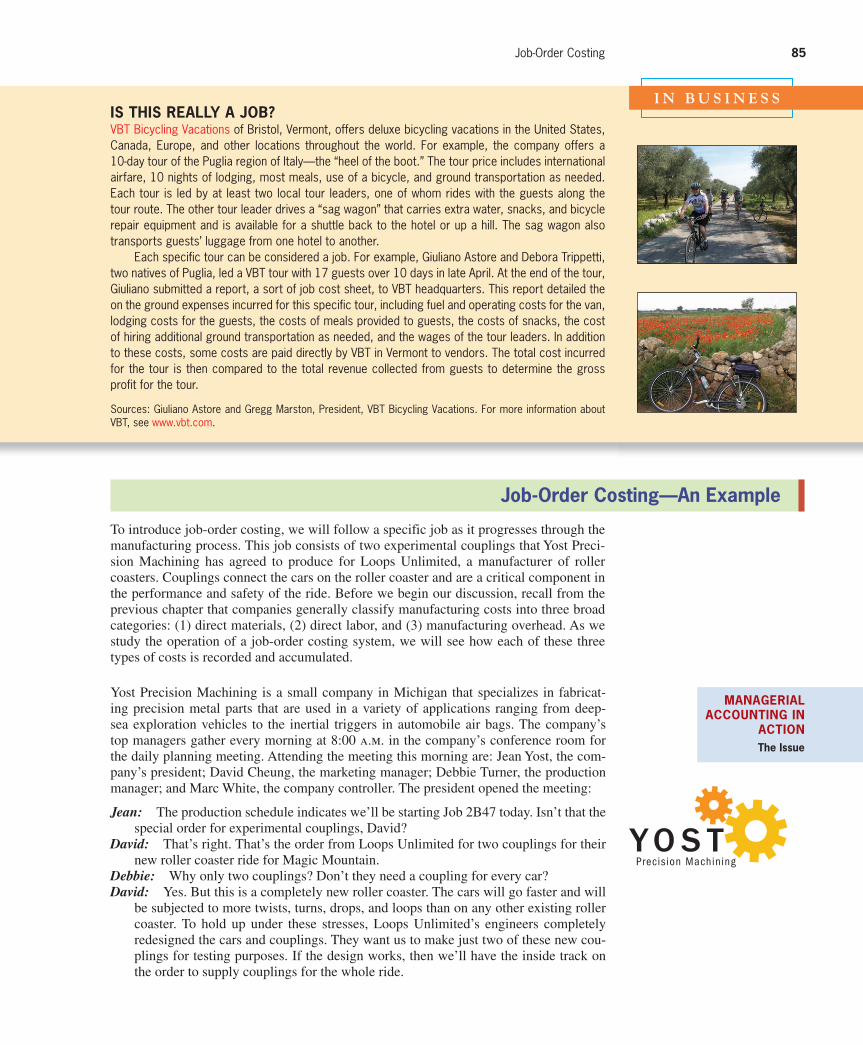
Rev.Confi rming Pages
Job-Order Costing 85
Job-Order Costing—An Example
To introduce job-order costing, we will follow a specific job as it progresses through the
manufacturing process. This job consists of two experimental couplings that Yost Preci-
sion Machining has agreed to produce for Loops Unlimited, a manufacturer of roller
coasters. Couplings connect the cars on the roller coaster and are a critical component in
the performance and safety of the ride. Before we begin our discussion, recall from the
previous chapter that companies generally classify manufacturing costs into three broad
categories: (1) direct materials, (2) direct labor, and (3) manufacturing overhead. As we
study the operation of a job-order costing system, we will see how each of these three
types of costs is recorded and accumulated.
Yost Precision Machining is a small company in Michigan that specializes in fabricat-
ing precision metal parts that are used in a variety of applications ranging from deep-
sea exploration vehicles to the inertial triggers in automobile air bags. The company’s
top managers gather every morning at 8:00 a.m. in the company’s conference room for
the daily planning meeting. Attending the meeting this morning are: Jean Yost, the com-
pany’s president; David Cheung, the marketing manager; Debbie Turner, the production
manager; and Marc White, the company controller. The president opened the meeting:
Jean: The production schedule indicates we’ll be starting Job 2B47 today. Isn’t that the
special order for experimental couplings, David?
David: That’s right. That’s the order from Loops Unlimited for two couplings for their
new roller coaster ride for Magic Mountain.
Debbie: Why only two couplings? Don’t they need a coupling for every car?
David: Yes. But this is a completely new roller coaster. The cars will go faster and will
be subjected to more twists, turns, drops, and loops than on any other existing roller
coaster. To hold up under these stresses, Loops Unlimited’s engineers completely
redesigned the cars and couplings. They want us to make just two of these new cou-
plings for testing purposes. If the design works, then we’ll have the inside track on
the order to supply couplings for the whole ride.
MANAGERIAL ACCOUNTING IN
ACTION The Issue
I N B U S I N E S S IS THIS REALLY A JOB? VBT Bicycling Vacations of Bristol, Vermont, offers deluxe bicycling vacations in the United States, Canada, Europe, and other locations throughout the world. For example, the company offers a 10-day tour of the Puglia region of Italy—the “heel of the boot.” The tour price includes international airfare, 10 nights of lodging, most meals, use of a bicycle, and ground transportation as needed. Each tour is led by at least two local tour leaders, one of whom rides with the guests along the tour route. The other tour leader drives a “sag wagon” that carries extra water, snacks, and bicycle repair equipment and is available for a shuttle back to the hotel or up a hill. The sag wagon also transports guests’ luggage from one hotel to another.
Each specific tour can be considered a job. For example, Giuliano Astore and Debora Trippetti, two natives of Puglia, led a VBT tour with 17 guests over 10 days in late April. At the end of the tour, Giuliano submitted a report, a sort of job cost sheet, to VBT headquarters. This report detailed the on the ground expenses incurred for this specific tour, including fuel and operating costs for the van, lodging costs for the guests, the costs of meals provided to guests, the costs of snacks, the cost of hiring additional ground transportation as needed, and the wages of the tour leaders. In addition to these costs, some costs are paid directly by VBT in Vermont to vendors. The total cost incurred for the tour is then compared to the total revenue collected from guests to determine the gross profit for the tour.
Sources: Giuliano Astore and Gregg Marston, President, VBT Bicycling Vacations. For more information about VBT, see www.vbt.com .
gar11005_ch03_083-140.indd 85gar11005_ch03_083-140.indd 85 11/11/10 11:27 AM11/11/10 11:27 AM
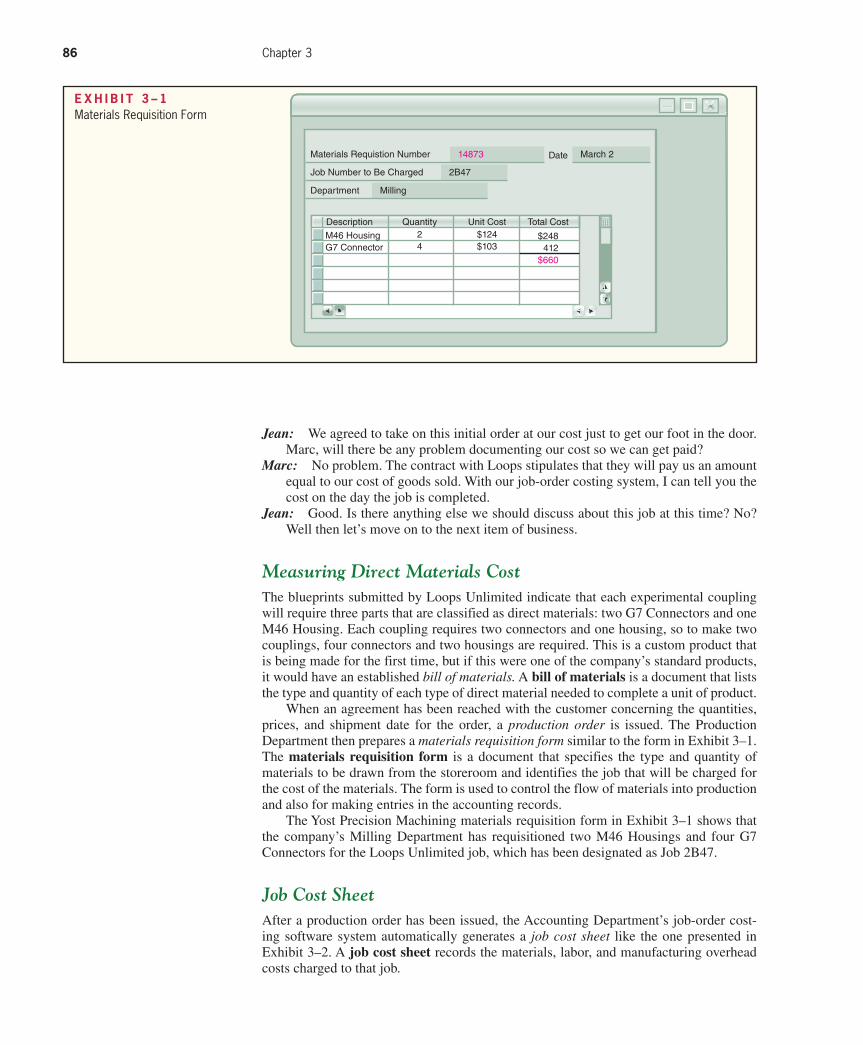
Rev.Confi rming Pages
86 Chapter 3
Jean: We agreed to take on this initial order at our cost just to get our foot in the door.
Marc, will there be any problem documenting our cost so we can get paid?
Marc: No problem. The contract with Loops stipulates that they will pay us an amount
equal to our cost of goods sold. With our job-order costing system, I can tell you the
cost on the day the job is completed.
Jean: Good. Is there anything else we should discuss about this job at this time? No?
Well then let’s move on to the next item of business.
Measuring Direct Materials Cost
The blueprints submitted by Loops Unlimited indicate that each experimental coupling
will require three parts that are classified as direct materials: two G7 Connectors and one
M46 Housing. Each coupling requires two connectors and one housing, so to make two
couplings, four connectors and two housings are required. This is a custom product that
is being made for the first time, but if this were one of the company’s standard products,
it would have an established bill of materials. A bill of materials is a document that lists
the type and quantity of each type of direct material needed to complete a unit of product.
When an agreement has been reached with the customer concerning the quantities,
prices, and shipment date for the order, a production order is issued. The Production
Department then prepares a materials requisition form similar to the form in Exhibit 3–1 .
The materials requisition form is a document that specifies the type and quantity of
materials to be drawn from the storeroom and identifies the job that will be charged for
the cost of the materials. The form is used to control the flow of materials into production
and also for making entries in the accounting records.
The Yost Precision Machining materials requisition form in Exhibit 3–1 shows that
the company’s Milling Department has requisitioned two M46 Housings and four G7
Connectors for the Loops Unlimited job, which has been designated as Job 2B47.
Job Cost Sheet
After a production order has been issued, the Accounting Department’s job-order cost-
ing software system automatically generates a job cost sheet like the one presented in
Exhibit 3–2 . A job cost sheet records the materials, labor, and manufacturing overhead
costs charged to that job.
E X H I B I T 3 – 1 Materials Requisition Form
Description Quantity Unit Cost Total Cost
Materials Requistion Number Date
Job Number to Be Charged
Department
March 214873
2B47
Milling
24
$124$103
$248412
$660
M46 HousingG7 Connector
gar11005_ch03_083-140.indd 86gar11005_ch03_083-140.indd 86 11/11/10 11:28 AM11/11/10 11:28 AM
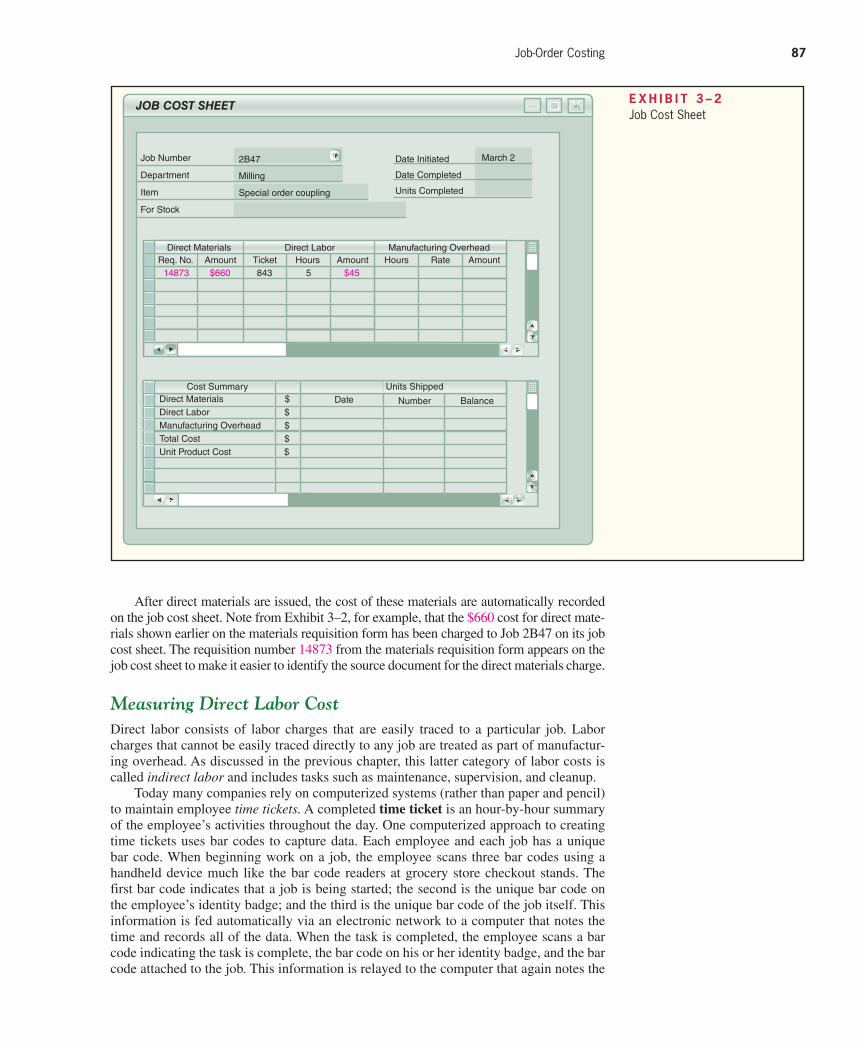
Rev.Confi rming Pages
Job-Order Costing 87
After direct materials are issued, the cost of these materials are automatically recorded
on the job cost sheet. Note from Exhibit 3–2 , for example, that the $660 cost for direct mate-
rials shown earlier on the materials requisition form has been charged to Job 2B47 on its job
cost sheet. The requisition number 14873 from the materials requisition form appears on the
job cost sheet to make it easier to identify the source document for the direct materials charge.
Measuring Direct Labor Cost
Direct labor consists of labor charges that are easily traced to a particular job. Labor
charges that cannot be easily traced directly to any job are treated as part of manufactur-
ing overhead. As discussed in the previous chapter, this latter category of labor costs is
called indirect labor and includes tasks such as maintenance, supervision, and cleanup.
Today many companies rely on computerized systems (rather than paper and pencil)
to maintain employee time tickets. A completed time ticket is an hour-by-hour summary
of the employee’s activities throughout the day. One computerized approach to creating
time tickets uses bar codes to capture data. Each employee and each job has a unique
bar code. When beginning work on a job, the employee scans three bar codes using a
handheld device much like the bar code readers at grocery store checkout stands. The
first bar code indicates that a job is being started; the second is the unique bar code on
the employee’s identity badge; and the third is the unique bar code of the job itself. This
information is fed automatically via an electronic network to a computer that notes the
time and records all of the data. When the task is completed, the employee scans a bar
code indicating the task is complete, the bar code on his or her identity badge, and the bar
code attached to the job. This information is relayed to the computer that again notes the
E X H I B I T 3 – 2 Job Cost Sheet
Direct Materials $Direct Labor $Manufacturing Overhead $Total Cost $ Unit Product Cost $
Cost SummaryDate Number Balance
Units Shipped
JOB COST SHEET
Job Number
Department
Item
For Stock
2B47
Milling
Special order coupling
Date Initiated
Date Completed
Units Completed
March 2
14873 $660
Direct Materials Direct Labor Manufacturing OverheadReq. No. Amount
843Ticket
5Hours
$45Amount Hours Rate Amount
gar11005_ch03_083-140.indd 87gar11005_ch03_083-140.indd 87 11/11/10 11:28 AM11/11/10 11:28 AM
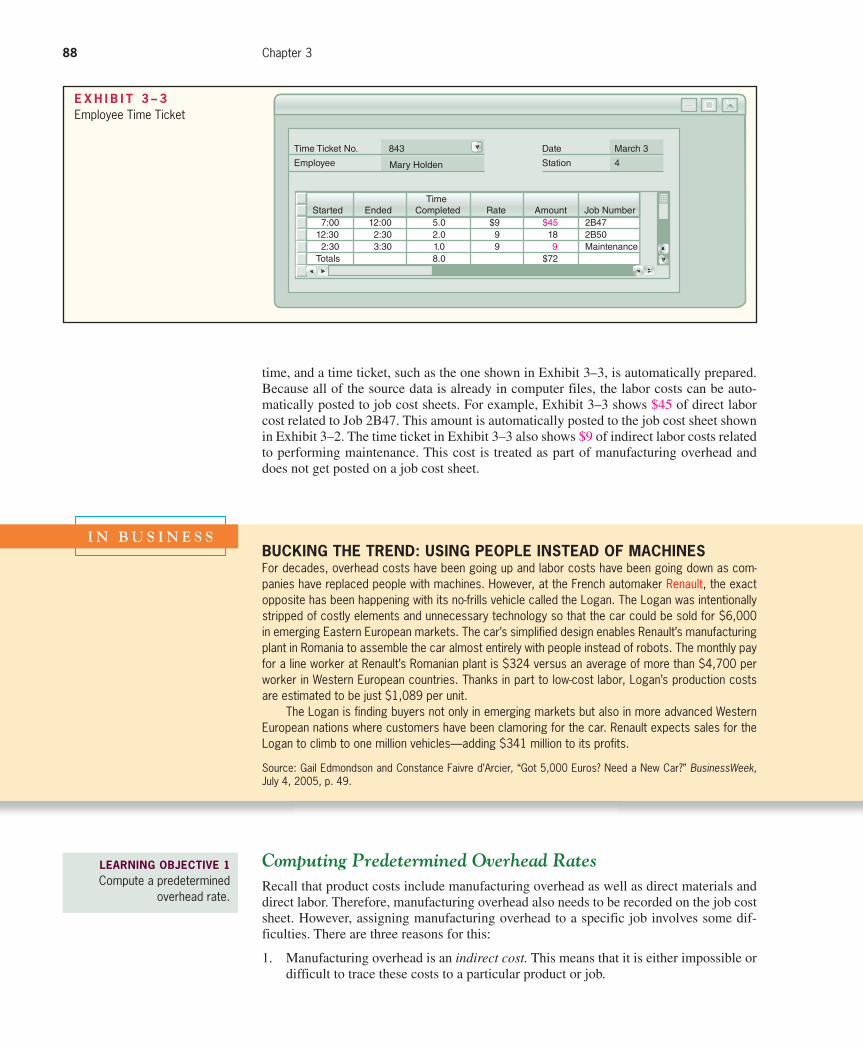
Rev.Confi rming Pages
88 Chapter 3
time, and a time ticket, such as the one shown in Exhibit 3–3 , is automatically prepared.
Because all of the source data is already in computer files, the labor costs can be auto-
matically posted to job cost sheets. For example, Exhibit 3–3 shows $45 of direct labor
cost related to Job 2B47. This amount is automatically posted to the job cost sheet shown
in Exhibit 3–2 . The time ticket in Exhibit 3–3 also shows $9 of indirect labor costs related
to performing maintenance. This cost is treated as part of manufacturing overhead and
does not get posted on a job cost sheet.
E X H I B I T 3 – 3 Employee Time Ticket
Time Ticket No. 843
Employee
Date
Station
March 3
4Mary Holden
Amount Job NumberRateTime
CompletedEndedStarted 7:00 12:00 5.0 $9 $45 2B47 12:30 2:30 2.0 9 18 2B50 2:30 3:30 1.0 9 9 MaintenanceTotals 8.0 $72
I N B U S I N E S S BUCKING THE TREND: USING PEOPLE INSTEAD OF MACHINES For decades, overhead costs have been going up and labor costs have been going down as com-panies have replaced people with machines. However, at the French automaker Renault, the exact opposite has been happening with its no-frills vehicle called the Logan. The Logan was intentionally stripped of costly elements and unnecessary technology so that the car could be sold for $6,000 in emerging Eastern European markets. The car’s simplified design enables Renault’s manufacturing plant in Romania to assemble the car almost entirely with people instead of robots. The monthly pay for a line worker at Renault’s Romanian plant is $324 versus an average of more than $4,700 per worker in Western European countries. Thanks in part to low-cost labor, Logan’s production costs are estimated to be just $1,089 per unit.
The Logan is finding buyers not only in emerging markets but also in more advanced Western European nations where customers have been clamoring for the car. Renault expects sales for the Logan to climb to one million vehicles—adding $341 million to its profits.
Source: Gail Edmondson and Constance Faivre d’Arcier, “Got 5,000 Euros? Need a New Car?” BusinessWeek, July 4, 2005, p. 49.
Computing Predetermined Overhead Rates
Recall that product costs include manufacturing overhead as well as direct materials and
direct labor. Therefore, manufacturing overhead also needs to be recorded on the job cost
sheet. However, assigning manufacturing overhead to a specific job involves some dif-
ficulties. There are three reasons for this:
1. Manufacturing overhead is an indirect cost. This means that it is either impossible or
difficult to trace these costs to a particular product or job.
LEARNING OBJECTIVE 1 Compute a predetermined
overhead rate.
gar11005_ch03_083-140.indd 88gar11005_ch03_083-140.indd 88 11/11/10 11:28 AM11/11/10 11:28 AM
Rev.Confi rming Pages
Job-Order Costing 89
2. Manufacturing overhead consists of many different items ranging from the grease
used in machines to the annual salary of the production manager.
3. Because of the fixed costs in manufacturing overhead, total manufacturing overhead
costs tend to remain relatively constant from one period to the next even though the
number of units produced can fluctuate widely. Consequently, the average cost per
unit will vary from one period to the next.
Given these problems, allocation is used to assign overhead costs to products. Alloca-
tion is accomplished by selecting an allocation base that is common to all of the company’s
products and services. An allocation base is a measure such as direct labor-hours (DLH)
or machine-hours (MH) that is used to assign overhead costs to products and services. The
most widely used allocation bases in manufacturing are direct labor-hours, direct labor
cost, machine-hours and (where a company has only a single product) units of product.
Manufacturing overhead is commonly assigned to products using a predetermined overhead rate. The predetermined overhead rate is computed by dividing the total esti-
mated manufacturing overhead cost for the period by the estimated total amount of the
allocation base as follows:
The predetermined overhead rate is computed before the period begins using a four-step
process. The first step is to estimate the total amount of the allocation base (the denomi-
nator) that will be required for next period’s estimated level of production. The second
step is to estimate the total fixed manufacturing overhead cost for the coming period and
the variable manufacturing overhead cost per unit of the allocation base. The third step
is to use the cost formula shown below to estimate the total manufacturing overhead cost
(the numerator) for the coming period:
Y = a + bX
Where,
Y = The estimated total manufacturing overhead cost
a = The estimated total fixed manufacturing overhead cost
b = The estimated variable manufacturing overhead cost per unit of the
allocation base
X = The estimated total amount of the allocation base
The fourth step is to compute the predetermined overhead rate. Notice, the estimated
amount of the allocation base is determined before estimating the total manufacturing
overhead cost. This needs to be done because total manufacturing overhead cost includes
variable overhead costs that depend on the amount of the allocation base.
Applying Manufacturing Overhead
To repeat, the predetermined overhead rate is computed before the period begins. The
predetermined overhead rate is then used to apply overhead cost to jobs throughout the
period. The process of assigning overhead cost to jobs is called overhead application . The formula for determining the amount of overhead cost to apply to a particular job is:
Overhead applied to a particular job
= Predetermined
overhead rate
× Amount of the allocation
base incurred by the job
For example, if the predetermined overhead rate is $8 per direct labor-hour, then $8 of
overhead cost is applied to a job for each direct labor-hour incurred on the job. When the
allocation base is direct labor-hours, the formula becomes:
Overhead applied to
a particular job
= Predetermined
overhead rate
× Actual direct labor-hours
charged to the job
Predetermined overhead rate = Estimated total manufacturing overhead cost
_______________________________ Estimated total amount of the allocation base
LEARNING OBJECTIVE 2 Apply overhead cost to jobs using a predetermined overhead rate.
gar11005_ch03_083-140.indd 89gar11005_ch03_083-140.indd 89 11/11/10 11:28 AM11/11/10 11:28 AM
Rev.Confi rming Pages
90 Chapter 3
Manufacturing Overhead—A Closer Look
To illustrate the steps involved in computing and using a predetermined overhead rate,
let’s return to Yost Precision Machining and make the following assumptions. In step
one, the company estimated that 40,000 direct labor-hours would be required to support
the production planned for the year. In step two, it estimated $220,000 of total fixed
manufacturing overhead cost for the coming year and $2.50 of variable manufacturing
overhead cost per direct labor-hour. Given these assumptions, in step three the company
used the cost formula shown below to estimate its total manufacturing overhead cost for
the year:
Y = a + bX
Y = $220,000 + ($2.50 per direct labor-hour × 40,000 direct labor-hours)
Y = $220,000 + $100,000
Y = $320,000
In step four, Yost Precision Machining computed its predetermined overhead rate for
the year of $8 per direct labor-hour as shown below:
Predetermined overhead rate = Estimated total manufacturing overhead cost
_____________________________________ Estimated total amount of the allocation base
= $320,000
_____________________ 40,000 direct labor-hours
= $8 per direct labor-hour
The job cost sheet in Exhibit 3–4 indicates that 27 direct labor-hours (i.e., DLHs)
were charged to Job 2B47. Therefore, a total of $216 of manufacturing overhead cost
would be applied to the job:
Overhead applied to
Job 2B47
= Predetermined
overhead rate
× Actual direct labor-hours
charged to Job 2B47
= $8 per DLH × 27 DLHs
= $216 of overhead applied to Job 2B47
This amount of overhead has been entered on the job cost sheet in Exhibit 3–4 . Note that
this is not the actual amount of overhead caused by the job. Actual overhead costs are not assigned to jobs—if that could be done, the costs would be direct costs, not overhead. The
overhead assigned to the job is simply a share of the total overhead that was estimated at
the beginning of the year. A normal cost system , which we have been describing, applies
overhead to jobs by multiplying a predetermined overhead rate by the actual amount of
the allocation base incurred by the jobs.
The Need for a Predetermined Rate
Instead of using a predetermined rate based on estimates, why not base the overhead rate
on the actual total manufacturing overhead cost and the actual total amount of the alloca-
tion base incurred on a monthly, quarterly, or annual basis? If an actual rate is computed
monthly or quarterly, seasonal factors in overhead costs or in the allocation base can
produce fluctuations in the overhead rate. For example, the costs of heating and cool-
ing a factory in Illinois will be highest in the winter and summer months and lowest in
the spring and fall. If the overhead rate is recomputed at the end of each month or each
quarter based on actual costs and activity, the overhead rate would go up in the winter and
summer and down in the spring and fall. As a result, two identical jobs, one completed
in the winter and one completed in the spring, would be assigned different manufactur-
ing overhead costs. Many managers believe that such fluctuations in product costs serve
gar11005_ch03_083-140.indd 90gar11005_ch03_083-140.indd 90 11/11/10 11:28 AM11/11/10 11:28 AM
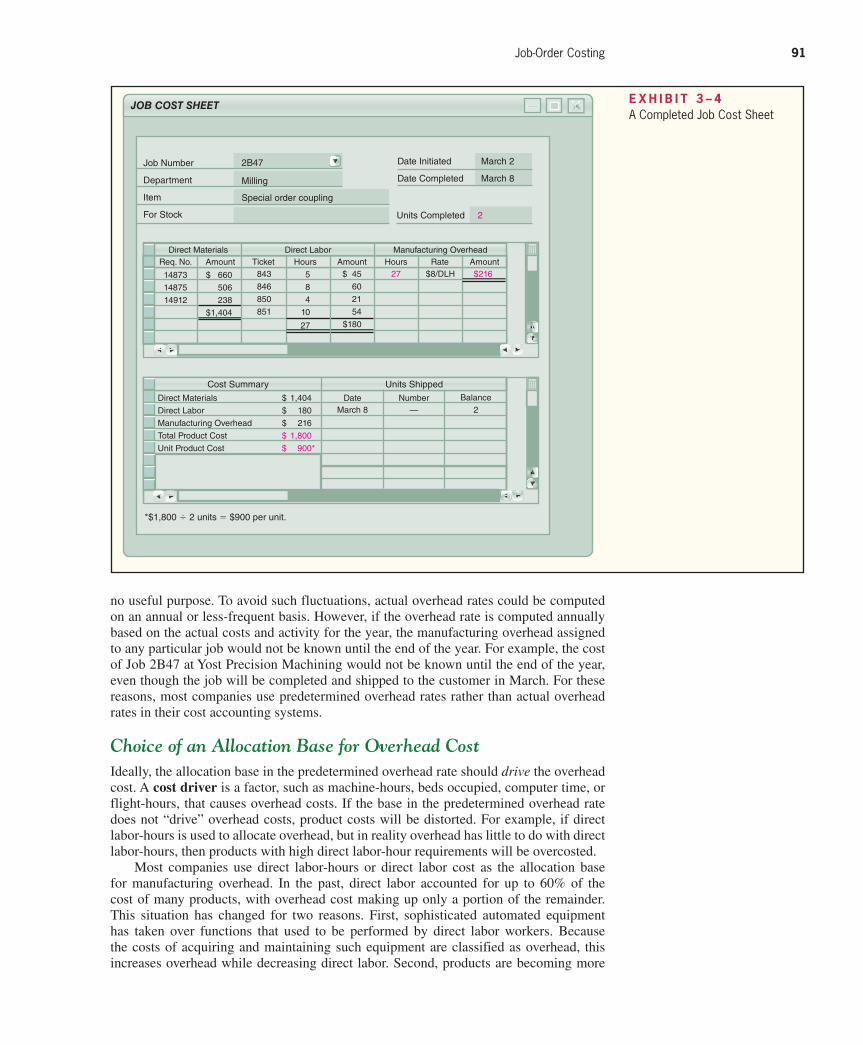
Rev.Confi rming Pages
Job-Order Costing 91
no useful purpose. To avoid such fluctuations, actual overhead rates could be computed
on an annual or less-frequent basis. However, if the overhead rate is computed annually
based on the actual costs and activity for the year, the manufacturing overhead assigned
to any particular job would not be known until the end of the year. For example, the cost
of Job 2B47 at Yost Precision Machining would not be known until the end of the year,
even though the job will be completed and shipped to the customer in March. For these
reasons, most companies use predetermined overhead rates rather than actual overhead
rates in their cost accounting systems.
Choice of an Allocation Base for Overhead Cost
Ideally, the allocation base in the predetermined overhead rate should drive the overhead
cost. A cost driver is a factor, such as machine-hours, beds occupied, computer time, or
flight-hours, that causes overhead costs. If the base in the predetermined overhead rate
does not “drive” overhead costs, product costs will be distorted. For example, if direct
labor-hours is used to allocate overhead, but in reality overhead has little to do with direct
labor-hours, then products with high direct labor-hour requirements will be overcosted.
Most companies use direct labor-hours or direct labor cost as the allocation base
for manufacturing overhead. In the past, direct labor accounted for up to 60% of the
cost of many products, with overhead cost making up only a portion of the remainder.
This situation has changed for two reasons. First, sophisticated automated equipment
has taken over functions that used to be performed by direct labor workers. Because
the costs of acquiring and maintaining such equipment are classified as overhead, this
increases overhead while decreasing direct labor. Second, products are becoming more
E X H I B I T 3 – 4 A Completed Job Cost Sheet
Job Number
Department
Item
For Stock
Date Initiated
Date Completed
March 2
March 8
JOB COST SHEET
Units Completed
Direct Materials Direct Labor Manufacturing Overhead
14873
14875
14912
Req. No.
$ 660
506
238
$1,404
$216Amount
843
846
850
851
Ticket Hours$ 45
60
21
54
$180
27 $8/DLHAmount Hours Rate Amount
5
8
4
10
27
Direct Materials $ 1,404
Direct Labor $ 180
Manufacturing Overhead $ 216
Total Product Cost $ 1,800
Unit Product Cost $ 900*
Number Balance—
DateMarch 8 2
Cost Summary Units Shipped
*$1,800 4 2 units 5 $900 per unit.
2
Milling
Special order coupling
2B47
gar11005_ch03_083-140.indd 91gar11005_ch03_083-140.indd 91 11/11/10 11:28 AM11/11/10 11:28 AM
Rev.Confi rming Pages
92 Chapter 3
sophisticated and complex and are changed more frequently. This increases the need for
highly skilled indirect workers such as engineers. As a result of these two trends, direct
labor has decreased relative to overhead as a component of product costs.
In companies where direct labor and overhead costs have been moving in opposite
directions, it would be difficult to argue that direct labor “drives” overhead costs. Accord-
ingly, managers in some companies use activity-based costing principles to redesign their
cost accounting systems. Activity-based costing is designed to more accurately reflect the
demands that products, customers, and other cost objects make on overhead resources.
The activity-based approach is discussed in more detail in Chapter 7.
Although direct labor may not be an appropriate allocation base in some industries,
in others it continues to be a significant driver of manufacturing overhead. Indeed, most
manufacturing companies in the United States continue to use direct labor as the primary
or secondary allocation base for manufacturing overhead. The key point is that the alloca-
tion base used by the company should really drive, or cause, overhead costs, and direct
labor is not always the most appropriate allocation base.
I N B U S I N E S S REDUCING HEALTH-DAMAGING BEHAVIORS Cianbro is an industrial construction company headquartered in Pittsfield, Maine, whose goal is “To be the healthiest company in America.” It introduced a corporate wellness program to attack employee behaviors that drive up health-care costs. The table below summarizes the number of employees in five health risk categories as of 2003 and 2005. The decreases in the number of employees in these high-risk categories are evidence that the wellness program was effective in helping employees make positive lifestyle changes. This should result in reduced health-care costs for the company.
Number of Employees
Health Risk Category January 2003 March 2005 Decrease
Obesity . . . . . . . . . . . . . . . . 432 353 79High cholesterol . . . . . . . . . 637 515 122Tobacco use . . . . . . . . . . . . 384 274 110Inactivity . . . . . . . . . . . . . . . 354 254 100High blood pressure . . . . . . 139 91 48
Source: Cianbro, WELCOA’s Absolute Advantage Magazine, 2006.
Computation of Unit Costs
With the application of Yost Precision Machining’s $216 of manufacturing overhead to
the job cost sheet in Exhibit 3–4 , the job cost sheet is complete except for two final steps.
First, the totals for direct materials, direct labor, and manufacturing overhead are trans-
ferred to the Cost Summary section of the job cost sheet and added together to obtain the
total cost for the job. 1 Then the total product cost ( $1,800 ) is divided by the number of
units (2) to obtain the unit product cost ( $900 ). This unit product cost information is used
for valuing unsold units in ending inventory and for determining cost of goods sold. As
indicated earlier, this unit product cost is an average cost and should not be interpreted as the cost that would actually be incurred if another unit were produced. The incremen-
tal cost of an additional unit is something less than the average unit cost of $900 because
much of the actual overhead costs would not change if another unit were produced.
LEARNING OBJECTIVE 3 Compute the total cost and
average cost per unit of a job.
1 Notice, we are assuming that Job 2B47 required direct materials and direct labor beyond the charges
shown in Exhibits 3–1 and 3–3 .
gar11005_ch03_083-140.indd 92gar11005_ch03_083-140.indd 92 11/11/10 11:28 AM11/11/10 11:28 AM
Rev.Confi rming Pages
Job-Order Costing 93
In the 8:00 a.m. daily planning meeting on March 9, Jean Yost, the president of Yost Pre-
cision Machining, once again drew attention to Job 2B47, the experimental couplings:
Jean: I see Job 2B47 is completed. Let’s get those couplings shipped immediately to
Loops Unlimited so they can get their testing program under way. Marc, how much
are we going to bill Loops for those two units?
Marc: Because we agreed to sell the experimental couplings at cost, we will be charg-
ing Loops Unlimited just $900 a unit.
Jean: Fine. Let’s hope the couplings work out and we make some money on the big
order later.
MANAGERIAL ACCOUNTING IN
ACTION The Wrap-up
I N B U S I N E S S ONE-OF-A-KIND MASTERPIECE In a true job-order costing environment, every job is unique. For example, Purdey manufactures 80–90 shotguns per year with each gun being a specially commissioned one-of-a-kind masterpiece. The prices start at $110,000 because every detail is custom built, engraved, assembled, and pol-ished by a skilled craftsman. The hand engraving can take months to complete and may add as much as $100,000 to the price. The guns are designed to shoot perfectly straight and their value increases over time even with heavy use. One Purdey gun collector said “when I shoot my Purdeys I feel like an orchestra conductor waving my baton.”
Source: Eric Arnold, “Aim High,” Forbes, December 28, 2009, p. 86.
Job-Order Costing—The Flow of Costs
We are now ready to discuss the flow of costs through a job-order costing system.
Exhibit 3–5 provides a conceptual overview of these cost flows. It highlights the fact that
product costs flow through inventories on the balance sheet and then on to cost of goods
sold in the income statement. More specifically, raw materials purchases are recorded in
the Raw Materials inventory account. Raw materials include any materials that go into
the final product. When raw materials are used in production, their costs are transferred
to the Work in Process inventory account as direct materials. 2 Work in process consists
of units of product that are only partially complete and will require further work before
they are ready for sale to the customer. Notice that direct labor costs are added directly
to Work in Process—they do not flow through Raw Materials inventory. Manufacturing
overhead costs are applied to Work in Process by multiplying the predetermined overhead
rate by the actual quantity of the allocation base consumed by each job. 3 When goods are
completed, their costs are transferred from Work in Process to Finished Goods. Finished goods consist of completed units of product that have not yet been sold to customers.
The amount transferred from Work in Process to Finished Goods is referred to as the cost of goods manufactured. The cost of goods manufactured includes the manufacturing
costs associated with the goods that were finished during the period. As goods are sold,
their costs are transferred from Finished Goods to Cost of Goods Sold. At this point, the
various costs required to make the product are finally recorded as an expense. Until that
point, these costs are in inventory accounts on the balance sheet. Period costs (or selling
and administrative expenses) do not flow through inventories on the balance sheet. They
are recorded as expenses on the income statement in the period incurred.
LEARNING OBJECTIVE 4 Understand the flow of costs in a job-order costing system and prepare appropriate journal entries to record costs.
2 Indirect material costs are accounted for as part of manufacturing overhead.
3 For simplicity, Exhibit 3–5 assumes that Cost of Goods Sold does not need to be adjusted as discussed
later in the chapter.
gar11005_ch03_083-140.indd 93gar11005_ch03_083-140.indd 93 11/11/10 11:28 AM11/11/10 11:28 AM
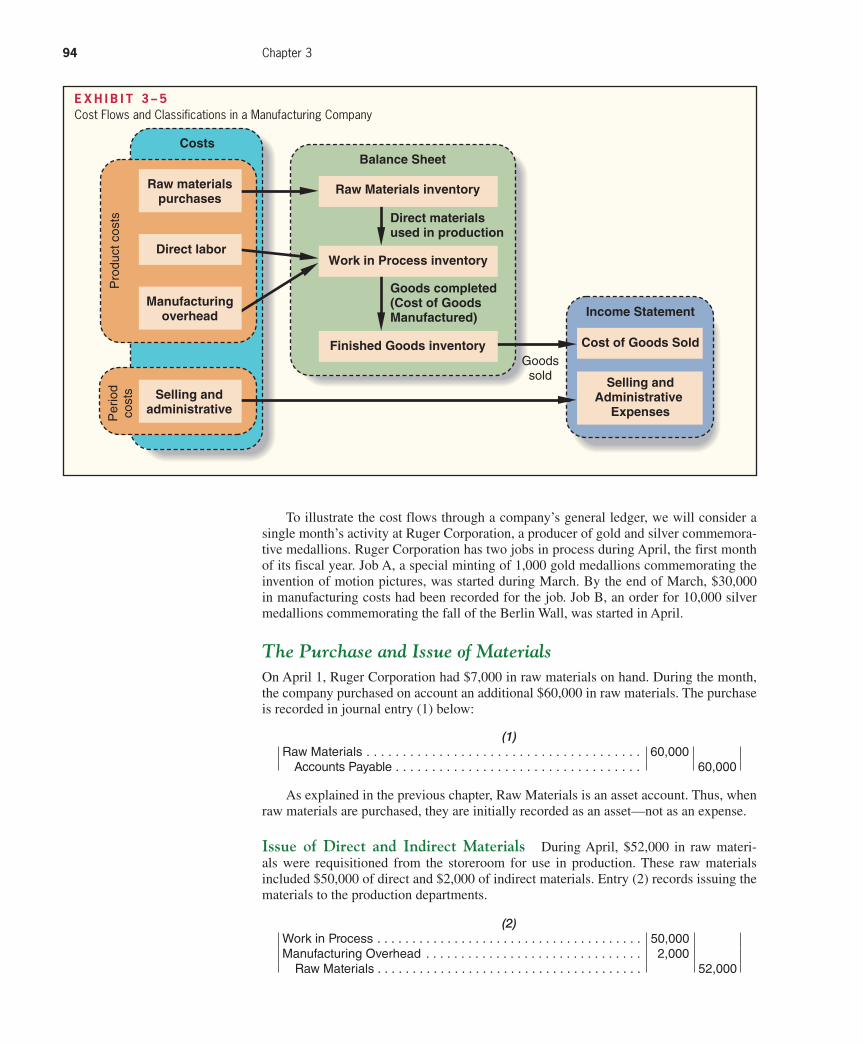
Rev.Confi rming Pages
94 Chapter 3
E X H I B I T 3 – 5 Cost Flows and Classifications in a Manufacturing Company
Pro
duct
cos
tsP
erio
dco
sts
Finished Goods inventory
Goods completed(Cost of GoodsManufactured)
Selling andAdministrative
Expenses
Income Statement
Balance SheetCosts
Cost of Goods SoldGoods
sold
Direct materialsused in production
Work in Process inventory
Raw Materials inventory
Manufacturingoverhead
Raw materialspurchases
Direct labor
Selling andadministrative
To illustrate the cost flows through a company’s general ledger, we will consider a
single month’s activity at Ruger Corporation, a producer of gold and silver commemora-
tive medallions. Ruger Corporation has two jobs in process during April, the first month
of its fiscal year. Job A, a special minting of 1,000 gold medallions commemorating the
invention of motion pictures, was started during March. By the end of March, $30,000
in manufacturing costs had been recorded for the job. Job B, an order for 10,000 silver
medallions commemorating the fall of the Berlin Wall, was started in April.
The Purchase and Issue of Materials
On April 1, Ruger Corporation had $7,000 in raw materials on hand. During the month,
the company purchased on account an additional $60,000 in raw materials. The purchase
is recorded in journal entry (1) below:
As explained in the previous chapter, Raw Materials is an asset account. Thus, when
raw materials are purchased, they are initially recorded as an asset—not as an expense.
Issue of Direct and Indirect Materials During April, $52,000 in raw materi-
als were requisitioned from the storeroom for use in production. These raw materials
included $50,000 of direct and $2,000 of indirect materials. Entry (2) records issuing the
materials to the production departments.
(1)Raw Materials . . . . . . . . . . . . . . . . . . . . . . . . . . . . . . . . . . . . . . 60,000 Accounts Payable . . . . . . . . . . . . . . . . . . . . . . . . . . . . . . . . . . 60,000
(2)Work in Process . . . . . . . . . . . . . . . . . . . . . . . . . . . . . . . . . . . . . . 50,000Manufacturing Overhead . . . . . . . . . . . . . . . . . . . . . . . . . . . . . . . 2,000 Raw Materials . . . . . . . . . . . . . . . . . . . . . . . . . . . . . . . . . . . . . . 52,000
gar11005_ch03_083-140.indd 94gar11005_ch03_083-140.indd 94 11/11/10 11:28 AM11/11/10 11:28 AM
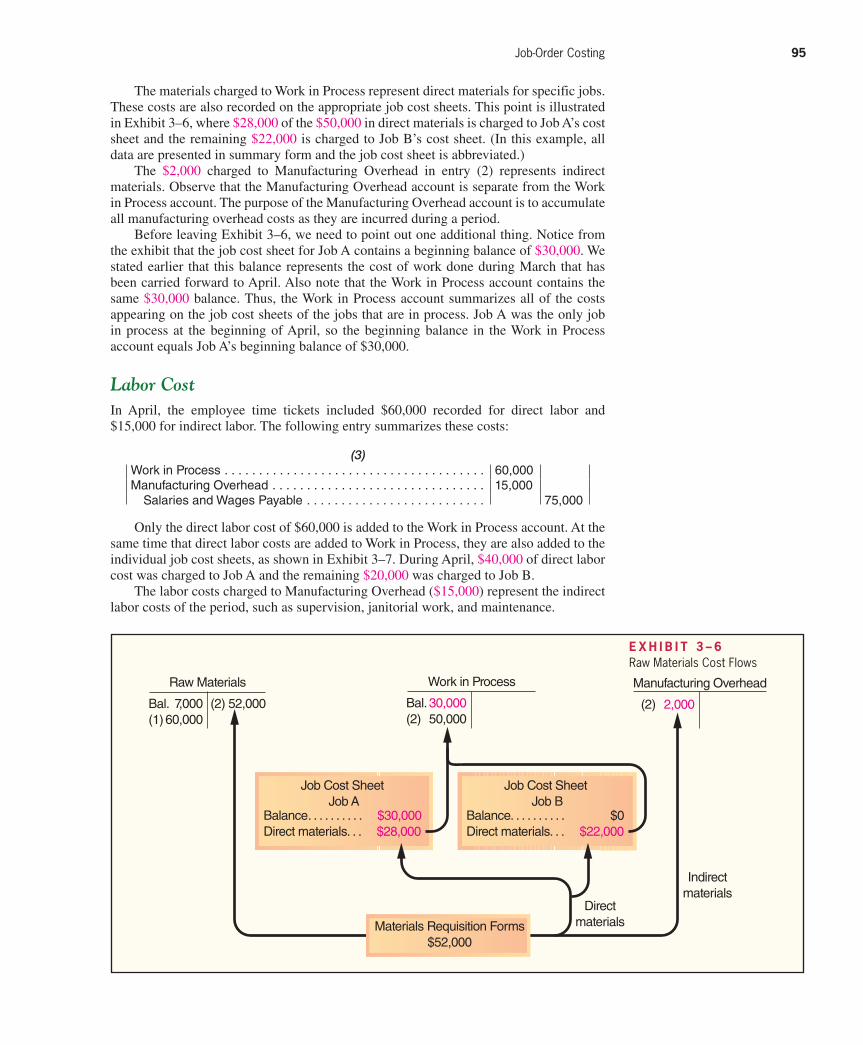
Rev.Confi rming Pages
Job-Order Costing 95
E X H I B I T 3 – 6 Raw Materials Cost Flows
The materials charged to Work in Process represent direct materials for specific jobs.
These costs are also recorded on the appropriate job cost sheets. This point is illustrated
in Exhibit 3–6 , where $28,000 of the $50,000 in direct materials is charged to Job A’s cost
sheet and the remaining $22,000 is charged to Job B’s cost sheet. (In this example, all
data are presented in summary form and the job cost sheet is abbreviated.)
The $2,000 charged to Manufacturing Overhead in entry (2) represents indirect
materials. Observe that the Manufacturing Overhead account is separate from the Work
in Process account. The purpose of the Manufacturing Overhead account is to accumulate
all manufacturing overhead costs as they are incurred during a period.
Before leaving Exhibit 3–6, we need to point out one additional thing. Notice from
the exhibit that the job cost sheet for Job A contains a beginning balance of $30,000 . We
stated earlier that this balance represents the cost of work done during March that has
been carried forward to April. Also note that the Work in Process account contains the
same $30,000 balance. Thus, the Work in Process account summarizes all of the costs
appearing on the job cost sheets of the jobs that are in process. Job A was the only job
in process at the beginning of April, so the beginning balance in the Work in Process
account equals Job A’s beginning balance of $30,000 .
Labor Cost
In April, the employee time tickets included $60,000 recorded for direct labor and
$15,000 for indirect labor. The following entry summarizes these costs:
(3)Work in Process . . . . . . . . . . . . . . . . . . . . . . . . . . . . . . . . . . . . . . 60,000Manufacturing Overhead . . . . . . . . . . . . . . . . . . . . . . . . . . . . . . . 15,000 Salaries and Wages Payable . . . . . . . . . . . . . . . . . . . . . . . . . . 75,000
Only the direct labor cost of $60,000 is added to the Work in Process account. At the
same time that direct labor costs are added to Work in Process, they are also added to the
individual job cost sheets, as shown in Exhibit 3–7 . During April, $40,000 of direct labor
cost was charged to Job A and the remaining $20,000 was charged to Job B.
The labor costs charged to Manufacturing Overhead ($15,000) represent the indirect
labor costs of the period, such as supervision, janitorial work, and maintenance.
Directmaterials
Indirectmaterials
Materials Requisition Forms$52,000
Job Cost Sheet Job A
Balance. . . . . . . . . . $30,000Direct materials. . . $28,000
Job Cost Sheet Job B
Balance. . . . . . . . . . $0Direct materials. . . $22,000
Raw Materials
Bal.(1)
7,00060,000
(2) 52,000
Manufacturing Overhead
(2) 2,000
Work in Process
Bal.(2)
30,00050,000
gar11005_ch03_083-140.indd 95gar11005_ch03_083-140.indd 95 11/11/10 11:28 AM11/11/10 11:28 AM
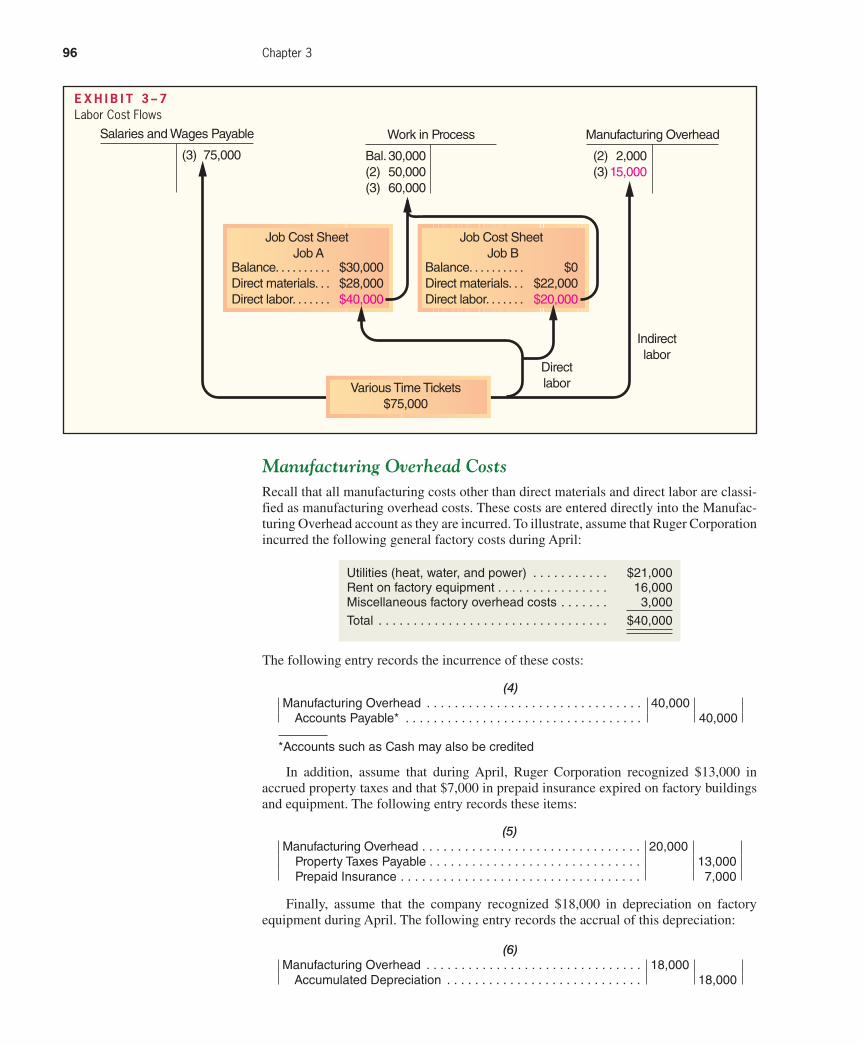
Rev.Confi rming Pages
96 Chapter 3
Manufacturing Overhead Costs
Recall that all manufacturing costs other than direct materials and direct labor are classi-
fied as manufacturing overhead costs. These costs are entered directly into the Manufac-
turing Overhead account as they are incurred. To illustrate, assume that Ruger Corporation
incurred the following general factory costs during April:
Utilities (heat, water, and power) . . . . . . . . . . . $21,000Rent on factory equipment . . . . . . . . . . . . . . . . 16,000Miscellaneous factory overhead costs . . . . . . . 3,000
Total . . . . . . . . . . . . . . . . . . . . . . . . . . . . . . . . . $40,000
The following entry records the incurrence of these costs:
(4)Manufacturing Overhead . . . . . . . . . . . . . . . . . . . . . . . . . . . . . . . 40,000 Accounts Payable* . . . . . . . . . . . . . . . . . . . . . . . . . . . . . . . . . . 40,000
* Accounts such as Cash may also be credited
(5)Manufacturing Overhead . . . . . . . . . . . . . . . . . . . . . . . . . . . . . . . 20,000 Property Taxes Payable . . . . . . . . . . . . . . . . . . . . . . . . . . . . . . 13,000 Prepaid Insurance . . . . . . . . . . . . . . . . . . . . . . . . . . . . . . . . . . 7,000
Finally, assume that the company recognized $18,000 in depreciation on factory
equipment during April. The following entry records the accrual of this depreciation:
(6)Manufacturing Overhead . . . . . . . . . . . . . . . . . . . . . . . . . . . . . . . 18,000 Accumulated Depreciation . . . . . . . . . . . . . . . . . . . . . . . . . . . . 18,000
E X H I B I T 3 – 7 Labor Cost Flows
In addition, assume that during April, Ruger Corporation recognized $13,000 in
accrued property taxes and that $7,000 in prepaid insurance expired on factory buildings
and equipment. The following entry records these items:
Directlabor
Indirectlabor
Salaries and Wages Payable
(3) 75,000
Manufacturing Overhead
(2)(3)
2,00015,000
Various Time Tickets$75,000
Work in Process
Bal.(2)(3)
30,00050,00060,000
Job Cost Sheet Job A
Balance. . . . . . . . . . $30,000Direct materials. . . $28,000Direct labor. . . . . . . $40,000
Job Cost Sheet Job B
Balance. . . . . . . . . . $0Direct materials. . . $22,000Direct labor. . . . . . . $20,000
gar11005_ch03_083-140.indd 96gar11005_ch03_083-140.indd 96 11/11/10 11:28 AM11/11/10 11:28 AM
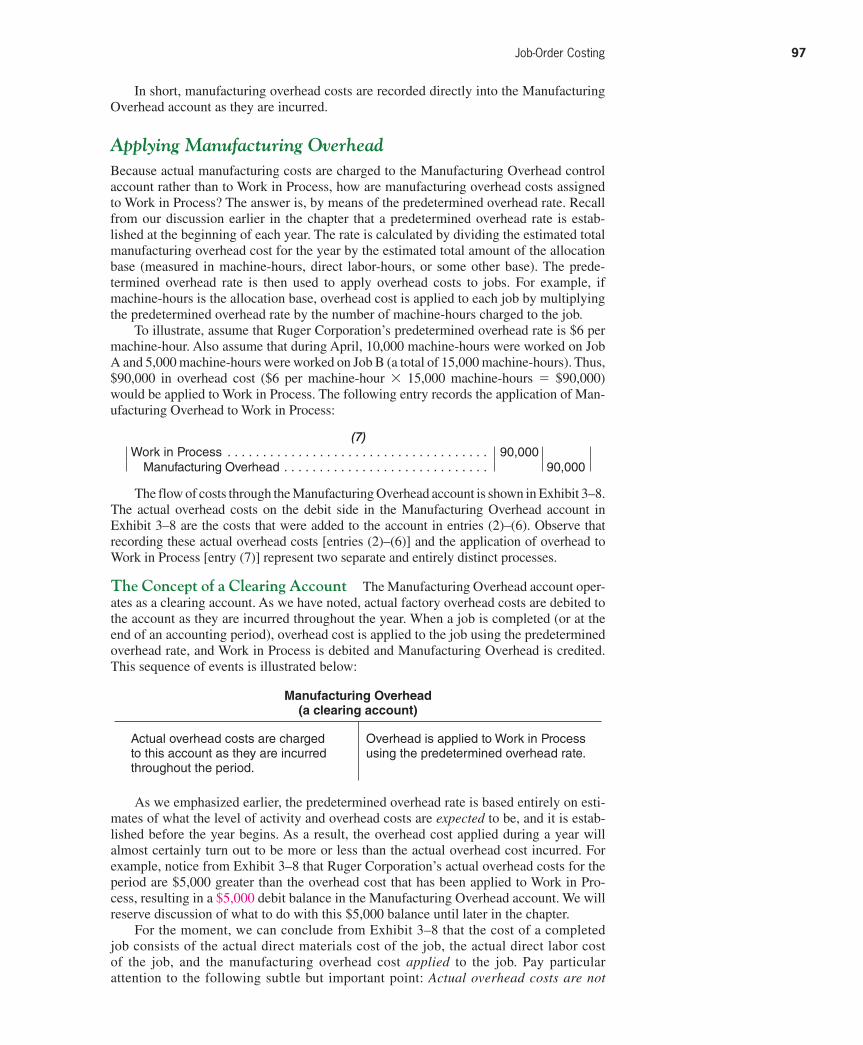
Rev.Confi rming Pages
Job-Order Costing 97
In short, manufacturing overhead costs are recorded directly into the Manufacturing
Overhead account as they are incurred.
Applying Manufacturing Overhead
Because actual manufacturing costs are charged to the Manufacturing Overhead control
account rather than to Work in Process, how are manufacturing overhead costs assigned
to Work in Process? The answer is, by means of the predetermined overhead rate. Recall
from our discussion earlier in the chapter that a predetermined overhead rate is estab-
lished at the beginning of each year. The rate is calculated by dividing the estimated total
manufacturing overhead cost for the year by the estimated total amount of the allocation
base (measured in machine-hours, direct labor-hours, or some other base). The prede-
termined overhead rate is then used to apply overhead costs to jobs. For example, if
machine-hours is the allocation base, overhead cost is applied to each job by multiplying
the predetermined overhead rate by the number of machine-hours charged to the job.
To illustrate, assume that Ruger Corporation’s predetermined overhead rate is $6 per
machine-hour. Also assume that during April, 10,000 machine-hours were worked on Job
A and 5,000 machine-hours were worked on Job B (a total of 15,000 machine-hours). Thus,
$90,000 in overhead cost ($6 per machine-hour × 15,000 machine-hours = $90,000)
would be applied to Work in Process. The following entry records the application of Man-
ufacturing Overhead to Work in Process:
(7)Work in Process . . . . . . . . . . . . . . . . . . . . . . . . . . . . . . . . . . . . . 90,000 Manufacturing Overhead . . . . . . . . . . . . . . . . . . . . . . . . . . . . . 90,000
The flow of costs through the Manufacturing Overhead account is shown in Exhibit 3–8 .
The actual overhead costs on the debit side in the Manufacturing Overhead account in
Exhibit 3–8 are the costs that were added to the account in entries (2)–(6). Observe that
recording these actual overhead costs [entries (2)–(6)] and the application of overhead to
Work in Process [entry (7)] represent two separate and entirely distinct processes.
The Concept of a Clearing Account The Manufacturing Overhead account oper-
ates as a clearing account. As we have noted, actual factory overhead costs are debited to
the account as they are incurred throughout the year. When a job is completed (or at the
end of an accounting period), overhead cost is applied to the job using the predetermined
overhead rate, and Work in Process is debited and Manufacturing Overhead is credited.
This sequence of events is illustrated below:
Manufacturing Overhead (a clearing account)
Actual overhead costs are charged to this account as they are incurred throughout the period.
Overhead is applied to Work in Process using the predetermined overhead rate.
As we emphasized earlier, the predetermined overhead rate is based entirely on esti-
mates of what the level of activity and overhead costs are expected to be, and it is estab-
lished before the year begins. As a result, the overhead cost applied during a year will
almost certainly turn out to be more or less than the actual overhead cost incurred. For
example, notice from Exhibit 3–8 that Ruger Corporation’s actual overhead costs for the
period are $5,000 greater than the overhead cost that has been applied to Work in Pro-
cess, resulting in a $5,000 debit balance in the Manufacturing Overhead account. We will
reserve discussion of what to do with this $5,000 balance until later in the chapter.
For the moment, we can conclude from Exhibit 3–8 that the cost of a completed
job consists of the actual direct materials cost of the job, the actual direct labor cost
of the job, and the manufacturing overhead cost applied to the job. Pay particular
attention to the following subtle but important point: Actual overhead costs are not
gar11005_ch03_083-140.indd 97gar11005_ch03_083-140.indd 97 11/11/10 11:28 AM11/11/10 11:28 AM

Rev.Confi rming Pages
98 Chapter 3
charged to jobs; actual overhead costs do not appear on the job cost sheet nor do they appear in the Work in Process account. Only the applied overhead cost, based on the predetermined overhead rate, appears on the job cost sheet and in the Work in Process account.
Nonmanufacturing Costs
In addition to manufacturing costs, companies also incur selling and administrative costs.
These costs should be treated as period expenses and charged directly to the income
statement. Nonmanufacturing costs should not go into the Manufacturing Overhead account. To illustrate the correct treatment of nonmanufacturing costs, assume that Ruger
Corporation incurred $30,000 in selling and administrative salary costs during April. The
following entry summarizes the accrual of those salaries:
Pay particular attention to the difference between this entry and entry (6) where we
recorded depreciation on factory equipment. In journal entry (6), depreciation on fac-
tory equipment was debited to Manufacturing Overhead and is therefore a product cost.
In journal entry (9) above, depreciation on office equipment is debited to Depreciation
Expense. Depreciation on office equipment is a period expense rather than a product cost.
Finally, assume that advertising was $42,000 and that other selling and administra-
tive expenses in April totaled $8,000. The following entry records these items:
E X H I B I T 3 – 8 The Flow of Costs in Overhead Application
(8)Salaries Expense . . . . . . . . . . . . . . . . . . . . . . . . . . . . . . . . . . . . 30,000 Salaries and Wages Payable . . . . . . . . . . . . . . . . . . . . . . . . . . 30,000
(9)Depreciation Expense . . . . . . . . . . . . . . . . . . . . . . . . . . . . . . . . . 7,000 Accumulated Depreciation . . . . . . . . . . . . . . . . . . . . . . . . . . . . 7,000
Assume that depreciation on office equipment during April was $7,000. The entry is
as follows:
Work in Process
Bal.(2)(3)(7)
30,00050,00060,00090,000
Manufacturing Overhead
Actualoverhead
costs
Balance
(2)(3)(4)(5)(6)
2,00015,00040,00020,00018,000
95,0005,000
Appliedoverhead
costs
90,000(7)
90,000
Job Cost Sheet Job A
Job Cost Sheet Job B
Balance. . . . . . . . . . . . . . . . . . $ 30,000Direct materials. . . . . . . . . . . $28,000Direct labor. . . . . . . . . . . . . . . $40,000Manufacturing overhead. . . $60,000Total. . . . . . . . . . . . . . . . . . . . . $158,000
Balance. . . . . . . . . . . . . . . . . . . $ 0Direct materials. . . . . . . . . . . . $22,000Direct labor. . . . . . . . . . . . . . . . $20,000Manufacturing overhead. . . $30,000Total. . . . . . . . . . . . . . . . . . . . . . $72,000
Overhead Applied to Work in Process
$6 per machine-hour 3 15,000 machine-hours = $90,000
gar11005_ch03_083-140.indd 98gar11005_ch03_083-140.indd 98 11/11/10 11:28 AM11/11/10 11:28 AM
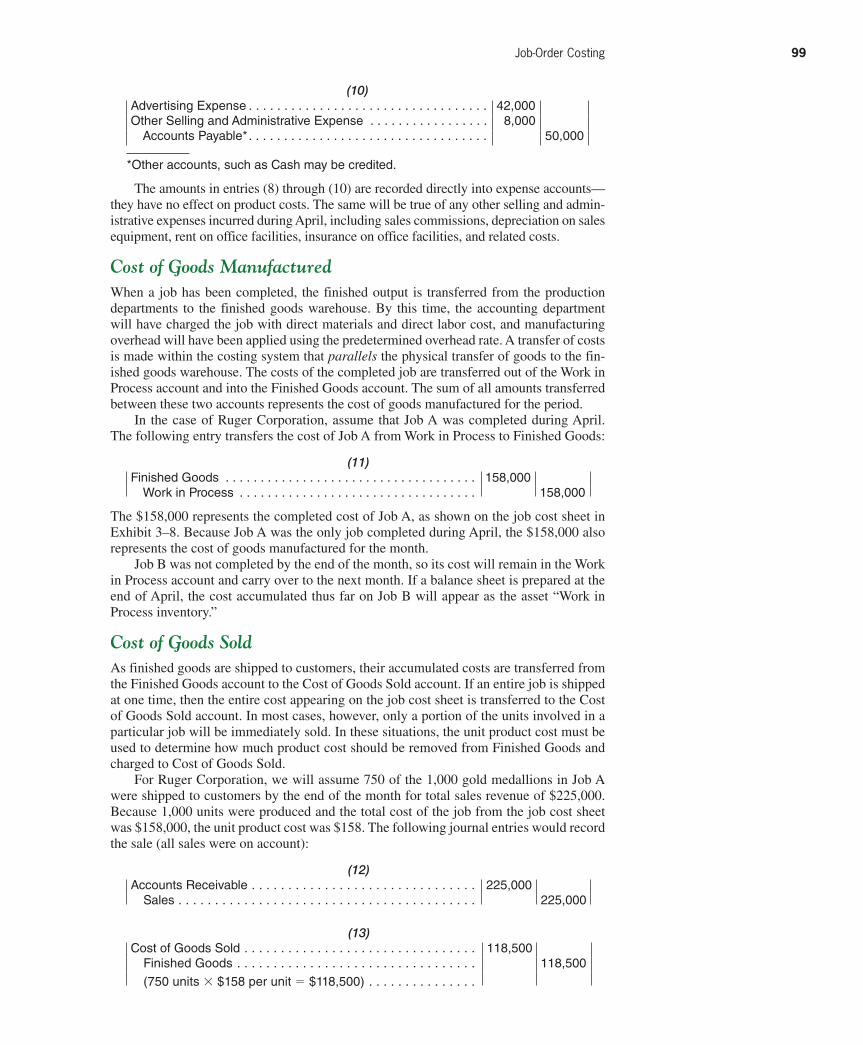
Rev.Confi rming Pages
Job-Order Costing 99
(10)Advertising Expense . . . . . . . . . . . . . . . . . . . . . . . . . . . . . . . . . . 42,000Other Selling and Administrative Expense . . . . . . . . . . . . . . . . . 8,000 Accounts Payable*. . . . . . . . . . . . . . . . . . . . . . . . . . . . . . . . . . 50,000
* Other accounts, such as Cash may be credited.
The amounts in entries (8) through (10) are recorded directly into expense accounts—
they have no effect on product costs. The same will be true of any other selling and admin-
istrative expenses incurred during April, including sales commissions, depreciation on sales
equipment, rent on office facilities, insurance on office facilities, and related costs.
Cost of Goods Manufactured
When a job has been completed, the finished output is transferred from the production
departments to the finished goods warehouse. By this time, the accounting department
will have charged the job with direct materials and direct labor cost, and manufacturing
overhead will have been applied using the predetermined overhead rate. A transfer of costs
is made within the costing system that parallels the physical transfer of goods to the fin-
ished goods warehouse. The costs of the completed job are transferred out of the Work in
Process account and into the Finished Goods account. The sum of all amounts transferred
between these two accounts represents the cost of goods manufactured for the period.
In the case of Ruger Corporation, assume that Job A was completed during April.
The following entry transfers the cost of Job A from Work in Process to Finished Goods:
(11)Finished Goods . . . . . . . . . . . . . . . . . . . . . . . . . . . . . . . . . . . . 158,000 Work in Process . . . . . . . . . . . . . . . . . . . . . . . . . . . . . . . . . . 158,000
The $158,000 represents the completed cost of Job A, as shown on the job cost sheet in
Exhibit 3–8 . Because Job A was the only job completed during April, the $158,000 also
represents the cost of goods manufactured for the month.
Job B was not completed by the end of the month, so its cost will remain in the Work
in Process account and carry over to the next month. If a balance sheet is prepared at the
end of April, the cost accumulated thus far on Job B will appear as the asset “Work in
Process inventory.”
Cost of Goods Sold
As finished goods are shipped to customers, their accumulated costs are transferred from
the Finished Goods account to the Cost of Goods Sold account. If an entire job is shipped
at one time, then the entire cost appearing on the job cost sheet is transferred to the Cost
of Goods Sold account. In most cases, however, only a portion of the units involved in a
particular job will be immediately sold. In these situations, the unit product cost must be
used to determine how much product cost should be removed from Finished Goods and
charged to Cost of Goods Sold.
For Ruger Corporation, we will assume 750 of the 1,000 gold medallions in Job A
were shipped to customers by the end of the month for total sales revenue of $225,000.
Because 1,000 units were produced and the total cost of the job from the job cost sheet
was $158,000, the unit product cost was $158. The following journal entries would record
the sale (all sales were on account):
(12)Accounts Receivable . . . . . . . . . . . . . . . . . . . . . . . . . . . . . . . 225,000 Sales . . . . . . . . . . . . . . . . . . . . . . . . . . . . . . . . . . . . . . . . . 225,000
(13)Cost of Goods Sold . . . . . . . . . . . . . . . . . . . . . . . . . . . . . . . . 118,500 Finished Goods . . . . . . . . . . . . . . . . . . . . . . . . . . . . . . . . . 118,500
(750 units × $158 per unit = $118,500) . . . . . . . . . . . . . . .
gar11005_ch03_083-140.indd 99gar11005_ch03_083-140.indd 99 11/11/10 11:28 AM11/11/10 11:28 AM
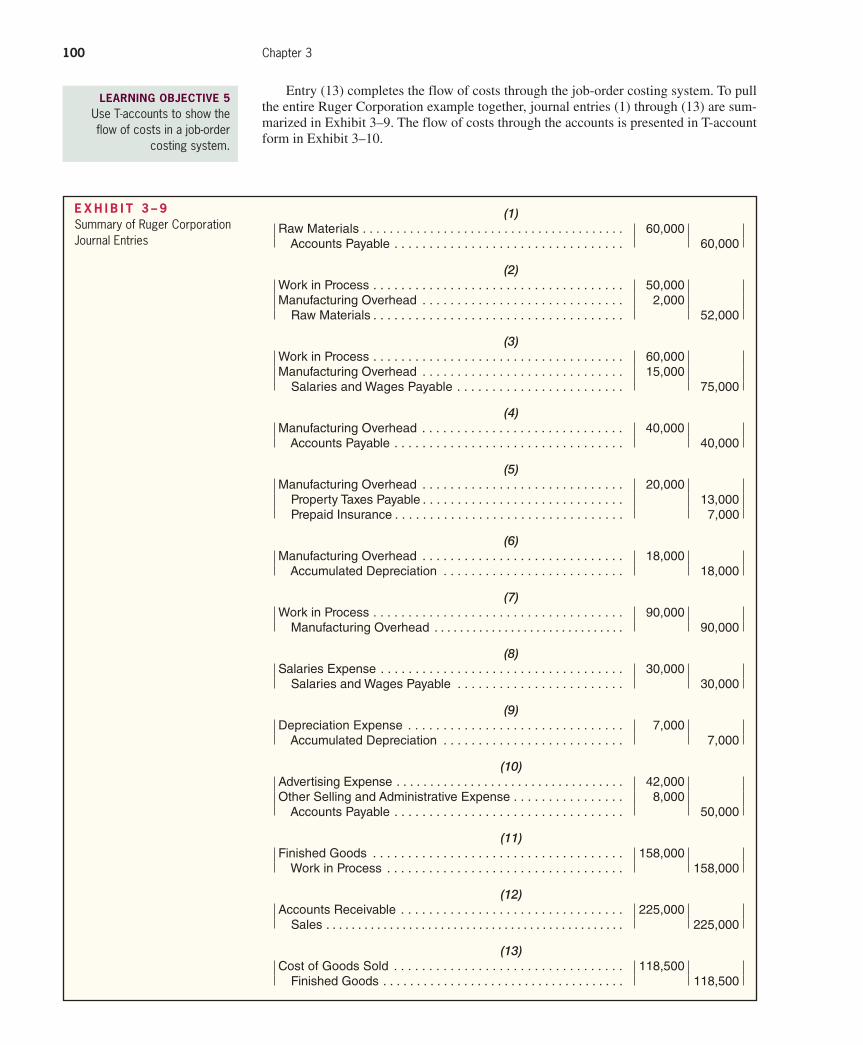
Rev.Confi rming Pages
100 Chapter 3
Entry (13) completes the flow of costs through the job-order costing system. To pull
the entire Ruger Corporation example together, journal entries (1) through (13) are sum-
marized in Exhibit 3–9 . The flow of costs through the accounts is presented in T-account
form in Exhibit 3–10 .
LEARNING OBJECTIVE 5 Use T-accounts to show the flow of costs in a job-order
costing system.
E X H I B I T 3 – 9 Summary of Ruger Corporation Journal Entries
(1)Raw Materials . . . . . . . . . . . . . . . . . . . . . . . . . . . . . . . . . . . . . . . 60,000 Accounts Payable . . . . . . . . . . . . . . . . . . . . . . . . . . . . . . . . . 60,000
(2)Work in Process . . . . . . . . . . . . . . . . . . . . . . . . . . . . . . . . . . . . 50,000Manufacturing Overhead . . . . . . . . . . . . . . . . . . . . . . . . . . . . . 2,000 Raw Materials . . . . . . . . . . . . . . . . . . . . . . . . . . . . . . . . . . . . 52,000
(3)Work in Process . . . . . . . . . . . . . . . . . . . . . . . . . . . . . . . . . . . . 60,000Manufacturing Overhead . . . . . . . . . . . . . . . . . . . . . . . . . . . . . 15,000 Salaries and Wages Payable . . . . . . . . . . . . . . . . . . . . . . . . 75,000
(4)Manufacturing Overhead . . . . . . . . . . . . . . . . . . . . . . . . . . . . . 40,000 Accounts Payable . . . . . . . . . . . . . . . . . . . . . . . . . . . . . . . . . 40,000
(5)Manufacturing Overhead . . . . . . . . . . . . . . . . . . . . . . . . . . . . . 20,000 Property Taxes Payable . . . . . . . . . . . . . . . . . . . . . . . . . . . . . 13,000 Prepaid Insurance . . . . . . . . . . . . . . . . . . . . . . . . . . . . . . . . . 7,000
(6)Manufacturing Overhead . . . . . . . . . . . . . . . . . . . . . . . . . . . . . 18,000 Accumulated Depreciation . . . . . . . . . . . . . . . . . . . . . . . . . . 18,000
(7)Work in Process . . . . . . . . . . . . . . . . . . . . . . . . . . . . . . . . . . . . 90,000 Manufacturing Overhead . . . . . . . . . . . . . . . . . . . . . . . . . . . . . . 90,000
(8)Salaries Expense . . . . . . . . . . . . . . . . . . . . . . . . . . . . . . . . . . . 30,000 Salaries and Wages Payable . . . . . . . . . . . . . . . . . . . . . . . . 30,000
(9)Depreciation Expense . . . . . . . . . . . . . . . . . . . . . . . . . . . . . . . 7,000 Accumulated Depreciation . . . . . . . . . . . . . . . . . . . . . . . . . . 7,000
(10)Advertising Expense . . . . . . . . . . . . . . . . . . . . . . . . . . . . . . . . . . 42,000Other Selling and Administrative Expense . . . . . . . . . . . . . . . . 8,000 Accounts Payable . . . . . . . . . . . . . . . . . . . . . . . . . . . . . . . . . 50,000
(11)Finished Goods . . . . . . . . . . . . . . . . . . . . . . . . . . . . . . . . . . . . 158,000 Work in Process . . . . . . . . . . . . . . . . . . . . . . . . . . . . . . . . . . 158,000
(12)Accounts Receivable . . . . . . . . . . . . . . . . . . . . . . . . . . . . . . . . 225,000 Sales . . . . . . . . . . . . . . . . . . . . . . . . . . . . . . . . . . . . . . . . . . . . . . . 225,000
(13)Cost of Goods Sold . . . . . . . . . . . . . . . . . . . . . . . . . . . . . . . . . 118,500 Finished Goods . . . . . . . . . . . . . . . . . . . . . . . . . . . . . . . . . . . . 118,500
gar11005_ch03_083-140.indd 100gar11005_ch03_083-140.indd 100 11/11/10 11:28 AM11/11/10 11:28 AM
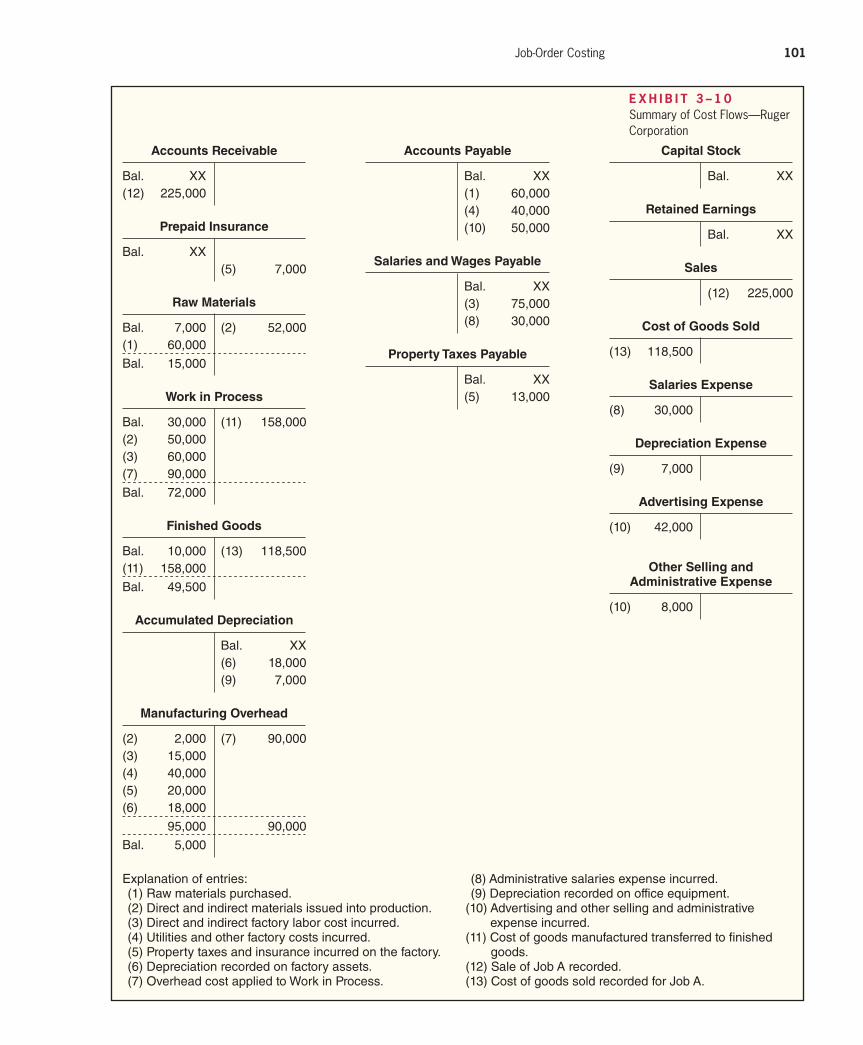
Rev.Confi rming Pages
Job-Order Costing 101
Accounts Receivable
Bal. XX(12) 225,000
Prepaid Insurance
Bal. XX (5) 7,000
Raw Materials
Bal. 7,000 (2) 52,000(1) 60,000
Bal. 15,000
Work in Process
Bal. 30,000 (11) 158,000(2) 50,000(3) 60,000(7) 90,000
Bal. 72,000
Finished Goods
Bal. 10,000 (13) 118,500(11) 158,000
Bal. 49,500
Accumulated Depreciation
Bal. XX (6) 18,000 (9) 7,000
Manufacturing Overhead
(2) 2,000 (7) 90,000(3) 15,000(4) 40,000(5) 20,000(6) 18,000
95,000 90,000
Bal. 5,000
Explanation of entries: (1) Raw materials purchased. (2) Direct and indirect materials issued into production. (3) Direct and indirect factory labor cost incurred. (4) Utilities and other factory costs incurred. (5) Property taxes and insurance incurred on the factory. (6) Depreciation recorded on factory assets. (7) Overhead cost applied to Work in Process.
(8) Administrative salaries expense incurred. (9) Depreciation recorded on office equipment. (10) Advertising and other selling and administrative
expense incurred. (11) Cost of goods manufactured transferred to fi nished
goods. (12) Sale of Job A recorded. (13) Cost of goods sold recorded for Job A.
E X H I B I T 3 – 1 0 Summary of Cost Flows—Ruger Corporation
Accounts Payable
Bal. XX (1) 60,000 (4) 40,000 (10) 50,000
Salaries and Wages Payable
Bal. XX (3) 75,000 (8) 30,000
Property Taxes Payable
Bal. XX (5) 13,000
Capital Stock
Bal. XX
Retained Earnings
Bal. XX
Sales
(12) 225,000
Cost of Goods Sold
(13) 118,500
Salaries Expense
(8) 30,000
Depreciation Expense
(9) 7,000
Advertising Expense
(10) 42,000
Other Selling and Administrative Expense
(10) 8,000
gar11005_ch03_083-140.indd 101gar11005_ch03_083-140.indd 101 11/11/10 11:28 AM11/11/10 11:28 AM
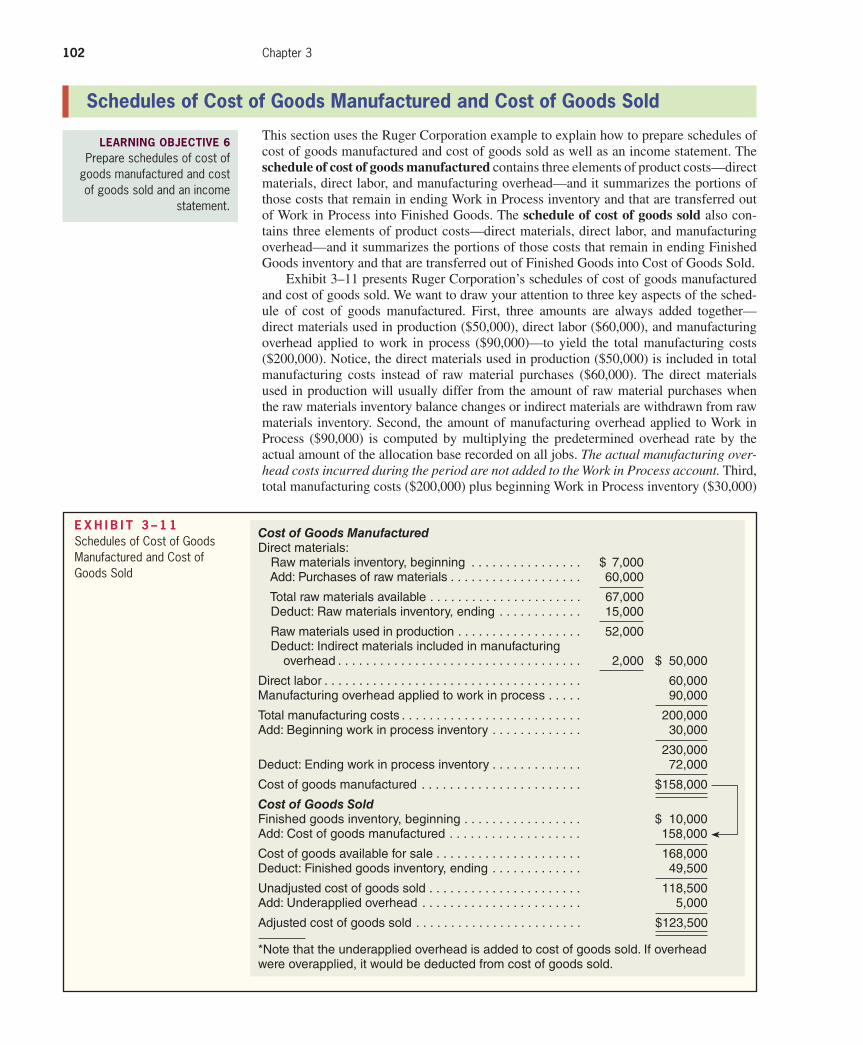
Rev.Confi rming Pages
102 Chapter 3
Schedules of Cost of Goods Manufactured and Cost of Goods Sold
This section uses the Ruger Corporation example to explain how to prepare schedules of
cost of goods manufactured and cost of goods sold as well as an income statement. The
schedule of cost of goods manufactured contains three elements of product costs—direct
materials, direct labor, and manufacturing overhead—and it summarizes the portions of
those costs that remain in ending Work in Process inventory and that are transferred out
of Work in Process into Finished Goods. The schedule of cost of goods sold also con-
tains three elements of product costs—direct materials, direct labor, and manufacturing
overhead—and it summarizes the portions of those costs that remain in ending Finished
Goods inventory and that are transferred out of Finished Goods into Cost of Goods Sold.
Exhibit 3–11 presents Ruger Corporation’s schedules of cost of goods manufactured
and cost of goods sold. We want to draw your attention to three key aspects of the sched-
ule of cost of goods manufactured. First, three amounts are always added together—
direct materials used in production ($50,000), direct labor ($60,000), and manufacturing
overhead applied to work in process ($90,000)—to yield the total manufacturing costs
($200,000). Notice, the direct materials used in production ($50,000) is included in total
manufacturing costs instead of raw material purchases ($60,000). The direct materials
used in production will usually differ from the amount of raw material purchases when
the raw materials inventory balance changes or indirect materials are withdrawn from raw
materials inventory. Second, the amount of manufacturing overhead applied to Work in
Process ($90,000) is computed by multiplying the predetermined overhead rate by the
actual amount of the allocation base recorded on all jobs. The actual manufacturing over-head costs incurred during the period are not added to the Work in Process account. Third,
total manufacturing costs ($200,000) plus beginning Work in Process inventory ($30,000)
LEARNING OBJECTIVE 6 Prepare schedules of cost of
goods manufactured and cost of goods sold and an income
statement.
Cost of Goods ManufacturedDirect materials: Raw materials inventory, beginning . . . . . . . . . . . . . . . . $ 7,000 Add: Purchases of raw materials . . . . . . . . . . . . . . . . . . . 60,000
Total raw materials available . . . . . . . . . . . . . . . . . . . . . . 67,000 Deduct: Raw materials inventory, ending . . . . . . . . . . . . 15,000
Raw materials used in production . . . . . . . . . . . . . . . . . . 52,000 Deduct: Indirect materials included in manufacturing overhead . . . . . . . . . . . . . . . . . . . . . . . . . . . . . . . . . . . 2,000 $ 50,000
Direct labor . . . . . . . . . . . . . . . . . . . . . . . . . . . . . . . . . . . . . 60,000Manufacturing overhead applied to work in process . . . . . 90,000
Total manufacturing costs . . . . . . . . . . . . . . . . . . . . . . . . . . 200,000Add: Beginning work in process inventory . . . . . . . . . . . . . 30,000
230,000Deduct: Ending work in process inventory . . . . . . . . . . . . . 72,000
Cost of goods manufactured . . . . . . . . . . . . . . . . . . . . . . . $158,000
Cost of Goods SoldFinished goods inventory, beginning . . . . . . . . . . . . . . . . . $ 10,000Add: Cost of goods manufactured . . . . . . . . . . . . . . . . . . . 158,000
Cost of goods available for sale . . . . . . . . . . . . . . . . . . . . . 168,000Deduct: Finished goods inventory, ending . . . . . . . . . . . . . 49,500
Unadjusted cost of goods sold . . . . . . . . . . . . . . . . . . . . . . 118,500Add: Underapplied overhead . . . . . . . . . . . . . . . . . . . . . . . 5,000
Adjusted cost of goods sold . . . . . . . . . . . . . . . . . . . . . . . . $123,500
*Note that the underapplied overhead is added to cost of goods sold. If overhead were overapplied, it would be deducted from cost of goods sold.
E X H I B I T 3 – 1 1 Schedules of Cost of Goods Manufactured and Cost of Goods Sold
gar11005_ch03_083-140.indd 102gar11005_ch03_083-140.indd 102 11/11/10 11:28 AM11/11/10 11:28 AM
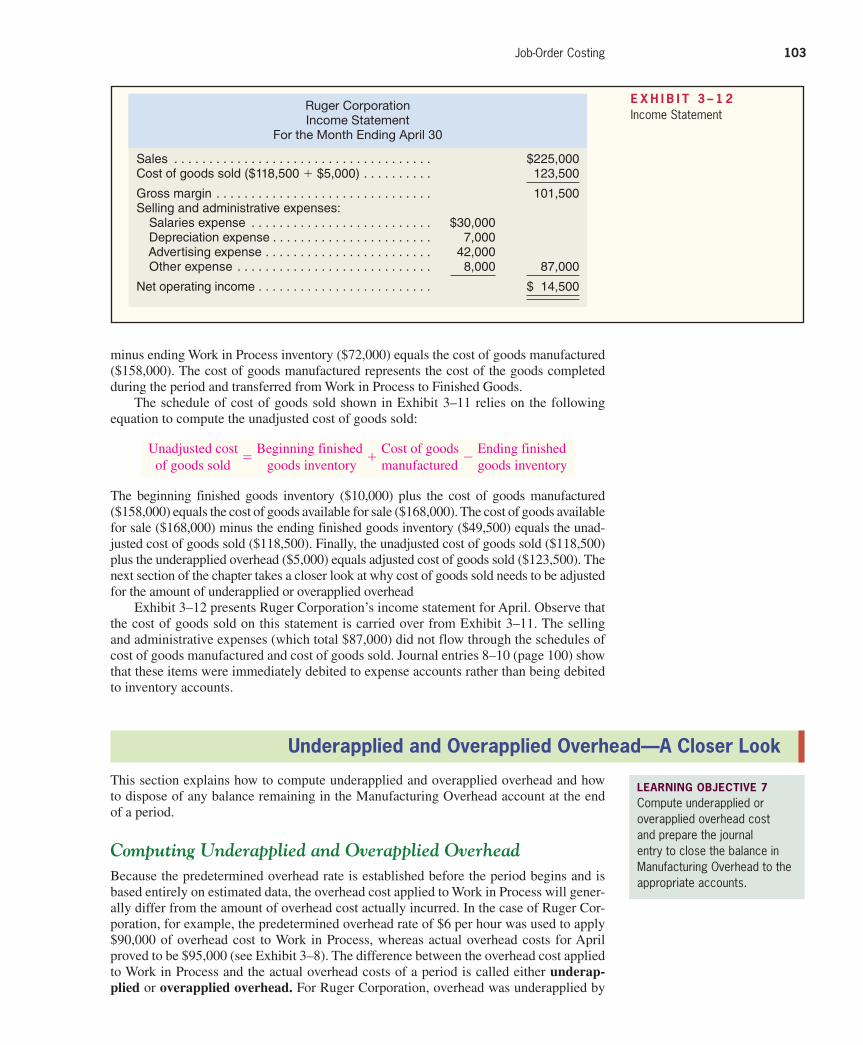
Rev.Confi rming Pages
Job-Order Costing 103
minus ending Work in Process inventory ($72,000) equals the cost of goods manufactured
($158,000). The cost of goods manufactured represents the cost of the goods completed
during the period and transferred from Work in Process to Finished Goods.
The schedule of cost of goods sold shown in Exhibit 3–11 relies on the following
equation to compute the unadjusted cost of goods sold:
Unadjusted cost
of goods sold
= Beginning finished
goods inventory
+ Cost of goods
manufactured
− Ending finished
goods inventory
The beginning finished goods inventory ($10,000) plus the cost of goods manufactured
($158,000) equals the cost of goods available for sale ($168,000). The cost of goods available
for sale ($168,000) minus the ending finished goods inventory ($49,500) equals the unad-
justed cost of goods sold ($118,500). Finally, the unadjusted cost of goods sold ($118,500)
plus the underapplied overhead ($5,000) equals adjusted cost of goods sold ($123,500). The
next section of the chapter takes a closer look at why cost of goods sold needs to be adjusted
for the amount of underapplied or overapplied overhead
Exhibit 3–12 presents Ruger Corporation’s income statement for April. Observe that
the cost of goods sold on this statement is carried over from Exhibit 3–11 . The selling
and administrative expenses (which total $87,000) did not flow through the schedules of
cost of goods manufactured and cost of goods sold. Journal entries 8–10 (page 100) show
that these items were immediately debited to expense accounts rather than being debited
to inventory accounts.
Ruger CorporationIncome Statement
For the Month Ending April 30
Sales . . . . . . . . . . . . . . . . . . . . . . . . . . . . . . . . . . . . . $225,000 Cost of goods sold ($118,500 + $5,000) . . . . . . . . . . 123,500
Gross margin . . . . . . . . . . . . . . . . . . . . . . . . . . . . . . . 101,500 Selling and administrative expenses: Salaries expense . . . . . . . . . . . . . . . . . . . . . . . . . . $30,000 Depreciation expense . . . . . . . . . . . . . . . . . . . . . . . 7,000 Advertising expense . . . . . . . . . . . . . . . . . . . . . . . . 42,000 Other expense . . . . . . . . . . . . . . . . . . . . . . . . . . . . 8,000 87,000
Net operating income . . . . . . . . . . . . . . . . . . . . . . . . . $ 14,500
E X H I B I T 3 – 1 2 Income Statement
Underapplied and Overapplied Overhead—A Closer Look
This section explains how to compute underapplied and overapplied overhead and how
to dispose of any balance remaining in the Manufacturing Overhead account at the end
of a period.
Computing Underapplied and Overapplied Overhead
Because the predetermined overhead rate is established before the period begins and is
based entirely on estimated data, the overhead cost applied to Work in Process will gener-
ally differ from the amount of overhead cost actually incurred. In the case of Ruger Cor-
poration, for example, the predetermined overhead rate of $6 per hour was used to apply
$90,000 of overhead cost to Work in Process, whereas actual overhead costs for April
proved to be $95,000 (see Exhibit 3–8 ). The difference between the overhead cost applied
to Work in Process and the actual overhead costs of a period is called either underap-plied or overapplied overhead . For Ruger Corporation, overhead was underapplied by
LEARNING OBJECTIVE 7 Compute underapplied or overapplied overhead cost and prepare the journal entry to close the balance in Manufacturing Overhead to the appropriate accounts.
gar11005_ch03_083-140.indd 103gar11005_ch03_083-140.indd 103 11/11/10 11:28 AM11/11/10 11:28 AM
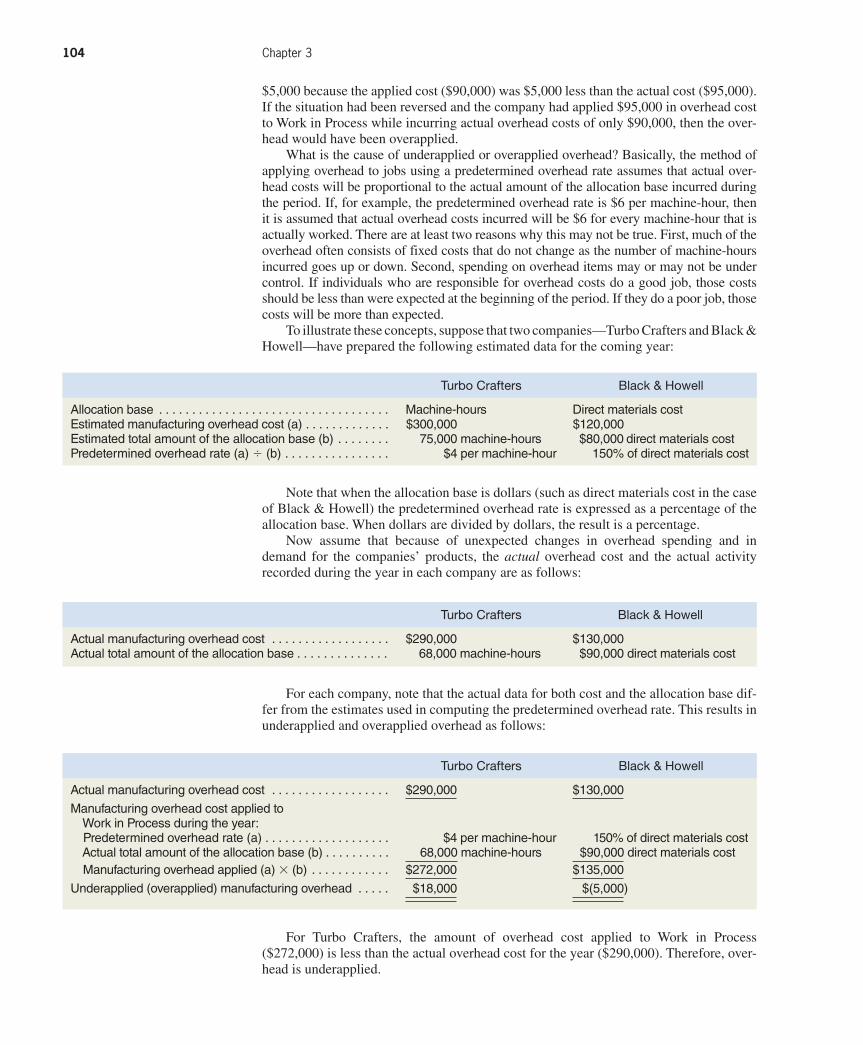
Rev.Confi rming Pages
104 Chapter 3
$5,000 because the applied cost ($90,000) was $5,000 less than the actual cost ($95,000).
If the situation had been reversed and the company had applied $95,000 in overhead cost
to Work in Process while incurring actual overhead costs of only $90,000, then the over-
head would have been overapplied.
What is the cause of underapplied or overapplied overhead? Basically, the method of
applying overhead to jobs using a predetermined overhead rate assumes that actual over-
head costs will be proportional to the actual amount of the allocation base incurred during
the period. If, for example, the predetermined overhead rate is $6 per machine-hour, then
it is assumed that actual overhead costs incurred will be $6 for every machine-hour that is
actually worked. There are at least two reasons why this may not be true. First, much of the
overhead often consists of fixed costs that do not change as the number of machine-hours
incurred goes up or down. Second, spending on overhead items may or may not be under
control. If individuals who are responsible for overhead costs do a good job, those costs
should be less than were expected at the beginning of the period. If they do a poor job, those
costs will be more than expected.
To illustrate these concepts, suppose that two companies—Turbo Crafters and Black &
Howell—have prepared the following estimated data for the coming year:
Turbo Crafters Black & Howell
Allocation base . . . . . . . . . . . . . . . . . . . . . . . . . . . . . . . . . . . Machine-hours Direct materials costEstimated manufacturing overhead cost (a) . . . . . . . . . . . . . $300,000 $120,000Estimated total amount of the allocation base (b) . . . . . . . . 75,000 machine-hours $80,000 direct materials costPredetermined overhead rate (a) ÷ (b) . . . . . . . . . . . . . . . . $4 per machine-hour 150% of direct materials cost
Turbo Crafters Black & Howell
Actual manufacturing overhead cost . . . . . . . . . . . . . . . . . . $290,000 $130,000Actual total amount of the allocation base . . . . . . . . . . . . . . 68,000 machine-hours $90,000 direct materials cost
Turbo Crafters Black & Howell
Actual manufacturing overhead cost . . . . . . . . . . . . . . . . . . $290,000 $130,000
Manufacturing overhead cost applied to Work in Process during the year: Predetermined overhead rate (a) . . . . . . . . . . . . . . . . . . . $4 per machine-hour 150% of direct materials cost Actual total amount of the allocation base (b) . . . . . . . . . . 68,000 machine-hours $90,000 direct materials cost Manufacturing overhead applied (a) × (b) . . . . . . . . . . . . $272,000 $135,000
Underapplied (overapplied) manufacturing overhead . . . . . $18,000 $(5,000)
Note that when the allocation base is dollars (such as direct materials cost in the case
of Black & Howell) the predetermined overhead rate is expressed as a percentage of the
allocation base. When dollars are divided by dollars, the result is a percentage.
Now assume that because of unexpected changes in overhead spending and in
demand for the companies’ products, the actual overhead cost and the actual activity
recorded during the year in each company are as follows:
For each company, note that the actual data for both cost and the allocation base dif-
fer from the estimates used in computing the predetermined overhead rate. This results in
underapplied and overapplied overhead as follows:
For Turbo Crafters, the amount of overhead cost applied to Work in Process
($272,000) is less than the actual overhead cost for the year ($290,000). Therefore, over-
head is underapplied.
gar11005_ch03_083-140.indd 104gar11005_ch03_083-140.indd 104 11/11/10 11:28 AM11/11/10 11:28 AM

Rev.Confi rming Pages
Job-Order Costing 105
For Black & Howell, the amount of overhead cost applied to Work in Process
($135,000) is greater than the actual overhead cost for the year ($130,000), so overhead
is overapplied.
A summary of these concepts is presented in Exhibit 3–13 .
Disposition of Underapplied or Overapplied Overhead Balances
If we return to the Ruger Corporation example and look at the Manufacturing Overhead
T-account in Exhibit 3–10 , you will see that there is a debit balance of $5,000. Remember
that debit entries to the account represent actual overhead costs incurred, whereas credit
entries represent overhead costs applied to jobs. In this case, the actual overhead costs
incurred exceeded the overhead costs applied to jobs by $5,000—hence, the debit balance
of $5,000. This may sound familiar. We just discussed in the previous section the fact that
the overhead costs incurred ($95,000) exceeded the overhead costs applied ($90,000),
and that the difference is called underapplied overhead. These are just two ways of look-
ing at the same thing. If there is a debit balance in the Manufacturing Overhead account
of X dollars, then the overhead is underapplied by X dollars. On the other hand, if there
is a credit balance in the Manufacturing Overhead account of Y dollars, then the overhead
is overapplied by Y dollars. What do we do with the balance in the Manufacturing Over-
head account at the end of the accounting period?
The underapplied or overapplied balance remaining in the Manufacturing Overhead
account at the end of a period is treated in one of two ways:
1. Closed out to Cost of Goods Sold.
2. Allocated among the Work in Process, Finished Goods, and Cost of Goods Sold
accounts in proportion to the overhead applied during the current period in ending
balances.
Closed Out to Cost of Goods Sold Closing out the balance in Manufacturing
Overhead to Cost of Goods Sold is simpler than the allocation method. In the Ruger
Corporation example, the entry to close the $5,000 of underapplied overhead to Cost of
Goods Sold is:
(14)Cost of Goods Sold . . . . . . . . . . . . . . . . . . . . . . . . . . . . . . . . . . . . . . 5,000 Manufacturing Overhead . . . . . . . . . . . . . . . . . . . . . . . . . . . . . . . . 5,000
E X H I B I T 3 – 1 3 Summary of Overhead Concepts
Predeterminedoverhead rate
Estimated totalmanufacturingoverhead cost
At the beginning of the period:
During the period:
At the end of the period:
Actual totalmanufacturingoverhead cost
Actual total amount of theallocation base incurred
during the period
Estimated totalamount of theallocation base
Totalmanufacturing
overhead applied
Underapplied(overapplied)
overhead
Predeterminedoverhead rate
Totalmanufacturing
overhead applied
4
3
2
5
5
5
gar11005_ch03_083-140.indd 105gar11005_ch03_083-140.indd 105 11/11/10 11:28 AM11/11/10 11:28 AM
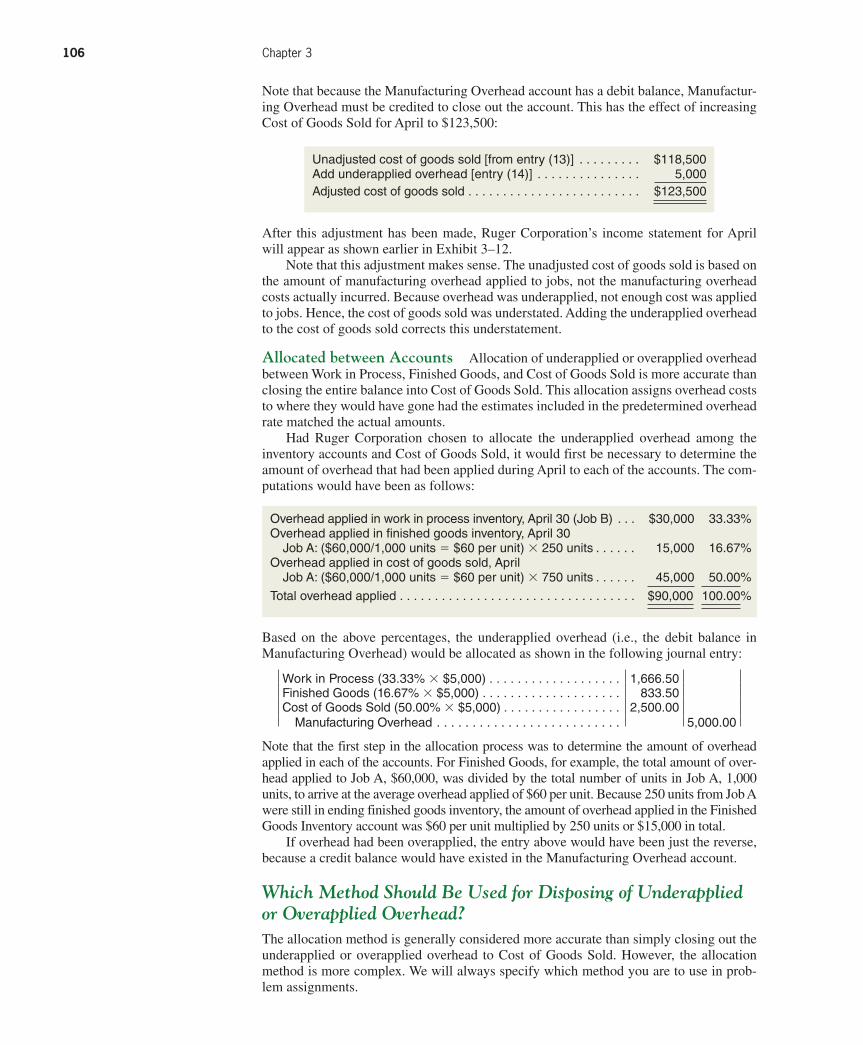
Rev.Confi rming Pages
106 Chapter 3
Note that because the Manufacturing Overhead account has a debit balance, Manufactur-
ing Overhead must be credited to close out the account. This has the effect of increasing
Cost of Goods Sold for April to $123,500:
Unadjusted cost of goods sold [from entry (13)] . . . . . . . . . $118,500Add underapplied overhead [entry (14)] . . . . . . . . . . . . . . . 5,000Adjusted cost of goods sold . . . . . . . . . . . . . . . . . . . . . . . . . $123,500
After this adjustment has been made, Ruger Corporation’s income statement for April
will appear as shown earlier in Exhibit 3–12 .
Note that this adjustment makes sense. The unadjusted cost of goods sold is based on
the amount of manufacturing overhead applied to jobs, not the manufacturing overhead
costs actually incurred. Because overhead was underapplied, not enough cost was applied
to jobs. Hence, the cost of goods sold was understated. Adding the underapplied overhead
to the cost of goods sold corrects this understatement.
Allocated between Accounts Allocation of underapplied or overapplied overhead
between Work in Process, Finished Goods, and Cost of Goods Sold is more accurate than
closing the entire balance into Cost of Goods Sold. This allocation assigns overhead costs
to where they would have gone had the estimates included in the predetermined overhead
rate matched the actual amounts.
Had Ruger Corporation chosen to allocate the underapplied overhead among the
inventory accounts and Cost of Goods Sold, it would first be necessary to determine the
amount of overhead that had been applied during April to each of the accounts. The com-
putations would have been as follows:
Overhead applied in work in process inventory, April 30 (Job B) . . . $30,000 33.33%Overhead applied in fi nished goods inventory, April 30 Job A: ($60,000/1,000 units = $60 per unit) × 250 units . . . . . . 15,000 16.67%Overhead applied in cost of goods sold, April Job A: ($60,000/1,000 units = $60 per unit) × 750 units . . . . . . 45,000 50.00%
Total overhead applied . . . . . . . . . . . . . . . . . . . . . . . . . . . . . . . . . . $90,000 100.00%
Based on the above percentages, the underapplied overhead (i.e., the debit balance in
Manufacturing Overhead) would be allocated as shown in the following journal entry:
Work in Process (33.33% × $5,000) . . . . . . . . . . . . . . . . . . . 1,666.50Finished Goods (16.67% × $5,000) . . . . . . . . . . . . . . . . . . . . 833.50Cost of Goods Sold (50.00% × $5,000) . . . . . . . . . . . . . . . . . 2,500.00 Manufacturing Overhead . . . . . . . . . . . . . . . . . . . . . . . . . . 5,000.00
Note that the first step in the allocation process was to determine the amount of overhead
applied in each of the accounts. For Finished Goods, for example, the total amount of over-
head applied to Job A, $60,000, was divided by the total number of units in Job A, 1,000
units, to arrive at the average overhead applied of $60 per unit. Because 250 units from Job A
were still in ending finished goods inventory, the amount of overhead applied in the Finished
Goods Inventory account was $60 per unit multiplied by 250 units or $15,000 in total.
If overhead had been overapplied, the entry above would have been just the reverse,
because a credit balance would have existed in the Manufacturing Overhead account.
Which Method Should Be Used for Disposing of Underapplied
or Overapplied Overhead?
The allocation method is generally considered more accurate than simply closing out the
underapplied or overapplied overhead to Cost of Goods Sold. However, the allocation
method is more complex. We will always specify which method you are to use in prob-
lem assignments.
gar11005_ch03_083-140.indd 106gar11005_ch03_083-140.indd 106 11/11/10 11:28 AM11/11/10 11:28 AM
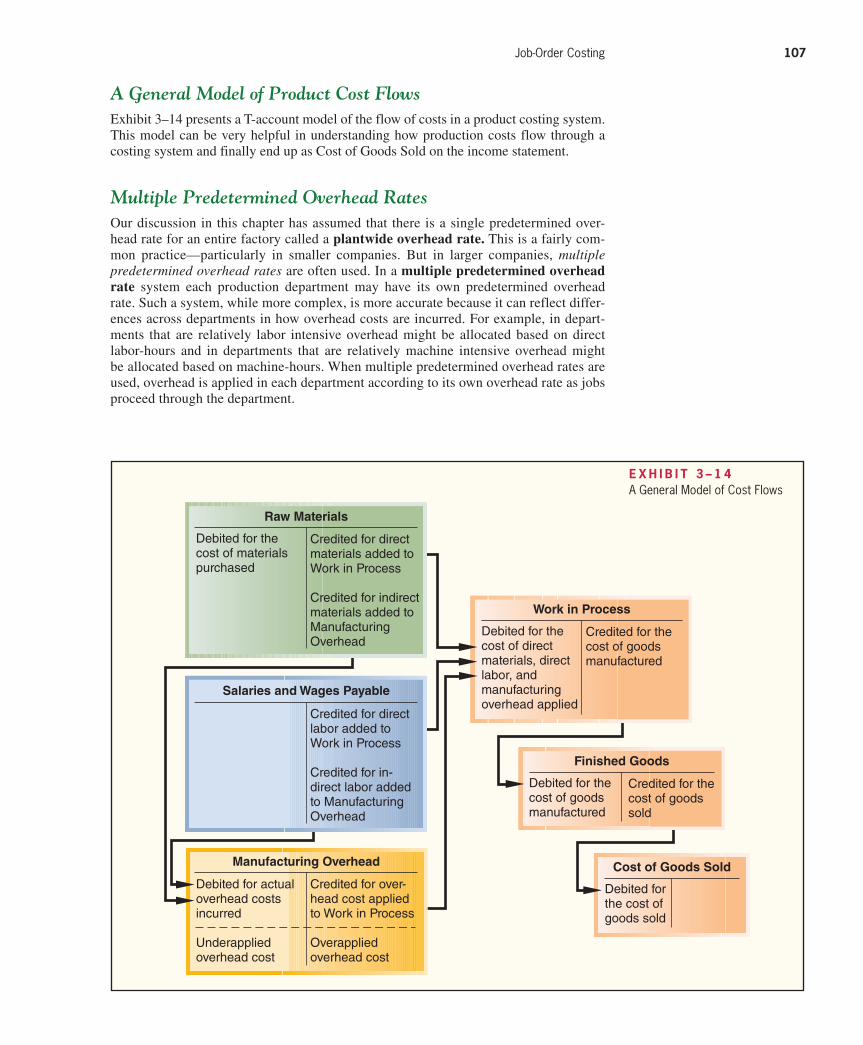
Rev.Confi rming Pages
Job-Order Costing 107
A General Model of Product Cost Flows
Exhibit 3–14 presents a T-account model of the flow of costs in a product costing system.
This model can be very helpful in understanding how production costs flow through a
costing system and finally end up as Cost of Goods Sold on the income statement.
Multiple Predetermined Overhead Rates
Our discussion in this chapter has assumed that there is a single predetermined over-
head rate for an entire factory called a plantwide overhead rate . This is a fairly com-
mon practice—particularly in smaller companies. But in larger companies, multiple predetermined overhead rates are often used. In a multiple predetermined overhead rate system each production department may have its own predetermined overhead
rate. Such a system, while more complex, is more accurate because it can reflect differ-
ences across departments in how overhead costs are incurred. For example, in depart-
ments that are relatively labor intensive overhead might be allocated based on direct
labor-hours and in departments that are relatively machine intensive overhead might
be allocated based on machine-hours. When multiple predetermined overhead rates are
used, overhead is applied in each department according to its own overhead rate as jobs
proceed through the department.
E X H I B I T 3 – 1 4 A General Model of Cost Flows
Work in Process
Debited for the cost of direct materials, direct labor, andmanufacturing overhead applied
Credited for the cost of goods manufactured
Finished Goods
Debited for thecost of goodsmanufactured
Credited for thecost of goods sold
Cost of Goods Sold
Debited for the cost of goods sold
Manufacturing Overhead
Debited for actual overhead costs incurred
Underappliedoverhead cost
Credited for over-head cost applied to Work in Process
Overappliedoverhead cost
Salaries and Wages Payable
Credited for direct labor added to Work in Process
Credited for in-direct labor added to Manufacturing Overhead
Raw Materials
Debited for the cost of materials purchased
Credited for direct materials added to Work in Process
Credited for indirect materials added toManufacturingOverhead
gar11005_ch03_083-140.indd 107gar11005_ch03_083-140.indd 107 11/11/10 11:28 AM11/11/10 11:28 AM
Rev.Confi rming Pages
108 Chapter 3
Job-order costing is used in situations where the organization offers many different products or
services, such as in furniture manufacturing, hospitals, and legal firms. Materials requisition forms
and labor time tickets are used to assign direct materials and direct labor costs to jobs in a job-
order costing system. Manufacturing overhead costs are assigned to jobs using a predetermined
overhead rate. All of the costs are recorded on a job cost sheet. The predetermined overhead rate
is determined before the period begins by dividing the estimated total manufacturing overhead
cost for the period by the estimated total amount of the allocation base for the period. The most
frequently used allocation bases are direct labor-hours and machine-hours. Overhead is applied to
jobs by multiplying the predetermined overhead rate by the actual amount of the allocation base
recorded for the job.
Because the predetermined overhead rate is based on estimates, the actual overhead cost
incurred during a period may be more or less than the amount of overhead cost applied to pro-
duction. Such a difference is referred to as underapplied or overapplied overhead. The underap-
plied or overapplied overhead for a period can be either closed out to Cost of Goods Sold or
allocated between Work in Process, Finished Goods, and Cost of Goods Sold. When overhead
is underapplied, manufacturing overhead costs have been understated and therefore inventories
and/or expenses must be adjusted upwards. When overhead is overapplied, manufacturing over-
head costs have been overstated and therefore inventories and/or expenses must be adjusted
downwards.
Summary
Job-Order Costing in Service Companies
Job-order costing is used in service organizations such as law firms, movie studios, hospi-
tals, and repair shops, as well as in manufacturing companies. In a law firm, for example,
each client is a “job,” and the costs of that job are accumulated day by day on a job cost
sheet as the client’s case is handled by the firm. Legal forms and similar inputs represent
the direct materials for the job; the time expended by attorneys is like direct labor; and the
costs of secretaries and legal aids, rent, depreciation, and so forth, represent the overhead.
In a movie studio such as Columbia Pictures, each film produced by the studio is a
“job,” and costs of direct materials (costumes, props, film, etc.) and direct labor (actors,
directors, and extras) are charged to each film’s job cost sheet. A share of the studio’s
overhead costs, such as utilities, depreciation of equipment, wages of maintenance work-
ers, and so forth, is also charged to each film.
In sum, job-order costing is a versatile and widely used costing method that may be
encountered in virtually any organization that provides diverse products or services.
I N B U S I N E S S MANAGING JOB COSTS IN A SERVICE BUSINESS IBM has created a software program called Professional Marketplace to match IBM employees with client needs. “Using Marketplace, IBM consultants working for customers can search through 100 job classifications and 10,000 skills, figuring out who inside IBM is available, where they are located and roughly how much it costs the company to use them.” Thus far, the results have been encouraging. IBM has reduced its reliance on outside contractors by 5% to 7% and its consultants spend more of their time in billable work. Furthermore, IBM’s senior consultants can search across the globe for available employees with particular niche skills with the click of a mouse instead of having to rely on numerous time-consuming phone calls and emails.
Source: Charles Forelle, “IBM Tool Deploys Employees Efficiently,” The Wall Street Journal, July 14, 2005, p. B3.
gar11005_ch03_083-140.indd 108gar11005_ch03_083-140.indd 108 11/11/10 11:28 AM11/11/10 11:28 AM

Rev.Confi rming Pages
Job-Order Costing 109
The company applies overhead cost to jobs on the basis of machine-hours worked. For the
current year, the company’s predetermined overhead rate was based on a cost formula that esti-
mated $450,000 of total manufacturing overhead for an estimated activity level of 75,000 machine-
hours. The following transactions were recorded for the year:
a. Raw materials were purchased on account, $410,000.
b. Raw materials were requisitioned for use in production, $380,000 ($360,000 direct materials
and $20,000 indirect materials).
c. The following costs were accrued for employee services: direct labor, $75,000; indirect labor,
$110,000; sales commissions, $90,000; and administrative salaries, $200,000.
d. Sales travel costs were $17,000.
e. Utility costs in the factory were $43,000.
f. Advertising costs were $180,000.
g. Depreciation was recorded for the year, $350,000 (80% relates to factory operations, and 20%
relates to selling and administrative activities).
h. Insurance expired during the year, $10,000 (70% relates to factory operations, and the remain-
ing 30% relates to selling and administrative activities).
i. Manufacturing overhead was applied to production. Due to greater than expected demand for
its products, the company worked 80,000 machine-hours on all jobs during the year.
j. Goods costing $900,000 to manufacture according to their job cost sheets were completed
during the year.
k. Goods were sold on account to customers during the year for a total of $1,500,000. The goods
cost $870,000 to manufacture according to their job cost sheets.
Required: 1. Prepare journal entries to record the preceding transactions.
2. Post the entries in (1) above to T-accounts (don’t forget to enter the beginning balances in the
inventory accounts).
3. Is Manufacturing Overhead underapplied or overapplied for the year? Prepare a journal entry
to close any balance in the Manufacturing Overhead account to Cost of Goods Sold. Do not
allocate the balance between ending inventories and Cost of Goods Sold.
4. Prepare an income statement for the year.
Solution to Review Problem 1. a. Raw Materials . . . . . . . . . . . . . . . . . . . . . . . . . . . . . . . . . . . 410,000
Accounts Payable . . . . . . . . . . . . . . . . . . . . . . . . . . . . . . 410,000
b. Work in Process . . . . . . . . . . . . . . . . . . . . . . . . . . . . . . . . . 360,000
Manufacturing Overhead . . . . . . . . . . . . . . . . . . . . . . . . . . 20,000
Raw Materials . . . . . . . . . . . . . . . . . . . . . . . . . . . . . . . . . 380,000
c. Work in Process . . . . . . . . . . . . . . . . . . . . . . . . . . . . . . . . . 75,000
Manufacturing Overhead . . . . . . . . . . . . . . . . . . . . . . . . . . 110,000
Sales Commissions Expense . . . . . . . . . . . . . . . . . . . . . . . 90,000
Administrative Salaries Expense . . . . . . . . . . . . . . . . . . . . 200,000
Salaries and Wages Payable . . . . . . . . . . . . . . . . . . . . . . 475,000
d. Sales Travel Expense . . . . . . . . . . . . . . . . . . . . . . . . . . . . . 17,000
Accounts Payable . . . . . . . . . . . . . . . . . . . . . . . . . . . . . . 17,000
e. Manufacturing Overhead . . . . . . . . . . . . . . . . . . . . . . . . . . 43,000
Accounts Payable . . . . . . . . . . . . . . . . . . . . . . . . . . . . . . 43,000
f. Advertising Expense . . . . . . . . . . . . . . . . . . . . . . . . . . . . . . 180,000
Accounts Payable . . . . . . . . . . . . . . . . . . . . . . . . . . . . . . 180,000
g. Manufacturing Overhead . . . . . . . . . . . . . . . . . . . . . . . . . . 280,000
Depreciation Expense . . . . . . . . . . . . . . . . . . . . . . . . . . . . . 70,000
Accumulated Depreciation . . . . . . . . . . . . . . . . . . . . . . . 350,000
Review Problem: Job-Order Costing
Hogle Corporation is a manufacturer that uses job-order costing. On January 1, the beginning of its
fiscal year, the company’s inventory balances were as follows:
Raw materials . . . . . . . . . . . . . . . . . . . . . . . . $20,000Work in process . . . . . . . . . . . . . . . . . . . . . . . . $15,000Finished goods . . . . . . . . . . . . . . . . . . . . . . . . . $30,000
gar11005_ch03_083-140.indd 109gar11005_ch03_083-140.indd 109 11/11/10 11:28 AM11/11/10 11:28 AM
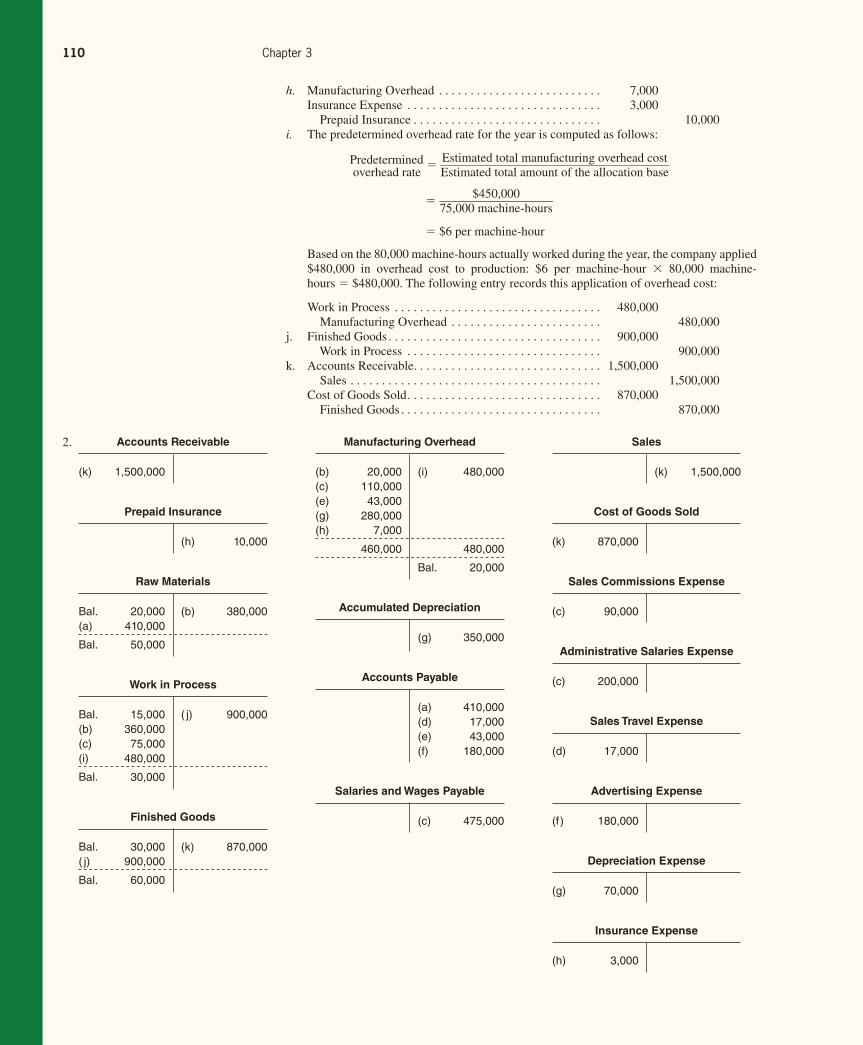
Rev.Confi rming Pages
110 Chapter 3
h. Manufacturing Overhead . . . . . . . . . . . . . . . . . . . . . . . . . . 7,000
Insurance Expense . . . . . . . . . . . . . . . . . . . . . . . . . . . . . . . 3,000
Prepaid Insurance . . . . . . . . . . . . . . . . . . . . . . . . . . . . . . 10,000
i. The predetermined overhead rate for the year is computed as follows:
Predetermined overhead rate
= Estimated total manufacturing overhead cost
_____________________________________ Estimated total amount of the allocation base
= $450,000
___________________ 75,000 machine-hours
= $6 per machine-hour
Based on the 80,000 machine-hours actually worked during the year, the company applied
$480,000 in overhead cost to production: $6 per machine-hour × 80,000 machine-
hours = $480,000. The following entry records this application of overhead cost:
Work in Process . . . . . . . . . . . . . . . . . . . . . . . . . . . . . . . . . 480,000
Manufacturing Overhead . . . . . . . . . . . . . . . . . . . . . . . . 480,000
j. Finished Goods . . . . . . . . . . . . . . . . . . . . . . . . . . . . . . . . . . 900,000
Work in Process . . . . . . . . . . . . . . . . . . . . . . . . . . . . . . . 900,000
k. Accounts Receivable . . . . . . . . . . . . . . . . . . . . . . . . . . . . . . 1,500,000
Sales . . . . . . . . . . . . . . . . . . . . . . . . . . . . . . . . . . . . . . . . 1,500,000
Cost of Goods Sold . . . . . . . . . . . . . . . . . . . . . . . . . . . . . . . 870,000
Finished Goods . . . . . . . . . . . . . . . . . . . . . . . . . . . . . . . . 870,000
2. Accounts Receivable
(k) 1,500,000
Prepaid Insurance
(h) 10,000
Raw Materials
Bal. 20,000 (b) 380,000(a) 410,000
Bal. 50,000
Work in Process
Bal. 15,000 ( j) 900,000(b) 360,000(c) 75,000(i) 480,000
Bal. 30,000
Finished Goods
Bal. 30,000 (k) 870,000( j) 900,000
Bal. 60,000
Manufacturing Overhead
(b) 20,000 (i) 480,000(c) 110,000(e) 43,000(g) 280,000(h) 7,000
460,000 480,000
Bal. 20,000
Accumulated Depreciation
(g) 350,000
Accounts Payable
(a) 410,000 (d) 17,000 (e) 43,000 (f) 180,000
Salaries and Wages Payable
(c) 475,000
Sales
(k) 1,500,000
Cost of Goods Sold
(k) 870,000
Sales Commissions Expense
(c) 90,000
Administrative Salaries Expense
(c) 200,000
Sales Travel Expense
(d) 17,000
Advertising Expense
(f) 180,000
Depreciation Expense
(g) 70,000
Insurance Expense
(h) 3,000
gar11005_ch03_083-140.indd 110gar11005_ch03_083-140.indd 110 11/11/10 11:28 AM11/11/10 11:28 AM
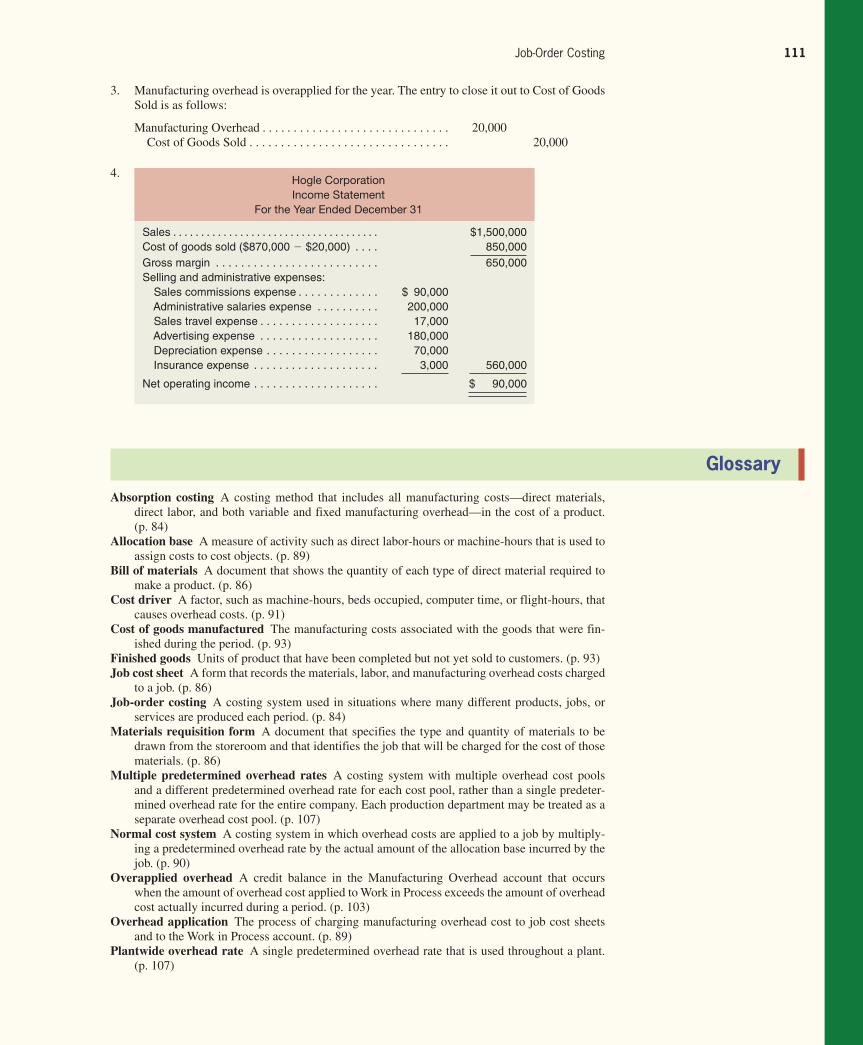
Rev.Confi rming Pages
Job-Order Costing 111
3. Manufacturing overhead is overapplied for the year. The entry to close it out to Cost of Goods
Sold is as follows:
Manufacturing Overhead . . . . . . . . . . . . . . . . . . . . . . . . . . . . . . 20,000
Cost of Goods Sold . . . . . . . . . . . . . . . . . . . . . . . . . . . . . . . . 20,000
4. Hogle Corporation
Income Statement
For the Year Ended December 31
Sales . . . . . . . . . . . . . . . . . . . . . . . . . . . . . . . . . . . . . $1,500,000Cost of goods sold ($870,000 − $20,000) . . . . 850,000Gross margin . . . . . . . . . . . . . . . . . . . . . . . . . . 650,000Selling and administrative expenses: Sales commissions expense . . . . . . . . . . . . . $ 90,000 Administrative salaries expense . . . . . . . . . . 200,000 Sales travel expense . . . . . . . . . . . . . . . . . . . 17,000 Advertising expense . . . . . . . . . . . . . . . . . . . 180,000 Depreciation expense . . . . . . . . . . . . . . . . . . 70,000 Insurance expense . . . . . . . . . . . . . . . . . . . . 3,000 560,000
Net operating income . . . . . . . . . . . . . . . . . . . . $ 90,000
Glossary
Absorption costing A costing method that includes all manufacturing costs—direct materials,
direct labor, and both variable and fixed manufacturing overhead—in the cost of a product.
(p. 84)
Allocation base A measure of activity such as direct labor-hours or machine-hours that is used to
assign costs to cost objects. (p. 89)
Bill of materials A document that shows the quantity of each type of direct material required to
make a product. (p. 86)
Cost driver A factor, such as machine-hours, beds occupied, computer time, or flight-hours, that
causes overhead costs. (p. 91)
Cost of goods manufactured The manufacturing costs associated with the goods that were fin-
ished during the period. (p. 93)
Finished goods Units of product that have been completed but not yet sold to customers. (p. 93)
Job cost sheet A form that records the materials, labor, and manufacturing overhead costs charged
to a job. (p. 86)
Job-order costing A costing system used in situations where many different products, jobs, or
services are produced each period. (p. 84)
Materials requisition form A document that specifies the type and quantity of materials to be
drawn from the storeroom and that identifies the job that will be charged for the cost of those
materials. (p. 86)
Multiple predetermined overhead rates A costing system with multiple overhead cost pools
and a different predetermined overhead rate for each cost pool, rather than a single predeter-
mined overhead rate for the entire company. Each production department may be treated as a
separate overhead cost pool. (p. 107)
Normal cost system A costing system in which overhead costs are applied to a job by multiply-
ing a predetermined overhead rate by the actual amount of the allocation base incurred by the
job. (p. 90)
Overapplied overhead A credit balance in the Manufacturing Overhead account that occurs
when the amount of overhead cost applied to Work in Process exceeds the amount of overhead
cost actually incurred during a period. (p. 103)
Overhead application The process of charging manufacturing overhead cost to job cost sheets
and to the Work in Process account. (p. 89)
Plantwide overhead rate A single predetermined overhead rate that is used throughout a plant.
(p. 107)
gar11005_ch03_083-140.indd 111gar11005_ch03_083-140.indd 111 11/11/10 11:28 AM11/11/10 11:28 AM
Rev.Confi rming Pages
112 Chapter 3
Predetermined overhead rate A rate used to charge manufacturing overhead cost to jobs that is
established in advance for each period. It is computed by dividing the estimated total manu-
facturing overhead cost for the period by the estimated total amount of the allocation base for
the period. (p. 89)
Raw materials Any materials that go into the final product. (p. 93)
Schedule of cost of goods manufactured A schedule that contains three elements of product
costs—direct materials, direct labor, and manufacturing overhead—and that summarizes the
portions of those costs that remain in ending Work in Process inventory and that are trans-
ferred out of Work in Process into Finished Goods. (p. 102)
Schedule of cost of goods sold A schedule that contains three elements of product costs—direct
materials, direct labor, and manufacturing overhead—and that summarizes the portions of
those costs that remain in ending Finished Goods inventory and that are transferred out of
Finished Goods into Cost of Goods Sold. (p. 102)
Time ticket A document that is used to record the amount of time an employee spends on various
activities. (p. 87)
Underapplied overhead A debit balance in the Manufacturing Overhead account that occurs
when the amount of overhead cost actually incurred exceeds the amount of overhead cost
applied to Work in Process during a period. (p. 103)
Work in process Units of product that are only partially complete and will require further work
before they are ready for sale to the customer. (p. 93)
Questions
3–1 Why aren’t actual manufacturing overhead costs traced to jobs just as direct materials
and direct labor costs are traced to jobs?
3–2 Explain the four-step process used to compute a predetermined overhead rate.
3–3 What is the purpose of the job cost sheet in a job-order costing system?
3–4 Explain how a sales order, a production order, a materials requisition form, and a labor
time ticket are involved in producing and costing products.
3–5 Explain why some production costs must be assigned to products through an allocation
process.
3–6 Why do companies use predetermined overhead rates rather than actual manufacturing
overhead costs to apply overhead to jobs?
3–7 What factors should be considered in selecting a base to be used in computing the prede-
termined overhead rate?
3–8 If a company fully allocates all of its overhead costs to jobs, does this guarantee that a
profit will be earned for the period?
3–9 What account is credited when overhead cost is applied to Work in Process? Would you
expect the amount applied for a period to equal the actual overhead costs of the period?
Why or why not?
3–10 What is underapplied overhead? Overapplied overhead? What disposition is made of
these amounts at the end of the period?
3–11 Provide two reasons why overhead might be underapplied in a given year.
3–12 What adjustment is made for underapplied overhead on the schedule of cost of goods
sold? What adjustment is made for overapplied overhead?
3–13 What is a plantwide overhead rate? Why are multiple overhead rates, rather than a plant-
wide overhead rate, used in some companies?
3–14 What happens to overhead rates based on direct labor when automated equipment
replaces direct labor?
Multiple-choice questions are provided on the text website at www.mhhe.com/garrison14e .
gar11005_ch03_083-140.indd 112gar11005_ch03_083-140.indd 112 11/11/10 11:28 AM11/11/10 11:28 AM

Rev.Confi rming Pages
Job-Order Costing 113
Applying Excel
Available with McGraw-Hill’s Connect™ Accounting .
The Excel worksheet form that appears below is to be used to recreate part of the example on
page 104. Download the workbook containing this form from the Online Learning Center at www.
mhhe.com/garrison14e. On the website you will also receive instructions about how to use this worksheet form.
You should proceed to the requirements below only after completing your worksheet.
Required: 1. Check your worksheet by changing the estimated total amount of the allocation base in the
Data area to 60,000 machine-hours, keeping all of the other data the same as in the original
example. If your worksheet is operating properly, the predetermined overhead rate should
now be $5.00 per machine-hour. If you do not get this answer, find the errors in your work-
sheet and correct them.
How much is the underapplied (overapplied) manufacturing overhead? Did it change?
Why or why not?
2. Determine the underapplied (overapplied) manufacturing overhead for a different company
with the following data:
Allocation base . . . . . . . . . . . . . . . . . . . . . . . . . . . . . . . . . . . Machine-hoursEstimated manufacturing overhead cost . . . . . . . . . . . . . . . . $100,000Estimated total amount of the allocation base . . . . . . . . . . . 50,000 machine-hoursActual manufacturing overhead cost . . . . . . . . . . . . . . . . . . $90,000Actual total amount of the allocation base . . . . . . . . . . . . . . 40,000 machine-hours
LEARNING OBJECTIVES 1, 4, 7
gar11005_ch03_083-140.indd 113gar11005_ch03_083-140.indd 113 11/11/10 11:28 AM11/11/10 11:28 AM
Rev.Confi rming Pages
114 Chapter 3
Exercises
All applicable exercises are available with McGraw-Hill’s Connect™ Accounting .
EXERCISE 3–1 Compute the Predetermined Overhead Rate [LO1] Logan Products computes its predetermined overhead rate annually on the basis of direct labor-
hours. At the beginning of the year, it estimated that 40,000 direct labor-hours would be required
for the period’s estimated level of production. The company also estimated $466,000 of fixed
manufacturing overhead expenses for the coming period and variable manufacturing overhead of
$3.00 per direct labor-hour. Logan’s actual manufacturing overhead for the year was $713,400 and
its actual total direct labor was 41,000 hours.
Required: Compute the company’s predetermined overhead rate for the year.
EXERCISE 3–2 Apply Overhead [LO2] Westan Corporation uses a predetermined overhead rate of $23.10 per direct labor-hour. This
predetermined rate was based on a cost formula that estimated $277,200 of total manufacturing
overhead for an estimated activity level of 12,000 direct labor-hours.
The company incurred actual total manufacturing overhead costs of $266,000 and 12,600
total direct labor-hours during the period.
Required: Determine the amount of manufacturing overhead that would have been applied to all jobs during
the period.
EXERCISE 3–3 Computing Job Costs [LO3] Weaver Company ’s predetermined overhead rate is $18.00 per direct labor-hour and its direct labor
wage rate is $12.00 per hour. The following information pertains to Job A-200:
Direct materials . . . . . . . . . . . . . $200Direct labor . . . . . . . . . . . . . . . . . $120
Required: 1. What is the total manufacturing cost assigned to Job A-200?
2. If Job A-200 consists of 50 units, what is the average cost assigned to each unit included in
the job?
EXERCISE 3–4 Prepare Journal Entries [LO4] Kirkaid Company recorded the following transactions for the just completed month.
a. $86,000 in raw materials were purchased on account.
b. $84,000 in raw materials were requisitioned for use in production. Of this amount, $72,000
was for direct materials and the remainder was for indirect materials.
3. What happens to the underapplied (overapplied) manufacturing overhead from part (2) if the
estimated total amount of the allocation base is changed to 40,000 machine-hours and every-
thing else remains the same? Why is the amount of underapplied (overapplied) manufacturing
overhead different from part (2)?
4. Change the estimated total amount of the allocation base back to 50,000 machine-hours
so that the data looks exactly like it did in part (2). Now change the actual manufacturing
overhead cost to $100,000. What is the underapplied (overapplied) manufacturing overhead
now? Why is the amount of underapplied (overapplied) manufacturing overhead different
from part (2)?
gar11005_ch03_083-140.indd 114gar11005_ch03_083-140.indd 114 11/11/10 11:28 AM11/11/10 11:28 AM
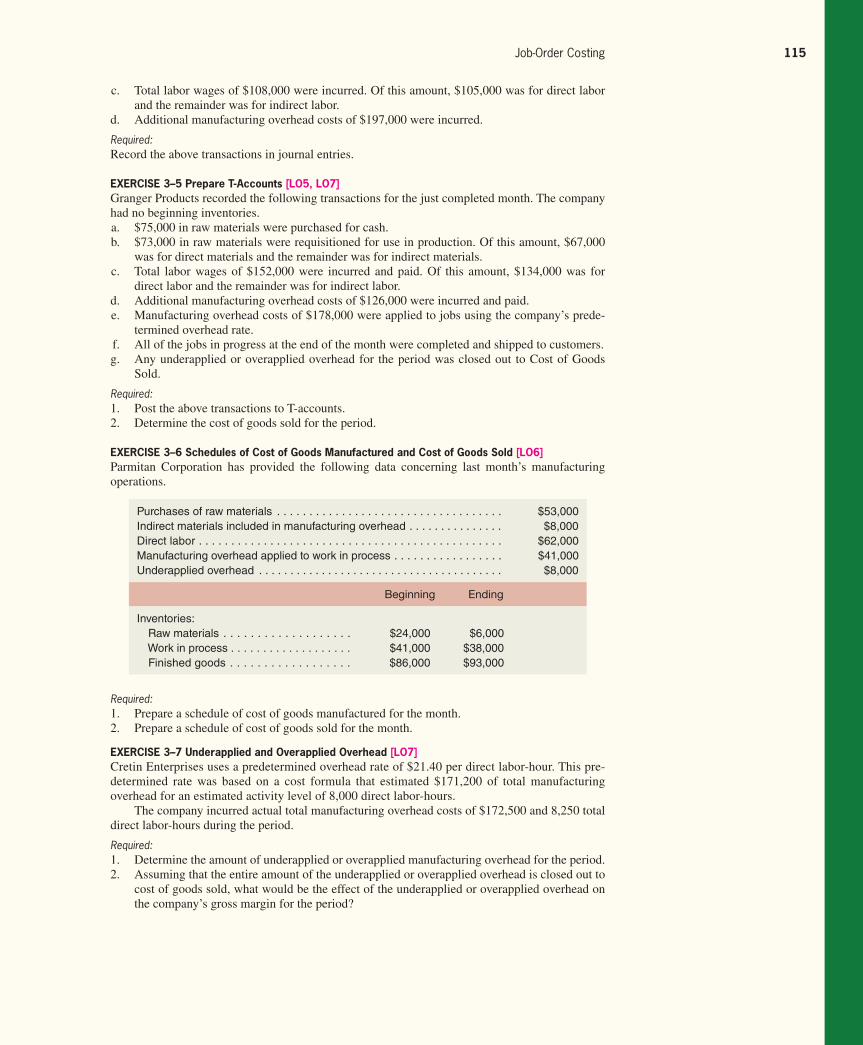
Rev.Confi rming Pages
Job-Order Costing 115
c. Total labor wages of $108,000 were incurred. Of this amount, $105,000 was for direct labor
and the remainder was for indirect labor.
d. Additional manufacturing overhead costs of $197,000 were incurred.
Required: Record the above transactions in journal entries.
EXERCISE 3–5 Prepare T-Accounts [LO5, LO7] Granger Products recorded the following transactions for the just completed month. The company
had no beginning inventories.
a. $75,000 in raw materials were purchased for cash.
b. $73,000 in raw materials were requisitioned for use in production. Of this amount, $67,000
was for direct materials and the remainder was for indirect materials.
c. Total labor wages of $152,000 were incurred and paid. Of this amount, $134,000 was for
direct labor and the remainder was for indirect labor.
d. Additional manufacturing overhead costs of $126,000 were incurred and paid.
e. Manufacturing overhead costs of $178,000 were applied to jobs using the company’s prede-
termined overhead rate.
f. All of the jobs in progress at the end of the month were completed and shipped to customers.
g. Any underapplied or overapplied overhead for the period was closed out to Cost of Goods
Sold.
Required: 1. Post the above transactions to T-accounts.
2. Determine the cost of goods sold for the period.
EXERCISE 3–6 Schedules of Cost of Goods Manufactured and Cost of Goods Sold [LO6] Parmitan Corporation has provided the following data concerning last month’s manufacturing
operations.
Purchases of raw materials . . . . . . . . . . . . . . . . . . . . . . . . . . . . . . . . . . . $53,000Indirect materials included in manufacturing overhead . . . . . . . . . . . . . . . $8,000Direct labor . . . . . . . . . . . . . . . . . . . . . . . . . . . . . . . . . . . . . . . . . . . . . . . $62,000Manufacturing overhead applied to work in process . . . . . . . . . . . . . . . . . $41,000Underapplied overhead . . . . . . . . . . . . . . . . . . . . . . . . . . . . . . . . . . . . . . . $8,000
Beginning Ending
Inventories: Raw materials . . . . . . . . . . . . . . . . . . . $24,000 $6,000 Work in process . . . . . . . . . . . . . . . . . . . $41,000 $38,000 Finished goods . . . . . . . . . . . . . . . . . . $86,000 $93,000
Required: 1. Prepare a schedule of cost of goods manufactured for the month.
2. Prepare a schedule of cost of goods sold for the month.
EXERCISE 3–7 Underapplied and Overapplied Overhead [LO7] Cretin Enterprises uses a predetermined overhead rate of $21.40 per direct labor-hour. This pre-
determined rate was based on a cost formula that estimated $171,200 of total manufacturing
overhead for an estimated activity level of 8,000 direct labor-hours.
The company incurred actual total manufacturing overhead costs of $172,500 and 8,250 total
direct labor-hours during the period.
Required: 1. Determine the amount of underapplied or overapplied manufacturing overhead for the period.
2. Assuming that the entire amount of the underapplied or overapplied overhead is closed out to
cost of goods sold, what would be the effect of the underapplied or overapplied overhead on
the company’s gross margin for the period?
gar11005_ch03_083-140.indd 115gar11005_ch03_083-140.indd 115 11/11/10 11:28 AM11/11/10 11:28 AM
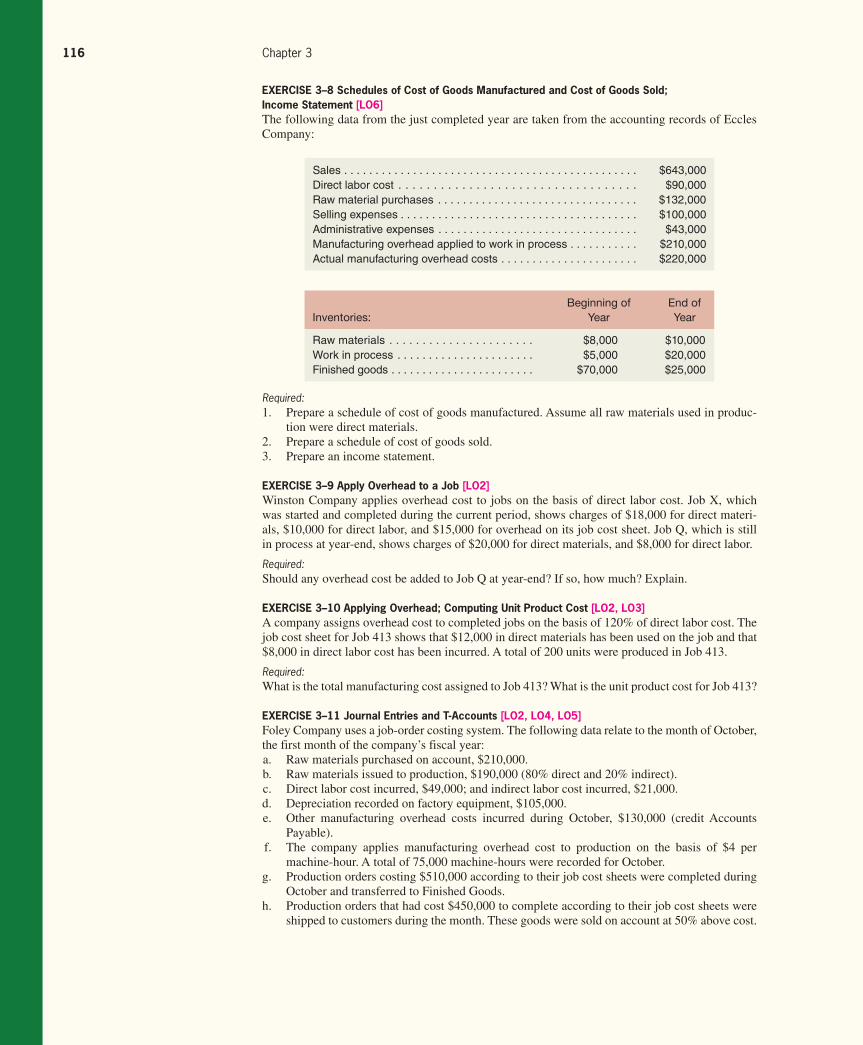
Rev.Confi rming Pages
116 Chapter 3
EXERCISE 3–8 Schedules of Cost of Goods Manufactured and Cost of Goods Sold; Income Statement [LO6] The following data from the just completed year are taken from the accounting records of Eccles
Company:
Sales . . . . . . . . . . . . . . . . . . . . . . . . . . . . . . . . . . . . . . . . . . . . . . . $643,000Direct labor cost . . . . . . . . . . . . . . . . . . . . . . . . . . . . . . . . . . $90,000Raw material purchases . . . . . . . . . . . . . . . . . . . . . . . . . . . . . . . . $132,000Selling expenses . . . . . . . . . . . . . . . . . . . . . . . . . . . . . . . . . . . . . . $100,000Administrative expenses . . . . . . . . . . . . . . . . . . . . . . . . . . . . . . . . $43,000Manufacturing overhead applied to work in process . . . . . . . . . . . $210,000Actual manufacturing overhead costs . . . . . . . . . . . . . . . . . . . . . . $220,000
Inventories:
Beginning of
Year
End of
Year
Raw materials . . . . . . . . . . . . . . . . . . . . . . $8,000 $10,000Work in process . . . . . . . . . . . . . . . . . . . . . . $5,000 $20,000Finished goods . . . . . . . . . . . . . . . . . . . . . . . $70,000 $25,000
Required: 1. Prepare a schedule of cost of goods manufactured. Assume all raw materials used in produc-
tion were direct materials.
2. Prepare a schedule of cost of goods sold.
3. Prepare an income statement.
EXERCISE 3–9 Apply Overhead to a Job [LO2] Winston Company applies overhead cost to jobs on the basis of direct labor cost. Job X, which
was started and completed during the current period, shows charges of $18,000 for direct materi-
als, $10,000 for direct labor, and $15,000 for overhead on its job cost sheet. Job Q, which is still
in process at year-end, shows charges of $20,000 for direct materials, and $8,000 for direct labor.
Required: Should any overhead cost be added to Job Q at year-end? If so, how much? Explain.
EXERCISE 3–10 Applying Overhead; Computing Unit Product Cost [LO2, LO3] A company assigns overhead cost to completed jobs on the basis of 120% of direct labor cost. The
job cost sheet for Job 413 shows that $12,000 in direct materials has been used on the job and that
$8,000 in direct labor cost has been incurred. A total of 200 units were produced in Job 413.
Required: What is the total manufacturing cost assigned to Job 413? What is the unit product cost for Job 413?
EXERCISE 3–11 Journal Entries and T-Accounts [LO2, LO4, LO5] Foley Company uses a job-order costing system. The following data relate to the month of October,
the first month of the company’s fiscal year:
a. Raw materials purchased on account, $210,000.
b. Raw materials issued to production, $190,000 (80% direct and 20% indirect).
c. Direct labor cost incurred, $49,000; and indirect labor cost incurred, $21,000.
d. Depreciation recorded on factory equipment, $105,000.
e. Other manufacturing overhead costs incurred during October, $130,000 (credit Accounts
Payable).
f. The company applies manufacturing overhead cost to production on the basis of $4 per
machine-hour. A total of 75,000 machine-hours were recorded for October.
g. Production orders costing $510,000 according to their job cost sheets were completed during
October and transferred to Finished Goods.
h. Production orders that had cost $450,000 to complete according to their job cost sheets were
shipped to customers during the month. These goods were sold on account at 50% above cost.
gar11005_ch03_083-140.indd 116gar11005_ch03_083-140.indd 116 11/11/10 11:28 AM11/11/10 11:28 AM
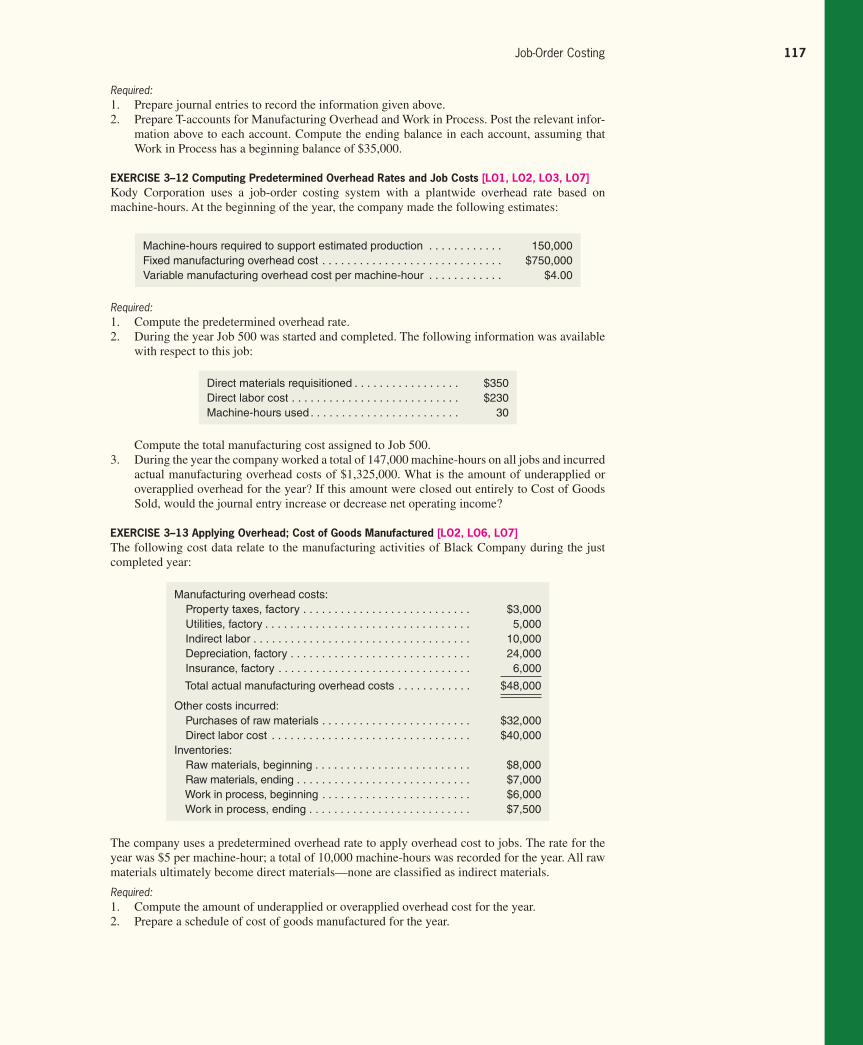
Rev.Confi rming Pages
Job-Order Costing 117
Required: 1. Prepare journal entries to record the information given above.
2. Prepare T-accounts for Manufacturing Overhead and Work in Process. Post the relevant infor-
mation above to each account. Compute the ending balance in each account, assuming that
Work in Process has a beginning balance of $35,000.
EXERCISE 3–12 Computing Predetermined Overhead Rates and Job Costs [LO1, LO2, LO3, LO7] Kody Corporation uses a job-order costing system with a plantwide overhead rate based on
machine-hours. At the beginning of the year, the company made the following estimates:
Machine-hours required to support estimated production . . . . . . . . . . . . 150,000Fixed manufacturing overhead cost . . . . . . . . . . . . . . . . . . . . . . . . . . . . . $750,000Variable manufacturing overhead cost per machine-hour . . . . . . . . . . . . $4.00
Direct materials requisitioned . . . . . . . . . . . . . . . . . $350Direct labor cost . . . . . . . . . . . . . . . . . . . . . . . . . . . $230Machine-hours used . . . . . . . . . . . . . . . . . . . . . . . . 30
Required: 1. Compute the predetermined overhead rate.
2. During the year Job 500 was started and completed. The following information was available
with respect to this job:
Compute the total manufacturing cost assigned to Job 500.
3. During the year the company worked a total of 147,000 machine-hours on all jobs and incurred
actual manufacturing overhead costs of $1,325,000. What is the amount of underapplied or
overapplied overhead for the year? If this amount were closed out entirely to Cost of Goods
Sold, would the journal entry increase or decrease net operating income?
EXERCISE 3–13 Applying Overhead; Cost of Goods Manufactured [LO2, LO6, LO7] The following cost data relate to the manufacturing activities of Black Company during the just
completed year:
Manufacturing overhead costs: Property taxes, factory . . . . . . . . . . . . . . . . . . . . . . . . . . . $3,000 Utilities, factory . . . . . . . . . . . . . . . . . . . . . . . . . . . . . . . . . 5,000 Indirect labor . . . . . . . . . . . . . . . . . . . . . . . . . . . . . . . . . . . 10,000 Depreciation, factory . . . . . . . . . . . . . . . . . . . . . . . . . . . . . 24,000 Insurance, factory . . . . . . . . . . . . . . . . . . . . . . . . . . . . . . . 6,000
Total actual manufacturing overhead costs . . . . . . . . . . . . $48,000
Other costs incurred: Purchases of raw materials . . . . . . . . . . . . . . . . . . . . . . . . $32,000 Direct labor cost . . . . . . . . . . . . . . . . . . . . . . . . . . . . . . . . $40,000Inventories: Raw materials, beginning . . . . . . . . . . . . . . . . . . . . . . . . . $8,000 Raw materials, ending . . . . . . . . . . . . . . . . . . . . . . . . . . . . $7,000 Work in process, beginning . . . . . . . . . . . . . . . . . . . . . . . . $6,000 Work in process, ending . . . . . . . . . . . . . . . . . . . . . . . . . . $7,500
The company uses a predetermined overhead rate to apply overhead cost to jobs. The rate for the
year was $5 per machine-hour; a total of 10,000 machine-hours was recorded for the year. All raw
materials ultimately become direct materials—none are classified as indirect materials.
Required: 1. Compute the amount of underapplied or overapplied overhead cost for the year.
2. Prepare a schedule of cost of goods manufactured for the year.
gar11005_ch03_083-140.indd 117gar11005_ch03_083-140.indd 117 11/11/10 11:28 AM11/11/10 11:28 AM
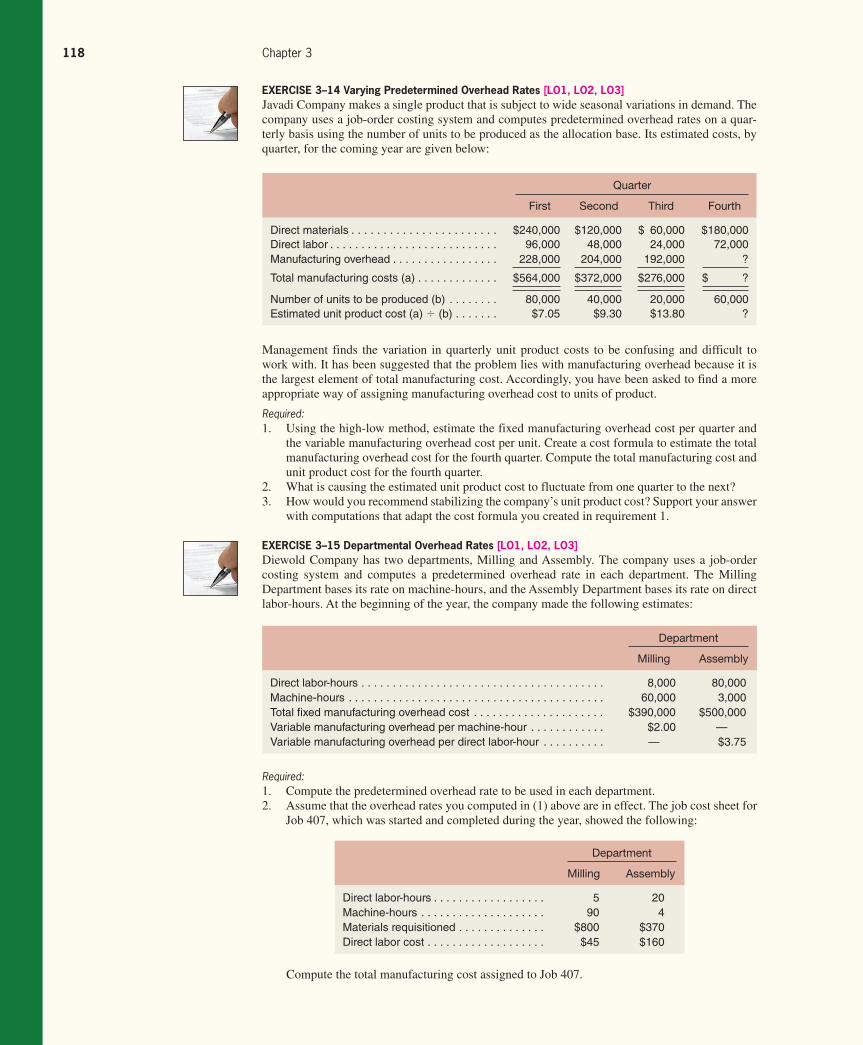
Rev.Confi rming Pages
118 Chapter 3
EXERCISE 3–14 Varying Predetermined Overhead Rates [LO1, LO2, LO3] Javadi Company makes a single product that is subject to wide seasonal variations in demand. The
company uses a job-order costing system and computes predetermined overhead rates on a quar-
terly basis using the number of units to be produced as the allocation base. Its estimated costs, by
quarter, for the coming year are given below:
Quarter
First Second Third Fourth
Direct materials . . . . . . . . . . . . . . . . . . . . . . . $240,000 $120,000 $ 60,000 $180,000Direct labor . . . . . . . . . . . . . . . . . . . . . . . . . . . 96,000 48,000 24,000 72,000Manufacturing overhead . . . . . . . . . . . . . . . . . 228,000 204,000 192,000 ?
Total manufacturing costs (a) . . . . . . . . . . . . . $564,000 $372,000 $276,000 $ ?
Number of units to be produced (b) . . . . . . . . 80,000 40,000 20,000 60,000Estimated unit product cost (a) ÷ (b) . . . . . . . $7.05 $9.30 $13.80 ?
Management finds the variation in quarterly unit product costs to be confusing and difficult to
work with. It has been suggested that the problem lies with manufacturing overhead because it is
the largest element of total manufacturing cost. Accordingly, you have been asked to find a more
appropriate way of assigning manufacturing overhead cost to units of product.
Required: 1. Using the high-low method, estimate the fixed manufacturing overhead cost per quarter and
the variable manufacturing overhead cost per unit. Create a cost formula to estimate the total
manufacturing overhead cost for the fourth quarter. Compute the total manufacturing cost and
unit product cost for the fourth quarter.
2. What is causing the estimated unit product cost to fluctuate from one quarter to the next?
3. How would you recommend stabilizing the company’s unit product cost? Support your answer
with computations that adapt the cost formula you created in requirement 1.
EXERCISE 3–15 Departmental Overhead Rates [LO1, LO2, LO3] Diewold Company has two departments, Milling and Assembly. The company uses a job-order
costing system and computes a predetermined overhead rate in each department. The Milling
Department bases its rate on machine-hours, and the Assembly Department bases its rate on direct
labor-hours. At the beginning of the year, the company made the following estimates:
Department
Milling Assembly
Direct labor-hours . . . . . . . . . . . . . . . . . . . . . . . . . . . . . . . . . . . . . . . 8,000 80,000Machine-hours . . . . . . . . . . . . . . . . . . . . . . . . . . . . . . . . . . . . . . . . . 60,000 3,000Total fi xed manufacturing overhead cost . . . . . . . . . . . . . . . . . . . . . $390,000 $500,000Variable manufacturing overhead per machine-hour . . . . . . . . . . . . $2.00 —Variable manufacturing overhead per direct labor-hour . . . . . . . . . . — $3.75
Required: 1. Compute the predetermined overhead rate to be used in each department.
2. Assume that the overhead rates you computed in (1) above are in effect. The job cost sheet for
Job 407, which was started and completed during the year, showed the following:
Department
Milling Assembly
Direct labor-hours . . . . . . . . . . . . . . . . . . 5 20Machine-hours . . . . . . . . . . . . . . . . . . . . 90 4Materials requisitioned . . . . . . . . . . . . . . $800 $370Direct labor cost . . . . . . . . . . . . . . . . . . . $45 $160
Compute the total manufacturing cost assigned to Job 407.
gar11005_ch03_083-140.indd 118gar11005_ch03_083-140.indd 118 11/11/10 11:28 AM11/11/10 11:28 AM
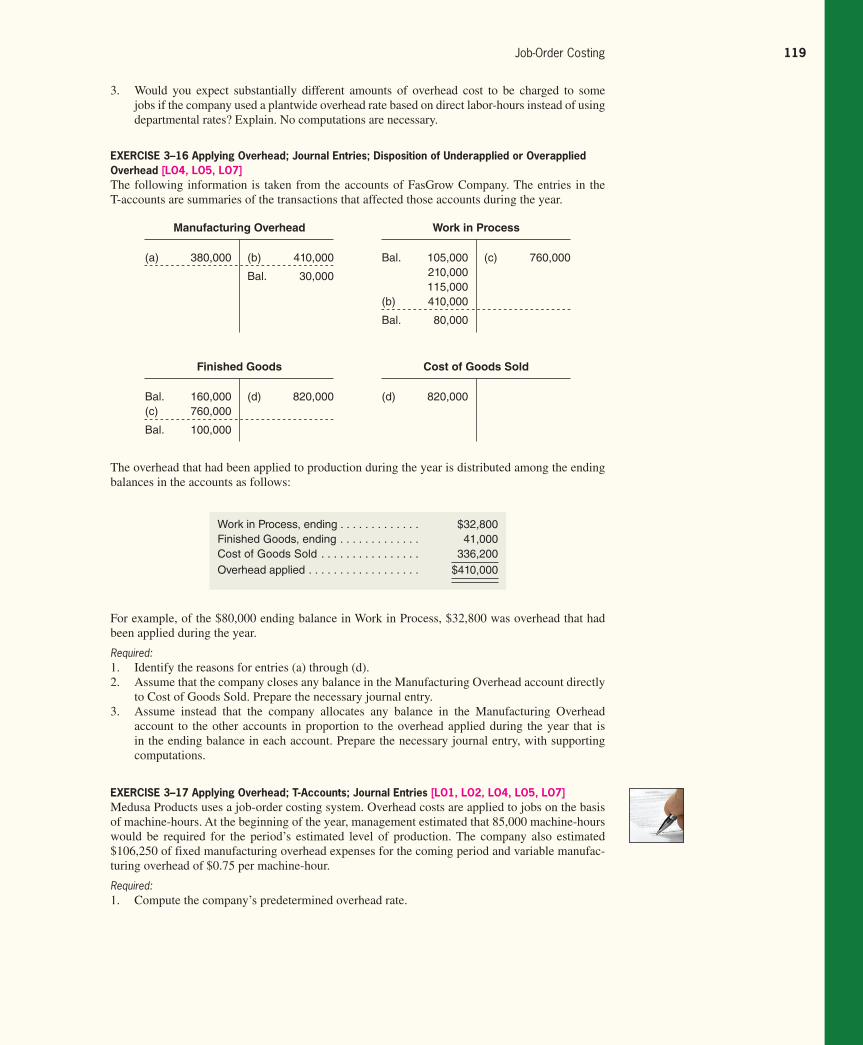
Rev.Confi rming Pages
Job-Order Costing 119
3. Would you expect substantially different amounts of overhead cost to be charged to some
jobs if the company used a plantwide overhead rate based on direct labor-hours instead of using
departmental rates? Explain. No computations are necessary.
EXERCISE 3–16 Applying Overhead; Journal Entries; Disposition of Underapplied or Overapplied Overhead [LO4, LO5, LO7] The following information is taken from the accounts of FasGrow Company. The entries in the
T-accounts are summaries of the transactions that affected those accounts during the year.
Work in Process, ending . . . . . . . . . . . . . $32,800Finished Goods, ending . . . . . . . . . . . . . 41,000Cost of Goods Sold . . . . . . . . . . . . . . . . 336,200Overhead applied . . . . . . . . . . . . . . . . . . $410,000
The overhead that had been applied to production during the year is distributed among the ending
balances in the accounts as follows:
Manufacturing Overhead
(a) 380,000 (b) 410,000
Bal. 30,000
Finished Goods
Bal. 160,000 (d) 820,000 (c) 760,000
Bal. 100,000
Work in Process
Bal. 105,000 (c) 760,000 210,000 115,000 (b) 410,000
Bal. 80,000
Cost of Goods Sold
(d) 820,000
For example, of the $80,000 ending balance in Work in Process, $32,800 was overhead that had
been applied during the year.
Required: 1. Identify the reasons for entries (a) through (d).
2. Assume that the company closes any balance in the Manufacturing Overhead account directly
to Cost of Goods Sold. Prepare the necessary journal entry.
3. Assume instead that the company allocates any balance in the Manufacturing Overhead
account to the other accounts in proportion to the overhead applied during the year that is
in the ending balance in each account. Prepare the necessary journal entry, with supporting
computations.
EXERCISE 3–17 Applying Overhead; T-Accounts; Journal Entries [LO1, LO2, LO4, LO5, LO7] Medusa Products uses a job-order costing system. Overhead costs are applied to jobs on the basis
of machine-hours. At the beginning of the year, management estimated that 85,000 machine-hours
would be required for the period’s estimated level of production. The company also estimated
$106,250 of fixed manufacturing overhead expenses for the coming period and variable manufac-
turing overhead of $0.75 per machine-hour.
Required: 1. Compute the company’s predetermined overhead rate.
gar11005_ch03_083-140.indd 119gar11005_ch03_083-140.indd 119 11/11/10 11:29 AM11/11/10 11:29 AM

Rev.Confi rming Pages
120 Chapter 3
Copy the data in the T-accounts above onto your answer sheet. Compute the amount of over-
head cost that would be applied to Work in Process for the year, and make the entry in your
T-accounts.
3. Compute the amount of underapplied or overapplied overhead for the year, and show the
balance in your Manufacturing Overhead T-account. Prepare a journal entry to close out the
balance in this account to Cost of Goods Sold.
4. Explain why the manufacturing overhead was underapplied or overapplied for the year.
EXERCISE 3–18 Plantwide and Departmental Overhead Rates; Job Costs [LO1, LO2, LO3] Smithson Company uses a job-order costing system and has two manufacturing departments—
Molding and Fabrication. The company provided the following estimates at the beginning of
the year:
Manufacturing
Overhead
(Utilities) 14,000 ? (Insurance) 9,000 (Maintenance) 33,000 (Indirect materials) 7,000 (Indirect labor) 65,000 (Depreciation) 40,000
Work in
Process
(Direct materials) 530,000 (Direct labor) 85,000 (Overhead) ?
2. Assume that during the year the company actually works only 80,000 machine-hours and
incurs the following costs in the Manufacturing Overhead and Work in Process accounts:
Molding Fabrication Total
Machine-hours . . . . . . . . . . . . . . . . . . . . . . . . . . . . . . . . . . 20,000 30,000 50,000Fixed manufacturing overhead costs . . . . . . . . . . . . . . . . . $800,000 $300,000 $1,100,000Variable manufacturing overhead per machine-hour . . . . . $5.00 $5.00
During the year, the company had no beginning or ending inventories and it started, completed,
and sold only two jobs—Job D-75 and Job C-100. It provided the following information related to
those two jobs:
Job D-75: Molding Fabrication Total
Direct materials cost . . . . . . . . . . . . . . . . . . . . . . . . . . . . . . $375,000 $325,000 $700,000Direct labor cost . . . . . . . . . . . . . . . . . . . . . . . . . . . . . . . . . $200,000 $160,000 $360,000Machine-hours . . . . . . . . . . . . . . . . . . . . . . . . . . . . . . . . . . 15,000 5,000 20,000
Job C-100: Molding Fabrication Total
Direct materials cost . . . . . . . . . . . . . . . . . . . . . . . . . . . . . . $300,000 $250,000 $550,000Direct labor cost . . . . . . . . . . . . . . . . . . . . . . . . . . . . . . . . . $175,000 $225,000 $400,000Machine-hours . . . . . . . . . . . . . . . . . . . . . . . . . . . . . . . . . . 5,000 25,000 30,000
Smithson had no overapplied or underapplied manufacturing overhead during the year.
Required: 1. Assume Smithson uses a plantwide overhead rate based on machine-hours.
a. Compute the predetermined plantwide overhead rate.
b. Compute the total manufacturing costs assigned to Job D-75 and Job C-100.
c. If Smithson establishes bid prices that are 150% of total manufacturing costs, what bid
price would it have established for Job D-75 and Job C-100?
d. What is Smithson’s cost of goods sold for the year?
gar11005_ch03_083-140.indd 120gar11005_ch03_083-140.indd 120 11/11/10 11:29 AM11/11/10 11:29 AM
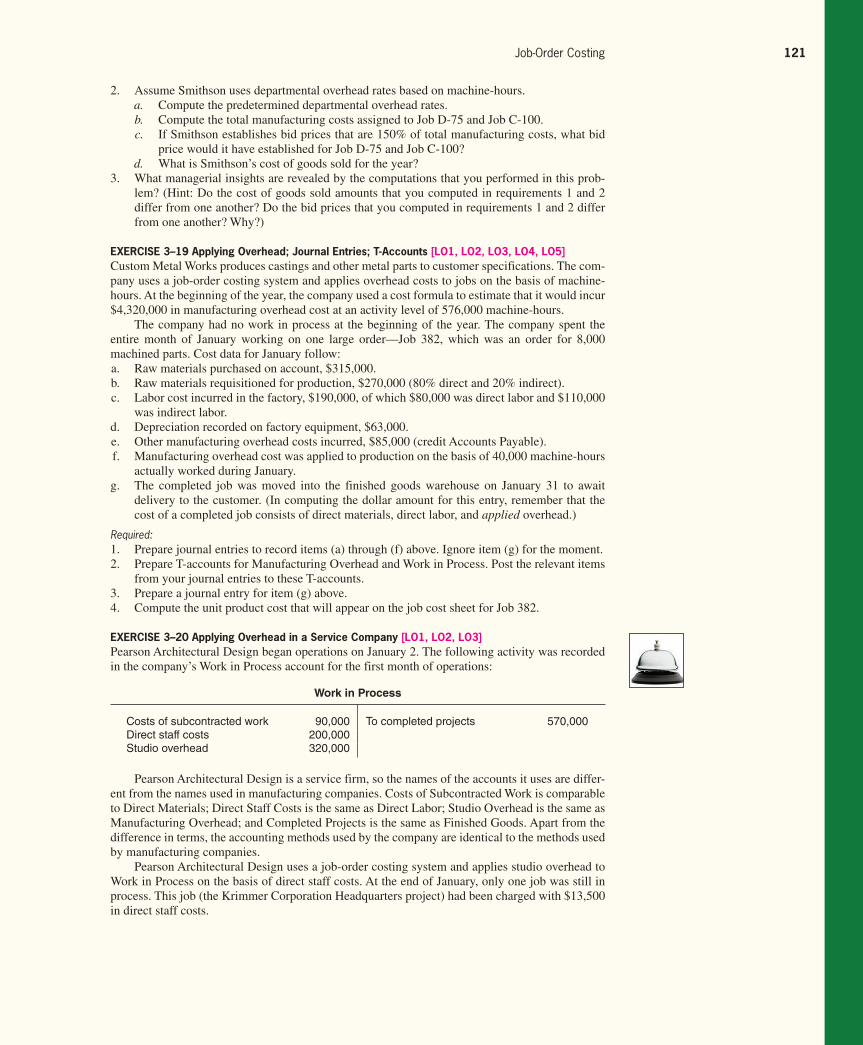
Rev.Confi rming Pages
Job-Order Costing 121
2. Assume Smithson uses departmental overhead rates based on machine-hours.
a. Compute the predetermined departmental overhead rates.
b. Compute the total manufacturing costs assigned to Job D-75 and Job C-100.
c. If Smithson establishes bid prices that are 150% of total manufacturing costs, what bid
price would it have established for Job D-75 and Job C-100?
d. What is Smithson’s cost of goods sold for the year?
3. What managerial insights are revealed by the computations that you performed in this prob-
lem? (Hint: Do the cost of goods sold amounts that you computed in requirements 1 and 2
differ from one another? Do the bid prices that you computed in requirements 1 and 2 differ
from one another? Why?)
EXERCISE 3–19 Applying Overhead; Journal Entries; T-Accounts [LO1, LO2, LO3, LO4, LO5] Custom Metal Works produces castings and other metal parts to customer specifications. The com-
pany uses a job-order costing system and applies overhead costs to jobs on the basis of machine-
hours. At the beginning of the year, the company used a cost formula to estimate that it would incur
$4,320,000 in manufacturing overhead cost at an activity level of 576,000 machine-hours.
The company had no work in process at the beginning of the year. The company spent the
entire month of January working on one large order—Job 382, which was an order for 8,000
machined parts. Cost data for January follow:
a. Raw materials purchased on account, $315,000.
b. Raw materials requisitioned for production, $270,000 (80% direct and 20% indirect).
c. Labor cost incurred in the factory, $190,000, of which $80,000 was direct labor and $110,000
was indirect labor.
d. Depreciation recorded on factory equipment, $63,000.
e. Other manufacturing overhead costs incurred, $85,000 (credit Accounts Payable).
f. Manufacturing overhead cost was applied to production on the basis of 40,000 machine-hours
actually worked during January.
g. The completed job was moved into the finished goods warehouse on January 31 to await
delivery to the customer. (In computing the dollar amount for this entry, remember that the
cost of a completed job consists of direct materials, direct labor, and applied overhead.)
Required: 1. Prepare journal entries to record items (a) through (f) above. Ignore item (g) for the moment.
2. Prepare T-accounts for Manufacturing Overhead and Work in Process. Post the relevant items
from your journal entries to these T-accounts.
3. Prepare a journal entry for item (g) above.
4. Compute the unit product cost that will appear on the job cost sheet for Job 382.
EXERCISE 3–20 Applying Overhead in a Service Company [LO1, LO2, LO3] Pearson Architectural Design began operations on January 2. The following activity was recorded
in the company’s Work in Process account for the first month of operations:
Work in Process
Costs of subcontracted work 90,000 To completed projects 570,000Direct staff costs 200,000Studio overhead 320,000
Pearson Architectural Design is a service firm, so the names of the accounts it uses are differ-
ent from the names used in manufacturing companies. Costs of Subcontracted Work is comparable
to Direct Materials; Direct Staff Costs is the same as Direct Labor; Studio Overhead is the same as
Manufacturing Overhead; and Completed Projects is the same as Finished Goods. Apart from the
difference in terms, the accounting methods used by the company are identical to the methods used
by manufacturing companies.
Pearson Architectural Design uses a job-order costing system and applies studio overhead to
Work in Process on the basis of direct staff costs. At the end of January, only one job was still in
process. This job (the Krimmer Corporation Headquarters project) had been charged with $13,500
in direct staff costs.
gar11005_ch03_083-140.indd 121gar11005_ch03_083-140.indd 121 11/11/10 11:29 AM11/11/10 11:29 AM
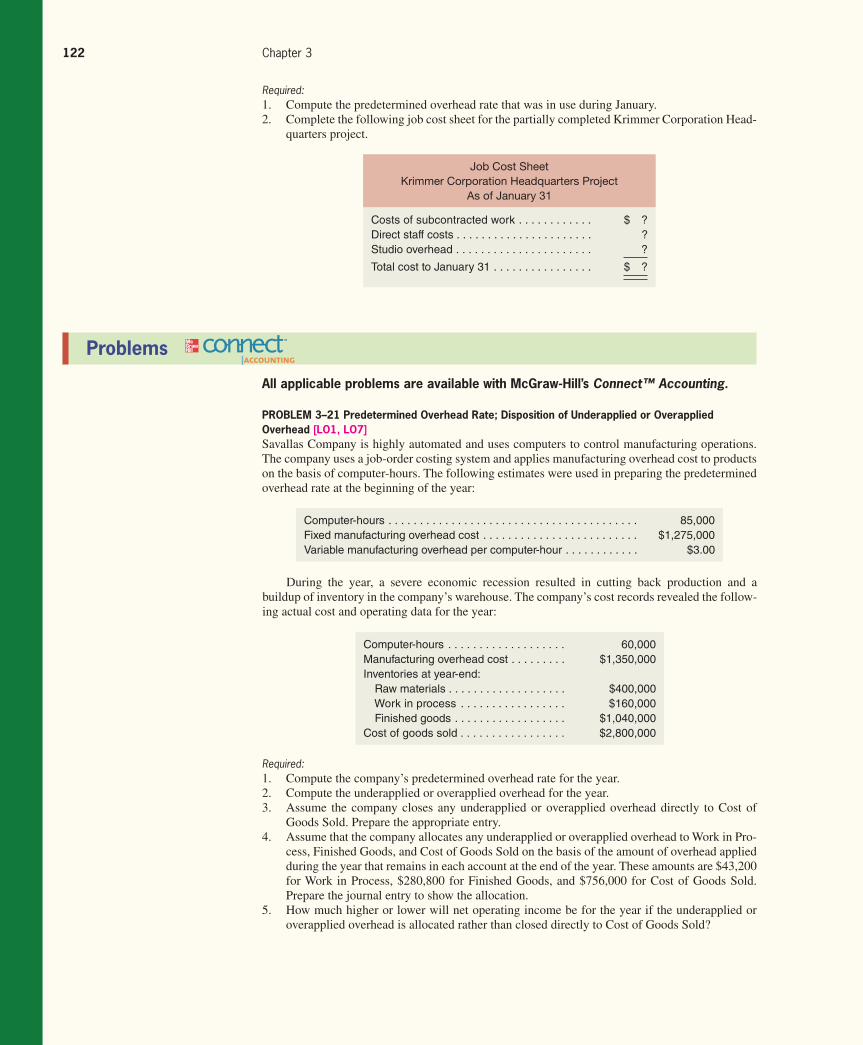
Rev.Confi rming Pages
122 Chapter 3
Job Cost Sheet
Krimmer Corporation Headquarters Project
As of January 31
Costs of subcontracted work . . . . . . . . . . . . $ ?Direct staff costs . . . . . . . . . . . . . . . . . . . . . . ?Studio overhead . . . . . . . . . . . . . . . . . . . . . . ?
Total cost to January 31 . . . . . . . . . . . . . . . . $ ?
Problems
All applicable problems are available with McGraw-Hill’s Connect™ Accounting .
PROBLEM 3–21 Predetermined Overhead Rate; Disposition of Underapplied or Overapplied Overhead [LO1, LO7] Savallas Company is highly automated and uses computers to control manufacturing operations.
The company uses a job-order costing system and applies manufacturing overhead cost to products
on the basis of computer-hours. The following estimates were used in preparing the predetermined
overhead rate at the beginning of the year:
Computer-hours . . . . . . . . . . . . . . . . . . . . . . . . . . . . . . . . . . . . . . . . 85,000Fixed manufacturing overhead cost . . . . . . . . . . . . . . . . . . . . . . . . . $1,275,000Variable manufacturing overhead per computer-hour . . . . . . . . . . . . $3.00
During the year, a severe economic recession resulted in cutting back production and a
buildup of inventory in the company’s warehouse. The company’s cost records revealed the follow-
ing actual cost and operating data for the year:
Computer-hours . . . . . . . . . . . . . . . . . . . 60,000Manufacturing overhead cost . . . . . . . . . $1,350,000Inventories at year-end: Raw materials . . . . . . . . . . . . . . . . . . . $400,000 Work in process . . . . . . . . . . . . . . . . . $160,000 Finished goods . . . . . . . . . . . . . . . . . . $1,040,000Cost of goods sold . . . . . . . . . . . . . . . . . $2,800,000
Required: 1. Compute the company’s predetermined overhead rate for the year.
2. Compute the underapplied or overapplied overhead for the year.
3. Assume the company closes any underapplied or overapplied overhead directly to Cost of
Goods Sold. Prepare the appropriate entry.
4. Assume that the company allocates any underapplied or overapplied overhead to Work in Pro-
cess, Finished Goods, and Cost of Goods Sold on the basis of the amount of overhead applied
during the year that remains in each account at the end of the year. These amounts are $43,200
for Work in Process, $280,800 for Finished Goods, and $756,000 for Cost of Goods Sold.
Prepare the journal entry to show the allocation.
5. How much higher or lower will net operating income be for the year if the underapplied or
overapplied overhead is allocated rather than closed directly to Cost of Goods Sold?
Required: 1. Compute the predetermined overhead rate that was in use during January.
2. Complete the following job cost sheet for the partially completed Krimmer Corporation Head-
quarters project.
gar11005_ch03_083-140.indd 122gar11005_ch03_083-140.indd 122 11/11/10 11:29 AM11/11/10 11:29 AM
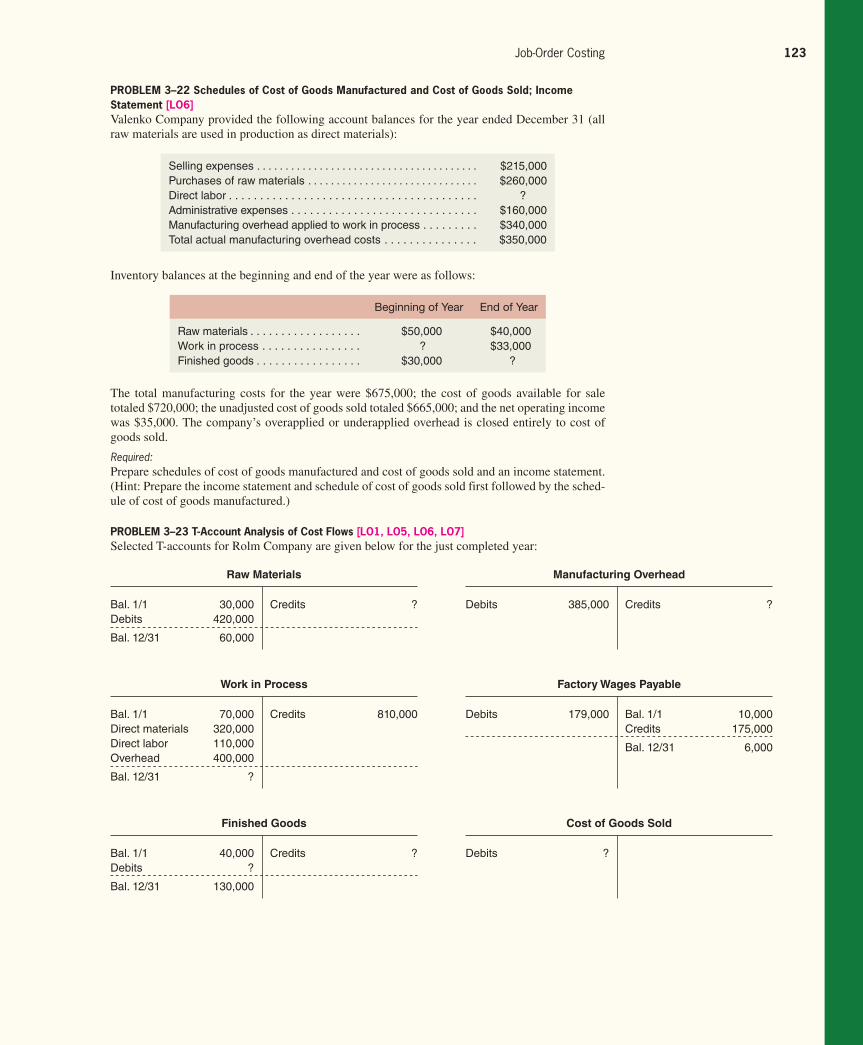
Rev.Confi rming Pages
Job-Order Costing 123
PROBLEM 3–22 Schedules of Cost of Goods Manufactured and Cost of Goods Sold; Income Statement [LO6] Valenko Company provided the following account balances for the year ended December 31 (all
raw materials are used in production as direct materials):
Selling expenses . . . . . . . . . . . . . . . . . . . . . . . . . . . . . . . . . . . . . . . $215,000Purchases of raw materials . . . . . . . . . . . . . . . . . . . . . . . . . . . . . . $260,000Direct labor . . . . . . . . . . . . . . . . . . . . . . . . . . . . . . . . . . . . . . . . ?Administrative expenses . . . . . . . . . . . . . . . . . . . . . . . . . . . . . . $160,000Manufacturing overhead applied to work in process . . . . . . . . . $340,000Total actual manufacturing overhead costs . . . . . . . . . . . . . . . $350,000
Inventory balances at the beginning and end of the year were as follows:
Beginning of Year End of Year
Raw materials . . . . . . . . . . . . . . . . . . $50,000 $40,000Work in process . . . . . . . . . . . . . . . . ? $33,000Finished goods . . . . . . . . . . . . . . . . . $30,000 ?
The total manufacturing costs for the year were $675,000; the cost of goods available for sale
totaled $720,000; the unadjusted cost of goods sold totaled $665,000; and the net operating income
was $35,000. The company’s overapplied or underapplied overhead is closed entirely to cost of
goods sold.
Required: Prepare schedules of cost of goods manufactured and cost of goods sold and an income statement.
(Hint: Prepare the income statement and schedule of cost of goods sold first followed by the sched-
ule of cost of goods manufactured.)
PROBLEM 3–23 T-Account Analysis of Cost Flows [LO1, LO5, LO6, LO7] Selected T-accounts for Rolm Company are given below for the just completed year:
Raw Materials
Bal. 1/1 30,000 Credits ?Debits 420,000
Bal. 12/31 60,000
Work in Process
Bal. 1/1 70,000 Credits 810,000Direct materials 320,000 Direct labor 110,000 Overhead 400,000
Bal. 12/31 ?
Finished Goods
Bal. 1/1 40,000 Credits ?Debits ?
Bal. 12/31 130,000
Manufacturing Overhead
Debits 385,000 Credits ?
Factory Wages Payable
Debits 179,000 Bal. 1/1 10,000 Credits 175,000
Bal. 12/31 6,000
Cost of Goods Sold
Debits ?
gar11005_ch03_083-140.indd 123gar11005_ch03_083-140.indd 123 11/11/10 11:29 AM11/11/10 11:29 AM
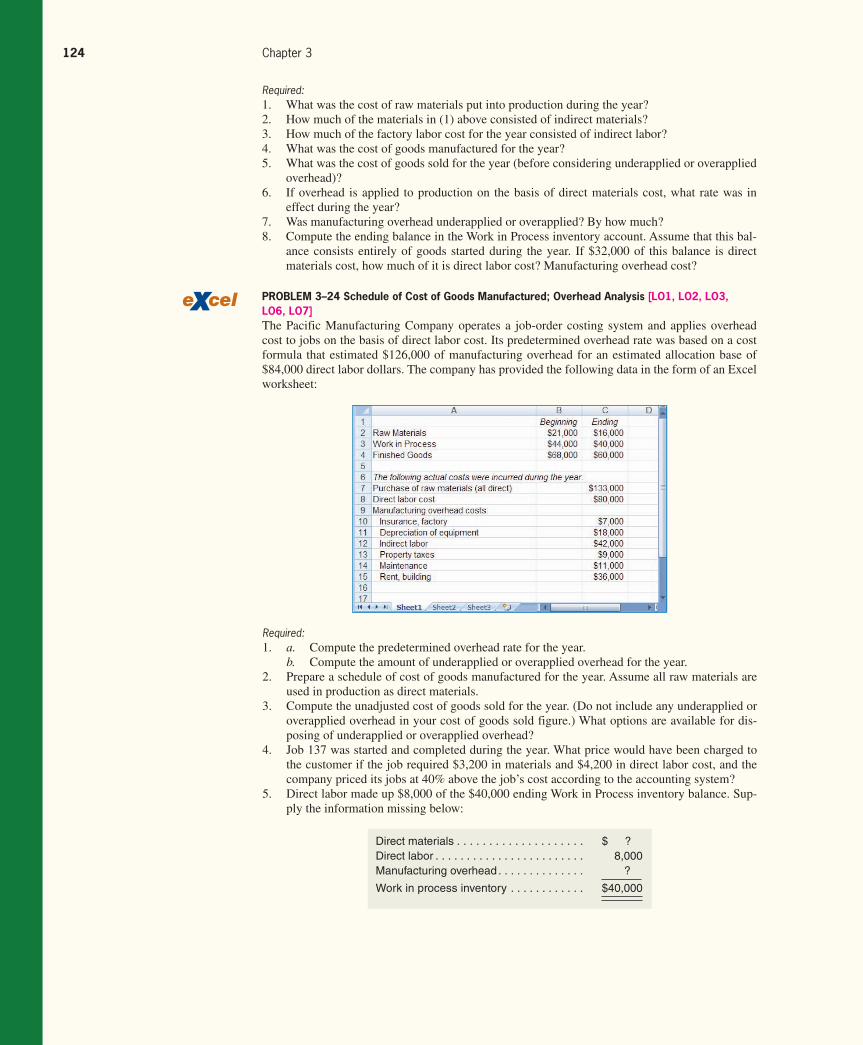
Rev.Confi rming Pages
124 Chapter 3
Required: 1. What was the cost of raw materials put into production during the year?
2. How much of the materials in (1) above consisted of indirect materials?
3. How much of the factory labor cost for the year consisted of indirect labor?
4. What was the cost of goods manufactured for the year?
5. What was the cost of goods sold for the year (before considering underapplied or overapplied
overhead)?
6. If overhead is applied to production on the basis of direct materials cost, what rate was in
effect during the year?
7. Was manufacturing overhead underapplied or overapplied? By how much?
8. Compute the ending balance in the Work in Process inventory account. Assume that this bal-
ance consists entirely of goods started during the year. If $32,000 of this balance is direct
materials cost, how much of it is direct labor cost? Manufacturing overhead cost?
PROBLEM 3–24 Schedule of Cost of Goods Manufactured; Overhead Analysis [LO1, LO2, LO3, LO6, LO7] The Pacific Manufacturing Company operates a job-order costing system and applies overhead
cost to jobs on the basis of direct labor cost. Its predetermined overhead rate was based on a cost
formula that estimated $126,000 of manufacturing overhead for an estimated allocation base of
$84,000 direct labor dollars. The company has provided the following data in the form of an Excel
worksheet:
Required: 1. a. Compute the predetermined overhead rate for the year.
b. Compute the amount of underapplied or overapplied overhead for the year.
2. Prepare a schedule of cost of goods manufactured for the year. Assume all raw materials are
used in production as direct materials.
3. Compute the unadjusted cost of goods sold for the year. (Do not include any underapplied or
overapplied overhead in your cost of goods sold figure.) What options are available for dis-
posing of underapplied or overapplied overhead?
4. Job 137 was started and completed during the year. What price would have been charged to
the customer if the job required $3,200 in materials and $4,200 in direct labor cost, and the
company priced its jobs at 40% above the job’s cost according to the accounting system?
5. Direct labor made up $8,000 of the $40,000 ending Work in Process inventory balance. Sup-
ply the information missing below:
Direct materials . . . . . . . . . . . . . . . . . . . . $ ? Direct labor . . . . . . . . . . . . . . . . . . . . . . . . 8,000Manufacturing overhead . . . . . . . . . . . . . . ?
Work in process inventory . . . . . . . . . . . . $40,000
gar11005_ch03_083-140.indd 124gar11005_ch03_083-140.indd 124 11/11/10 11:29 AM11/11/10 11:29 AM
Rev.Confi rming Pages
Job-Order Costing 125
PROBLEM 3–25 Journal Entries; T-Accounts; Financial Statements [LO1, LO2, LO3, LO4, LO5, LO6, LO7] Southworth Company uses a job-order costing system and applies manufacturing overhead cost to
jobs on the basis of the cost of direct materials used in production. Its predetermined overhead rate
was based on a cost formula that estimated $248,000 of manufacturing overhead for an estimated
allocation base of $155,000 direct material dollars. The following transactions took place during
the year (all purchases and services were acquired on account):
a. Raw materials purchased, $142,000.
b. Raw materials requisitioned for use in production (all direct materials), $150,000.
c. Utility bills incurred in the factory, $21,000.
d. Costs for salaries and wages were incurred as follows:
Direct labor . . . . . . . . . . . . . . . . . . . . . . . . . . . . $216,000Indirect labor . . . . . . . . . . . . . . . . . . . . . . . . . . . $90,000Selling and administrative salaries . . . . . . . . . . $145,000
e. Maintenance costs incurred in the factory, $15,000.
f. Advertising costs incurred, $130,000.
g. Depreciation recorded for the year, $50,000 (90% relates to factory assets, and the remainder
relates to selling and administrative assets).
h. Rental cost incurred on buildings, $90,000 (80% of the space is occupied by the factory, and
20% is occupied by sales and administration).
i. Miscellaneous selling and administrative costs incurred, $17,000.
j. Manufacturing overhead cost was applied to jobs, $ ? .
k. Cost of goods manufactured for the year, $590,000.
l. Sales for the year (all on account) totaled $1,000,000. These goods cost $600,000 according
to their job cost sheets.
The balances in the inventory accounts at the beginning of the year were as follows:
Raw Materials . . . . . . . . . . . . . . . . . . . . . . . $18,000Work in Process . . . . . . . . . . . . . . . . . . . . . $24,000Finished Goods . . . . . . . . . . . . . . . . . . . . . . $35,000
Required: 1. Prepare journal entries to record the above data.
2. Post your entries to T-accounts. (Don’t forget to enter the opening inventory balances above.)
Determine the ending balances in the inventory accounts and in the Manufacturing Overhead
account.
3. Prepare a schedule of cost of goods manufactured.
4. Prepare a journal entry to close any balance in the Manufacturing Overhead account to Cost
of Goods Sold. Prepare a schedule of cost of goods sold.
5. Prepare an income statement for the year.
6. Job 218 was one of the many jobs started and completed during the year. The job required
$3,600 in direct materials and 400 hours of direct labor time at a rate of $11 per hour. If the
job contained 500 units and the company billed at 75% above the unit product cost on the job
cost sheet, what price per unit would have been charged to the customer?
PROBLEM 3–26 Multiple Departments; Applying Overhead [LO1, LO2, LO3, LO7] WoodGrain Technology makes home office furniture from fine hardwoods. The company uses a
job-order costing system and predetermined overhead rates to apply manufacturing overhead cost
gar11005_ch03_083-140.indd 125gar11005_ch03_083-140.indd 125 11/11/10 11:29 AM11/11/10 11:29 AM
Rev.Confi rming Pages
126 Chapter 3
to jobs. The predetermined overhead rate in the Preparation Department is based on machine-
hours, and the rate in the Fabrication Department is based on direct labor-hours. At the beginning
of the year, the company’s management made the following estimates for the year:
Department
Preparation Fabrication
Machine-hours . . . . . . . . . . . . . . . . . . . . . . . . . . . . . . . . . . . . . . . 80,000 21,000Direct labor-hours . . . . . . . . . . . . . . . . . . . . . . . . . . . . . . . . . . . . . 35,000 50,000Direct materials cost . . . . . . . . . . . . . . . . . . . . . . . . . . . . . . . . . . . $190,000 $400,000Direct labor cost . . . . . . . . . . . . . . . . . . . . . . . . . . . . . . . . . . . . . . $280,000 $530,000Fixed manufacturing overhead cost . . . . . . . . . . . . . . . . . . . . . . . $256,000 $520,000Variable manufacturing overhead per machine-hour . . . . . . . . . . $2.00 —Variable manufacturing overhead per direct labor-hour . . . . . . . . — $4.00
Job 127 was started on April 1 and completed on May 12. The company’s cost records show
the following information concerning the job:
Department
Preparation Fabrication
Machine-hours . . . . . . . . . . . . . . . . . . 350 70Direct labor-hours . . . . . . . . . . . . . . . . 80 130Direct materials cost . . . . . . . . . . . . . . $940 $1,200Direct labor cost . . . . . . . . . . . . . . . . . $710 $980
Required: 1. Compute the predetermined overhead rate used during the year in the Preparation Depart-
ment. Compute the rate used in the Fabrication Department.
2. Compute the total overhead cost applied to Job 127.
3. What would be the total cost recorded for Job 127? If the job contained 25 units, what would
be the unit product cost?
4. At the end of the year, the records of WoodGrain Technology revealed the following actual cost and operating data for all jobs worked on during the year:
Department
Preparation Fabrication
Machine-hours . . . . . . . . . . . . . . . . . . 73,000 24,000Direct labor-hours . . . . . . . . . . . . . . . . 30,000 54,000Direct materials cost . . . . . . . . . . . . . . $165,000 $420,000Manufacturing overhead cost . . . . . . . $390,000 $740,000
What was the amount of underapplied or overapplied overhead in each department at the end of
the year?
PROBLEM 3–27 Comprehensive Problem [LO1, LO2, LO4, LO5, LO6, LO7] Sovereign Millwork, Ltd., produces reproductions of antique residential moldings at a plant
located in Manchester, England. Because there are hundreds of products, some of which are made
gar11005_ch03_083-140.indd 126gar11005_ch03_083-140.indd 126 11/11/10 11:29 AM11/11/10 11:29 AM
Rev.Confi rming Pages
Job-Order Costing 127
The company applies overhead cost to jobs on the basis of machine-hours. Its predetermined
overhead rate for the fiscal year starting July 1 was based on a cost formula that estimated £99,000
of manufacturing overhead for an estimated activity level of 45,000 machine-hours. During the
year, the following transactions were completed:
a. Raw materials purchased on account, £160,000.
b. Raw materials requisitioned for use in production, £140,000 (materials costing £120,000 were
chargeable directly to jobs; the remaining materials were indirect).
c. Costs for employee services were incurred as follows:
Raw Materials . . . . . . . . . . . . . . . . . . . . . . £10,000Work in Process . . . . . . . . . . . . . . . . . . . . £4,000Finished Goods . . . . . . . . . . . . . . . . . . . . £8,000
only to order, the company uses a job-order costing system. On July 1, the start of the company’s
fiscal year, inventory account balances were as follows:
Direct labor . . . . . . . . . . . . . . . . . . . . . . £90,000Indirect labor . . . . . . . . . . . . . . . . . . . . . £60,000Sales commissions . . . . . . . . . . . . . . . . £20,000Administrative salaries . . . . . . . . . . . . . £50,000
d. Prepaid insurance expired during the year, £18,000 (£13,000 of this amount related to factory
operations, and the remainder related to selling and administrative activities).
e. Utility costs incurred in the factory, £10,000.
f. Advertising costs incurred, £15,000.
g. Depreciation recorded on equipment, £25,000. (£20,000 of this amount was on equipment
used in factory operations; the remaining £5,000 was on equipment used in selling and admin-
istrative activities.)
h. Manufacturing overhead cost was applied to jobs, £?. (The company recorded 50,000
machine-hours of operating time during the year.)
i. Goods that had cost £310,000 to manufacture according to their job cost sheets were
completed.
j. Sales (all on account) to customers during the year totaled £498,000. These goods had cost
£308,000 to manufacture according to their job cost sheets.
Required: 1. Prepare journal entries to record the transactions for the year.
2. Prepare T-accounts for inventories, Manufacturing Overhead, and Cost of Goods Sold. Post
relevant data from your journal entries to these T-accounts (don’t forget to enter the opening
balances in your inventory accounts). Compute an ending balance in each account.
3. Is Manufacturing Overhead underapplied or overapplied for the year? Prepare a journal entry
to close any balance in the Manufacturing Overhead account to Cost of Goods Sold.
4. Prepare an income statement for the year. (Do not prepare a schedule of cost of goods manu-
factured; all of the information needed for the income statement is available in the journal
entries and T-accounts you have prepared.)
gar11005_ch03_083-140.indd 127gar11005_ch03_083-140.indd 127 11/11/10 11:29 AM11/11/10 11:29 AM
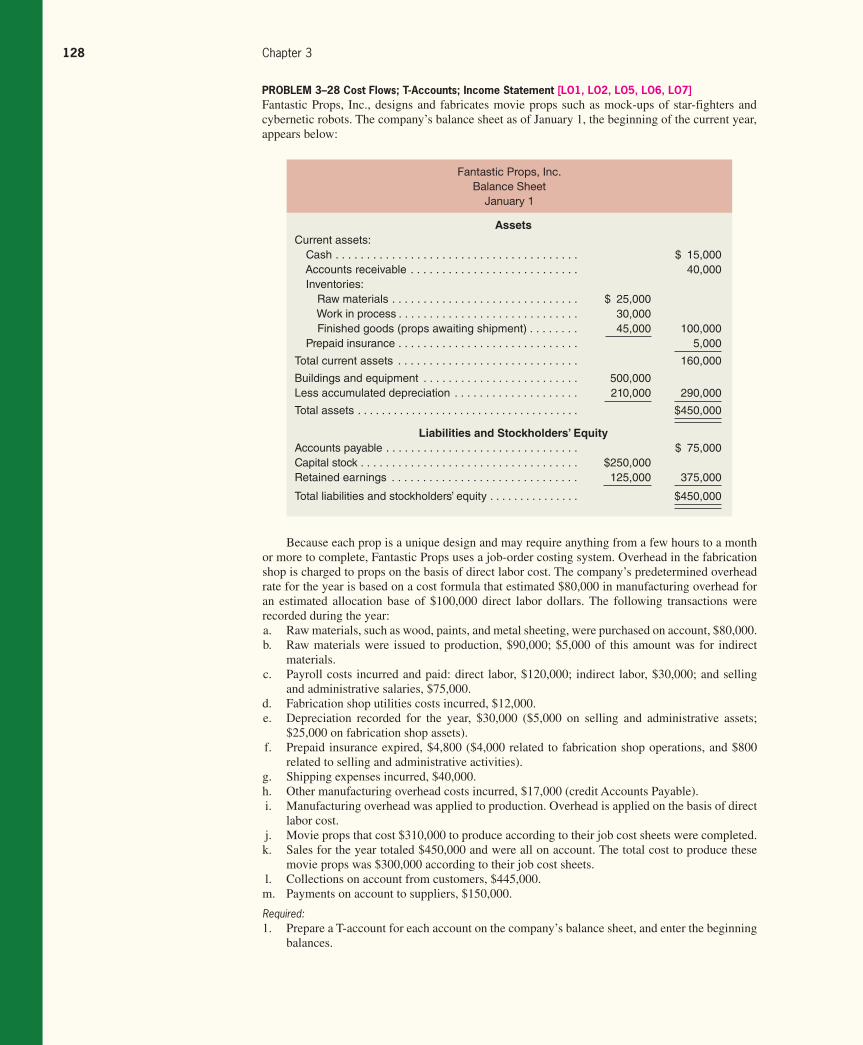
Rev.Confi rming Pages
128 Chapter 3
Because each prop is a unique design and may require anything from a few hours to a month
or more to complete, Fantastic Props uses a job-order costing system. Overhead in the fabrication
shop is charged to props on the basis of direct labor cost. The company’s predetermined overhead
rate for the year is based on a cost formula that estimated $80,000 in manufacturing overhead for
an estimated allocation base of $100,000 direct labor dollars. The following transactions were
recorded during the year:
a. Raw materials, such as wood, paints, and metal sheeting, were purchased on account, $80,000.
b. Raw materials were issued to production, $90,000; $5,000 of this amount was for indirect
materials.
c. Payroll costs incurred and paid: direct labor, $120,000; indirect labor, $30,000; and selling
and administrative salaries, $75,000.
d. Fabrication shop utilities costs incurred, $12,000.
e. Depreciation recorded for the year, $30,000 ($5,000 on selling and administrative assets;
$25,000 on fabrication shop assets).
f. Prepaid insurance expired, $4,800 ($4,000 related to fabrication shop operations, and $800
related to selling and administrative activities).
g. Shipping expenses incurred, $40,000.
h. Other manufacturing overhead costs incurred, $17,000 (credit Accounts Payable).
i. Manufacturing overhead was applied to production. Overhead is applied on the basis of direct
labor cost.
j. Movie props that cost $310,000 to produce according to their job cost sheets were completed.
k. Sales for the year totaled $450,000 and were all on account. The total cost to produce these
movie props was $300,000 according to their job cost sheets.
l. Collections on account from customers, $445,000.
m. Payments on account to suppliers, $150,000.
Required: 1. Prepare a T-account for each account on the company’s balance sheet, and enter the beginning
balances.
Fantastic Props, Inc.
Balance Sheet
January 1
Assets
Current assets: Cash . . . . . . . . . . . . . . . . . . . . . . . . . . . . . . . . . . . . . . . $ 15,000 Accounts receivable . . . . . . . . . . . . . . . . . . . . . . . . . . . 40,000 Inventories: Raw materials . . . . . . . . . . . . . . . . . . . . . . . . . . . . . . $ 25,000 Work in process . . . . . . . . . . . . . . . . . . . . . . . . . . . . . 30,000 Finished goods (props awaiting shipment) . . . . . . . . 45,000 100,000 Prepaid insurance . . . . . . . . . . . . . . . . . . . . . . . . . . . . . 5,000
Total current assets . . . . . . . . . . . . . . . . . . . . . . . . . . . . . 160,000
Buildings and equipment . . . . . . . . . . . . . . . . . . . . . . . . . 500,000Less accumulated depreciation . . . . . . . . . . . . . . . . . . . . 210,000 290,000
Total assets . . . . . . . . . . . . . . . . . . . . . . . . . . . . . . . . . . . . . $450,000
Liabilities and Stockholders’ Equity
Accounts payable . . . . . . . . . . . . . . . . . . . . . . . . . . . . . . . $ 75,000Capital stock . . . . . . . . . . . . . . . . . . . . . . . . . . . . . . . . . . . $250,000Retained earnings . . . . . . . . . . . . . . . . . . . . . . . . . . . . . . 125,000 375,000
Total liabilities and stockholders’ equity . . . . . . . . . . . . . . . $450,000
PROBLEM 3–28 Cost Flows; T-Accounts; Income Statement [LO1, LO2, LO5, LO6, LO7] Fantastic Props, Inc., designs and fabricates movie props such as mock-ups of star-fighters and
cybernetic robots. The company’s balance sheet as of January 1, the beginning of the current year,
appears below:
gar11005_ch03_083-140.indd 128gar11005_ch03_083-140.indd 128 11/11/10 11:29 AM11/11/10 11:29 AM
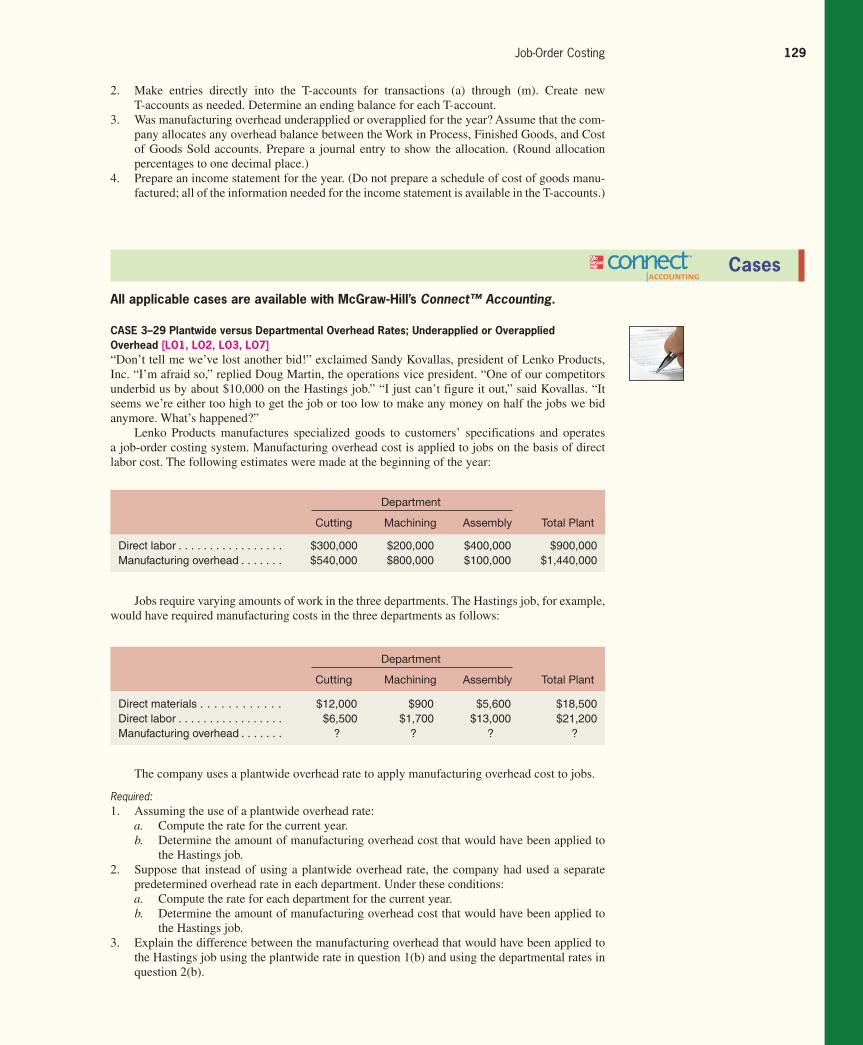
Rev.Confi rming Pages
Job-Order Costing 129
2. Make entries directly into the T-accounts for transactions (a) through (m). Create new
T-accounts as needed. Determine an ending balance for each T-account.
3. Was manufacturing overhead underapplied or overapplied for the year? Assume that the com-
pany allocates any overhead balance between the Work in Process, Finished Goods, and Cost
of Goods Sold accounts. Prepare a journal entry to show the allocation. (Round allocation
percentages to one decimal place.)
4. Prepare an income statement for the year. (Do not prepare a schedule of cost of goods manu-
factured; all of the information needed for the income statement is available in the T-accounts.)
Cases
All applicable cases are available with McGraw-Hill’s Connect™ Accounting .
CASE 3–29 Plantwide versus Departmental Overhead Rates; Underapplied or Overapplied Overhead [LO1, LO2, LO3, LO7] “Don’t tell me we’ve lost another bid!” exclaimed Sandy Kovallas, president of Lenko Products,
Inc. “I’m afraid so,” replied Doug Martin, the operations vice president. “One of our competitors
underbid us by about $10,000 on the Hastings job.” “I just can’t figure it out,” said Kovallas. “It
seems we’re either too high to get the job or too low to make any money on half the jobs we bid
anymore. What’s happened?”
Lenko Products manufactures specialized goods to customers’ specifications and operates
a job-order costing system. Manufacturing overhead cost is applied to jobs on the basis of direct
labor cost. The following estimates were made at the beginning of the year:
Department
Cutting Machining Assembly Total Plant
Direct labor . . . . . . . . . . . . . . . . . $300,000 $200,000 $400,000 $900,000Manufacturing overhead . . . . . . . $540,000 $800,000 $100,000 $1,440,000
Jobs require varying amounts of work in the three departments. The Hastings job, for example,
would have required manufacturing costs in the three departments as follows:
The company uses a plantwide overhead rate to apply manufacturing overhead cost to jobs.
Required: 1. Assuming the use of a plantwide overhead rate:
a. Compute the rate for the current year.
b. Determine the amount of manufacturing overhead cost that would have been applied to
the Hastings job.
2. Suppose that instead of using a plantwide overhead rate, the company had used a separate
predetermined overhead rate in each department. Under these conditions:
a. Compute the rate for each department for the current year.
b. Determine the amount of manufacturing overhead cost that would have been applied to
the Hastings job.
3. Explain the difference between the manufacturing overhead that would have been applied to
the Hastings job using the plantwide rate in question 1(b) and using the departmental rates in
question 2(b).
Department
Cutting Machining Assembly Total Plant
Direct materials . . . . . . . . . . . . $12,000 $900 $5,600 $18,500Direct labor . . . . . . . . . . . . . . . . . $6,500 $1,700 $13,000 $21,200Manufacturing overhead . . . . . . . ? ? ? ?
gar11005_ch03_083-140.indd 129gar11005_ch03_083-140.indd 129 11/11/10 11:29 AM11/11/10 11:29 AM
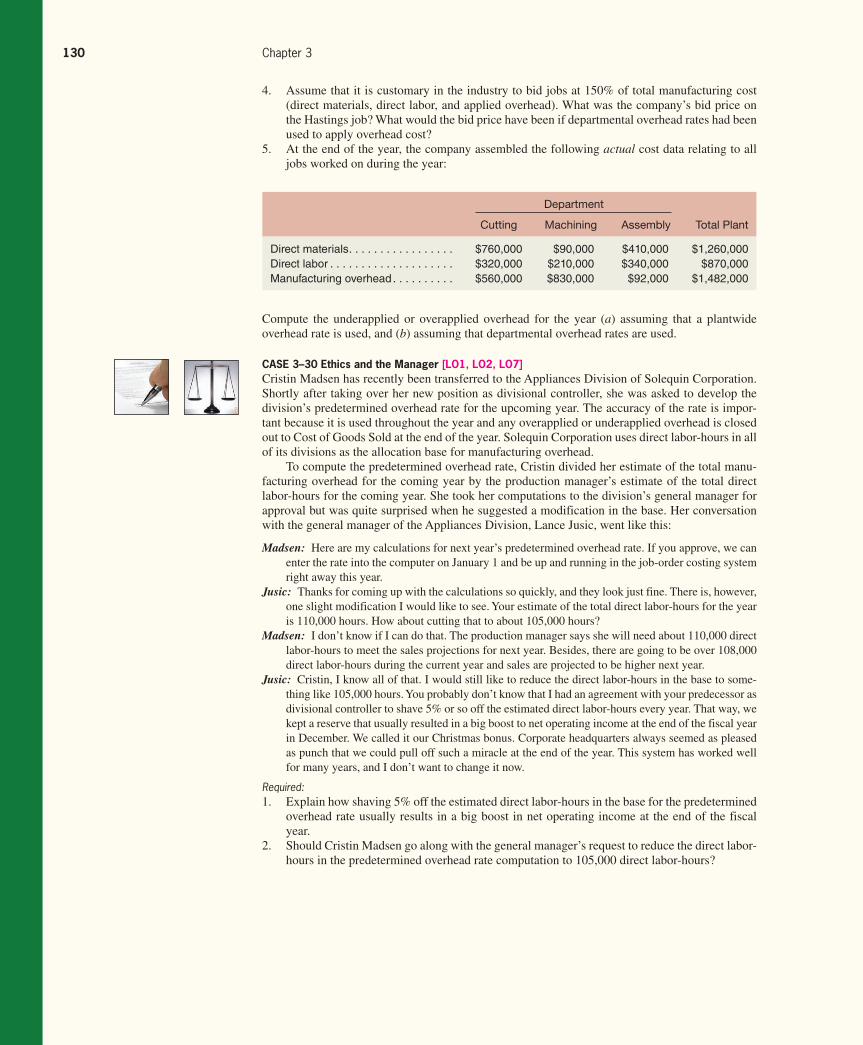
Rev.Confi rming Pages
130 Chapter 3
4. Assume that it is customary in the industry to bid jobs at 150% of total manufacturing cost
(direct materials, direct labor, and applied overhead). What was the company’s bid price on
the Hastings job? What would the bid price have been if departmental overhead rates had been
used to apply overhead cost?
5. At the end of the year, the company assembled the following actual cost data relating to all
jobs worked on during the year:
Department
Cutting Machining Assembly Total Plant
Direct materials. . . . . . . . . . . . . . . . . $760,000 $90,000 $410,000 $1,260,000Direct labor . . . . . . . . . . . . . . . . . . . . $320,000 $210,000 $340,000 $870,000Manufacturing overhead . . . . . . . . . . $560,000 $830,000 $92,000 $1,482,000
Compute the underapplied or overapplied overhead for the year ( a ) assuming that a plantwide
overhead rate is used, and ( b ) assuming that departmental overhead rates are used.
CASE 3–30 Ethics and the Manager [LO1, LO2, LO7] Cristin Madsen has recently been transferred to the Appliances Division of Solequin Corporation.
Shortly after taking over her new position as divisional controller, she was asked to develop the
division’s predetermined overhead rate for the upcoming year. The accuracy of the rate is impor-
tant because it is used throughout the year and any overapplied or underapplied overhead is closed
out to Cost of Goods Sold at the end of the year. Solequin Corporation uses direct labor-hours in all
of its divisions as the allocation base for manufacturing overhead.
To compute the predetermined overhead rate, Cristin divided her estimate of the total manu-
facturing overhead for the coming year by the production manager’s estimate of the total direct
labor-hours for the coming year. She took her computations to the division’s general manager for
approval but was quite surprised when he suggested a modification in the base. Her conversation
with the general manager of the Appliances Division, Lance Jusic, went like this:
Madsen: Here are my calculations for next year’s predetermined overhead rate. If you approve, we can
enter the rate into the computer on January 1 and be up and running in the job-order costing system
right away this year.
Jusic: Thanks for coming up with the calculations so quickly, and they look just fine. There is, however,
one slight modification I would like to see. Your estimate of the total direct labor-hours for the year
is 110,000 hours. How about cutting that to about 105,000 hours?
Madsen: I don’t know if I can do that. The production manager says she will need about 110,000 direct
labor-hours to meet the sales projections for next year. Besides, there are going to be over 108,000
direct labor-hours during the current year and sales are projected to be higher next year.
Jusic: Cristin, I know all of that. I would still like to reduce the direct labor-hours in the base to some-
thing like 105,000 hours. You probably don’t know that I had an agreement with your predecessor as
divisional controller to shave 5% or so off the estimated direct labor-hours every year. That way, we
kept a reserve that usually resulted in a big boost to net operating income at the end of the fiscal year
in December. We called it our Christmas bonus. Corporate headquarters always seemed as pleased
as punch that we could pull off such a miracle at the end of the year. This system has worked well
for many years, and I don’t want to change it now.
Required: 1. Explain how shaving 5% off the estimated direct labor-hours in the base for the predetermined
overhead rate usually results in a big boost in net operating income at the end of the fiscal
year.
2. Should Cristin Madsen go along with the general manager’s request to reduce the direct labor-
hours in the predetermined overhead rate computation to 105,000 direct labor-hours?
gar11005_ch03_083-140.indd 130gar11005_ch03_083-140.indd 130 11/11/10 11:29 AM11/11/10 11:29 AM
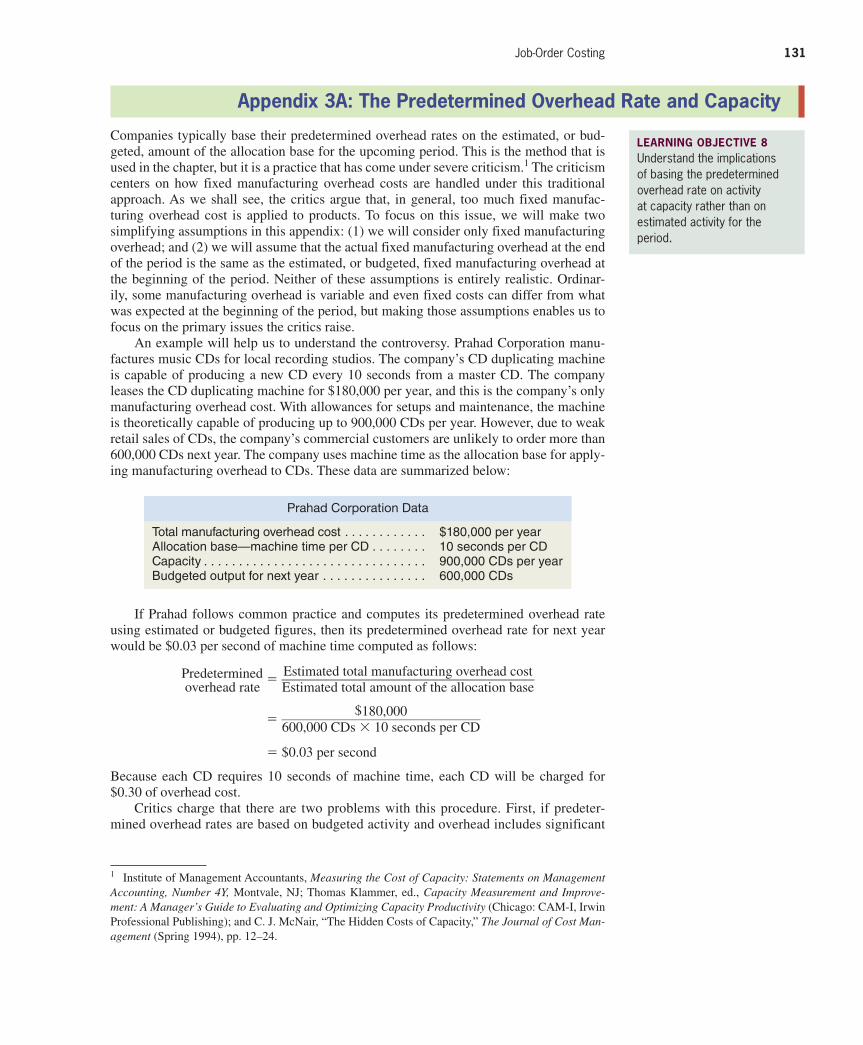
Rev.Confi rming Pages
Job-Order Costing 131
Appendix 3A: The Predetermined Overhead Rate and Capacity
Companies typically base their predetermined overhead rates on the estimated, or bud-
geted, amount of the allocation base for the upcoming period. This is the method that is
used in the chapter, but it is a practice that has come under severe criticism. 1 The criticism
centers on how fixed manufacturing overhead costs are handled under this traditional
approach. As we shall see, the critics argue that, in general, too much fixed manufac-
turing overhead cost is applied to products. To focus on this issue, we will make two
simplifying assumptions in this appendix: (1) we will consider only fixed manufacturing
overhead; and (2) we will assume that the actual fixed manufacturing overhead at the end
of the period is the same as the estimated, or budgeted, fixed manufacturing overhead at
the beginning of the period. Neither of these assumptions is entirely realistic. Ordinar-
ily, some manufacturing overhead is variable and even fixed costs can differ from what
was expected at the beginning of the period, but making those assumptions enables us to
focus on the primary issues the critics raise.
An example will help us to understand the controversy. Prahad Corporation manu-
factures music CDs for local recording studios. The company’s CD duplicating machine
is capable of producing a new CD every 10 seconds from a master CD. The company
leases the CD duplicating machine for $180,000 per year, and this is the company’s only
manufacturing overhead cost. With allowances for setups and maintenance, the machine
is theoretically capable of producing up to 900,000 CDs per year. However, due to weak
retail sales of CDs, the company’s commercial customers are unlikely to order more than
600,000 CDs next year. The company uses machine time as the allocation base for apply-
ing manufacturing overhead to CDs. These data are summarized below:
LEARNING OBJECTIVE 8 Understand the implications of basing the predetermined overhead rate on activity at capacity rather than on estimated activity for the period.
1 Institute of Management Accountants, Measuring the Cost of Capacity: Statements on Management Accounting, Number 4Y, Montvale, NJ; Thomas Klammer, ed., Capacity Measurement and Improve-ment: A Manager’s Guide to Evaluating and Optimizing Capacity Productivity (Chicago: CAM-I, Irwin
Professional Publishing); and C. J. McNair, “The Hidden Costs of Capacity,” The Journal of Cost Man-agement (Spring 1994), pp. 12–24.
Prahad Corporation Data
Total manufacturing overhead cost . . . . . . . . . . . . $180,000 per yearAllocation base—machine time per CD . . . . . . . . 10 seconds per CDCapacity . . . . . . . . . . . . . . . . . . . . . . . . . . . . . . . . 900,000 CDs per yearBudgeted output for next year . . . . . . . . . . . . . . . 600,000 CDs
If Prahad follows common practice and computes its predetermined overhead rate
using estimated or budgeted figures, then its predetermined overhead rate for next year
would be $0.03 per second of machine time computed as follows:
Predetermined overhead rate
= Estimated total manufacturing overhead cost
_____________________________________ Estimated total amount of the allocation base
= $180,000
_____________________________ 600,000 CDs × 10 seconds per CD
= $0.03 per second
Because each CD requires 10 seconds of machine time, each CD will be charged for
$0.30 of overhead cost.
Critics charge that there are two problems with this procedure. First, if predeter-
mined overhead rates are based on budgeted activity and overhead includes significant
gar11005_ch03_083-140.indd 131gar11005_ch03_083-140.indd 131 11/11/10 11:29 AM11/11/10 11:29 AM

Rev.Confi rming Pages
132 Chapter 3
fixed costs, then the unit product costs will fluctuate depending on the budgeted level
of activity for the period. For example, if the budgeted output for the year was only
300,000 CDs, the predetermined overhead rate would be $0.06 per second of machine
time or $0.60 per CD rather than $0.30 per CD. In general, if budgeted output falls,
the overhead cost per unit will increase; it will appear that the CDs cost more to make.
Managers may then be tempted to increase prices at the worst possible time—just as
demand is falling.
Second, critics charge that under the traditional approach, products are charged for
resources that they don’t use. When the fixed costs of capacity are spread over estimated
activity, the units that are produced must shoulder the costs of unused capacity. That is
why the applied overhead cost per unit increases as the level of activity falls. The critics
argue that products should be charged only for the capacity that they use; they should
not be charged for the capacity they don’t use. This can be accomplished by basing the
predetermined overhead rate on capacity as follows:
Predetermined overhead rate based on capacity
= Estimated total manufacturing overhead cost at capacity
______________________________________________ Estimated total amount of the allocation base at capacity
= $180,000
______________________________ 900,000 CDs × 10 seconds per CD
= $0.02 per second
It is important to realize that the numerator in this predetermined overhead rate is the
estimated total manufacturing overhead cost at capacity. In general, the numerator in
a predetermined overhead rate is the estimated total manufacturing overhead cost for
the level of activity in the denominator. Ordinarily, the estimated total manufacturing
overhead cost at capacity will be larger than the estimated total manufacturing over-
head cost at the estimated level of activity. The estimated level of activity in this case
was 600,000 CDs (or 6 million seconds of machine time), whereas capacity is 900,000
CDs (or 9 million seconds of machine time). The estimated total manufacturing over-
head cost at 600,000 CDs was $180,000. This also happens to be the estimated total
manufacturing overhead cost at 900,000 CDs, but that only happens because we have
assumed that the manufacturing overhead is entirely fixed. If manufacturing overhead
contained any variable element, the total manufacturing overhead would be larger at
900,000 CDs than at 600,000 CDs and, in that case, the predetermined overhead rate
should reflect that fact.
At any rate, returning to the computation of the predetermined overhead rate based
on capacity, the predetermined overhead rate is $0.02 per second and so the overhead
cost applied to each CD would be $0.20. This charge is constant and would not be
affected by the level of activity during a period. If output falls, the charge would still be
$0.20 per CD.
This method will almost certainly result in underapplied overhead. If actual
output at Prahad Corporation is 600,000 CDs, then only $120,000 of overhead cost
would be applied to products ($0.20 per CD × 600,000 CDs). Because the actual
overhead cost is $180,000, overhead would be underapplied by $60,000. Because we
are assuming that manufacturing overhead is entirely fixed and that actual manufac-
turing overhead equals the manufacturing overhead as estimated at the beginning of
the year, the underapplied overhead represents the cost of unused capacity. In other
words, if there had been no unused capacity, there would have been no underap-
plied overhead. The critics suggest that the underapplied overhead that results from
unused capacity should be separately disclosed on the income statement as the Cost
of Unused Capacity—a period expense. Disclosing this cost as a lump sum on the
income statement, rather than burying it in Cost of Goods Sold or ending inventories,
gar11005_ch03_083-140.indd 132gar11005_ch03_083-140.indd 132 11/11/10 11:29 AM11/11/10 11:29 AM
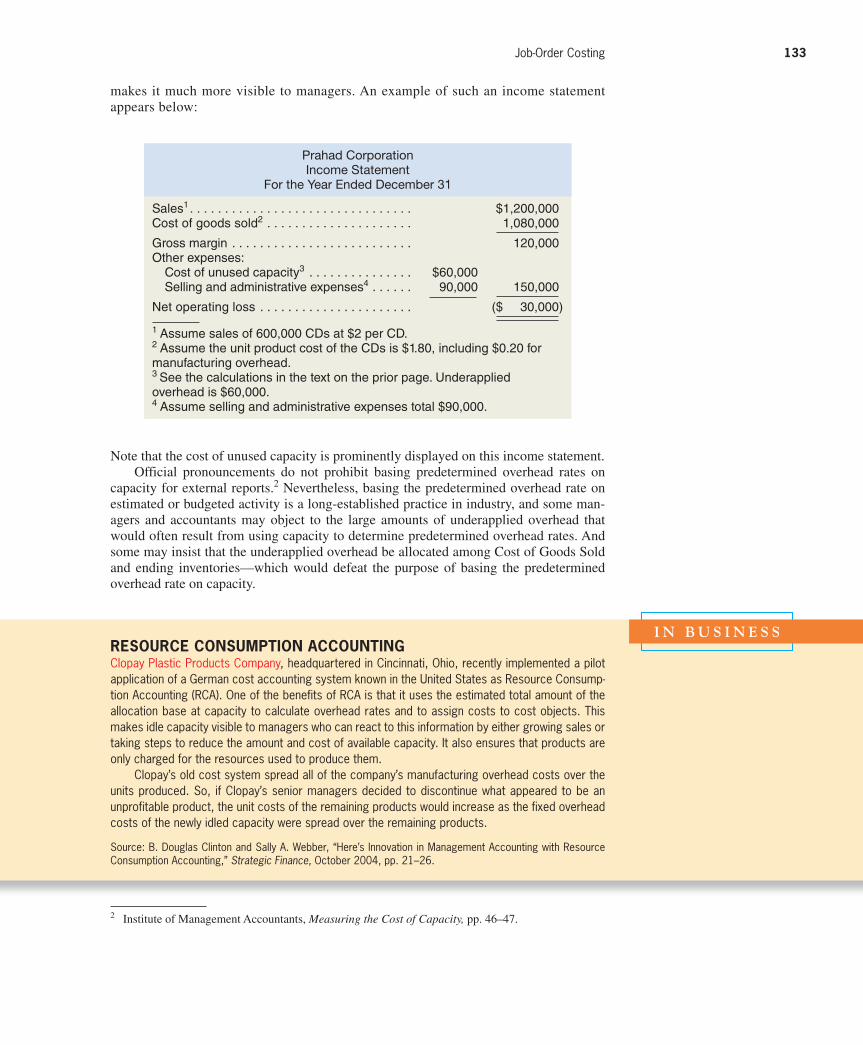
Rev.Confi rming Pages
Job-Order Costing 133
Note that the cost of unused capacity is prominently displayed on this income statement.
Official pronouncements do not prohibit basing predetermined overhead rates on
capacity for external reports. 2 Nevertheless, basing the predetermined overhead rate on
estimated or budgeted activity is a long-established practice in industry, and some man-
agers and accountants may object to the large amounts of underapplied overhead that
would often result from using capacity to determine predetermined overhead rates. And
some may insist that the underapplied overhead be allocated among Cost of Goods Sold
and ending inventories—which would defeat the purpose of basing the predetermined
overhead rate on capacity.
Prahad Corporation Income Statement
For the Year Ended December 31
Sales 1 . . . . . . . . . . . . . . . . . . . . . . . . . . . . . . . . $1,200,000 Cost of goods sold 2 . . . . . . . . . . . . . . . . . . . . . 1,080,000
Gross margin . . . . . . . . . . . . . . . . . . . . . . . . . . 120,000 Other expenses: Cost of unused capacity 3 . . . . . . . . . . . . . . . $60,000 Selling and administrative expenses 4 . . . . . . 90,000 150,000
Net operating loss . . . . . . . . . . . . . . . . . . . . . . ($ 30,000)
1 Assume sales of 600,000 CDs at $2 per CD. 2 Assume the unit product cost of the CDs is $1.80, including $0.20 for manufacturing overhead. 3 See the calculations in the text on the prior page. Underapplied overhead is $60,000. 4 Assume selling and administrative expenses total $90,000.
2 Institute of Management Accountants, Measuring the Cost of Capacity, pp. 46–47.
I N B U S I N E S S RESOURCE CONSUMPTION ACCOUNTING Clopay Plastic Products Company, headquartered in Cincinnati, Ohio, recently implemented a pilot application of a German cost accounting system known in the United States as Resource Consump-tion Accounting (RCA). One of the benefits of RCA is that it uses the estimated total amount of the allocation base at capacity to calculate overhead rates and to assign costs to cost objects. This makes idle capacity visible to managers who can react to this information by either growing sales or taking steps to reduce the amount and cost of available capacity. It also ensures that products are only charged for the resources used to produce them.
Clopay’s old cost system spread all of the company’s manufacturing overhead costs over the units produced. So, if Clopay’s senior managers decided to discontinue what appeared to be an unprofitable product, the unit costs of the remaining products would increase as the fixed overhead costs of the newly idled capacity were spread over the remaining products.
Source: B. Douglas Clinton and Sally A. Webber, “Here’s Innovation in Management Accounting with Resource Consumption Accounting,” Strategic Finance, October 2004, pp. 21–26.
makes it much more visible to managers. An example of such an income statement
appears below:
gar11005_ch03_083-140.indd 133gar11005_ch03_083-140.indd 133 11/11/10 11:29 AM11/11/10 11:29 AM
Rev.Confi rming Pages
134 Chapter 3
“Professional staff hours available” is a measure of the capacity of the firm. Any hours available
that are not charged to clients’ accounts represent unused capacity. All of the firm’s overhead is
fixed.
Required: 1. Jennifer Miyami is an established client whose pension plan was set up many years ago. In
both 2010 and 2011, only five hours of professional staff time were charged to Ms. Miyami’s
account. If the company bases its predetermined overhead rate on the estimated overhead cost
and the estimated professional staff hours to be charged to clients, how much overhead cost
would have been applied to Ms. Miyami’s account in 2010? In 2011?
2. Suppose that the company bases its predetermined overhead rate on the estimated overhead
cost and the estimated professional staff hours to be charged to clients as in (1) above. Also
suppose that the actual professional staff hours charged to clients’ accounts and the actual
overhead costs turn out to be exactly as estimated in both years. By how much would the
overhead be underapplied or overapplied in 2010? In 2011?
3. Refer back to the data concerning Ms. Miyami in (1) above. If the company bases its predeter-
mined overhead rate on the professional staff hours available, how much overhead cost would
have been applied to Ms. Miyami’s account in 2010? In 2011?
4. Suppose that the company bases its predetermined overhead rate on the professional staff
hours available as in (3) above. Also, suppose that the actual professional staff hours charged
to clients’ accounts and the actual overhead costs turn out to be exactly as estimated in both
years. By how much would the overhead be underapplied or overapplied in 2010? In 2011?
EXERCISE 3A–2 Overhead Rate Based on Capacity [LO8] Wixis Cabinets makes custom wooden cabinets for high-end stereo systems from specialty woods.
The company uses a job-order costing system. The capacity of the plant is determined by the
capacity of its constraint, which is time on the automated bandsaw that makes finely beveled cuts
in wood according to the preprogrammed specifications of each cabinet. The bandsaw can oper-
ate up to 180 hours per month. The estimated total manufacturing overhead at capacity is $14,760
per month. The company bases its predetermined overhead rate on capacity, so its predetermined
overhead rate is $82 per hour of bandsaw use.
The results of a recent month’s operations appear below:
Appendix 3A Exercises and Problems
All applicable exercises and problems are available with McGraw-Hill’s Connect™ Accounting .
EXERCISE 3A–1 Overhead Rates and Capacity Issues [LO1, LO2, LO7, LO8] Estate Pension Services helps clients to set up and administer pension plans that are in compliance
with tax laws and regulatory requirements. The firm uses a job-order costing system in which over-
head is applied to clients’ accounts on the basis of professional staff hours charged to the accounts.
Data concerning two recent years appear below:
2010 2011
Estimated professional staff hours to be charged to clients’ accounts . . . . . . . . . . . . . . . . . . . . . . . . . . . . . . . . . . . . . . . 2,400 2,250Estimated overhead cost . . . . . . . . . . . . . . . . . . . . . . . . . . . . . . . . . . $144,000 $144,000Professional staff hours available . . . . . . . . . . . . . . . . . . . . . . . . . . . . 3,000 3,000
Sales . . . . . . . . . . . . . . . . . . . . . . . . . . . . . . . . . $43,740Beginning inventories . . . . . . . . . . . . . . . . . . . . $0Ending inventories . . . . . . . . . . . . . . . . . . . . . . . $0Direct materials . . . . . . . . . . . . . . . . . . . . . . . . . $5,350Direct labor (all variable) . . . . . . . . . . . . . . . . . . $8,860Manufacturing overhead incurred . . . . . . . . . . . $14,220Selling and administrative expense . . . . . . . . . $8,180Actual hours of bandsaw use . . . . . . . . . . . . . . 150
gar11005_ch03_083-140.indd 134gar11005_ch03_083-140.indd 134 11/11/10 11:29 AM11/11/10 11:29 AM
Rev.Confi rming Pages
Job-Order Costing 135
Required: 1. Prepare an income statement following the example in Appendix 3A in which any underap-
plied overhead is directly recorded on the income statement as an expense.
2. Why is overhead ordinarily underapplied when the predetermined overhead rate is based on
capacity?
PROBLEM 3A–3 Predetermined Overhead Rate and Capacity [LO1, LO2, LO7, LO8] Skid Road Recording, Inc., is a small audio recording studio located in Seattle. The company
handles work for advertising agencies—primarily for radio ads—and has a few singers and bands
as clients. Skid Road Recording handles all aspects of recording from editing to making a digital
master from which CDs can be copied. The competition in the audio recording industry in Seattle
has always been tough, but it has been getting even tougher over the last several years. The studio
has been losing customers to newer studios that are equipped with more up-to-date equipment and
that are able to offer very attractive prices and excellent service. Summary data concerning the last
two years of operations follow:
2010 2011
Estimated hours of studio service . . . . . . . . . . . . . 1,000 750Estimated studio overhead cost . . . . . . . . . . . . . . $90,000 $90,000Actual hours of studio service provided . . . . . . . . 900 600Actual studio overhead cost incurred . . . . . . . . . . $90,000 $90,000Hours of studio service at capacity . . . . . . . . . . . . 1,800 1,800
The company applies studio overhead to recording jobs on the basis of the hours of studio ser-
vice provided. For example, 30 hours of studio time were required to record, edit, and master the
Slug Fest music CD for a local band. All of the studio overhead is fixed, and the actual overhead
cost incurred was exactly as estimated at the beginning of the year in both 2010 and 2011.
Required: 1. Skid Road Recording computes its predetermined overhead rate at the beginning of each year
based on the estimated studio overhead and the estimated hours of studio service for the year.
How much overhead would have been applied to the Slug Fest job if it had been done in 2010?
In 2011? By how much would overhead have been underapplied or overapplied in 2010?
In 2011?
2. The president of Skid Road Recording has heard that some companies in the industry have
changed to a system of computing the predetermined overhead rate at the beginning of each
year based on the hours of studio service that could be provided at capacity. He would like
to know what effect this method would have on job costs. How much overhead would have
been applied using this method to the Slug Fest job if it had been done in 2010? In 2011?
By how much would overhead have been underapplied or overapplied in 2010 using this
method? In 2011?
3. How would you interpret the underapplied or overapplied overhead that results from using
studio hours at capacity to compute the predetermined overhead rate?
4. What fundamental business problem is Skid Road Recording facing? Which method of com-
puting the predetermined overhead rate is likely to be more helpful in facing this problem?
Explain.
CASE 3A–4 Ethics; Predetermined Overhead Rate and Capacity [LO2, LO7, LO8] Melissa Ostwerk, the new controller of TurboDrives, Inc., has just returned from a seminar on the
choice of the activity level in the predetermined overhead rate. Even though the subject did not
sound exciting at first, she found that there were some important ideas presented that should get a
hearing at her company. After returning from the seminar, she arranged a meeting with the produc-
tion manager, Jan Kingman, and the assistant production manager, Lonny Chan.
Melissa: I ran across an idea that I wanted to check out with both of you. It’s about the way we compute
predetermined overhead rates.
Jan: We’re all ears.
Melissa: We compute the predetermined overhead rate by dividing the estimated total factory overhead for
the coming year, which is all a fixed cost, by the estimated total units produced for the coming year.
gar11005_ch03_083-140.indd 135gar11005_ch03_083-140.indd 135 11/11/10 11:29 AM11/11/10 11:29 AM
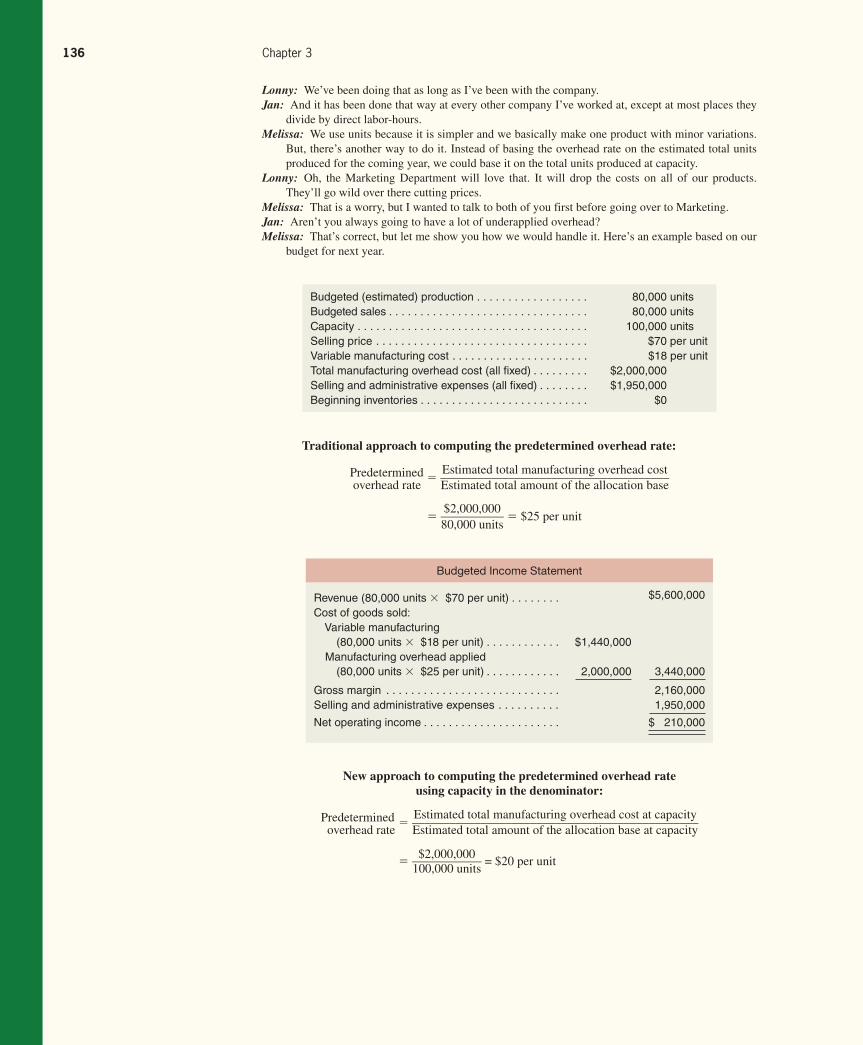
Rev.Confi rming Pages
136 Chapter 3
Lonny: We’ve been doing that as long as I’ve been with the company.
Jan: And it has been done that way at every other company I’ve worked at, except at most places they
divide by direct labor-hours.
Melissa: We use units because it is simpler and we basically make one product with minor variations.
But, there’s another way to do it. Instead of basing the overhead rate on the estimated total units
produced for the coming year, we could base it on the total units produced at capacity.
Lonny: Oh, the Marketing Department will love that. It will drop the costs on all of our products.
They’ll go wild over there cutting prices.
Melissa: That is a worry, but I wanted to talk to both of you first before going over to Marketing.
Jan: Aren’t you always going to have a lot of underapplied overhead?
Melissa: That’s correct, but let me show you how we would handle it. Here’s an example based on our
budget for next year.
Budgeted (estimated) production . . . . . . . . . . . . . . . . . . 80,000 units Budgeted sales . . . . . . . . . . . . . . . . . . . . . . . . . . . . . . . . 80,000 units Capacity . . . . . . . . . . . . . . . . . . . . . . . . . . . . . . . . . . . . . 100,000 units Selling price . . . . . . . . . . . . . . . . . . . . . . . . . . . . . . . . . . $70 per unitVariable manufacturing cost . . . . . . . . . . . . . . . . . . . . . . $18 per unitTotal manufacturing overhead cost (all fi xed) . . . . . . . . . $2,000,000 Selling and administrative expenses (all fi xed) . . . . . . . . $1,950,000 Beginning inventories . . . . . . . . . . . . . . . . . . . . . . . . . . . $0
Traditional approach to computing the predetermined overhead rate:
Predetermined overhead rate
= Estimated total manufacturing overhead cost
_____________________________________ Estimated total amount of the allocation base
= $2,000,000
___________ 80,000 units
= $25 per unit
Budgeted Income Statement
Revenue (80,000 units × $70 per unit) . . . . . . . . $5,600,000
Cost of goods sold: Variable manufacturing (80,000 units × $18 per unit) . . . . . . . . . . . . $1,440,000 Manufacturing overhead applied (80,000 units × $25 per unit) . . . . . . . . . . . . 2,000,000 3,440,000
Gross margin . . . . . . . . . . . . . . . . . . . . . . . . . . . . 2,160,000Selling and administrative expenses . . . . . . . . . . 1,950,000
Net operating income . . . . . . . . . . . . . . . . . . . . . . $ 210,000
New approach to computing the predetermined overhead rate using capacity in the denominator:
Predetermined overhead rate
= Estimated total manufacturing overhead cost at capacity
______________________________________________ Estimated total amount of the allocation base at capacity
= $2,000,000
____________ 100,000 units
= $20 per unit
gar11005_ch03_083-140.indd 136gar11005_ch03_083-140.indd 136 11/11/10 11:29 AM11/11/10 11:29 AM
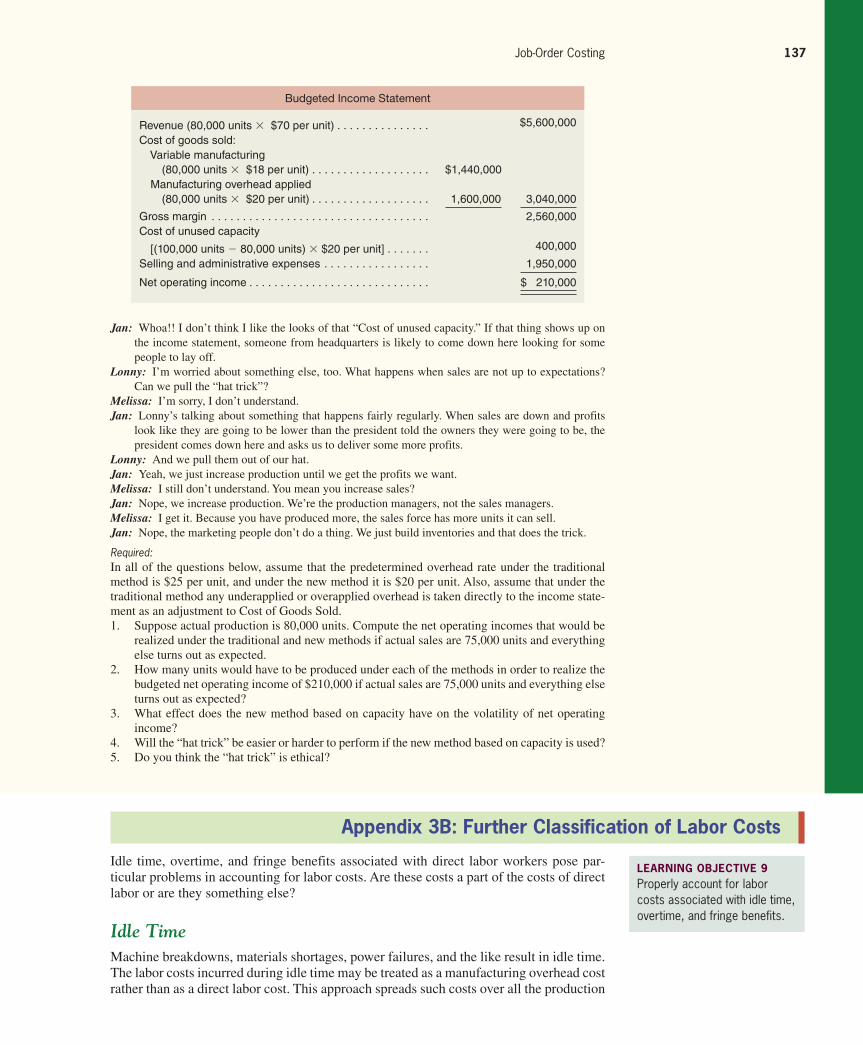
Rev.Confi rming Pages
Job-Order Costing 137
Jan: Whoa!! I don’t think I like the looks of that “Cost of unused capacity.” If that thing shows up on
the income statement, someone from headquarters is likely to come down here looking for some
people to lay off.
Lonny: I’m worried about something else, too. What happens when sales are not up to expectations?
Can we pull the “hat trick”?
Melissa: I’m sorry, I don’t understand.
Jan: Lonny’s talking about something that happens fairly regularly. When sales are down and profits
look like they are going to be lower than the president told the owners they were going to be, the
president comes down here and asks us to deliver some more profits.
Lonny: And we pull them out of our hat.
Jan: Yeah, we just increase production until we get the profits we want.
Melissa: I still don’t understand. You mean you increase sales?
Jan: Nope, we increase production. We’re the production managers, not the sales managers.
Melissa: I get it. Because you have produced more, the sales force has more units it can sell.
Jan: Nope, the marketing people don’t do a thing. We just build inventories and that does the trick.
Required: In all of the questions below, assume that the predetermined overhead rate under the traditional
method is $25 per unit, and under the new method it is $20 per unit. Also, assume that under the
traditional method any underapplied or overapplied overhead is taken directly to the income state-
ment as an adjustment to Cost of Goods Sold.
1. Suppose actual production is 80,000 units. Compute the net operating incomes that would be
realized under the traditional and new methods if actual sales are 75,000 units and everything
else turns out as expected.
2. How many units would have to be produced under each of the methods in order to realize the
budgeted net operating income of $210,000 if actual sales are 75,000 units and everything else
turns out as expected?
3. What effect does the new method based on capacity have on the volatility of net operating
income?
4. Will the “hat trick” be easier or harder to perform if the new method based on capacity is used?
5. Do you think the “hat trick” is ethical?
Budgeted Income Statement
Revenue (80,000 units × $70 per unit) . . . . . . . . . . . . . . . $5,600,000
Cost of goods sold: Variable manufacturing (80,000 units × $18 per unit) . . . . . . . . . . . . . . . . . . . $1,440,000 Manufacturing overhead applied (80,000 units × $20 per unit) . . . . . . . . . . . . . . . . . . . 1,600,000 3,040,000
Gross margin . . . . . . . . . . . . . . . . . . . . . . . . . . . . . . . . . . . 2,560,000Cost of unused capacity
[(100,000 units − 80,000 units) × $20 per unit] . . . . . . . 400,000
Selling and administrative expenses . . . . . . . . . . . . . . . . . 1,950,000
Net operating income . . . . . . . . . . . . . . . . . . . . . . . . . . . . . $ 210,000
Appendix 3B: Further Classification of Labor Costs
Idle time, overtime, and fringe benefits associated with direct labor workers pose par-
ticular problems in accounting for labor costs. Are these costs a part of the costs of direct
labor or are they something else?
Idle Time
Machine breakdowns, materials shortages, power failures, and the like result in idle time.
The labor costs incurred during idle time may be treated as a manufacturing overhead cost
rather than as a direct labor cost. This approach spreads such costs over all the production
LEARNING OBJECTIVE 9 Properly account for labor costs associated with idle time, overtime, and fringe benefits.
gar11005_ch03_083-140.indd 137gar11005_ch03_083-140.indd 137 11/11/10 11:29 AM11/11/10 11:29 AM
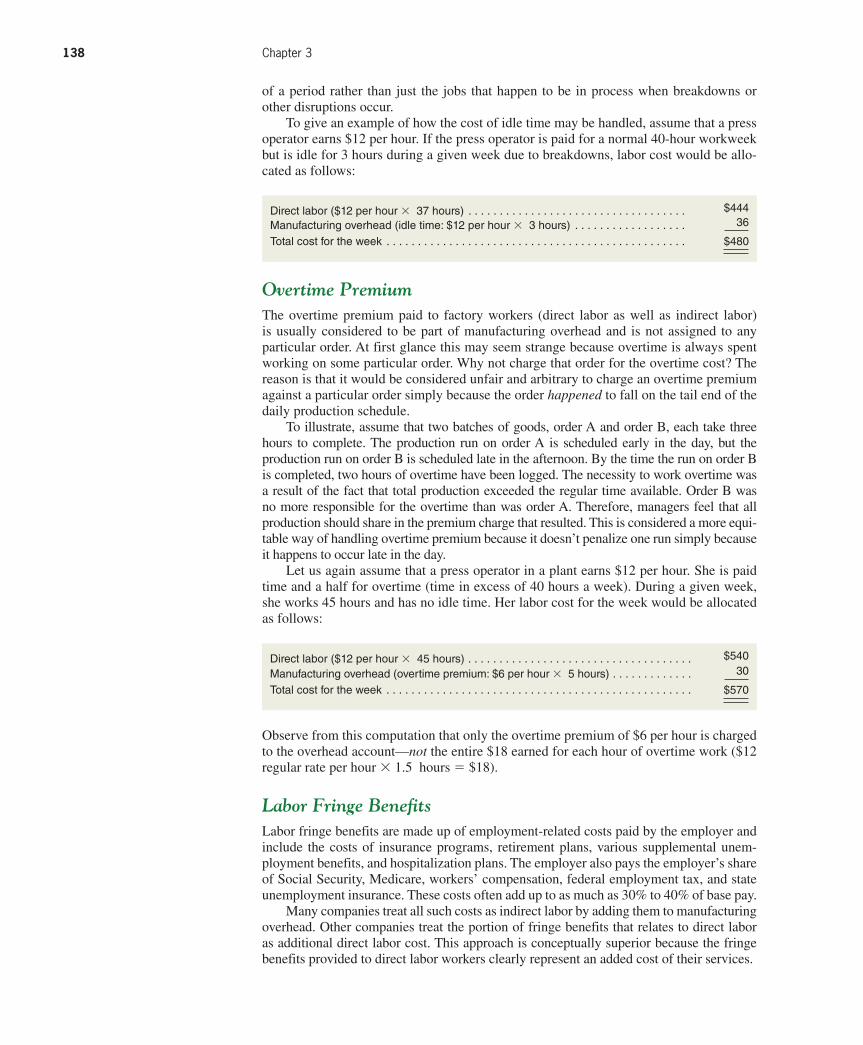
Rev.Confi rming Pages
138 Chapter 3
of a period rather than just the jobs that happen to be in process when breakdowns or
other disruptions occur.
To give an example of how the cost of idle time may be handled, assume that a press
operator earns $12 per hour. If the press operator is paid for a normal 40-hour workweek
but is idle for 3 hours during a given week due to breakdowns, labor cost would be allo-
cated as follows:
Direct labor ($12 per hour × 37 hours) . . . . . . . . . . . . . . . . . . . . . . . . . . . . . . . . . . . $444
Manufacturing overhead (idle time: $12 per hour × 3 hours) . . . . . . . . . . . . . . . . . . 36
Total cost for the week . . . . . . . . . . . . . . . . . . . . . . . . . . . . . . . . . . . . . . . . . . . . . . . . $480
Overtime Premium
The overtime premium paid to factory workers (direct labor as well as indirect labor)
is usually considered to be part of manufacturing overhead and is not assigned to any
particular order. At first glance this may seem strange because overtime is always spent
working on some particular order. Why not charge that order for the overtime cost? The
reason is that it would be considered unfair and arbitrary to charge an overtime premium
against a particular order simply because the order happened to fall on the tail end of the
daily production schedule.
To illustrate, assume that two batches of goods, order A and order B, each take three
hours to complete. The production run on order A is scheduled early in the day, but the
production run on order B is scheduled late in the afternoon. By the time the run on order B
is completed, two hours of overtime have been logged. The necessity to work overtime was
a result of the fact that total production exceeded the regular time available. Order B was
no more responsible for the overtime than was order A. Therefore, managers feel that all
production should share in the premium charge that resulted. This is considered a more equi-
table way of handling overtime premium because it doesn’t penalize one run simply because
it happens to occur late in the day.
Let us again assume that a press operator in a plant earns $12 per hour. She is paid
time and a half for overtime (time in excess of 40 hours a week). During a given week,
she works 45 hours and has no idle time. Her labor cost for the week would be allocated
as follows:
Direct labor ($12 per hour × 45 hours) . . . . . . . . . . . . . . . . . . . . . . . . . . . . . . . . . . . . $540
Manufacturing overhead (overtime premium: $6 per hour × 5 hours) . . . . . . . . . . . . . 30
Total cost for the week . . . . . . . . . . . . . . . . . . . . . . . . . . . . . . . . . . . . . . . . . . . . . . . . . $570
Observe from this computation that only the overtime premium of $6 per hour is charged
to the overhead account— not the entire $18 earned for each hour of overtime work ($12
regular rate per hour × 1.5 hours = $18).
Labor Fringe Benefits
Labor fringe benefits are made up of employment-related costs paid by the employer and
include the costs of insurance programs, retirement plans, various supplemental unem-
ployment benefits, and hospitalization plans. The employer also pays the employer’s share
of Social Security, Medicare, workers’ compensation, federal employment tax, and state
unemployment insurance. These costs often add up to as much as 30% to 40% of base pay.
Many companies treat all such costs as indirect labor by adding them to manufacturing
overhead. Other companies treat the portion of fringe benefits that relates to direct labor
as additional direct labor cost. This approach is conceptually superior because the fringe
benefits provided to direct labor workers clearly represent an added cost of their services.
gar11005_ch03_083-140.indd 138gar11005_ch03_083-140.indd 138 11/11/10 11:30 AM11/11/10 11:30 AM
Rev.Confi rming Pages
Job-Order Costing 139
Appendix 3B Exercises and Problems
All applicable exercises and problems are available with McGraw-Hill’s Connect™ Accounting .
EXERCISE 3B–1 Allocations of the Cost of Idle Time [LO9] Chris Shannon is employed by Acme Company and is paid $18 per hour. Last week she worked 36
hours assembling one of the company’s products and was idle 4 hours due to material shortages.
Acme’s employees are engaged at their workstations for a normal 40-hour week.
Required: Allocate Ms. Shannon’s earnings for the week between direct labor and manufacturing overhead.
EXERCISE 3B–2 Allocations of Overtime Pay [LO9] Barry DeJay operates a stamping machine on the assembly line of Clinton Manufacturing Com-
pany. Last week Mr. DeJay worked 46 hours. His basic wage rate is $16 per hour, with time and a
half for overtime (time worked in excess of 40 hours per week).
Required: Allocate Mr. DeJay’s earnings for the week between direct labor and manufacturing overhead.
EXERCISE 3B–3 Classification of Overtime Cost [LO9] Several weeks ago you called Jiffy Plumbing Company to have some routine repair work done on
the plumbing system in your home. The plumber came about two weeks later, at four o’clock in the
afternoon, and spent two hours completing your repair work. When you received your bill from the
company, it contained a $75 charge for labor—$30 for the first hour and $45 for the second.
When questioned about the difference in hourly rates, the company’s service manager explained
that the higher rate for the second hour contained a charge for an “overtime premium,” because the
union required that plumbers be paid time and a half for any work in excess of eight hours per day. The
service manager further explained that the company was working overtime to “catch up a little” on its
backlog of work orders, but still needed to maintain a “decent” profit margin on the plumbers’ time.
Required: 1. Do you agree with the company’s computation of the labor charge on your job?
2. The company pays its plumbers $20 per hour for the first eight hours worked in a day and $30
per hour for any additional time worked. Show how the cost of the plumber’s time for the day
(nine hours) should be allocated between direct labor and general overhead on the company’s
books.
3. Under what circumstances might the company be justified in charging an overtime premium
for repair work on your home?
EXERCISE 3B–4 Classification of Labor Costs [LO9] Fred Austin is employed by White Company where he assembles a component part for one of the
company’s products. Fred is paid $12 per hour for regular time, and he is paid time and a half (i.e.,
$18 per hour) for all work in excess of 40 hours per week.
Required: 1. Assume that during a given week Fred is idle for two hours due to machine breakdowns and
that he is idle for four more hours due to material shortages. No overtime is recorded for the
week. Allocate Fred’s wages for the week between direct labor and manufacturing overhead.
2. Assume that during a following week Fred works a total of 50 hours. He has no idle time
for the week. Allocate Fred’s wages for the week between direct labor and manufacturing
overhead.
3. Fred’s company provides an attractive package of fringe benefits for its employees. This pack-
age includes a retirement program and a health insurance program. Explain two ways that the
company could handle the costs of its direct laborers’ fringe benefits in its cost records.
PROBLEM 3B–5 Classification of Labor Costs [LO9] Lynn Bjorland is employed by Southern Laboratories and is directly involved in preparing the
company’s leading antibiotic drug. Lynn’s basic wage rate is $24 per hour. The company pays its
employees time and a half (i.e., $36 per hour) for any work in excess of 40 hours per week.
gar11005_ch03_083-140.indd 139gar11005_ch03_083-140.indd 139 11/11/10 11:30 AM11/11/10 11:30 AM
Rev.Confi rming Pages
140 Chapter 3
Required: 1. Suppose that in a given week Lynn works 45 hours. Compute Lynn’s total wages for the week.
How much of this cost would the company allocate to direct labor? To manufacturing overhead?
2. Suppose in another week that Lynn works 50 hours but is idle for 4 hours during the week
due to equipment breakdowns. Compute Lynn’s total wages for the week. How much of this
amount would be allocated to direct labor? To manufacturing overhead?
3. Southern Laboratories has an attractive package of fringe benefits that costs the company $8
for each hour of employee time (either regular time or overtime). During a particular week,
Lynn works 48 hours but is idle for 3 hours due to material shortages. Compute Lynn’s total
wages and fringe benefits for the week. If the company treats all fringe benefits as part of
manufacturing overhead cost, how much of Lynn’s wages and fringe benefits for the week
would be allocated to direct labor? To manufacturing overhead?
4. Refer to the data in (3) above. If the company treats that part of fringe benefits relating to
direct labor as added direct labor cost, how much of Lynn’s wages and fringe benefits for the
week will be allocated to direct labor? To manufacturing overhead?
gar11005_ch03_083-140.indd 140gar11005_ch03_083-140.indd 140 11/11/10 11:30 AM11/11/10 11:30 AM
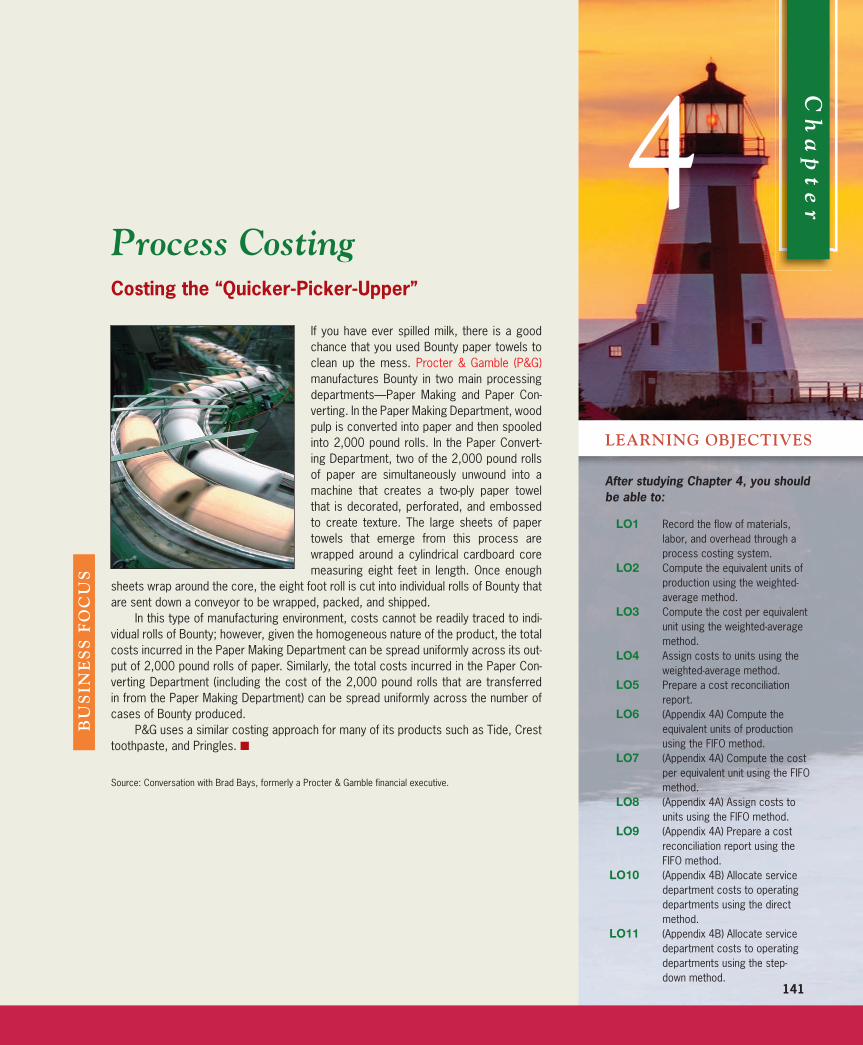
Rev.Confi rming Pages
141
Costing the “Quicker-Picker-Upper”
If you have ever spilled milk, there is a good chance that you used Bounty paper towels to clean up the mess. Procter & Gamble (P&G) manufactures Bounty in two main processing departments—Paper Making and Paper Con-verting. In the Paper Making Department, wood pulp is converted into paper and then spooled into 2,000 pound rolls. In the Paper Convert-ing Department, two of the 2,000 pound rolls of paper are simultaneously unwound into a machine that creates a two-ply paper towel that is decorated, perforated, and embossed to create texture. The large sheets of paper towels that emerge from this process are wrapped around a cylindrical cardboard core measuring eight feet in length. Once enough
sheets wrap around the core, the eight foot roll is cut into individual rolls of Bounty that are sent down a conveyor to be wrapped, packed, and shipped.
In this type of manufacturing environment, costs cannot be readily traced to indi-vidual rolls of Bounty; however, given the homogeneous nature of the product, the total costs incurred in the Paper Making Department can be spread uniformly across its out-put of 2,000 pound rolls of paper. Similarly, the total costs incurred in the Paper Con-verting Department (including the cost of the 2,000 pound rolls that are transferred in from the Paper Making Department) can be spread uniformly across the number of cases of Bounty produced.
P&G uses a similar costing approach for many of its products such as Tide, Crest toothpaste, and Pringles. ■
Source: Conversation with Brad Bays, formerly a Procter & Gamble financial executive.
4 C
ha
pt
er
After studying Chapter 4, you should be able to:
LO1 Record the flow of materials, labor, and overhead through a process costing system.
LO2 Compute the equivalent units of production using the weighted-average method.
LO3 Compute the cost per equivalent unit using the weighted-average method.
LO4 Assign costs to units using the weighted-average method.
LO5 Prepare a cost reconciliation report.
LO6 (Appendix 4A) Compute the equivalent units of production using the FIFO method.
LO7 (Appendix 4A) Compute the cost per equivalent unit using the FIFO method.
LO8 (Appendix 4A) Assign costs to units using the FIFO method.
LO9 (Appendix 4A) Prepare a cost reconciliation report using the FIFO method.
LO10 (Appendix 4B) Allocate service department costs to operating departments using the direct method.
LO11 (Appendix 4B) Allocate service department costs to operating departments using the step-down method.
LEARNING OBJECTIVES
BU
SIN
ES
S F
OC
US
Process Costing
gar11005_ch04_141-182.indd 141gar11005_ch04_141-182.indd 141 17/11/10 11:21 AM17/11/10 11:21 AM
Confi rming Pages
142 Chapter 4
J ob-order costing and process costing are two common methods for deter-
mining unit product costs. As explained in the previous chapter, job-order costing is
used when many different jobs or products are worked on each period. Examples of
industries that use job-order costing include furniture manufacturing, special-order
printing, shipbuilding, and many types of service organizations.
By contrast, process costing is used most commonly in industries that convert raw
materials into homogeneous (i.e., uniform) products, such as bricks, soda, or paper,
on a continuous basis. Examples of companies that would use process costing include
Reynolds Aluminum (aluminum ingots), Scott Paper (toilet paper), General Mills
(flour), Exxon (gasoline and lubricating oils), Coppertone (sunscreens), and Kellogg’s
(breakfast cereals). In addition, process costing is sometimes used in companies with
assembly operations. A form of process costing may also be used in utilities that pro-
duce gas, water, and electricity.
Our purpose in this chapter is to explain how product costing works in a process cost-
ing system.
Comparison of Job-Order and Process Costing
In some ways process costing is very similar to job-order costing, and in some ways it is
very different. In this section, we focus on these similarities and differences to provide a
foundation for the detailed discussion of process costing that follows.
Similarities between Job-Order and Process Costing
Much of what you learned in the previous chapter about costing and cost flows applies
equally well to process costing in this chapter. We are not throwing out all that we have
learned about costing and starting from “scratch” with a whole new system. The similari-
ties between job-order and process costing can be summarized as follows:
1. Both systems have the same basic purposes—to assign material, labor, and manu-
facturing overhead costs to products and to provide a mechanism for computing unit
product costs.
2. Both systems use the same basic manufacturing accounts, including Manufacturing
Overhead, Raw Materials, Work in Process, and Finished Goods.
3. The flow of costs through the manufacturing accounts is basically the same in both
systems.
As can be seen from this comparison, much of the knowledge that you have already
acquired about costing is applicable to a process costing system. Our task now is to refine
and extend your knowledge to process costing.
Differences between Job-Order and Process Costing
There are three differences between job-order and process costing. First, process costing
is used when a company produces a continuous flow of units that are indistinguishable
from one another. Job-order costing is used when a company produces many different
jobs that have unique production requirements. Second, under process costing, it makes
no sense to try to identify materials, labor, and overhead costs with a particular cus-
tomer order (as we did with job-order costing) because each order is just one of many
that are filled from a continuous flow of virtually identical units from the production
line. Accordingly, process costing accumulates costs by department (rather than by order)
and assigns these costs uniformly to all units that pass through the department during a
period. Job cost sheets (which we used for job-order costing) are not used to accumulate
gar11005_ch04_141-182.indd 142gar11005_ch04_141-182.indd 142 02/11/10 3:02 PM02/11/10 3:02 PM
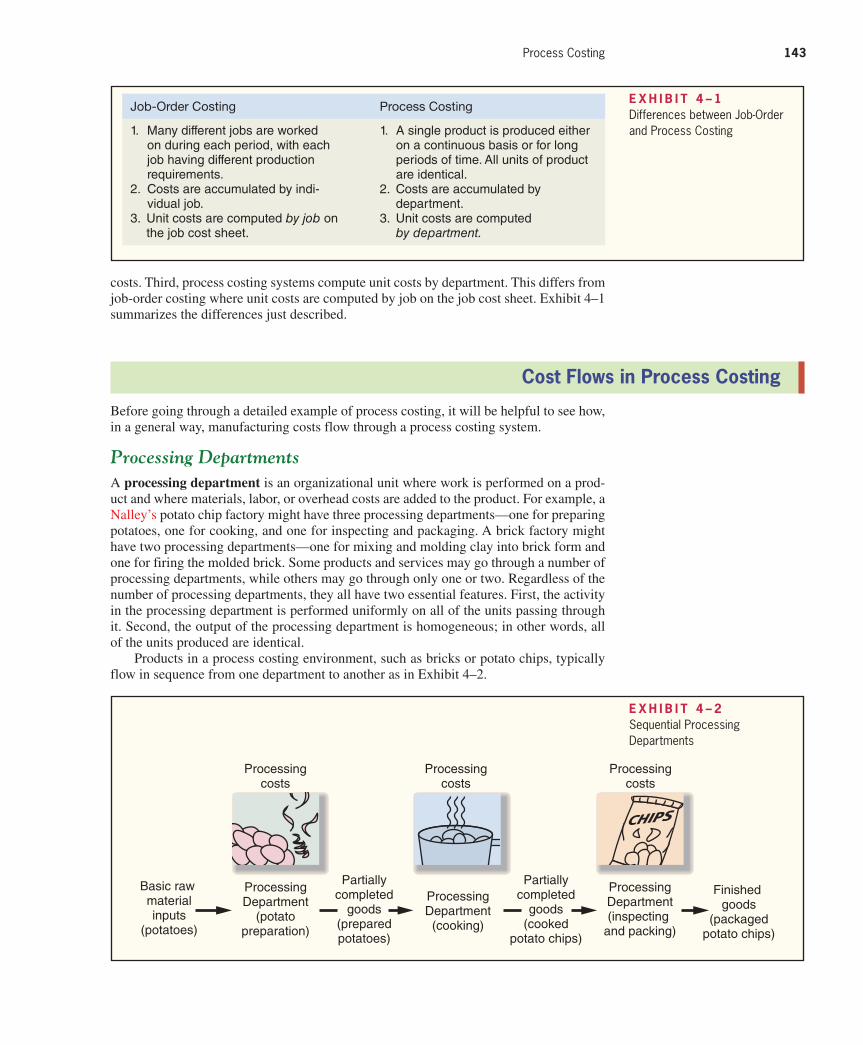
Confi rming Pages
Process Costing 143
costs. Third, process costing systems compute unit costs by department. This differs from
job-order costing where unit costs are computed by job on the job cost sheet. Exhibit 4–1
summarizes the differences just described.
Job-Order Costing
1. Many different jobs are worked on during each period, with each job having different production requirements.
2. Costs are accumulated by indi-vidual job.
3. Unit costs are computed by job on the job cost sheet.
Process Costing
1. A single product is produced either on a continuous basis or for long periods of time. All units of product are identical.
2. Costs are accumulated by department.
3. Unit costs are computed by department.
E X H I B I T 4 – 1 Differences between Job-Order and Process Costing
Cost Flows in Process Costing
Before going through a detailed example of process costing, it will be helpful to see how,
in a general way, manufacturing costs flow through a process costing system.
Processing Departments
A processing department is an organizational unit where work is performed on a prod-
uct and where materials, labor, or overhead costs are added to the product. For example, a
Nalley’s potato chip factory might have three processing departments—one for preparing
potatoes, one for cooking, and one for inspecting and packaging. A brick factory might
have two processing departments—one for mixing and molding clay into brick form and
one for firing the molded brick. Some products and services may go through a number of
processing departments, while others may go through only one or two. Regardless of the
number of processing departments, they all have two essential features. First, the activity
in the processing department is performed uniformly on all of the units passing through
it. Second, the output of the processing department is homogeneous; in other words, all
of the units produced are identical.
Products in a process costing environment, such as bricks or potato chips, typically
flow in sequence from one department to another as in Exhibit 4–2 .
Partiallycompleted
goods(preparedpotatoes)
Partiallycompleted
goods(cooked
potato chips)
Processingcosts
Processingcosts
Processingcosts
Basic raw materialinputs
(potatoes)
Finished goods
(packagedpotato chips)
ProcessingDepartment
(potatopreparation)
ProcessingDepartment
(cooking)
ProcessingDepartment(inspecting
and packing)
E X H I B I T 4 – 2 Sequential Processing Departments
gar11005_ch04_141-182.indd 143gar11005_ch04_141-182.indd 143 02/11/10 3:02 PM02/11/10 3:02 PM
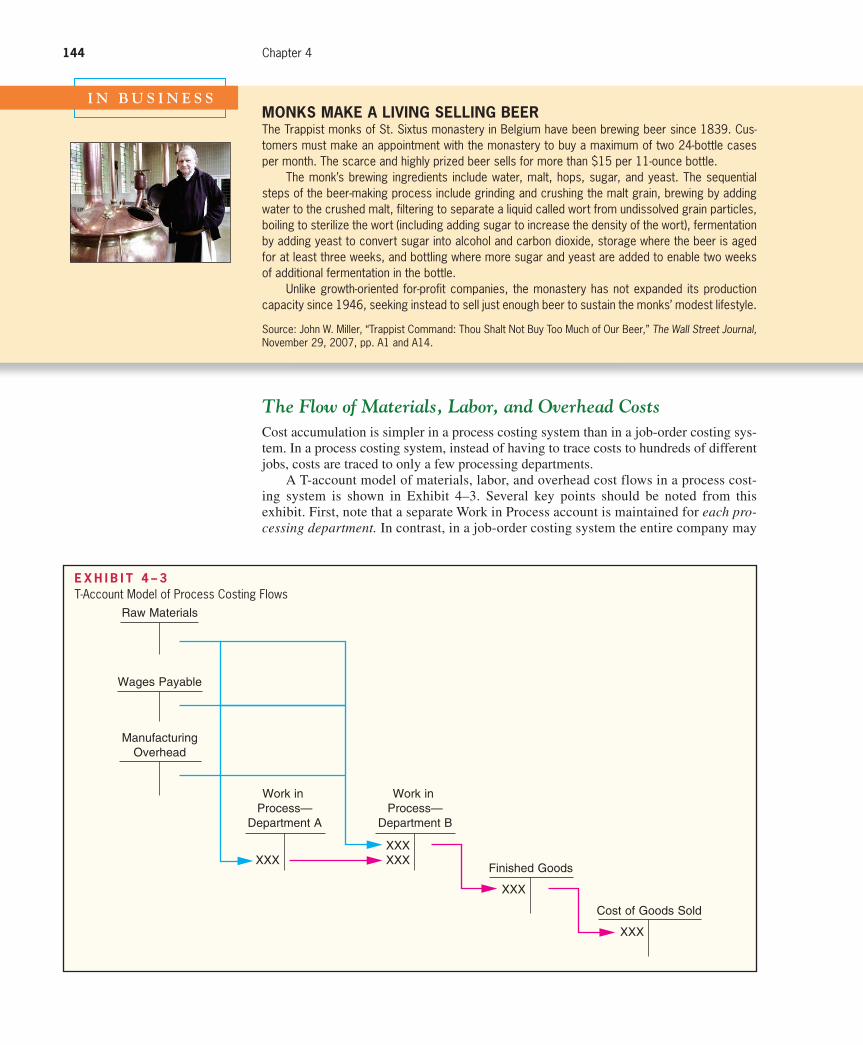
Confi rming Pages
144 Chapter 4
The Flow of Materials, Labor, and Overhead Costs
Cost accumulation is simpler in a process costing system than in a job-order costing sys-
tem. In a process costing system, instead of having to trace costs to hundreds of different
jobs, costs are traced to only a few processing departments.
A T-account model of materials, labor, and overhead cost flows in a process cost-
ing system is shown in Exhibit 4–3 . Several key points should be noted from this
exhibit. First, note that a separate Work in Process account is maintained for each pro-cessing department. In contrast, in a job-order costing system the entire company may
I N B U S I N E S S MONKS MAKE A LIVING SELLING BEER The Trappist monks of St. Sixtus monastery in Belgium have been brewing beer since 1839. Cus-tomers must make an appointment with the monastery to buy a maximum of two 24-bottle cases per month. The scarce and highly prized beer sells for more than $15 per 11-ounce bottle.
The monk’s brewing ingredients include water, malt, hops, sugar, and yeast. The sequential steps of the beer-making process include grinding and crushing the malt grain, brewing by adding water to the crushed malt, filtering to separate a liquid called wort from undissolved grain particles, boiling to sterilize the wort (including adding sugar to increase the density of the wort), fermentation by adding yeast to convert sugar into alcohol and carbon dioxide, storage where the beer is aged for at least three weeks, and bottling where more sugar and yeast are added to enable two weeks of additional fermentation in the bottle.
Unlike growth-oriented for-profit companies, the monastery has not expanded its production capacity since 1946, seeking instead to sell just enough beer to sustain the monks’ modest lifestyle.
Source: John W. Miller, “Trappist Command: Thou Shalt Not Buy Too Much of Our Beer,” The Wall Street Journal,November 29, 2007, pp. A1 and A14.
Raw Materials
Wages Payable
ManufacturingOverhead
Work in
Process—Department A
XXX
Work in
Process—Department B
XXXXXX
Finished Goods
XXX
Cost of Goods Sold
XXX
E X H I B I T 4 – 3 T-Account Model of Process Costing Flows
gar11005_ch04_141-182.indd 144gar11005_ch04_141-182.indd 144 02/11/10 3:02 PM02/11/10 3:02 PM
Confi rming Pages
Process Costing 145
have only one Work in Process account. Second, note that the completed production
of the first processing department (Department A in the exhibit) is transferred to the
Work in Process account of the second processing department (Department B). After
further work in Department B, the completed units are then transferred to Finished
Goods. (In Exhibit 4–3 , we show only two processing departments, but a company can
have many processing departments.)
Finally, note that materials, labor, and overhead costs can be added in any processing
department—not just the first. Costs in Department B’s Work in Process account consist of
the materials, labor, and overhead costs incurred in Department B plus the costs attached
to partially completed units transferred in from Department A (called transferred-in costs).
Materials, Labor, and Overhead Cost Entries
To complete our discussion of cost flows in a process costing system, in this section we
show journal entries relating to materials, labor, and overhead costs at Megan’s Classic
Cream Soda, a company that has two processing departments—Formulating and Bot-
tling. In the Formulating Department, ingredients are checked for quality and then mixed
and injected with carbon dioxide to create bulk cream soda. In the Bottling Department,
bottles are checked for defects, filled with cream soda, capped, visually inspected again
for defects, and then packed for shipping.
Materials Costs As in job-order costing, materials are drawn from the storeroom
using a materials requisition form. Materials can be added in any processing department,
although it is not unusual for materials to be added only in the first processing depart-
ment, with subsequent departments adding only labor and overhead costs.
At Megan’s Classic Cream Soda, some materials (i.e., water, flavors, sugar, and car-
bon dioxide) are added in the Formulating Department and some materials (i.e., bottles,
caps, and packing materials) are added in the Bottling Department. The journal entry to
record the materials used in the first processing department, the Formulating Department,
is as follows:
Work in Process—Formulating . . . . . . . . . . . . . . . . . . . . . . . . . . . . . . . XXX Raw Materials . . . . . . . . . . . . . . . . . . . . . . . . . . . . . . . . . . . . . . . . . . XXX
The journal entry to record the materials used in the second processing department, the
Bottling Department, is as follows:
Work in Process—Bottling . . . . . . . . . . . . . . . . . . . . . . . . . . . . . . . . . . XXX Raw Materials . . . . . . . . . . . . . . . . . . . . . . . . . . . . . . . . . . . . . . . . . . XXX
Labor Costs In process costing, labor costs are traced to departments—not to indi-
vidual jobs. The following journal entry records the labor costs in the Formulating
Department at Megan’s Classic Cream Soda:
Work in Process—Formulating . . . . . . . . . . . . . . . . . . . . . . . . . . . . . . XXX Salaries and Wages Payable . . . . . . . . . . . . . . . . . . . . . . . . . . . . . . XXX
A similar entry would be made to record labor costs in the Bottling Department.
Overhead Costs In process costing, as in job-order costing, predetermined overhead
rates are usually used. Manufacturing overhead cost is applied according to the amount of
the allocation base that is incurred in the department. The following journal entry records
the overhead cost applied in the Formulating Department:
Work in Process—Formulating . . . . . . . . . . . . . . . . . . . . . . . . . . . . . . . XXX Manufacturing Overhead. . . . . . . . . . . . . . . . . . . . . . . . . . . . . . . . . . XXX
A similar entry would be made to apply manufacturing overhead costs in the Bottling
Department.
LEARNING OBJECTIVE 1 Record the flow of materials, labor, and overhead through a process costing system.
gar11005_ch04_141-182.indd 145gar11005_ch04_141-182.indd 145 02/11/10 3:02 PM02/11/10 3:02 PM
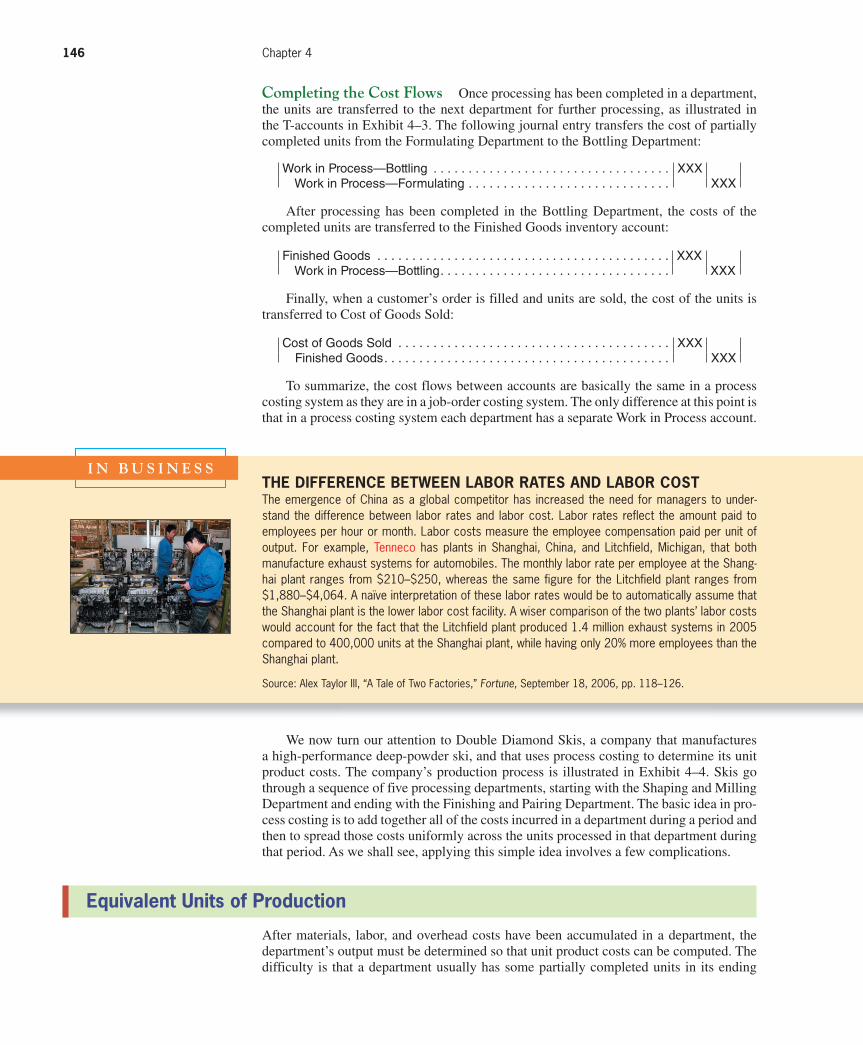
Confi rming Pages
146 Chapter 4
Completing the Cost Flows Once processing has been completed in a department,
the units are transferred to the next department for further processing, as illustrated in
the T-accounts in Exhibit 4–3 . The following journal entry transfers the cost of partially
completed units from the Formulating Department to the Bottling Department:
Work in Process—Bottling . . . . . . . . . . . . . . . . . . . . . . . . . . . . . . . . . . XXX Work in Process—Formulating . . . . . . . . . . . . . . . . . . . . . . . . . . . . . XXX
After processing has been completed in the Bottling Department, the costs of the
completed units are transferred to the Finished Goods inventory account:
Finished Goods . . . . . . . . . . . . . . . . . . . . . . . . . . . . . . . . . . . . . . . . . . XXX Work in Process—Bottling. . . . . . . . . . . . . . . . . . . . . . . . . . . . . . . . . XXX
Finally, when a customer’s order is filled and units are sold, the cost of the units is
transferred to Cost of Goods Sold:
Cost of Goods Sold . . . . . . . . . . . . . . . . . . . . . . . . . . . . . . . . . . . . . . . XXX Finished Goods. . . . . . . . . . . . . . . . . . . . . . . . . . . . . . . . . . . . . . . . . XXX
To summarize, the cost flows between accounts are basically the same in a process
costing system as they are in a job-order costing system. The only difference at this point is
that in a process costing system each department has a separate Work in Process account.
I N B U S I N E S S THE DIFFERENCE BETWEEN LABOR RATES AND LABOR COST The emergence of China as a global competitor has increased the need for managers to under-stand the difference between labor rates and labor cost. Labor rates reflect the amount paid to employees per hour or month. Labor costs measure the employee compensation paid per unit of output. For example, Tenneco has plants in Shanghai, China, and Litchfield, Michigan, that both manufacture exhaust systems for automobiles. The monthly labor rate per employee at the Shang-hai plant ranges from $210–$250, whereas the same figure for the Litchfield plant ranges from $1,880–$4,064. A naïve interpretation of these labor rates would be to automatically assume that the Shanghai plant is the lower labor cost facility. A wiser comparison of the two plants’ labor costs would account for the fact that the Litchfield plant produced 1.4 million exhaust systems in 2005 compared to 400,000 units at the Shanghai plant, while having only 20% more employees than the Shanghai plant.
Source: Alex Taylor III, “A Tale of Two Factories,” Fortune, September 18, 2006, pp. 118–126.
We now turn our attention to Double Diamond Skis, a company that manufactures
a high-performance deep-powder ski, and that uses process costing to determine its unit
product costs. The company’s production process is illustrated in Exhibit 4–4 . Skis go
through a sequence of five processing departments, starting with the Shaping and Milling
Department and ending with the Finishing and Pairing Department. The basic idea in pro-
cess costing is to add together all of the costs incurred in a department during a period and
then to spread those costs uniformly across the units processed in that department during
that period. As we shall see, applying this simple idea involves a few complications.
Equivalent Units of Production
After materials, labor, and overhead costs have been accumulated in a department, the
department’s output must be determined so that unit product costs can be computed. The
difficulty is that a department usually has some partially completed units in its ending
gar11005_ch04_141-182.indd 146gar11005_ch04_141-182.indd 146 02/11/10 3:02 PM02/11/10 3:02 PM
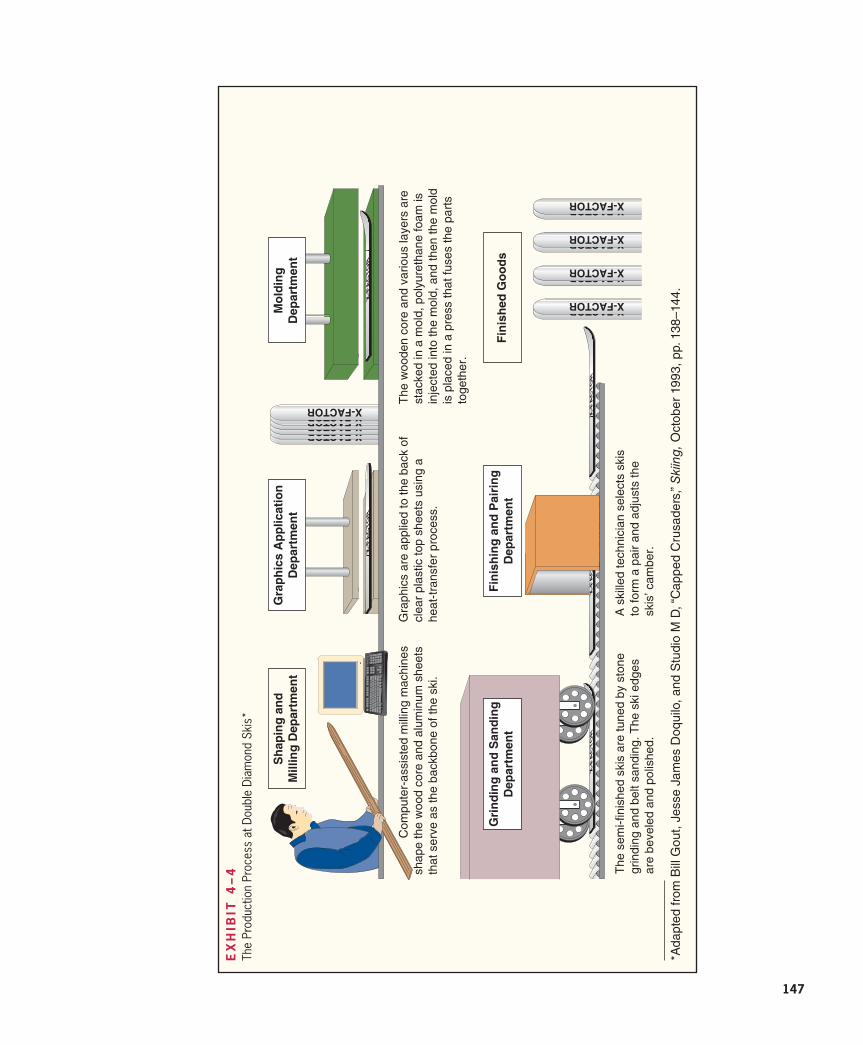
Confi rming Pages
147
X-FACTOR
X-FACTOR X-FACTOR X-FACTOR X-FACTOR X-FACTOR X-FACTOR
X-FACTOR X-FACTOR
X-FACTOR X-FACTOR
X-FACTOR X-FACTOR
X-FACTOR X-FACTOR
C
ompu
ter-
assi
sted
mill
ing
mac
hine
s sh
ape
the
woo
d co
re a
nd a
lum
inum
she
ets
that
ser
ve a
s th
e ba
ckbo
ne o
f the
ski
.
Gra
phic
s ar
e ap
plie
d to
the
back
of
clea
r pl
astic
top
shee
ts u
sing
a
heat
-tra
nsfe
r pr
oces
s.
The
woo
den
core
and
var
ious
laye
rs a
re
stac
ked
in a
mol
d, p
olyu
reth
ane
foam
is
inje
cted
into
the
mol
d, a
nd th
en th
e m
old
is p
lace
d in
a p
ress
that
fuse
s th
e pa
rts
toge
ther
.
The
sem
i-fin
ishe
d sk
is a
re tu
ned
by s
tone
gr
indi
ng a
nd b
elt s
andi
ng. T
he s
ki e
dges
ar
e be
vele
d an
d po
lishe
d.
A s
kille
d te
chni
cian
sel
ects
ski
s to
form
a p
air
and
adju
sts
the
skis
’ cam
ber.
Sh
ap
ing
an
d
Millin
g D
ep
art
men
t
Fin
ish
ed
Go
od
s
Gra
ph
ics A
pp
licati
on
Dep
art
men
t
Mo
ldin
g
De
pa
rtm
en
tX-FACTOR
X-FACTOR
X-FACTOR
X-FACTOR
Gri
nd
ing
an
d S
an
din
g
Dep
art
me
nt
Fin
ish
ing
an
d P
air
ing
Dep
art
men
t
* Ada
pted
from
Bill
Gou
t, Je
sse
Jam
es D
oqui
lo, a
nd S
tudi
o M
D, “
Cap
ped
Cru
sade
rs,”
Ski
ing
, Oct
ober
199
3, p
p. 1
38–1
44.
EX
HIB
IT 4
–4
The
Prod
uctio
n Pr
oces
s at
Dou
ble
Diam
ond
Skis
*
gar11005_ch04_141-182.indd 147gar11005_ch04_141-182.indd 147 02/11/10 3:02 PM02/11/10 3:02 PM
Confi rming Pages
148 Chapter 4
inventory. It does not seem reasonable to count these partially completed units as equiva-
lent to fully completed units when counting the department’s output. Therefore, these
partially completed units are translated into an equivalent number of fully completed
units. In process costing, this translation is done using the following formula:
Equivalent units = Number of partially completed units × Percentage completion
As the formula states, equivalent units is the product of the number of partially com-
pleted units and the percentage completion of those units with respect to the processing in
the department. Roughly speaking, the equivalent units is the number of complete units
that could have been obtained from the materials and effort that went into the partially
complete units.
For example, suppose the Molding Department at Double Diamond has 500 units in its
ending work in process inventory that are 60% complete with respect to processing in the
department. These 500 partially complete units are equivalent to 300 fully complete units
(500 × 60% = 300). Therefore, the ending work in process inventory contains 300 equiva-
lent units. These equivalent units are added to any units completed during the period to
determine the department’s output for the period—called the equivalent units of production. Equivalent units of production for a period can be computed in different ways. In this
chapter, we discuss the weighted-average method. In Appendix 4A, we discuss the FIFO method. The FIFO method of process costing is a method in which equivalent units and
unit costs relate only to work done during the current period. In contrast, the weighted-average method blends together units and costs from the current period with units and
costs from the prior period. In the weighted-average method, the equivalent units of production for a department are the number of units transferred to the next department
(or to finished goods) plus the equivalent units in the department’s ending work in pro-
cess inventory.
Weighted-Average Method
Under the weighted-average method, a department’s equivalent units are computed as
follows:
Weighted-Average Method (a separate calculation is made for each cost category in
each processing department)
Equivalent units
of production = Units transferred to the next
department or to finished goods +
Equivalent units in ending
work in process inventory
Note that the computation of the equivalent units of production involves adding the num-
ber of units transferred out of the department to the equivalent units in the department’s
ending inventory. There is no need to compute the equivalent units for the units trans-
ferred out of the department—they are 100% complete with respect to the work done in
that department or they would not be transferred out. In other words, each unit transferred
out of the department is counted as one equivalent unit.
Consider the Shaping and Milling Department at Double Diamond. This department
uses computerized milling machines to precisely shape the wooden core and metal sheets
that will be used to form the backbone of the ski. (See Exhibit 4–4 for an overview of the
production process at Double Diamond.) The activity shown at the top of the next page
took place in the department in May.
Note the use of the term conversion in the table on the next page. Conversion cost , as defined in an earlier chapter, is direct labor cost plus manufacturing overhead cost. In
process costing, conversion cost is often treated as a single element of product cost.
Note that the beginning work in process inventory was 55% complete with respect
to materials costs and 30% complete with respect to conversion costs. This means
that 55% of the materials costs required to complete the units in the department had
LEARNING OBJECTIVE 2 Compute the equivalent units of production using the weighted-
average method.
gar11005_ch04_141-182.indd 148gar11005_ch04_141-182.indd 148 02/11/10 3:02 PM02/11/10 3:02 PM

Confi rming Pages
Process Costing 149
already been incurred. Likewise, 30% of the conversion costs required to complete the
units had already been incurred.
Two equivalent unit figures must be computed—one for materials and one for con-
version. These computations are shown in Exhibit 4–5 .
Note that the computations in Exhibit 4–5 ignore the fact that the units in the begin-
ning work in process inventory were partially complete. For example, the 200 units in
beginning inventory were already 30% complete with respect to conversion costs. Never-
theless, the weighted-average method is concerned only with the 4,900 equivalent units
that are in ending inventories and in units transferred to the next department; it is not
concerned with the fact that the beginning inventory was already partially complete. In
other words, the 4,900 equivalent units computed using the weighted-average method
include work that was accomplished in prior periods. This is a key point concerning the
weighted-average method and it is easy to overlook.
Exhibit 4–6 provides another way of looking at the computation of equivalent units
of production. This exhibit depicts the equivalent units computation for conversion costs.
Study it carefully before going on.
Percent Complete
Shaping and Milling Department Units Materials Conversion
Beginning work in process . . . . . . . . . . . . . . . . . 200 55% 30% Units started into production during May . . . . . . . . . . . . . . . . . . . . . . . . . . . 5,000 Units completed during May and transferred to the next department . . . . . . . . . 4,800 100% * 100% * Ending work in process . . . . . . . . . . . . . . . . . . . 400 40% 25%
* We always assume that units transferred out of a department are 100% complete with respect to the processing done in that department.
Shaping and Milling Department Materials Conversion
Units transferred to the next department . . . . . . . . . . . . . . 4,800 4,800 Ending work in process: Materials: 400 units × 40% complete . . . . . . . . . . . . . . 160 Conversion: 400 units × 25% complete . . . . . . . . . . . . 100
Equivalent units of production. . . . . . . . . . . . . . . . . . . . . . 4,960 4,900
E X H I B I T 4 – 5 Equivalent Units of Production: Weighted-Average Method
I N B U S I N E S S CUTTING CONVERSION COSTS Cemex SA, the world’s third largest cement maker, owns 54 plants. Each of these plants consumes 800 tons of fuel a day heating kilns to 2,700 degrees Fahrenheit. Consequently, energy costs account for 40% of the company’s overall conversion costs. Historically, Cemex relied exclusively on coal to heat its kilns; however, faced with soaring coal prices and shrinking profits, the company desperately needed a cheaper fuel. Cemex turned its attention to an oil industry waste product called petroleum coke that burns hotter than coal and costs half as much. The company spent about $150 million to convert its kilns to burn petroleum coke. Overall, Cemex has cut its energy bills by 17%, helping it earn higher profit margins than its biggest rivals.
Source: John Lyons, “Expensive Energy? Burn Other Stuff, One Firm Decides,” The Wall Street Journal, September 1, 2004, pp. A1 and A8.
gar11005_ch04_141-182.indd 149gar11005_ch04_141-182.indd 149 02/11/10 3:02 PM02/11/10 3:02 PM
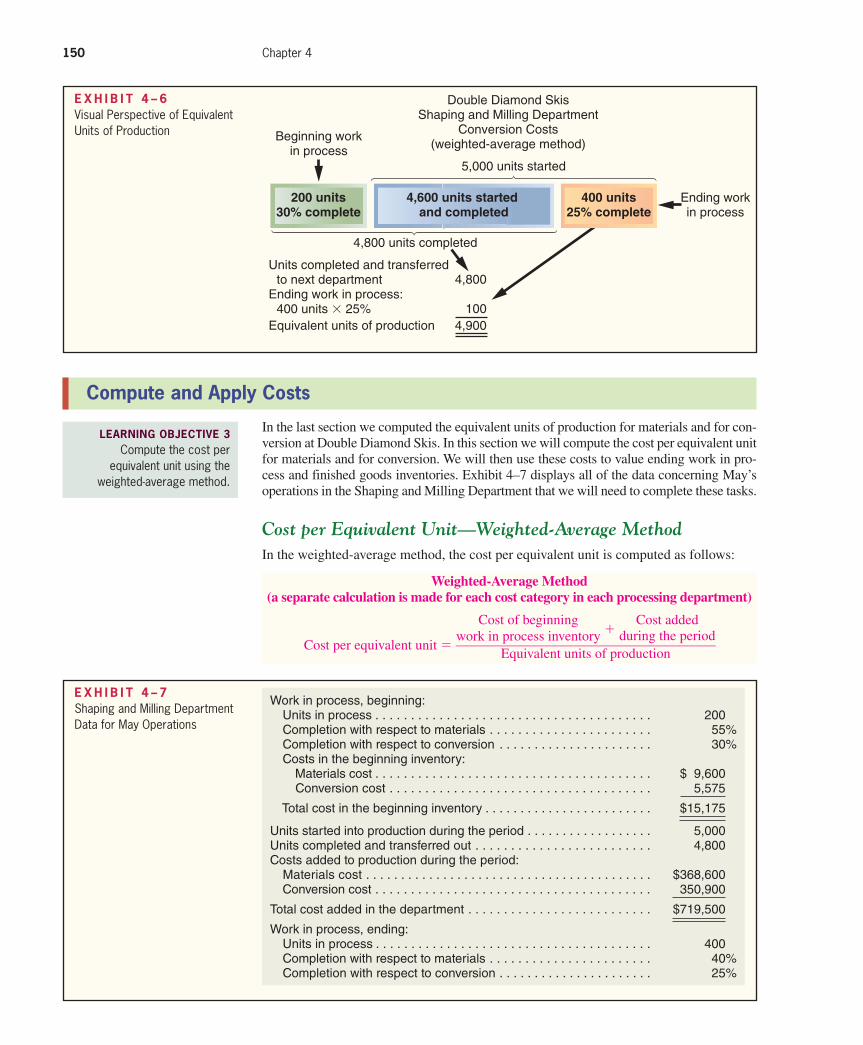
Confi rming Pages
150 Chapter 4
Beginning workin process
Ending workin process
5,000 units started
4,800 units completed
Units completed and transferred to next departmentEnding work in process: 400 units 3 25%
4,800
1004,900Equivalent units of production
200 units30% complete
4,600 units started and completed
400 units25% complete
Double Diamond SkisShaping and Milling Department
Conversion Costs(weighted-average method)
E X H I B I T 4 – 6 Visual Perspective of Equivalent Units of Production
Compute and Apply Costs
In the last section we computed the equivalent units of production for materials and for con-
version at Double Diamond Skis. In this section we will compute the cost per equivalent unit
for materials and for conversion. We will then use these costs to value ending work in pro-
cess and finished goods inventories. Exhibit 4–7 displays all of the data concerning May’s
operations in the Shaping and Milling Department that we will need to complete these tasks.
Cost per Equivalent Unit—Weighted-Average Method
In the weighted-average method, the cost per equivalent unit is computed as follows:
Weighted-Average Method (a separate calculation is made for each cost category in each processing department)
Cost per equivalent unit =
Cost of beginning work in process inventory
+ Cost added during the period
______________________________________ Equivalent units of production
LEARNING OBJECTIVE 3 Compute the cost per
equivalent unit using the weighted-average method.
Work in process, beginning: Units in process . . . . . . . . . . . . . . . . . . . . . . . . . . . . . . . . . . . . . . . 200 Completion with respect to materials . . . . . . . . . . . . . . . . . . . . . . . 55% Completion with respect to conversion . . . . . . . . . . . . . . . . . . . . . . 30% Costs in the beginning inventory: Materials cost . . . . . . . . . . . . . . . . . . . . . . . . . . . . . . . . . . . . . . . $ 9,600 Conversion cost . . . . . . . . . . . . . . . . . . . . . . . . . . . . . . . . . . . . . 5,575
Total cost in the beginning inventory . . . . . . . . . . . . . . . . . . . . . . . . $15,175
Units started into production during the period . . . . . . . . . . . . . . . . . . 5,000 Units completed and transferred out . . . . . . . . . . . . . . . . . . . . . . . . . 4,800 Costs added to production during the period: Materials cost . . . . . . . . . . . . . . . . . . . . . . . . . . . . . . . . . . . . . . . . . $368,600 Conversion cost . . . . . . . . . . . . . . . . . . . . . . . . . . . . . . . . . . . . . . . 350,900
Total cost added in the department . . . . . . . . . . . . . . . . . . . . . . . . . . $719,500
Work in process, ending: Units in process . . . . . . . . . . . . . . . . . . . . . . . . . . . . . . . . . . . . . . . 400 Completion with respect to materials . . . . . . . . . . . . . . . . . . . . . . . 40% Completion with respect to conversion . . . . . . . . . . . . . . . . . . . . . . 25%
E X H I B I T 4 – 7 Shaping and Milling Department Data for May Operations
gar11005_ch04_141-182.indd 150gar11005_ch04_141-182.indd 150 02/11/10 3:02 PM02/11/10 3:02 PM
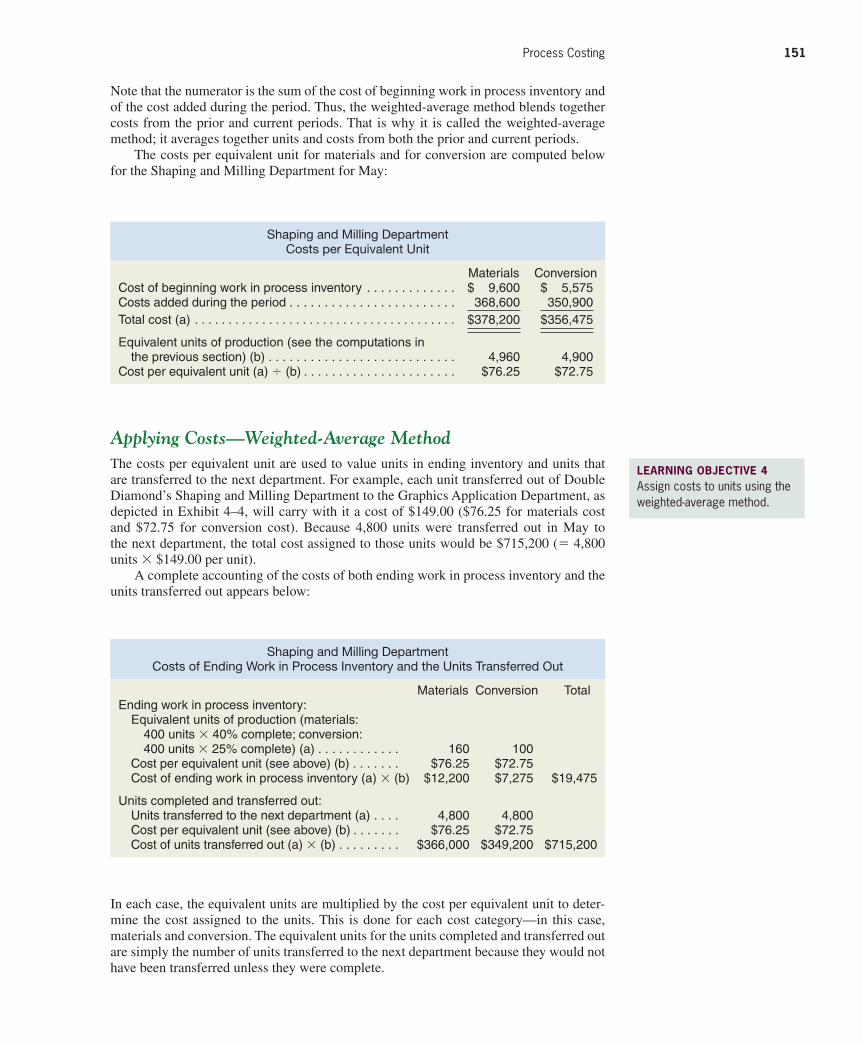
Confi rming Pages
Process Costing 151
Note that the numerator is the sum of the cost of beginning work in process inventory and
of the cost added during the period. Thus, the weighted-average method blends together
costs from the prior and current periods. That is why it is called the weighted-average
method; it averages together units and costs from both the prior and current periods.
The costs per equivalent unit for materials and for conversion are computed below
for the Shaping and Milling Department for May:
Shaping and Milling Department Costs per Equivalent Unit
Materials Conversion Cost of beginning work in process inventory . . . . . . . . . . . . . $ 9,600 $ 5,575 Costs added during the period . . . . . . . . . . . . . . . . . . . . . . . . 368,600 350,900 Total cost (a) . . . . . . . . . . . . . . . . . . . . . . . . . . . . . . . . . . . . . . . $378,200 $356,475
Equivalent units of production (see the computations in the previous section) (b) . . . . . . . . . . . . . . . . . . . . . . . . . . . 4,960 4,900 Cost per equivalent unit (a) ÷ (b) . . . . . . . . . . . . . . . . . . . . . . $76.25 $72.75
Applying Costs—Weighted-Average Method
The costs per equivalent unit are used to value units in ending inventory and units that
are transferred to the next department. For example, each unit transferred out of Double
Diamond’s Shaping and Milling Department to the Graphics Application Department, as
depicted in Exhibit 4–4 , will carry with it a cost of $149.00 ($76.25 for materials cost
and $72.75 for conversion cost). Because 4,800 units were transferred out in May to
the next department, the total cost assigned to those units would be $715,200 ( = 4,800
units × $149.00 per unit).
A complete accounting of the costs of both ending work in process inventory and the
units transferred out appears below:
LEARNING OBJECTIVE 4 Assign costs to units using the weighted-average method.
Shaping and Milling Department Costs of Ending Work in Process Inventory and the Units Transferred Out
Materials Conversion Total Ending work in process inventory: Equivalent units of production (materials: 400 units × 40% complete; conversion: 400 units × 25% complete) (a) . . . . . . . . . . . . 160 100 Cost per equivalent unit (see above) (b) . . . . . . . $76.25 $72.75 Cost of ending work in process inventory (a) × (b) $12,200 $7,275 $19,475
Units completed and transferred out: Units transferred to the next department (a) . . . . 4,800 4,800 Cost per equivalent unit (see above) (b) . . . . . . . $76.25 $72.75 Cost of units transferred out (a) × (b) . . . . . . . . . $366,000 $349,200 $715,200
In each case, the equivalent units are multiplied by the cost per equivalent unit to deter-
mine the cost assigned to the units. This is done for each cost category—in this case,
materials and conversion. The equivalent units for the units completed and transferred out
are simply the number of units transferred to the next department because they would not
have been transferred unless they were complete.
gar11005_ch04_141-182.indd 151gar11005_ch04_141-182.indd 151 02/11/10 3:02 PM02/11/10 3:02 PM
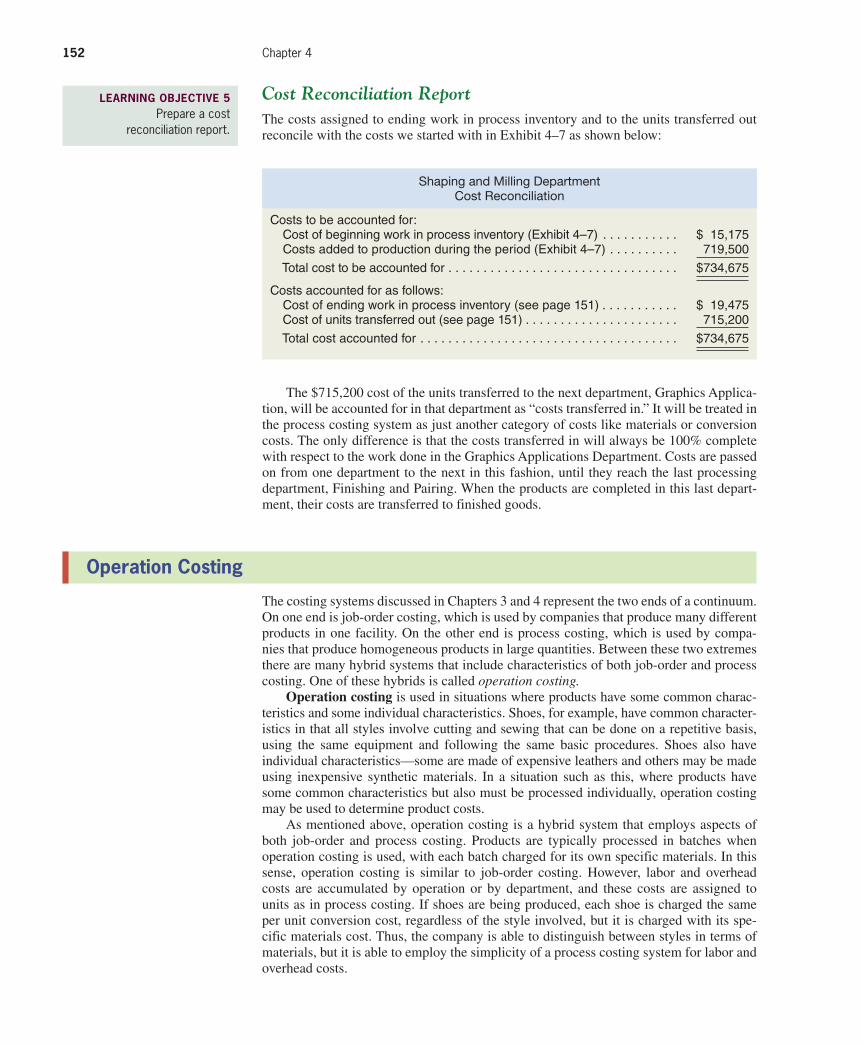
Confi rming Pages
152 Chapter 4
Cost Reconciliation Report
The costs assigned to ending work in process inventory and to the units transferred out
reconcile with the costs we started with in Exhibit 4–7 as shown below:
LEARNING OBJECTIVE 5 Prepare a cost
reconciliation report.
Shaping and Milling Department Cost Reconciliation
Costs to be accounted for: Cost of beginning work in process inventory ( Exhibit 4–7 ) . . . . . . . . . . . $ 15,175 Costs added to production during the period ( Exhibit 4–7 ) . . . . . . . . . . 719,500
Total cost to be accounted for . . . . . . . . . . . . . . . . . . . . . . . . . . . . . . . . . $734,675
Costs accounted for as follows: Cost of ending work in process inventory (see page 151) . . . . . . . . . . . $ 19,475 Cost of units transferred out (see page 151) . . . . . . . . . . . . . . . . . . . . . . 715,200
Total cost accounted for . . . . . . . . . . . . . . . . . . . . . . . . . . . . . . . . . . . . . $734,675
The $715,200 cost of the units transferred to the next department, Graphics Applica-
tion, will be accounted for in that department as “costs transferred in.” It will be treated in
the process costing system as just another category of costs like materials or conversion
costs. The only difference is that the costs transferred in will always be 100% complete
with respect to the work done in the Graphics Applications Department. Costs are passed
on from one department to the next in this fashion, until they reach the last processing
department, Finishing and Pairing. When the products are completed in this last depart-
ment, their costs are transferred to finished goods.
Operation Costing
The costing systems discussed in Chapters 3 and 4 represent the two ends of a continuum.
On one end is job-order costing, which is used by companies that produce many different
products in one facility. On the other end is process costing, which is used by compa-
nies that produce homogeneous products in large quantities. Between these two extremes
there are many hybrid systems that include characteristics of both job-order and process
costing. One of these hybrids is called operation costing. Operation costing is used in situations where products have some common charac-
teristics and some individual characteristics. Shoes, for example, have common character-
istics in that all styles involve cutting and sewing that can be done on a repetitive basis,
using the same equipment and following the same basic procedures. Shoes also have
individual characteristics—some are made of expensive leathers and others may be made
using inexpensive synthetic materials. In a situation such as this, where products have
some common characteristics but also must be processed individually, operation costing
may be used to determine product costs.
As mentioned above, operation costing is a hybrid system that employs aspects of
both job-order and process costing. Products are typically processed in batches when
operation costing is used, with each batch charged for its own specific materials. In this
sense, operation costing is similar to job-order costing. However, labor and overhead
costs are accumulated by operation or by department, and these costs are assigned to
units as in process costing. If shoes are being produced, each shoe is charged the same
per unit conversion cost, regardless of the style involved, but it is charged with its spe-
cific materials cost. Thus, the company is able to distinguish between styles in terms of
materials, but it is able to employ the simplicity of a process costing system for labor and
overhead costs.
gar11005_ch04_141-182.indd 152gar11005_ch04_141-182.indd 152 02/11/10 3:02 PM02/11/10 3:02 PM
Confi rming Pages
Process Costing 153
Summary
Process costing is used in situations where homogeneous products or services are produced on
a continuous basis. Costs flow through the manufacturing accounts in basically the same way in
a process costing system as in a job-order costing system. However, costs are accumulated by
department rather than by job in process costing.
In process costing, the equivalent units of production must be determined for each cost cat-
egory in each department. Under the weighted-average method, the equivalent units of production
equals the number of units transferred out to the next department or to finished goods plus the
equivalent units in ending work in process inventory. The equivalent units in ending inventory
equals the product of the number of partially completed units in ending work in process inventory
and their percentage of completion with respect to the specific cost category.
Under the weighted-average method, the cost per equivalent unit for a specific cost category is
computed by adding the cost of beginning work in process inventory and the cost added during the
period and then dividing the result by the equivalent units of production. The cost per equivalent
unit is then used to value the ending work in process inventory and the units transferred out to the
next department or to finished goods.
The cost reconciliation report reconciles the cost of beginning inventory and the costs added
to production during the period to the cost of ending inventory and the cost of units transferred out.
Costs are transferred from one department to the next until the last processing department. At
that point, the cost of completed units is transferred to finished goods.
Examples of other products for which operation costing may be used include elec-
tronic equipment (such as semiconductors), textiles, clothing, and jewelry (such as rings,
bracelets, and medallions). Products of this type are typically produced in batches, but
they can vary considerably from model to model or from style to style in terms of the cost
of materials.
Review Problem: Process Cost Flows and Costing Units
Luxguard Home Paint Company produces exterior latex paint, which it sells in one-gallon contain-
ers. The company has two processing departments—Base Fab and Finishing. White paint, which is
used as a base for all the company’s paints, is mixed from raw ingredients in the Base Fab Depart-
ment. Pigments are then added to the basic white paint, the pigmented paint is squirted under
pressure into one-gallon containers, and the containers are labeled and packed for shipping in the
Finishing Department. Information relating to the company’s operations for April follows:
a. Issued raw materials for use in production: Base Fab Department, $851,000; and Finishing
Department, $629,000.
b. Incurred direct labor costs: Base Fab Department, $330,000; and Finishing Department,
$270,000.
c. Applied manufacturing overhead cost: Base Fab Department, $665,000; and Finishing Depart-
ment, $405,000.
d. Transferred basic white paint from the Base Fab Department to the Finishing Department,
$1,850,000.
e. Transferred paint that had been prepared for shipping from the Finishing Department to Fin-
ished Goods, $3,200,000.
Required: 1. Prepare journal entries to record items (a) through (e) above.
2. Post the journal entries from (1) above to T-accounts. The balance in the Base Fab Department’s
Work in Process account on April 1 was $150,000; the balance in the Finishing Department’s Work
in Process account was $70,000. After posting entries to the T-accounts, find the ending balance in
each department’s Work in Process account.
3. Determine the cost of ending work in process inventories and of units transferred out of the
Base Fab Department in April. The following additional information is available regarding
production in the Base Fab Department during April:
gar11005_ch04_141-182.indd 153gar11005_ch04_141-182.indd 153 02/11/10 3:02 PM02/11/10 3:02 PM
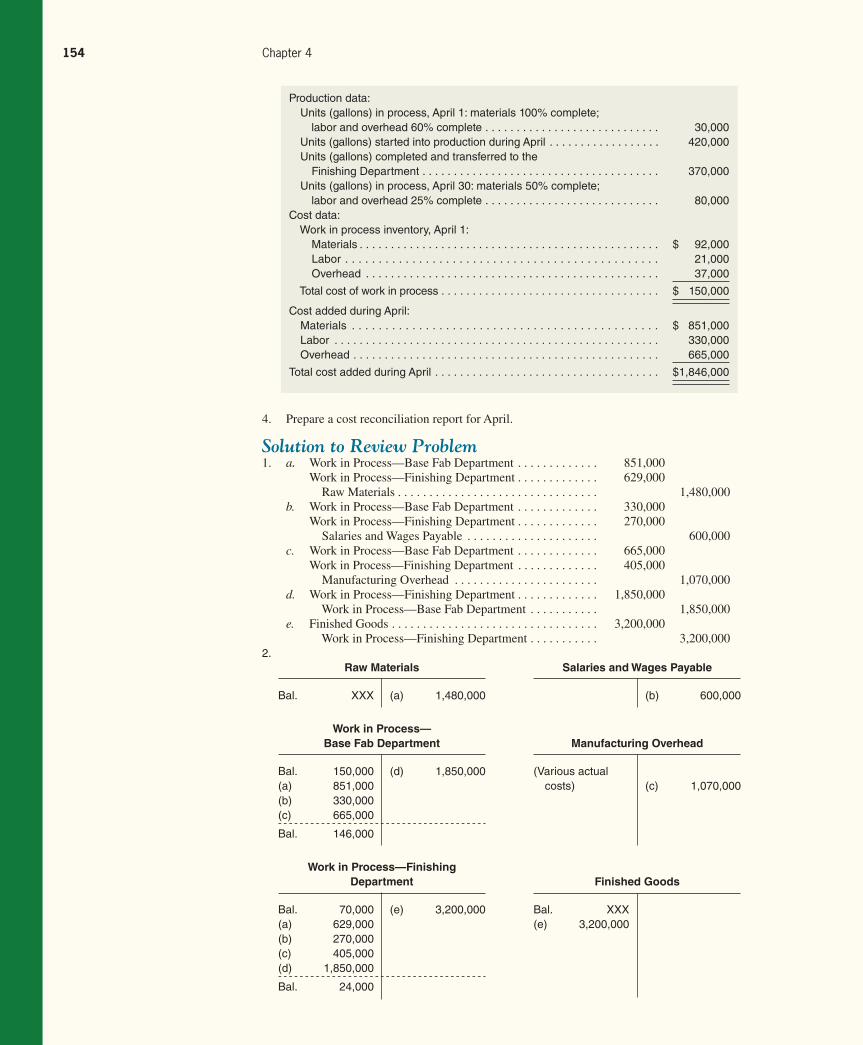
Rev.Confi rming Pages
154 Chapter 4
4. Prepare a cost reconciliation report for April.
Solution to Review Problem 1. a . Work in Process—Base Fab Department . . . . . . . . . . . . . 851,000
Work in Process—Finishing Department . . . . . . . . . . . . . 629,000
Raw Materials . . . . . . . . . . . . . . . . . . . . . . . . . . . . . . . . 1,480,000
b. Work in Process—Base Fab Department . . . . . . . . . . . . . 330,000
Work in Process—Finishing Department . . . . . . . . . . . . . 270,000
Salaries and Wages Payable . . . . . . . . . . . . . . . . . . . . . 600,000
c. Work in Process—Base Fab Department . . . . . . . . . . . . . 665,000
Work in Process—Finishing Department . . . . . . . . . . . . . 405,000
Manufacturing Overhead . . . . . . . . . . . . . . . . . . . . . . . 1,070,000
d. Work in Process—Finishing Department . . . . . . . . . . . . . 1,850,000
Work in Process—Base Fab Department . . . . . . . . . . . 1,850,000
e. Finished Goods . . . . . . . . . . . . . . . . . . . . . . . . . . . . . . . . . 3,200,000
Work in Process—Finishing Department . . . . . . . . . . . 3,200,000
2.
Production data: Units (gallons) in process, April 1: materials 100% complete; labor and overhead 60% complete . . . . . . . . . . . . . . . . . . . . . . . . . . . . 30,000 Units (gallons) started into production during April . . . . . . . . . . . . . . . . . . 420,000 Units (gallons) completed and transferred to the Finishing Department . . . . . . . . . . . . . . . . . . . . . . . . . . . . . . . . . . . . . . 370,000 Units (gallons) in process, April 30: materials 50% complete; labor and overhead 25% complete . . . . . . . . . . . . . . . . . . . . . . . . . . . . 80,000 Cost data: Work in process inventory, April 1: Materials . . . . . . . . . . . . . . . . . . . . . . . . . . . . . . . . . . . . . . . . . . . . . . . . $ 92,000 Labor . . . . . . . . . . . . . . . . . . . . . . . . . . . . . . . . . . . . . . . . . . . . . . . 21,000 Overhead . . . . . . . . . . . . . . . . . . . . . . . . . . . . . . . . . . . . . . . . . . . . . . . 37,000
Total cost of work in process . . . . . . . . . . . . . . . . . . . . . . . . . . . . . . . . . . . $ 150,000
Cost added during April: Materials . . . . . . . . . . . . . . . . . . . . . . . . . . . . . . . . . . . . . . . . . . . . . . $ 851,000 Labor . . . . . . . . . . . . . . . . . . . . . . . . . . . . . . . . . . . . . . . . . . . . . . . . . . . . 330,000 Overhead . . . . . . . . . . . . . . . . . . . . . . . . . . . . . . . . . . . . . . . . . . . . . . . . . 665,000
Total cost added during April . . . . . . . . . . . . . . . . . . . . . . . . . . . . . . . . . . . . $1,846,000
Raw Materials
Bal. XXX (a) 1,480,000
Work in Process—
Base Fab Department
Bal. 150,000 (d) 1,850,000(a) 851,000(b) 330,000(c) 665,000
Bal. 146,000
Work in Process—Finishing
Department
Bal. 70,000 (e) 3,200,000(a) 629,000(b) 270,000(c) 405,000(d) 1,850,000
Bal. 24,000
Salaries and Wages Payable
(b) 600,000
Manufacturing Overhead
(Various actual costs) (c) 1,070,000
Finished Goods
Bal. XXX(e) 3,200,000
gar11005_ch04_141-182.indd 154gar11005_ch04_141-182.indd 154 10/11/10 3:55 PM10/11/10 3:55 PM
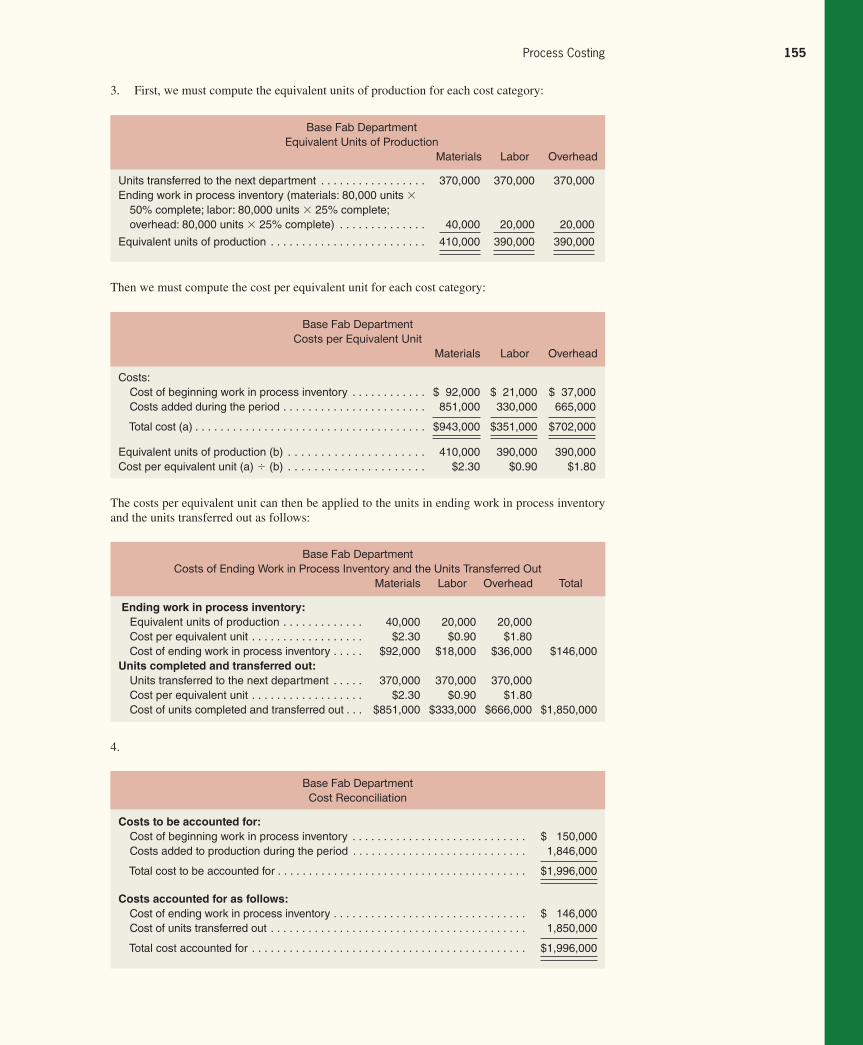
Confi rming Pages
Process Costing 155
3. First, we must compute the equivalent units of production for each cost category:
Base Fab Department
Equivalent Units of Production
Materials Labor Overhead
Units transferred to the next department . . . . . . . . . . . . . . . . . 370,000 370,000 370,000 Ending work in process inventory (materials: 80,000 units × 50% complete; labor: 80,000 units × 25% complete; overhead: 80,000 units × 25% complete) . . . . . . . . . . . . . . 40,000 20,000 20,000
Equivalent units of production . . . . . . . . . . . . . . . . . . . . . . . . . 410,000 390,000 390,000
Base Fab Department
Costs per Equivalent Unit
Materials Labor Overhead
Costs: Cost of beginning work in process inventory . . . . . . . . . . . . $ 92,000 $ 21,000 $ 37,000 Costs added during the period . . . . . . . . . . . . . . . . . . . . . . . 851,000 330,000 665,000
Total cost (a) . . . . . . . . . . . . . . . . . . . . . . . . . . . . . . . . . . . . . $943,000 $351,000 $702,000
Equivalent units of production (b) . . . . . . . . . . . . . . . . . . . . . 410,000 390,000 390,000 Cost per equivalent unit (a) ÷ (b) . . . . . . . . . . . . . . . . . . . . . $2.30 $0.90 $1.80
Base Fab Department
Costs of Ending Work in Process Inventory and the Units Transferred Out
Materials Labor Overhead Total
Ending work in process inventory: Equivalent units of production . . . . . . . . . . . . . 40,000 20,000 20,000 Cost per equivalent unit . . . . . . . . . . . . . . . . . . $2.30 $0.90 $1.80 Cost of ending work in process inventory . . . . . $92,000 $18,000 $36,000 $146,000 Units completed and transferred out: Units transferred to the next department . . . . . 370,000 370,000 370,000 Cost per equivalent unit . . . . . . . . . . . . . . . . . . $2.30 $0.90 $1.80 Cost of units completed and transferred out . . . $851,000 $333,000 $666,000 $1,850,000
Base Fab Department
Cost Reconciliation
Costs to be accounted for: Cost of beginning work in process inventory . . . . . . . . . . . . . . . . . . . . . . . . . . . . $ 150,000 Costs added to production during the period . . . . . . . . . . . . . . . . . . . . . . . . . . . . 1,846,000
Total cost to be accounted for . . . . . . . . . . . . . . . . . . . . . . . . . . . . . . . . . . . . . . . . $1,996,000
Costs accounted for as follows: Cost of ending work in process inventory . . . . . . . . . . . . . . . . . . . . . . . . . . . . . . . $ 146,000 Cost of units transferred out . . . . . . . . . . . . . . . . . . . . . . . . . . . . . . . . . . . . . . . . . 1,850,000
Total cost accounted for . . . . . . . . . . . . . . . . . . . . . . . . . . . . . . . . . . . . . . . . . . . . $1,996,000
Then we must compute the cost per equivalent unit for each cost category:
The costs per equivalent unit can then be applied to the units in ending work in process inventory
and the units transferred out as follows:
4.
gar11005_ch04_141-182.indd 155gar11005_ch04_141-182.indd 155 02/11/10 3:02 PM02/11/10 3:02 PM

Confi rming Pages
156 Chapter 4
Glossary
Conversion cost Direct labor cost plus manufacturing overhead cost. (p. 148)
Equivalent units The product of the number of partially completed units and their percentage
of completion with respect to a particular cost. Equivalent units are the number of complete
whole units that could be obtained from the materials and effort contained in partially com-
pleted units. (p. 148)
Equivalent units of production (weighted-average method) The units transferred to the next
department (or to finished goods) during the period plus the equivalent units in the depart-
ment’s ending work in process inventory. (p. 148)
FIFO method A process costing method in which equivalent units and unit costs relate only to
work done during the current period. (p. 148)
Operation costing A hybrid costing system used when products have some common characteris-
tics and some individual characteristics. (p. 152)
Process costing A costing method used when essentially homogeneous products are produced on
a continuous basis. (p. 142)
Processing department An organizational unit where work is performed on a product and where
materials, labor, or overhead costs are added to the product. (p. 143)
Weighted-average method A process costing method that blends together units and costs from
both the current and prior periods. (p. 148)
Questions
4–1 Under what conditions would it be appropriate to use a process costing system?
4–2 In what ways are job-order and process costing similar?
4–3 Why is cost accumulation simpler in a process costing system than it is in a job-order
costing system?
4–4 How many Work in Process accounts are maintained in a company that uses process
costing?
4–5 Assume that a company has two processing departments—Mixing followed by Firing.
Prepare a journal entry to show a transfer of work in process from the Mixing Depart-
ment to the Firing Department.
4–6 Assume that a company has two processing departments—Mixing followed by Firing.
Explain what costs might be added to the Firing Department’s Work in Process account
during a period.
4–7 What is meant by the term equivalent units of production when the weighted-average
method is used?
4–8 Watkins Trophies, Inc., produces thousands of medallions made of bronze, silver, and
gold. The medallions are identical except for the materials used in their manufacture.
What costing system would you advise the company to use?
Multiple-choice questions are provided on the text website at www.mhhe.com/garrison14e .
gar11005_ch04_141-182.indd 156gar11005_ch04_141-182.indd 156 02/11/10 3:02 PM02/11/10 3:02 PM
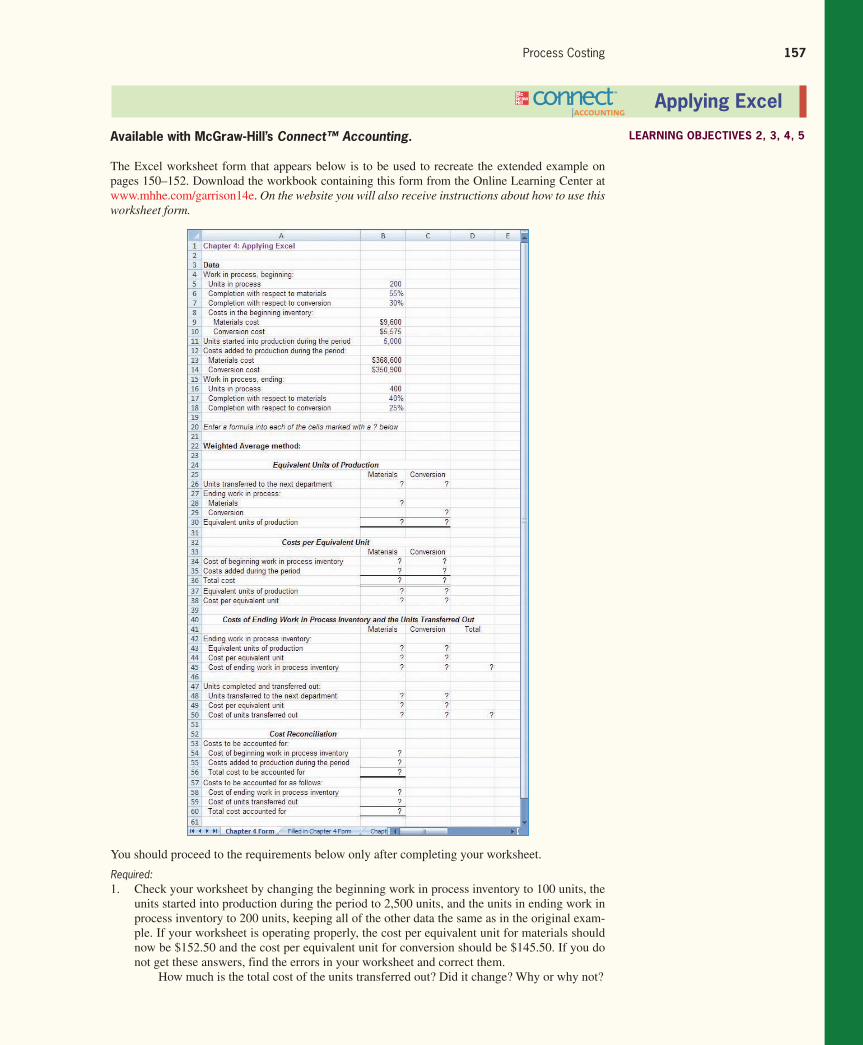
Rev.Confi rming Pages
Process Costing 157
You should proceed to the requirements below only after completing your worksheet.
Required: 1. Check your worksheet by changing the beginning work in process inventory to 100 units, the
units started into production during the period to 2,500 units, and the units in ending work in
process inventory to 200 units, keeping all of the other data the same as in the original exam-
ple. If your worksheet is operating properly, the cost per equivalent unit for materials should
now be $152.50 and the cost per equivalent unit for conversion should be $145.50. If you do
not get these answers, find the errors in your worksheet and correct them.
How much is the total cost of the units transferred out? Did it change? Why or why not?
Applying Excel
Available with McGraw-Hill’s Connect™ Accounting.
The Excel worksheet form that appears below is to be used to recreate the extended example on
pages 150–152. Download the workbook containing this form from the Online Learning Center at
www.mhhe.com/garrison14e. On the website you will also receive instructions about how to use this worksheet form.
LEARNING OBJECTIVES 2, 3, 4, 5
gar11005_ch04_141-182.indd 157gar11005_ch04_141-182.indd 157 22/11/10 10:32 AM22/11/10 10:32 AM
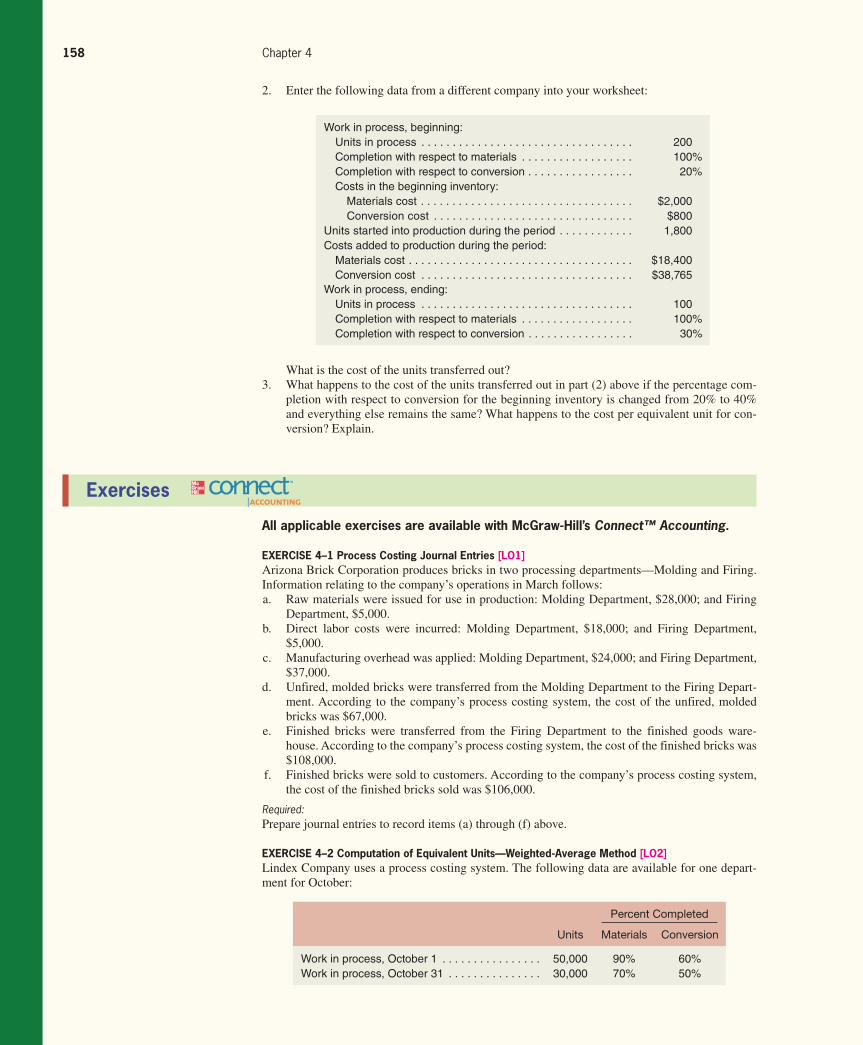
Confi rming Pages
158 Chapter 4
2. Enter the following data from a different company into your worksheet:
Work in process, beginning: Units in process . . . . . . . . . . . . . . . . . . . . . . . . . . . . . . . . . . 200 Completion with respect to materials . . . . . . . . . . . . . . . . . . 100% Completion with respect to conversion . . . . . . . . . . . . . . . . . 20% Costs in the beginning inventory: Materials cost . . . . . . . . . . . . . . . . . . . . . . . . . . . . . . . . . . $2,000 Conversion cost . . . . . . . . . . . . . . . . . . . . . . . . . . . . . . . . $800Units started into production during the period . . . . . . . . . . . . 1,800Costs added to production during the period: Materials cost . . . . . . . . . . . . . . . . . . . . . . . . . . . . . . . . . . . . $18,400 Conversion cost . . . . . . . . . . . . . . . . . . . . . . . . . . . . . . . . . . $38,765Work in process, ending: Units in process . . . . . . . . . . . . . . . . . . . . . . . . . . . . . . . . . . 100 Completion with respect to materials . . . . . . . . . . . . . . . . . . 100% Completion with respect to conversion . . . . . . . . . . . . . . . . . 30%
What is the cost of the units transferred out?
3. What happens to the cost of the units transferred out in part (2) above if the percentage com-
pletion with respect to conversion for the beginning inventory is changed from 20% to 40%
and everything else remains the same? What happens to the cost per equivalent unit for con-
version? Explain.
Exercises
All applicable exercises are available with McGraw-Hill’s Connect™ Accounting .
EXERCISE 4–1 Process Costing Journal Entries [LO1] Arizona Brick Corporation produces bricks in two processing departments—Molding and Firing.
Information relating to the company’s operations in March follows:
a. Raw materials were issued for use in production: Molding Department, $28,000; and Firing
Department, $5,000.
b. Direct labor costs were incurred: Molding Department, $18,000; and Firing Department,
$5,000.
c. Manufacturing overhead was applied: Molding Department, $24,000; and Firing Department,
$37,000.
d. Unfired, molded bricks were transferred from the Molding Department to the Firing Depart-
ment. According to the company’s process costing system, the cost of the unfired, molded
bricks was $67,000.
e. Finished bricks were transferred from the Firing Department to the finished goods ware-
house. According to the company’s process costing system, the cost of the finished bricks was
$108,000.
f. Finished bricks were sold to customers. According to the company’s process costing system,
the cost of the finished bricks sold was $106,000.
Required: Prepare journal entries to record items (a) through (f) above.
EXERCISE 4–2 Computation of Equivalent Units—Weighted-Average Method [LO2] Lindex Company uses a process costing system. The following data are available for one depart-
ment for October:
Percent Completed
Units Materials Conversion
Work in process, October 1 . . . . . . . . . . . . . . . . 50,000 90% 60%Work in process, October 31 . . . . . . . . . . . . . . . 30,000 70% 50%
gar11005_ch04_141-182.indd 158gar11005_ch04_141-182.indd 158 02/11/10 3:02 PM02/11/10 3:02 PM
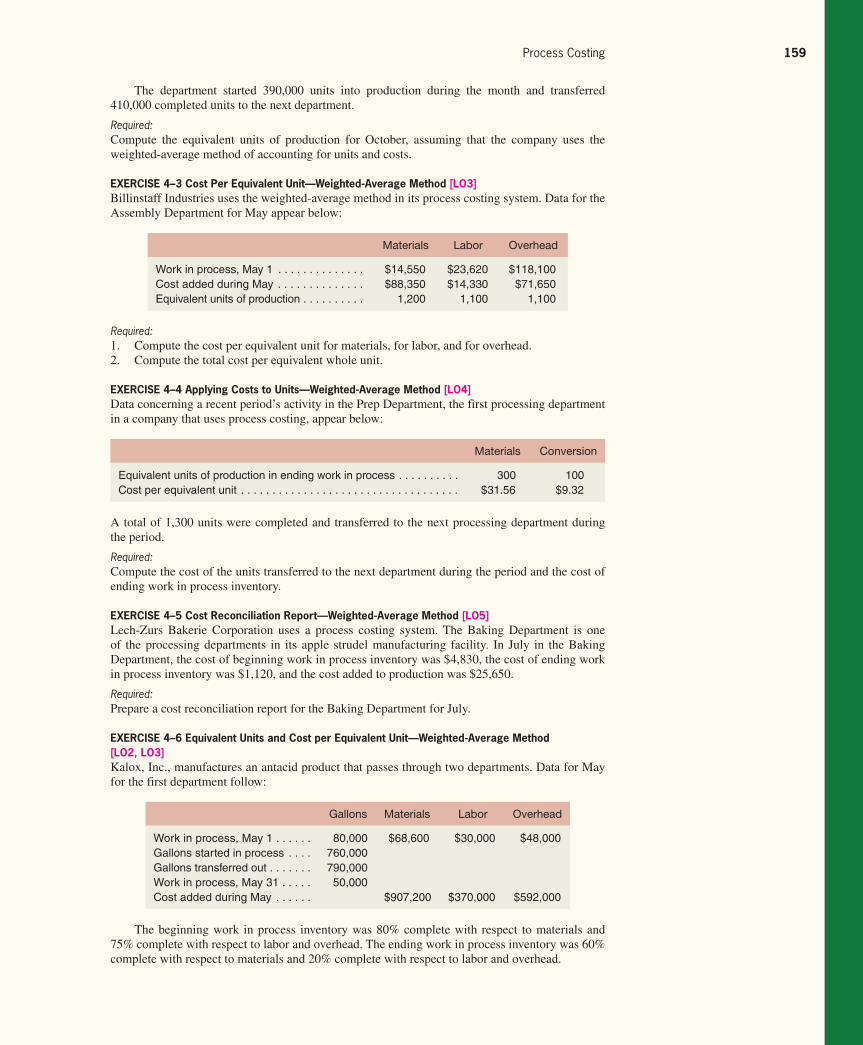
Confi rming Pages
Process Costing 159
The department started 390,000 units into production during the month and transferred
410,000 completed units to the next department.
Required: Compute the equivalent units of production for October, assuming that the company uses the
weighted-average method of accounting for units and costs.
EXERCISE 4–3 Cost Per Equivalent Unit—Weighted-Average Method [LO3] Billinstaff Industries uses the weighted-average method in its process costing system. Data for the
Assembly Department for May appear below:
Materials Labor Overhead
Work in process, May 1 . . . . . . . . . . . . . . $14,550 $23,620 $118,100Cost added during May . . . . . . . . . . . . . . $88,350 $14,330 $71,650Equivalent units of production . . . . . . . . . . 1,200 1,100 1,100
Required: 1. Compute the cost per equivalent unit for materials, for labor, and for overhead.
2. Compute the total cost per equivalent whole unit.
EXERCISE 4–4 Applying Costs to Units—Weighted-Average Method [LO4] Data concerning a recent period’s activity in the Prep Department, the first processing department
in a company that uses process costing, appear below:
A total of 1,300 units were completed and transferred to the next processing department during
the period.
Required: Compute the cost of the units transferred to the next department during the period and the cost of
ending work in process inventory.
EXERCISE 4–5 Cost Reconciliation Report—Weighted-Average Method [LO5] Lech-Zurs Bakerie Corporation uses a process costing system. The Baking Department is one
of the processing departments in its apple strudel manufacturing facility. In July in the Baking
Department, the cost of beginning work in process inventory was $4,830, the cost of ending work
in process inventory was $1,120, and the cost added to production was $25,650.
Required: Prepare a cost reconciliation report for the Baking Department for July.
EXERCISE 4–6 Equivalent Units and Cost per Equivalent Unit—Weighted-Average Method [LO2, LO3] Kalox, Inc., manufactures an antacid product that passes through two departments. Data for May
for the first department follow:
Materials Conversion
Equivalent units of production in ending work in process . . . . . . . . . . 300 100Cost per equivalent unit . . . . . . . . . . . . . . . . . . . . . . . . . . . . . . . . . . . $31.56 $9.32
Gallons Materials Labor Overhead
Work in process, May 1 . . . . . . 80,000 $68,600 $30,000 $48,000Gallons started in process . . . . 760,000Gallons transferred out . . . . . . . 790,000Work in process, May 31 . . . . . 50,000Cost added during May . . . . . . $907,200 $370,000 $592,000
The beginning work in process inventory was 80% complete with respect to materials and
75% complete with respect to labor and overhead. The ending work in process inventory was 60%
complete with respect to materials and 20% complete with respect to labor and overhead.
gar11005_ch04_141-182.indd 159gar11005_ch04_141-182.indd 159 02/11/10 3:02 PM02/11/10 3:02 PM
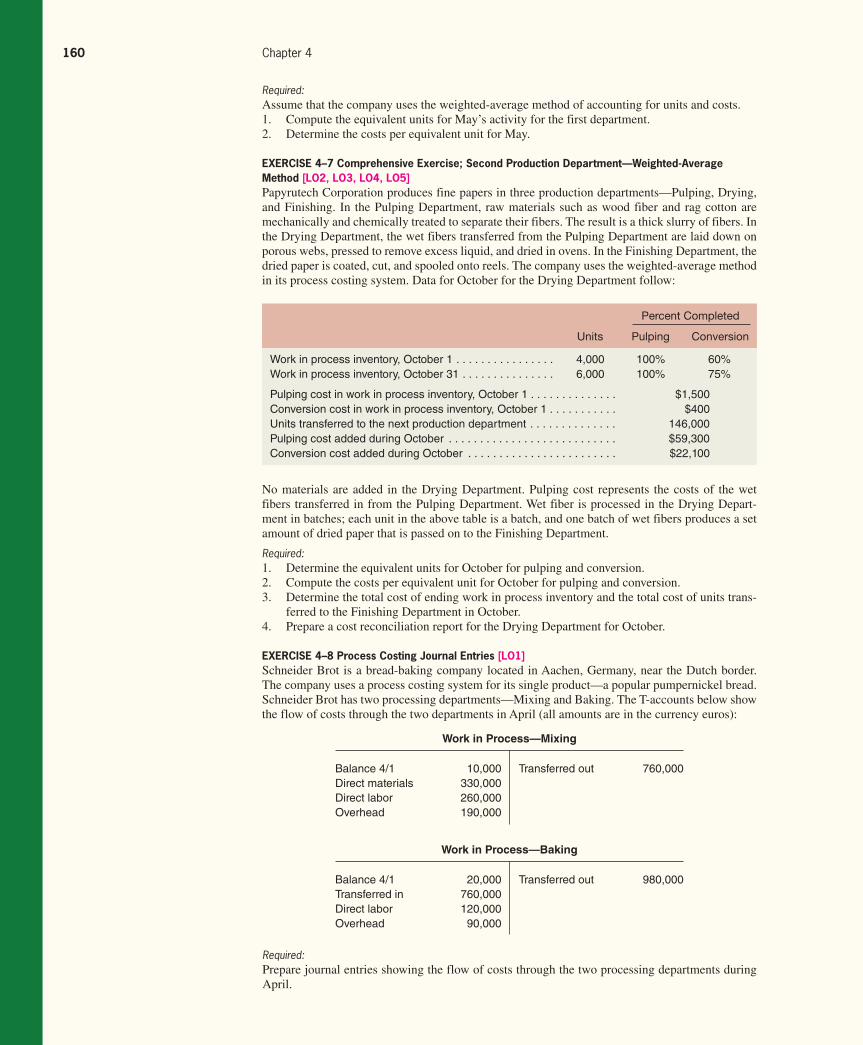
Rev.Confi rming Pages
160 Chapter 4
Required: Assume that the company uses the weighted-average method of accounting for units and costs.
1. Compute the equivalent units for May’s activity for the first department.
2. Determine the costs per equivalent unit for May.
EXERCISE 4–7 Comprehensive Exercise; Second Production Department—Weighted-Average Method [LO2, LO3, LO4, LO5] Papyrutech Corporation produces fine papers in three production departments—Pulping, Drying,
and Finishing. In the Pulping Department, raw materials such as wood fiber and rag cotton are
mechanically and chemically treated to separate their fibers. The result is a thick slurry of fibers. In
the Drying Department, the wet fibers transferred from the Pulping Department are laid down on
porous webs, pressed to remove excess liquid, and dried in ovens. In the Finishing Department, the
dried paper is coated, cut, and spooled onto reels. The company uses the weighted-average method
in its process costing system. Data for October for the Drying Department follow:
Percent Completed
Units Pulping Conversion
Work in process inventory, October 1 . . . . . . . . . . . . . . . . 4,000 100% 60%Work in process inventory, October 31 . . . . . . . . . . . . . . . 6,000 100% 75%
Pulping cost in work in process inventory, October 1 . . . . . . . . . . . . . . $1,500Conversion cost in work in process inventory, October 1 . . . . . . . . . . . $400Units transferred to the next production department . . . . . . . . . . . . . . 146,000Pulping cost added during October . . . . . . . . . . . . . . . . . . . . . . . . . . . $59,300Conversion cost added during October . . . . . . . . . . . . . . . . . . . . . . . . $22,100
No materials are added in the Drying Department. Pulping cost represents the costs of the wet
fibers transferred in from the Pulping Department. Wet fiber is processed in the Drying Depart-
ment in batches; each unit in the above table is a batch, and one batch of wet fibers produces a set
amount of dried paper that is passed on to the Finishing Department.
Required: 1. Determine the equivalent units for October for pulping and conversion.
2. Compute the costs per equivalent unit for October for pulping and conversion.
3. Determine the total cost of ending work in process inventory and the total cost of units trans-
ferred to the Finishing Department in October.
4. Prepare a cost reconciliation report for the Drying Department for October.
EXERCISE 4–8 Process Costing Journal Entries [LO1] Schneider Brot is a bread-baking company located in Aachen, Germany, near the Dutch border.
The company uses a process costing system for its single product—a popular pumpernickel bread.
Schneider Brot has two processing departments—Mixing and Baking. The T-accounts below show
the flow of costs through the two departments in April (all amounts are in the currency euros):
Work in Process—Mixing
Balance 4/1 10,000 Transferred out 760,000 Direct materials 330,000 Direct labor 260,000 Overhead 190,000
Work in Process—Baking
Balance 4/1 20,000 Transferred out 980,000 Transferred in 760,000 Direct labor 120,000 Overhead 90,000
Required: Prepare journal entries showing the flow of costs through the two processing departments during
April.
gar11005_ch04_141-182.indd 160gar11005_ch04_141-182.indd 160 10/11/10 3:55 PM10/11/10 3:55 PM
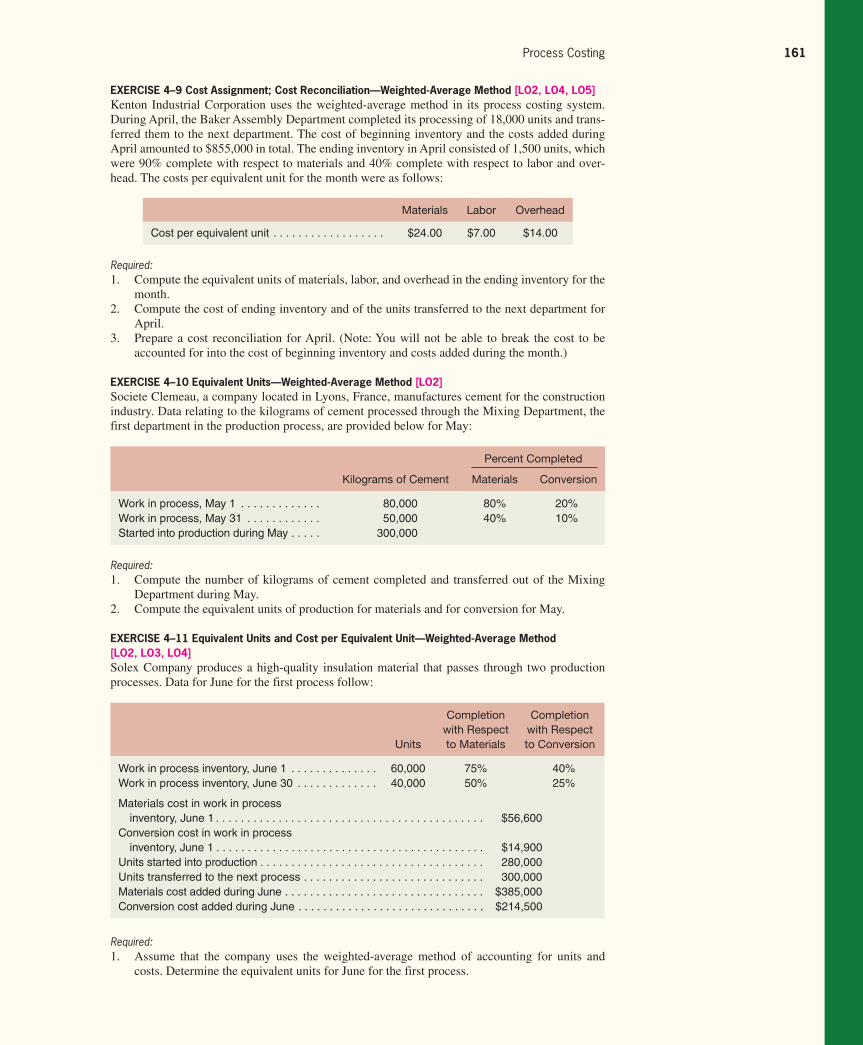
Rev.Confi rming Pages
Process Costing 161
EXERCISE 4–9 Cost Assignment; Cost Reconciliation—Weighted-Average Method [LO2, LO4, LO5] Kenton Industrial Corporation uses the weighted-average method in its process costing system.
During April, the Baker Assembly Department completed its processing of 18,000 units and trans-
ferred them to the next department. The cost of beginning inventory and the costs added during
April amounted to $855,000 in total. The ending inventory in April consisted of 1,500 units, which
were 90% complete with respect to materials and 40% complete with respect to labor and over-
head. The costs per equivalent unit for the month were as follows:
Materials Labor Overhead
Cost per equivalent unit . . . . . . . . . . . . . . . . . . $24.00 $7.00 $14.00
Required: 1. Compute the equivalent units of materials, labor, and overhead in the ending inventory for the
month.
2. Compute the cost of ending inventory and of the units transferred to the next department for
April.
3. Prepare a cost reconciliation for April. (Note: You will not be able to break the cost to be
accounted for into the cost of beginning inventory and costs added during the month.)
EXERCISE 4–10 Equivalent Units—Weighted-Average Method [LO2] Societe Clemeau, a company located in Lyons, France, manufactures cement for the construction
industry. Data relating to the kilograms of cement processed through the Mixing Department, the
first department in the production process, are provided below for May:
Percent Completed
Kilograms of Cement Materials Conversion
Work in process, May 1 . . . . . . . . . . . . . 80,000 80% 20%Work in process, May 31 . . . . . . . . . . . . 50,000 40% 10%Started into production during May . . . . . 300,000
Required: 1. Compute the number of kilograms of cement completed and transferred out of the Mixing
Department during May.
2. Compute the equivalent units of production for materials and for conversion for May.
EXERCISE 4–11 Equivalent Units and Cost per Equivalent Unit—Weighted-Average Method [LO2, LO3, LO4] Solex Company produces a high-quality insulation material that passes through two production
processes. Data for June for the first process follow:
Units
Completion
with Respect
to Materials
Completion
with Respect
to Conversion
Work in process inventory, June 1 . . . . . . . . . . . . . . 60,000 75% 40%Work in process inventory, June 30 . . . . . . . . . . . . . 40,000 50% 25%
Materials cost in work in process inventory, June 1 . . . . . . . . . . . . . . . . . . . . . . . . . . . . . . . . . . . . . . . . . . . $56,600Conversion cost in work in process inventory, June 1 . . . . . . . . . . . . . . . . . . . . . . . . . . . . . . . . . . . . . . . . . . . $14,900Units started into production . . . . . . . . . . . . . . . . . . . . . . . . . . . . . . . . . . . . 280,000Units transferred to the next process . . . . . . . . . . . . . . . . . . . . . . . . . . . . . 300,000Materials cost added during June . . . . . . . . . . . . . . . . . . . . . . . . . . . . . . . . $385,000Conversion cost added during June . . . . . . . . . . . . . . . . . . . . . . . . . . . . . . $214,500
Required: 1. Assume that the company uses the weighted-average method of accounting for units and
costs. Determine the equivalent units for June for the first process.
gar11005_ch04_141-182.indd 161gar11005_ch04_141-182.indd 161 10/11/10 3:55 PM10/11/10 3:55 PM
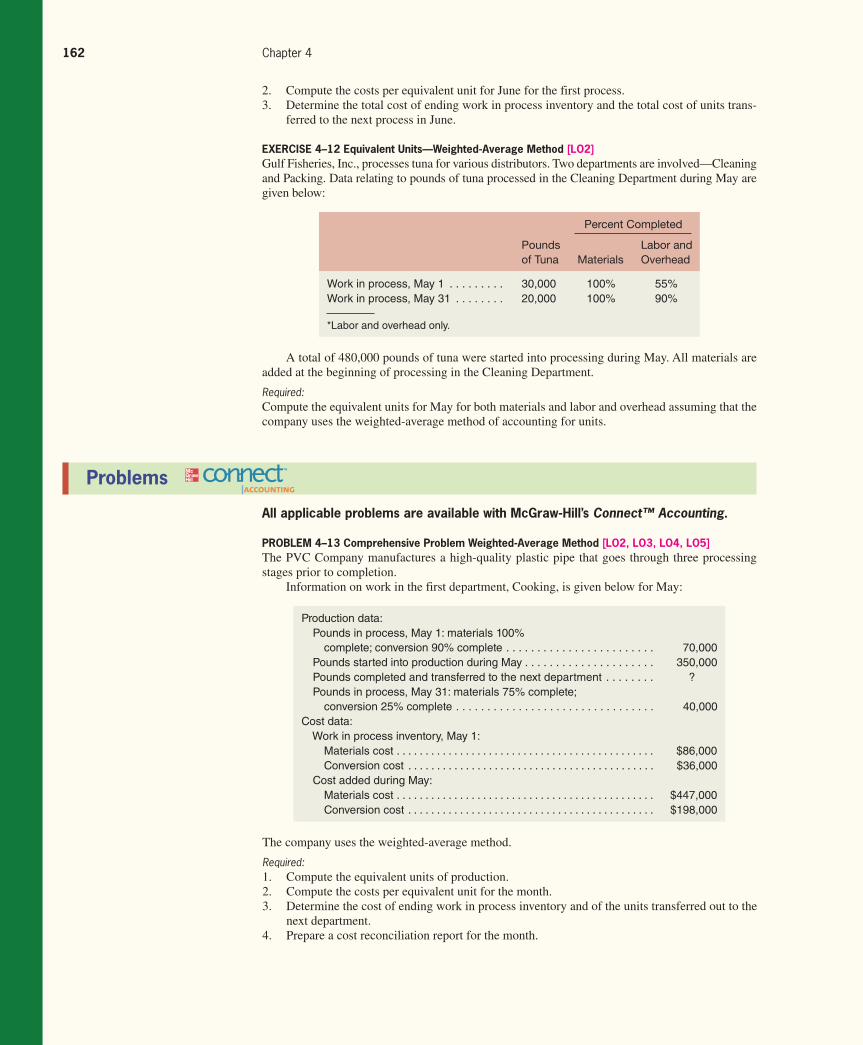
Confi rming Pages
162 Chapter 4
2. Compute the costs per equivalent unit for June for the first process.
3. Determine the total cost of ending work in process inventory and the total cost of units trans-
ferred to the next process in June.
EXERCISE 4–12 Equivalent Units—Weighted-Average Method [LO2] Gulf Fisheries, Inc., processes tuna for various distributors. Two departments are involved—Cleaning
and Packing. Data relating to pounds of tuna processed in the Cleaning Department during May are
given below:
Percent Completed
Pounds
of Tuna Materials
Labor and
Overhead
Work in process, May 1 . . . . . . . . . 30,000 100% 55%Work in process, May 31 . . . . . . . . 20,000 100% 90%
*Labor and overhead only.
A total of 480,000 pounds of tuna were started into processing during May. All materials are
added at the beginning of processing in the Cleaning Department.
Required: Compute the equivalent units for May for both materials and labor and overhead assuming that the
company uses the weighted-average method of accounting for units.
Problems
All applicable problems are available with McGraw-Hill’s Connect™ Accounting .
PROBLEM 4–13 Comprehensive Problem Weighted-Average Method [LO2, LO3, LO4, LO5] The PVC Company manufactures a high-quality plastic pipe that goes through three processing
stages prior to completion.
Information on work in the first department, Cooking, is given below for May:
Production data: Pounds in process, May 1: materials 100% complete; conversion 90% complete . . . . . . . . . . . . . . . . . . . . . . . . 70,000 Pounds started into production during May . . . . . . . . . . . . . . . . . . . . . 350,000 Pounds completed and transferred to the next department . . . . . . . . ? Pounds in process, May 31: materials 75% complete; conversion 25% complete . . . . . . . . . . . . . . . . . . . . . . . . . . . . . . . . 40,000Cost data: Work in process inventory, May 1: Materials cost . . . . . . . . . . . . . . . . . . . . . . . . . . . . . . . . . . . . . . . . . . . . . $86,000 Conversion cost . . . . . . . . . . . . . . . . . . . . . . . . . . . . . . . . . . . . . . . . . . . $36,000 Cost added during May: Materials cost . . . . . . . . . . . . . . . . . . . . . . . . . . . . . . . . . . . . . . . . . . . . . $447,000 Conversion cost . . . . . . . . . . . . . . . . . . . . . . . . . . . . . . . . . . . . . . . . . . . $198,000
The company uses the weighted-average method.
Required: 1. Compute the equivalent units of production.
2. Compute the costs per equivalent unit for the month.
3. Determine the cost of ending work in process inventory and of the units transferred out to the
next department.
4. Prepare a cost reconciliation report for the month.
gar11005_ch04_141-182.indd 162gar11005_ch04_141-182.indd 162 02/11/10 3:02 PM02/11/10 3:02 PM
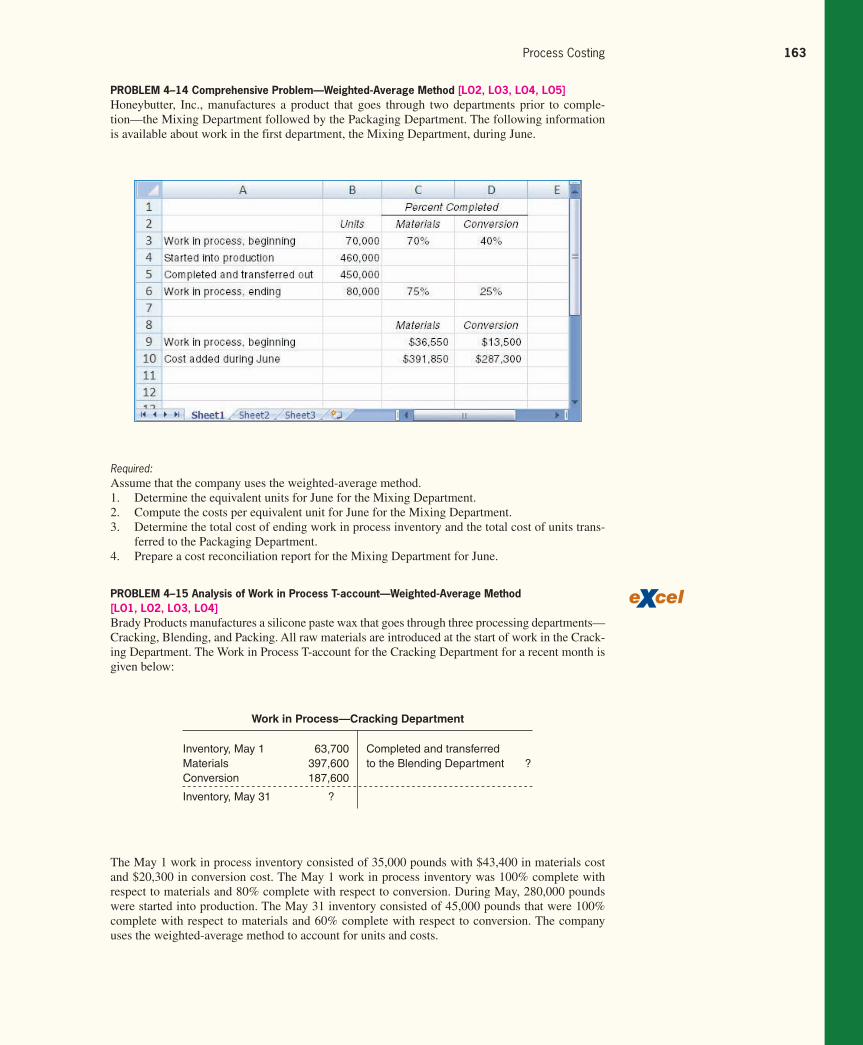
Rev.Confi rming Pages
Process Costing 163
PROBLEM 4–14 Comprehensive Problem—Weighted-Average Method [LO2, LO3, LO4, LO5] Honeybutter, Inc., manufactures a product that goes through two departments prior to comple-
tion—the Mixing Department followed by the Packaging Department. The following information
is available about work in the first department, the Mixing Department, during June.
Required: Assume that the company uses the weighted-average method.
1. Determine the equivalent units for June for the Mixing Department.
2. Compute the costs per equivalent unit for June for the Mixing Department.
3. Determine the total cost of ending work in process inventory and the total cost of units trans-
ferred to the Packaging Department.
4. Prepare a cost reconciliation report for the Mixing Department for June.
PROBLEM 4–15 Analysis of Work in Process T-account—Weighted-Average Method [LO1, LO2, LO3, LO4] Brady Products manufactures a silicone paste wax that goes through three processing departments—
Cracking, Blending, and Packing. All raw materials are introduced at the start of work in the Crack-
ing Department. The Work in Process T-account for the Cracking Department for a recent month is
given below:
Work in Process—Cracking Department
Inventory, May 1 63,700 Completed and transferred Materials 397,600 to the Blending Department ? Conversion 187,600
Inventory, May 31 ?
The May 1 work in process inventory consisted of 35,000 pounds with $43,400 in materials cost
and $20,300 in conversion cost. The May 1 work in process inventory was 100% complete with
respect to materials and 80% complete with respect to conversion. During May, 280,000 pounds
were started into production. The May 31 inventory consisted of 45,000 pounds that were 100%
complete with respect to materials and 60% complete with respect to conversion. The company
uses the weighted-average method to account for units and costs.
gar11005_ch04_141-182.indd 163gar11005_ch04_141-182.indd 163 10/11/10 3:55 PM10/11/10 3:55 PM

Rev.Confi rming Pages
164 Chapter 4
Required: 1. Determine the equivalent units of production for May.
2. Determine the costs per equivalent unit for May.
3. Determine the cost of the units completed and transferred to the Blending Department during
May.
PROBLEM 4–16 Cost Flows [LO1] Nature’s Way, Inc., keeps one of its production facilities busy making a perfume called Essence de
la Vache. The perfume goes through two processing departments: Blending and Bottling.
The following incomplete Work in Process account is provided for the Blending Department
for March:
Work in Process—Blending
March 1 balance 32,800 Completed and transferredMaterials 147,600 to Bottling (760,000 ounces) ? Direct labor 73,200 Overhead 481,000
March 31 balance ?
The $32,800 beginning inventory in the Blending Department consisted of the following ele-
ments: materials, $8,000; direct labor, $4,000; and overhead applied, $20,800.
Costs incurred during March in the Bottling Department were: materials used, $45,000; direct
labor, $17,000; and overhead cost applied to production, $108,000.
Required: 1. Prepare journal entries to record the costs incurred in both the Blending Department and
Bottling Department during March. Key your entries to items (a) through (g) below:
a. Raw materials were issued for use in production.
b. Direct labor costs were incurred.
c. Manufacturing overhead costs for the entire factory were incurred, $596,000. (Credit
Accounts Payable and use a single Manufacturing Overhead control account for the
entire factory.)
d. Manufacturing overhead was applied to production using a predetermined overhead rate.
e. Units that were complete with respect to processing in the Blending Department were
transferred to the Bottling Department, $722,000.
f. Units that were complete with respect to processing in the Bottling Department were
transferred to Finished Goods, $920,000.
g. Completed units were sold on account for $1,400,000. The cost of goods sold was
$890,000.
2. Post the journal entries from (1) above to T-accounts. The following account balances existed
at the beginning of March. (The beginning balance in the Blending Department’s Work in
Process account is given above.)
Raw Materials . . . . . . . . . . . . . . . . . . . . . . . . . . . . . $198,600Work in Process—Bottling Department . . . . . . . . . . $49,000Finished Goods . . . . . . . . . . . . . . . . . . . . . . . . . . . . $20,000
After posting the entries to the T-accounts, find the ending balances in the inventory accounts and
the manufacturing overhead account.
PROBLEM 4–17 Comprehensive Problem; Second Production Department—Weighted-Average Method [LO2, LO3, LO4, LO5] Bohemian Links Inc. produces sausages in three production departments—Mixing, Casing and
Curing, and Packaging. In the Mixing Department, meats are prepared and ground and then mixed
with spices. The spiced meat mixture is then transferred to the Casing and Curing Department,
where the mixture is force-fed into casings and then hung and cured in climate-controlled smoking
chambers. In the Packaging Department, the cured sausages are sorted, packed, and labeled. The
gar11005_ch04_141-182.indd 164gar11005_ch04_141-182.indd 164 10/11/10 3:55 PM10/11/10 3:55 PM
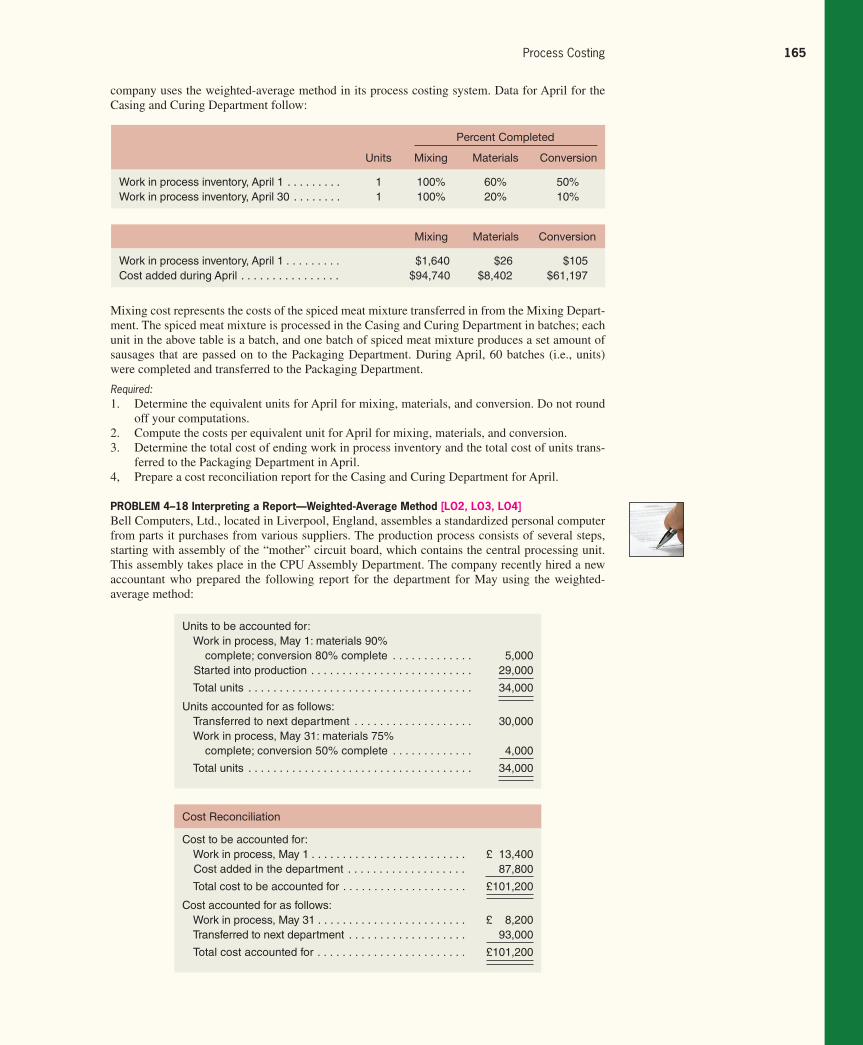
Confi rming Pages
Process Costing 165
Mixing cost represents the costs of the spiced meat mixture transferred in from the Mixing Depart-
ment. The spiced meat mixture is processed in the Casing and Curing Department in batches; each
unit in the above table is a batch, and one batch of spiced meat mixture produces a set amount of
sausages that are passed on to the Packaging Department. During April, 60 batches (i.e., units)
were completed and transferred to the Packaging Department.
Required: 1. Determine the equivalent units for April for mixing, materials, and conversion. Do not round
off your computations.
2. Compute the costs per equivalent unit for April for mixing, materials, and conversion.
3. Determine the total cost of ending work in process inventory and the total cost of units trans-
ferred to the Packaging Department in April.
4, Prepare a cost reconciliation report for the Casing and Curing Department for April.
PROBLEM 4–18 Interpreting a Report—Weighted-Average Method [LO2, LO3, LO4] Bell Computers, Ltd., located in Liverpool, England, assembles a standardized personal computer
from parts it purchases from various suppliers. The production process consists of several steps,
starting with assembly of the “mother” circuit board, which contains the central processing unit.
This assembly takes place in the CPU Assembly Department. The company recently hired a new
accountant who prepared the following report for the department for May using the weighted-
average method:
Percent Completed
Units Mixing Materials Conversion
Work in process inventory, April 1 . . . . . . . . . 1 100% 60% 50%Work in process inventory, April 30 . . . . . . . . 1 100% 20% 10%
Mixing Materials Conversion
Work in process inventory, April 1 . . . . . . . . . $1,640 $26 $105Cost added during April . . . . . . . . . . . . . . . . $94,740 $8,402 $61,197
company uses the weighted-average method in its process costing system. Data for April for the
Casing and Curing Department follow:
Units to be accounted for: Work in process, May 1: materials 90% complete; conversion 80% complete . . . . . . . . . . . . . 5,000 Started into production . . . . . . . . . . . . . . . . . . . . . . . . . . 29,000
Total units . . . . . . . . . . . . . . . . . . . . . . . . . . . . . . . . . . . . 34,000
Units accounted for as follows: Transferred to next department . . . . . . . . . . . . . . . . . . . 30,000 Work in process, May 31: materials 75% complete; conversion 50% complete . . . . . . . . . . . . . 4,000
Total units . . . . . . . . . . . . . . . . . . . . . . . . . . . . . . . . . . . . 34,000
Cost Reconciliation
Cost to be accounted for: Work in process, May 1 . . . . . . . . . . . . . . . . . . . . . . . . . £ 13,400 Cost added in the department . . . . . . . . . . . . . . . . . . . 87,800
Total cost to be accounted for . . . . . . . . . . . . . . . . . . . . £101,200
Cost accounted for as follows: Work in process, May 31 . . . . . . . . . . . . . . . . . . . . . . . . £ 8,200 Transferred to next department . . . . . . . . . . . . . . . . . . . 93,000
Total cost accounted for . . . . . . . . . . . . . . . . . . . . . . . . £101,200
gar11005_ch04_141-182.indd 165gar11005_ch04_141-182.indd 165 02/11/10 3:02 PM02/11/10 3:02 PM
Confi rming Pages
166 Chapter 4
The company’s management would like some additional information about May’s operation in the
CPU Assembly Department. (The currency in England is the pound, which is denoted by the symbol £.)
Required: 1. How many units were started and completed during May?
2. What were the equivalent units for May for materials and conversion costs?
3. What were the costs per equivalent unit for May? The following additional data are available
concerning the department’s costs:
Materials Conversion Total
Work in process, May 1 . . . . . . . . . £9,000 £4,400 £13,400Costs added during May . . . . . . . . £57,000 £30,800 £87,800
4. Verify the accountant’s ending work in process inventory figure (£8,200) given in the report.
5. The new manager of the CPU Assembly Department was asked to estimate the incremental
cost of processing an additional 1,000 units through the department. He took the unit cost for
an equivalent whole unit you computed in (3) above and multiplied this figure by 1,000. Will
this method yield a valid estimate of incremental cost? Explain.
Cases
All applicable cases are available with McGraw-Hill’s Connect™ Accounting .
CASE 4–19 Ethics and the Manager; Understanding the Impact of Percentage Completion on Profit [LO2, LO3, LO4] Thad Kostowski and Carol Lee are production managers in the Appliances Division of Mesger
Corporation, which has several dozen plants scattered in locations throughout the world. Carol
manages the plant located in Kansas City, Missouri, while Thad manages the plant in Roseville,
Oregon. Production managers are paid a salary and get an additional bonus equal to 10% of their
base salary if the entire division meets or exceeds its target profits for the year. The bonus is deter-
mined in March after the company’s annual report has been prepared and issued to stockholders.
Late in February, Carol received a phone call from Thad that went like this:
Thad: How’s it going, Carol?
Carol: Fine, Thad. How’s it going with you?
Thad: Great! I just got the preliminary profit figures for the division for last year and we are within
$62,500 of making the year’s target profits. All we have to do is to pull a few strings, and we’ll be
over the top!
Carol: What do you mean?
Thad: Well, one thing that would be easy to change is your estimate of the percentage completion of
your ending work in process inventories.
Carol: I don’t know if I should do that, Thad. Those percentage completion numbers are supplied by
Jean Jackson, my lead supervisor. I have always trusted her to provide us with good estimates.
Besides, I have already sent the percentage completion figures to the corporate headquarters.
Thad: You can always tell them there was a mistake. Think about it, Carol. All of us managers are
doing as much as we can to pull this bonus out of the hat. You may not want the bonus check, but
the rest of us sure could use it.
The final processing department in Carol’s production facility began the year with no work in
process inventories. During the year, 270,000 units were transferred in from the prior processing
department and 250,000 units were completed and sold. Costs transferred in from the prior depart-
ment totaled $49,221,000. No materials are added in the final processing department. A total of
$16,320,000 of conversion cost was incurred in the final processing department during the year.
Required: 1. Jean Jackson estimated that the units in ending inventory in the final processing department were
25% complete with respect to the conversion costs of the final processing department. If this
estimate of the percentage completion is used, what would be the cost of goods sold for the year?
2. Does Thad Kostowski want the estimated percentage completion to be increased or decreased?
Explain why.
gar11005_ch04_141-182.indd 166gar11005_ch04_141-182.indd 166 02/11/10 3:03 PM02/11/10 3:03 PM