the impact of hunger on risk preference
TRANSCRIPT
FUNDAÇÃO GETULIO VARGAS
ESCOLA BRASILEIRA DE ADMINISTRAÇÃO PÚBLICA E DE EMPRESAS
MESTRADO EM ADMINISTRAÇÃO
The Hunger Games: The impact of hunger on risk preference
Bernardo Barbosa Machado da Silva
Dissertação submetida à Escola Brasileira de Administração Pública e de Empresas como requisite parcial para a obtenção do grau de Mestre em Administração
Orientador: Eduardo Bittencourt Andrade
Rio de Janeiro, 2014
Ficha catalográfica elaborada pela Biblioteca Mario Henrique Simonsen/FGV
Silva, Bernardo Barbosa Machado da The hunger games : the impact of hunger on risk preference / Bernardo Barbosa Machado da Silva. - 2014. 39 f.
Dissertação (mestrado) - Escola Brasileira de Administração Pública e de Empresas, Centro de Formação Acadêmica e Pesquisa.
Orientador: Eduardo Bittencourt Andrade. Inclui bibliografia. 1. Processo decisório. 2. Avaliação de riscos. 3. Fome. I. Andrade, Eduardo
Bittencourt. II. Escola Brasileira de Administração Pública e de Empresas. Centro de Formação Acadêmica e Pesquisa. III. Título.
CDD – 658.403
Table of Contents
1. Introduction ............................................................................................................... 4
2. Theoretical Background .............................................................................................. 5 Hunger and Food-‐Related Stimuli ............................................................................................... 6 Hunger and Attention to Food-‐Related Stimuli ........................................................................... 6 Hunger and Food-‐Related Choices .............................................................................................. 7 Can Hunger Impact Food-‐Unrelated Choices? ............................................................................. 7 Hunger’s Impact on Risk-‐Taking .................................................................................................. 8
3. Methods ................................................................................................................... 10 Pre-‐test, Experiment 1A, and Experiment 1B ............................................................................. 11 Pre-‐test ..................................................................................................................................... 11 Stimuli ...................................................................................................................................... 11 Procedure ................................................................................................................................. 12 Results ...................................................................................................................................... 12 Experiment 1A .......................................................................................................................... 14 Stimuli ...................................................................................................................................... 14 Procedure ................................................................................................................................. 14 Results ...................................................................................................................................... 16 Discussion ................................................................................................................................. 19 Experiment 1B ........................................................................................................................... 19 Procedure ................................................................................................................................. 20 Results ...................................................................................................................................... 20 Experiment 1A+B ...................................................................................................................... 22
4. General Discussion ................................................................................................... 24 Managerial Implications ............................................................................................................ 26 Limitations ................................................................................................................................ 26 Future Research ........................................................................................................................ 27
5. References ................................................................................................................ 28
6. Appendix 1 ............................................................................................................... 31
7. Appendix 2 ............................................................................................................... 36
8. Appendix 3 ............................................................................................................... 39
Abstract
We often feel hungry and we also often make decisions that involve risk and uncertainty.
However, little is known about the influence of the feeling of hunger on risk preference.
Previous studies have suggested that hunger is capable of altering people’s attention and
perception, but could it also be capable of altering risk preferences? In two experiments,
this current study explores the relationship between hunger and risk preference. Visual
food-related stimuli are used to manipulate hunger followed by a real gambling task, which
assesses risk propensity. The results suggest that hunger may reduce risk-taking in
gambling-like situations. Interestingly, the phenomenon seems particularly true among
those who are in general more prone to take risks (i.e., male participants).
1. Introduction
In 2010’s Super Bowl, Mars Inc., the company that owns the Snickers candy bar
brand, launched an advertisement campaign touting the idea that “you’re not yourself when
you are hungry”. The promotion used comic videos of ill-tempered characters in troublesome
situations and illustrated that after eating the candy bar, they transformed into a better version
of themselves; at this point the actual actor playing the role changed. This humorous
advertisement was centered on the popular idea that hunger influences our mood and
behavior. This idea has implications for different aspects of our lives, like shopping for
groceries on an empty stomach. While hungry, we usually buy greater quantities.
Experiencing hunger impairs our judgment as a buyer, hindering our ability to correctly
follow a budget and/or plan future meals.
Scientific evidence has backed up this anecdotal knowledge (Nisbett and Kanouse,
1969; Mela, Aaron, and Gatenby, 1997). Previous studies have successfully found evidence
that hunger alters behavior regarding future choices of food (Read and Van Leeuwen, 1998)
and attention to food-related stimuli (Mogg et al., 1998; Piech, Pastorino, and Zald, 2010;
Channon and Hayward, 1990; Neimeijer, de Jong, and Roefs, 2013).
As hunger levels fluctuate during the day, people are often exposed to hunger’s
decision-altering properties. A few researchers have explored its cross-domain effects; that is,
the impact of hunger on decisions and cognitive processes unrelated to food stimuli (Piech et
al., 2009). For example, judges in a prisoner’s parole jury were found to be much more likely
to concede to a prisoner’s request just after starting working or right after the lunch break
than right before the lunch break. Precisely, each sequential decision session sees a decreased
chance of favorable ruling, starting at ~65% to nearly 0% right before the break. As soon as
the judge returns from lunch break, the favorable ruling rates restart at the 65% mark again
(Danziger, Levav, and Avnaim-Pesso, 2011).
Symmonds et al (2010) explored these questions with an experiment where
participants where restrained from eating for almos 12 hours and had their risk preference
tested, then fed and tested again. The results suggested a correlation between hunger and risk-
seeking behaviors, inversely right after the fed, subjects had a drastic change in behavior,
becoming more risk averse.
In short, there is strong evidence showing that hunger impacts food-related decisions
and some initial, but mostly indirect, evidence that it may also impact food-unrelated
decisions. In this dissertation, we deal with the following research questions: Can hunger
impact risk-taking? If so, in which direction: does it increase or decrease risk-taking?
To address these questions, the following section explores the main concepts of
interest (hunger and risk-taking), how they may relate to each other, and what can be
hypothesized. We then describe the method used in the pre-test and in experiments 1A and
1B and discuss the results and possible explanations. Concluding, we describe potential
implications, limitations, and future research.
2. Theoretical Background
When discussing hunger, two possible interpretations may come to mind: one is that of a
sustained period without eating and the other is the sensation of desiring food. While the first
is correlated with starvation and undernourishment, a very serious issue that affected
approximately 12% of the world’s population in 2010-2012 (FAO, IFAD, and WFP, 2013),
the latter may apply to the sensation of hunger that is present in everyone’s lives as soon as
food-related cues appear in the environment (imagery, scents, and so on). For the sake of
simplicity, the term ‘hunger’ will hereafter be used to refer to the consciously felt desire for
food intake.
Hunger and Food-Related Stimuli
Hunger has an obvious relationship with eating stimuli and behaviors. The sensation
of hunger is the indication of a homeostatic necessity that needs to be attended, motivating
the organism toward feeding. Thus, the majority of work published about hunger has been
related to food-related stimuli, food choices (quantity and type), and pleasure.
Hunger and Attention to Food-Related Stimuli
Attention and hunger have proved to be a very productive field of research. Studies
have indicated that individuals experiencing hunger are more sensitive to food-related visual
stimuli (Mogg et al., 1998; Piech, Pastorino, and Zald, 2010; Channon and Hayward, 1990;
Neimeijer, de Jong, and Roefs, 2013). This may reveal the nature of hunger and of all other
homeostatic imbalances, which motivate the subject to perform actions that will reduce the
imbalance, providing an adaptive sensorial mechanism with evolutionary benefits.
Piech, Pastorino, and Zald (2010) conducted an experiment manipulating hunger and
its effect on attention with an emotional blink of attention test. This test requires participants
to detect specific images within a rapid visual stream of different types of irrelevant
distractors. When exposed to images of food prior to the target, hungrier subjects had a
higher chance of being distracted, missing their target image. The researchers demonstrated
that food cues become more distractive for hungry subjects than for sated subjects, indicating
that hunger may be an involuntary bias of perception even to motivated individuals.
Hunger and Food-Related Choices
Hunger has been shown to influence food purchases (Gilbert, Gill, and Wilson, 2002;
Nisbett and Kanouse, 1969; Read and Van Leeuwen, 1998). We suffer from a difficulty in
separating the current state of hunger from future states; in other words, what we are feeling
right now is predicted as what we will feel in the future. This phenomenon has been labeled
as the hot/cold interpersonal empathy gap (Loewenstein, Prelec, and Shatto, 1998). When
someone experiencing hunger goes to the supermarket, he or she will systematically
overestimate the amount of food needed. Taking into account the current hunger, the
reference point will be skewed toward a higher quantity, altering the normal behavior. This
phenomenon is especially powerful when the individual is under high cognitive load, that is,
when self-control is undermined (Gilbert, Gill, and Wilson, 2002).
There has been a debate on whether hungry people simply buy more food in general
(Nisbett and Kanouse, 1969) or whether they lean toward certain types of food. According to
the latter view, hungry individuals are not necessarily more likely to buy more food.
However, they are more likely to buy more-caloric food. For instance, Wansink, Tal, and
Shimizu (2012) compared the eating behavior of subjects at a buffet. Subjects who had fasted
for 18 hours were more likely to start their meal with calorie-rich starchy food, rather than
nutrient-dense vegetables. Additional analysis of choice and quantity indicated that subjects
who had fasted consumed more calories and were less likely to consume vegetables (see also
Tal and Wansink, 2013). Whether in terms of individuals deciding to buy more or to buy
differently, the literature agrees that hunger has a strong impact on food-related choices.
Can Hunger Impact Food-Unrelated Choices?
Much like thirst, body temperature, sexual arousal, and pain, hunger is considered a
drive state, also called a visceral state or a biological feeling (Andrade, 2015; Bhatia and
Lowenstein, 2013; Loewenstein, 1996). These visceral felt states have been shown to impact
behavior in systematic manners. For instance, when visceral states are high, people tend to be
more present-focused and more self-centered. In other words, they care less about the future
and about others (Loewenstein, 1996).
If this is a general pattern, it suggests that hunger can impact preferences for issues
that are completely unrelated to food. This argument is in line with the finding that food
deprivation has been demonstrated to not only enhance the value of food-related items to
consumers but also decrease the value of food-unrelated items (Brendl, Markman, and
Messner, 2003).
Hunger’s Impact on Risk-Taking
Hunger is a felt state and as such shares many characteristics with emotions, to the
point that there are few properties that actually distinguish them (Andrade, 2015). Given that
much has been published on the effect of emotions on estimations and risk preferences
(Lerner and Keltner, 2001; Loewenstein and Lerner, 2003; Loewenstein et al., 2001; Lopes,
1987; Mellers et al., 1997), this literature could help us set predictions about the relationship
between hunger and risk-taking.
For instance, a common finding in this literature refers to the mood-congruency bias.
Positive (negative) moods are likely to increase the subjective estimate of future positive
(negative) events (Johnson and Tversky, 1983; Mayer et al., 1992). Put simply, happy (sad)
individuals are more optimistic (pessimistic) about future events. Other researchers have
explored dimensions other than valence (DeSteno et al., 2000; Lerner and Keltner, 2001).
Emotions of same valence but that feel more or less certain also impact risk-taking decisions
differently. For example, anger (high certainty) increases risk-taking, whereas fear (low
certainty) decreases risk-taking. DeSteno et al. (2000) explored the hypothesis that estimates
of event likelihood are subject to emotion-specific-congruency bias. They successfully
demonstrated that the influence of emotions of the same valence can differently bias
likelihood judgments, making the case for specific emotional bias.
Concerning the influence of hunger on the perception of estimates and eventually risk-
taking, one might argue that the negative valence as well as the somewhat high feeling of
uncertainty associated with hunger should prone the individual to overestimate negative
events and underestimate positive ones, which would in turn make people less risk-taking.
The contributions from Danziger, Levav, and Avnaim-Pesso (2011) about Judicial
Rulings opens the possibility that that hunger might be responsible for the change of behavior
and have impact on risk-avoidance and pessimistic effect in terms of forecasting future
events. If we interpret the judges’ decision as a risk assessment (“Will this prisoner pose a
risk to society once released? What are his/her chances of committing a crime again?”) in
order to avoid being partially responsible for a future crime, hunger might have made them
more prone to overestimating negative events in the future. Thus, we can hypothesize the
following:
Hypothesis 1A: The feeling of hunger reduces risk-taking.
Along with valence, arousal (i.e. intensity) represents a dominant dimension of any
given felt experience (Andrade, 2015). Arousal stressors have been shown to negatively
impact cognitive capacity and narrow the attention to salient or goal-relevant cues
(Easterbrook, 1959; Wells and Matthews, 1994). In risk-taking scenarios, the ‘prize’ is often
more tangible than the probabilities of acquiring it. For example, the tiny likelihood of
winning a lottery is much less salient than the million-dollar jackpot. Given that hunger
triggers arousal and narrows the focus of attention to the salient cues, it is possible that in a
risk-taking scenario (e.g., a gambling task), arousal will make people pay more attention to
the prize than to the probability of winning, potentially making them more likely to take
risks.
Another classic dimension of any emotional state is action readiness (Frijda, 1987).
Feeling states prepare the body to act and to change the status quo. Hunger, as a felt state,
thus prepares the body to search for food, but it also motivates the individual to change the
status quo in general. Assuming, reasonably, that to take a risk represents a bigger change to
the status quo than to not take a risk, the action readiness dimension of feeling states can
predict that hunger will make people more likely to take risks. Thus, we can also predict:
Hypothesis 1B: The feeling of hunger increases risk-taking.
Indeed, recent evidence seems to support this hypothesis (Symmonds et al., 2010).
However, the authors manipulated hunger through fasting, whereas we focus on feelings of
hunger triggered by external stimuli (food-related pictures). Further, their risk measurement
task differed from that used in this study. Symmonds et al. (2010) opted for a selection of
combination of lottery tickets with varied wages, which the participants had to choose; the
higher combined value of the tickets was seen as a riskier option. Their proposed model also
focused on before and after feeding differences (within subjects), whereas this current study
is solely focused on hunger and sated conditions (between subjects).
In short, two plausible and contrasting hypotheses arise from the literature. In the
following experiments, we systematically test them.
3. Methods
Pre-test, Experiment 1A, and Experiment 1B
In order to test the hypotheses through experiments, it was necessary to a) build an
effective set of food pictures capable of inducing hunger and b) assemble a risk-taking
scenario to measure the impact of hunger. The pre-test was dedicated to choosing an
appropriate set of pictures with higher chances of inducing hunger among participants and
neutral pictures that were comparable. Experiment 1A was the first attempt to test this, and
experiment 1B was a variation of the first experiment. All three stages had approximately the
same duration, 8 minutes.
Pre-test
One hundred and forty-seven participants (54.4% Male, Mage=33.25), recruited
through Amazon’s Mechanical Turk, were randomly assigned to one of the two conditions
(Food-related images x Neutral images) in a between-subjects design, using a Qualtrics
survey. To avoid potential cross-cultural effects, survey was only available to American
residents. The experiment took approximately 8 minutes and each respondent received
US$0.75 for their participation.
Stimuli
Following the framework proposed by Piech et al. (2009) to manipulate hunger, two
sets of pictures, food related and neutral, were developed for the experimental and control
groups, respectively. Our goal was to obtain 28 images with a high chance of evoking hunger,
for the experimental condition, and another 28 images with a very low chance for the control
condition. To minimize confounds, these two sets also needed to be as similar as possible--
that is, both being consumer products of comparable prices.
Considering a safety margin, we opted to double the quantity of images needed from
two sets of 28 pictures to two sets of 56 pictures. The 28 highest hunger-eliciting food-related
images, and the 28 lowest ones, would then be selected to be used in the main experiments.
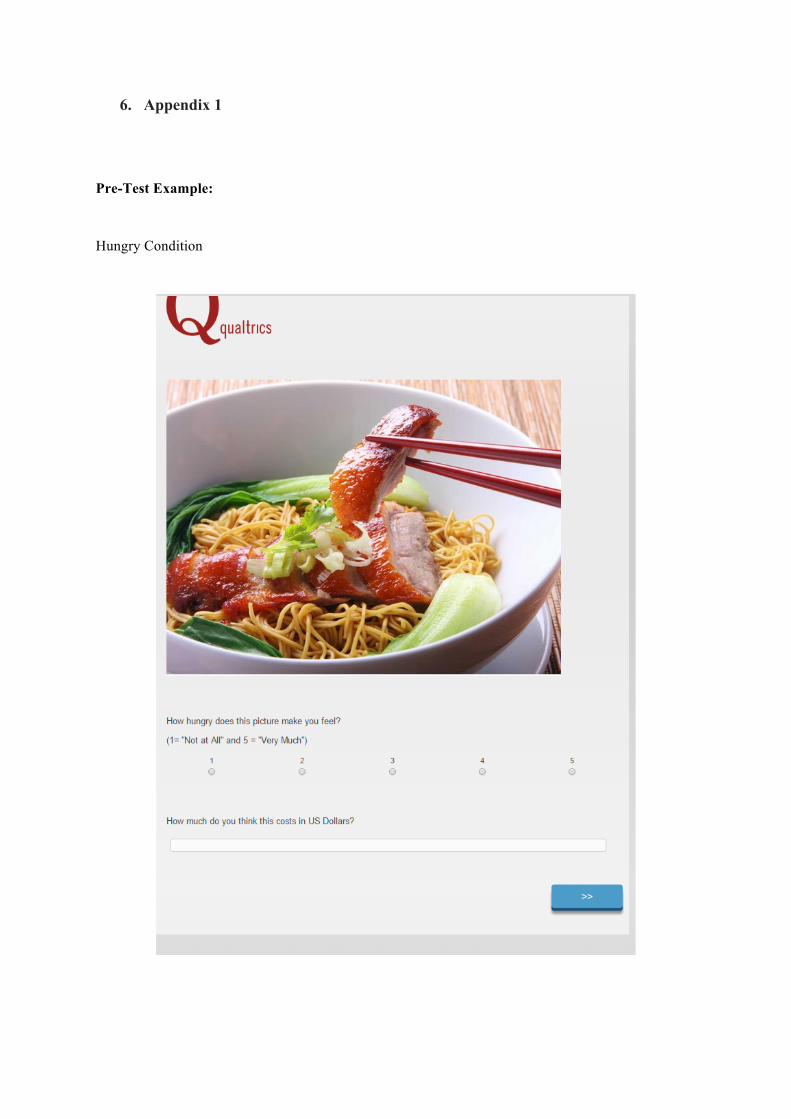
Procedure
The subjects were instructed to answer two questions after seeing each presented
image: “How much do you think this product costs in US dollars?” (open ended) and “How
hungry does this picture make you feel?” (1=Not at all and 5=Very much).
Each subject only saw one of the conditions, food-related or neutral images, and only
rated 20 images, in order to prevent fatigue. The order of the questions and images was
randomized across subjects. Each image was evaluated at least 24 times.
After the task, the participants provided socio-demographic information (gender, age,
country of residence, highest academic qualification, native language, and salary), mood-
related information (“How are you feeling right now?”; 1=Very bad to 5=Very good), and
food-related information (number of hours since last meal, quantity of food ingested in the
last meal, what the last meal was, and any food restrictions). They also indicated if they had
experienced any problems with the survey.
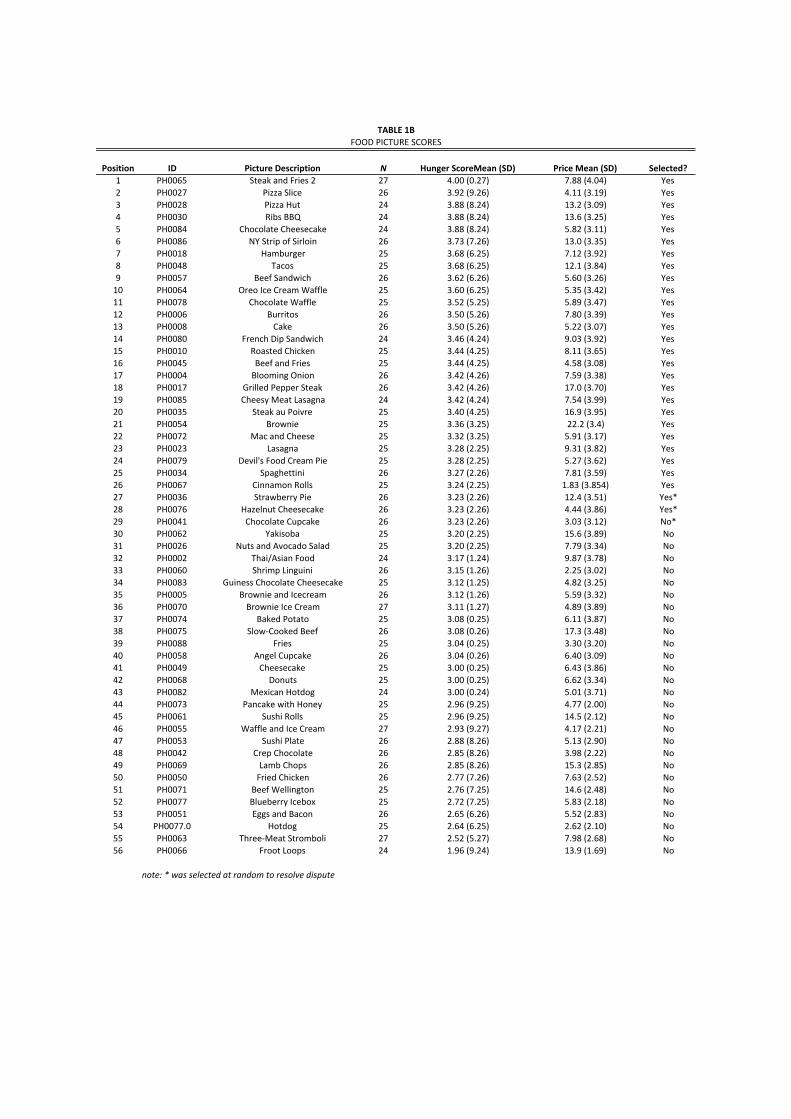
Results
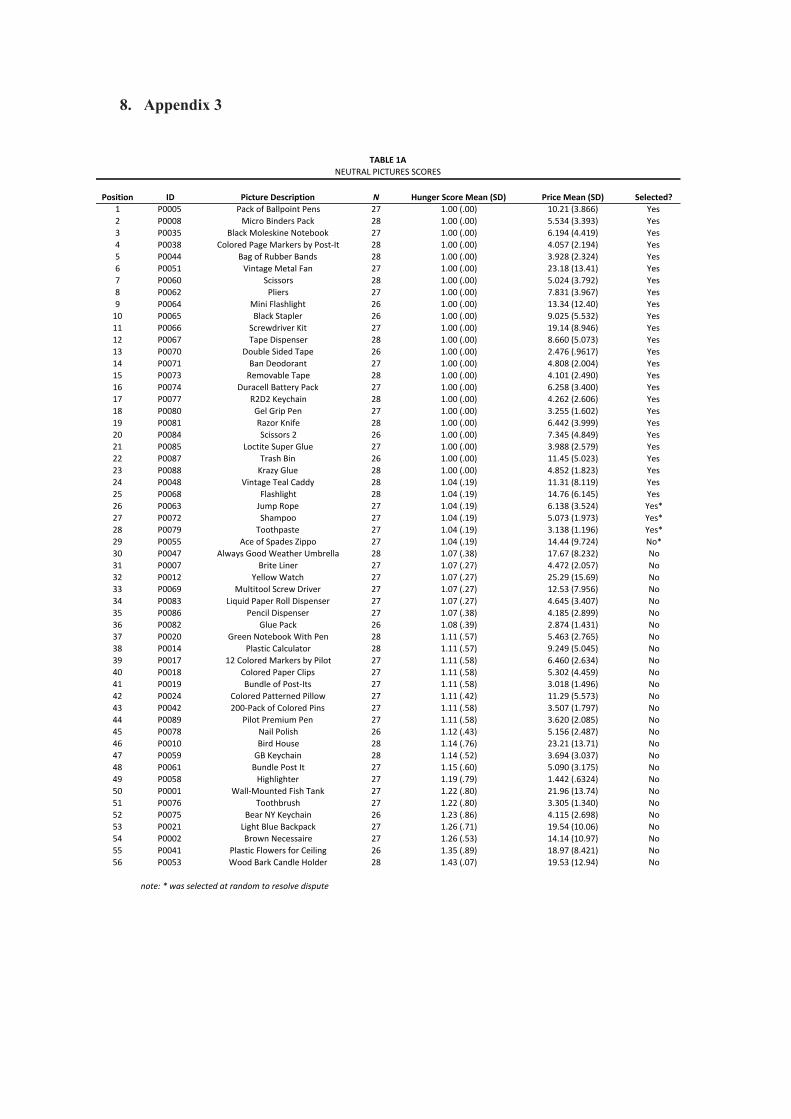
Tables 1A and 1B (Appendix 3) report the means and standard deviations of hunger
and perceived price. We then selected the 28 food-related images with the highest hunger
scores and the 28 neutral images with the lowest hunger scores. There was a tie among four
images for the last two positions of the neutral picture set; positions 24 and 25 only looked to
be tied as well because the difference was masked by the use of two decimal places. There
were also three images tied for the last two positions for the food set. To resolve the disputes,
the tied images were selected at random.
We then proceeded to compare both groups. The experimental condition had an
average hunger score of 3.52 (SD=.23), while the control condition scored an average of 1.00
(SD=.01). An ANOVA was conducted and the results indicate that there was, as expected, a
significant difference between the two groups (3.52 vs. 1.00; F(1, 54) = 3323.39, p <.001).
The average prices for the experimental and control conditions were respectively
8.75(SD=3.77) and 7.70(SD=4.97). Again, an ANOVA was used to compare the means, and
as expected, there was no significant differences across conditions (F(1, 54) = .782, p >.10).
Also, a Levene’s test also showed that the two conditions also shared similar variances
(p<.010).
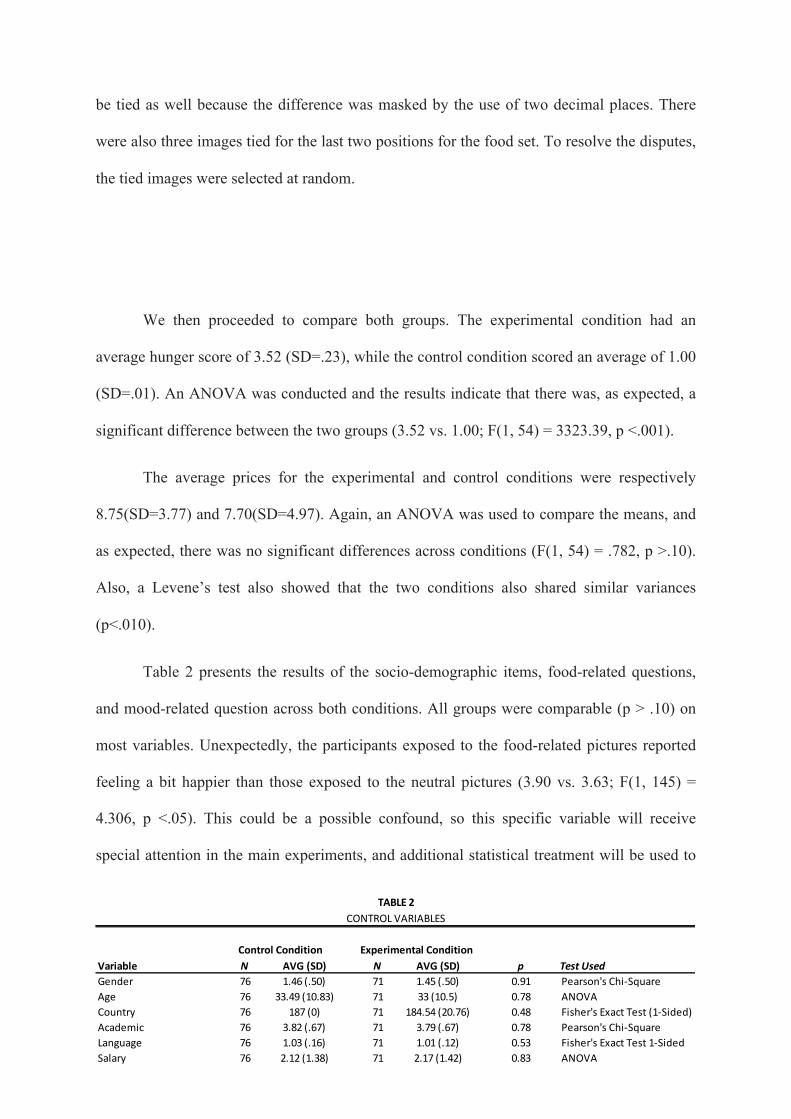
Table 2 presents the results of the socio-demographic items, food-related questions,
and mood-related question across both conditions. All groups were comparable (p > .10) on
most variables. Unexpectedly, the participants exposed to the food-related pictures reported
feeling a bit happier than those exposed to the neutral pictures (3.90 vs. 3.63; F(1, 145) =
4.306, p <.05). This could be a possible confound, so this specific variable will receive
special attention in the main experiments, and additional statistical treatment will be used to
Variable N AVG (SD) N AVG (SD) p Test UsedGender 76 1.46 (.50) 71 1.45 (.50) 0.91 Pearson's Chi-‐SquareAge 76 33.49 (10.83) 71 33 (10.5) 0.78 ANOVACountry 76 187 (0) 71 184.54 (20.76) 0.48 Fisher's Exact Test (1-‐Sided)Academic 76 3.82 (.67) 71 3.79 (.67) 0.78 Pearson's Chi-‐SquareLanguage 76 1.03 (.16) 71 1.01 (.12) 0.53 Fisher's Exact Test 1-‐SidedSalary 76 2.12 (1.38) 71 2.17 (1.42) 0.83 ANOVAFeeling Right Now 76 3.63 (.89) 71 3.90 (.66) 0.04 ANOVAHours Since Last Meal 76 3.15 (2.65) 71 3.49 (3.43) 0.50 ANOVAQuantity Eaten Last Meal 76 1.89 (.50) 71 1.92 (.53) 0.81 ANOVA
Control Condition Experimental Condition
TABLE 2CONTROL VARIABLES
control for it.
Experiment 1A
Two hundred and two participants (62.87% Male, Mage=31.26) recruited via
Amazon’s Mechanical Turk received US$1 for participation in a 8-minute online experiment.
Participants were informed that they had the option to gamble $.50 of their participation fee
on on a roulette-like gambling task.
Stimuli
Making use of the visual stimuli developed in the pre-test, we proceeded to conduct a
two-level, single-factor, between-subjects experiment, where one group was exposed to food-
related pictures and the control group was exposed to neutral products prior to a gambling
task. The images were presented randomly. Each picture was displayed for 3 seconds,
accounting for 84 seconds in total. The objective was to manipulate the subject’s hunger to
then gauge hunger’s influence in a decision-making task presented as an actual gambling
decision.
Procedure
To minimize hypothesis guessing, a cover story was employed. We informed the
subjects that they would be participating in two different studies: one related to advertisement
images and another on gambling behavior. The experiment started with a consent form,
followed by basic demographic questions (gender, age, education, country of residence,
native language, annual income, hours since last meal, and quantity of food eaten last meal).
Upon answering the demographic questions, the subjects were randomly assigned to
either the food-related images (a steak, a cake, a slice of pizza, etc.) or the neutral images (a
stapler, a fan, some pens, etc.). A manipulation check and an attention check then followed.
With respect to the attention check, the participants were asked to indicate the number of
pictures they had seen (7, 28, or 56; the correct answer was 28 for both groups) and what
picture out of three options was not displayed to them (they were provided with two pictures
that were actually displayed to everybody and one that was not (a human face)).
As for the main manipulation check, we asked “How hungry are you right now?”
Three control questions were also inserted: “How are you feeling right now?”, “How much
did you enjoy this task?”, and “How difficult was this task?” This concluded the first part of
the survey. See appendix 1 for a sample of the hunger manipulation and subsequent
measurements.
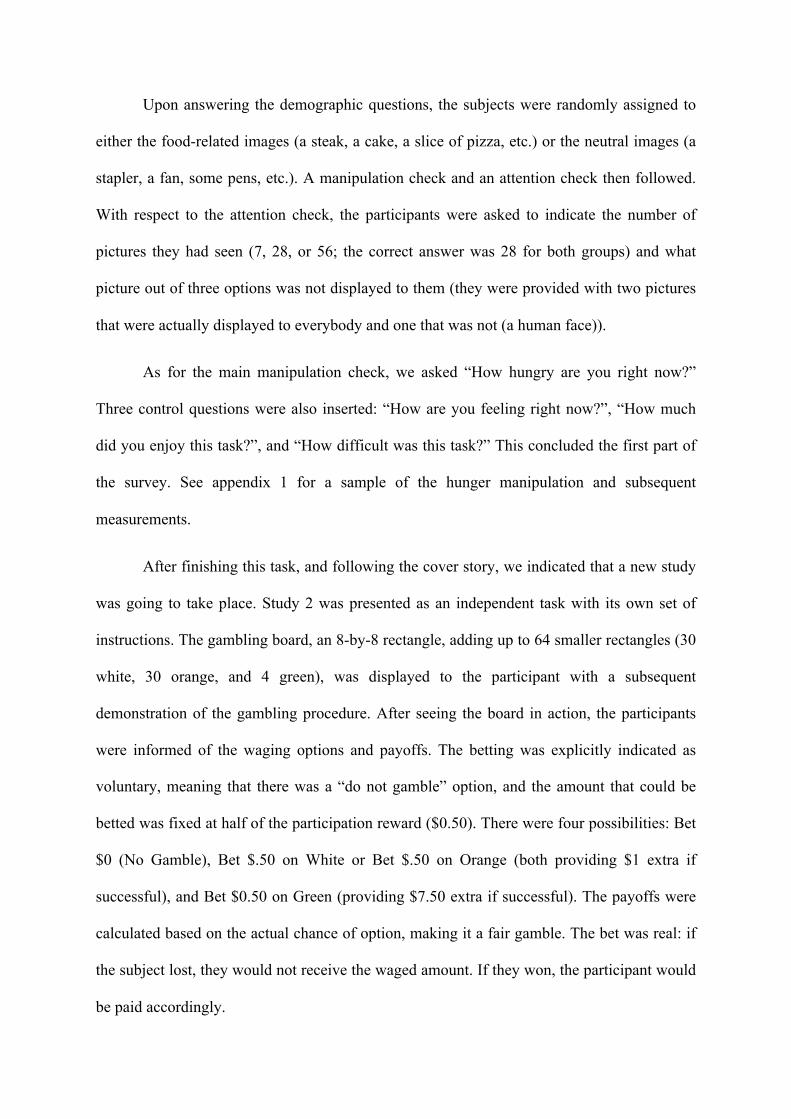
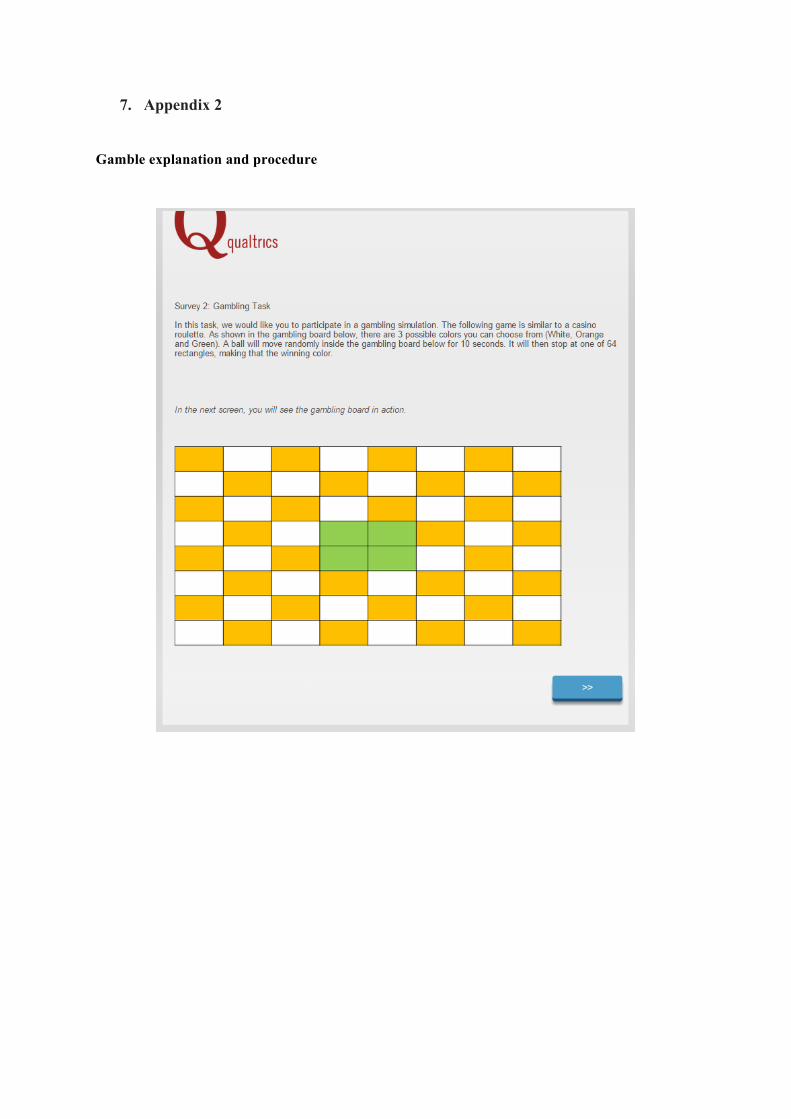
After finishing this task, and following the cover story, we indicated that a new study
was going to take place. Study 2 was presented as an independent task with its own set of
instructions. The gambling board, an 8-by-8 rectangle, adding up to 64 smaller rectangles (30
white, 30 orange, and 4 green), was displayed to the participant with a subsequent
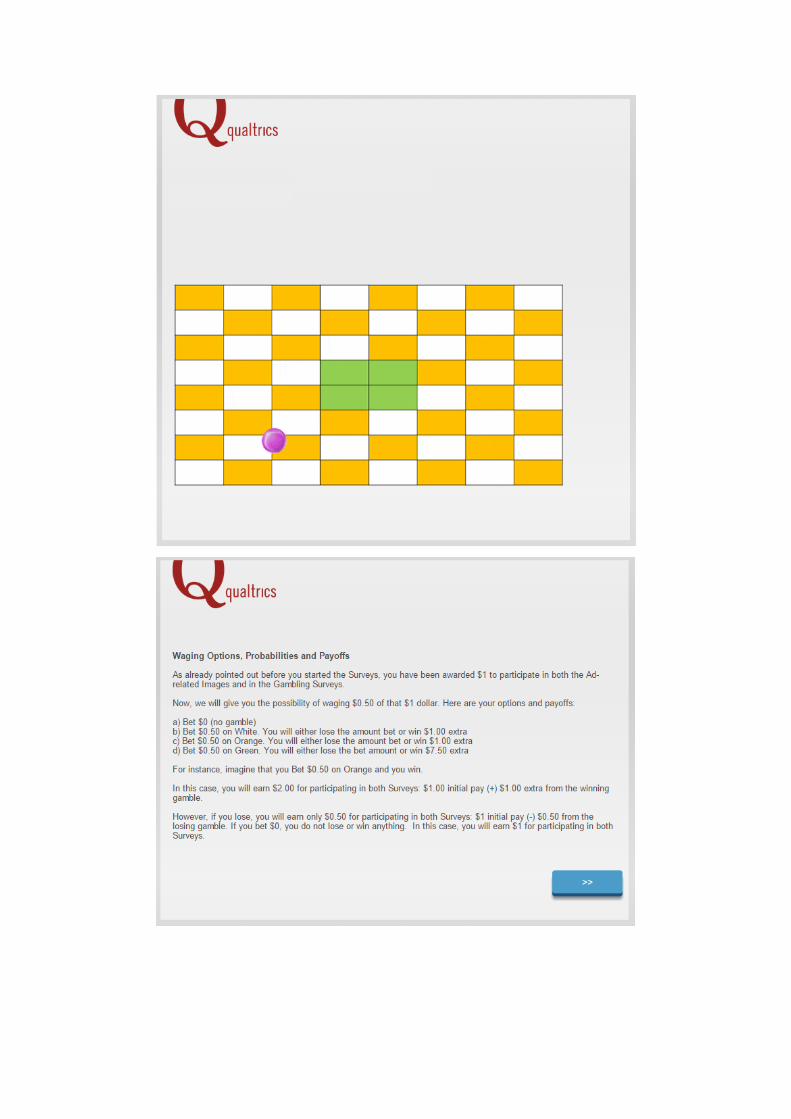
demonstration of the gambling procedure. After seeing the board in action, the participants
were informed of the waging options and payoffs. The betting was explicitly indicated as
voluntary, meaning that there was a “do not gamble” option, and the amount that could be
betted was fixed at half of the participation reward ($0.50). There were four possibilities: Bet
$0 (No Gamble), Bet $.50 on White or Bet $.50 on Orange (both providing $1 extra if
successful), and Bet $0.50 on Green (providing $7.50 extra if successful). The payoffs were
calculated based on the actual chance of option, making it a fair gamble. The bet was real: if
the subject lost, they would not receive the waged amount. If they won, the participant would
be paid accordingly.
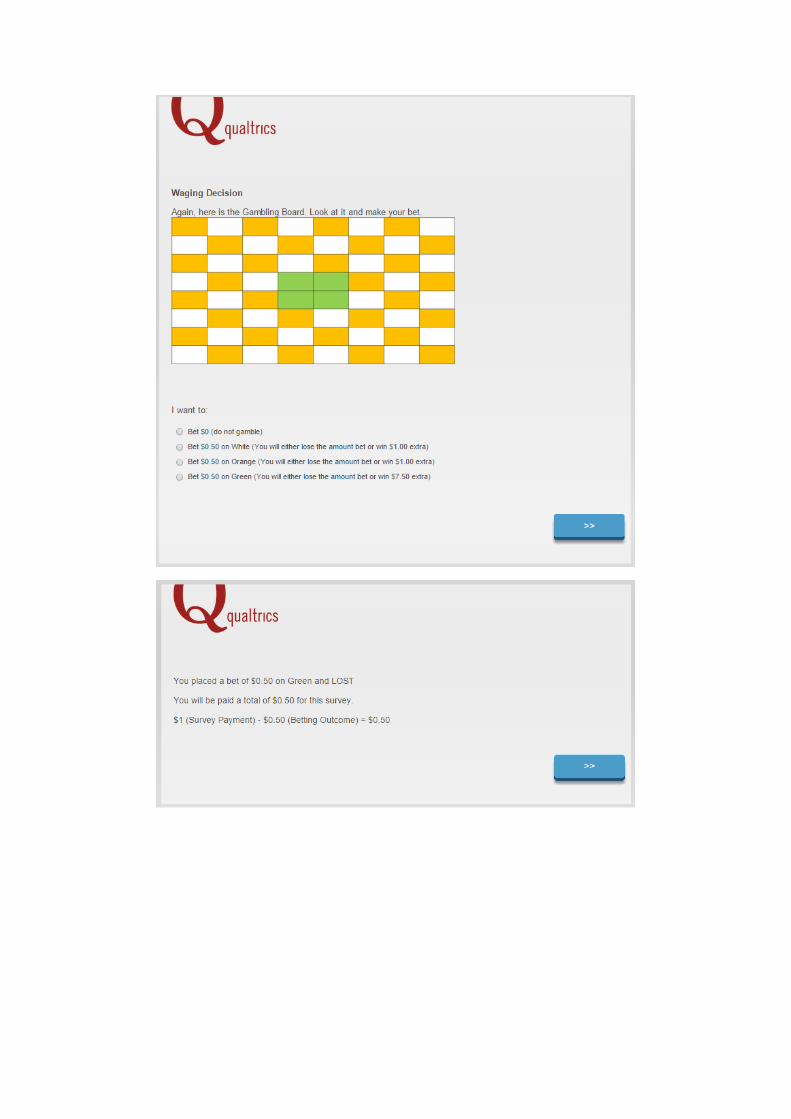
On a subsequent screen, the participants were presented with all the betting options,
their payoffs, and an image of the gambling board. After selecting a bet option, the
participant was presented with a quick video sequence of the board in action: a ball bounced
around the board and stopped at a random rectangle, concluding with the outcome of the bet.
A Win, Loss, or No Bet message informed the participant how much he or she would be paid
(see appendix 2 for a complete description of the gambling task).
The final part of the survey consisted of a “How often do you gamble?” question. To
assess hypothesis guessing, the subjects were then asked to describe briefly the purpose of
each study. Only five participants guessed the actual purpose of the study.
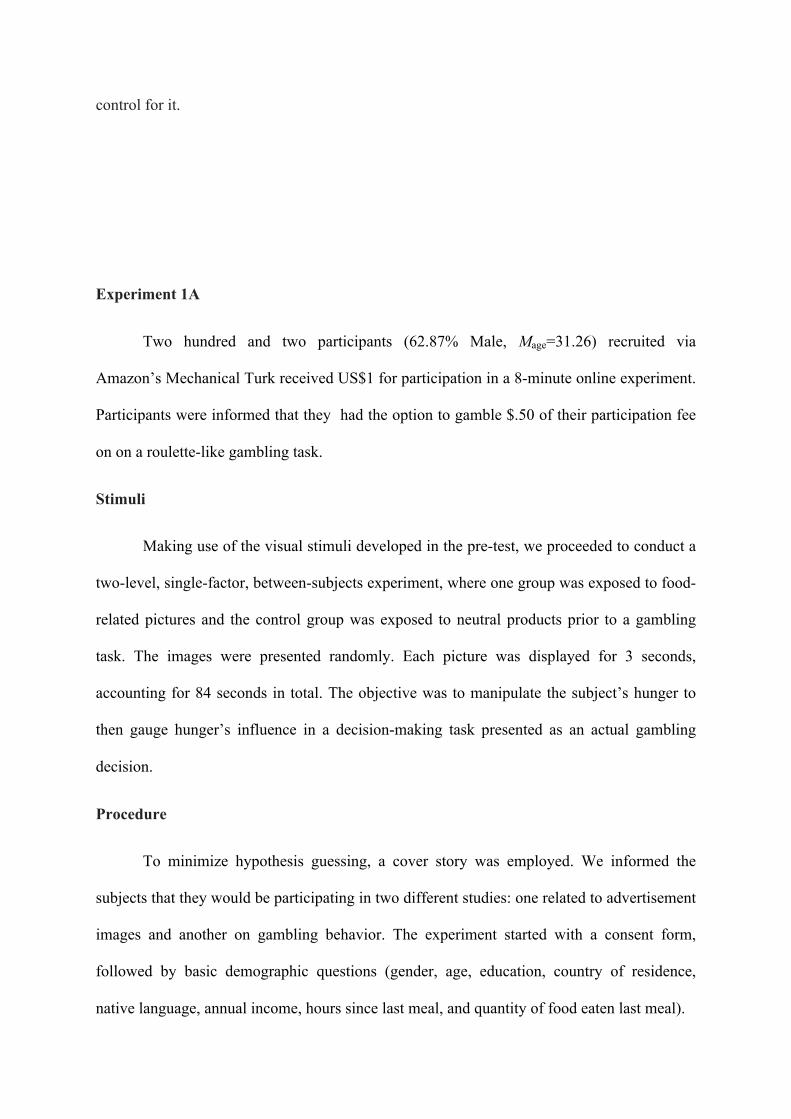
Results
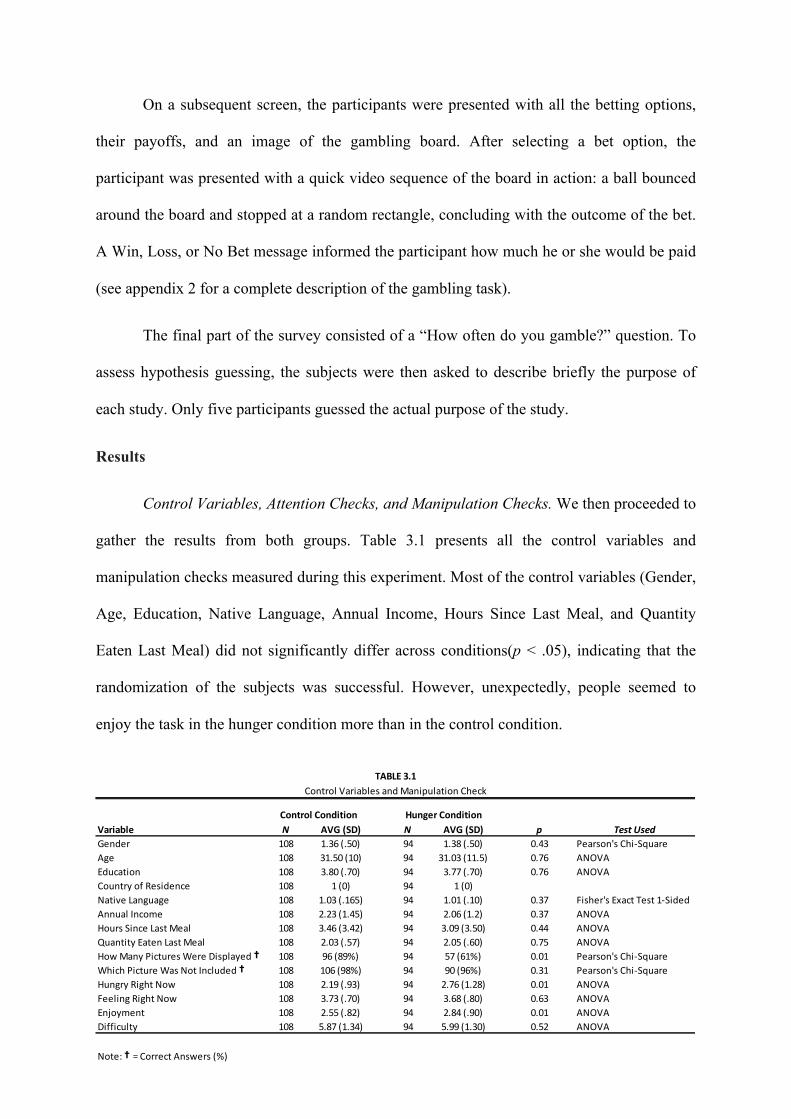
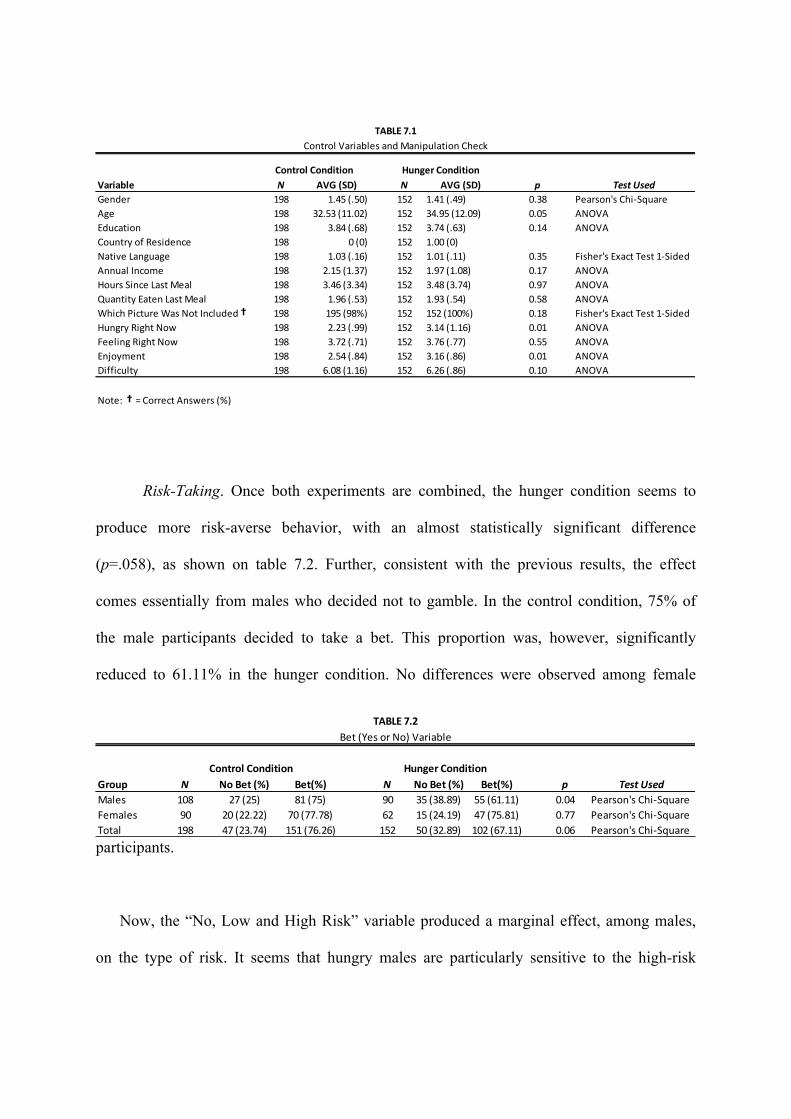
Control Variables, Attention Checks, and Manipulation Checks. We then proceeded to
gather the results from both groups. Table 3.1 presents all the control variables and
manipulation checks measured during this experiment. Most of the control variables (Gender,
Age, Education, Native Language, Annual Income, Hours Since Last Meal, and Quantity
Eaten Last Meal) did not significantly differ across conditions(p < .05), indicating that the
randomization of the subjects was successful. However, unexpectedly, people seemed to
enjoy the task in the hunger condition more than in the control condition.
Variable N AVG (SD) N AVG (SD) p Test UsedGender 108 1.36 (.50) 94 1.38 (.50) 0.43 Pearson's Chi-‐SquareAge 108 31.50 (10) 94 31.03 (11.5) 0.76 ANOVAEducation 108 3.80 (.70) 94 3.77 (.70) 0.76 ANOVACountry of Residence 108 1 (0) 94 1 (0)Native Language 108 1.03 (.165) 94 1.01 (.10) 0.37 Fisher's Exact Test 1-‐SidedAnnual Income 108 2.23 (1.45) 94 2.06 (1.2) 0.37 ANOVAHours Since Last Meal 108 3.46 (3.42) 94 3.09 (3.50) 0.44 ANOVAQuantity Eaten Last Meal 108 2.03 (.57) 94 2.05 (.60) 0.75 ANOVAHow Many Pictures Were Displayed ✝ 108 96 (89%) 94 57 (61%) 0.01 Pearson's Chi-‐SquareWhich Picture Was Not Included ✝ 108 106 (98%) 94 90 (96%) 0.31 Pearson's Chi-‐SquareHungry Right Now 108 2.19 (.93) 94 2.76 (1.28) 0.01 ANOVAFeeling Right Now 108 3.73 (.70) 94 3.68 (.80) 0.63 ANOVAEnjoyment 108 2.55 (.82) 94 2.84 (.90) 0.01 ANOVADifficulty 108 5.87 (1.34) 94 5.99 (1.30) 0.52 ANOVA
Note: ✝ = Correct Answers (%)
TABLE 3.1Control Variables and Manipulation Check
Control Condition Hunger Condition
Unfortunately, 25% of the participants in total provided the wrong answers to the
attention check question (“How many pictures were displayed?”). Also, as table 3.1 points
out, there were significant differences across conditions. The hunger condition reported a
significantly higher percentage of incorrect answers. This effect was probably caused by
technical problems. Some users reported in the open-ended question at the end of the
experiment that some pictures had not loaded. This was particularly true in the experimental
condition, possibly because these images were also larger files (in bytes). This possible
technical issue will be statistically addressed in order not to compromise the experiment.
Despite this, the main manipulation check (i.e., “How hungry are you right now?”)
indicated a significant difference between the two conditions in the expected direction. As
described in the table, participants exposed to the food-related stimuli reported feeling
significantly hungrier than those in the control condition (F(1, 200) = 12.944, p < .01).
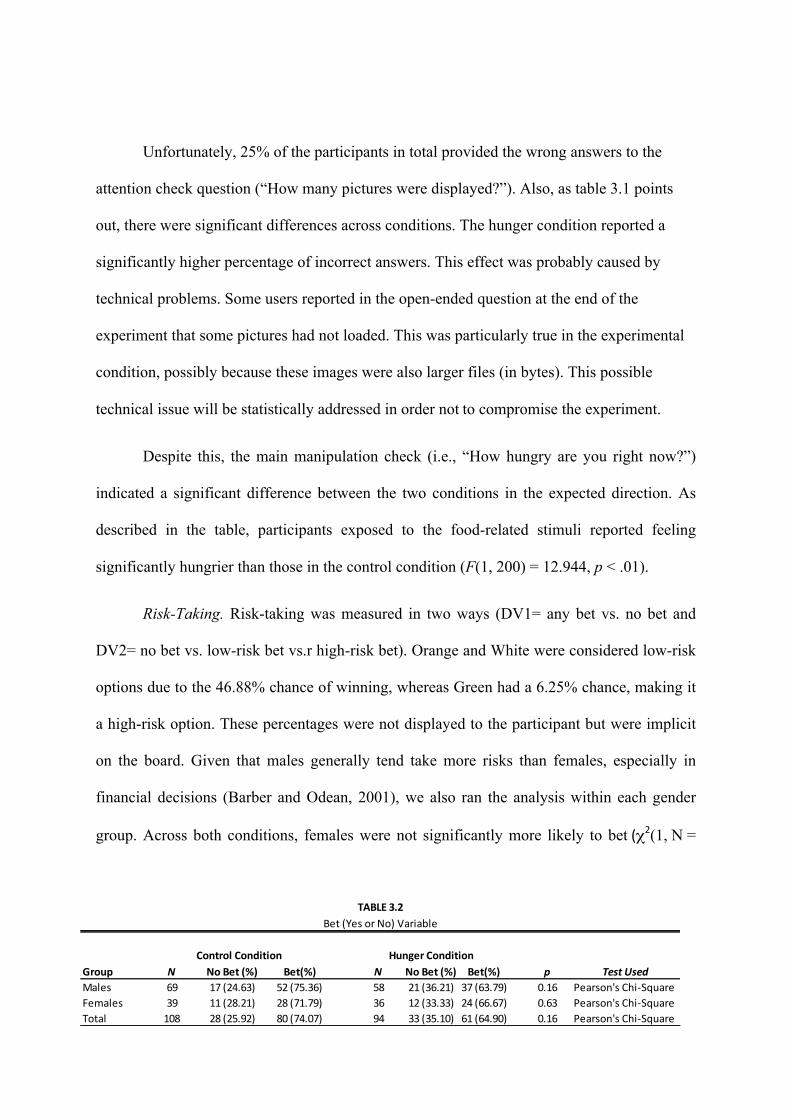
Risk-Taking. Risk-taking was measured in two ways (DV1= any bet vs. no bet and
DV2= no bet vs. low-risk bet vs.r high-risk bet). Orange and White were considered low-risk
options due to the 46.88% chance of winning, whereas Green had a 6.25% chance, making it
a high-risk option. These percentages were not displayed to the participant but were implicit
on the board. Given that males generally tend take more risks than females, especially in
financial decisions (Barber and Odean, 2001), we also ran the analysis within each gender
group. Across both conditions, females were not significantly more likely to bet (χ2(1, N =
Group N No Bet (%) Bet(%) N No Bet (%) Bet(%) p Test UsedMales 69 17 (24.63) 52 (75.36) 58 21 (36.21) 37 (63.79) 0.16 Pearson's Chi-‐SquareFemales 39 11 (28.21) 28 (71.79) 36 12 (33.33) 24 (66.67) 0.63 Pearson's Chi-‐SquareTotal 108 28 (25.92) 80 (74.07) 94 33 (35.10) 61 (64.90) 0.16 Pearson's Chi-‐Square
Control Condition Hunger Condition
TABLE 3.2Bet (Yes or No) Variable
202) = 0.01, p = .91) nor to bet more conservatively than males (χ2(2, N = 202) = 2.96, p =
.23).
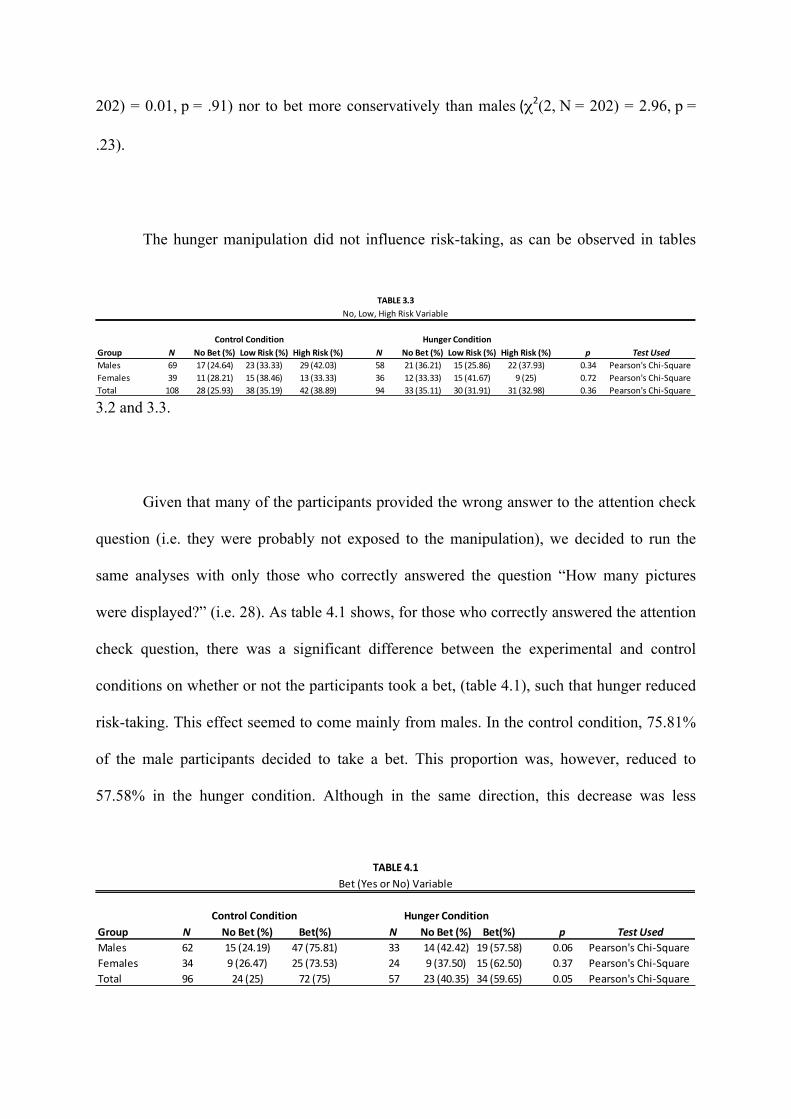
The hunger manipulation did not influence risk-taking, as can be observed in tables
3.2 and 3.3.
Given that many of the participants provided the wrong answer to the attention check
question (i.e. they were probably not exposed to the manipulation), we decided to run the
same analyses with only those who correctly answered the question “How many pictures
were displayed?” (i.e. 28). As table 4.1 shows, for those who correctly answered the attention
check question, there was a significant difference between the experimental and control
conditions on whether or not the participants took a bet, (table 4.1), such that hunger reduced
risk-taking. This effect seemed to come mainly from males. In the control condition, 75.81%
of the male participants decided to take a bet. This proportion was, however, reduced to
57.58% in the hunger condition. Although in the same direction, this decrease was less
Group N No Bet (%) Low Risk (%) High Risk (%) N No Bet (%) Low Risk (%) High Risk (%) p Test UsedMales 69 17 (24.64) 23 (33.33) 29 (42.03) 58 21 (36.21) 15 (25.86) 22 (37.93) 0.34 Pearson's Chi-‐SquareFemales 39 11 (28.21) 15 (38.46) 13 (33.33) 36 12 (33.33) 15 (41.67) 9 (25) 0.72 Pearson's Chi-‐SquareTotal 108 28 (25.93) 38 (35.19) 42 (38.89) 94 33 (35.11) 30 (31.91) 31 (32.98) 0.36 Pearson's Chi-‐Square
Control Condition Hunger Condition
TABLE 3.3No, Low, High Risk Variable
Group N No Bet (%) Bet(%) N No Bet (%) Bet(%) p Test UsedMales 62 15 (24.19) 47 (75.81) 33 14 (42.42) 19 (57.58) 0.06 Pearson's Chi-‐SquareFemales 34 9 (26.47) 25 (73.53) 24 9 (37.50) 15 (62.50) 0.37 Pearson's Chi-‐SquareTotal 96 24 (25) 72 (75) 57 23 (40.35) 34 (59.65) 0.05 Pearson's Chi-‐Square
TABLE 4.1Bet (Yes or No) Variable
Control Condition Hunger Condition
striking among females (from 73.5% to 62.5%).
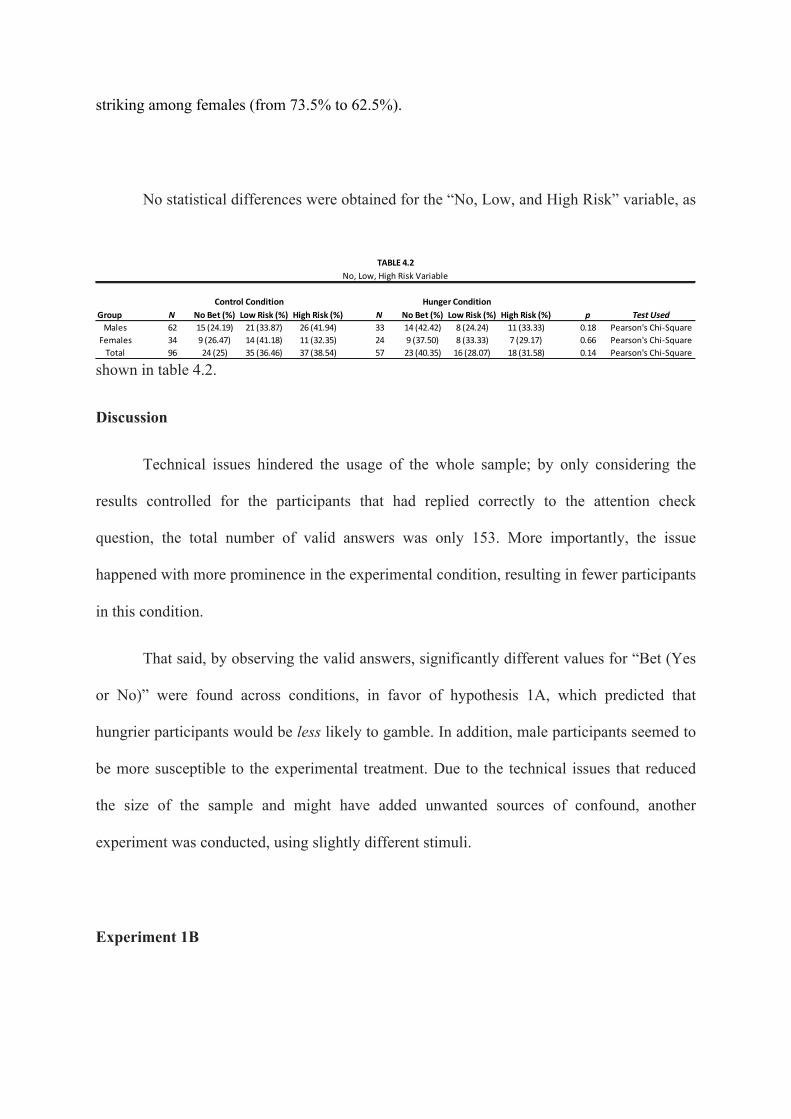
No statistical differences were obtained for the “No, Low, and High Risk” variable, as
shown in table 4.2.
Discussion
Technical issues hindered the usage of the whole sample; by only considering the
results controlled for the participants that had replied correctly to the attention check
question, the total number of valid answers was only 153. More importantly, the issue
happened with more prominence in the experimental condition, resulting in fewer participants
in this condition.
That said, by observing the valid answers, significantly different values for “Bet (Yes
or No)” were found across conditions, in favor of hypothesis 1A, which predicted that
hungrier participants would be less likely to gamble. In addition, male participants seemed to
be more susceptible to the experimental treatment. Due to the technical issues that reduced
the size of the sample and might have added unwanted sources of confound, another
experiment was conducted, using slightly different stimuli.
Experiment 1B
Group N No Bet (%) Low Risk (%) High Risk (%) N No Bet (%) Low Risk (%) High Risk (%) p Test UsedMales 62 15 (24.19) 21 (33.87) 26 (41.94) 33 14 (42.42) 8 (24.24) 11 (33.33) 0.18 Pearson's Chi-‐SquareFemales 34 9 (26.47) 14 (41.18) 11 (32.35) 24 9 (37.50) 8 (33.33) 7 (29.17) 0.66 Pearson's Chi-‐SquareTotal 96 24 (25) 35 (36.46) 37 (38.54) 57 23 (40.35) 16 (28.07) 18 (31.58) 0.14 Pearson's Chi-‐Square
TABLE 4.2No, Low, High Risk Variable
Control Condition Hunger Condition
Again, each subject (N = 207, 52.2% Male, Mage=34.78) received US$1 for
participation and had the option to gamble $.50 of their participation fee on a roulette-like
gambling task. The experiment lasted around 7 minutes, was conducted online, and the
participants were recruited via Amazon’s Mechanical Turk.
Procedure
This experiment followed an almost identical procedure to that used in experiment
1A, except that a question now followed each of the 28 pictures presented. This modification
helped us to overcome the technical problems, making sure that everybody saw the picture
before moving to the next one. In the control condition, the question asked was “How
appealing does this product look to you?”; in the experimental condition, the question was
“How hungry does this picture make you feel?” (for both questions: 1=Not at all and 5=Very
much). Only one participant guessed the actual purpose of the study.
Results
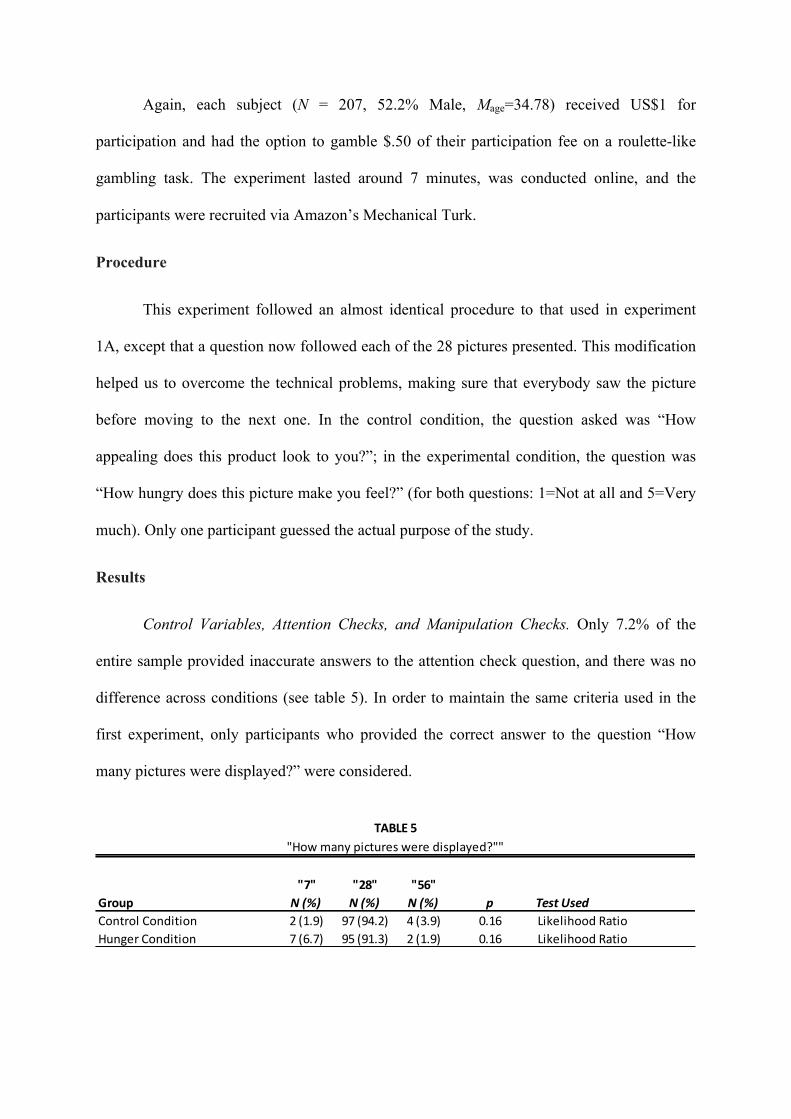
Control Variables, Attention Checks, and Manipulation Checks. Only 7.2% of the
entire sample provided inaccurate answers to the attention check question, and there was no
difference across conditions (see table 5). In order to maintain the same criteria used in the
first experiment, only participants who provided the correct answer to the question “How
many pictures were displayed?” were considered.
"7" "28" "56"Group N (%) N (%) N (%) p Test UsedControl Condition 2 (1.9) 97 (94.2) 4 (3.9) 0.16 Likelihood RatioHunger Condition 7 (6.7) 95 (91.3) 2 (1.9) 0.16 Likelihood Ratio
TABLE 5"How many pictures were displayed?""
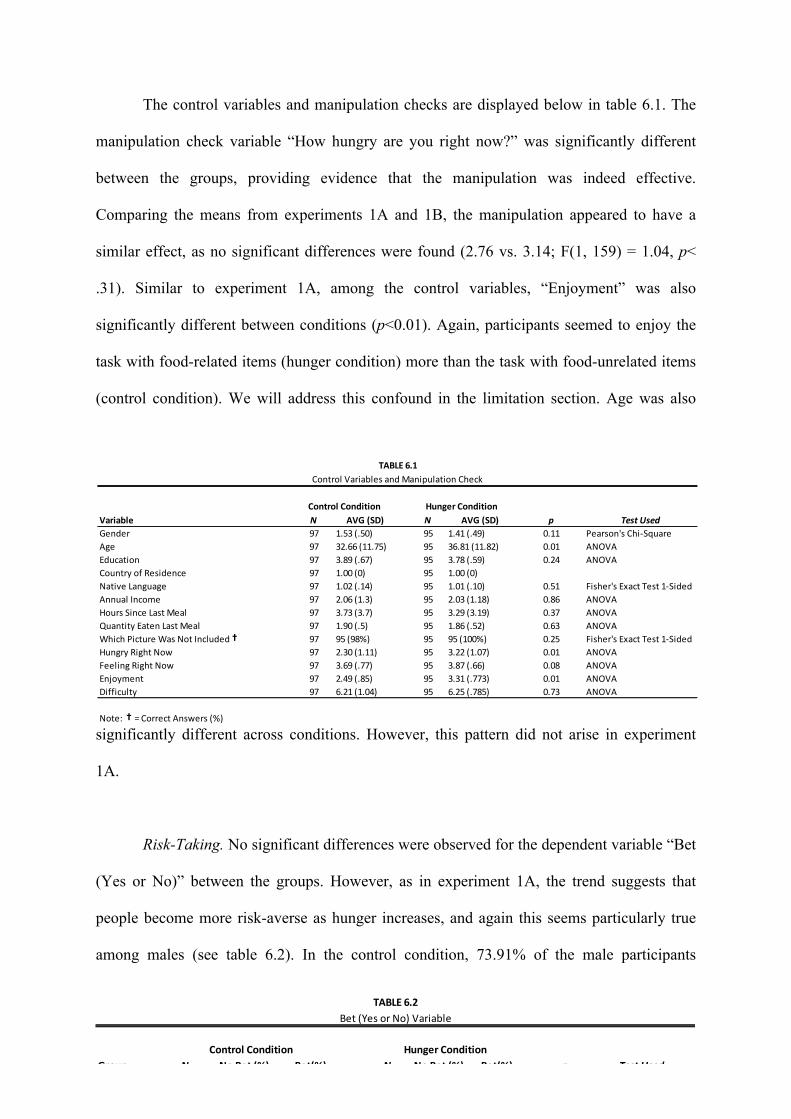
The control variables and manipulation checks are displayed below in table 6.1. The
manipulation check variable “How hungry are you right now?” was significantly different
between the groups, providing evidence that the manipulation was indeed effective.
Comparing the means from experiments 1A and 1B, the manipulation appeared to have a
similar effect, as no significant differences were found (2.76 vs. 3.14; F(1, 159) = 1.04, p<
.31). Similar to experiment 1A, among the control variables, “Enjoyment” was also
significantly different between conditions (p<0.01). Again, participants seemed to enjoy the
task with food-related items (hunger condition) more than the task with food-unrelated items
(control condition). We will address this confound in the limitation section. Age was also
significantly different across conditions. However, this pattern did not arise in experiment
1A.
Risk-Taking. No significant differences were observed for the dependent variable “Bet
(Yes or No)” between the groups. However, as in experiment 1A, the trend suggests that
people become more risk-averse as hunger increases, and again this seems particularly true
among males (see table 6.2). In the control condition, 73.91% of the male participants
Variable N AVG (SD) N AVG (SD) p Test UsedGender 97 1.53 (.50) 95 1.41 (.49) 0.11 Pearson's Chi-‐SquareAge 97 32.66 (11.75) 95 36.81 (11.82) 0.01 ANOVAEducation 97 3.89 (.67) 95 3.78 (.59) 0.24 ANOVACountry of Residence 97 1.00 (0) 95 1.00 (0)Native Language 97 1.02 (.14) 95 1.01 (.10) 0.51 Fisher's Exact Test 1-‐SidedAnnual Income 97 2.06 (1.3) 95 2.03 (1.18) 0.86 ANOVAHours Since Last Meal 97 3.73 (3.7) 95 3.29 (3.19) 0.37 ANOVAQuantity Eaten Last Meal 97 1.90 (.5) 95 1.86 (.52) 0.63 ANOVAWhich Picture Was Not Included ✝ 97 95 (98%) 95 95 (100%) 0.25 Fisher's Exact Test 1-‐SidedHungry Right Now 97 2.30 (1.11) 95 3.22 (1.07) 0.01 ANOVAFeeling Right Now 97 3.69 (.77) 95 3.87 (.66) 0.08 ANOVAEnjoyment 97 2.49 (.85) 95 3.31 (.773) 0.01 ANOVADifficulty 97 6.21 (1.04) 95 6.25 (.785) 0.73 ANOVA
Note: ✝ = Correct Answers (%)
TABLE 6.1Control Variables and Manipulation Check
Control Condition Hunger Condition
Group N No Bet (%) Bet(%) N No Bet (%) Bet(%) p Test UsedMales 46 12 (26.09) 34 (73.91) 56 21 (37.50) 35 (62.50) 0.22 Pearson's Chi-‐SquareFemales 51 10 (19.61) 41 (80.39) 39 6 (15.38) 33 (84.62) 0.60 Pearson's Chi-‐SquareTotal 97 22 (22.68) 75 (77.32) 95 27 (28.42) 68 (71.58) 0.36 Pearson's Chi-‐Square
TABLE 6.2Bet (Yes or No) Variable
Control Condition Hunger Condition
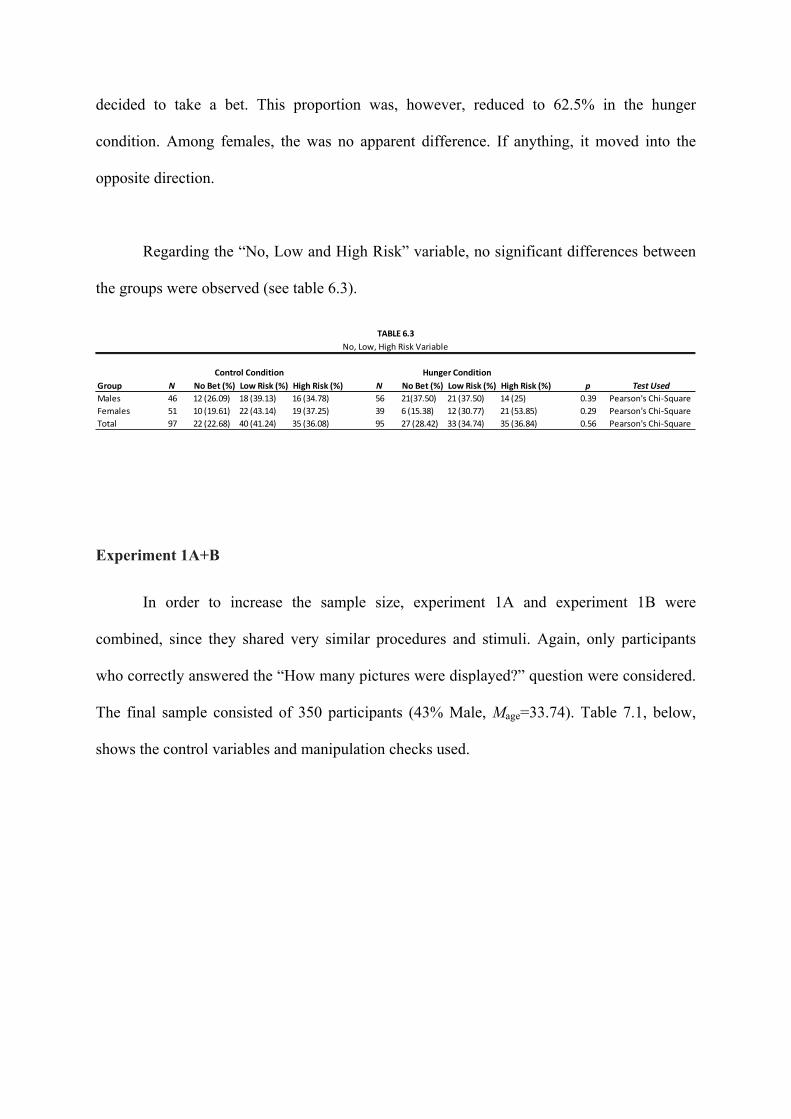
decided to take a bet. This proportion was, however, reduced to 62.5% in the hunger
condition. Among females, the was no apparent difference. If anything, it moved into the
opposite direction.
Regarding the “No, Low and High Risk” variable, no significant differences between
the groups were observed (see table 6.3).
Experiment 1A+B
In order to increase the sample size, experiment 1A and experiment 1B were
combined, since they shared very similar procedures and stimuli. Again, only participants
who correctly answered the “How many pictures were displayed?” question were considered.
The final sample consisted of 350 participants (43% Male, Mage=33.74). Table 7.1, below,
shows the control variables and manipulation checks used.
Group N No Bet (%) Low Risk (%) High Risk (%) N No Bet (%) Low Risk (%) High Risk (%) p Test UsedMales 46 12 (26.09) 18 (39.13) 16 (34.78) 56 21(37.50) 21 (37.50) 14 (25) 0.39 Pearson's Chi-‐SquareFemales 51 10 (19.61) 22 (43.14) 19 (37.25) 39 6 (15.38) 12 (30.77) 21 (53.85) 0.29 Pearson's Chi-‐SquareTotal 97 22 (22.68) 40 (41.24) 35 (36.08) 95 27 (28.42) 33 (34.74) 35 (36.84) 0.56 Pearson's Chi-‐Square
TABLE 6.3No, Low, High Risk Variable
Control Condition Hunger Condition
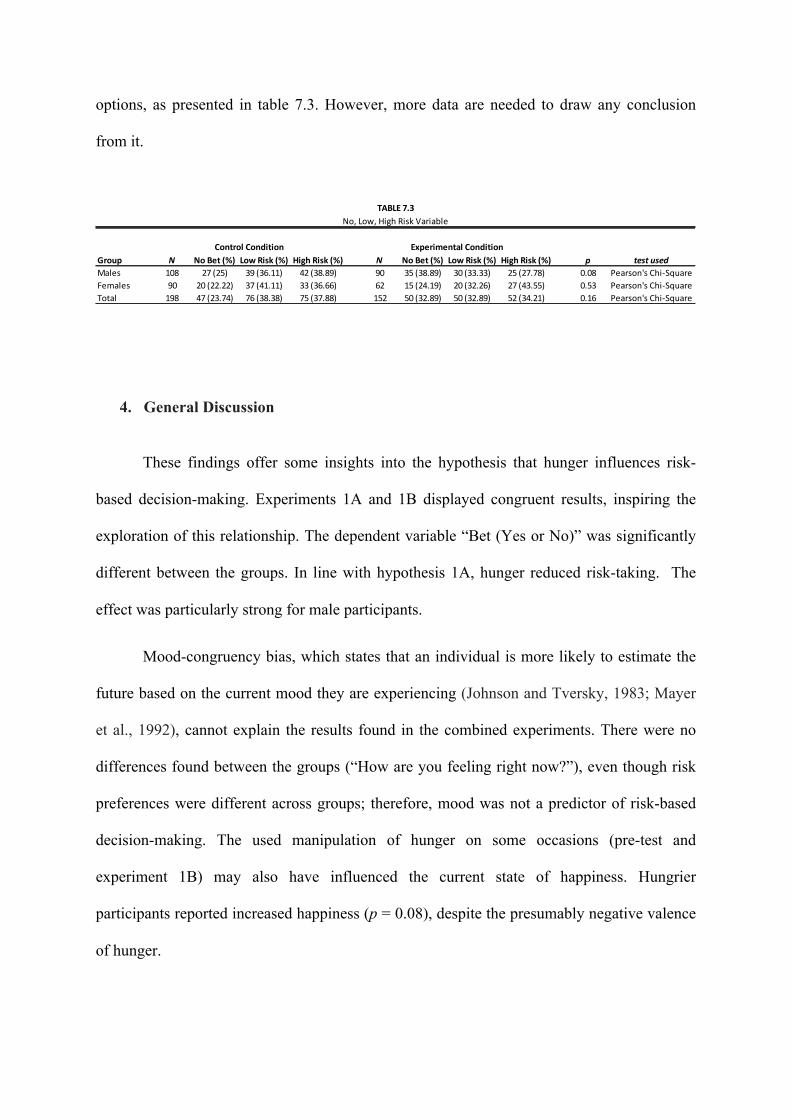
Risk-Taking. Once both experiments are combined, the hunger condition seems to
produce more risk-averse behavior, with an almost statistically significant difference
(p=.058), as shown on table 7.2. Further, consistent with the previous results, the effect
comes essentially from males who decided not to gamble. In the control condition, 75% of
the male participants decided to take a bet. This proportion was, however, significantly
reduced to 61.11% in the hunger condition. No differences were observed among female
participants.
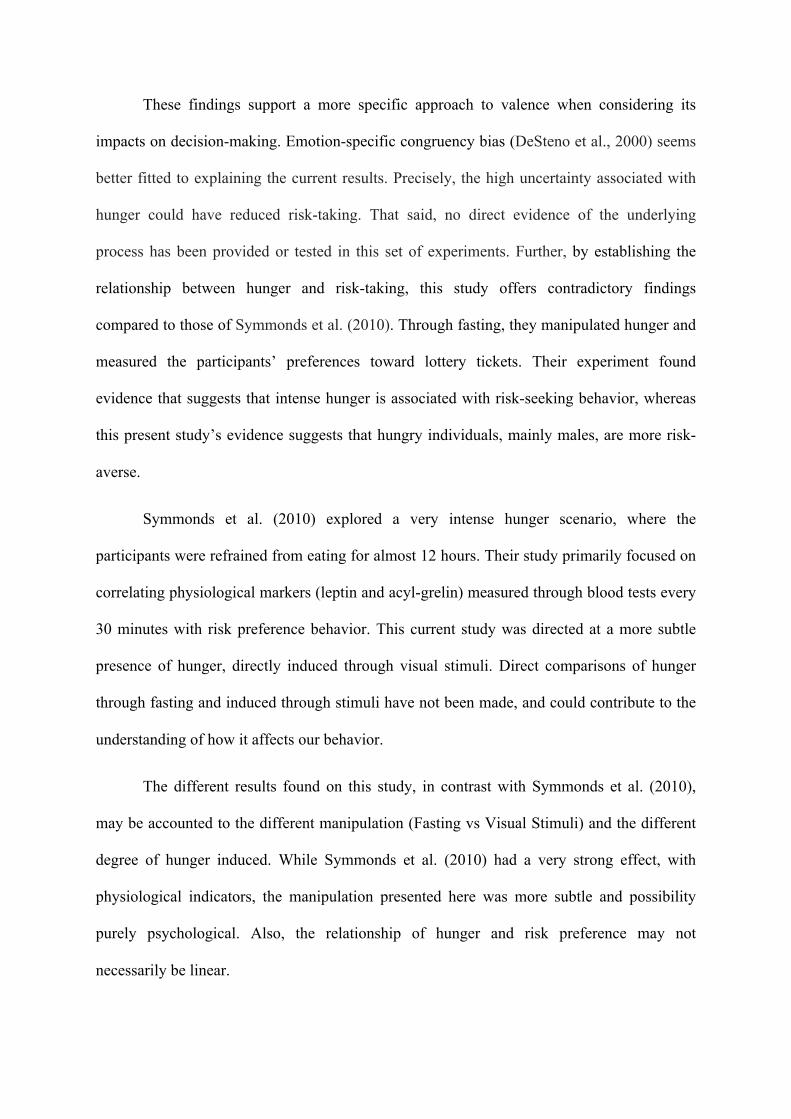
Now, the “No, Low and High Risk” variable produced a marginal effect, among males,
on the type of risk. It seems that hungry males are particularly sensitive to the high-risk
Variable N AVG (SD) N AVG (SD) p Test UsedGender 198 1.45 (.50) 152 1.41 (.49) 0.38 Pearson's Chi-‐SquareAge 198 32.53 (11.02) 152 34.95 (12.09) 0.05 ANOVAEducation 198 3.84 (.68) 152 3.74 (.63) 0.14 ANOVACountry of Residence 198 0 (0) 152 1.00 (0)Native Language 198 1.03 (.16) 152 1.01 (.11) 0.35 Fisher's Exact Test 1-‐SidedAnnual Income 198 2.15 (1.37) 152 1.97 (1.08) 0.17 ANOVAHours Since Last Meal 198 3.46 (3.34) 152 3.48 (3.74) 0.97 ANOVAQuantity Eaten Last Meal 198 1.96 (.53) 152 1.93 (.54) 0.58 ANOVAWhich Picture Was Not Included ✝ 198 195 (98%) 152 152 (100%) 0.18 Fisher's Exact Test 1-‐SidedHungry Right Now 198 2.23 (.99) 152 3.14 (1.16) 0.01 ANOVAFeeling Right Now 198 3.72 (.71) 152 3.76 (.77) 0.55 ANOVAEnjoyment 198 2.54 (.84) 152 3.16 (.86) 0.01 ANOVADifficulty 198 6.08 (1.16) 152 6.26 (.86) 0.10 ANOVA
Note: ✝ = Correct Answers (%)
TABLE 7.1Control Variables and Manipulation Check
Control Condition Hunger Condition
Group N No Bet (%) Bet(%) N No Bet (%) Bet(%) p Test UsedMales 108 27 (25) 81 (75) 90 35 (38.89) 55 (61.11) 0.04 Pearson's Chi-‐SquareFemales 90 20 (22.22) 70 (77.78) 62 15 (24.19) 47 (75.81) 0.77 Pearson's Chi-‐SquareTotal 198 47 (23.74) 151 (76.26) 152 50 (32.89) 102 (67.11) 0.06 Pearson's Chi-‐Square
TABLE 7.2Bet (Yes or No) Variable
Control Condition Hunger Condition
options, as presented in table 7.3. However, more data are needed to draw any conclusion
from it.
4. General Discussion
These findings offer some insights into the hypothesis that hunger influences risk-
based decision-making. Experiments 1A and 1B displayed congruent results, inspiring the
exploration of this relationship. The dependent variable “Bet (Yes or No)” was significantly
different between the groups. In line with hypothesis 1A, hunger reduced risk-taking. The
effect was particularly strong for male participants.
Mood-congruency bias, which states that an individual is more likely to estimate the
future based on the current mood they are experiencing (Johnson and Tversky, 1983; Mayer
et al., 1992), cannot explain the results found in the combined experiments. There were no
differences found between the groups (“How are you feeling right now?”), even though risk
preferences were different across groups; therefore, mood was not a predictor of risk-based
decision-making. The used manipulation of hunger on some occasions (pre-test and
experiment 1B) may also have influenced the current state of happiness. Hungrier
participants reported increased happiness (p = 0.08), despite the presumably negative valence
of hunger.
Group N No Bet (%) Low Risk (%) High Risk (%) N No Bet (%) Low Risk (%) High Risk (%) p test usedMales 108 27 (25) 39 (36.11) 42 (38.89) 90 35 (38.89) 30 (33.33) 25 (27.78) 0.08 Pearson's Chi-‐SquareFemales 90 20 (22.22) 37 (41.11) 33 (36.66) 62 15 (24.19) 20 (32.26) 27 (43.55) 0.53 Pearson's Chi-‐SquareTotal 198 47 (23.74) 76 (38.38) 75 (37.88) 152 50 (32.89) 50 (32.89) 52 (34.21) 0.16 Pearson's Chi-‐Square
TABLE 7.3No, Low, High Risk Variable
Control Condition Experimental Condition
These findings support a more specific approach to valence when considering its
impacts on decision-making. Emotion-specific congruency bias (DeSteno et al., 2000) seems
better fitted to explaining the current results. Precisely, the high uncertainty associated with
hunger could have reduced risk-taking. That said, no direct evidence of the underlying
process has been provided or tested in this set of experiments. Further, by establishing the
relationship between hunger and risk-taking, this study offers contradictory findings
compared to those of Symmonds et al. (2010). Through fasting, they manipulated hunger and
measured the participants’ preferences toward lottery tickets. Their experiment found
evidence that suggests that intense hunger is associated with risk-seeking behavior, whereas
this present study’s evidence suggests that hungry individuals, mainly males, are more risk-
averse.
Symmonds et al. (2010) explored a very intense hunger scenario, where the
participants were refrained from eating for almost 12 hours. Their study primarily focused on
correlating physiological markers (leptin and acyl-grelin) measured through blood tests every
30 minutes with risk preference behavior. This current study was directed at a more subtle
presence of hunger, directly induced through visual stimuli. Direct comparisons of hunger
through fasting and induced through stimuli have not been made, and could contribute to the
understanding of how it affects our behavior.
The different results found on this study, in contrast with Symmonds et al. (2010),
may be accounted to the different manipulation (Fasting vs Visual Stimuli) and the different
degree of hunger induced. While Symmonds et al. (2010) had a very strong effect, with
physiological indicators, the manipulation presented here was more subtle and possibility
purely psychological. Also, the relationship of hunger and risk preference may not
necessarily be linear.
Managerial Implications
Risk is a core component of many business activities, whether it is avoided or
embraced. Considering that hunger may skew our default risk preferences toward safer
behavior, this may pose significant negative implications for one’s decision-making. As in
the already mentioned Judicial Rulings case, individuals may be inadvertently influenced by
their current physiological state, making important decisions susceptible to unimportant
variables.
Professionals that are constantly under the pressure of making risk-based decisions,
like physicians and stock market professionals, are most likely to be influenced by hunger. As
they make decisions in short periods of time, the current state experienced may very well
influence their decisions. It is possible, as seen with judges, that a trader may behave
differently before or after lunch.
Limitations
This study was conducted through an experiment with American online participants
recruited through Amazon’s Mechanical Turk. The artificial environment of the experiment,
being an online survey, and the lack of control of test conditions may have caused distortions,
thus requiring more studies to generalize the findings obtained here.
The hunger manipulation employed (visual stimuli) might have different effects when
compared to fasting techniques that have also proven valid in previous studies. Visual stimuli
may be a more artificial approach of inducing hunger and may strictly represent real-world
experiences of hunger. With the use of imagery, possible confounds could also be present,
such as the significant difference in enjoyment observed in this study. Using images could
very well affect unaccounted variables, which could explain the observed results. Live
experiments with greater control over the manipulation of hunger and the experimental
environment are required for definitive answers.
In order to increase the external validity of this study, a real betting scenario was used
for increased realism. However, some participants expressed suspicion regarding whether the
actual bet was real or if the winning payment would be made. These concerns were visible in
the answers to the open-ended segment of the survey.
Additional consideration has to be given to the fact that experiment 1B did not present
as significant results as experiment 1A did. The lack of statistically significant results in
experiment 1B also increases the difficulty of asserting any definitive conclusions on the
issue but rather opens up new possibilities. The possible technical problems in experiment 1A
also reduced the valid sample, although these issues were addressed and corrected in
experiment 1B.
Future Research
As a first attempt to study this phenomenon, this study could have benefited from a
larger sample size to allow greater analysis of specific control variables (e.g. time of the day).
Additionally, with the discrepancy between experiment 1A and 1B, a third revision would
contribute to understanding this phenomenon.
Additional control variables should also be considered for future studies regarding
hunger, such as glycemic index and body mass index (BMI). Glycemic index may provide a
direct observation of hunger without requiring self-reported measures, while BMI has proven
to be an important factor regarding hunger in past studies (Nisbett and Kanouse, 1969; Mela,
Aaron, and Gatenby, 1997).
The possible ramifications of this study may reside in sub-optimal risk preference. If
hunger indeed proves to influence risk-based decision-making in favor of risk aversion, could
that influence be such that even an option with higher expected value would be forfeited in
favor of a risk-free decision? If so, the negative aspects of risk aversion would prove to be
even greater and more significant than so far explored. On the other hand, could diminishing
the hunger skew one’s preference toward riskier options, even those with lower expected
values?
Another theoretical aspect to be explored lies in the complexity of the choice. Gilbert,
Gill, and Wilson (2002) explored the notion that a higher cognitive load could deplete the
limited attention resources, making participants even more likely to be influenced by hunger.
The current choice was fairly simple: an eight-by-eight board with countable squares. With
basic math skills, one could calculate the odds of winning or at least have an educated guess.
If the choices proposed are indeed complex and very hard to calculate, how much more or
less would hunger influence risk preference?
Finally, although not supported in this study, hypothesis 1B, that hunger could influence
participants’ risk preference toward riskier options, may also be true in certain extreme
scenarios. Risk-seeking behavior could be enhanced by hunger in extreme scenarios of
starvation where survival could be at stake. Even though relevant, exploring these borderline
scenarios in a controlled environment may prove to be a challenge.
5. References
Andrade, E. B., & Ariely, D. (2009). The enduring impact of transient emotions on decision making. Organizational Behavior and Human Decision Processes, 109(1), 1-8.
Andrade, E.B. (in press). Consumer emotions. In M. Norton, D. Rucker, & C. Lamberton (Eds.), Cambridge Handbook of Consumer Psychology.
Barber, B. M., & Odean, T. (2001). Boys will be boys: Gender, overconfidence, and common stock investment. Quarterly Journal of Economics, 261-292.
Bhatia, S., & Loewenstein, G. (2013). Drive states. In E. Diener & R. Biswas-Diener (Eds), Noba Textbook Series: Psychology. Champaign, IL.
Brendl, C. M., Markman, A. B., & Messner, C. (2003). The devaluation effect: Activating a need devalues unrelated objects. Journal of Consumer Research, 29(4), 463-473.
Channon, S., & Hayward, A. (1990). The effect of short-‐term fasting on processing of food cues in normal subjects. International Journal of Eating Disorders, 9(4), 447-452.
Danziger, S., Levav, J., & Avnaim-Pesso, L. (2011). Extraneous factors in judicial decisions. Proceedings of the National Academy of Sciences, 108(17), 6889-6892.
DeSteno, D., Petty, R.E., Wegener, D.T., & Rucker, D.D. (2000). Beyond valence in the perception of likelihood: The role of emotion specificity. Journal of Personality and Social Psychology, 78(3), 397-416.
Easterbrook, J. A. (1959). The effect of emotion on cue utilization and the organization of behavior. Psychological Review, 66(3), 183.
FAO, IFAD, & WFP, 2013. The State of Food Insecurity in the World 2013. The Multiple Dimensions of Food Security. Rome, FAO.
Frijda, N.H. (1987). Emotion, cognitive structure, and action tendency. Cognition & Emotion, 1(2), 115-143.
Gilbert, D. T., Gill, M. J., & Wilson, T. D. (2002). The future is now: Temporal correction in affective forecasting. Organizational Behavior and Human Decision Processes, 88(1), 430-444.
Johnson, E. J., & Tversky, A. (1983). Affect, generalization, and the perception of risk. Journal of Personality and Social Psychology, 45(1), 20.
Lerner, J. S., & Keltner, D. (2000). Beyond valence: Toward a model of emotion-specific influences on judgement and choice. Cognition & Emotion, 14(4), 473-493.
Lerner, J. S., & Keltner, D. (2001). Fear, anger, and risk. Journal of Personality & Social Psychology, 81(1), 146-159.
Loewenstein, G. (1996). Out of control: Visceral influences on behavior. Organizational Behavior and Human Decision Processes, 65(3), 272-292.
Loewenstein, G. F., Prelec, D., & Shatto, C. (1998). Hot/cold intrapersonal empathy gaps and the underprediction of curiosity. Unpublished manuscript, Carnegie-Mellon University, Pittsburgh, PA.
Loewenstein, G. F., Weber, E. U., Hsee, C. K., & Welch, N. (2001). Risk as feelings. Psychological Bulletin, 127(2), 267.
Loewenstein, G., & Lerner, J. S. (2003). The role of affect in decision making. Handbook of Affective Science, 619(642), 3.
Lopes, L. L. (1987). Between hope and fear: The psychology of risk. Advances in Experimental Social Psychology, 20, 255-295.
Mayer, J. D., Gaschke, Y. N., Braverman, D. L., & Evans, T. W. (1992). Mood-congruent judgment is a general effect. Journal of Personality and Social Psychology, 63(1), 119.
Mela, D. J., Aaron, J. I., & Gatenby, S. J. (1997). Relationships of consumer characteristics and food deprivation to food purchasing behavior. Physiology & Behavior, 60(5), 1331-1335.
Mellers, B. A., Schwartz, A., Ho, K., & Ritov, I. (1997). Decision affect theory: Emotional reactions to the outcomes of risky options. Psychological Science, 423-429.
Mogg, K., Bradley, B. P., Hyare, H., & Lee, S. (1998). Selective attention to food-related stimuli in hunger: Are attentional biases specific to emotional and psychopathological states, or are they also found in normal drive states? Behaviour Research and Therapy, 36(2), 227-237.
Neimeijer, R. A., de Jong, P. J., & Roefs, A. (2013). Temporal attention for visual food stimuli in restrained eaters. Appetite, 64, 5-11.
Nisbett, R. E., & Kanouse, D. E. (1969). Obesity, food deprivation, and supermarket shopping behavior. Journal of Personality and Social Psychology, 12(4), 289.
Piech, R. M., Hampshire, A., Owen, A. M., & Parkinson, J. A. (2009). Modulation of cognitive flexibility by hunger and desire. Cognition and Emotion, 23(3), 528-540.
Piech, R. M., Pastorino, M. T., & Zald, D. H. (2010). All I saw was the cake. Hunger effects on attentional capture by visual food cues. Appetite, 54(3), 579-582.
Read, D., & Van Leeuwen, B. (1998). Predicting hunger: The effects of appetite and delay on choice. Organizational Behavior and Human Decision Processes, 76(2), 189-205.
Symmonds, M., et al. (2010). Metabolic state alters economic decision making under risk in humans. PloS one 5.6: e11090.
Tal, A., & Wansink, B. (2013). Fattening fasting: Hungry grocery shoppers buy more calories, not more food. JAMA internal medicine, 173(12), 1146-1148.
Wansink, B., Tal, A., & Shimizu, M. (2012). First foods most: After 18-hour fast, people drawn to starches first and vegetables last. Archives of Internal Medicine, 172(12), 961-963.
Wells, A., & Matthews, G. (Eds.). (1994). Attention and Emotion: A Clinical Perspective. Psychology Press.
6. Appendix 1
Pre-Test Example:
Hungry Condition
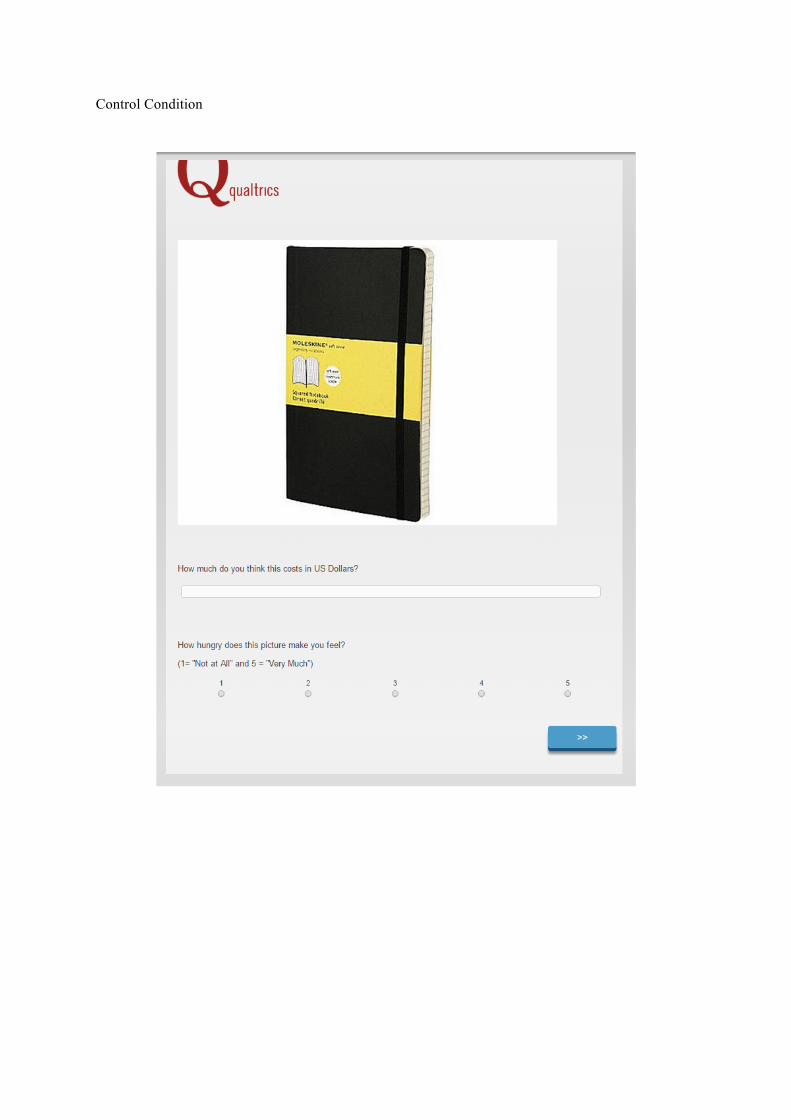
Control Condition
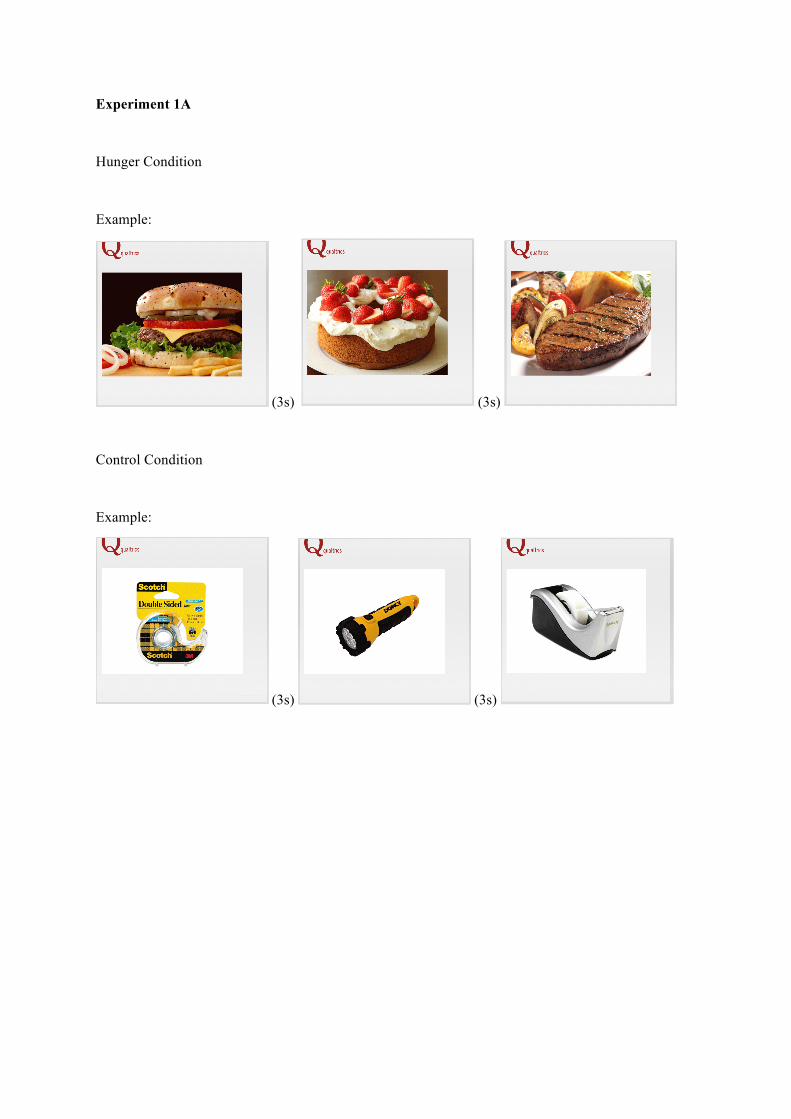
Experiment 1A
Hunger Condition
Example:
(3s) (3s)
Control Condition
Example:
(3s) (3s)
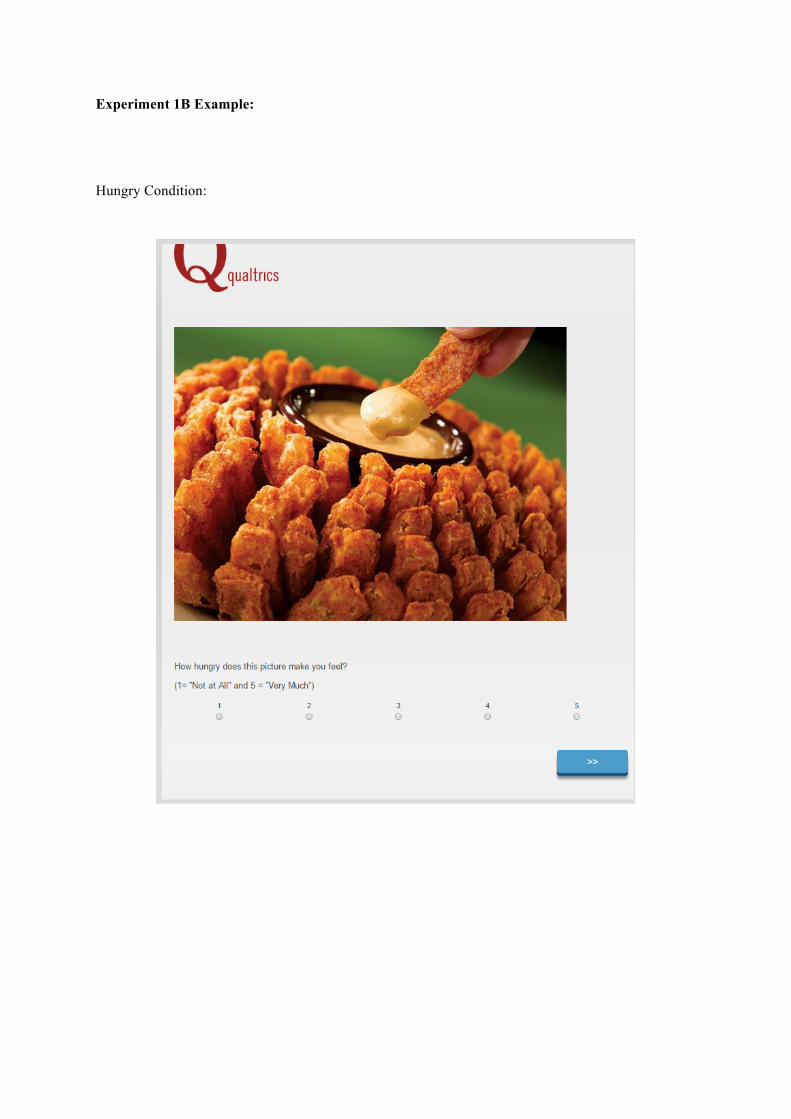
Experiment 1B Example:
Hungry Condition:

Control Condition:
7. Appendix 2
Gamble explanation and procedure
8. Appendix 3
Position ID Picture-Description N Hunger-Score-Mean-(SD) Price-Mean-(SD) Selected?1 P0005 Pack(of(Ballpoint(Pens 27 1.00((.00) 10.21((3.866) Yes2 P0008 Micro(Binders(Pack 28 1.00((.00) 5.534((3.393) Yes3 P0035 Black(Moleskine(Notebook 27 1.00((.00) 6.194((4.419) Yes4 P0038 Colored(Page(Markers(by(PostFIt 28 1.00((.00) 4.057((2.194) Yes5 P0044 Bag(of(Rubber(Bands 28 1.00((.00) 3.928((2.324) Yes6 P0051 Vintage(Metal(Fan 27 1.00((.00) 23.18((13.41) Yes7 P0060 Scissors 28 1.00((.00) 5.024((3.792) Yes8 P0062 Pliers 27 1.00((.00) 7.831((3.967) Yes9 P0064 Mini(Flashlight 26 1.00((.00) 13.34((12.40) Yes10 P0065 Black(Stapler 26 1.00((.00) 9.025((5.532) Yes11 P0066 Screwdriver(Kit 27 1.00((.00) 19.14((8.946) Yes12 P0067 Tape(Dispenser 28 1.00((.00) 8.660((5.073) Yes13 P0070 Double(Sided(Tape 26 1.00((.00) 2.476((.9617) Yes14 P0071 Ban(Deodorant 27 1.00((.00) 4.808((2.004) Yes15 P0073 Removable(Tape 28 1.00((.00) 4.101((2.490) Yes16 P0074 Duracell(Battery(Pack 27 1.00((.00) 6.258((3.400) Yes17 P0077 R2D2(Keychain 28 1.00((.00) 4.262((2.606) Yes18 P0080 Gel(Grip(Pen 27 1.00((.00) 3.255((1.602) Yes19 P0081 Razor(Knife 28 1.00((.00) 6.442((3.999) Yes20 P0084 Scissors(2 26 1.00((.00) 7.345((4.849) Yes21 P0085 Loctite(Super(Glue 27 1.00((.00) 3.988((2.579) Yes22 P0087 Trash(Bin 26 1.00((.00) 11.45((5.023) Yes23 P0088 Krazy(Glue 28 1.00((.00) 4.852((1.823) Yes24 P0048 Vintage(Teal(Caddy 28 1.04((.19) 11.31((8.119) Yes25 P0068 Flashlight 28 1.04((.19) 14.76((6.145) Yes26 P0063 Jump(Rope 27 1.04((.19) 6.138((3.524) Yes*27 P0072 Shampoo 27 1.04((.19) 5.073((1.973) Yes*28 P0079 Toothpaste 27 1.04((.19) 3.138((1.196) Yes*29 P0055 Ace(of(Spades(Zippo 27 1.04((.19) 14.44((9.724) No*30 P0047 Always(Good(Weather(Umbrella 28 1.07((.38) 17.67((8.232) No31 P0007 Brite(Liner 27 1.07((.27) 4.472((2.057) No32 P0012 Yellow(Watch 27 1.07((.27) 25.29((15.69) No33 P0069 Multitool(Screw(Driver 27 1.07((.27) 12.53((7.956) No34 P0083 Liquid(Paper(Roll(Dispenser 27 1.07((.27) 4.645((3.407) No35 P0086 Pencil(Dispenser 27 1.07((.38) 4.185((2.899) No36 P0082 Glue(Pack 26 1.08((.39) 2.874((1.431) No37 P0020 Green(Notebook(With(Pen 28 1.11((.57) 5.463((2.765) No38 P0014 Plastic(Calculator 28 1.11((.57) 9.249((5.045) No39 P0017 12(Colored(Markers(by(Pilot 27 1.11((.58) 6.460((2.634) No40 P0018 Colored(Paper(Clips 27 1.11((.58) 5.302((4.459) No41 P0019 Bundle(of(PostFIts 27 1.11((.58) 3.018((1.496) No42 P0024 Colored(Patterned(Pillow 27 1.11((.42) 11.29((5.573) No43 P0042 200FPack(of(Colored(Pins 27 1.11((.58) 3.507((1.797) No44 P0089 Pilot(Premium(Pen 27 1.11((.58) 3.620((2.085) No45 P0078 Nail(Polish 26 1.12((.43) 5.156((2.487) No46 P0010 Bird(House 28 1.14((.76) 23.21((13.71) No47 P0059 GB(Keychain 28 1.14((.52) 3.694((3.037) No48 P0061 Bundle(Post(It 27 1.15((.60) 5.090((3.175) No49 P0058 Highlighter 27 1.19((.79) 1.442((.6324) No50 P0001 WallFMounted(Fish(Tank 27 1.22((.80) 21.96((13.74) No51 P0076 Toothbrush 27 1.22((.80) 3.305((1.340) No52 P0075 Bear(NY(Keychain 26 1.23((.86) 4.115((2.698) No53 P0021 Light(Blue(Backpack 27 1.26((.71) 19.54((10.06) No54 P0002 Brown(Necessaire 27 1.26((.53) 14.14((10.97) No55 P0041 Plastic(Flowers(for(Ceiling 26 1.35((.89) 18.97((8.421) No56 P0053 Wood(Bark(Candle(Holder 28 1.43((.07) 19.53((12.94) No
note:&*&was&selected&at&random&to&resolve&dispute
NEUTRAL(PICTURES(SCORESTABLE-1A
Position ID Picture-Description N Hunger-ScoreMean-(SD) Price-Mean-(SD) Selected?1 PH0065 Steak,and,Fries,2 27 4.00,(0.27) 7.88,(4.04) Yes2 PH0027 Pizza,Slice 26 3.92,(9.26) 4.11,(3.19) Yes3 PH0028 Pizza,Hut 24 3.88,(8.24) 13.2,(3.09) Yes4 PH0030 Ribs,BBQ 24 3.88,(8.24) 13.6,(3.25) Yes5 PH0084 Chocolate,Cheesecake 24 3.88,(8.24) 5.82,(3.11) Yes6 PH0086 NY,Strip,of,Sirloin 26 3.73,(7.26) 13.0,(3.35) Yes7 PH0018 Hamburger 25 3.68,(6.25) 7.12,(3.92) Yes8 PH0048 Tacos 25 3.68,(6.25) 12.1,(3.84) Yes9 PH0057 Beef,Sandwich 26 3.62,(6.26) 5.60,(3.26) Yes10 PH0064 Oreo,Ice,Cream,Waffle 25 3.60,(6.25) 5.35,(3.42) Yes11 PH0078 Chocolate,Waffle 25 3.52,(5.25) 5.89,(3.47) Yes12 PH0006 Burritos 26 3.50,(5.26) 7.80,(3.39) Yes13 PH0008 Cake 26 3.50,(5.26) 5.22,(3.07) Yes14 PH0080 French,Dip,Sandwich 24 3.46,(4.24) 9.03,(3.92) Yes15 PH0010 Roasted,Chicken 25 3.44,(4.25) 8.11,(3.65) Yes16 PH0045 Beef,and,Fries 25 3.44,(4.25) 4.58,(3.08) Yes17 PH0004 Blooming,Onion 26 3.42,(4.26) 7.59,(3.38) Yes18 PH0017 Grilled,Pepper,Steak 26 3.42,(4.26) 17.0,(3.70) Yes19 PH0085 Cheesy,Meat,Lasagna 24 3.42,(4.24) 7.54,(3.99) Yes20 PH0035 Steak,au,Poivre 25 3.40,(4.25) 16.9,(3.95) Yes21 PH0054 Brownie 25 3.36,(3.25) 22.2,(3.4) Yes22 PH0072 Mac,and,Cheese 25 3.32,(3.25) 5.91,(3.17) Yes23 PH0023 Lasagna 25 3.28,(2.25) 9.31,(3.82) Yes24 PH0079 Devil's,Food,Cream,Pie 25 3.28,(2.25) 5.27,(3.62) Yes25 PH0034 Spaghettini 26 3.27,(2.26) 7.81,(3.59) Yes26 PH0067 Cinnamon,Rolls 25 3.24,(2.25) 1.83,(3.854) Yes27 PH0036 Strawberry,Pie 26 3.23,(2.26) 12.4,(3.51) Yes*28 PH0076 Hazelnut,Cheesecake 26 3.23,(2.26) 4.44,(3.86) Yes*29 PH0041 Chocolate,Cupcake 26 3.23,(2.26) 3.03,(3.12) No*30 PH0062 Yakisoba 25 3.20,(2.25) 15.6,(3.89) No31 PH0026 Nuts,and,Avocado,Salad 25 3.20,(2.25) 7.79,(3.34) No32 PH0002 Thai/Asian,Food 24 3.17,(1.24) 9.87,(3.78) No33 PH0060 Shrimp,Linguini 26 3.15,(1.26) 2.25,(3.02) No34 PH0083 Guiness,Chocolate,Cheesecake 25 3.12,(1.25) 4.82,(3.25) No35 PH0005 Brownie,and,Icecream 26 3.12,(1.26) 5.59,(3.32) No36 PH0070 Brownie,Ice,Cream 27 3.11,(1.27) 4.89,(3.89) No37 PH0074 Baked,Potato 25 3.08,(0.25) 6.11,(3.87) No38 PH0075 Slow\Cooked,Beef 26 3.08,(0.26) 17.3,(3.48) No39 PH0088 Fries 25 3.04,(0.25) 3.30,(3.20) No40 PH0058 Angel,Cupcake 26 3.04,(0.26) 6.40,(3.09) No41 PH0049 Cheesecake 25 3.00,(0.25) 6.43,(3.86) No42 PH0068 Donuts 25 3.00,(0.25) 6.62,(3.34) No43 PH0082 Mexican,Hotdog 24 3.00,(0.24) 5.01,(3.71) No44 PH0073 Pancake,with,Honey 25 2.96,(9.25) 4.77,(2.00) No45 PH0061 Sushi,Rolls 25 2.96,(9.25) 14.5,(2.12) No46 PH0055 Waffle,and,Ice,Cream 27 2.93,(9.27) 4.17,(2.21) No47 PH0053 Sushi,Plate 26 2.88,(8.26) 5.13,(2.90) No48 PH0042 Crep,Chocolate 26 2.85,(8.26) 3.98,(2.22) No49 PH0069 Lamb,Chops 26 2.85,(8.26) 15.3,(2.85) No50 PH0050 Fried,Chicken 26 2.77,(7.26) 7.63,(2.52) No51 PH0071 Beef,Wellington 25 2.76,(7.25) 14.6,(2.48) No52 PH0077 Blueberry,Icebox 25 2.72,(7.25) 5.83,(2.18) No53 PH0051 Eggs,and,Bacon 26 2.65,(6.26) 5.52,(2.83) No54 PH0077.0 Hotdog 25 2.64,(6.25) 2.62,(2.10) No55 PH0063 Three\Meat,Stromboli 27 2.52,(5.27) 7.98,(2.68) No56 PH0066 Froot,Loops 24 1.96,(9.24) 13.9,(1.69) No
note:&*&was&selected&at&random&to&resolve&dispute
TABLE-1BFOOD,PICTURE,SCORES