nutrition assessment report - action against hunger
TRANSCRIPT
Nutrition Survey report IDP camps, Gulu district,
Northern Uganda
22nd June to 5th July 2006.
Table of content SUMMARY..................................................................................................................................................................4 RECOMMENDATIONS ............................................................................................................................................5 1-INTRODUCTION....................................................................................................................................................6
1.1 SITUATION ...........................................................................................................................................................6 1.2 SURVEY OBJECTIVES ...........................................................................................................................................7
2- METHODOLOGY..................................................................................................................................................7 2.1 SURVEY METHODOLOGY .....................................................................................................................................7 2.2 DATA COLLECTED................................................................................................................................................8 2.3 DATA ANALYSIS ..................................................................................................................................................9 2.4 TRAINING AND SUPERVISION ...............................................................................................................................9
3- RESULTS...............................................................................................................................................................10 3.1 ANTHROPOMETRIC RESULTS ..............................................................................................................................10
Distribution of age and sex of the children ........................................................................................................10 Distribution of malnutrition in z-score...............................................................................................................10 Distribution of malnutrition in percentage of the median..................................................................................12 Mid upper arm circumference (MUAC).............................................................................................................12
3.2 MORTALITY RESULTS ........................................................................................................................................12 3.3 VACCINATION....................................................................................................................................................13
Measles immunization coverage ........................................................................................................................13 Vitamin A coverage............................................................................................................................................13
3.4 PROGRAM COVERAGE ........................................................................................................................................13 WFP general food distribution...........................................................................................................................13 Feeding center....................................................................................................................................................13
4- DISCUSSION ........................................................................................................................................................14 RECOMMENDATIONS ..........................................................................................................................................14 ACKNOWLEDGMENTS.........................................................................................................................................15 APPENDIX ................................................................................................................................................................15
*****
2
Table 1: Results summary............................................................................................................................. 4 Table 2: Comparison of ACF surveys results in Z-scores ............................................................................ 4 Table 3: List of NGOs working in Gulu district and their field of activities ................................................ 6 Table 4: Distribution of age and sex ........................................................................................................... 10 Table 5: Prevalence of acute malnutrition based on weight-for-height z-scores (and/or oedema) ............. 10 Table 6: Prevalence of acute malnutrition by age based on weight-for-height z-scores and/or oedema. ... 11 Table 7: Distribution of acute malnutrition and oedema based on weight-for-height z-scores .................. 11 Table 8: Prevalence of acute malnutrition based on the percentage of the median and/or oedema............ 12 Table 9: Prevalence of malnutrition by age, based on w/h in percentage of the median and oedema........ 12 Table 10: MUAC distribution according to nutritional status ....................................................................12 Table 11: Mortality rates............................................................................................................................. 13 Table 12: measles immunization coverage ................................................................................................. 13 Table 13: vitamin A supplementation coverage.......................................................................................... 13 Table 14: WFP card coverage..................................................................................................................... 13 Table 15: Children under 5 years old in the SFC program ......................................................................... 13 Table 16: Comparison of ACF surveys, results in Z-scores. ...................................................................... 14
***** Figure 1: Population age and sex pyramid.................................................................................................. 10 Figure 2: Z-score distribution weight for height ......................................................................................... 11
*****
3
Summary The survey took place in the IDP camps of Gulu district, in northern Uganda from the 22nd June to 5th July 2006. It is part of a monitoring system, together with on going screening activities, and follows up a serie of yearly survey since 2003.
The objective of this monitoring is mainly to evaluate the evolution of the nutritional status of this population, and do recommendations accordingly.
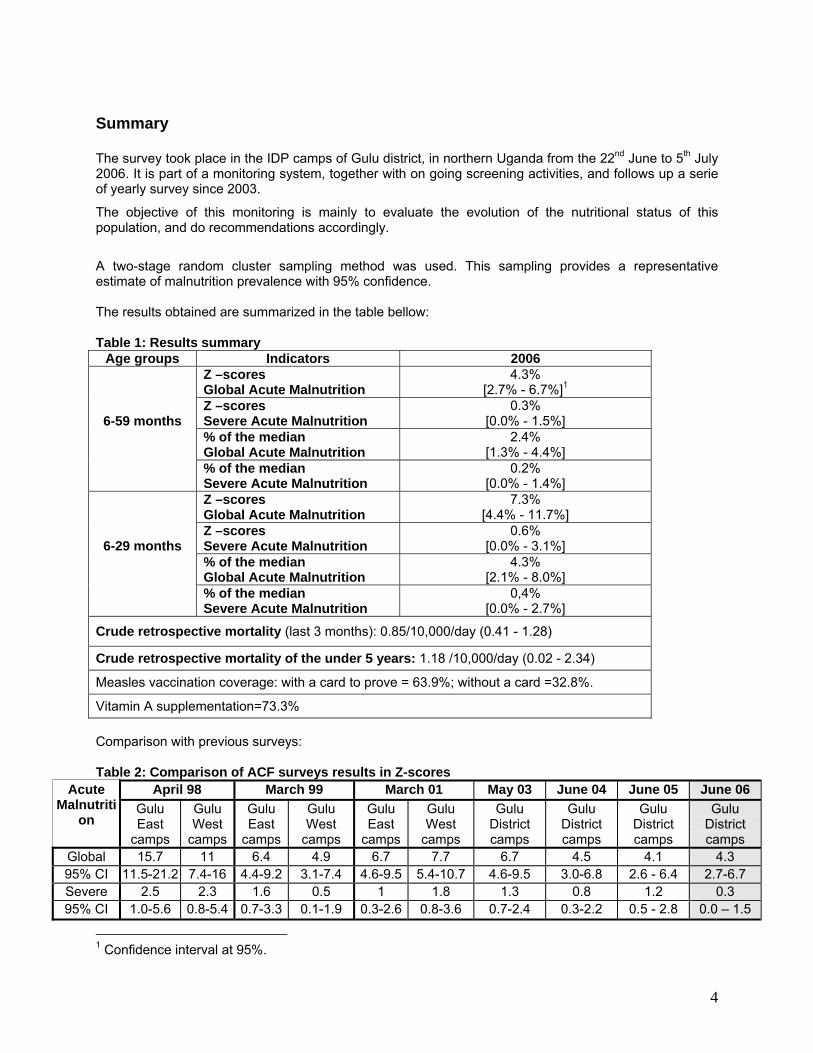
A two-stage random cluster sampling method was used. This sampling provides a representative estimate of malnutrition prevalence with 95% confidence. The results obtained are summarized in the table bellow: Table 1: Results summary
Age groups Indicators 2006 Z –scores Global Acute Malnutrition
4.3% [2.7% - 6.7%]1
Z –scores Severe Acute Malnutrition
0.3% [0.0% - 1.5%]
% of the median Global Acute Malnutrition
2.4% [1.3% - 4.4%]
6-59 months
% of the median Severe Acute Malnutrition
0.2% [0.0% - 1.4%]
Z –scores Global Acute Malnutrition
7.3% [4.4% - 11.7%]
Z –scores Severe Acute Malnutrition
0.6% [0.0% - 3.1%]
% of the median Global Acute Malnutrition
4.3% [2.1% - 8.0%]
6-29 months
% of the median Severe Acute Malnutrition
0,4% [0.0% - 2.7%]
Crude retrospective mortality (last 3 months): 0.85/10,000/day (0.41 - 1.28)
Crude retrospective mortality of the under 5 years: 1.18 /10,000/day (0.02 - 2.34)
Measles vaccination coverage: with a card to prove = 63.9%; without a card =32.8%.
Vitamin A supplementation=73.3% Comparison with previous surveys: Table 2: Comparison of ACF surveys results in Z-scores
April 98 March 99 March 01 May 03 June 04 June 05 June 06 Acute Malnutriti
on Gulu East
camps
Gulu West
camps
Gulu East
camps
Gulu West
camps
Gulu East
camps
Gulu West
camps
Gulu District camps
Gulu District camps
Gulu District camps
Gulu District camps
Global 15.7 11 6.4 4.9 6.7 7.7 6.7 4.5 4.1 4.3 95% CI 11.5-21.2 7.4-16 4.4-9.2 3.1-7.4 4.6-9.5 5.4-10.7 4.6-9.5 3.0-6.8 2.6 - 6.4 2.7-6.7 Severe 2.5 2.3 1.6 0.5 1 1.8 1.3 0.8 1.2 0.3 95% CI 1.0-5.6 0.8-5.4 0.7-3.3 0.1-1.9 0.3-2.6 0.8-3.6 0.7-2.4 0.3-2.2 0.5 - 2.8 0.0 – 1.5
1 Confidence interval at 95%.
4
The analysis of the data obtained in 2006 shows that the situation is not alarming. Compared with the figures obtained in the previous years, at the same period, it seems that the nutritional status of the IPD population in Gulu has reached a stable phase, and even slightly improved when looking at severe malnutrition. The mortality rates remain as well below the alarm level, which is compatible with the nutrition data. This stabilization goes along with the context analysis: the overall living conditions, food security, access to health and to other humanitarian assistance are similar with the ones observed in the past 2 years in Gulu District. The challenges remain therefore the same to reduce the acute malnutrition rates. The main ones are:
To improve the Child feeding practices: acute malnutrition is significantly higher in children from 6 to 29 months than for the older ones. This reflects the fact that malnutrition is not associated with food availability, but with lactating and weaning practices. Education sessions about this issue are key to address this concern.
To improve food access: the WFP ration provides the theoretical amount of calories, in accordance with the nutriments balance. But food diversity and addition of fresh products are essential to prevent occurrence of type 2 micronutrients deficiencies that are a direct cause of acute malnutrition. Access to the fields and input are therefore to be promoted, but are closely dependant to the security situation.
To improve health access: most part of camps population has access to primarily health services, but some camps remain under served, as shown through the coverage of measles vaccination.
The nutritional status of the population surveyed in the camps is acceptable, but the population in the IDP camps remains highly dependant of the humanitarian assistance. Even if the rates are low, the magnitude of malnutrition is still concern, as is concerned a high number of children. Recommendations Continuation of the therapeutic and supplementary feeding centers activities, and extension of their
coverage if security allows
Continuation of surveillance activities (home visitor program and active case finding in the community).
Strengthening community involvement in prevention activities, such as breast feeding support groups, community based discussion groups and peer to peer learning, promotion of balanced diet and kitchen gardens.
Identification of balanced and accepted diets, distribution of gardens seeds, training on agricultural practices through food security programs
Strengthening of mother and child health activities through the health centers, including activities to encourage early accessing of health services, regular attendance at the health centers for growth monitoring, vaccination and child health screening.
Continuation of nutrition surveillance though annual nutrition surveys, and strengthen the existing surveillance system to identify areas of higher acute malnutrition concentrations and target interventions appropriately
Continue food distribution and monitoring of the food security situation in order to predict and prevent any change in living conditions that could damage the nutrition status of the population.
5

1-Introduction 1.1 Situation The war in Northern Uganda has been ongoing for nineteen years. Initially rooted in a popular rebellion against President Yoweri Museveni’s National Resistance Movement (NRM) government, the conflict has since been transformed by Joseph Kony’s Lord’s Resistance Army (LRA) into a brutally violent war in which civilians in the northern districts are the main victims. Approximately 1.9 million people have been internally displaced. The Acholi region of Uganda (Kitgum, Pader, and Gulu Districts) has seen an increase in the intensity of insurgency since 1996. This has resulted in people moving, spontaneously or under the direction of the Government, into camps protected by the Uganda People’s Defense Forces (UPDF). The conflict in Northern Uganda is often referred to as the forgotten war. Funding for relief and development activities has long not been proportional to needs. In the last one to two years though, an increase in international attention has served to increase the amount of international funds designated to projects in Gulu District, and other districts in Northern Uganda. Besides funding, the major factor restricting relief work in Gulu District is insecurity. Agencies are often unable to reach camps because of insecurity with some camps routinely cut-off from services There are many non-governmental organizations working in Gulu district; Table 3: List of NGOs working in Gulu district and their field of activities Activities NGOs working in Gulu2
Food security WFP, FAO, UNDP, COU, CCF Puena, ACORD, COME, CCF Laroo, CRS, WVI, ACF, CPAR, NRC, CARE, CARITAS, HA, HPI, ACDI/VOCA, ICRC, SOS, GDLG
Health and nutrition
FAO, UNFPA, WFP, WHO, UNICEF, AEI, COME, CPA, FEED, HAU, HA, FASO, UPHOLD, WACRO, ICRC, ACORD, ACF, ACFIC, AMREF, AVSI, CPAR, CARE, CARITAS, CRS, CCF, MSF Swiss, MSF Spain, SCiU, SOS, WVI, GDLG
Water and sanitation AMREF, CARE, UNICEF, MSF Spain, ICRC, ACF, AVSI, WVI, GDLG
Social services UNICEF, FEED, NOAH’S ARK, URCS, ICRC, AVSI, CPAR, NRC, SCIU, SOS, WVI, GDLG
Human rights and protection UNOHCHR, UNICEF, CPA, HURIFO, LAP, ICRC, ACFIC, CARE, NRC, SOS, WCC, WCH, WVI, UHRC, AMNESTY COMMISSION, UNDSS, GDLG
Education and Child Care AEI, UNICEF, CPA, FEED, GUSCO, URCS, UPHOLD, ACFIC, AVSI, CPAR, CARITAS, CCF, NRC, SCIU, SOS, WVI, GDLG
Return and recovery UNDP, WFP, GDNF, GUSCO, NUPI, ACORD, CARE, CRS, MSF Swiss, QPSW, SCIU, SOS, WVI, GDLG, AMNESTY COMMISSION, ARLPI
Coordination OCHA
See annex for Acronyms
ACF-USA has been operational in Gulu District since May 1997 implementing nutrition, food security and water & sanitation programs.
2 OCHA – February 2006
6
Currently ACF-USA supports 16 Supplementary Feeding Centres (SFCs) integrated in the Health Centres spread throughout the District, and one Therapeutic Feeding Centres (TFC), in Gulu Municipality Hospital. A home visiting program has been operational since October 2003, for the active research of the malnutrition cases in the camps. In parallel, the Health Centre staffs have been trained in the prevention and detection of malnutrition for the children coming for health consultation, and health/nutrition education is being provided at the community level by CHW in 9 of the camps. ACF also supports home treatment for severe malnutrition in 6 camps. In 2005, the attendance of each centre was as follow:
SFC: around 14,400 admissions Gulu TFC: around 600 admissions OTP centers: around 500 admissions
General sanitation is poor and it is aggravated by the fact that people live in densely confined areas within the security of the camps. Access to safe water is good; however, the average number of people to a safe water source is much higher than the SPHERE standard of 250 persons per water point. Latrine coverage fluctuates among camps though in general there is need for improved services. This generally poor environmental situation is a cause for concern, especially since morbidity, and then malnutrition, are correlated to quality of water and sanitation facilities. Food eaten in most households is not diverse with most meals composed of World Food Programme (WFP) food rations. WFP has been distributing food aid to the IDP camps in 1996. Plot sizes for agriculture are reducing – current average is estimated at 0.7 acres3 compared to 1.25 acres in 2003 and 2.2 acres in 2002. The majority of the IDP population experiences a hunger gap in May, June, and July due to the cultivation calendar and there is evidence that it has extended into August and beyond for some locations. WFP will decrease rations to 60% in the next months. 1.2 Survey Objectives
To assess the nutritional status of children 6-59 months in IDP camps of Gulu To assess the retrospective mortality To assess the measles immunization and Vitamin A supplementation coverage To assess the feeding practices of children under 6 months.
2- Methodology 2.1 Survey Methodology The assessment was done with the cluster sampling method. The technique is a two stage measuring 30 children in 30 clusters (30 x 30), which allows analyzing the results with a 95% confidence interval. The target population is children 6-59 months. Stage 1- Cluster Selection The cluster is a geographical unit used to divide the population. The smallest geographical unit should be used – here they were IDP camps in Gulu district. Clusters to be surveyed were selected by using the Nutrisurvey. For the survey to be representative of the population, the selection probability of each camp is proportional to its population. The list of clusters selected is available in annex.
3 Action against Hunger food security team estimation
7

Stage 2 – Household Selection Households to be surveyed were selected randomly in each cluster by using the EPI method. At the centre of the identified cluster, a pencil or bottle was set on the ground and spun. The direction to which it pointed determined the direction to be followed by the surveying team. The team walks in the direction indicated by the pen, from the centre to the edge of the village. At the edge of the village spin the bottle again, until it points into the village and walk along this second line counting each house on the way. The first house to be surveyed was randomly chosen, through the use of a bag of random numbers. The main house was use in case of a family having many houses. All the children aged 6-59 months living in the household were included in the nutritional survey. The following house to be surveyed was the door to the right closest to the previously visited house. If the team reached the end of the camp before the sample number was reached, they returned to the center of the camp and repeat the procedure in another direction until the sample was complete. If there was more than one cluster per camp, teams shared the camp in order to avoid overlaps, and moved in different directions. All household selected by the sampling method was also surveyed for the retrospective mortality questionnaire, whether or not they had children eligible for the survey. 2.2 Data collected
1- Anthropometric data
• Age: Registered in months for children 6-59 months; if the mother did not know the exact date birth, then the supervisor tried to remember the season with important events.
• Gender: Female/Male • Weight: Registered in kilograms to the nearest 100g and measured with a Salter Scale. • Height: Measured in cm to the nearest millimeter with a wooden height board. • MUAC: Measured with ACF bracelet on the left arm and in cm to nearest mm. • Edema: The thumb pressure technique for three seconds was implemented bilaterally, beginning
at the feet of surveyed children and moving up towards limbs. • Measles: Recorded according to vaccination card availability. The following code was developed
- (1) if a child has a card and has been vaccinated, (2) if the child has not been vaccinated, and (3) if the caretaker confirms that the vaccine has been received, but has no card to prove it.
• Vitamin A: Recorded as received in the last month. • SFC: if the child is in a supplementary feeding center’s program. If not, then if the child was fitting
the criteria of admission, the team supervision would refer the child to the nearest SFC. Acute malnutrition rates were estimated from the weight for height (WFH) index values combined with the presence of edema for the children 6-59 months measured. The WFH indices are compared with National Center of Health Statistics (NCHS) reference curve, based on a population of healthy children. WFH indices are expressed both in Z-scores and percentage of the median. The expression in Z-scores is statistically reliable for comparisons of different studies. The percentage of the median is more operationally feasible in identifying children who fit the admittance criteria for nutrition programs. Z-score and % median systems do not classify the same children as malnourished4. The guidelines for the results expressed in Z-scores are as follows:
o Severe malnutrition is defined by WFH < -3 SD and/or bilateral edema on the lower limbs o Moderate malnutrition is defined by WFH < -2 SD and ≥ -3 SD and no edema.
4 Prudhon, Claudine. Assessment and Treatment of Malnutrition in Emergency Situation. Action Contre La Faim.
8
o Global acute malnutrition is defined by WFH < -2 SD and/or bilateral edema The guidelines for the results expressed in percentage according to the median of reference:
o Severe malnutrition is defined by WFH < 70 % and/or bilateral edema on the lower limbs o Moderate malnutrition is defined by WFH < 80 % and ≥ 70 % and no edema. o Global acute malnutrition is defined by WFH <80% and/or existing bilateral edema
The measurement of the mid-upper arm circumference (MUAC) is use to as a malnutrition indicator as follows: MUAC < 110 mm severe malnutrition and high risk of mortality MUAC ≥ 110 mm and <120 mm moderate malnutrition and moderate risk of mortality MUAC ≥ 120 mm and <125 mm high risk of malnutrition MUAC ≥ 125 mm and <135 mm moderate risk of malnutrition MUAC ≥ 135 mm "adequate" nutritional status
2- Mortality A 3-month retrospective survey assessed the levels of mortality in communities. Identifying number of household members now and three months ago provided identification of movement in and out of the camps, birth and the deaths that occurred within the last 3 months. The questionnaire was filled even in the houses where no children were eligible for anthropometric measurements. The formula below is applied: Crude Mortality Rate (CMR) = 10,000/a*f/ (b+f/2-e/2+d/2-c/2), where: a = Number of recall days (90) b = Number of current household residents c = Number of people who joined household d = Number of people who left household e = Number of births during recall f = Number of deaths during recall period The result is expressed per 10,000-people / day. 2.3 Data Analysis Data processing and analysis were carried out using Nutrisurvey software for anthropometric and mortality data. Excel program was use for other data. 2.4 Training and supervision 6 teams of 3 were recruited and trained on the objectives of the survey, causes and detection of acute malnutrition, use of the questionnaire, sampling methodology and anthropometric measurements. During the second day of training, the surveyors visited a therapeutic feeding center to learn how to recognize edema and visualize the different types of malnutrition. Then they proceed to the supplementary feeding center to do the measurements test. Unfortunately, due the numbers of people, the surveyor could only take 1 measurement of each child. A practice pilot survey was done on a third day in a camp that was not included in the survey (Unyama). Then, the data were collected at the end of the practice and were entered in Nutrisurvey software, for validation of the measurements taken by each team. The supervision of the field work has been made every day by the project manager and/or the home visiting officer.
9
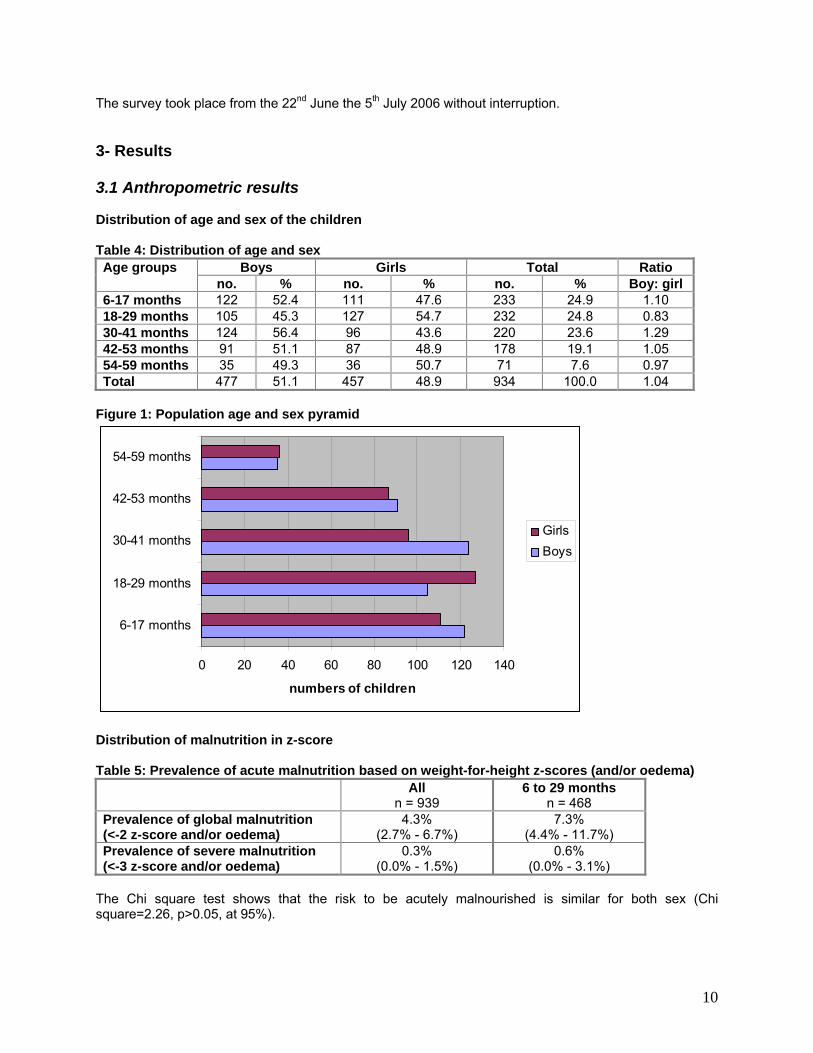
The survey took place from the 22nd June the 5th July 2006 without interruption. 3- Results 3.1 Anthropometric results Distribution of age and sex of the children Table 4: Distribution of age and sex
Boys Girls Total Ratio Age groups no. % no. % no. % Boy: girl
6-17 months 122 52.4 111 47.6 233 24.9 1.10 18-29 months 105 45.3 127 54.7 232 24.8 0.83 30-41 months 124 56.4 96 43.6 220 23.6 1.29 42-53 months 91 51.1 87 48.9 178 19.1 1.05 54-59 months 35 49.3 36 50.7 71 7.6 0.97 Total 477 51.1 457 48.9 934 100.0 1.04
Figure 1: Population age and sex pyramid
0 20 40 60 80 100 120 140
6-17 months
18-29 months
30-41 months
42-53 months
54-59 months
numbers of children
GirlsBoys
Distribution of malnutrition in z-score Table 5: Prevalence of acute malnutrition based on weight-for-height z-scores (and/or oedema) All
n = 939 6 to 29 months
n = 468 Prevalence of global malnutrition (<-2 z-score and/or oedema)
4.3% (2.7% - 6.7%)
7.3% (4.4% - 11.7%)
Prevalence of severe malnutrition (<-3 z-score and/or oedema)
0.3% (0.0% - 1.5%)
0.6% (0.0% - 3.1%)
The Chi square test shows that the risk to be acutely malnourished is similar for both sex (Chi square=2.26, p>0.05, at 95%).
10

An the other hand, the analysis of the malnutrition prevalence per age group reveals that the 6-29 months old present a much higher risk to be malnourished (Chi square= 18.7, Relative risk=5.37, Confidence interval = 2.27– 12.72, at 95%). Figure 2: Z-score distribution weight for height
The mean of the curve is -0.28, and the standard deviation is 0.95 (it should be between 0.80 and 1.10), which shows that the sample is of adequate quality. Table 6: Prevalence of acute malnutrition by age based on weight-for-height z-scores and/or oedema.
Severe wasting (<-3 z-score)
Moderate wasting
(>= -3 and <-2 z-score )
Normal (> = -2 z score) Oedema Age
(months) Total
No. % No. % No. % No. % 6-17 233 0 0.0 20 8.6 212 91.0 1 0.4 18-29 243 1 0.4 11 4.7 219 94.4 1 0.4 30-41 220 0 0.0 5 2.3 215 97.7 0 0.0 42-53 178 0 0.0 1 0.6 177 99.4 0 0.0 54-59 71 0 0.0 0 0.0 71 100.0 0 0.0 Total 939 1 0.1 37 3.9 899 95.7 2 0.2
Table 7: Distribution of acute malnutrition and oedema based on weight-for-height z-scores <-2 z-score >=-2 z-score Oedema present Marasmic kwashiorkor
0 (0.0 %) Kwashiorkor
2 (0.2 %) Oedema absent Marasmic
38 (4.0%) Normal
899 (95.7%)
11
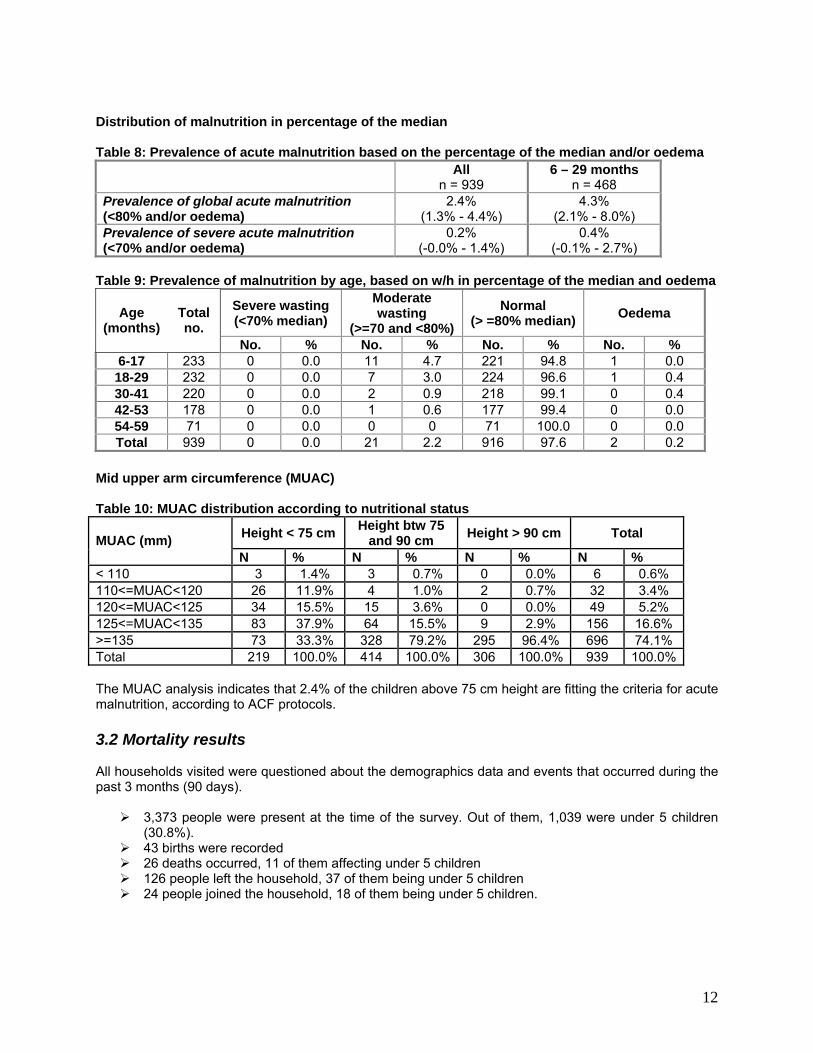
Distribution of malnutrition in percentage of the median Table 8: Prevalence of acute malnutrition based on the percentage of the median and/or oedema All
n = 939 6 – 29 months
n = 468 Prevalence of global acute malnutrition (<80% and/or oedema)
2.4% (1.3% - 4.4%)
4.3% (2.1% - 8.0%)
Prevalence of severe acute malnutrition (<70% and/or oedema)
0.2% (-0.0% - 1.4%)
0.4% (-0.1% - 2.7%)
Table 9: Prevalence of malnutrition by age, based on w/h in percentage of the median and oedema
Severe wasting (<70% median)
Moderate wasting
(>=70 and <80%) Normal
(> =80% median) Oedema Age (months)
Total no.
No. % No. % No. % No. % 6-17 233 0 0.0 11 4.7 221 94.8 1 0.0 18-29 232 0 0.0 7 3.0 224 96.6 1 0.4 30-41 220 0 0.0 2 0.9 218 99.1 0 0.4 42-53 178 0 0.0 1 0.6 177 99.4 0 0.0 54-59 71 0 0.0 0 0 71 100.0 0 0.0 Total 939 0 0.0 21 2.2 916 97.6 2 0.2
Mid upper arm circumference (MUAC) Table 10: MUAC distribution according to nutritional status
Height < 75 cm Height btw 75 and 90 cm Height > 90 cm Total MUAC (mm)
N % N % N % N % < 110 3 1.4% 3 0.7% 0 0.0% 6 0.6% 110<=MUAC<120 26 11.9% 4 1.0% 2 0.7% 32 3.4% 120<=MUAC<125 34 15.5% 15 3.6% 0 0.0% 49 5.2% 125<=MUAC<135 83 37.9% 64 15.5% 9 2.9% 156 16.6% >=135 73 33.3% 328 79.2% 295 96.4% 696 74.1% Total 219 100.0% 414 100.0% 306 100.0% 939 100.0% The MUAC analysis indicates that 2.4% of the children above 75 cm height are fitting the criteria for acute malnutrition, according to ACF protocols. 3.2 Mortality results All households visited were questioned about the demographics data and events that occurred during the past 3 months (90 days).
3,373 people were present at the time of the survey. Out of them, 1,039 were under 5 children (30.8%).
43 births were recorded 26 deaths occurred, 11 of them affecting under 5 children 126 people left the household, 37 of them being under 5 children 24 people joined the household, 18 of them being under 5 children.
12
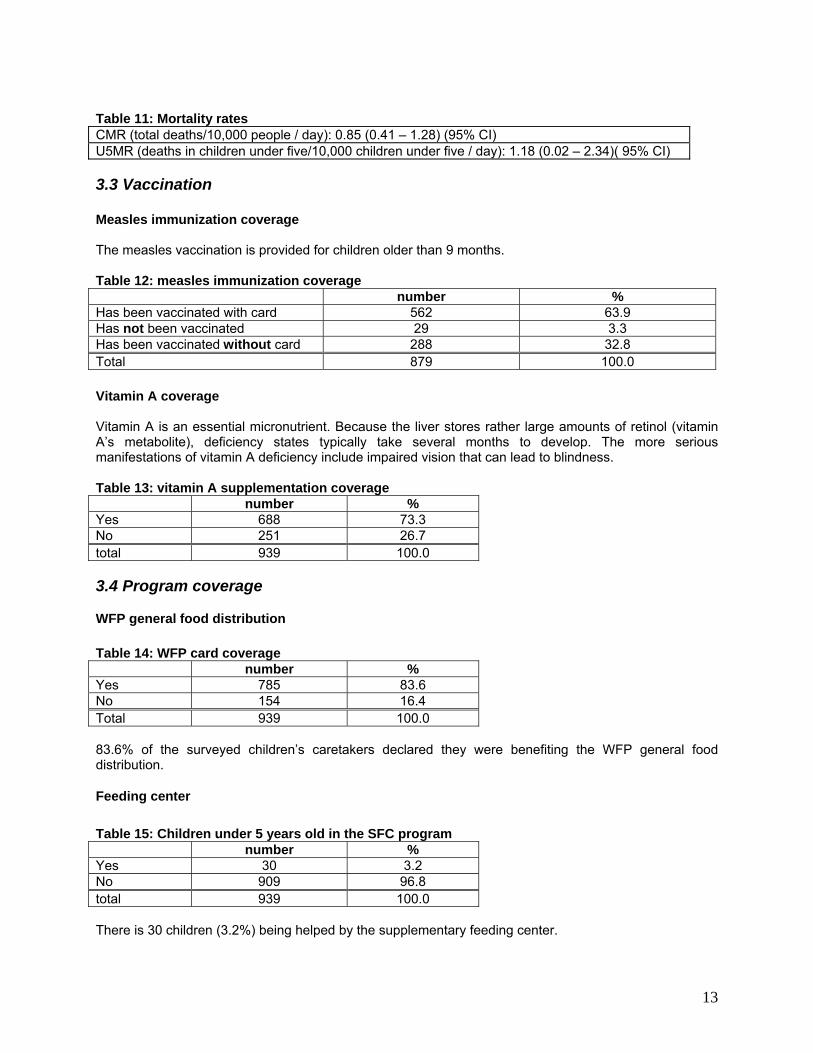
Table 11: Mortality rates CMR (total deaths/10,000 people / day): 0.85 (0.41 – 1.28) (95% CI) U5MR (deaths in children under five/10,000 children under five / day): 1.18 (0.02 – 2.34)( 95% CI) 3.3 Vaccination Measles immunization coverage The measles vaccination is provided for children older than 9 months. Table 12: measles immunization coverage number % Has been vaccinated with card 562 63.9 Has not been vaccinated 29 3.3 Has been vaccinated without card 288 32.8 Total 879 100.0 Vitamin A coverage Vitamin A is an essential micronutrient. Because the liver stores rather large amounts of retinol (vitamin A’s metabolite), deficiency states typically take several months to develop. The more serious manifestations of vitamin A deficiency include impaired vision that can lead to blindness. Table 13: vitamin A supplementation coverage number % Yes 688 73.3 No 251 26.7 total 939 100.0 3.4 Program coverage
WFP general food distribution Table 14: WFP card coverage number % Yes 785 83.6 No 154 16.4 Total 939 100.0 83.6% of the surveyed children’s caretakers declared they were benefiting the WFP general food distribution.
Feeding center Table 15: Children under 5 years old in the SFC program number % Yes 30 3.2 No 909 96.8 total 939 100.0 There is 30 children (3.2%) being helped by the supplementary feeding center.
13

Out of the 939 children included in the survey, there were 43 who fitted the criteria to be admitted in the SFC. Among those 43, there were actually 11 (25.6%) that were attending the program, which shows a low coverage. 4- Discussion This survey is part of a yearly monitoring. The results are displayed below together with the ones of previous years. Table 16: Comparison of ACF surveys, results in Z-scores.
April 98 March 99 March 01 May 03 June 04 June 05 June 06Acute Malnutrition Gulu East
camps Gulu West
camps
Gulu East
camps
Gulu West
camps
Gulu East
camps
Gulu West
camps
Gulu District camps
Gulu District camps
Gulu District camps
Gulu District camps
Global 15.7 11 6.4 4.9 6.7 7.7 6.7 4.5 4.1 4.3 95% CI 11.5-21.2 7.4-16 4.4-9.2 3.1-7.4 4.6-9.5 5.4-10.7 4.6-9.5 3.0-6.8 2.6 - 6.4 2.7-6.7 Severe 2.5 2.3 1.6 0.5 1 1.8 1.3 0.8 1.2 0.3 95% CI 1.0-5.6 0.8-5.4 0.7-3.3 0.1-1.9 0.3-2.6 0.8-3.6 0.7-2.4 0.3-2.2 0.5 - 2.8 0.0 – 1.5
The analysis of the data obtained in 2006 shows that the situation is not alarming. Compared with the figures obtained in the previous years, at the same period, it seems that the nutritional status of the IPD population in Gulu has reached a stable phase, and even slightly improved when looking at severe malnutrition. The mortality rates remain as well below the alarm level, which is compatible with the nutrition data. This stabilization goes along with the context analysis: the overall living conditions, food security, access to health and to other humanitarian assistance are similar with the ones observed in the past 2 years in Gulu District. The challenges remain therefore the same to reduce the acute malnutrition rates. The main ones are:
To improve the Child feeding practices: acute malnutrition is significantly higher in children from 6 to 29 months than for the older ones. This reflects the fact that malnutrition is not associated with food availability, but with lactating and weaning practices. Education sessions about this issue are there key to address this concern.
To improve food access: the WFP ration provides the theoretical amount of calories, in accordance with the nutriments balance. But food diversity and addition of fresh products are essential to prevent occurrence of type 2 micronutrients deficiencies that are a direct cause of acute malnutrition. Access to the fields and input are therefore to be promoted, but are closely dependant to the security situation.
To improve health access: most part of camps population has access to primarily health services, but some camps remain under served, as shown through the coverage of measles vaccination.
The nutritional status of the population surveyed in the camps is acceptable, but the population in the IDP camps remains highly dependant of the humanitarian assistance. Even if the rates are low, the magnitude of malnutrition is still concern, as is concerned a high number of children. Recommendations Continuation of the therapeutic and supplementary feeding centres activities, and extension of their
coverage if security allows
Continuation of surveillance activities (home visitor program and active case finding in the community).
14
Strengthening community involvement in prevention activities, such as breast feeding support groups, community based discussion groups and peer to peer learning, promotion of balanced diet and kitchen gardens.
Identification of balanced and accepted diets, distribution of gardens seeds, training on agricultural practices through food security programs
Strengthening of mother and child health activities through the health centers, including activities to encourage early accessing of health services, regular attendance at the health centers for growth monitoring, vaccination and child health screening.
Continuation of nutrition surveillance though annual nutrition surveys, and strengthen the existing surveillance system to identify areas of higher acute malnutrition concentrations and target interventions appropriately
Continue food distribution and monitoring of the food security situation in order to predict and prevent any change in living conditions that could damage the nutrition status of the population.
Acknowledgments Action Against hunger would like to thank the ministry of health and the DDHS for helping undertaking this nutritional survey. Many thanks to the surveyors, who made this survey possible by their hard and conscientious work. Of course, a gratefully thanks to ACF staff of Gulu base who made all in their power to make this survey a successful one. Appendix
15

Appendix 1: Clusters Assignment of Clusters Geographical unit Population size Assigned cluster Acet 18752 1 Agung 2133 Alero 13025 2 Alokulum 9461 3 Amuru 38153 4, 5, 6 Anaka 22723 7 Aparanga 2280 Atiak 19837 8, 9 Awach 13362 10 Awer 15018 11 Awere 4665 Awor 5349 12 Bibia 5290 Bobi 12094 13 Coo Pe 11049 14 Diino 4662 Jeng Gari 3356 Keyo 4379 15 Koch Goma 11683 16 Koch Ongako 7212 Koro Abili 5643 Lacor 6280 17 Lalogi 13702 18 Lolim 510 Lugore 3542 Odek 2444 Olwal 13088 19 Olwiyo 2201 20 Omee 1 3530 Omee 2 2444 Opit 26888 21, 22 Otong 1424 Pabbo 54621 23, 24, 25, 26 Pagak 7347 Paicho 9213 27 Palaro 3849 Palenga 10626 28 Palukere 693 Parabongo 11561 29 Patiko/Ajulu 8496 30 Pawel 3063 Purongo 7086 Tegot Latoro 392 Tetugu/Koro Lapainat 10095 31 Teya Padola 5716 32 Unyama 12745 33 Wii Anaka 1184 Wii Nono 1166
16
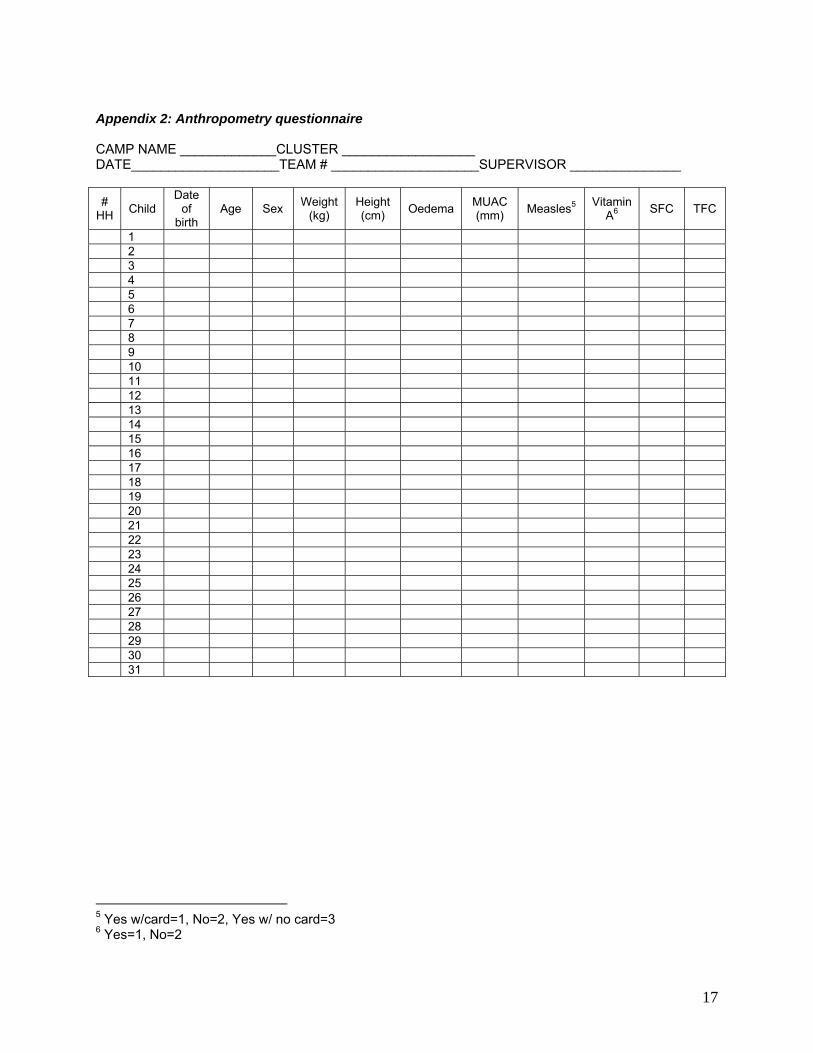
Appendix 2: Anthropometry questionnaire CAMP NAME _____________CLUSTER __________________ DATE____________________TEAM # ____________________SUPERVISOR _______________ #
HH Child Date
of birth
Age Sex Weight (kg)
Height (cm) Oedema MUAC
(mm) Measles5 Vitamin A6 SFC TFC
1 2 3 4 5 6 7 8 9 10 11 12 13 14 15 16 17 18 19 20 21 22 23 24 25 26 27 28 29 30 31
5 Yes w/card=1, No=2, Yes w/ no card=3 6 Yes=1, No=2
17
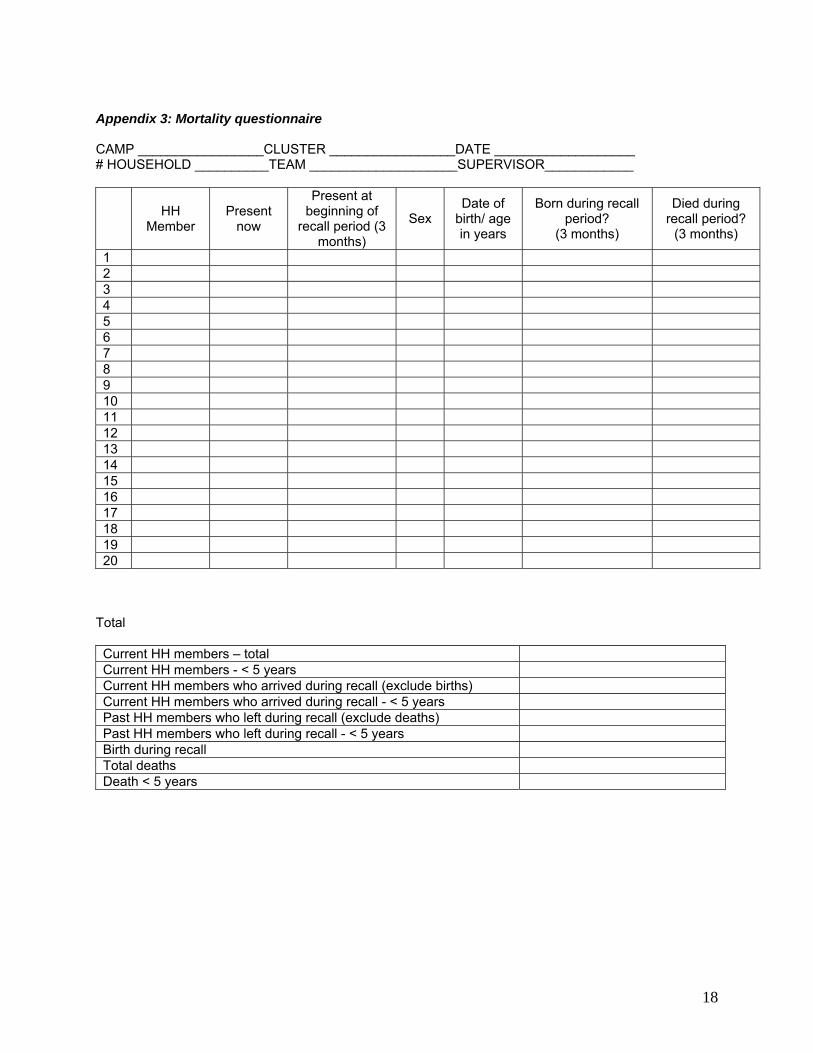
Appendix 3: Mortality questionnaire CAMP _________________CLUSTER _________________DATE ___________________ # HOUSEHOLD __________TEAM ____________________SUPERVISOR____________
HH Member
Present now
Present at beginning of
recall period (3 months)
Sex Date of
birth/ age in years
Born during recall period?
(3 months)
Died during recall period?
(3 months)
1 2 3 4 5 6 7 8 9 10 11 12 13 14 15 16 17 18 19 20
Total Current HH members – total Current HH members - < 5 years Current HH members who arrived during recall (exclude births) Current HH members who arrived during recall - < 5 years Past HH members who left during recall (exclude deaths) Past HH members who left during recall - < 5 years Birth during recall Total deaths Death < 5 years
18
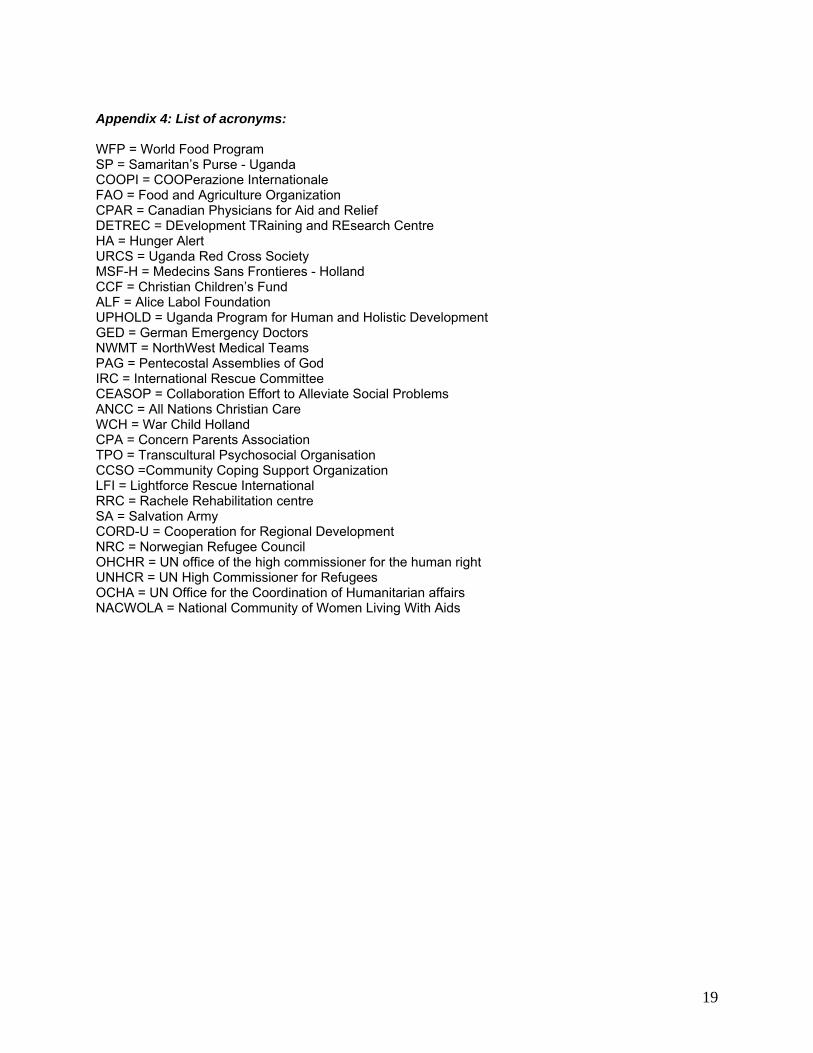
Appendix 4: List of acronyms: WFP = World Food Program SP = Samaritan’s Purse - Uganda COOPI = COOPerazione Internationale FAO = Food and Agriculture Organization CPAR = Canadian Physicians for Aid and Relief DETREC = DEvelopment TRaining and REsearch Centre HA = Hunger Alert URCS = Uganda Red Cross Society MSF-H = Medecins Sans Frontieres - Holland CCF = Christian Children’s Fund ALF = Alice Labol Foundation UPHOLD = Uganda Program for Human and Holistic Development GED = German Emergency Doctors NWMT = NorthWest Medical Teams PAG = Pentecostal Assemblies of God IRC = International Rescue Committee CEASOP = Collaboration Effort to Alleviate Social Problems ANCC = All Nations Christian Care WCH = War Child Holland CPA = Concern Parents Association TPO = Transcultural Psychosocial Organisation CCSO =Community Coping Support Organization LFI = Lightforce Rescue International RRC = Rachele Rehabilitation centre SA = Salvation Army CORD-U = Cooperation for Regional Development NRC = Norwegian Refugee Council OHCHR = UN office of the high commissioner for the human right UNHCR = UN High Commissioner for Refugees OCHA = UN Office for the Coordination of Humanitarian affairs NACWOLA = National Community of Women Living With Aids
19