the genome organization of angiosperms
TRANSCRIPT
Research Signpost 37/661 (2), Fort P.O., Trivandrum-695 023, Kerala, India
Recent Res. Devel. Plant Sci., 3(2005): 129-194 ISBN: 81-7736-245-3
8 The genome organization of angiosperms
Nicolas Carels Laboratório de bioinformática, Universidade Estadual de Santa Cruz – UESC Rod. Ilhéus/Itabuna km 16, Ilhéus, 45650-000 BA, Brazil
Abstract In the present review, the comprehensive picture of vertebrate genome organization that have been obtained over the last 35 years is used to discuss relationships between genome organization and cell function compartmentalization in angiosperms. Variations in genome organization are described with reference to the base composition of coding and non-coding sequences. The genome phenotype resulting from the compositional genome organization constitutes a pattern whose code varies at the taxonomic level corresponding to the family or above. Genus and species do not generally exhibit strong qualitative difference of genome organization. In that
Correspondence/Reprint request: Dr. Nicolas Carels, Laboratório de bioinformática, Universidade Estadual de Santa Cruz − UESC, Rod. Ilhéus/Itabuna km 16, Ilhéus, 45650-000 BA, Brazil E-mail: [email protected]
Nicolas Carels 130
respect, genome phenotype is a tool that may be used to investigate species adaptation and biodiversity at another level than genes since it affect patterns instead of traits. Complexity with concern to gene number, retrotransposon, non-coding DNA, molecular basis of genome plasticity, genome size, isochores, compositional patterns, compositional correlations and compositional transitions are quickly reviewed. Finally, the functional implications of the two classes of genes for plant genome evolution are discussed. 1. The plant genome and genome complexity The term "genome" was created in 1920 by R Hans Winkler, to indicate the set of haploid eukaryote chromosomes. Today, genome is generally considered as the sum of genes and intergenic sequences. The Arabidopsis genome is about 1.2x10⁸ pb while that of maize is 25x108 pb. In contrast, other plant species such as onion may have genome size 150 times larger, or even more (Lilium, 1000 times - Hutchinson et al., 1980). The Arabidopsis gene number was initially estimated to 25,490 and revised to 26,207 with 3,786 pseudogenes in the annotation version 5 (Berardini et al., 2004). Therefore, the basic set of genes is around 30,000 and may vary between 2 or 3 times more due to the polyploidization events that are frequent in plant history. The repertoire of 11,000–15,000 gene families is comparable in number to other sequenced organisms, highlighting the similarity of life’s instructions that stem from our common single-cell ancestors (Borevitz and Hecker, 2004). This suggests that the simplest plant genome had a number of gene families not far from that of humans (where gene number is estimated to be between 36,000 and 60,000 - Kamalay and Goldberg, 1980). Certainly the gene number does not reflect organism complexity. For a given function, plants often contain many more genes than animals (mainly due to polyploidy or large-scale duplication) leading to redundancy in the encoded information (Blanc and Wolfe, 2004). For example, gene number in rice is estimated to be ~43,000 (Miklos and Rubin, 1996) while it would be ~59,000 in maize as a consequence of its tetrapolid origin (Messing et al., 2004). Finally, gene number estimation in plants and in Gramineae, in particular, is a hard job because of significant levels of false positives are detected by in silico procedures (Cruveiller et al., 2003; Carels et al., 2004; Bennetzen et al., 2004a). In Arabidopsis, when more than 10,000 full-length cDNA sequences became available, 32% of the predicted gene models were incorrect (Yamada et al., 2003). On the other hand, small proteins or non-coding genes with non-traditional splice acceptor sites are often missed. The error rate of gene prediction usually ranges between 8% and 32% (Rogic et al., 2001). Each program has more or less bias in different aspects and multiple prediction methods are essential (Shah et al., 2003).
Angiosperm genomics 131
More likely, organism complexity is related to the levels of molecular interactions and regulatory circuitry using a similar genetic parts list. Arabidopsis has a large number of transcription factors (~1500), many of which are in families unique to plants. On the other hand, plants seem to lack many of the transcription factors families found in animals, such as nuclear steroid receptors, for example (Morris and Walker, 2003). The average gene size (exons + introns) in maize and Arabidopsis is about 1.8 kb (Hawkins, 1988; Smyth, 1991; Carels and Bernardi, 2000a). In Arabidopsis that is almost entirely lacking repeated sequences (only 10%), the genome size and the gene number is such that the average intergenic size is about 2.7kb (Carels and Bernardi, 2000b). A corollary of this calculation is that the minimal size of the coding part of the genome should be ~90 Mb. However, plant genomes are usually much larger. This implies that the additional DNA is not strictly necessary to the cell expression (junk DNA). In the human (3x10⁹ bp) as well as in maize (2.5x10⁹ bp) roughly 1% of the genome is devoted to protein coding (Hake and Walbot, 1980). Within the Poaceae family (Gramineae in the old nomenclature) Hordeum vulgare = 5x10⁹ bp, Triticum aestivum = 17x109 bp, Oryza sativa = 0.4x10⁹ bp and Sorghum bicolor = 0.8x10⁹ bp. 1.1. Repeated DNA The DNA fraction that can be attributed to satellite DNA (Heslop-Harrison, 2000; Alkhimova et al., 2004) varies in a large range from species to species; however, it cannot explain the DNA excess (Smyth, 1991) due to junk DNA. The other repeated DNA sequences that form a large genome proportion are interspersed and can be grouped in a limited number of different classes. They are mainly made up of retrotransposons whose amplification mode relies on RNA (class I). Retrotransposons have a large sequence spectrum (<~10 kb) since they encode their own replication and integration machineries (Xiong and Eickbush, 1990). In plants, several retroelements were identified. They belong to the copia and gypsy groups. Based on their structure, the retrotransposons are divided into two groups: those that are flanked by long terminal repeats (LTRs), and non-LTR retrotransposons, or long interspersed nuclear elements (LINEs). LTR retrotransposons are further divided (Doolittle et al., 1989) into the two groups Ty1 or copia (Peterson-Burch and Voytas, 2002), and Ty3 or gypsy. The major structural differences between copia and gypsy groups are in the order of the reverse transcriptase (RT) and integrase domains in their pol genes. In plants, the Ty1/copia elements were first identified as insertions near maize genes, whereas the highly repetitive Ty3/gypsy elements have a preference to insert into or near other repetitive elements (Bennetzen, 1996). Gypsy group elements have similarities to
Nicolas Carels 132
retroviruses. Copia group sequences have been found in diverse species, including single-cell algae, bryophytes, gymnosperms, and angiosperms. Gypsy-like elements have been reported from major taxonomic groups of plants (pine, lily, maize, tomato, pineapple, rice, several angiosperms and gymnosperms; see refs. in Friesen et al., 2001). In addition to these elements, the short interspersed elements (SINEs) are non-autonomous retroposons that also have successfully spread within the genome of almost all eukaryotes. SINEs are ancestrally related to functionally important RNAs, such as tRNA, 5S rRNA and 7SL RNA. They possess an internal promoter that can be recognized by the RNA polymerase III (polIII) enzyme complex, and are usually organized in a monomeric or dimeric structure. Monomeric tRNA-related SINE families are present in the genomes of species from all major eukaryotic lineages and this organization is, by far, the most frequent. These elements are composed of a 5’ tRNA-related region and a central region of unknown origin, followed by a stretch of homopolymeric adenosine residues or other simple repeats with the opposite organization. SINEs likely retropose by target site-primed reverse transcription (TPRT) using the enzymatic machinery of LINEs. PolIII SINE transcription is induced by several cellular stresses such as heat shock, treatment with cycloheximide, DNA-damaging agents and viral infections (see Pélissier et al., 2004 and refs. therein). The dispersion of retrotransposons follows the master sequence model (Deininger et al., 1992; Deragon et al., 1994), i.e. only a small number of loci that match the master sequences are responsible for the amplification of the family, whereas the majority of the members are inactive on the evolutionary time scale. The consensus sequence of each family represents the starting point of the process and is copied in the genome in a great number of inactive retroposons. Each member of the subfamily diverges in agreement with compositional constraints (Paces et al., 2004) after its dispersion from the master sequence. As a result, homogeneous subfamilies are more recent than heterogeneous ones, and the process of retroposition associated to illegitimate recombination (Devos et al., 2002; Ma et al., 2004; Bennetzen et al., 2004b) is a powerful DNA turnover driver for their shuffling. Such pattern of retrotransposons interspertion was described in detail by SanMiguel et al. (1996) in maize and corresponds to selfish DNA (Orgel and Crick, 1980) whose behavior was mathematically modeled (Ohta and Kimura, 1981). The fact that, in maize, DNA reassociation kinetics show that ~80% of that genome is made up of repetitive DNA (with similar results in other grass species) led Flavell et al. (1993) to propose that retransposons are at the base of the genome organization of Gramineae. Later on, retrotransposons were confirmed to represent >50% (~70%) of the genome (SanMiguel et al., 1996; Martienssen et al., 2004). Hake and Walbot (1980) concluded that the genes should occupy
Angiosperm genomics 133
only a small part of the genome (~1%) and scattered among repetitive DNA. This was confirmed by Messing et al., 2004 and Martienssen et al., 2004. In comparison, transposons (class II) such as miniature inverted-repeats (MITEs) (Feschotte et al., 2003; Jiang et al., 2004), Touristes (Bureau and Wessler, 1992; Zhang et al., 2004a), Ac, Dc, Mu, etc. have a low rate of amplification of ~100 copies or so per genome. Their amplification relies on DNA and they are associated to genes. 1.2. Selfish DNA The repeated sequences, which have none or few known functions, form a broad group. They include (i) short segments of non-coding repeated DNA such as those found in the introns, in the gene neighbourhood or that act as gene spacers (Fedoroff, 1979; Alkhimova et al., 2004), (ii) highly repeated sequences and (iii) middle repeated sequences (Dootlittle and Sapienza, 1980). All these repeated sequences were gathered by Orgel and Crick (1980) under the name of selfish DNA, i.e. DNA which does not contribute to the phenotype and which is spread in the genome by formation of additional copies. Middle repeated DNA must be regarded as resulting from transposition activity. Once established inside the genome, transposable elements would be difficult to eliminate and, therefore, dedicated to a prolonged lifespan (Doolittle and Sapienza, 1980). However, it has been shown that under particular conditions, natural selection can reduce genome size very efficiently and if necessary eliminate essentially all non-coding DNA (Beaton and Cavalier-Smith, 1999). As seen above, retroelements have been found in all plants investigated and are very heterogeneous, suggesting that they are an ancient genome component. In addition, the clear monophyletic structure of the phylogenies based on reverse transcriptase gene of gypsy and copia elements suggests that cross-kingdom horizontal transfer has not occurred (Friesen et al., 2001). Variation of the genome size from one species to another is mainly due to the expansion/contraction of high and middle repetitive DNA. LTR retroelement elimination was shown to be involved in genomic contraction in Arabidopsis (Devos et al., 2002) and rice (Ma et al., 2004) leaving solo LTR as a fingerprint of the process. DNA fragment deletions were also documented (Smyth, 1991; Voytas et al., 1990; Bennetzen et al., 2004b); however, it does not lead to such important genome variation. In other species the recombination mechanisms are probably at the base of sequence insertion (Shepherd et al., 1984; Sentry and Smyth, 1985, 1989). A certain proportion of the single copy sequences could be relics of old diverged families of repeated sequences which would have reached a point such that they do not have any more significant homology with others. The amplification events recycle some of these sequences as well as certain members of still recognizable sequence families.

Nicolas Carels 134
The concept of selfish DNA should not be confused with that of junk DNA which is much more reducing (Orgel et al., 1980) and does not bring any positive proposal on possible functions of the supernumerary DNA. The evolution of tandem repeats does not show characteristics of a “molecular clock” with a constant mutation rate. All evidence points to its occurrence in bursts or evolutionary waves, perhaps occurring during periods of rapid speciation or stress (McClintock, 1984). In many species, the distribution of different repetitive DNA sequences closely follows their taxonomic relationships. In addition, transposition is estimated to account for 80% of the mutations detected in Drosophila (Capy, 1998). Transposons can excise, partially or completely restoring gene function, and can also lead to chromosome rearrangements such as inversions or translocations. Transposable elements can also act to move elements such as exons and promoters into existing sequences so as to create new gene functions and contribute to evolution (Plasterck, 1998; Moran et al., 1999). It is clear that middle and high repeated sequences have a regional effect on chromosomal structure (Cavalier-Smith, 2005; Erayman et al., 2004) and therefore on: (i) spacial organization of chromosomes in the nucleus (Thuriaux, 1977; Ferreira et al., 1997; Sadoni et al., 1999; Saccone et al., 2002), (ii) centromer function (Topp et al., 2004; Zhang et al., 2004b) and organization (Heslop-Harrison, 2000, 2003a; Jin et al., 2004; Nagaki et al., 2004), (iii) replication time (Ferreira et al., 1997; Sadoni et al., 1999; Kimura and Horikoshi, 2004), (iv) gene regulation (Vinogradov, 2004) and expression (Lippman et al., 2004), (v) nucleus/cytoplasm ratio (Cavalier-Smith, 2005). These cell functions will be affected by genome size variations through retrotransposition amplification or elimination and are, therefore, under environmental constrains. Ciliate nuclear dimorphism provides a key test that refutes the selfish DNA and strongly supports the nucleus/cytoplasm (skeletal DNA/karyoplasmic) ratio interpretation of genome size evolution (Cavalier-Smith, 2005). The primary driving forces for genome reduction are metabolic, spatial economy and cell multiplication speed. The factors that affect the genome size may also affect the interspecific competition and eventually lead to species extinction (Vinogradov, 2003a). Large variations of DNA content were observed in maize (Biradar et al., 1994). The DNA content has been often correlated with cells features such as nucleus and cell volume, mitotic cycle, meiosis duration, chloroplast number (see in Biradar et al., 1994). These features (nucleotype effects) are not limited to the cell level (Bennett, 1972). They also alter the speed of development, plant size, seed weight, etc. (Bennett, 1987, 1996). The genome size has been correlated with the latitude (Laurie and Bennett, 1985), with the altitude (Rayburn, 1990; Rayburn and Auger, 1990), i.e. length of the vegetative growth (Bullock and Rayburn, 1991;

Angiosperm genomics 135
Graham et al., 1994). Obviously, the correlations are not, a priori, identical in all species (Cavalini and Natali, 1991). This demonstrates the amazing plasticity of the repetitive DNA in plant genomes. DNA amplification may also result from a necessity of chromosome stabilization (Hutchinson et al., 1980). There may be a relationship between genome size and genome complexity in the way non-coding DNA interact with coding DNA (isochore in vertebrates – see Bernardi, 2001 for a review, compositional compartmentalization in plants – Fig. 8) and the cell size diversity related to tissue organization in higher eukaryotes. It is likely that this could be addressed through compositional compartmentalization and skeletal DNA theory (see Cavalier-Smith, 2005 for a review), which establish the relationship between genome size, functionality and the structural role of DNA. 2. The compositional compartmentalization 2.1. The genome of vertebrates 2.1.1. Compositional organization of the human genome Due to the existence of structural and functional interactions between the minority of the coding sequences and the majority of the non-coding sequences, one can view the genome as more than just the sum of its parts, i.e. coding and non-coding DNA. The compositional properties of vertebrate genomes allow description of these interactions. Among these properties, one may distinguish (i) the genome organization of the warm-blooded vertebrates as a mosaic of isochores, (ii) the compositional correlations between coding and non-coding sequences and (iii) the correlation between GC (guanine + cytosine) level of intergenic sequences and gene density (see Bernardi, 2000 for a review). 2.1.2. The isochores During the extraction procedure, DNA breaks in 50 to 200 kb fragments under the effect of the mechanical and enzymatic actions. In practice, to carry out the compositional sorting of the fragments, one proceeds, by isopycnic ultracentrifugation in Cs2SO4 in the presence of a DNA ligand. This ligand, a mercury acetate whose shortened name is BAMD (Zipper et al., 1982), is AT-rich sequence specific. The more a DNA fragment is AT-rich, the more it binds BAMD molecules, and, consequently, the more it is be found towards the bottom of the tube after centrifugation. The compositional fractionation is carried out by harvesting aliquotes by means of a needle penetrating the gradient after centrifugation (Fig. 1). Vertebrate DNA is organized in domains of 0.2-1.3 Mb (Bernardi, 1989; De Sario et al., 1996), of fairly homogeneous base composition (Macaya et al., 1976; Bettecken et al., 1992) following a mosaic pattern (cf Bernardi, 2001 for a review). Because of their fearly homogeneous composition, these domains
Nicolas Carels 136
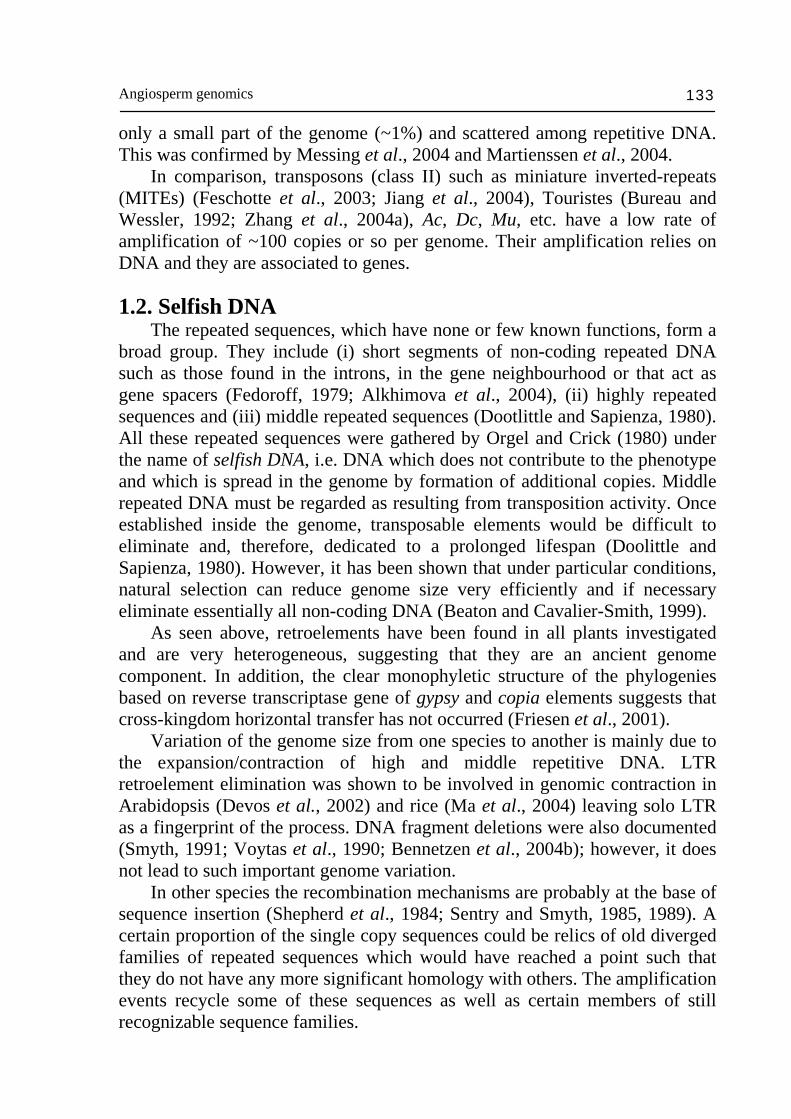
Figure 1. Diagram of the experimental procedure used in the compositional approach to the study of the genome organization in higher eukaryotes. The AT specific ligand BAMD (black triangle) is mixed to the DNA extract and the complex is resolved in compositional fractions by sedimentation in Cs2SO4. After collecting the compositional fractions are characterized for GC level by sedimentation in CsCl or HPLC and investigated by Southern hybridization to understand specificity of sequence location according to regional GC level. were called isochores (Cuny et al., 1981). They were discovered by Filipski et al. (1973) in the cow genome. The fragment size is about one order of magnitude lower than the isochores, so that the majority of the fragments can be classified in their respective isochore family. The fragments that overlap two isochores remain ambiguous to classify, but they are only a minority of the whole (Fig. 2). In the human genome, these isochores can be gathered in a small number of compositional families ranging from 30% to 60% GC (Bernardi, 1985; Bernardi, 2000), each family spread over approximately 5% of GC (Fig. 3). They can be divided into two groups: the first, representing two thirds of the genome, is composed by the L family of isochores (L for low in GC) itself subdivided in two subfamilies L1 and L2; the second includes three GC-rich families (H1, H2 and H3, H for high in GC − Fig. 3). 2.1.3. Compositional patterns The compositional distributions of the (i) ~100 kb DNA fragments, (ii) exons, (iii) introns and (iv) the relationship between these factors constitute a compositional pattern (Bernardi, 1985; Bernardi, 1989; Bernardi, 1993a) that was called genome phenotype. They differ not only between cold-blooded and
Angiosperm genomics 137
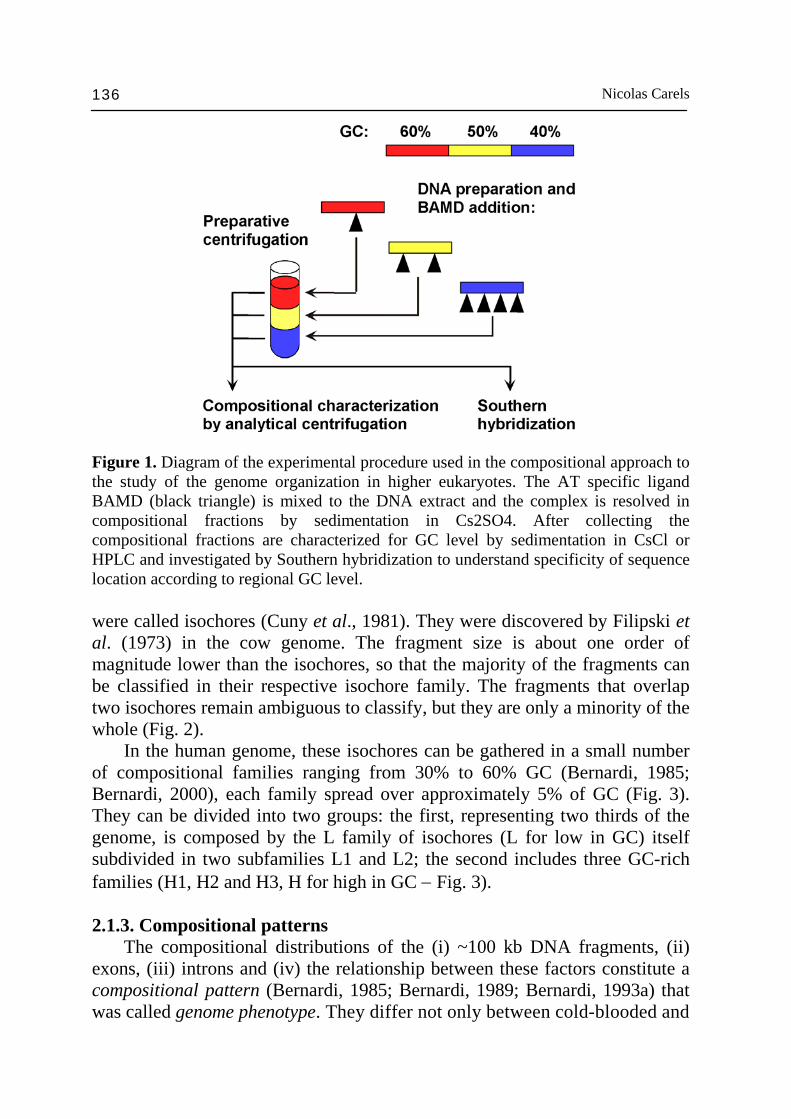
Figure 2. Diagram of the human genome organization. The human genome is made up of a mosaic of DNA segments (>>300 KB) homogeneous in composition (the isochors) that can be divided into GC low (L), rich in GC (H1 and H2), and very rich in GC (H3) families. The isochores are degraded during the DNA preparation in fragments of about 100kb. The range of GC covered by the isochores of the human genome extends from 30% to 60 %. The compositional fractionation is equivalent to a DNA fragment sorting for GC level.
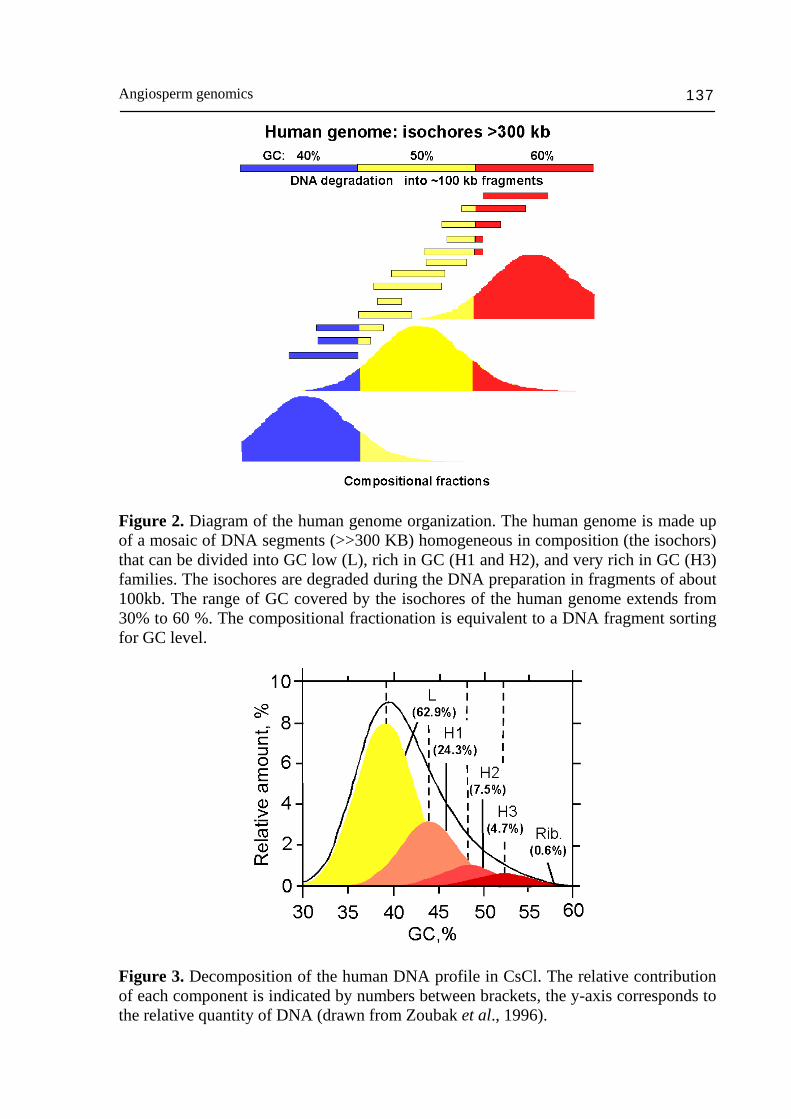
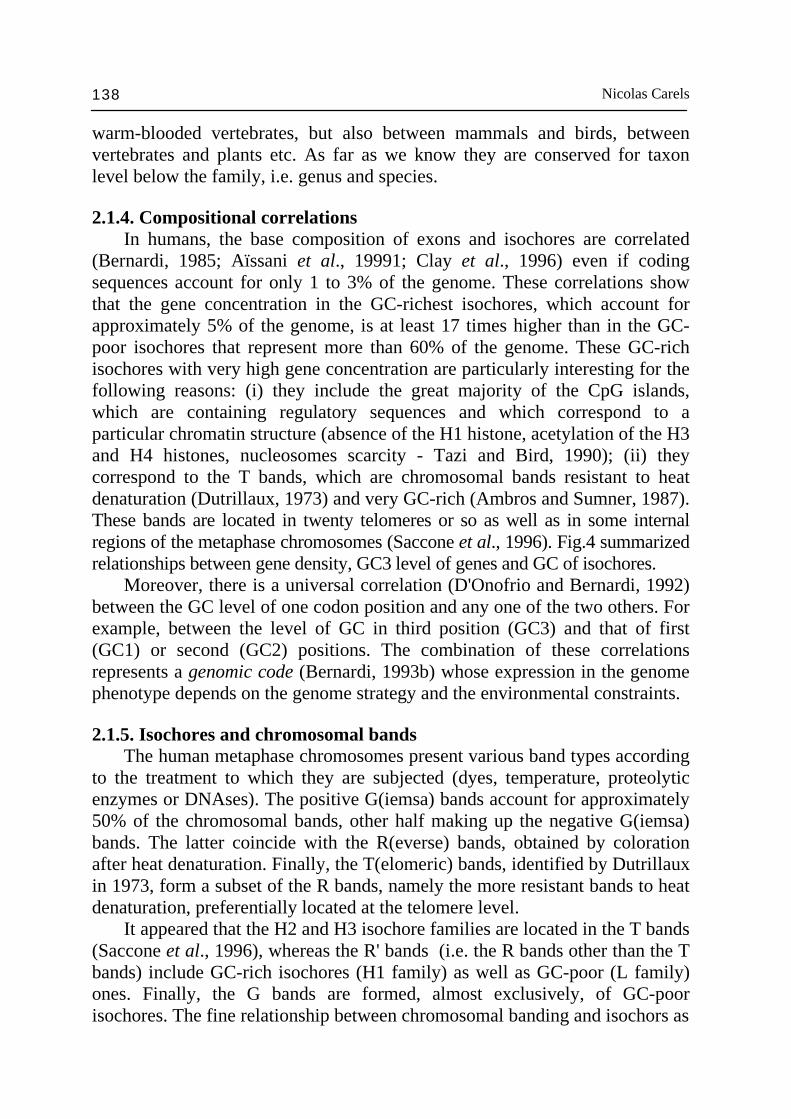
Figure 3. Decomposition of the human DNA profile in CsCl. The relative contribution of each component is indicated by numbers between brackets, the y-axis corresponds to the relative quantity of DNA (drawn from Zoubak et al., 1996).
Nicolas Carels 138
warm-blooded vertebrates, but also between mammals and birds, between vertebrates and plants etc. As far as we know they are conserved for taxon level below the family, i.e. genus and species. 2.1.4. Compositional correlations In humans, the base composition of exons and isochores are correlated (Bernardi, 1985; Aïssani et al., 19991; Clay et al., 1996) even if coding sequences account for only 1 to 3% of the genome. These correlations show that the gene concentration in the GC-richest isochores, which account for approximately 5% of the genome, is at least 17 times higher than in the GC-poor isochores that represent more than 60% of the genome. These GC-rich isochores with very high gene concentration are particularly interesting for the following reasons: (i) they include the great majority of the CpG islands, which are containing regulatory sequences and which correspond to a particular chromatin structure (absence of the H1 histone, acetylation of the H3 and H4 histones, nucleosomes scarcity - Tazi and Bird, 1990); (ii) they correspond to the T bands, which are chromosomal bands resistant to heat denaturation (Dutrillaux, 1973) and very GC-rich (Ambros and Sumner, 1987). These bands are located in twenty telomeres or so as well as in some internal regions of the metaphase chromosomes (Saccone et al., 1996). Fig.4 summarized relationships between gene density, GC3 level of genes and GC of isochores. Moreover, there is a universal correlation (D'Onofrio and Bernardi, 1992) between the GC level of one codon position and any one of the two others. For example, between the level of GC in third position (GC3) and that of first (GC1) or second (GC2) positions. The combination of these correlations represents a genomic code (Bernardi, 1993b) whose expression in the genome phenotype depends on the genome strategy and the environmental constraints. 2.1.5. Isochores and chromosomal bands The human metaphase chromosomes present various band types according to the treatment to which they are subjected (dyes, temperature, proteolytic enzymes or DNAses). The positive G(iemsa) bands account for approximately 50% of the chromosomal bands, other half making up the negative G(iemsa) bands. The latter coincide with the R(everse) bands, obtained by coloration after heat denaturation. Finally, the T(elomeric) bands, identified by Dutrillaux in 1973, form a subset of the R bands, namely the more resistant bands to heat denaturation, preferentially located at the telomere level. It appeared that the H2 and H3 isochore families are located in the T bands (Saccone et al., 1996), whereas the R' bands (i.e. the R bands other than the T bands) include GC-rich isochores (H1 family) as well as GC-poor (L family) ones. Finally, the G bands are formed, almost exclusively, of GC-poor isochores. The fine relationship between chromosomal banding and isochors as
Angiosperm genomics 139
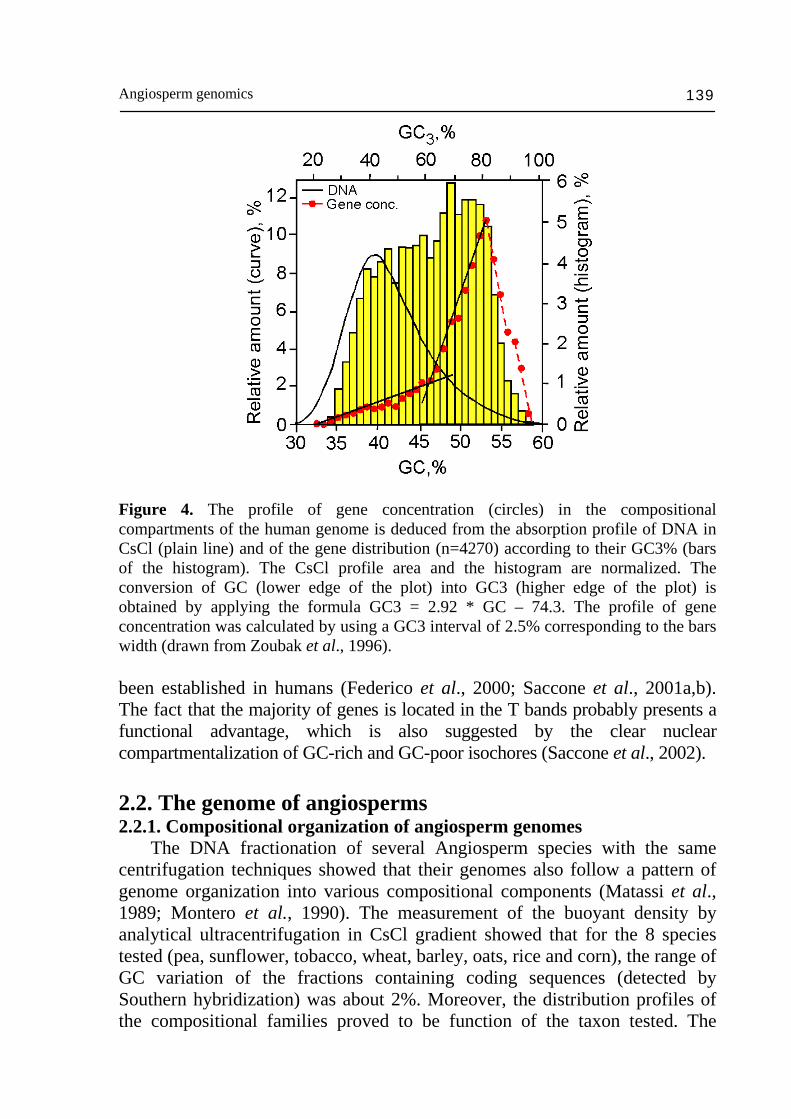
Figure 4. The profile of gene concentration (circles) in the compositional compartments of the human genome is deduced from the absorption profile of DNA in CsCl (plain line) and of the gene distribution (n=4270) according to their GC3% (bars of the histogram). The CsCl profile area and the histogram are normalized. The conversion of GC (lower edge of the plot) into GC3 (higher edge of the plot) is obtained by applying the formula GC3 = 2.92 * GC – 74.3. The profile of gene concentration was calculated by using a GC3 interval of 2.5% corresponding to the bars width (drawn from Zoubak et al., 1996). been established in humans (Federico et al., 2000; Saccone et al., 2001a,b). The fact that the majority of genes is located in the T bands probably presents a functional advantage, which is also suggested by the clear nuclear compartmentalization of GC-rich and GC-poor isochores (Saccone et al., 2002). 2.2. The genome of angiosperms 2.2.1. Compositional organization of angiosperm genomes The DNA fractionation of several Angiosperm species with the same centrifugation techniques showed that their genomes also follow a pattern of genome organization into various compositional components (Matassi et al., 1989; Montero et al., 1990). The measurement of the buoyant density by analytical ultracentrifugation in CsCl gradient showed that for the 8 species tested (pea, sunflower, tobacco, wheat, barley, oats, rice and corn), the range of GC variation of the fractions containing coding sequences (detected by Southern hybridization) was about 2%. Moreover, the distribution profiles of the compositional families proved to be function of the taxon tested. The
Nicolas Carels 140
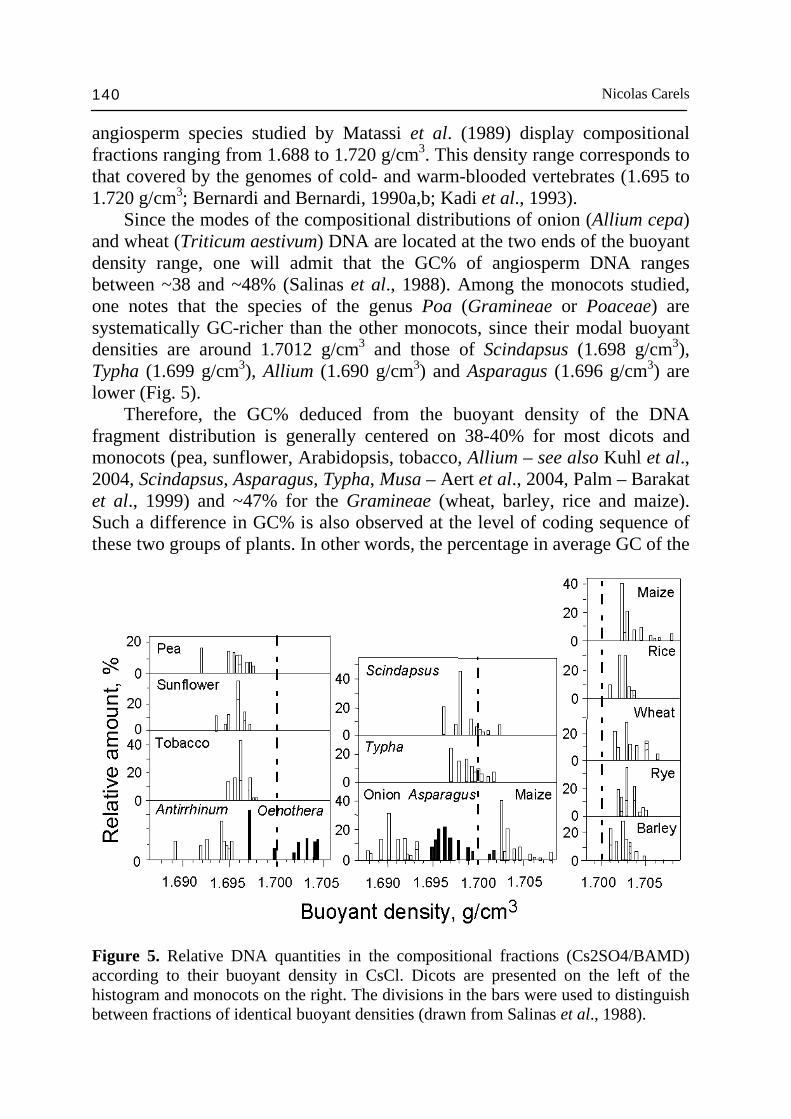
angiosperm species studied by Matassi et al. (1989) display compositional fractions ranging from 1.688 to 1.720 g/cm3. This density range corresponds to that covered by the genomes of cold- and warm-blooded vertebrates (1.695 to 1.720 g/cm3; Bernardi and Bernardi, 1990a,b; Kadi et al., 1993). Since the modes of the compositional distributions of onion (Allium cepa) and wheat (Triticum aestivum) DNA are located at the two ends of the buoyant density range, one will admit that the GC% of angiosperm DNA ranges between ~38 and ~48% (Salinas et al., 1988). Among the monocots studied, one notes that the species of the genus Poa (Gramineae or Poaceae) are systematically GC-richer than the other monocots, since their modal buoyant densities are around 1.7012 g/cm3 and those of Scindapsus (1.698 g/cm3), Typha (1.699 g/cm3), Allium (1.690 g/cm3) and Asparagus (1.696 g/cm3) are lower (Fig. 5). Therefore, the GC% deduced from the buoyant density of the DNA fragment distribution is generally centered on 38-40% for most dicots and monocots (pea, sunflower, Arabidopsis, tobacco, Allium – see also Kuhl et al., 2004, Scindapsus, Asparagus, Typha, Musa – Aert et al., 2004, Palm – Barakat et al., 1999) and ~47% for the Gramineae (wheat, barley, rice and maize). Such a difference in GC% is also observed at the level of coding sequence of these two groups of plants. In other words, the percentage in average GC of the
Figure 5. Relative DNA quantities in the compositional fractions (Cs2SO4/BAMD) according to their buoyant density in CsCl. Dicots are presented on the left of the histogram and monocots on the right. The divisions in the bars were used to distinguish between fractions of identical buoyant densities (drawn from Salinas et al., 1988).
Angiosperm genomics 141
coding sequence of pea, sunflower and tobacco is around 46%, according to the sequences available in GenBank, and their distributions are symmetrically spread out between 30 and 60%. On the other hand, the Gramineae (wheat, barley, rice and maize) have an asymmetrical distribution between 40 and 80 GC%. Similar results, although even more striking, were obtained when analyzing GC3% (Carels et al., 1998). 2.2.2. Methylation Many DNA methylation patterns are established during ontogeny and may remain stable through later development (Jahner and Jaenisch, 1984; Razin and Cedar, 1993; Neves et al., 1995). Studies of floral homeotic mutants (Finnegan et al., 1996; Ronemus et al., 1996) suggest a direct correlation between DNA methylation and normal regulation of developmentally important genes (Jacobsen and Meyerowitz, 1997). Some methylation patterns change during plant development, particularly through meiosis (Silva et al., 1995) and embryogenesis (Castilho et al., 1999). Reduced methylation of tandem DNA repeats in tobacco is maintained during protoplasting and plant regeneration (Bezdek et al., 1991; Koukalova et al., 1994). DNA methyltransferases participate in DNA repair complexes and also stabilize nucleoprotein assemblies required in chromosome inactivation and imprinting. Antibodies to methylcytosine have shown that different regions of chromosomes have different methylation levels both in humans (De Capoa et al., 1995) and plants (Frediani et al., 1996; Oakeley et al., 1997; Siroky et al., 1998; Castilho et al., 1999). Methylation may act as a regulation process of gene expression by switching it on and off (Kinoshita et al., 2004; Oakeley et al., 1997; Xiao et al., 2003). Mutants for methylation were found to have obvious effects on plant development (Finnegan et al., 1996). The DNA methylation levels of animal genomes vary from almost undetectable rates, as in certain insects (Drosophila), to rates of about 8% in certain vertebrates (Shapiro, 1976). In all the cases, more than 95% of the mC are located in CpG (Bonen et al., 1980). The nuclear genome of higher plants is generally even more strongly methylated. The level of mC can reach 30% of the whole cytosines in certain species (Shapiro, 1976). In addition to CpG and CpNpG (Gruenbaum et al., 1981) that are conventional methylation targets, plants DNA sequences as short as 30 base pairs can be targets for methylation in any Cps by RNA-DNA interactions with dsRNAs (Matzke et al., 2004; Zilberman et al., 2004). RNAs produced in the cytoplasm as a consequence of post-transcriptional gene silencing (PTGS) can enter the nucleus and trigger homologous DNA methylation. In some instances of post-transcriptional gene silencing, RNA-directed DNA methylation might be required for initiation or maintenance of silencing, as indicated by the alleviation of post-transcriptional gene silencing in Arabidopsis mutants deficient for DNA methylation (ddm1
Nicolas Carels 142
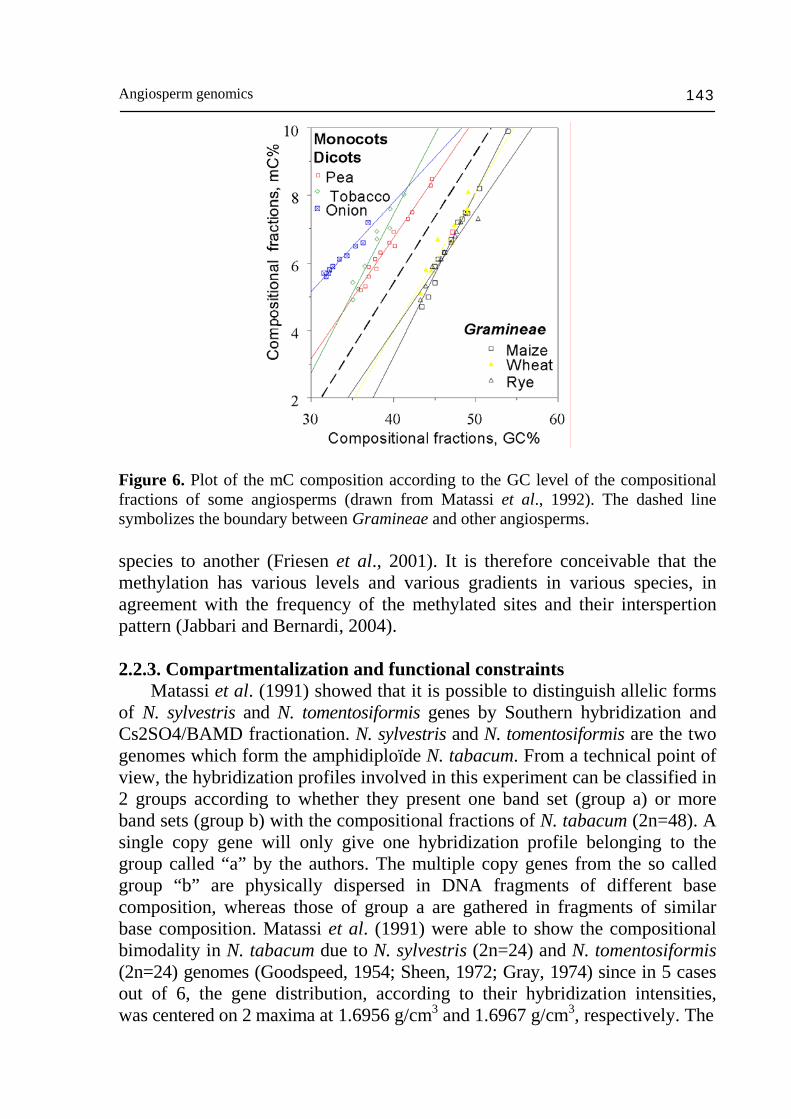
and ddm2/met1). RNA silencing, which is active at different levels of gene expression in the cytoplasm and the nucleus, appears to have evolved to counter the proliferation of foreign sequences, such as transposable elements and viruses, many of which produce dsRNAs during replication. A possible beneficial outcome of faulty host defenses has been the evolution of epigenetic regulatory mechanisms that are required for proper organism development in plants and animals. The insertion of transposable elements into host genes might have rendered them conspicuous to the defense machinery with the putative consequence for the host genes to be regulated by the type of epigenetic mechanism used to silence foreign sequences (see Matzke et al., 2004 for a review). As seen above, the range of genome size covered by plant species is very large: 0.1 pg for Arabidopsis, and up to 33.5 pg in the case of onion (Bennett and Smith, 1991). The GC % varies between 35% and 48%, whereas the levels of mC varies between 2% for Brassica oleifera (Vanyushin and Belozerskii, 1959) to 10% for rye (Thomas and Sherratt, 1956; Shapiro, 1976; Wagner and Capesius, 1981; Leutwiler et al., 1984; Morrish and Vasil, 1989; Palmgren et al., 1990). The mC/(mC+C) ratio varies in a larger range from 6,3% (Arabidopsis) to 33% (rye). Thus, the mC/(mC+C) ratio is a more sensitive estimator than the mC % with concern to the total nucleotide contents. The mC level of compositional fractions strongly depends on their GC level (Matassi et al., 1992). The relationship between methylation and GC levels was also studied by comparing the ratio of mC/(mC+C) with the GC % of compositional fractions (Matassi et al., 1992). In all the cases, the relationship proved to be linear and demonstrated coefficients of correlation varying between 0,88 (rye) and 0,98 (pea), so that the rates of mC and mC/(mC+C) increase regularly from GC-poor to GC-rich fractions. The onion DNA has the lower regression line slope. Dicots form a beam of more or less similar slopes (except for tobacco whose slope is slightly higher) and parallel with those of Gramineae (Fig. 6). The correlation between C and mC can seems trivial due to the fact that the DNA methylation affect CpG doublets, CpNpG triplets and that these sites increase statistically with the GC level. Actually, the whole picture presented here shows that methylation is species specific. For example, a methylation level of 35% in mC/(mC+C) is found in DNA fragments having a GC level of ~32% in onion, 39% in tobacco, 41% in pea and 54% in maize. The level of methylation of ~100 kb DNA fragments does not depend, therefore, only on their GC level, but also on the sequence types that make them up. One can draw from these observations two considerations. On the one hand, in large plant genomes, methylation essentially concerning the inter-genic sequences (Martienssen and Colot, 2001; Rabinowicz et al., 2003c). On the other hand, the intergenic sequences are essentially made up of repeated sequences, whose relative frequency and organization differ from one
Angiosperm genomics 143
Figure 6. Plot of the mC composition according to the GC level of the compositional fractions of some angiosperms (drawn from Matassi et al., 1992). The dashed line symbolizes the boundary between Gramineae and other angiosperms. species to another (Friesen et al., 2001). It is therefore conceivable that the methylation has various levels and various gradients in various species, in agreement with the frequency of the methylated sites and their interspertion pattern (Jabbari and Bernardi, 2004). 2.2.3. Compartmentalization and functional constraints Matassi et al. (1991) showed that it is possible to distinguish allelic forms of N. sylvestris and N. tomentosiformis genes by Southern hybridization and Cs2SO4/BAMD fractionation. N. sylvestris and N. tomentosiformis are the two genomes which form the amphidiploïde N. tabacum. From a technical point of view, the hybridization profiles involved in this experiment can be classified in 2 groups according to whether they present one band set (group a) or more band sets (group b) with the compositional fractions of N. tabacum (2n=48). A single copy gene will only give one hybridization profile belonging to the group called “a” by the authors. The multiple copy genes from the so called group “b” are physically dispersed in DNA fragments of different base composition, whereas those of group a are gathered in fragments of similar base composition. Matassi et al. (1991) were able to show the compositional bimodality in N. tabacum due to N. sylvestris (2n=24) and N. tomentosiformis (2n=24) genomes (Goodspeed, 1954; Sheen, 1972; Gray, 1974) since in 5 cases out of 6, the gene distribution, according to their hybridization intensities, was centered on 2 maxima at 1.6956 g/cm3 and 1.6967 g/cm3, respectively. The
Nicolas Carels 144
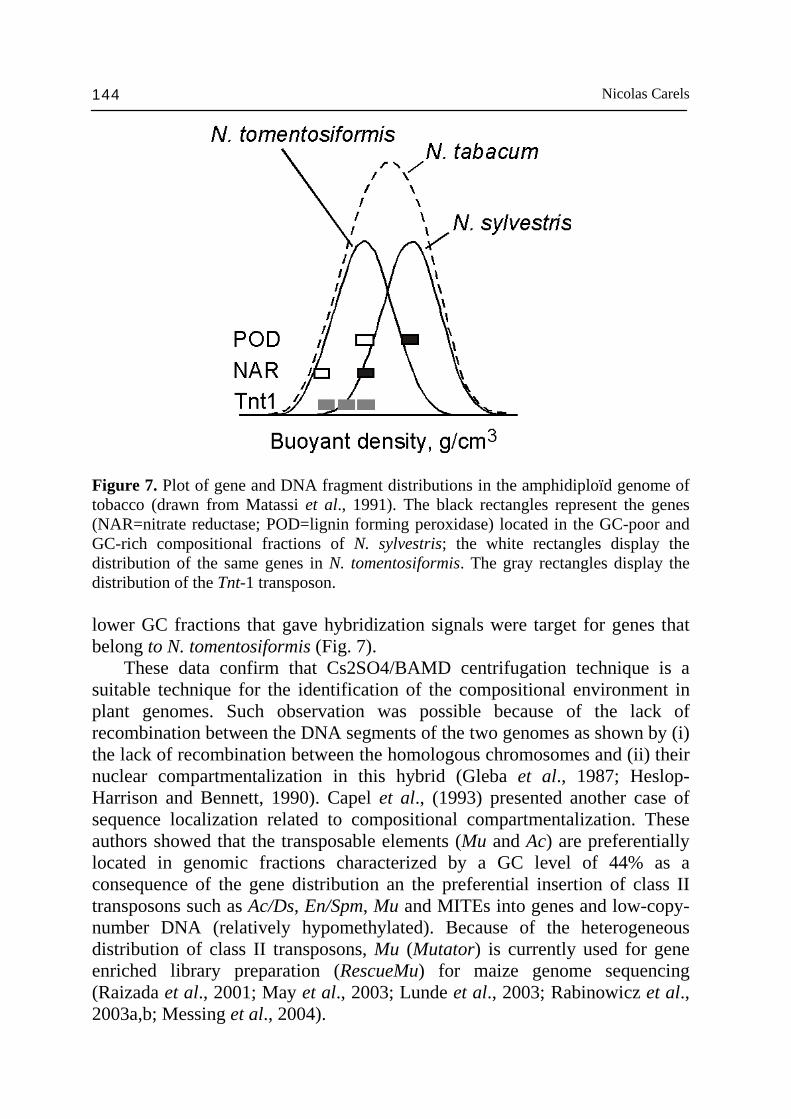
Figure 7. Plot of gene and DNA fragment distributions in the amphidiploïd genome of tobacco (drawn from Matassi et al., 1991). The black rectangles represent the genes (NAR=nitrate reductase; POD=lignin forming peroxidase) located in the GC-poor and GC-rich compositional fractions of N. sylvestris; the white rectangles display the distribution of the same genes in N. tomentosiformis. The gray rectangles display the distribution of the Tnt-1 transposon. lower GC fractions that gave hybridization signals were target for genes that belong to N. tomentosiformis (Fig. 7). These data confirm that Cs2SO4/BAMD centrifugation technique is a suitable technique for the identification of the compositional environment in plant genomes. Such observation was possible because of the lack of recombination between the DNA segments of the two genomes as shown by (i) the lack of recombination between the homologous chromosomes and (ii) their nuclear compartmentalization in this hybrid (Gleba et al., 1987; Heslop-Harrison and Bennett, 1990). Capel et al., (1993) presented another case of sequence localization related to compositional compartmentalization. These authors showed that the transposable elements (Mu and Ac) are preferentially located in genomic fractions characterized by a GC level of 44% as a consequence of the gene distribution an the preferential insertion of class II transposons such as Ac/Ds, En/Spm, Mu and MITEs into genes and low-copy-number DNA (relatively hypomethylated). Because of the heterogeneous distribution of class II transposons, Mu (Mutator) is currently used for gene enriched library preparation (RescueMu) for maize genome sequencing (Raizada et al., 2001; May et al., 2003; Lunde et al., 2003; Rabinowicz et al., 2003a,b; Messing et al., 2004).
Angiosperm genomics 145
2.2.4. The gene space In 1989, Matassi et al. showed that correlations could be established between the GC% of (i) CDS in the various codon positions, (ii) CDS and introns and (iii) the CDS and the flanking sequences. However, because of data limitation in GenBank at that time, dicot genes were gathered with those of Gramineae. Implicitly, the authors regarded angiosperms as a "super-genome", which led to wrong conclusions regarding point “iii” (see below). They emphasize the same tendency as those observed with vertebrates. Apart from the interest to consider angiosperms as a single “super-genome” this study showed that, as in vertebrates, the coding sequences are systematically GC-richer than the introns and the surrounding non-coding sequences. Later on, it was shown that non-storage protein genes are preferentially found in ~100 kb DNA fragments with GC levels above the average GC% of the whole maize genome (Carels et al., 1995), within a range of GC variation far smaller than that of warm-blooded vertebrates. In contrast, storage protein genes were generally found in compositional compartments of lower GC level. The mosaic distribution pattern of gene islands in the so-called gene space was later confirmed in Gramineae by other authors (Fu et al., 2002; Sandhu and Gill, 2002; Whitelaw et al., 2003; Messing et al., 2004; Erayman et al., 2004). Because the maize genome is composed of at least 80% of highly repetitive sequences, the current sequencing effort (Whitelaw et al., 2003; Martienssen et al., 2004) is based on the sequencing of gene rich fragments by methylation filtering (Rabinowicz, 2003a,b; Palmer et al., 2004) and DNA renaturation with High-Cot DNA (Yuan et al., 2003). This strategy led to bias in the sequence distribution of the ~100 kb DNA fragments to those containing genes. When comparing this distribution (Fig. 8B) to the distribution of the complete set of DNA fragments in the same size range (Fig. 8A), we found that it overlaps the gene space as previously published (Carels et al., 1995). By subtraction, it also shows that vast portions of the maize genome do not have protein coding potential other than that of retrotransposon origin. The gene enrichment strategy of the maize genome sequencing effort led to increased resolution of the gene space complexity. It was found that maize genes are distributed in a compositional interval ~10 times narrower than that of humans. The maize gene space was set to ~4-6% GC (Fig. 8), i.e. covering a compositional range corresponding to one human isochore family. This interval corresponds to a gene space of ~40%. However, this is a maximum value since it appeared that 85% of the genes were found in a ~4% GC interval (see below). The interesting feature is that the compositional heterogeneity in the 3rd codon position is as large in maize as in humans. However, the slope of the regression line (Fig. 8c) of the correlation between GC3% and GC% of ~100 kb fragments is two times larger in maize than in humans. This led to consider that the maize gene space is made up of two compositional compartments (Carles, 2005) in
Nicolas Carels 146
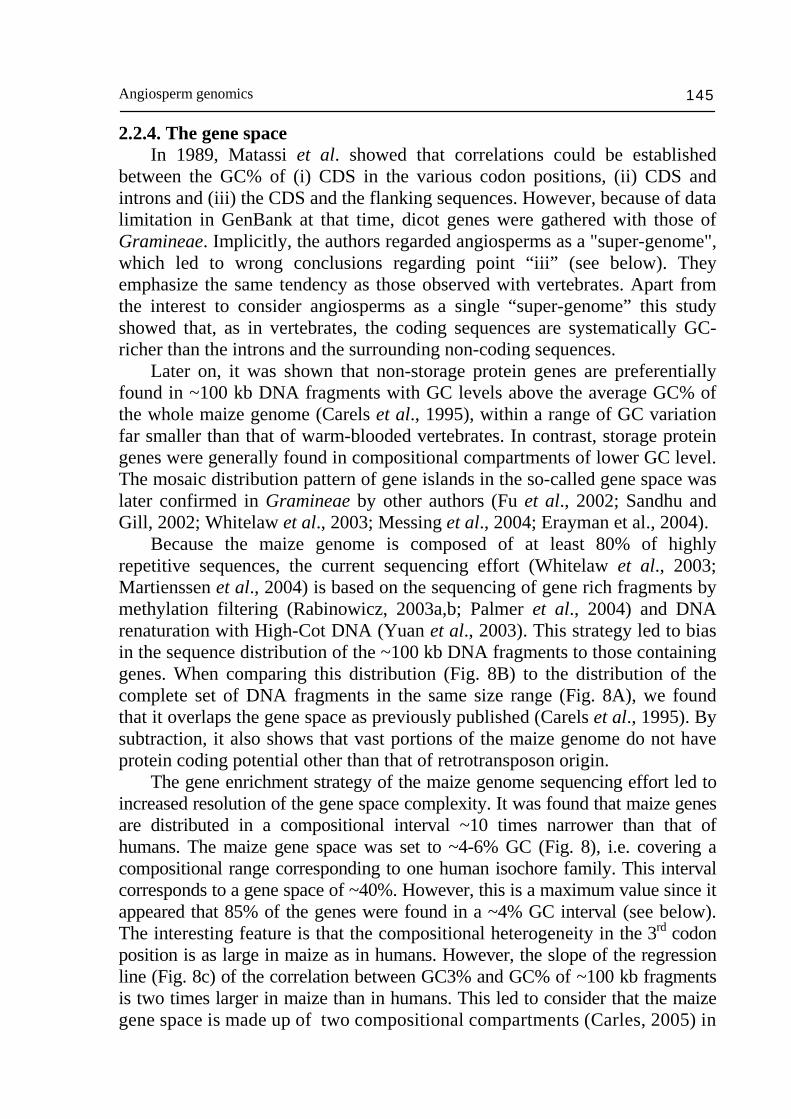
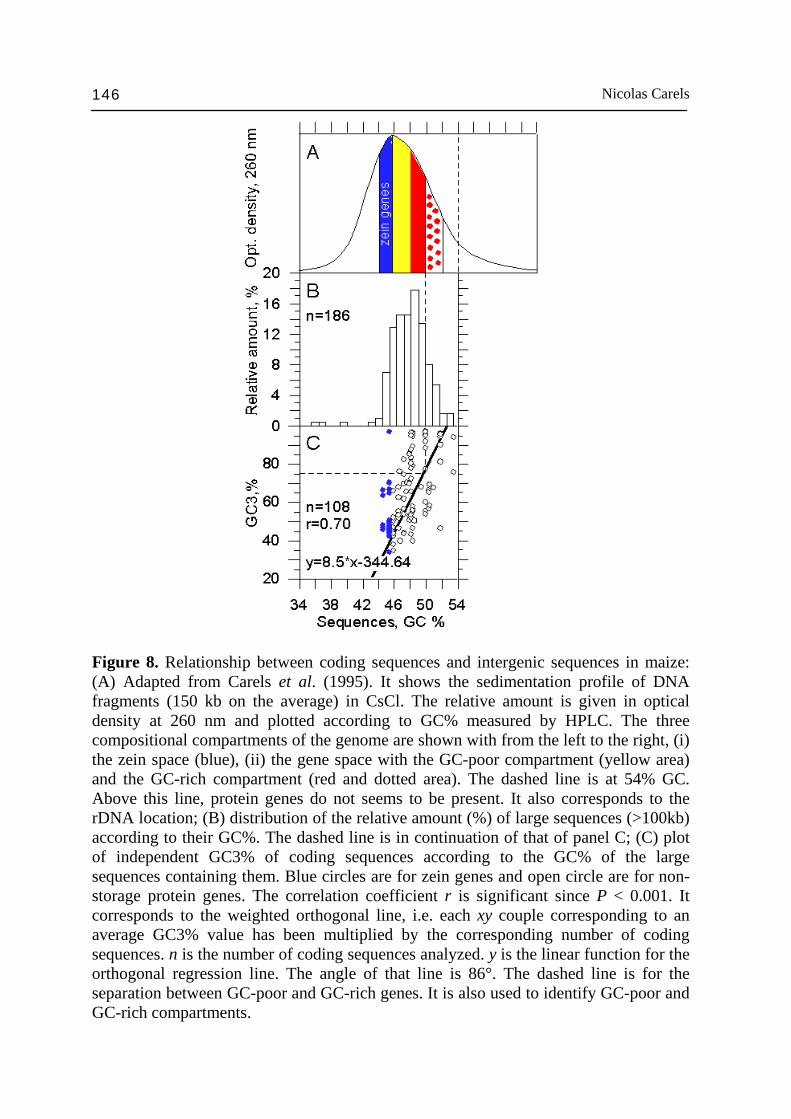
Figure 8. Relationship between coding sequences and intergenic sequences in maize: (A) Adapted from Carels et al. (1995). It shows the sedimentation profile of DNA fragments (150 kb on the average) in CsCl. The relative amount is given in optical density at 260 nm and plotted according to GC% measured by HPLC. The three compositional compartments of the genome are shown with from the left to the right, (i) the zein space (blue), (ii) the gene space with the GC-poor compartment (yellow area) and the GC-rich compartment (red and dotted area). The dashed line is at 54% GC. Above this line, protein genes do not seems to be present. It also corresponds to the rDNA location; (B) distribution of the relative amount (%) of large sequences (>100kb) according to their GC%. The dashed line is in continuation of that of panel C; (C) plot of independent GC3% of coding sequences according to the GC% of the large sequences containing them. Blue circles are for zein genes and open circle are for non-storage protein genes. The correlation coefficient r is significant since P < 0.001. It corresponds to the weighted orthogonal line, i.e. each xy couple corresponding to an average GC3% value has been multiplied by the corresponding number of coding sequences. n is the number of coding sequences analyzed. y is the linear function for the orthogonal regression line. The angle of that line is 86°. The dashed line is for the separation between GC-poor and GC-rich genes. It is also used to identify GC-poor and GC-rich compartments.
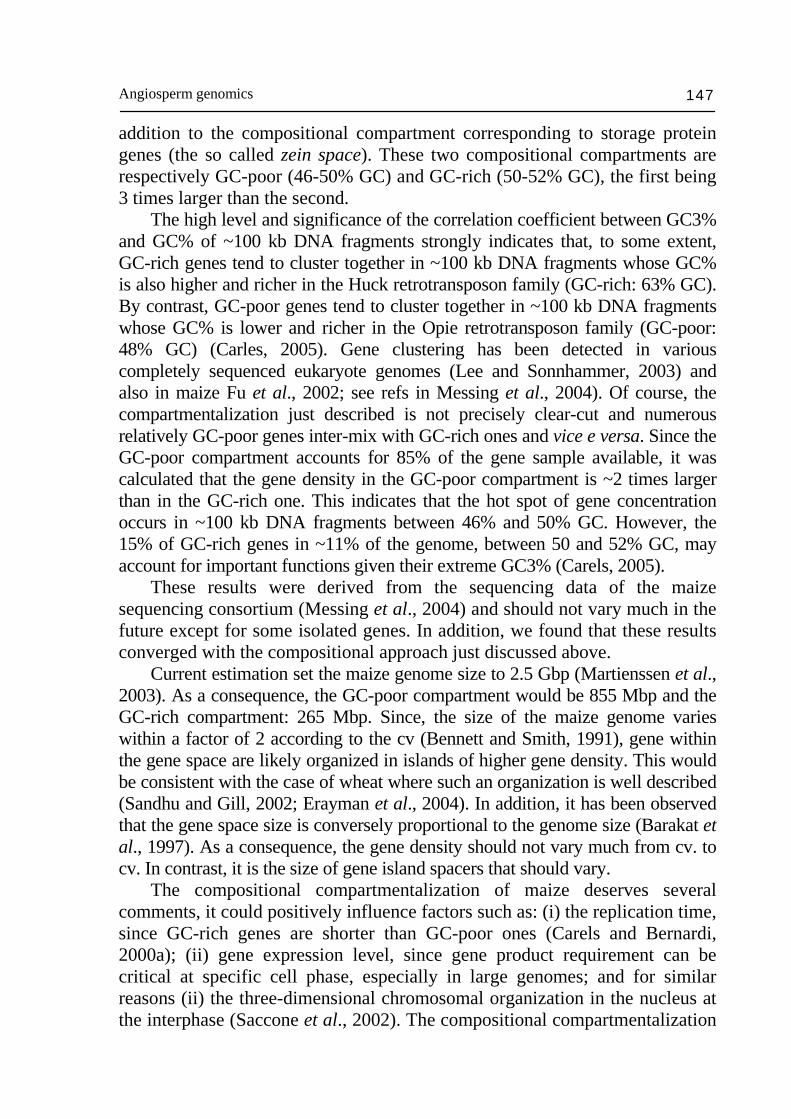
Angiosperm genomics 147
addition to the compositional compartment corresponding to storage protein genes (the so called zein space). These two compositional compartments are respectively GC-poor (46-50% GC) and GC-rich (50-52% GC), the first being 3 times larger than the second. The high level and significance of the correlation coefficient between GC3% and GC% of ~100 kb DNA fragments strongly indicates that, to some extent, GC-rich genes tend to cluster together in ~100 kb DNA fragments whose GC% is also higher and richer in the Huck retrotransposon family (GC-rich: 63% GC). By contrast, GC-poor genes tend to cluster together in ~100 kb DNA fragments whose GC% is lower and richer in the Opie retrotransposon family (GC-poor: 48% GC) (Carles, 2005). Gene clustering has been detected in various completely sequenced eukaryote genomes (Lee and Sonnhammer, 2003) and also in maize Fu et al., 2002; see refs in Messing et al., 2004). Of course, the compartmentalization just described is not precisely clear-cut and numerous relatively GC-poor genes inter-mix with GC-rich ones and vice e versa. Since the GC-poor compartment accounts for 85% of the gene sample available, it was calculated that the gene density in the GC-poor compartment is ~2 times larger than in the GC-rich one. This indicates that the hot spot of gene concentration occurs in ~100 kb DNA fragments between 46% and 50% GC. However, the 15% of GC-rich genes in ~11% of the genome, between 50 and 52% GC, may account for important functions given their extreme GC3% (Carels, 2005). These results were derived from the sequencing data of the maize sequencing consortium (Messing et al., 2004) and should not vary much in the future except for some isolated genes. In addition, we found that these results converged with the compositional approach just discussed above. Current estimation set the maize genome size to 2.5 Gbp (Martienssen et al., 2003). As a consequence, the GC-poor compartment would be 855 Mbp and the GC-rich compartment: 265 Mbp. Since, the size of the maize genome varies within a factor of 2 according to the cv (Bennett and Smith, 1991), gene within the gene space are likely organized in islands of higher gene density. This would be consistent with the case of wheat where such an organization is well described (Sandhu and Gill, 2002; Erayman et al., 2004). In addition, it has been observed that the gene space size is conversely proportional to the genome size (Barakat et al., 1997). As a consequence, the gene density should not vary much from cv. to cv. In contrast, it is the size of gene island spacers that should vary. The compositional compartmentalization of maize deserves several comments, it could positively influence factors such as: (i) the replication time, since GC-rich genes are shorter than GC-poor ones (Carels and Bernardi, 2000a); (ii) gene expression level, since gene product requirement can be critical at specific cell phase, especially in large genomes; and for similar reasons (ii) the three-dimensional chromosomal organization in the nucleus at the interphase (Saccone et al., 2002). The compositional compartmentalization
Nicolas Carels 148
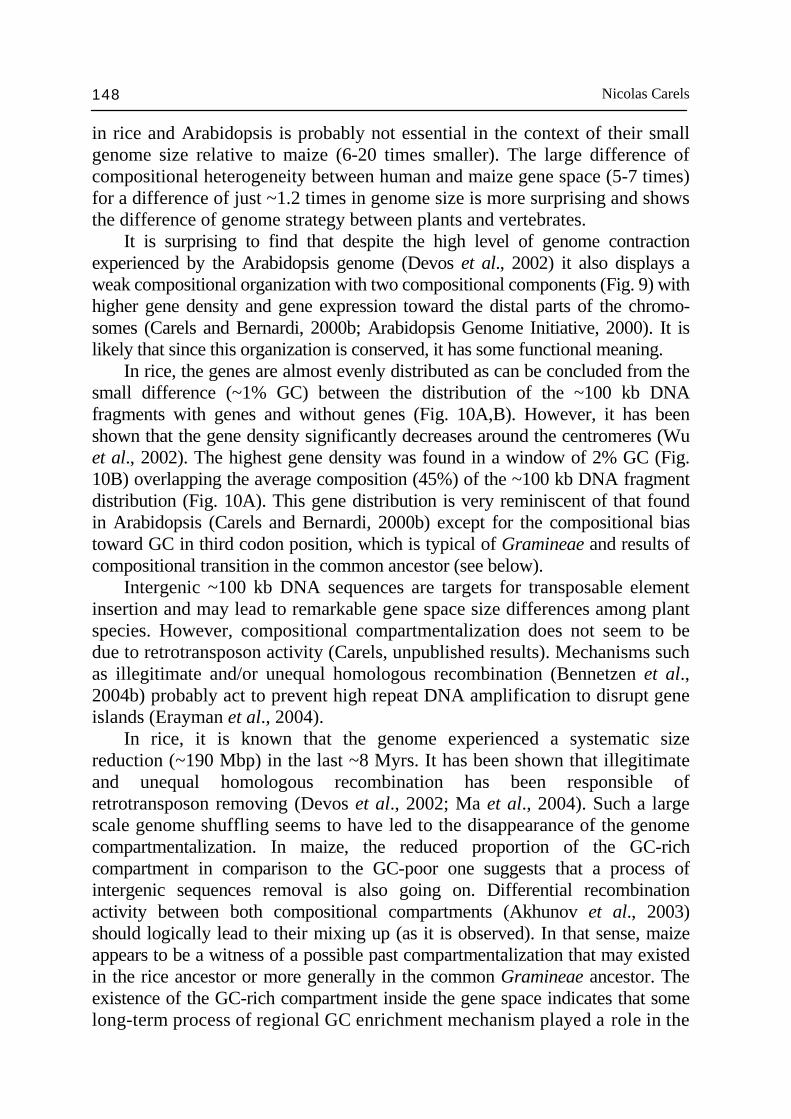
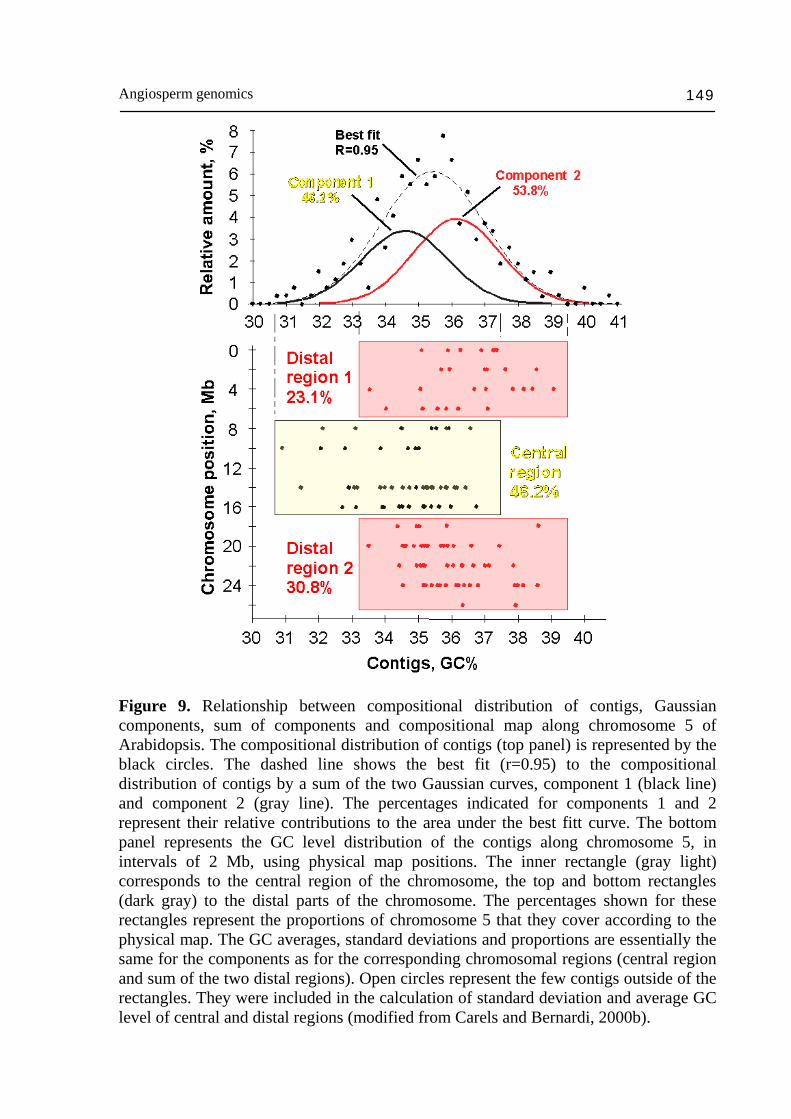
in rice and Arabidopsis is probably not essential in the context of their small genome size relative to maize (6-20 times smaller). The large difference of compositional heterogeneity between human and maize gene space (5-7 times) for a difference of just ~1.2 times in genome size is more surprising and shows the difference of genome strategy between plants and vertebrates. It is surprising to find that despite the high level of genome contraction experienced by the Arabidopsis genome (Devos et al., 2002) it also displays a weak compositional organization with two compositional components (Fig. 9) with higher gene density and gene expression toward the distal parts of the chromo-somes (Carels and Bernardi, 2000b; Arabidopsis Genome Initiative, 2000). It is likely that since this organization is conserved, it has some functional meaning. In rice, the genes are almost evenly distributed as can be concluded from the small difference (~1% GC) between the distribution of the ~100 kb DNA fragments with genes and without genes (Fig. 10A,B). However, it has been shown that the gene density significantly decreases around the centromeres (Wu et al., 2002). The highest gene density was found in a window of 2% GC (Fig. 10B) overlapping the average composition (45%) of the ~100 kb DNA fragment distribution (Fig. 10A). This gene distribution is very reminiscent of that found in Arabidopsis (Carels and Bernardi, 2000b) except for the compositional bias toward GC in third codon position, which is typical of Gramineae and results of compositional transition in the common ancestor (see below). Intergenic ~100 kb DNA sequences are targets for transposable element insertion and may lead to remarkable gene space size differences among plant species. However, compositional compartmentalization does not seem to be due to retrotransposon activity (Carels, unpublished results). Mechanisms such as illegitimate and/or unequal homologous recombination (Bennetzen et al., 2004b) probably act to prevent high repeat DNA amplification to disrupt gene islands (Erayman et al., 2004). In rice, it is known that the genome experienced a systematic size reduction (~190 Mbp) in the last ~8 Myrs. It has been shown that illegitimate and unequal homologous recombination has been responsible of retrotransposon removing (Devos et al., 2002; Ma et al., 2004). Such a large scale genome shuffling seems to have led to the disappearance of the genome compartmentalization. In maize, the reduced proportion of the GC-rich compartment in comparison to the GC-poor one suggests that a process of intergenic sequences removal is also going on. Differential recombination activity between both compositional compartments (Akhunov et al., 2003) should logically lead to their mixing up (as it is observed). In that sense, maize appears to be a witness of a possible past compartmentalization that may existed in the rice ancestor or more generally in the common Gramineae ancestor. The existence of the GC-rich compartment inside the gene space indicates that some long-term process of regional GC enrichment mechanism played a role in the
Angiosperm genomics 149
Figure 9. Relationship between compositional distribution of contigs, Gaussian components, sum of components and compositional map along chromosome 5 of Arabidopsis. The compositional distribution of contigs (top panel) is represented by the black circles. The dashed line shows the best fit (r=0.95) to the compositional distribution of contigs by a sum of the two Gaussian curves, component 1 (black line) and component 2 (gray line). The percentages indicated for components 1 and 2 represent their relative contributions to the area under the best fitt curve. The bottom panel represents the GC level distribution of the contigs along chromosome 5, in intervals of 2 Mb, using physical map positions. The inner rectangle (gray light) corresponds to the central region of the chromosome, the top and bottom rectangles (dark gray) to the distal parts of the chromosome. The percentages shown for these rectangles represent the proportions of chromosome 5 that they cover according to the physical map. The GC averages, standard deviations and proportions are essentially the same for the components as for the corresponding chromosomal regions (central region and sum of the two distal regions). Open circles represent the few contigs outside of the rectangles. They were included in the calculation of standard deviation and average GC level of central and distal regions (modified from Carels and Bernardi, 2000b).
Nicolas Carels 150
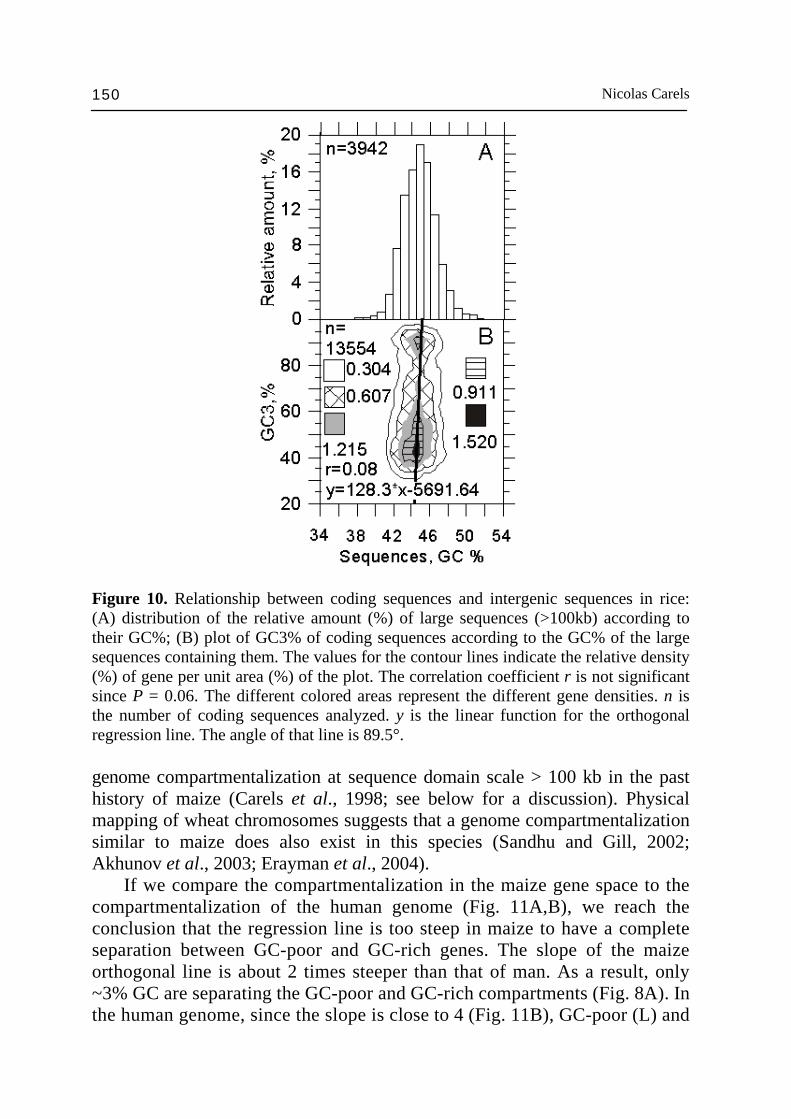
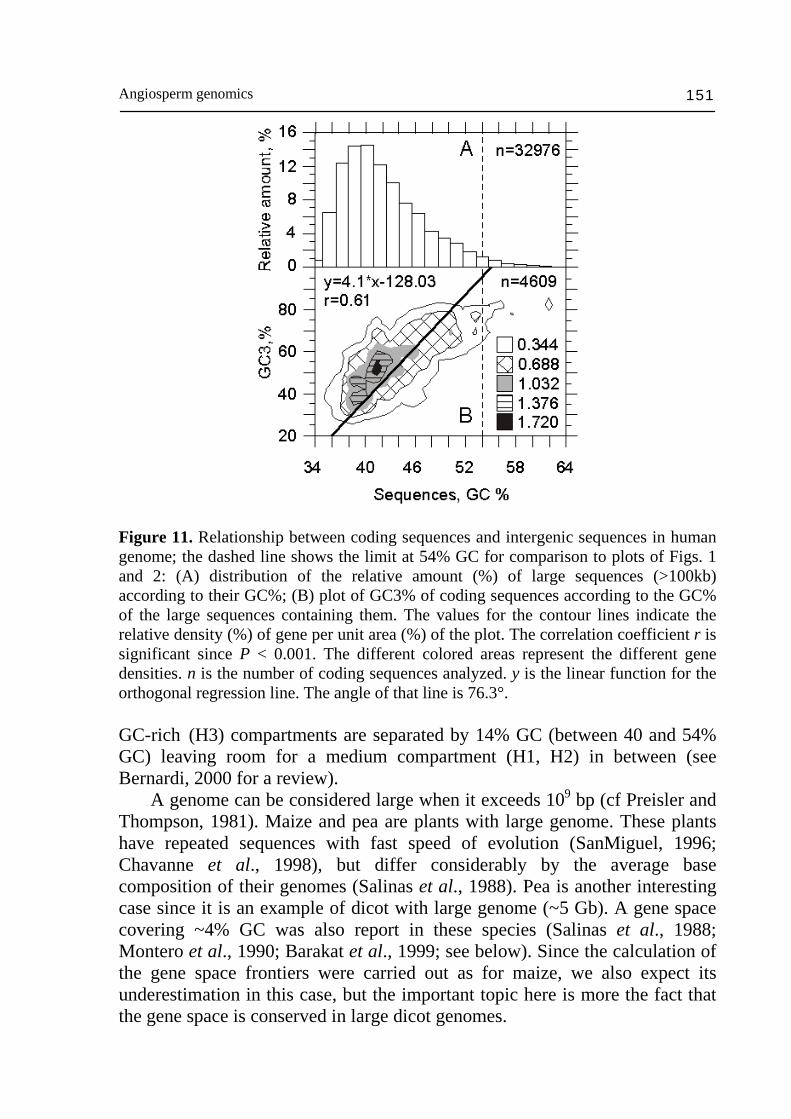
Figure 10. Relationship between coding sequences and intergenic sequences in rice: (A) distribution of the relative amount (%) of large sequences (>100kb) according to their GC%; (B) plot of GC3% of coding sequences according to the GC% of the large sequences containing them. The values for the contour lines indicate the relative density (%) of gene per unit area (%) of the plot. The correlation coefficient r is not significant since P = 0.06. The different colored areas represent the different gene densities. n is the number of coding sequences analyzed. y is the linear function for the orthogonal regression line. The angle of that line is 89.5°. genome compartmentalization at sequence domain scale > 100 kb in the past history of maize (Carels et al., 1998; see below for a discussion). Physical mapping of wheat chromosomes suggests that a genome compartmentalization similar to maize does also exist in this species (Sandhu and Gill, 2002; Akhunov et al., 2003; Erayman et al., 2004). If we compare the compartmentalization in the maize gene space to the compartmentalization of the human genome (Fig. 11A,B), we reach the conclusion that the regression line is too steep in maize to have a complete separation between GC-poor and GC-rich genes. The slope of the maize orthogonal line is about 2 times steeper than that of man. As a result, only ~3% GC are separating the GC-poor and GC-rich compartments (Fig. 8A). In the human genome, since the slope is close to 4 (Fig. 11B), GC-poor (L) and
Angiosperm genomics 151
Figure 11. Relationship between coding sequences and intergenic sequences in human genome; the dashed line shows the limit at 54% GC for comparison to plots of Figs. 1 and 2: (A) distribution of the relative amount (%) of large sequences (>100kb) according to their GC%; (B) plot of GC3% of coding sequences according to the GC% of the large sequences containing them. The values for the contour lines indicate the relative density (%) of gene per unit area (%) of the plot. The correlation coefficient r is significant since P < 0.001. The different colored areas represent the different gene densities. n is the number of coding sequences analyzed. y is the linear function for the orthogonal regression line. The angle of that line is 76.3°. GC-rich (H3) compartments are separated by 14% GC (between 40 and 54% GC) leaving room for a medium compartment (H1, H2) in between (see Bernardi, 2000 for a review). A genome can be considered large when it exceeds 109 bp (cf Preisler and Thompson, 1981). Maize and pea are plants with large genome. These plants have repeated sequences with fast speed of evolution (SanMiguel, 1996; Chavanne et al., 1998), but differ considerably by the average base composition of their genomes (Salinas et al., 1988). Pea is another interesting case since it is an example of dicot with large genome (~5 Gb). A gene space covering ~4% GC was also report in these species (Salinas et al., 1988; Montero et al., 1990; Barakat et al., 1999; see below). Since the calculation of the gene space frontiers were carried out as for maize, we also expect its underestimation in this case, but the important topic here is more the fact that the gene space is conserved in large dicot genomes.

Nicolas Carels 152
From the above considerations, it seems that large genomes are more likely to be compositionally compartmentalized even if this condition is not sufficient as proved by the difference of complexity between human and maize genome for about the same genome size. 2.2.5. The implications of the gene space The gene space conservation in Gramineae (Barakat et al., 1997) and likely in angiosperms in general provide additional evidences for the existence of a common operational genome for Gramineae (Kurata et al., 1994; Moore et al., 1995a,b; Gale and Devos, 1998). It testify the conservative mode of evolution since the occurrence of the compositional transition in their ancestor. The Gramineae speciation and radiation led to mutation accumulation without large average composition modification in spite of genome expansion/contraction process due to specific selfish DNA variation (2,500 Mb for maize, 400 Mb for rice). These genome expansions/contractions are promoted by intergeneric hybridization, polyploïdisation and transposable element amplification or elimination by illegitimate recombination. The gene space proportions in the 3 typical Gramineae (rice, wheat, maize) are roughly conversely proportional to the sizes of the corresponding genomes (Barakat et al., 1997). This observation indicates that the expansion/ contraction processes affect intergenic sequences in a comparable way whether they belong to the gene space or the rest of the genome. This conclusion is in adequacy with the fact that retrotransposons constitute more than 60% of the 280 kb which surround Adh1-F (SanMiguel et al., 1996), but also at least 50% of the nuclear maize DNA (SanMiguel et al., 1996; Meyers et al. 2001). The observation according to which the majority of genes are located in a gene space accounting for ~30-40% of the maize genome and covering a narrow GC range (~4% against 30% in the case of the human genome) indicates that a strong proportion of repeated sequences families is located outside the gene space. Indeed, the repeated sequences form 60-70% of the maize genome (Flavell et al., 1974; Hake and Walbot, 1980) and cannot all of them hold in the gene space (SanMiguel et al., 1996). In addition, DNA reassociation kinetics showed that the unique sequences tend to be interspersed with middle repeated sequences whereas the highly repeated sequences are preferentially interspersed with the middle repeated sequences (Hake and Walbot, 1980; Sandhu and Gill, 2002). Another fact of interest is that according to the range of GC variation of retrotransposons (between 42% and 63% GC, SanMiguel: personal communication), one could expect a strong compositional heterogeneity of the ~100 kb fragments. However, the scanning of the 280 kb sequence described by SanMiguel et al. (1996) using a 100 kb window gave a GC level of 47 %, on the average. There is thus a strong compensation of the size, copy number and

Angiosperm genomics 153
composition of retrotransposons so that the ~100 kb fragments within the gene space remains around 47% GC, on the average. The gene space corresponds to the only genome compartment in which Mu (mutator), Ac (activator) elements transpose. The same applies to the majority of the Cin4 elements, which are exclusively located in the same compositional class of DNA fragments as the Adh-1 gene (Capel et al., 1993), i.e. in the gene space. Transposons appear to be located in gene rich DNA fragments and active from the transcription point of view. This observation is consistent with the fact that the provirale sequences are integrated in regions of the mammal genome active for transcription (Zoubak et al., 1994). Similar results were obtained with T-DNA in rice (Barakat et al., 2000; Sallaud et al., 2004). The results described above for maize are also valid for other cereals and probably for the Gramineae in general. The generality of these observations in Gramineae is suggested by the uniformity of other criteria such as: colinearity of linkage groups (Gale and Devos, 1998), intergeneric hybridization experiments (Bennetzen et al., 1993) and the homology between their coding sequences. As already stressed, gene space forms a mosaic of gene islands dispersed along the chromosomes according to the cDNA data on the genetic map (Helentjaris, 1987; Ahn and Tanksley, 1993; Chao et al., 1994; Causse et al., 1996). In the case of wheat, the majority of the loci are physically located in the distal part of the chromosomes (Gill et al., 1993; Erayman et al., 2004) where the majority of the recombination events occur (cf Schwarzacher, 1996; Akhunov et al., 2004). In addition, Moore et al. (1993) found, in wheat, that the chromosomes present a composition profile such that long AT-rich fragments are interspersed with GC-rich ones on the pericentromeric side, whereas in the distal chromosomes part, the interval between the GC-rich sequences is shorter and richer in single sequences among which coding sequences are included. Moreover, the pericentromeric fragments of DNA generated by restriction were longer and more regularly spaced than the distal fragments. The distal chromosome regions was also found to be hot-spot of non-methylated Not I site, i.e., hot-spot in CpG islands, which are indicative of genes (Antequera and Bird, 1988; Gardiner-Garden and Frommer, 1992; Gardiner-Garden et al., 1992). These observations are testimony of a bias between genetic and physic maps, which is the expression of the recombination gradient along the chromosome (Mucha et al., 2003; Akhunov et al., 2004). Since GC3% of genes is correlated to GC% of ~100 kb DNA fragments containing them in maize and to CpG islands (Fig. 24), reparation that basically rely on illegitimate recombination in plants is likely to be more frequent in GC-rich (Mucha et al., 2003) than in GC-poor genes (Gorbunova and Levy 1999; Vergust and Hooykaas 1999) and responsible of higher rate of GC increase in GC-rich genes and gene space homogenization. In addition, the
Nicolas Carels 154
recombination rate is influenced by the chromatin accessibility and, therefore, by its condensation level (McKee and Handel, 1993; Bass et al., 1997) which is higher in the heterochromatin. This would promote the GC increase process in the GC-rich genes (see the two classes of genes and the compositional transition below). The differences in recombination rates between pericentromeric and distal regions of the chromosomes was already described in warm-blooded vertebrates and found correlated to physical organization of isochores and spacial organization of chromosomes in the nucleus (Saccone et al., 2002). The colinearity between species of the Triticeae tribes shows that, in the homologous linkage groups, the gene order is similar between different related species (Bennetzen and Freeling, 1993; Moore, 1995; Moore et al, 1995a,b; Gale and Devos, 1998). This implies that the intergenic DNA amount is correlated with the genome size (Moore, 1995). However, the repeated sequences of these species diverged (Rimpau et al., 1980) during speciation and genetic isolation (Flavell, 1982). The divergence is, however, not complete and is correlated with the genetic distance (Flavell, 1982). The result of this divergence is the quasi-absence of chiasmata formation between homeologous chromosomes in the interspecific hybrids. Zuckerkandl and Henning (1995) and Demburg et al. (1996) showed that to ensure a normal meïotic disjunction of the achiasmatic chromosomes in Drosophila females, the heterochromatin homology is important. Certain heterochromatin regions are necessary for chromatid cohesion and, therefore, for chromosomal disjunction (Karpen et al., 1996). These heterochromatine functions lie on the action of particular protein such as pasc and HP-1 (Pak et al., 1997). Mutation in these genes appears to alter the heterochromatin structure and the chromosomal segregation. Such a process of chiasmata formation under gene dependence was also detected in interspecific hybrids in Gramineae (Flavell, 1982). All the considerations reported above show how the genome is a highly structured dynamic entity and how the term genome can take a particular meaning according to the type of molecular entity under investigation. If the genes appear organized in clusters, these clusters are not all located in distal position of chromosomes. In wheat, for example, some of them are located in the pericentromeric regions of the long arm of the chromosomes 1 and 5. They are spaced by regions of low marker density; however, the clusters in distal positions are richest in genes (Gill et al., 1996a,b; Erayman et al., 2004). The physical mapping by cytogenetic ladder mapping (CLM) does not allow detailed study of the relationship between gene clusters and repeated sequences. However, more restrictive but finer studies confirmed the global view just outlined. Feuillet and Keller (1999) showed that in a syntenic region of maize, barley, rice and wheat with a gene density of one gene per 15 kb on the wheat
Angiosperm genomics 155
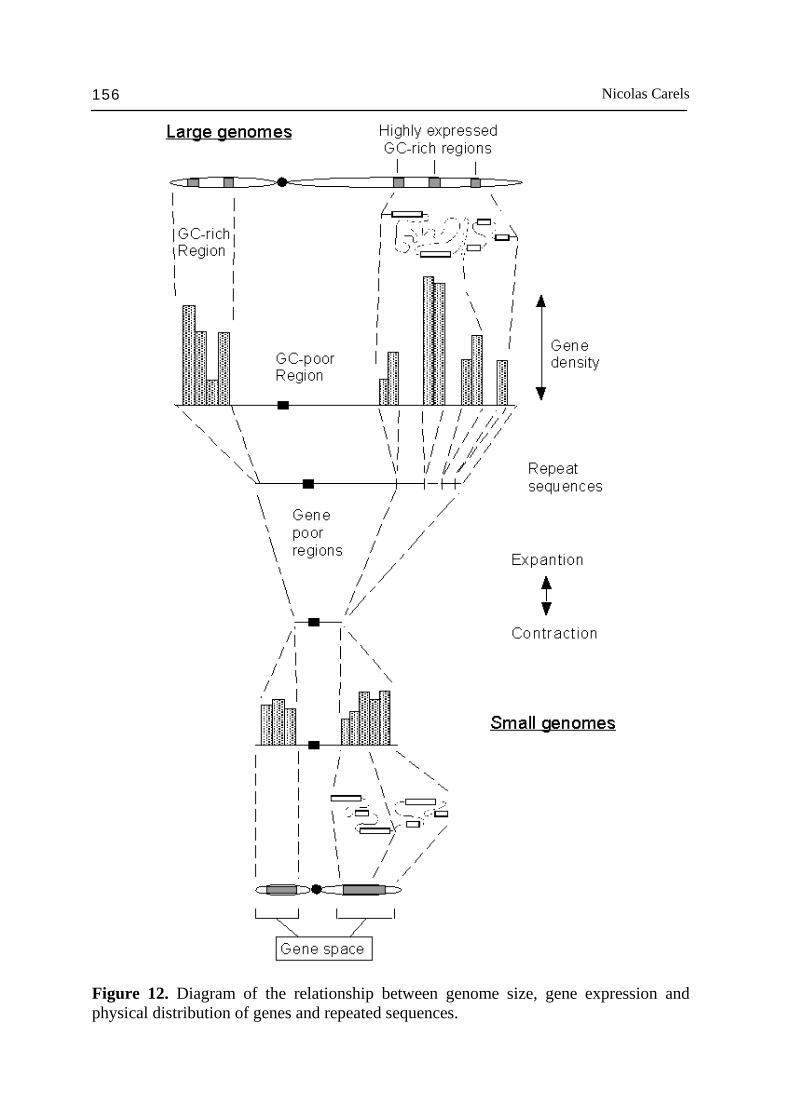
homologous segment of 160 KB. In certain cases, the intergenic distance was only 4-5 kb (as in Arabidopsis). SanMiguel et al. (1996) showed in a sequence of 225 kb, the average gene density was 1 by 25 kb in maize and 1 by 5,6 kb in the homologous sorghum sequence (Tikhonov et al., 1999). This value is close to the value of 1 per 5 kb on the average found in Arabidopsis (Carels and Bernardi, 2000b). These gene densities are higher than those that one could expect from a random distribution and are in agreement with the gene space and with the observations of Erayman et al. (2004). Because of the colinearity general to Gramineae species, one can conclude that the gene clusters are conserved within the family despite the genome size and repeated sequence differences. This is consistent with the fact that Gramineae are a recent monophyletic group (Chase et al., 1993). These data on the genome organization of Gramineae (see: Moore et al., 1993; Gill et al., 1996a,b; Feuillet and Keller, 1999) and on the relationship between small and large genomes (Hutchinson et al., 1980; Moore et al., 1995a; Moore, 1995) are summarized in Fig. 12 and seems to be ubiquitous in angiosperms because of colinearity in other plant families and retrotransposon omnipresence in higher plants (Friesen et al., 2001). The gene cluster organization makes the gene recognition (Voytas and Naylor, 1998) in a chromosomal environment submerged by retrotransposons less difficult to figure out and could explain why this organization was preserved. In addition, it is likely related to chromosomal loops and heterochromatine packaging in interphase nuclei (Heslop-Harrison, 2000; Saccone et al., 2002; Heslop-Harrison, 2003b). Under these conditions, one can understand how the transition from a small genome like those of Arabidopsis or rice to large genomes such as those of maize or wheat can be done via amplifications in certain chromosomal regions without disturbing cell functioning. As discussed above, selective processes are in all likelihood operating to control such amplification processes giving sense to the pattern of genome organization just discussed (Bernardi, 2001; Cavalier-Smith, 2005). 2.2.6. The storage proteins Seed development is a unique transition state in the life cycle of higher plants between the parental sporophytic stage and the progeny. The embryo is polarized and its root and stem meristems form the basic architecture of the future plantlet. Maturation mechanisms take place in seed prior to germination. During this maturation phase, one observes an important increase in seed volume and mass due to storage protein, starch and/or lipid accumulation in cells, which will be metabolized during germination and used as carbon and nitrogen sources until photosynthesis initiation. Quickly after the initiation of the seed maturation phase, the level of ABA reaches a threshold value such that any germination and premature gene expression is inhibited. The desiccation
Nicolas Carels 156
Figure 12. Diagram of the relationship between genome size, gene expression and physical distribution of genes and repeated sequences.
Angiosperm genomics 157
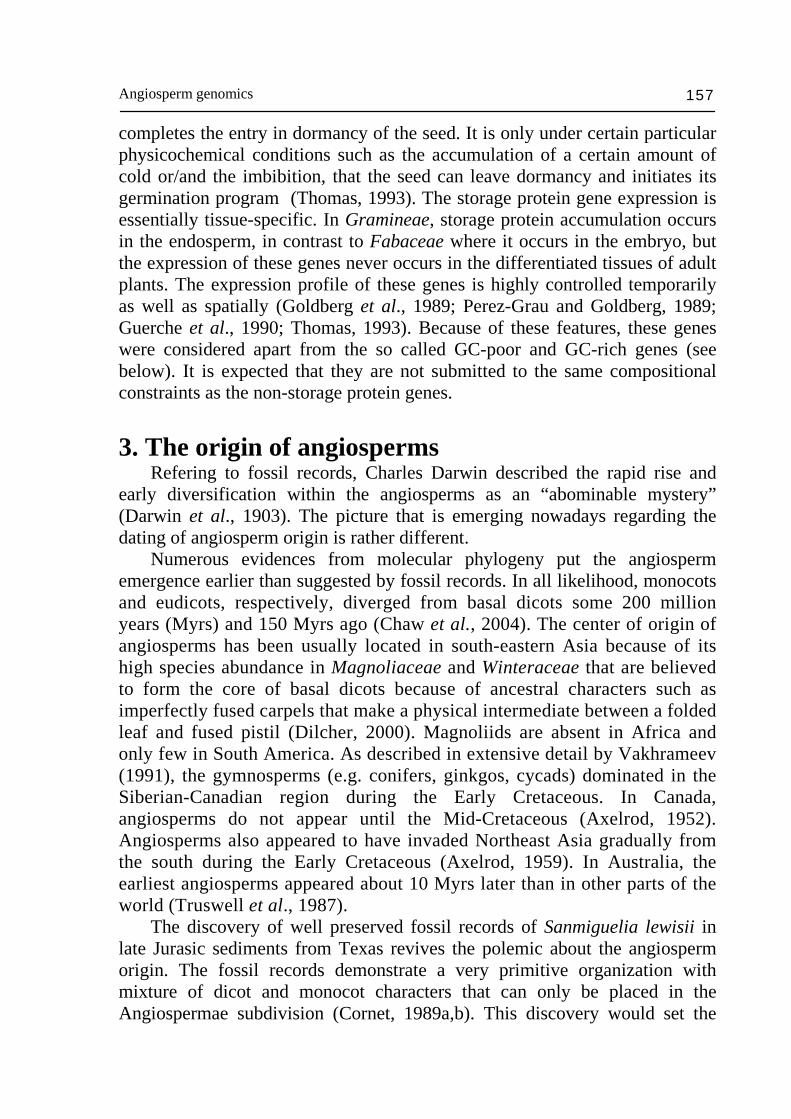
completes the entry in dormancy of the seed. It is only under certain particular physicochemical conditions such as the accumulation of a certain amount of cold or/and the imbibition, that the seed can leave dormancy and initiates its germination program (Thomas, 1993). The storage protein gene expression is essentially tissue-specific. In Gramineae, storage protein accumulation occurs in the endosperm, in contrast to Fabaceae where it occurs in the embryo, but the expression of these genes never occurs in the differentiated tissues of adult plants. The expression profile of these genes is highly controlled temporarily as well as spatially (Goldberg et al., 1989; Perez-Grau and Goldberg, 1989; Guerche et al., 1990; Thomas, 1993). Because of these features, these genes were considered apart from the so called GC-poor and GC-rich genes (see below). It is expected that they are not submitted to the same compositional constraints as the non-storage protein genes. 3. The origin of angiosperms Refering to fossil records, Charles Darwin described the rapid rise and early diversification within the angiosperms as an “abominable mystery” (Darwin et al., 1903). The picture that is emerging nowadays regarding the dating of angiosperm origin is rather different. Numerous evidences from molecular phylogeny put the angiosperm emergence earlier than suggested by fossil records. In all likelihood, monocots and eudicots, respectively, diverged from basal dicots some 200 million years (Myrs) and 150 Myrs ago (Chaw et al., 2004). The center of origin of angiosperms has been usually located in south-eastern Asia because of its high species abundance in Magnoliaceae and Winteraceae that are believed to form the core of basal dicots because of ancestral characters such as imperfectly fused carpels that make a physical intermediate between a folded leaf and fused pistil (Dilcher, 2000). Magnoliids are absent in Africa and only few in South America. As described in extensive detail by Vakhrameev (1991), the gymnosperms (e.g. conifers, ginkgos, cycads) dominated in the Siberian-Canadian region during the Early Cretaceous. In Canada, angiosperms do not appear until the Mid-Cretaceous (Axelrod, 1952). Angiosperms also appeared to have invaded Northeast Asia gradually from the south during the Early Cretaceous (Axelrod, 1959). In Australia, the earliest angiosperms appeared about 10 Myrs later than in other parts of the world (Truswell et al., 1987). The discovery of well preserved fossil records of Sanmiguelia lewisii in late Jurasic sediments from Texas revives the polemic about the angiosperm origin. The fossil records demonstrate a very primitive organization with mixture of dicot and monocot characters that can only be placed in the Angiospermae subdivision (Cornet, 1989a,b). This discovery would set the
Nicolas Carels 158
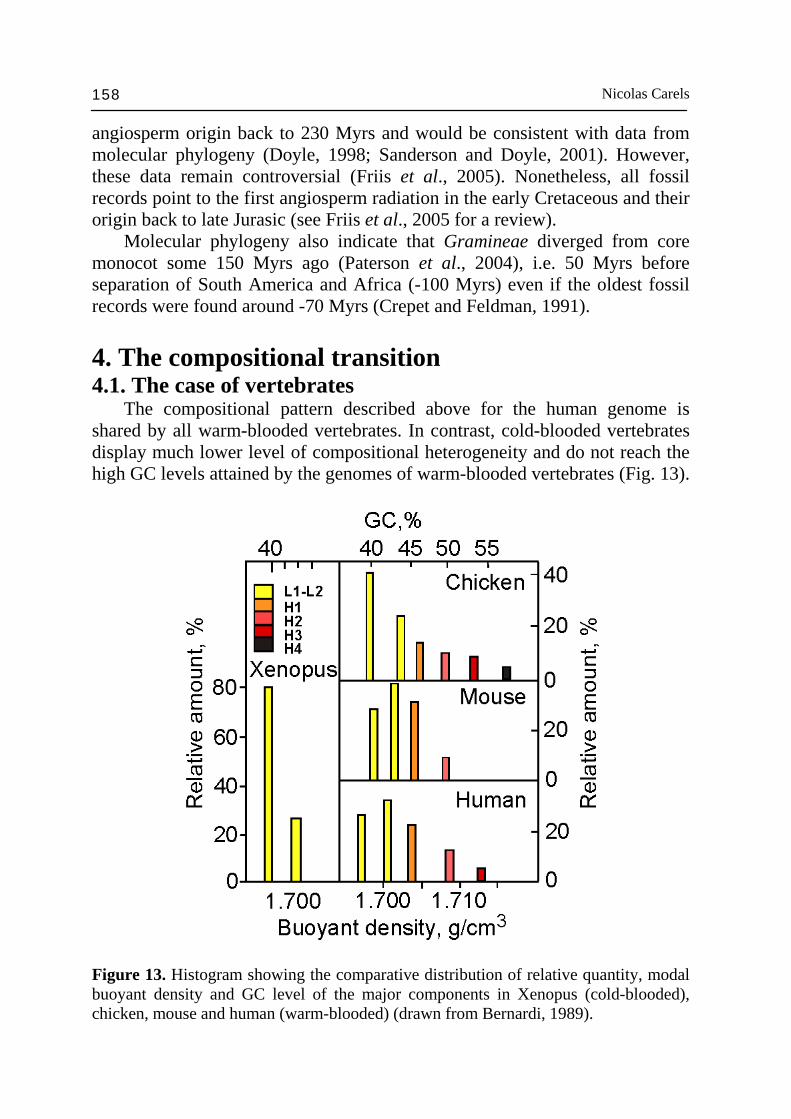
angiosperm origin back to 230 Myrs and would be consistent with data from molecular phylogeny (Doyle, 1998; Sanderson and Doyle, 2001). However, these data remain controversial (Friis et al., 2005). Nonetheless, all fossil records point to the first angiosperm radiation in the early Cretaceous and their origin back to late Jurasic (see Friis et al., 2005 for a review). Molecular phylogeny also indicate that Gramineae diverged from core monocot some 150 Myrs ago (Paterson et al., 2004), i.e. 50 Myrs before separation of South America and Africa (-100 Myrs) even if the oldest fossil records were found around -70 Myrs (Crepet and Feldman, 1991). 4. The compositional transition 4.1. The case of vertebrates The compositional pattern described above for the human genome is shared by all warm-blooded vertebrates. In contrast, cold-blooded vertebrates display much lower level of compositional heterogeneity and do not reach the high GC levels attained by the genomes of warm-blooded vertebrates (Fig. 13).
Figure 13. Histogram showing the comparative distribution of relative quantity, modal buoyant density and GC level of the major components in Xenopus (cold-blooded), chicken, mouse and human (warm-blooded) (drawn from Bernardi, 1989).

Angiosperm genomics 159
Genes are, however, not uniformly distributed in these genomes. Indeed, only the GC-richest 10-15 of the genomes of cold-blooded vertebrates hybridize single-copy DNA from human H3 isochores (Perani, 1996 and unpublished results). This indicates that in cold-blooded vertebrates as well, there is a genome compartment corresponding to the GC-richest fractions of the warm-blooded genome (Fig. 14). Even if these GC-richest fractions are much less GC-rich than the corresponding fractions of the genomes of warm-blooded vertebrates, they are still the GC-richest in their proper genome environment. Since mammals and birds originated independently from reptiles, it was concluded that two major independent compositional genome transitions took place between cold-blooded vertebrates (reptiles) and warm-blooded vertebrates (mammals and birds), and that they concerned a small part of the genome, which is, interestingly, the gene-richest part of it (Bernardi, 2000). The compositional transition is also found comparing GC3 values of orthologous genes in calf, mouse, chicken and Xenopus. Warm-blooded vertebrates GC-rich genes systematically accumulated increasing amount of GC in 3rd codon position compared to Xenopus (Bernardi, 2000). The compositional transition in the warm-blooded vertebrates had several other consequences: (i) DNA methylation decrease (Jabbari et al., 1997); (ii) formation of unmethylated CpG islands in the 5’ side of GC-rich genes (Aïssani and Bernardi, 1991a,b); and (iii) T bands appeared in metaphase chromosomes; at the same time karyotype changes and speciation increased (Bernardi, 1993b).
Figure 14. Diagram of the compositional modifications that took place during the transition from cold-blooded to warm-blooded vertebrates. The neogenome who includes the isochore families H1-H3 was formed during the evolution by the GC increase of homologous GC-rich DNA regions in the GC-poor ancestral genome. The GC-poor regions were seen to be compositionally passive and constitute the so-called paleogenome who is represented by the L family of GC-poor isochores (Bernardi, 2000).
Nicolas Carels 160
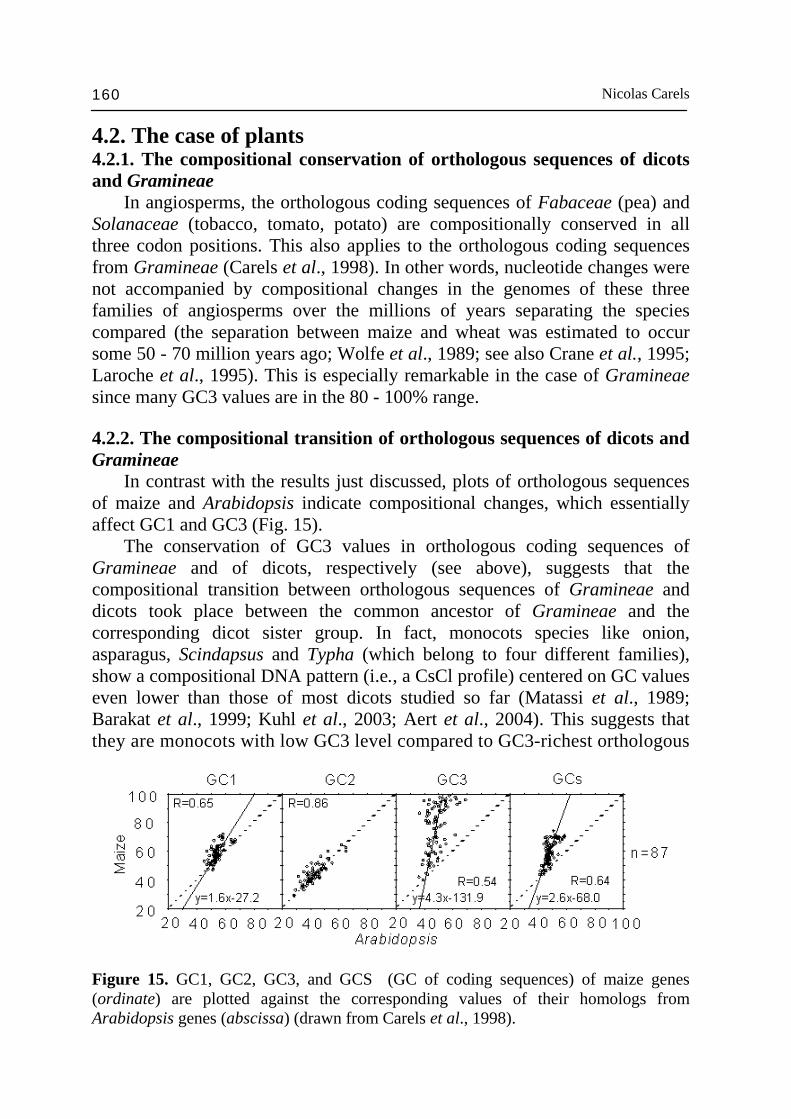
4.2. The case of plants 4.2.1. The compositional conservation of orthologous sequences of dicots and Gramineae In angiosperms, the orthologous coding sequences of Fabaceae (pea) and Solanaceae (tobacco, tomato, potato) are compositionally conserved in all three codon positions. This also applies to the orthologous coding sequences from Gramineae (Carels et al., 1998). In other words, nucleotide changes were not accompanied by compositional changes in the genomes of these three families of angiosperms over the millions of years separating the species compared (the separation between maize and wheat was estimated to occur some 50 - 70 million years ago; Wolfe et al., 1989; see also Crane et al., 1995; Laroche et al., 1995). This is especially remarkable in the case of Gramineae since many GC3 values are in the 80 - 100% range. 4.2.2. The compositional transition of orthologous sequences of dicots and Gramineae In contrast with the results just discussed, plots of orthologous sequences of maize and Arabidopsis indicate compositional changes, which essentially affect GC1 and GC3 (Fig. 15). The conservation of GC3 values in orthologous coding sequences of Gramineae and of dicots, respectively (see above), suggests that the compositional transition between orthologous sequences of Gramineae and dicots took place between the common ancestor of Gramineae and the corresponding dicot sister group. In fact, monocots species like onion, asparagus, Scindapsus and Typha (which belong to four different families), show a compositional DNA pattern (i.e., a CsCl profile) centered on GC values even lower than those of most dicots studied so far (Matassi et al., 1989; Barakat et al., 1999; Kuhl et al., 2003; Aert et al., 2004). This suggests that they are monocots with low GC3 level compared to GC3-richest orthologous
Figure 15. GC1, GC2, GC3, and GCS (GC of coding sequences) of maize genes (ordinate) are plotted against the corresponding values of their homologs from Arabidopsis genes (abscissa) (drawn from Carels et al., 1998).
Angiosperm genomics 161
genes of maize. The few genes that could be tested confirm this view. For example, since onion, a monocot which is not a Graminea, is 40% GC on the average in DNA and since its available coding sequences are comprised between 40% and 55% GCs and 35% and 70% GC3, we can conclude that the compositional transition is specific to Gramineae and not to monocots in general. Therefore, the compositional pattern of Gramineae is the result of a compositional transition that took place at the time of their divergence from monocots some ~150 Myrs ago (Paterson et al., 2004). In addition to the "major transition" between Gramineae and dicots just discussed, some "minor transitions" were also found among dicots. For instance, a number of orthologous genes from tomato and pea show lower GC3 values than those of Arabidopsis (Carels et al., 1998). As shown above, the compositional transition in vertebrates promoted independently the GC enrichment of GC-richest isochores of cold-blooded vertebrates. This regional enrichment of the GC level led to the formation of new compositional families (H) in warm-blooded vertebrates qualitatively different from the ancestral families (L) from cold-blooded vertebrates. The determinants of the major compositional transition in vertebrates operated on coding sequences as well as non-coding, so that the GC level of the coding sequences and the third codon position are correlated with GC level of isochores (see above). In angiosperms, the situation differs in the sense that the major transition that occurred in Gramineae as seen in GC-rich genes is accompanied by the increase in the genome heterogeneity proved by the maize genome compartmentalization (Fig. 8), but at a much lower level than in warm-blooded vertebrates. Interestingly, the profile of gene distribution according to GC3 in warm-blooded vertebrates and Gramineae are similar except that the complexity of the GC3 profile is simpler in Gramineae than in human since it only present two peaks (Figs. 8 and 18) in place of four (Fig. 16) (Zoubak et al., 1996). This lower complexity is accompanied by the existence of two clear cut classes of genes in Gramineae (Fig. 16, and discussion below). Genome size does not correlate closely with organism complexity. This observation has been termed the ‘C-value paradox’. The genomes of more complex organisms are, on the average, larger than the genomes of less complex organisms, and one can, therefore, assess that a part of the non-coding DNA is also involved in complexity. As seen above the evolution of multicellular organisms was accompanied by a great increase in the regulation complexity by transcriptional regulation, the target of which lies in the intergenic DNA (Zuckerkandl, 2002; Vinogradov, 2003b, 2004). To estimate the relationship between genome size and organism complexity, it would be probably more efficient to compare the latest with the gene space size. Actually, the gene space displays a higher optimization level than the complete genome itself since selfish DNA is there somewhat under control.
Nicolas Carels 162
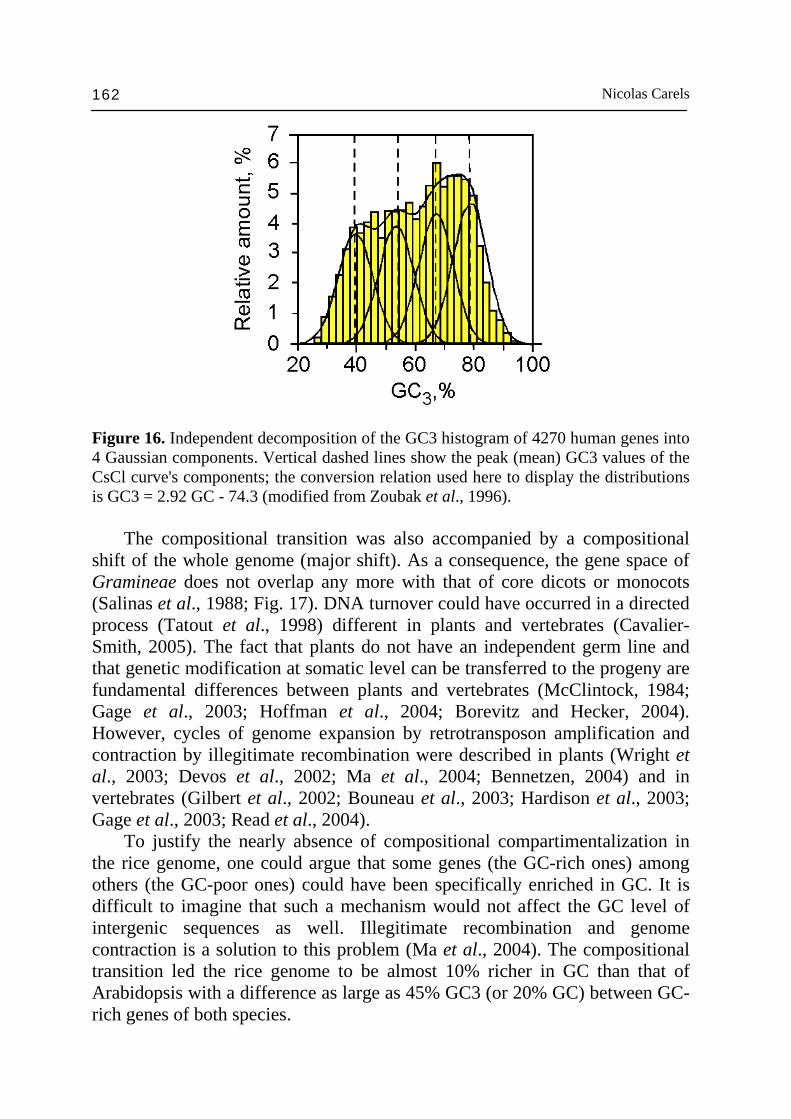
Figure 16. Independent decomposition of the GC3 histogram of 4270 human genes into 4 Gaussian components. Vertical dashed lines show the peak (mean) GC3 values of the CsCl curve's components; the conversion relation used here to display the distributions is GC3 = 2.92 GC - 74.3 (modified from Zoubak et al., 1996). The compositional transition was also accompanied by a compositional shift of the whole genome (major shift). As a consequence, the gene space of Gramineae does not overlap any more with that of core dicots or monocots (Salinas et al., 1988; Fig. 17). DNA turnover could have occurred in a directed process (Tatout et al., 1998) different in plants and vertebrates (Cavalier-Smith, 2005). The fact that plants do not have an independent germ line and that genetic modification at somatic level can be transferred to the progeny are fundamental differences between plants and vertebrates (McClintock, 1984; Gage et al., 2003; Hoffman et al., 2004; Borevitz and Hecker, 2004). However, cycles of genome expansion by retrotransposon amplification and contraction by illegitimate recombination were described in plants (Wright et al., 2003; Devos et al., 2002; Ma et al., 2004; Bennetzen, 2004) and in vertebrates (Gilbert et al., 2002; Bouneau et al., 2003; Hardison et al., 2003; Gage et al., 2003; Read et al., 2004). To justify the nearly absence of compositional compartimentalization in the rice genome, one could argue that some genes (the GC-rich ones) among others (the GC-poor ones) could have been specifically enriched in GC. It is difficult to imagine that such a mechanism would not affect the GC level of intergenic sequences as well. Illegitimate recombination and genome contraction is a solution to this problem (Ma et al., 2004). The compositional transition led the rice genome to be almost 10% richer in GC than that of Arabidopsis with a difference as large as 45% GC3 (or 20% GC) between GC-rich genes of both species.
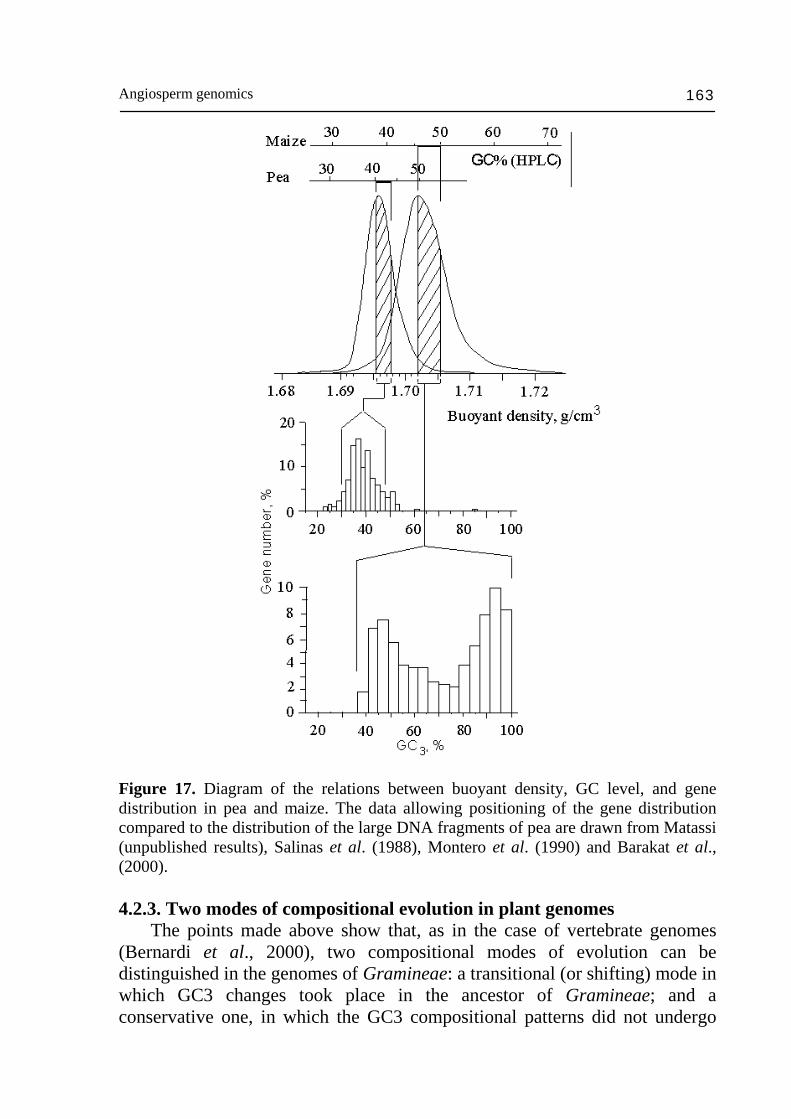
Angiosperm genomics 163
Figure 17. Diagram of the relations between buoyant density, GC level, and gene distribution in pea and maize. The data allowing positioning of the gene distribution compared to the distribution of the large DNA fragments of pea are drawn from Matassi (unpublished results), Salinas et al. (1988), Montero et al. (1990) and Barakat et al., (2000). 4.2.3. Two modes of compositional evolution in plant genomes The points made above show that, as in the case of vertebrate genomes (Bernardi et al., 2000), two compositional modes of evolution can be distinguished in the genomes of Gramineae: a transitional (or shifting) mode in which GC3 changes took place in the ancestor of Gramineae; and a conservative one, in which the GC3 compositional patterns did not undergo
Nicolas Carels 164
any further changes in spite of the accumulation of point mutations. This conservative mode is also predominant in the dicots studied (except for some cases exhibiting minor shifts; see above). The GC3 plot of maize vs. Arabidopsis is strongly reminiscent of that previously found for human vs. Xenopus (see Bernardi et al., 1997), the slope of the observed regression line being even higher (4.3 vs. 2.7). In both cases, the GC3-poorest genes (neglecting seed storage protein genes in the case of plants) are practically identical in GC3, whereas the differences become increasingly larger for GC3-rich genes. 4.2.4. Compositional transition and retrotransposons Certain elements of a family can undergo a selective constraint because of their base composition, whereas others are free to evolve/move. An increasingly important quantity of comparative data shows that the major part of the eukaryote DNA, including the majority of the repeated sequences, must be regarded as derived DNA (secondary DNA). The reiteration of one or some members of a family of divergent sequences repeated by derived amplification (secondary amplification) is a common feature of large plant genomes. This mechanism leads to high amplification rate, heterogeneous base composition between families, and to fast sequence family turnover (Preisler and Thompson, 1981). In vertebrates, DNA amplification occurred successively during evolution (Gillespie, 1977; Gillespie et al., 1980; Hwu et al., 1986; Shen et al., 1991; Smit, 1993; Gilbert and Labuda, 1999). Such phenomena had already taken place before the compositional transition (Gilbert and Labuda, 1999). Isopycnic integration (Zoubak et al., 1994; Xie et al., 2001) or post-incertional compositional homogenization (Paces et al., 2004) could have promoted the extension of large homogeneous DNA stretches leading to isochore formation. In maize, for example, one knows that, the majority of the genome (>50%) is made up of retrotransposons (SanMiguel et al., 1996; Meyers et al., 2001). The coding sequences of active retrotransposons must be subjected to compositional constraints of the same type as those that act on other nuclear genes. In maize, average GC% of retrotransposons vary between 42 and 63% according to the family (SanMiguel, personal communication). The dating of these retrotransposons by analysis of the rates of substitution in their LTR allowed to show that their dissemination in the genome of maize took place ~6 Myrs ago (SanMiguel et al., 1998), well after the Gramineae radiation at the higher cretaceous (~70 Myrs). If amplification events occurred in Gramineae before the compositional transition, they would have happened at least 100 Myrs ago since Gramineae diverged from the monocot core about 150 Myrs ago (Paterson et al., 2004). That would imply that a second wave of amplification would have occurred in maize towards -6 Myrs in a GC enriched environment since these
Angiosperm genomics 165
transposons are also present in the gene space. The first one occurred at some point before the compositional transition so that seed families were inherited in the common ancestor of Gramineae (Friesen et al., 2001). Under these conditions the compositional transition (according to the comparison of CsCl profiles) would have some analogy in Gramineae and warm-blooded vertebrates. It is effectively the case (compare Fig. 8 and 17 to 4), except that the genome compartmentalization is much simpler than in warm-blooded vertebrates. Although simplest, it is consistent with the genome complexity since the two compositional compartments correspond roughly to the two classes of genes. The retrotransposition activity must have taken place in a context already enriched in GC, which justifies that the profile of Gramineae genomes appears shifted in its totality towards high GC values. From this reasoning, it results that the genome of Gramineae ancestor was likely small, otherwise it would be difficult to explain the low level of asymmetry of the CsCl profiles in Gramineae. In support of this assumption, the smallest known number of chromosomes in Gramineae is 2n=4 (Bennett, 1996). More recently, using a molecular phylogenetic framework and genome size measurements for crucial basal angiosperms, Soltis et al. (2003) showed that a very small genome size (~1.4 pg) is ancestral not only for angiosperms in general, but also for most of their major clades including monocots and eudicots. In addition, the analysis of paleontological data using the Fossil Record 2 database (http://palaeo.gly.bris.ac.uk/frwhole/FR2.html) confirmed that there is a negative correlation between mean genome size of angiosperm families and the upper limit of their first appearance in geological time (r = -0.39, P<0.001, n=74), that is, more recent families have larger genomes on average (Vinogradov, 2003). The compositional profile of DNA fragments of most plant species is centered on ~38-40% GC, on the average and seems, therefore, to be the plexus value for higher plants. From this common plexus to which belong dicots as well as monocots, the compositional evolution of the genome towards higher GC occurred on several occasions in different taxonomic groups. The case of Gramineae is the best documented, but other groups such as Oenothera are candidates (cf Fig. 8). 5. The two classes of genes Two classes of genes were found in angiosperms analyzing GC distribution of genes (introns + exons) (Carels and Bernardi, 2000a). In the case of maize or rice, the compositional distribution of genes is strikingly bimodal (Fig. 17,18), and the two classes of genes, GC-rich and GC-poor, are very distinct, in that the former exhibit either no introns or very few, short introns, whereas the latter are characterized by many long introns (Fig. 19).
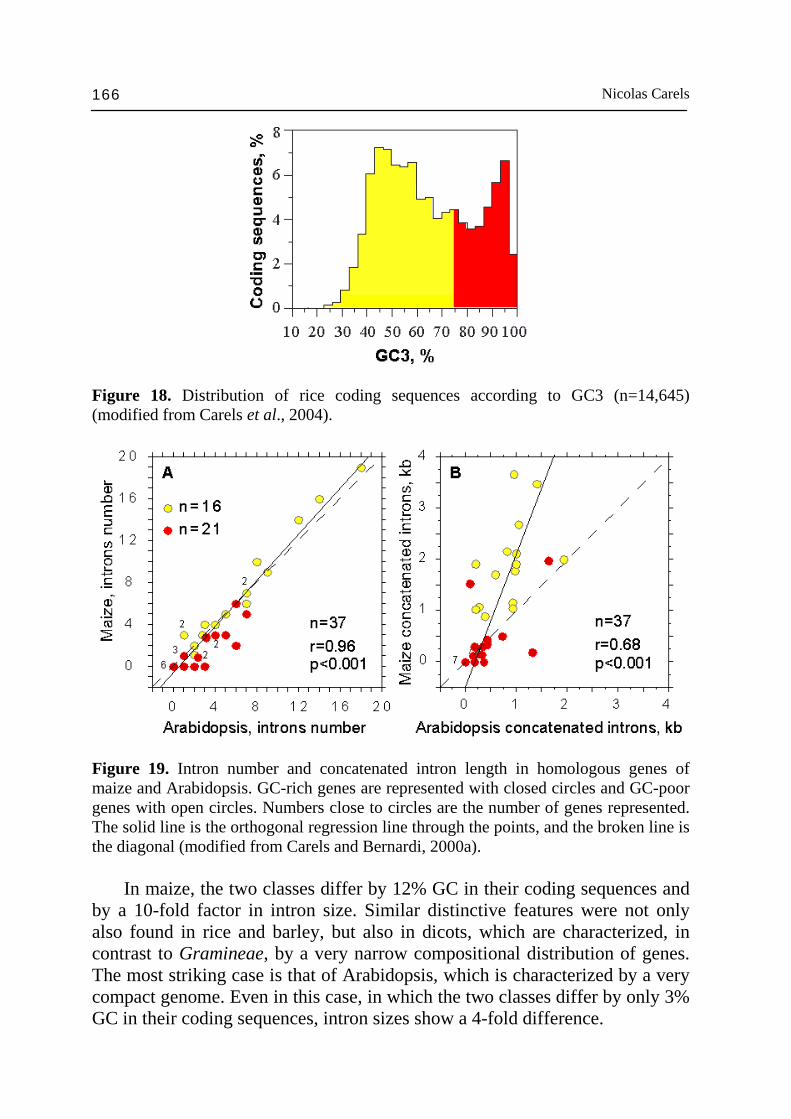
Nicolas Carels 166
Figure 18. Distribution of rice coding sequences according to GC3 (n=14,645) (modified from Carels et al., 2004).
Figure 19. Intron number and concatenated intron length in homologous genes of maize and Arabidopsis. GC-rich genes are represented with closed circles and GC-poor genes with open circles. Numbers close to circles are the number of genes represented. The solid line is the orthogonal regression line through the points, and the broken line is the diagonal (modified from Carels and Bernardi, 2000a). In maize, the two classes differ by 12% GC in their coding sequences and by a 10-fold factor in intron size. Similar distinctive features were not only also found in rice and barley, but also in dicots, which are characterized, in contrast to Gramineae, by a very narrow compositional distribution of genes. The most striking case is that of Arabidopsis, which is characterized by a very compact genome. Even in this case, in which the two classes differ by only 3% GC in their coding sequences, intron sizes show a 4-fold difference.

Angiosperm genomics 167
The fact that genes are, on the average, interrupted by either a large number of long introns or a small number of short introns, and that GC levels are different in the two classes of genes, is far from trivial for two reasons. First, these properties are found not only in angiosperms, but also in vertebrates (Duret et al., 1995) and might, therefore, be quite general properties of the genomes of multicellular eukaryotes. However, the phenomenon is more striking in plants than in vertebrates since the contrast between intron lengths in GC-poor and GC-rich genes is at least 15% to 20% larger in plants than in vertebrates. Second, total intron sizes in homologous genes from maize and Arabidopsis are correlated. In other words, the Arabidopsis genes that are homologous to the genes having large total intron size in maize also are endowed with large total intron sizes. Therefore, in homologous genes, not only the number of introns is conserved, as expected, but also the total size of introns (Carels and Bernardi, 2000a). Moreover, GC-rich genes were observed to be, on the average, more GC-rich in all codon positions in all species tested, but especially in Gramineae, compared to GC-poor genes. As far as the functional meaning of the two classes of genes is concerned, it has been speculated that since housekeeping genes were found to be associated with GC-rich genes not only in Arabidopsis and maize (Chiapello et al., 1998), but also in vertebrates (see Bernardi, 2000, for a review), shortage and small sizes of introns might be visualized as advantageous features for genes which are transcribed in a constitutive or at least in an extensive way. However, Vinogradov (2003c) showed recently that in humans and mice, the compartmentalization of tissue-specific and housekeeping genes according to GC is fuzzy. Just a slight trend of GC-poor and GC-rich affinity was found for tissue-specific and housekeeping genes, respectively. This is not surprising given slight different of intron distribution between GC-poor and GC-rich genes in vertebrates (Duret et al., 1995). Such a relationship is expected to be more striking in Gramineae given the higher contrast in intron distribution according to GC. In the case of GC-poor genes, which are largely tissue-specific in vertebrates (Bickmore and Craig, 1997), the abundance and size of introns in these genes would be favorable for alternative splicing (Iida et al., 2004), an important mechanism of expression regulation of tissue-specific genes (Bell et al., 1998; Ner-Gaon et al., 2004). 5.1. Synonymous and non-synonymous substitutions Various authors (Li et al., 1985; Ticher and Graur, 1989; Wolfe and Sharp, 1993; Mouchiroud et al., 1995; Ohta and Ina, 1995) showed that the speeds of synonymous and non-synonymous nucleotide substitutions in genes are positively correlated in bacteria as well as in mammals. With more precision,
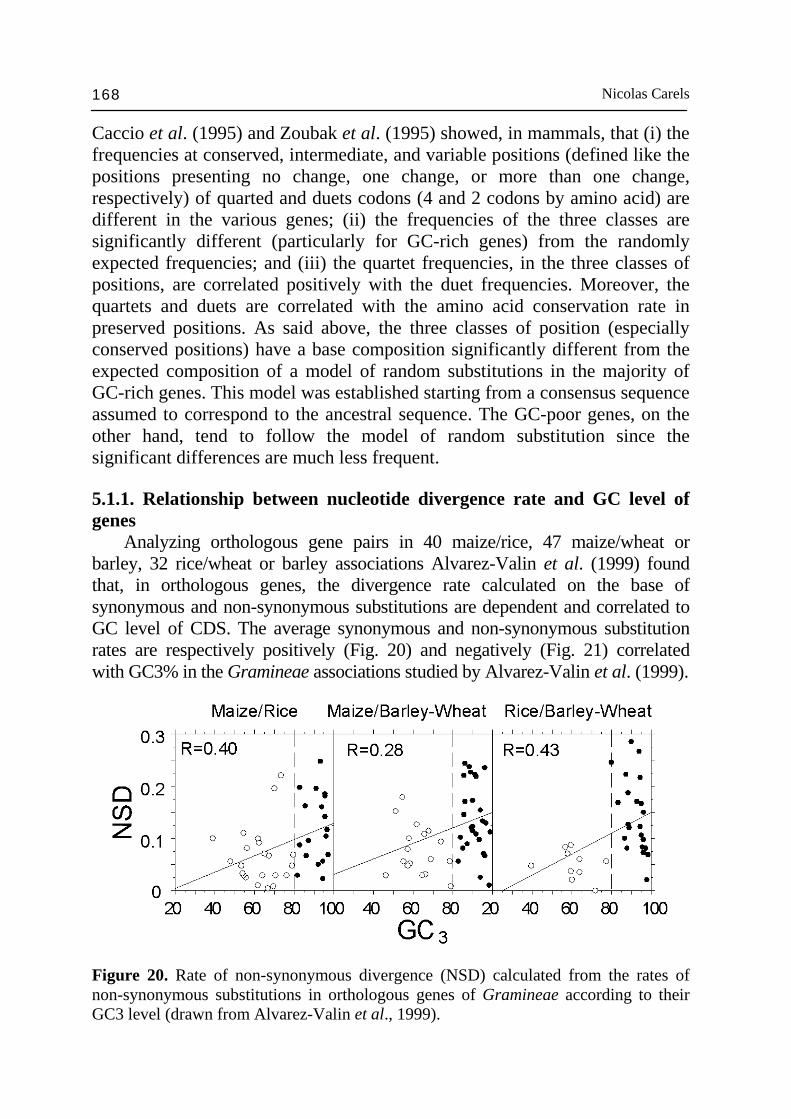
Nicolas Carels 168
Caccio et al. (1995) and Zoubak et al. (1995) showed, in mammals, that (i) the frequencies at conserved, intermediate, and variable positions (defined like the positions presenting no change, one change, or more than one change, respectively) of quarted and duets codons (4 and 2 codons by amino acid) are different in the various genes; (ii) the frequencies of the three classes are significantly different (particularly for GC-rich genes) from the randomly expected frequencies; and (iii) the quartet frequencies, in the three classes of positions, are correlated positively with the duet frequencies. Moreover, the quartets and duets are correlated with the amino acid conservation rate in preserved positions. As said above, the three classes of position (especially conserved positions) have a base composition significantly different from the expected composition of a model of random substitutions in the majority of GC-rich genes. This model was established starting from a consensus sequence assumed to correspond to the ancestral sequence. The GC-poor genes, on the other hand, tend to follow the model of random substitution since the significant differences are much less frequent. 5.1.1. Relationship between nucleotide divergence rate and GC level of genes Analyzing orthologous gene pairs in 40 maize/rice, 47 maize/wheat or barley, 32 rice/wheat or barley associations Alvarez-Valin et al. (1999) found that, in orthologous genes, the divergence rate calculated on the base of synonymous and non-synonymous substitutions are dependent and correlated to GC level of CDS. The average synonymous and non-synonymous substitution rates are respectively positively (Fig. 20) and negatively (Fig. 21) correlated with GC3% in the Gramineae associations studied by Alvarez-Valin et al. (1999).
Figure 20. Rate of non-synonymous divergence (NSD) calculated from the rates of non-synonymous substitutions in orthologous genes of Gramineae according to their GC3 level (drawn from Alvarez-Valin et al., 1999).
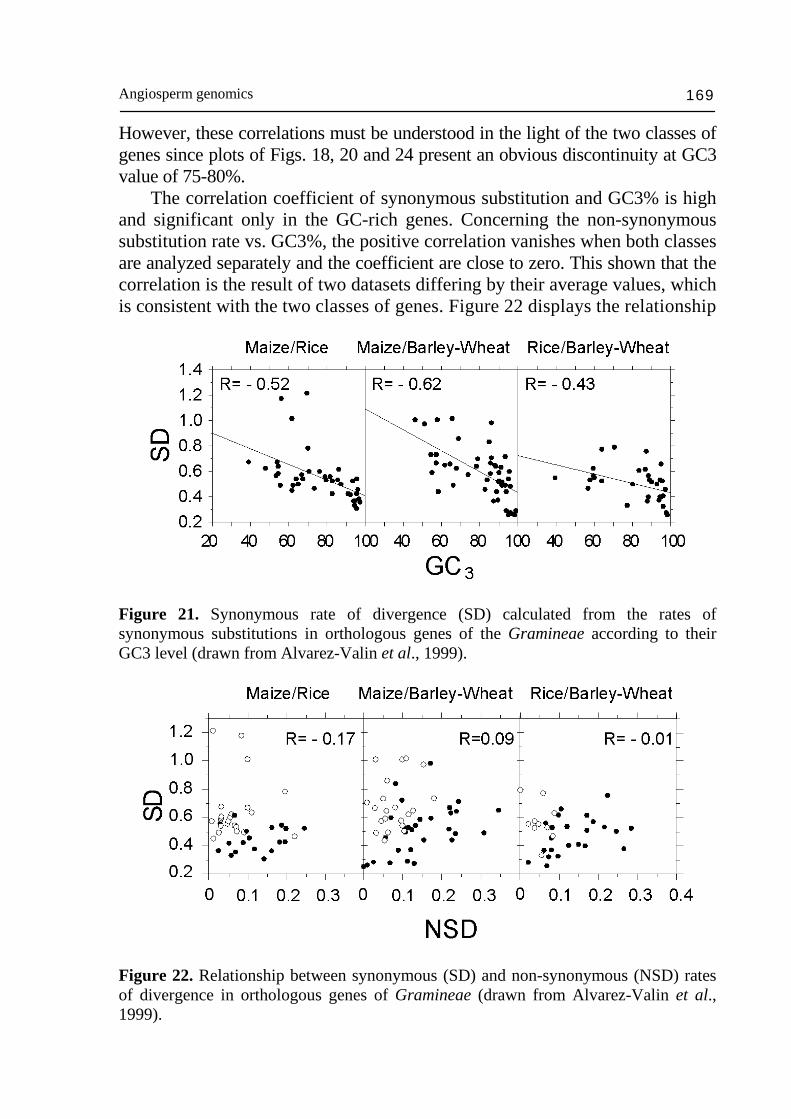
Angiosperm genomics 169
However, these correlations must be understood in the light of the two classes of genes since plots of Figs. 18, 20 and 24 present an obvious discontinuity at GC3 value of 75-80%. The correlation coefficient of synonymous substitution and GC3% is high and significant only in the GC-rich genes. Concerning the non-synonymous substitution rate vs. GC3%, the positive correlation vanishes when both classes are analyzed separately and the coefficient are close to zero. This shown that the correlation is the result of two datasets differing by their average values, which is consistent with the two classes of genes. Figure 22 displays the relationship
Figure 21. Synonymous rate of divergence (SD) calculated from the rates of synonymous substitutions in orthologous genes of the Gramineae according to their GC3 level (drawn from Alvarez-Valin et al., 1999).
Figure 22. Relationship between synonymous (SD) and non-synonymous (NSD) rates of divergence in orthologous genes of Gramineae (drawn from Alvarez-Valin et al., 1999).
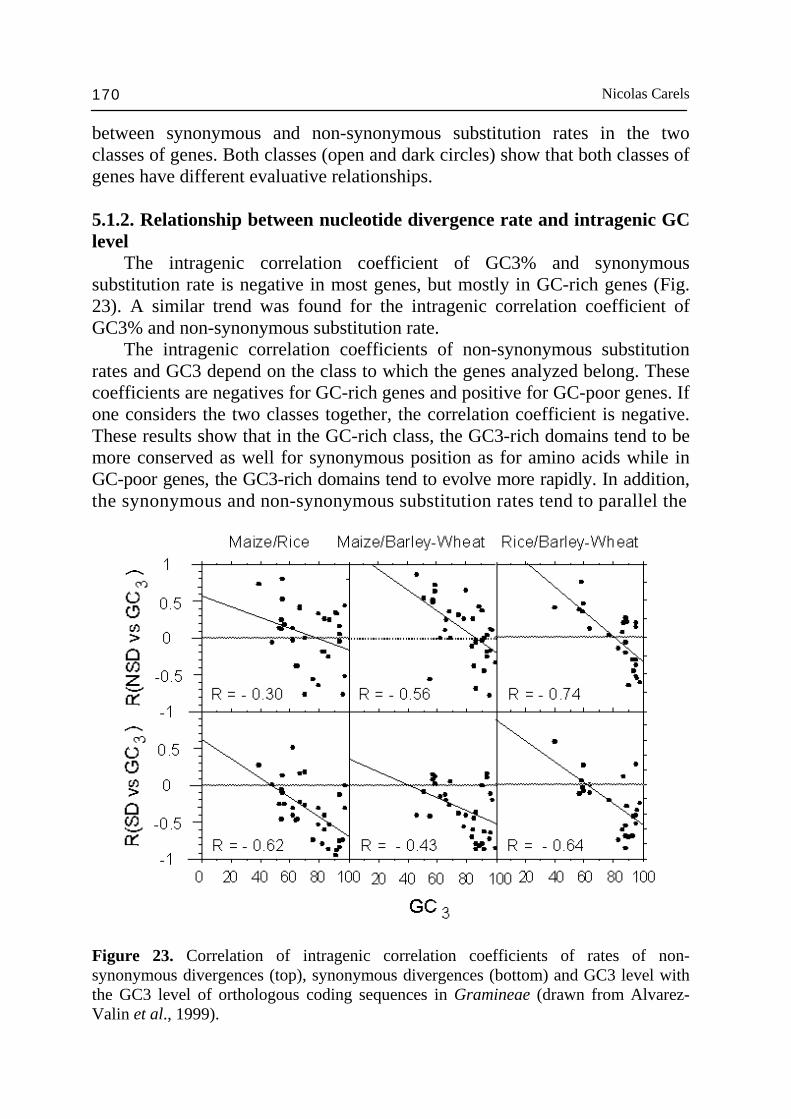
Nicolas Carels 170
between synonymous and non-synonymous substitution rates in the two classes of genes. Both classes (open and dark circles) show that both classes of genes have different evaluative relationships. 5.1.2. Relationship between nucleotide divergence rate and intragenic GC level The intragenic correlation coefficient of GC3% and synonymous substitution rate is negative in most genes, but mostly in GC-rich genes (Fig. 23). A similar trend was found for the intragenic correlation coefficient of GC3% and non-synonymous substitution rate. The intragenic correlation coefficients of non-synonymous substitution rates and GC3 depend on the class to which the genes analyzed belong. These coefficients are negatives for GC-rich genes and positive for GC-poor genes. If one considers the two classes together, the correlation coefficient is negative. These results show that in the GC-rich class, the GC3-rich domains tend to be more conserved as well for synonymous position as for amino acids while in GC-poor genes, the GC3-rich domains tend to evolve more rapidly. In addition, the synonymous and non-synonymous substitution rates tend to parallel the
Figure 23. Correlation of intragenic correlation coefficients of rates of non-synonymous divergences (top), synonymous divergences (bottom) and GC3 level with the GC3 level of orthologous coding sequences in Gramineae (drawn from Alvarez-Valin et al., 1999).
Angiosperm genomics 171
GC3 variation. Therefore, the intragenic profiles of synonymous substitution rates and amino acids are linked in a similar way to the GC3 variations. Moreover in the GC-poor class, the synonymous substitution rate is high and the non-synonymous substitution rate is low while this trend tends to be inverted in the GC-rich class. The evolution speed difference in the two classes of genes is evident from the trend discontinuity between GC-poor and GC-rich orthologous genes from maize and Arabidopsis (Fig. 17). These results are in agreement with those of mammals (Alvarez-Valin et al., 1998). 5.2. The functional implications of the two classes of genes As stressed above, the vast majority of dicots and monocots studied so far are GC-poor (~38-40% GC, on the average). The GC bias is a feature that appeared in the common ancestor of Gramineae (~45-47% GC, on the average). Since Gramineae are relatively young (~70 My) in the plant kingdom history, it is parcimonious to consider that the majority of angiosperms are GC-poor and that the compositional transition is a recent acquisition in higher angiosperms (Carels et al., 1998). Various genome features may have coevolved with the compositional transition. For example, in spite of the similarities of the snRNA sequences in the spliceosome of mammals and plants, the splicing of mammal premRNA or hybrids between premRNA of plants and mammals, is generally unoperant, or even erroneous when it is carried out by dicot cells. The inability of heterologous premRNA splicing is not only limited to differences between dicots and mammals, but also applies to the inability of Gramineae premRNA splicing by dicots. By contrast, the dicots premRNA, are efficiently spliced by Gramineae cells. Gramineae are much less demanding concerning AU levels of introns provided that certain necessary AU-rich signals are present. The maize spliceosome is able to splice introns that do not contain signals known to be absolutely essential in other organisms. Moreover, maize is able to splice premRNA containing introns with hairpin structures (stem-loop structures) that are not normally spliced by the tobacco spliceosome. The spliceosome flexibility of Gramineae enables them to splice mammals premRNA, although sometimes imperfectly (cf Simpson and Filipowicz, 1996 for a review). Such co-evolution could have affected other biochemical processes/ structures and led to a kind of gene specialization. For example, since introns are much more numerous in GC-poor than in GC-rich genes alternative splicing have higher probability to occur in GC-poor than in GC-rich genes. The presence of introns in the premRNA can have important effects on the expression level of the transcript in the higher plants (cf Luehrsen et al., 1994; Sinibaldi and Mettler, 1992; Koziel et al., 1996; Ner-Gaon et al., 2004). The cosuppression of post-transcription products in transgenic plants due to the alteration of the RNA encoded by introns, and thus
Nicolas Carels 172
to the alteration of the premRNA splicing quality in these plants, illustrates this observation (Baulcombe, 1996). Moreover, the regulation of gene expression due to scaffold/matrix attachment regions located within introns (Rudd et al., 2004) has also higher probability to occur in GC-poor genes. Since GC-rich genes are generally deprived of introns they must rely on other type of regulation for their expression. In addition, the ratio of CpG observed over expected in GC-poor genes is generally far lower than in GC-rich genes and this independently of the gene expression level reached by these genes (Fig. 24). By CpG observed one means their frequency in the sequence obtained by counting. By CpG expected one means their frequency in the sequence in the absence of any bias. In the absence of any bias, CpG and GpC frequencies are equal (GpC is not normally biased). As a result, the ratio of CpG observed over expected (CpG O/E) gives a measure of the CpG frequency bias. This suggests that CpG methylation occurs in CDS of most GC-poor genes and that deamination of methylated CpG in TpG (Salser, 1977; Coulondre et al., 1978) may justify the CpG shortage of these genes. Methylation may act as a regulation process of gene expression by switching them on and off (Oakeley et al., 1997; Xiao et al., 2003; Kinoshita et al., 2004). Mutants for methylation have obvious effects on plant development (Finnegan et al., 1996). In contrast, GC-rich genes were found to be CpG observed over expected > 0.95. This means that methylation in CpG does not normally occur or more probably that GC-rich genes are kept demethylated, which is consistent with the fact that these genes can be regarded as CpG islands (Fig. 24). A possibility would be that these genes would conserve a demethylated stage throughout the complete plant cycle by imprinting (Xiao et al., 2003), a consequence of the necessity of their fast transcription (Vinogradov, 2003b; 2004) at a critical plant life stage. If this mechanism is indeed significant in the real case, it would probably positively select these genes for high GC and CpG levels in the context of a GC bias. Matassi et al. (1989) showed that the use of synonymous codon differs between dicots and Gramineae. The alternative choice between several synonymous codons gives flexibility to the genome regarding GC utilization for each encoded amino acid. It was believed that the third position was completely neutral, so that the codon choice would remain without effect on the protein sequence (Caccio et al., 1995). However, today we know that it is not the case since there is a positive correlation between GC1, GC2 and GC3 (D'Onofrio et al., 1991). Consequently, the regional increase in GC% of the ~100 kb DNA fragments because of the compositional transition, is reflected on the increase in GC3 and to some extend also in GC1 and GC2 inducing a modification of amino acids balance in the proteins in agreement with constraints such as genetic code (amino acid balance in proteins) and gene expression (optimal codons,
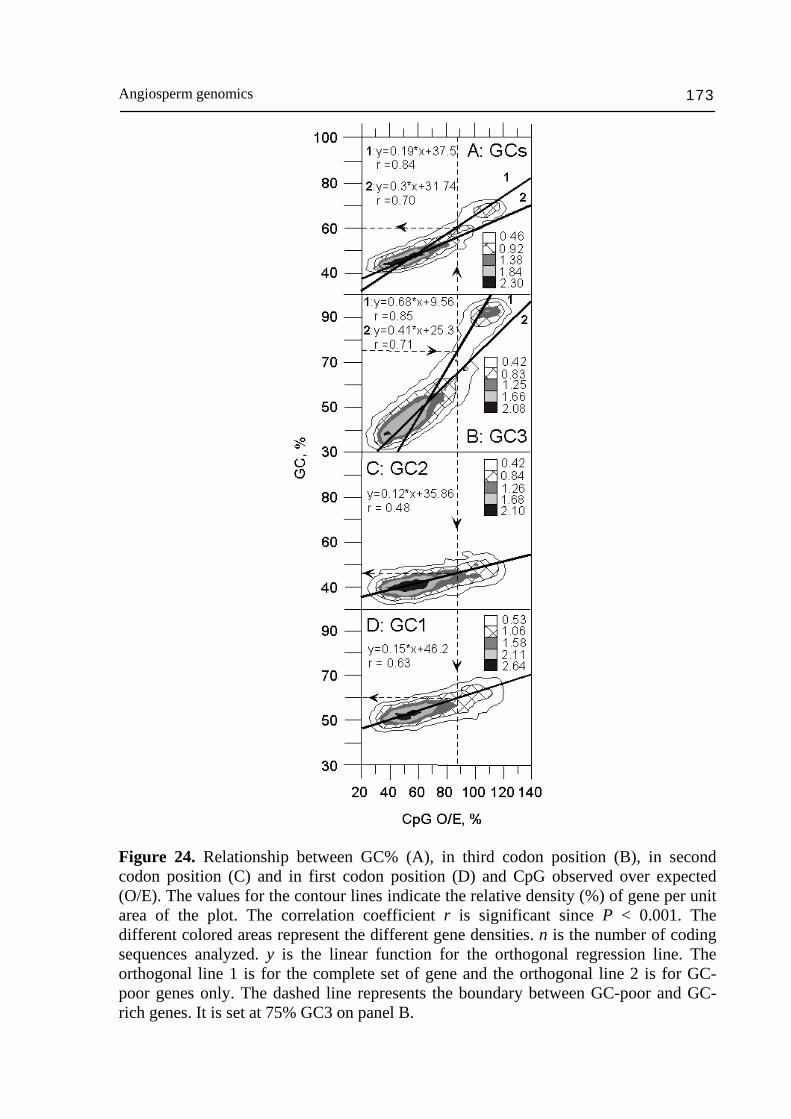
Angiosperm genomics 173
Figure 24. Relationship between GC% (A), in third codon position (B), in second codon position (C) and in first codon position (D) and CpG observed over expected (O/E). The values for the contour lines indicate the relative density (%) of gene per unit area of the plot. The correlation coefficient r is significant since P < 0.001. The different colored areas represent the different gene densities. n is the number of coding sequences analyzed. y is the linear function for the orthogonal regression line. The orthogonal line 1 is for the complete set of gene and the orthogonal line 2 is for GC-poor genes only. The dashed line represents the boundary between GC-poor and GC-rich genes. It is set at 75% GC3 on panel B.
Nicolas Carels 174
tRNA population). The modification of the spectrum of amino acid in proteins encoded by GC-rich genes can be detected from the positive slopes of the orthogonal regressions of GC1, GC2 vs GC3 (unpublished results). Plants having coding sequences with GC3 > 90% are characterized by the absence of a number of codons (23 to 31) and by a low level of some others. Bias between observed and expected codon frequencies is obvious in the Gramineae genes ranging above GC3 = 80-90%, and perhaps already above GC3 = 70%. The coding sequences having less than 70% of GC3 have codon avoidance levels varying between 0 and 52% in the case of maize. The broad variations of the codon use not only concern the genome of Gramineae, but also those of dicots such as tobacco and soyabean. A similar codon avoidance has also been observed in other plants and in particular in tobacco for GC3 values below 30% which shows that the GC bias in these plants are rather biased toward AT. This is obvious from the fact that GC3 is lower than GC1 in Arabidopsis, but also in Fabaceae and in Solanaceae (Carels et al., 1998). Consistently with D’Onofrio et al. (1999) the four fold degenerated amino acid with aliphatic side chains: Arginine, Valine and in a minor proportion Glycine, Threonine, were more frequent in highly expressed GC-rich genes, which shows that net hydrophobicity increased in the encoded proteins. On the other hand, the two fold degenerated amino acid with basic, acid and amide functions: Lysine, Glutamate and in a minor proportion Glutamine, Aspartate, were more frequent in highly expressed GC-poor genes, and the net hydrophobicity decreased in the encoded proteins. The hydropathy difference between proteins of both groups was statistically significant using the student test and as high as a ~10 time factor (Carels, unpublished results). 5.3. The implication of the two classes of genes for plant genome evolution As far as the two modes of evolution are concerned, two different viewpoints were put forward in the analogous case of vertebrates (see also Bernardi et al., 1997). The first one (Bernardi and Bernardi, 1986) was that a selective advantage favored GC increases in the synonymous positions of most genes. Once these high values had been reached, the selective advantage favored compositionally conservative changes in these GC-rich synonymous positions. The second one was that repair (Filipski, 1987), replication (Wolfe et al., 1989) or recombination (Eyre-Walker, 1990) biases were the cause of the changes and of the subsequent conservation. In fact in most likelihood, all these factors are involved in the evolution of plant genomes. A detailed analysis of synonymous substitution in quartet codons of genes from four mammalian orders (Cacciò et al., 1995; Zoubak et al., 1995) has shown that, while GC3-poor positions show the frequencies of substitution and
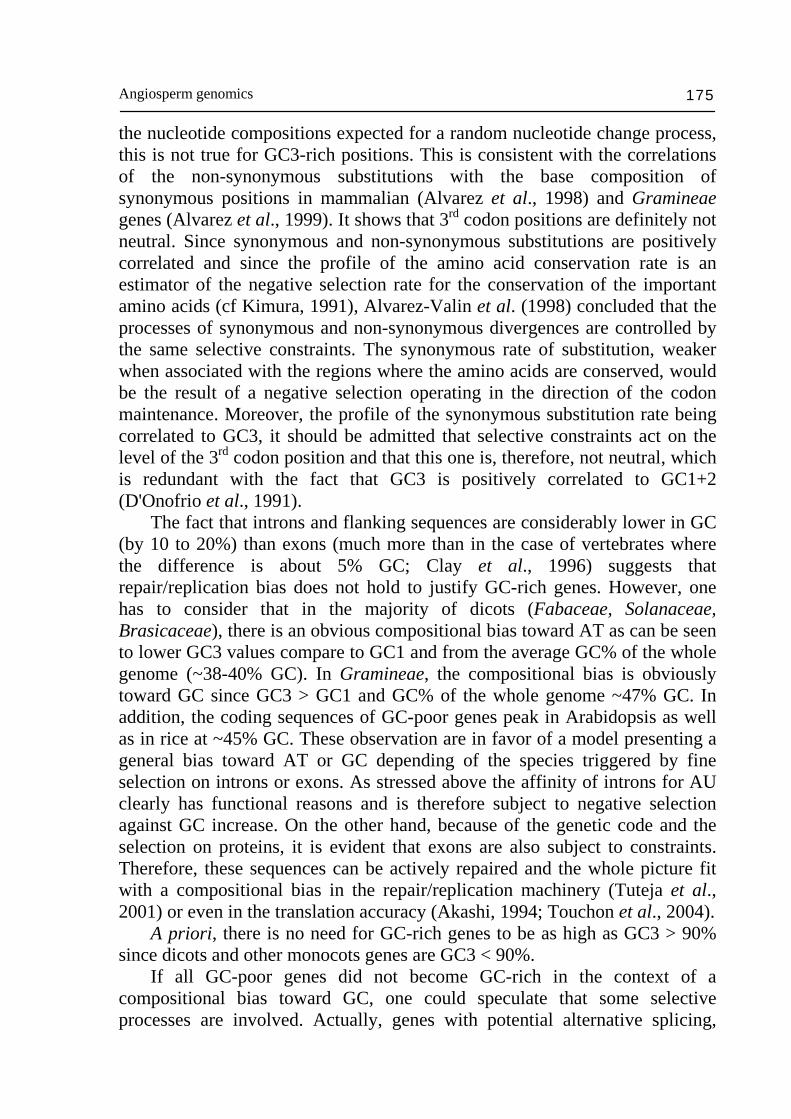
Angiosperm genomics 175
the nucleotide compositions expected for a random nucleotide change process, this is not true for GC3-rich positions. This is consistent with the correlations of the non-synonymous substitutions with the base composition of synonymous positions in mammalian (Alvarez et al., 1998) and Gramineae genes (Alvarez et al., 1999). It shows that 3rd codon positions are definitely not neutral. Since synonymous and non-synonymous substitutions are positively correlated and since the profile of the amino acid conservation rate is an estimator of the negative selection rate for the conservation of the important amino acids (cf Kimura, 1991), Alvarez-Valin et al. (1998) concluded that the processes of synonymous and non-synonymous divergences are controlled by the same selective constraints. The synonymous rate of substitution, weaker when associated with the regions where the amino acids are conserved, would be the result of a negative selection operating in the direction of the codon maintenance. Moreover, the profile of the synonymous substitution rate being correlated to GC3, it should be admitted that selective constraints act on the level of the 3rd codon position and that this one is, therefore, not neutral, which is redundant with the fact that GC3 is positively correlated to GC1+2 (D'Onofrio et al., 1991). The fact that introns and flanking sequences are considerably lower in GC (by 10 to 20%) than exons (much more than in the case of vertebrates where the difference is about 5% GC; Clay et al., 1996) suggests that repair/replication bias does not hold to justify GC-rich genes. However, one has to consider that in the majority of dicots (Fabaceae, Solanaceae, Brasicaceae), there is an obvious compositional bias toward AT as can be seen to lower GC3 values compare to GC1 and from the average GC% of the whole genome (~38-40% GC). In Gramineae, the compositional bias is obviously toward GC since GC3 > GC1 and GC% of the whole genome ~47% GC. In addition, the coding sequences of GC-poor genes peak in Arabidopsis as well as in rice at ~45% GC. These observation are in favor of a model presenting a general bias toward AT or GC depending of the species triggered by fine selection on introns or exons. As stressed above the affinity of introns for AU clearly has functional reasons and is therefore subject to negative selection against GC increase. On the other hand, because of the genetic code and the selection on proteins, it is evident that exons are also subject to constraints. Therefore, these sequences can be actively repaired and the whole picture fit with a compositional bias in the repair/replication machinery (Tuteja et al., 2001) or even in the translation accuracy (Akashi, 1994; Touchon et al., 2004). A priori, there is no need for GC-rich genes to be as high as GC3 > 90% since dicots and other monocots genes are GC3 < 90%. If all GC-poor genes did not become GC-rich in the context of a compositional bias toward GC, one could speculate that some selective processes are involved. Actually, genes with potential alternative splicing,
Nicolas Carels 176
down regulation due to scaffold/matrix attachment regions would most probably be selected against GC increase. In contrast, continuously/highly expressed (Vinogradov, 2003c) and actively repaired genes (Gorbunova and Levy, 1999; Vergust and Hooykaas, 1999) are more likely to be selected for GC increase in the context of a compositional bias toward GC. Among such genes, those for carbohydrate transport and metabolism, cell wall synthesis, extracellular structures and secondary metabolites synthesis fit well with the general picture (Carels, unpublished results). Those genes are essential for energy management, physical structure and defense, i.e. for the cell relation with its environment. In contrast, GC-poor genes are concentrated on functions dealing with the cell mechanics and general functions, i.e. the cell identity (Carels, unpublished results). This picture could be completed by a higher mutation effect on GC-poor genes as observed by the higher synonymous and non-synonymous substitution rates in these genes probably due at least in part to deamination of mC in T at mCps sites. Since GC-rich genes in Gramineae match also the definition of CpG islands, it is likely that they also benefit their particular properties such as chromatin modification, low level or absence of methylation in CpG, histone acetylation, higher recombination rate.
Figure 25. Distribution of Arabidopsis coding sequences orthologous to the highly expressed GC-poor (light gray) and GC-rich (dark gray) rice coding sequences (Carels, unpublished results). The black curve is for the total sample. The difference of average GC3% of Arabidopsis coding sequences orthologous to GC-poor and GC-rich rice coding sequences is statistically significant. This indicates that rice GC-rich sequences tend to be GC-rich as well in Arabidopsis. The KOG annotations of the Arabidopsis genes show significant function differences between the two classes of genes (Carels, unpublished results). This gene function specialization according to GC3 level is also correlated to gene structure (see Carels and Bernardi, 2000a).
Angiosperm genomics 177
Above, we saw that GC-rich genes (i) are positively selected for GC accumulation in the context of a compositional bias toward GC (Gramineae), (ii) negatively selected for amino acid variation, (iii) show a positive correlation for GC% in synonymous and non-synonymous codon positions, and (iv) are also GC-rich in the context of a compositional bias toward AT (Fig. 25). These features imply that (i) the protein domains encoded by GC-rich genes are conserved, (ii) they deserve important biological functions and (iii) these important biological functions have affinities for high GC levels. 6. Conclusions It has been found that: (i) the genome of the common ancestor of Gramineae underwent a compositional transition such as in warm-blooded vertebrates with the consequence of a regional increase of the GC level in intergenic sequences and in 3rd codon position. In contrast, such as transition did not take place in the majority of dicots and monocots. (ii) The GC level in 3rd codon position is correlated positively with the GC1+2 or GC2 and GC1 levels. (iii) The compositional transition did not affect significantly gene structure: exon/intron relationship, but rather their composition. The CDS of GC-poor genes are more frequently interrupted by large introns than GC-rich genes. (iv) The angiosperm genes belong to two classes on the basis of their GC level. (v) GC-poor and GC-rich genes vary at least for gene structure, methylation/reparation, CpG frequency, expression regulation, alternative splicing, codon usage, hydropathy and cellular functions. (vi) The genes of the two classes evolve at different speeds. (vii) In angiosperms as in the vertebrates, the gene density is not homogeneous throughout the genome. (viii) In large genomes, the gene location is correlated to the regional GC level of the genome and also obeys physical constraints. (xix) The relationship between gene density and regional GC level is different in plants and vertebrates and leads to a very different genome phenotype even if the determinants seem to be qualitatively the same. (x) In maize, the majority of the genes are located in a narrow GC interval of 48% +/- 2% (10 times narrower than in humans) (xi) The correlation level between GC3 and regional GC is the same as for humans but the slope of the regression line is two times higher. (xii) In rice, significant relationship between GC3 and regional GC disappeared most likely because of illegitimate recombination. (xiii) In Arabidopsis, the genome is strikingly homogeneous, but cryptic organization according to GC level can still be found. For instance, the distal parts of chromosome 5 are more GC-rich, on average, than in the central part. The GC level of genes and coding sequences follow similar trends. The expression level of genes is also higher in the distal part compared with the central part of the chromosomes. (xiv) The Arabidopsis genome can be broken up into two components, GC-poor and GC-rich
Nicolas Carels 178
respectively that display cryptic, but significant different features that are more contrasted in genomes of higher complexity such as that of the human. The GC-poor one matches the central chromosomal regions and the GC-rich one matches the distal chromosomal regions. (xv) The GC-poor component accounts for approximately 46% of the genome and is lower in genes than the GC-rich component that accounts for the remaining 54%. (xvi) The gene clustering seems to be conserved in all large plant genomes and preserved by mechanisms of retrotransposon elimination. (xvii) The non-storage protein genes of maize are also gathered in two compositional compartments according (roughly) to their GC level. However, this compositional compartmentalization displays a strong tendency to uniformity as occurred in rice. It is increasingly clear that the genome is an highly organized and compartmentalized entity at all its structural levels. Each genome phenotype is a strategic choice where the means that are implemented are balanced with internal and external constraints. These constraints have effects on the choice of nucleotides in the sequence, but also on the gene organization via the balance between introns and exons, and even at a larger scale on the regional GC level, on the gene distribution and on the chromosomal organization itself. The continuous confrontation between genome innovations and the constraints derived from the resource availability or the environmental pressure determines specific adaptations or strategies. GC level is a simple parameter to investigate the resulting genome organization. The genome phenotype is a kind of photograph taken at a given moment of a genetic entity in the course of its evolution. It tells the modification of the genomic formula from time to time or from taxa to taxa. Acknowledgements We thank Carter Miller for the manuscript revision. Part of this work was suported by the Brazilian CNPq and FAPESB agencies providing research fellowships to N. Carels. The following institutions are acknowledged for their support to the experimental work of the autor: Institut Jacques Monod (www.ijm.jussieur.fr), Stazione Zoologica ‘Anton Dohrn’ (www.szn.it), Centro de Astrobiología (www.cab.inta.es), Universidade Estadual de Santa Cruz (www.uesc.br) and Universidade Livre da Mata Atlântica (www.wwiuma.org.br). References 1. Aert, R., Sagi, L. and Volckaert, G. (2004) Gene content and density in banana
(Musa acuminata) as revealed by genomic sequencing of BAC clones. Theor. Appl. Genet. 109, 129-39.
2. Ahn, S. and Tanksley, S.D. (1993) Comparative linkage maps of the rice and maize genomes. Proc. Natl. Acad. Sci. USA 90, 7980-7984.
Angiosperm genomics 179
3. Aïssani, B. and Bernardi, G. (1991a) CpG islands: features and distribution in the genome of vertebrates. Gene 106, 173-183.
4. Aïssani, B. and Bernardi, G. (1991b) CpG islands, genes and isochores in the genome of vertebrates. Gene 106, 185-195.
5. Aïssani, B., D'Onofrio, G., Mouchiroud, D., Gardiner, K., Gautier, C. and Bernardi, G. (1991) The compositional properties of human genes. J. Mol. Evol. 32, 497-503.
6. Akashi, H. (1994) Synonymous codon usage in Drosophila melanogaster: natural selection and translation accuracy. Genetics 136, 927-935.
7. Akhunov, E.D., Goodyear, A.W., Geng, S., Qi, L.L., Echalier, B., Gill, B.S., Miftahudin, Gustafson, J.P., Lazo, G., Chao, S., Anderson, O.D., Linkiewicz, A.M., Dubcovsky, J., La Rota, M., Sorrells, M.E., Zhang, D., Nguyen, H.T., Kalavacharla, V., Hossain, K., Kianian, S.F., Peng, J., Lapitan, N.L., Gonzalez-Hernandez, J.L., Anderson, J.A., Choi, D.W., Close, T.J., Dilbirligi, M., Gill, K.S., Walker-Simmons, M.K., Steber, C., McGuire, P.E., Qualset, C.O. and Dvorak, J. (2003) The organization and rate of evolution of wheat genomes are correlated with recombination rates along chromosome arms. Genome Res. 13, 753-763.
8. Alkhimova, O.G., Mazurok, N.A., Potapova, T.A., Zakian, S.M., Heslop-Harrison, J.S. and Vershinin, V.A. (2004) Diverse patterns of the tandem repeats organization in rye chromosomes Chromosoma 113, 42-52
9. Alvarez-Valin, F., Jabbari, K. and Bernardi, G. (1998) Synonymous and non-synonymous substitutions in mammalian genes: intragenic correlations. J. Mol. Evol. 46, 37-44.
10. Alvarez-Valin, F., Jabbari, K., Carels, N. and Bernardi, G. (1999) Synonymous and nonsynonymous substitutions in genes from Gramineae: intragenic correlations. J. Mol. Evol. 49, 330-342.
11. Ambros, P.F. and Sumner, A.T. (1987) Correlation of pachytene chromomeres and metaphase bands of human chromosomes, and distinctive properties od telomeric regions. Cytogen. Cell Genet. 44, 223-228.
12. Antequera, F. and Bird, A.P. (1988) Unmethylated CpG islands associated with genes in higher plant DNA. EMBO. J. 7, 2295-229.
13. Arabidopsis Genome Initiative (2000) Analysis of the genome sequence of the flowering plant Arabidopsis thaliana. Nature 408, 796-815.
14. Axelrod, A.J. (1952) A theory of angiosperm evolution. Evolution 6, 29-60. 15. Axelrod, D.J. (1959) Poleward migration of early angiosperm flora. Science 130,
203-207. 16. Barakat, A., Carels, N. and Bernardi, G. (1997) The distribution of genes in the
genomes of Gramineae. Proc. Natl. Acad. Sci. USA 94, 6857-6861. 17. Barakat, A., Tran Han, D., Benslimane, A.-A., Rode, A. and Bernardi G. (1999)
The gene distribution in the genomes of pea, tomato and date palm. FEBS L. 463, 139-142.
18. Barakat, A., Gallois, P., Raynal, M., Mestre-Ortega, D., Sallaud, C., Guiderdoni, E., Delseny, M. and Bernardi, G. (2000) The distribution of T-DNA in the genomes of transgenic Arabidopsis and rice. FEBS L. 471, 161-164.
19. Bass, H.W., Marshall, W.F., Sedat, J.W., Agard, D.A. and Cande, W.Z. (1997) Telomeres cluster de novo before the initiation of synapsis: a three dimensional
Nicolas Carels 180
spatial analysis of telomere positions before and during meiotic prophase. J. Cell Biol. 137, 5-118.
20. Baulcombe, D.C. (1996) RNA as a target and an initiator of post-transcriptional gene silencing in transgenic plants. Plant Mol. Biol. 32, 79-88.
21. Beaton, M.J. and Cavalier-Smith, T. (1999) Eukaryotic non-coding DNA is functional: evidence from the differential scaling of cryptomonad genomes. Proc. R. Soc. Lond. B 266, 2053-2059.
22. Bell, M.V., Cowper, A.E., Lefranc, M.P., Bell, J.I. and Screaton, G.R. (1998) Influence of intron length on alternative splicing of CD44. Mol. Cell Biol. 18, 5930-5941.
23. Bennett, M.D. (1972) Nuclear DNA content and minimum generation time in herbaceous plants. Proc. R. Soc. Lond. B. Biol. Sci. 181, 109-135.
24. Bennett, M.D. (1987) Variation in genomic form in plants and its ecological implications. New Phytol. 106 [Suppl], 177-200.
25. Bennett, M.D. (1996) The nucleotype, the natural karyotype and the ancestral genome. Symp. Soc. Exp. Biol. 50, 45-52.
26. Bennett, M.D. and Smith, J.B. (1991) Nuclear DNA amounts in angiosperms. Phil. Trans. R. Soc. Lond. B 334, 309-345.
27. Bennetzen, J.L. and Freeling, M. (1993) Grasses as a single genetic system: genome composition, collinearity and compatibility. Trends Genet. 9, 259-261.
28. Bennetzen, J.L. (1996) The contributions of retroelements to plant genome organization, function and evolution. Trends Microbiol. 4, 347-353.
29. Bennetzen, J.L., Coleman, C., Liu, R., Ma, J. and Ramakrishna, W. (2004a) Consistent over-estimation of gene number in complex plant genomes. Curr. Opin. in Plant Biol. 7, 732-736.
30. Bennetzen, J.L., Ma, J. and Devos, K.M. (2004b) Mechanisms of Recent Genome Size Variation in Flowering Plants. Annals of Botany 95, 127-132.
31. Berardini, T.Z., Mundodi, S., Reiser, L., Huala, E., Garcia-Hernandez, M., Zhang, P., Mueller, L.A., Yoon, J., Doyle, A., Lander, G., Moseyko, N., Yoo, D., Xu, I., Zoeckler, B., Montoya, M., Miller, N., Weems, D. and Rhee, S.Y. (2004) Functional Annotation of the Arabidopsis Genome Using Controlled Vocabularios. Plant Physiol. 135, 745-755.
32. Bernardi, G. (1985) The organization of the vertebrate genome and the problem of the CpG shortage (eds. G.L. Cantoni and A. Razin) Prog. in Clinic. and Biol. Res. 198, 3-10.
33. Bernardi, G. and Bernardi, G. (1986) Compositional constraints and genome evolution. J. Mol. Evol. 24, 1-11.
34. Bernardi, G. (1989) The isochore organization of the human genome. Annu Rev. Genet. 23, 637-661.
35. Bernardi, G. (1993a) The human genome organization and its evolutionary history: a review. Gene 135, 57-66.
36. Bernardi, G. (1993b) The vertebrate genome : isochores and evolution. Mol. Biol. Evol. 10, 186-204.
37. Bernardi, G. and Bernardi, G. (1990a) Compositional patterns in the nuclear genomes of cold-blooded vertebrates. J. Mol. Evol. 31, 265-281.
38. Bernardi, G. and Bernardi, G. (1990b) Compositional transitions in the nuclear genomes of cold-blooded vertebrates. J. Mol. Evol. 31, 282-293.
Angiosperm genomics 181
39. Bernardi, G., Hughes, S. and Mouchiroud, D. (1997) The major compositional transitions in the vertebrate genome. J. Mol. Evol. 44, S44-S51.
40. Bernardi, G. (2000) Isochores and the evolutionary genomics of vertebrates. Gene 241, 3-17.
41. Bernardi, G. (2001) Misunderstandings about isochores. Part 1. Gene 276, 3-13. 42. Bettecken, T., Aïssani, B., Müller, C.R. and Bernardi, G. (1992) Compositional
mapping of the human dystrophin gene. Gene 122, 329-35. 43. Bezdek, M., Koukalova, B., Brzobohaty, B. and Vyskot, B. (1991). 5-Azacytidine-
induced hypomethylation of tobacco HRS60 tandem DNA repeats in tissue culture. Planta 184, 487-490.
44. Bickmore, W. and Craig, J. (1997) Chromosome Bands: Patterns in the Genome. Springer, New York.
45. Biradar, D.P., Bullock, D.G. and Rayburn, L.A. (1994) Nuclear DNA amount, growth, and yield parameters in maize. Theor. Appl. Genet. 88, 557-560.
46. Blanc, G. and Wolfe, K.H. (2004) Widespread paleopolyploidy in model plant species inferred from age distributions of duplicate genes. The Plant Cell 16, 1667-1678.
47. Bonen, L., Huh, T.Y. and Gray, T.W. (1980) Can partial methylation explain the complex fragment patterns observed when plant mitochondrial DNA is cleaved with restriction endonucleases? FEBS L. 111, 340-346.
48. Borevitz, J.O. and Ecker, J.R. (2004) PLANT GENOMICS: The Third Wave. Annu. Rev. Genomics Hum. Genet. 5, 443-477.
49. Bouneau, L., Fischer, C., Ozouf-Costaz, C., Froschauer, A., Jaillon, O., Coutanceau, J.P., Korting, C., Weissenbach, J., Bernot, A. and Volff, J.N. (2003) An active non-LTR retrotransposon with tandem structure in the compact genome of the pufferfish Tetraodon nigroviridis. Genome Res. 13, 1686-1695.
50. Bullock, D.G. and Rayburn, A.L. (1991) Genome size variation in the southwestern US Indian maize populations may be a function of effective growing season. Maydica 36, 247-250.
51. Bureau, Th.E. and Wessler, S.R. (1992) Tourist: A large family of small inverted repeat elements frequently associated with maize genes. The plant cell 4, 1283-1294.
52. Cacciò, S., Zoubak, S., D'Onofrio, G. and Bernardi, G. (1995) Nonrandom frequency patterns of synonymous substitutions in homologous mammalian genes. J. Mol. Evol. 40, 280-292.
53. Capel, J, Montero, L.M., Martinez-Zapater, J.M. and Salinas, J. (1993) Non-random distribution of transposable elements in the nuclear genome of plants. Nucleic Acids Res. 21: 2369-73.
54. Capy, P. (1998). A plastic genome. Nature 396, 522-523. 55. Carels, N., Barakat, A. and Bernardi, G. (1995) The gene distribution of the maize
genome. Proc. Nat. Acad. Sci. USA 92, 11057-11060. 56. Carels, N. and Bernardi, G. (2000a) Two classes of genes in plants. Genetics 154,
1819-1825. 57. Carels, N. and Bernardi, G. (2000b) The compositional organization and the
expression of the Arabidopsis genome. FEBS L. 472, 302-306. 58. Carels, N., Hatey, P, Jabbari, K. and Bernardi, G. (1998) Compositional properties
of homologous coding sequences from plants. J. Mol. Evol. 46, 45-53.
Nicolas Carels 182
59. Carels, N., Vidal, R., Mansilla, R. and Frías, D. (2004) The mutual information theory for the certification of rice coding sequences. FEBS L. 568, 155-158.
60. Carels, N. (2005) The maize gene space is compositionally compartimentalized. FEBS L. 579, 3867-3871.
61. Castilho, A., Neves, N., Rufini-Castiglione, M., Viegas, W., and Heslop-Harrison, J.S. (1999). 5-Methylcytosine distribution and genome organization in Triticale before and after treatment with 5-azacytidine. J. Cell Sci. 112, 4397-4404.
62. Causse, M., Santoni, S., Damerval, C., Maurice, A., Charcosset, A., Deatrick, J. and de Vienne, D. (1996) A composite map of expressed sequences in maize. Genome 39, 418-432.
63. Cavalier-Smith, T. (2005) Economy, speed and size matter: evolutionary forces driving nuclear genome miniaturization and expansion. Annals of Botany 95, 147-175.
64. Cavalini, A. and Natali, L. (1991) Intraspecific variation of nuclear DNA content in plant species. Caryologia 44, 93-107.
65. Chao, S., Baysdorfer, C., Herdia-Dias, O., Musket, T., Xu, G. and Coe, Jr.E.H. (1994) RFLP mapping of partially sequenced leaf cDNA clones in maize. Theor. Appl. Genet. 88, 717-721.
66. Chase, M.W. et al. (41 autors) (1993) Phylogenetics of seed plants: An analysis of nucleotide sequences from the plastid gene rbcl. Missouri Bot. Gard. 80, 528-580.
67. Chavanne, F., Zhang, D.X., Liaud, M.F. and Cerff, R. (1998) Structure and evolution of Ty3/Gypsy family highly amplified in pea and other legume species. Plant Mol. Biol. 37, 363-375.
68. Chaw, S.-M., Chang, C.-C., Chen, H.-L. and Li, W.-H. (2004) Dating the Monocot–Dicot Divergence and the Origin of Core Eudicots Using Whole Chloroplast Genomes. J. Mol. Evol. 58, 424-441.
69. Chiapello, H., Lisacek, F., Caboche, M. and Henaut, A. (1998) Codon usage and gene function are related in sequences of Arabidopsis thaliana. Gene 209, GC1-GC38.
70. Clay, O., Caccio, S., Zoubak, S., Mouchiroud, D. and Bernardi, G. (1996) Human coding and non coding DNA: compositional correlations. Mol. Phylogenet. Evol. 5, 2-12.
71. Cornet, B. (1989a) The reproductive morphology and biology of Sanmiguela lewisii, and its bearing on angiosperm evolution in the late Triassic. Evol. Trends in Plants 3, 25-51.
72. Cornet, B. (1989b) Late Triassic angiosperm-like pollen from the Richmond Rift Basin of Virginia, U.S.A. Palaeontogr. B 213, 37-87.
73. Coulondre, C., Miller, J.H., Farabaugh, P.J. and Gilbert, W. (1978) Molecular basis of base substitution hotspots in Escherichia coli. Nature 274, 775–780.
74. Crane, P.R., Friis, E.M. and Pedersen, K.R. (1995) The origin and early diversification of angiosperms. Nature 374, 27-33.
75. Crepet, W.L. and Feldman, G.D. (1991) The earliest remains of grasses in fossil record. American J. Bot. 78, 1010-1014.
76. Cruveiller, S., Jabbari, K., Clay, O. and Bernardi, G. (2003) Compositional features of eukaryotic genomes for checking predicted genes. Brief Bioinform. 4, 43-52.
Angiosperm genomics 183
77. Cuny, G., Soriano, P., Macaya, G. and Bernardi, G. (1981) The major components of the mouse and human genomes : preparation, basic properties and compositional heterogeneity. Eur. J. Biochem. 111, 227-233.
78. Darwin, C., Darwin, F. and Seward, A.C. (Eds) (1903) More letters from Charles Darwin. D. Appleton, New York.
79. De Capoa, A., Menendez, F., Poggesi, I., Giancitti, P., Grapelli, C., Marotta, M., Niveleau, A., Reynaud, C., Archidiacono, N. and Rocchi, M. (1995). Labelling by anti 5-MeC antibodies as a measure of the methylation status of human constitutive heterochromatin. Chromosome Res. 3 (suppl. 1), 45.
80. Deininger, P.L., Batzer, M.A., Hutchison, C.A. and Edgell, M.H. (1992) Master genes in mammalian repetitive DNA amplification. Trends Genet. 8, 307-311.
81. Demburg, A.F., Sedat, J.W. and Hawley, R.S. (1996) Direct evidence of a role for heterochromatin inmeiotic chromosome segregation. Cell 86, 135-146.
82. Deragon, J.M., Landry, B.S., Pelissier, T., Tutois, S., Tourmente, S. and Picard, G. (1994) An analysis of retroposition in plants based on a family of SINEs from Brassica napus. J. Mol. Evol. 39, 378-86.
83. De Sario, A., Geigl, E.M., Palmieri, G., D'Urso, M. and Bernardi, G. (1996) A compositional map of human chromosome band Xq28. Proc. Natl. Acad. Sci. USA 93, 1298-302.
84. Devos, K.M., Brown, J.K. and Bennetzen, J.L. 2002. Genome size reduction through illegitimate recombination counteracts genome expansion in Arabidopsis. Genome Res. 12, 1075-1079.
85. Dilcher, D. (2000) Toward a new synthesis: major evolutionary trends in the angiosperm fossil record. Proc. Natl. Acad. Sci. USA. 97, 7030-7036.
86. D’Onofrio, G., Mouchiroud, D., Aïssani, B., Gautier, C. and Bernardi, G. (1991) Correlations between the compositional properties of human genes, codon usage and aminoacid composition of proteins. J. Mol. Evol. 32, 504-510.
87. D’Onofrio, G. and Bernardi, G. (1992) A universal compositional correlation among codon positions. Gene 110, 81-88.
88. D’Onofrio, G., Jabbari, K., Musto, H. and Bernardi, G. (1999) The correlation of protein hydropathy with the base composition of coding sequences. Gene 238, 3-14.
89. Doolittle, W.F. and Sapienza, C. (1980) Selfish-genes, the phenotype paradigm and genome evolution. Nature 284, 601-603.
90. Doolittle, R.F., Feng, D.-F., Johnson, M.S. and McClure, M.A. (1989) Origins and evolutionary relationships of retroviruses. Q. Rev. Biol. 64, 1-30.
91. Doyle, J.A. (1998) Molecules, Morphology, Fossils, and the Relationship of Angiosperms and Gnetales. Mol. Phyl. Evol. 9, 448-462.
92. Duret, L., Mouchiroud, D. and Gautier, C. (1995) Statistical analysis of vertebrate sequences reveals that long genes are scarce in GC-rich isochores. J. Mol. Evol. 40, 308-317.
93. Dutrillaux, B. (1973) Nouveau système de marquage chromosomique : les bandes T. Chromosoma 41, 395-402.
94. Erayman, M., Sandhu, D., Sidhu, D., Dilbirligi, M., Baenziger, P.S. and Gill, K.S. (2004) Demarcating the gene-rich regions of the wheat genome. Nucleic Acids Res. 32, 3546-3565.
Nicolas Carels 184
95. Eyre-Walker, A. (1990) Recombination and mammalian genome evolution. Proc. R. Soc. London Ser B 252, 237-243.
96. Federico, C., Andreozzi, L., Saccone, S. and Bernardi, G. (2000) Gene density in the Giemsa bands of human chromosomes. Chromosome Res. 8, 737-746.
97. Fedoroff, N. (1979) On spacers. Cell 16, 697-710. 98. Ferreira, J., Paolella, G., Ramos, C. and Lamond, A.I. (1997) Spatial organization
of large-scale chromatin domains in the nucleus: a magnified view of single chromosome territories. Cell Biol. 139, 1597-1610.
99. Feschotte, C., Swamy, L. and Wessler, S.R. (2003) Genome-Wide Analysis of mariner-Like Transposable Elements in Rice Reveals Complex Relationships With Stowaway Miniature Inverted Repeat Transposable Elements (MITEs). Genetics 163, 747-758.
100. Feuillet, C. and Keller, B. (1999) High gene density is conserved at syntenic loci of small and large grass genomes. Proc. Natl. Acad. Sci. USA 96, 8265-8270.
101. Filipski, J., Thiery, J.P. and Bernardi, G. (1973) An analysis of the bovine genome by Cs2SO4-Ag+ density gradient centrifugation. J. Mol. Biol. 80, 177-97.
102. Filipski, J. (1987) Correlation between molecular clock ticking, codon usage, fidelity of DNA repair, chromosome banding and chromatin compactness in germline cells. FEBS L. 217, 184-186.
103. Finnegan, E.J., Peacock, W.J. and Dennis, E.S. (1996) Reduced DNA methylation in Arabidopsis thaliana results in abnormal plant development. Proc. Natl. Acad. Sci. USA 93, 8449-8454.
104. Flavell, R. (1982) Sequence amplification, deletion and rearrangement: major sources of variation during species divergence. In: Genome Evolution. (Eds.: Dover, G. and Flavell, R.), Academic Press, London, pp. 301-323.
105. Flavell, R.B., Bennett, M.D, Smith, J.B. and Smith, D.B. (1974) Genome size and the proportion of repeated sequence DNA in plants. Biochemical Genetics 12, 257-269.
106. Flavell, R.B., Gale, M.D., O'Dell, M., Murphy, G. and Moore, G. (1993) Molecular organization of genes and repeats in the large cereal genomes and implications for the isolation of genes by chromosome walking. Chromosomes Today 11, 199-213.
107. Frediani, M., Giraldi, E. and Ruffini-Castiglione, M. (1996). Distribution of 5-methylcytosine rich regions in the metaphase chromosomes of Vicia faba. Chromosome Res. 4, 141-146.
108. Friesen, N., Brandes, A. and Heslop-Harrison, J.S. (2001) Diversity, Origin, and Distribution of Retrotransposons (gypsy and copia) in Conifers Molecular Biology and Evolution 18, 1176-1188
109. Friis, E.M., Pedersen, K.R. and Crane, P.R. (2005) When Earth started blooming: insights from the fossil record. Curr. Opin. Plant Biol. 8, 5-12.
110. Fu, H. and Dooner, H.K. (2002) Intraspecific violation of genetic colinearity and its implications in maize. Proc. Natl. Acad. Sci. USA 99, 9573-9578.
111. Gage, M.J. and Morrow, E.H. (2003) Experimental evidence for the evolution of numerous, tiny sperm via spermcompetition. Curr. Biol. 13, 754-757.
112. Gale, M.D. and Devos, K.M. (1998) Comparative genetics in the grasses. Proc. Natl. Acad. Sci. USA 95, 1971-1974.

Angiosperm genomics 185
113. Gardiner-Garden, M. and Frommer, M. (1992) Significant CpG-rich regions in angiosperm genes. J. Mol. Evol. 34, 231-245.
114. Gardiner-Garden, M., Sved, J.A. and Frommer, M. (1992) Methylation sites in angiosperm genes. J. Mol. Evol. 34, 219-230.
115. Gilbert, N. and Labuda, D. (1999) CORE-SINEs: eukaryotic short interspersed retroposing elements with common sequence motifs Proc. Natl. Acad. Sci. USA 96, 2869-2874.
116. Gilbert, N., Lutz-Prigge, S. and Moran, J.V. (2002) Genomic deletions created upon LINE-1 retrotransposition. Cell 110, 315-325.
117. Gill, K.S., Gill, B.S. and Endo, T.R. (1993) A chromosome region-specific mapping strategy reveals gene-rich telomeric ends in wheat. Chromosoma 102, 374-381.
118. Gill, K.S., Gill, B.S., Endo, T.R. and Boyko, E.V. (1996a) Identification and high-density mapping of gene-rich regions in chromosome group 5 of wheat. Genetics 143, 1001-1012.
119. Gill, K.S., Gill, B.S., Endo, T.R. and Taylor, T. (1996b) Identification and high-density mapping of gene-rich regions in chromosome group 1 of wheat. Genetics 144, 1883-1891.
120. Gillespie, D. (1977) Newly evolved repeated DNA sequences in primates. Science 196, 889-891.
121. Gillespie, D., Pequignot, E. and Strayer, D. (1980) An ancestral amplification of DNA in primates. Gene 12, 103-111.
122. Gleba, Y.Y., Parokonny, A., Kotov, V., Negrutiu, I. and Momot, V. (1987) Spatial separation of parental genomes in hybrids of somatic plant cells. Proc. Natl. Acad. Sci. USA 84, 3709-3713.
123. Goldberg, R.B., Barker, S.J. and Perez-Grau, L. (1989) Regulation of gene expression during plant embryogenesis. Cell 56, 149-160.
124. Goodspeed, T.H. (1954) The genus Nicotiana. Chronica Botanica Co., Waltham. Mass.
125. Gorbunova, V. and Levy, A.A. (1999) How plants make ends meet: DNA double-strand break repair. Trends Plant Sci. 4, 263-269.
126. Graham, M.J., Nickell, C.D. and Rayburn, A.L. (1994) Relationship between genome size and maturity group in soybean. Theor. Appl. Genet. 88, 429-432.
127. Gray, J.C., Kung, S.D., Wildman, S.G. and Sheen, S.J. (1974) Origin of Nicotiana tabacum L. detected by polypeptide composition of fraction I protein. Nature 252, 226-227.
128. Gruenbaum, Y., Navey-Many, T., Cedar, H. and Razin, A. (1981) Sequence specificity of methylation in higher plant DNA. Nature 292, 860-862.
129. Guerche, P., Tire, C., Grossi de Sa, F., De Clercq, A., Van Montagu, M. and Krebbers, E. (1990) Differential expression of the Arabidopsis 2S albumin genes and the effect of increasing gene family size. Plant Cell 2, 469-478.
130. Hake, S. and Walbot, V. (1980) The genome of zea mays, its organization and homology to related grasses. Chromosoma 79, 251-270.
131. Hardison, R.C., Roskin, K.M., Yang, S., Diekhans, M., Kent, W.J., Weber, R., Elnitski, L., Li, J., O’Connor, M., Kolbe, D. et al. (2003) Covariation in frequencies of substitution, deletion, transposition, and recombination during eutherian evolution. Genome Res. 13, 13-26.
Nicolas Carels 186
132. Hawkins, J.D. (1988) A survey on introns and exon lengths. Nucl. Acids Res. 16, 9893-9908.
133. Helentjaris, T. (1987) A genetic linkage map for maize based on RFLPs. Trends Genet. 3, 217-221.
134. Heslop-Harrison, J.S. (2000) Comparative Genome organization in Plants: From Sequence and Markers to Chromatin and Chromosomes. The Plant Cell 12, 617-635.
135. Heslop-Harrison, J.S., Brandes, A. and Schwarzacher, T. (2003a) Tandemly repeated DNA sequences and centromeric chromosomal regions of Arabidopsis species Chromosome Res. 11, 241-253
136. Heslop-Harrison, J.S. (2003b) Planning for remodelling: nuclear architecture, chromatin and chromosomes. Trends in Plant Science 8, 195-197.
137. Heslop-Harrison, J.S. and Bennett, M.D. (1990) Nuclear architecture in plant. Trends Genet. 6, 401-405.
138. Hoffman, P.D., Leonard J.M., Lindberg, G.E., Bollmann, S.R. and Hays, J.B. (2004) Rapid accumulation of mutations during seed-to-seed propagation of mismatch-repair-defective Arabidopsis. Genes Dev. 18, 2676-85.
139. Hutchinson, J., Narayan, R.K.J. and Rees, H. (1980) Constraints upon the composition of supplementary DNA. Chromosoma 78, 137-145.
140. Hwu, H.R., Roberts, J.W., Davidson, E.H. and Britten, R. (1986) Insertion and/or deletion of many repeated DNA sequences in human and higher ape evolution Proc. Natl. Acad. Sci. USA 83, 3875-3879.
141. Iida, K., Seki, M., Sakurai, T., Satou, M., Akiyama, K., Toyoda, T., Konagaya A. and Shinozaki, K. (2004) Genome-wide analysis of alternative pre-mRNA splicing in Arabidopsis thaliana based on full-length cDNA sequences. Nucleic Acids Res. 32, 5096-5103.
142. Jabbari, K., Cacciò, S., Païs de Barros, J.P., Desgrès, J. and Bernardi, G. (1997) Evolutionary changes in CpG and methylation levels in the genome of vertebrates. Gene 205, 109-118.
143. Jabbari, K. and Bernardi, G. (2004) Cytosine methylation and CpG, TpG (CpA) and TpA frequencies. Gene 333, 143-149.
144. Jacobsen, S.E. and Meyerowitz, E.M. (1997). Hypermethylated SUPERMAN epigenetic alleles in Arabidopsis. Science 277, 1100-1103.
145. Jahner, D. and Jaenisch, R. (1984). DNA methylation in early mammalian development. In DNA Methylation: Biochemistry and Biological Significance, A. Razin, H. Cedar, and A. Riggs, eds. (New York: Springer-Verlag), pp. 189-219.
146. Jiang, N., Feschotte, C., Zhang, X. and Wessler, S.R. (2004) Using rice to understand the origin and amplification of miniature inverted repeat transposable elements MITEs). Curr. Opin. Plant Biol. 7, 115-119.
147. Jin, W., Melo, J.R., Nagaki, K., Talbert, P.B., Henikoff, S., Dawe, R.K. and Jiang, J. (2004) Maize Centromeres: Organization and Functional Adaptation in the Genetic background of Oat. The Plant Cell 16, 571-581.
148. Kadi, F., Mouchiroud, D., Sabeur, G. and Bernardi, G. (1993) The compositional patterns of the avian genomes and their evolutionary implications. J. Mol. Evol. 37, 544-551.
149. Kamalay, J.C. and Goldberg, R.B. (1980) Regulation of structural gene expression in tobacco. Cell 19, 935-946.
Angiosperm genomics 187
150. Karpen, G.H., Le, M.H. and Le, H. (1996) Centric heterochromatin and the efficiency of achiasmate disjunction in Drosophila female meiosis. Science 273, 118-122.
151. Kimura, M. (1991) Recent development of the neutral theory viewed from the Wrightian tradition of theoretical population genetics. Proc. Natl. Acad. Sci. USA 88, 5969-5973.
152. Kimura, A. and Horikoshi, M. (2004) Partition of distinct chromosomal regions: negotiable border and fixed border. Genes to Cells 9, 499-508.
153. Kinoshita, T., Miura, A., Choi, Y., Kinoshita, Y., Cao, X., Jacobsen, S.E., Fischer, R.L. and Kakutani, T. (2004) One-way control of FWA imprinting in Arabidopsis endosperm by DNA methylation. Science 23, 521-523.
154. Koukalova, B., Kuhrova, V., Vyskot, B., Siroky, J. and Bezdek, M. (1994). Maintenance of the induced hypomethylation state of tobacco nuclear repetitive DNA sequences in the course of protoplast and plant regeneration. Planta 194, 306-310.
155. Koziel, M.G., Carozzi, N.B. and Desai, N. (1996) Optimizing expression of transgenes with an emphasis on posttranscriptional events. Plant Mol. Biol. 32, 393-405.
156. Kuhl, J.C., Cheung, F., Yuan, Q., Martin, W., Zewdie, Y., McCallum, J., Catanach, A., Rutherford, P., Sink, K.C., Jenderek, M., Prince, J.P., Town, C.D. and Havey, M.J. (2004) A unique set of 11,008 onion expressed sequence tags reveals expressed sequence and genomic differences between the monocot orders Asparagales and Poales. Plant Cell 6, 114-125.
157. Kurata, N., Moore, G., Nagamura, Y., Foote, T., Yano, M., Minobe, Y. and Gale, M. (1994) Conservation of genome structure between rice and wheat. Biotechnology 12, 276-278.
158. Laroche, J., Li, P. and Bousquet, J. (1995) Mitochondrial DNA and monocot–dicot divergence time. Mol. Biol. Evol. 12, 1151-1156.
159. Laurie, D.A. and Bennett, M.D. (1985) Nuclear DNA content in the genera Zea and Sorghum. Intergeneric, interspecific and intraspecific variation. Heredity 55, 307-313.
160. Lee, J.M. and Sonnhammer, E.L. (2003) Genomic gene clustering analysis of pathways in eukaryotes. Genome Res. 13, 875-882.
161. Leutwiler, L.S., Hough-Evans, B.R. Meyerowitz, E.W. (1984) The DNA of Arabidopsis thaliana. Mol. Gen. Genet. 194, 15-23.
162. Li, W.-H., Wu, C.-I. and Luo, C.C. (1985) A new method for estimating synonymous and synonymous rate of nucleotide substitutions considering the relative likelihood of nucleotide codon changes. Mol. Biol. Evol. 2, 150-174.
163. Lippman1, Z., Gendrel, A.V., Black, M., Vaughn, M.W., Dedhia, N., McCombie, W.R., Lavine, K., Mittal, V., May, B., Kasschau, K.D., Carrington, J.C., Doerge, R.W., Colot, V. and Martienssen, R. (2004) Role of transposable elements in heterochromatin and epigenetic control. Nature 430, 471-476.
164. Luehrsen, K.R., Taha, S. and Walbot, V. (1994) Nuclear pre-mRNA processing in higher plants. Prog. Nucl. Acid Res. Mol. Biol. 47, 149-193.
165. Lunde, C.F., Morrow, D.J., Roy, L.M. and Walbot, V. (2003) Funct. Integr. Genomics 3, 25-32.
166. Ma, J., Devos, K.M. and Bennetzen, J.L. (2004) Analyses of LTR-retrotransposon structures reveal recent and rapid genomic DNA loss in rice. Genome Res. 14, 860-869.
Nicolas Carels 188
167. Macaya, G., Thiery, J.P. and Bernardi, G. (1976) An approach to the organization of eukaryotic genomes at a macromolecular level. J. Mol. Biol. 108, 237-54.
168. Martienssen, R.A. and Colot, V. (2001) DNA methylation and epigenetic inheritance in plants and filamentous fungi. Science 293, 1070-1074.
169. Martienssen, R.A., Rabinowicz, P.D., O'Shaughnessy, A. and McCombie, W.R. (2004) Sequencing the maize genome. Curr. Opin. Plant Biol. 7, 102-107.
170. Martienssen, R.A., Rabinowicz, P.D., O'Shaughnessy, A. and McCombie, W.R. (2003) Sequencing the maize genome. Curr Opin Plant Biol. 7, 102-107.
171. Matassi, G., Montero, L.M., Salinas, J. and Bernardi, G. (1989) The isochores organization and compositional distribution of homologous coding sequences in the nuclear genome of plants. Nucl. Acids Res. 17, 5273-5290.
172. Matassi, G., Melis, R., Macaya, G. and Bernardi, G. (1991) Compositional bimodality of the nuclear genome of tobacco. Nucleic Acids Res. 19, 5561-5567.
173. Matassi, G., Melis, R., Kuo, K.C., Macaya, G., Gehrke, C.W. and Bernardi, G. (1992) Large-scale methylation patterns in the nuclear genomes of plants. Gene 122, 239-245.
174. Matzke, M., Matzke, A.J.M. and Kooter, J.M. (2004) RNA: guiding gene silencing. Science 293, 1080-1083.
175. May, B.P., Liu, H., Vollbrecht, E., Senior, L., Rabinowicz, P.D., Roh, D., Pan, X., Stein, L., Freeling, M., Alexander, D. et al. (2003) Maize targeted mutagenesis: a knockout resource in maize. Proc. Natl. Acad. Sci. USA 100, 11541-11546.
176. McClintock, B. (1984) The significance of responses of the genome to challenge. Science 226, 792-801.
177. McKee, B.D. and Handel, M.A. (1993) Sex chromosomes, recombination, and chromatin conformation. Chromosoma 102, 71-80.
178. Messing, J., Bharti, A.K., Karlowski, W.M., Gundlach, H., Kim, H.R., Yu, Y., Wei, F., Fuks, G., Soderlund, C.A., Mayer, K.F. and Wing, R.A. (2004) Sequence composition and genome organization of maize. Proc. Natl. Acad. Sci. USA. 101, 14349-14354.
179. Meyers, B.C., Tingey, S.V. and Morgante, M. (2001) Abundance, distribution, and transcriptional activity of repetitive elements in the maize genome. Genome Res. 11, 1660-1676.
180. Miklos, G.L.G. and Rubin, G.M. (1996) The role of the genome project in determining gene function: insights from model organisms. Cell 86, 521-529.
181. Montero, L.M., Salinas, J., Matassi, G. and Bernardi, G. (1990) Gene distribution and isochore organization in the nuclear genome of plants. Nucl. Acids Res. 18, 1859-1867.
182. Moore, G., Abbo, S., Cheung, W., Foote, T., Gale, M., Koebner, R., Leitch, A., Leitch, I., Money, T., Stancombe, P., Yano, M. and Flavell, R. (1993) Key features of cereal genome organization as revealed by the use of cytosine methylation-sensitive restriction endonucleases. Genomics 15, 472-482.
183. Moore, G., Devos, K.M., Wang, Z. and Gale, M.D. (1995a) Grasses, line up and form a circle. Curr. Biol. 5, 737-739.
184. Moore, G., Foote, T., Helentjaris, T., Devos, K., Kurata, N. and Gale, M. (1995b) Was there a single ancestral cereal chromosome? Trends Genet. 11, 81-82.
185. Moore, G. (1995) Cereal genome evolution: pastoral pusuits with ‘lego' genomes. Curr.Opin.Genet.Develop. 5, 717-724.
Angiosperm genomics 189
186. Moran, J.V., DeBerardinis, R.J. and Kazazzian, H.H. (1999). Exon shuffling by L1 retrotransposition. Science 283, 1530-1534.
187. Morris, E.R. and Walker, J.C. (2003) Receptorlike protein kinases: the keys to response. Curr. Opin. Plant Biol. 6, 339-42.
188. Morrish, F.M. and Vasil, I.K. (1989) DNA methylation and embryogenic competence in leaves and callus of napiergrass (Pennisetum purpurum Schum). Plant Physiol. 90, 37-40.
189. Mouchiroud, D., Gautier, C. and Bernardi, G. (1995) Frequencies of synonymous substitutions in mammals are gene-specific and correlated with frequencies of non-synonymous substitutions. J. Mol. Evol. 40, 107-113.
190. Mucha, M., Krol, J., Goc, A. and Filipski, J. (2003) Mapping candidate hotspots of meiotic recombination in segments of human DNA cloned in the yeast Saccharomyces cerevisiae. Mol. Genet. Genomics 270, 165-172.
191. Nagaki, K., Cheng, Z., Ouyang, S., Talbert, P.B., Kim, M., Jones, K.M., Henikoff, S., Buell, C.R. and Jiang, J. (2004) Sequencing of a rice centromere uncovers active genes. Nature Genet. 36, 138-145.
192. Ner-Gaon, H., Halachmi, R., Savaldi-Goldstein, S., Rubin, E., Ophir, R. and Fluhr, R. (2004) Intron retention is a major phenomenon in alternative splicing in Arabidopsis. The Plant Journal 39, 877-885.
193. Neves, N., Heslop-Harrison, J.S. and Viegas, W. (1995) rRNA gene activity and control of expression mediated by methylation and imprinting during embryo development in wheat 3 rye hybrids. Theor. Appl. Genet. 91, 529-533.
194. Oakeley, E.J., Podestà , A. and Jost, J.-P. (1997) Developmental changes in DNA methylation of the two tobacco pollen nuclei during maturation. Proc. Natl. Acad. Sci. USA 94, 11721-11725.
195. Ohta, T. and Kimura, M. (1981) Some calculations on the amount of selfish DNA. Proc. Nat. Acad. Sci. USA 78, 1129-1132.
196. Ohta, T. and Ina, Y. (1995) Variation in synonymous substitutions rates among mammalian genes and correlations between synonymous and non-synonymous divergences. J. Mol. Evol. 41, 717-720.
197. Orgel, L.E. and Crick, F.H.C. (1980) Selfish DNA : the ultimate parasite. Nature 284, 604-607.
198. Orgel, L.E., Crick, F.H.C. and Sapienza, C. (1980) Selfish DNA. Nature 288, 645-646.
199. Paces, J., Zika, R., Paces, V., Pavlicek, A., Clay, O. and Bernardi, G. (2004) Representing GC variation along eukaryotic chromosomes. Gene 333, 135-141.
200. Pak, D.T., Pflumm, M., Chesnokov, I., Huang, D.W., Kellum, R., Marr, J., Romanowski, P. and Botchan, M.R. (1997) Association of the origin recognition complex with heterochromatin and HP1 in higher eukaryotes. Cell 91, 311-323.
201. Palmer, L.E., Rabinowicz, P.D., O'Shaughnessy, A.L., Balija, V.S., Nascimento, L.U., Dike, S., de la Bastide, M., Martienssen, R.A. and McCombie, W.R. (2004) Maize genome sequencing by methylation filtration. Science 302, 2115-2117.
202. Palmgren, G., Mattsson, O. and Okkels, F.T. (1990) Employment of hydrolytic enzymes in the study of the level of DNA methylation. Biochim. Biophys. Acta 1049, 293-297.
Nicolas Carels 190
203. Paterson, A.H., Bowers, J.E. and Chapman, B.A. (2004) Ancient polyploidization predating divergence of the cereals, and its consequences for comparative genomics. Proc. Natl. Acad. Sci. USA 101, 9903-9908.
204. Pélissier, Th., Bousquet-Antonelli, C., Lavie, L. and Deragon, J.-M. (2004) Synthesis and processing of tRNA-related SINE transcripts in Arabidopsis thaliana. Nucleic Acids Res. 32, 3957-3966.
205. Perani, P. (1996) Etude de la localisation compositionelle des séquences à copie unique de la famille d’isochore H3 humain et de la séquence télomérique (TTAGGG)n chez les vertébrés à sang chaud. Thèse de Doctorat de l’Université de Paris VII - Denis Diderot. Spécialité: Microbiologie.
206. Perez-Grau, L. and Goldberg, R.B. (1989) Soybean seed protein genes are regulated spatially during embryogenesis. Plant Cell 1, 1095-1109.
207. Peterson-Burch, B.D. and Voytas, D.F. (2002) Genes of the Pseudoviridae (Ty1/copia Retrotransposons). Mol. Biol. Evol. 19, 1832-1845.
208. Plasterck, R. (1998). Ragtime jumping. Nature 394, 718-719. 209. Preisler, R.S. and Thompson, W.F. (1981) Evolutionary sequence divergence
within repeated DNA families of higher plant genomes. II. Analysis of thermal denaturation. J. Mol. Evol. 17, 85-93.
210. Rabinowicz, P.D. (2003a) Constructing gene-enriched plant genomic libraries using methylation filtration technology. Methods Mol. Biol. 236, 21-36.
211. Rabinowicz, P.D., McCombiey, W.R. and Martienssen, R.A. (2003b) Gene enrichment in plant genomic shotgun libraries. Curr. Opin. Plant Biol. 6, 150-156.
212. Rabinowicz, P.D., Palmer, L.E., May, B.P., Hemann, M.T., Lowe, S.W., McCombie, W.R. and Martienssen, R.A. (2003c) Genes and transposons are differentially methylated in plants, but not in mammals. Genome Res. 13, 2658-2664.
213. Raizada, M.N., Nan G.L. and Walbot, V. (2001) Somatic and germinal mobility of the RescueMu transposon in transgenic maize. Plant Cell 13, 1587-1608.
214. Rayburn, A.L. (1990) Genome size variation in Southern United States maize adapted to various altitudes. Evol. Trends Plant 4, 53-57.
215. Rayburn, A.L. and Auger, J.A. (1990) Genome size variation in Zea mays ssp. mays adapted to different altitudes. Theor. Appl. Genet. 79, 470-474.
216. Razin, A. and Cedar, H. (1993). DNA methylation and embryogenesis. In: DNA methylation: molecular biology and biological significance, (Eds. : Jost, J.P. and Salus, H.P.) Basel, Switzerland: Birkhauser. pp. 523-568.
217. Read, L.R., Raynard, S.J., Ruksc, A. and Baker, M.D. (2004) Gene repeat expansion and contraction by spontaneous intrachromosomal homologous recombination in mammalian cells. Nucleic Acids Res. 32, 1184-1196.
218. Rimpau, J., Smith, D.B. and Flavell, R.B. (1980) Sequence organisation in barley and oats chromosomes revealed by interspecies DNA/DNA hybridisation. Heredity 44, 131-149.
219. Rogic, S., Mackworth, A.K. and Ouellette, F.B. (2001) Evaluation of gene-finding programs on mammalian sequences. Genome Res. 11, 817-32.
220. Ronemus, M.J., Galbiati, M., Ticknor, C., Chen, J. and Dellaporta, S.L. (1996). Demethylation-induced developmental pleiotropy in Arabidopsis. Science 273, 654-657.
Angiosperm genomics 191
221. Rudd, S., Frisch, M., Grote, K., Meyers, B.C., Mayer, K. and Werner, T. (2004) Genome-wide in silico mapping of scaffold/matrix attachment regions in Arabidopsis suggests correlation of intragenic scaffold/matrix attachment regions with gene expression. Plant Physiol. 135, 715-22.
222. Saccone, S., Caccio, S., Kusuda, J., Andreozzi, L. and Bernardi, G. (1996) Identification of the gene-richest bands in human chromosomes. Gene 174, 85-94.
223. Saccone, S. and Bernardi, G. (2001a) Human chromosomal banding by in situ hybridization of isochores Methods in Cell Science 23, 7-15.
224. Saccone, S., Pavlic¡ek, A., Federico, C., Paces, J. and Bernardi, G. (2001b) Genes, isochores and bands in human chromosomes 21 and 22. Chromosome Res. 9, 533–539.
225. Saccone, S., Federico, C. and Bernardi, G. (2002) Localization of the gene-richest and the gene-poorest isochores in the interphase nuclei of mammals and birds. Gene 300, 169-178.
226. Sadoni, N., Langer, S., Fauth, C., Bernardi, G., Cremer, T., Turner, B.M. and Zink, D. (1999) Nuclear organization of mammalian genomes: polar chromosome territories build up functionally distinct higher order compartments. J. Cell Biol. 146, 1211-1226.
227. Salinas, J., Matassi, G., Montero, L.M. and Bernardi, G. (1988) Compositional compartmentalization and compositional patterns in the nuclear genomes of plants. Nucl. Acids Res. 16, 4269-4285.
228. Sallaud, C., Gay, C., Larmande, P., Bès, M., Piffanelli, P., Piégu, B., Droc, G., Regad, F., Bourgeois, E., Meynard, D., Périn, C., Sabau, X., Ghesquière, A., Glaszmann, J.C., Delseny, M. and Guiderdoni, E. (2004) High throughput T-DNA insertion mutagenesis in rice: a first step towards in silico reverse genetics. The Plant Journal 39, 450-464.
229. Salser, W. (1977) Globin mRNA sequences: analysis of base pairing and evolutionary implications. Cold Spring Harbor Symp. Quant. Biol. 40, 985-1002.
230. Sandhu, D. and Gill, K.S. (2002) Gene containing regions of wheat and the other grass genomes. Plant Physiol. 128, 803-811.
231. Sanderson, M.J. and Doyle, J.A. (2001) Sources of error and confidence intervals in estimating the age of angiosperms from rbcL and 18S rDNA data. Am. J. Bot. 88, 1499-1516.
232. SanMiguel, Ph., Tikhonov, A., Jin, Y.-K., Motchoulskaia, N., Zakharov, D., Melake-Berhan, A., Springer, P.S., Edwards, K.J., Lee, M., Avramova, Z. and Bennetzen, J. (1996) Nested retrotransposons in the intergenic regions of the maize genome. Sciences 274, 765-768.
233. SanMiguel, Ph., Gaut, B.S., Tikonov, A., Nakajima, Y. and Bennetzen, J. (1998) The paleontology of intergene retrotransposons of maize. Nat. Genetics 20, 43-45.
234. Schwarzacher, T. (1996) The physical organization of Triticeae chromosomes. Symp. Soc. Exp. Biol. 50, 71-75.
235. Sentry, J.W. and Smyth, D.R. (1985) A family of repeated sequences dispersed through the genome of Lilium henryi. Chromosoma 92, 149-155.
236. Sentry, J.W. and Smyth, D.R. (1989) An element with long terminal repeats and its variant arrangements in the genome of Lilium henryi. Mol. Gen. Genet. 215, 349-354.
Nicolas Carels 192
237. Shah, S.P., McVicker, G.P., Mackworth, A.K., Rogic, S. and Ouellette, B.F. (2003) GeneComber: combining outputs of gene prediction programs for improved results. Bioinformatics 19, 1296-97.
238. Shapiro, H.S. (1976) Distribution of purines and pyrimidines in deoxyribonucleic acids. In: Hanbook of biochemistry and molecular biology (Ed. : Fasman, G.D.). CRC Press, Cleveland OH. pp. 241-275.
239. Sheen, S.J. (1972) Isozymic evidence bearing on the origin of Nicotiana tabacum L. Evolution 26, 143-154.
240. Shen, M.R., Batzer, M.A. and Deininger, P.L. (1991) Evolution of the master Alu gene(s) J. Mol. Evol. 33, 311-320.
241. Shepherd, N.S., Swarz-Sommer, Z., vel Spalve, J.B., Gupta, M., Wienand, V. and Saedler, H. (1984) Similarity of the Cin1 repetitive family of Zea mays to eukaryotic transposable elements. Nature 307, 185-187.
242. Silva, M., Queiroz, A., Neves, N., Barao, A., Castilho, A., Morais, L. and Viegas, W. (1995) Reprogramming of rye rDNA in triticale during microsporogenesis. Chromosome Res. 3, 492-496.
243. Simpson, G.G. and Filipowicz, W. (1996) Splicing of precursors to mRNA in higher plants: mechanism, regulation and sub-nuclear organisation of the spliceosomal machinery. Plant Mol. Biol. 32, 1-41.
244. Sinibaldi, R.M. and Mettler, I.J. (1992) Intron splicing and intron-mediated enhanced gene expression in Monocots. Prog. Nucl. Acid. Res. Mol. Biol. 42, 229-257.
245. Siroky, J., Ruffini-Castiglione, M. and Vyskot, B. (1998). DNA methylation and replication patterns of Melandrium album chromosomes. Chromosome Res. 6, 441-446.
246. Smit, A.F.A. (1993) Identification of a new, abundant superfamily of mammalian LTR-transposons. Nucl. Acids Res. 21, 1863-1872.
247. Smyth, D.R. (1991) Dispersed repeats in plant genomes. Chromosoma 100, 355-359. Strathdee, G., Sim, A. and Brown, R. (2004) Control of gene expression by CpG island methylation in normal cells. Biochem. Soc. Trans. 32, 913-915.
248. Soltis, D.E., Soltis, P.S., Bennett, M.D. and Leitch, I.J. (2003) Evolution of genome size in the angiosperms. Am. J. Bot. 90, 1596-1603.
249. Tatout, C., Lavie, L. and Deragon, J.-M. (1998). Similar target site selection occurs in integration of plant and mammalian retroposons. J. Mol. Ecol. 47, 463-470.
250. Tazi, J. and Bird, A.P. (1990) Alternative Chromatin structure at CpG islands. Cell 60, 909-920.
251. Thomas, T.L. (1993) Gene Expression during plant embryogenesis and germination: an overview. The Plant Cell. 5, 1401-1410.
252. Thomas, A.J. and Sherratt, H.S.A. (1956) The isolation of nucleic-acid fractions from plant leaves and their purine and pyrimidine composition. Biochem. J. 62, 1-4.
253. Thuriaux, P. (1977) Is recombination confined to structural genes on the eukaryotic genome? Nature 268, 460.
254. Ticher, A. and Graur, D. (1989) Nucleic acid composition, codon usage, and the rate of synonymous substitution in protein-coding genes. J. Mol. Evol. 28, 286-298.
255. Tikhonov, A.P., SanMiguel, P.J., Nakajima, Y., Gorenstein, N.M., Bennetzen, J. and Avramova, Z. (1999) Colinearity and its exceptions in orthologous adh regions of maize and sorghum. Proc. Natl. Acad. Sci. USA 96, 7409-7414.
Angiosperm genomics 193
256. Topp, C.N., Zhong, C.X. and Dawe, R.K. (2004) Centromere-encoded RNAs are integral components of the maize kinetochore. Proc. Natl. Acad. Sci. USA 101, 15986-15991.
257. Touchon, M., Arneodo, A., d’Aubenton-Carafa, Y. and Thermes, C. (2004) Transcription-coupled and splicing-coupled strand asymmetries in eukaryotic genomes. Nucleic Acids Res. 32, 4969-4978.
258. Truswell, E.M., Kershaw, A.P. and Sluiter, I.R. (1987) The Australian-south-east Asian connection: evidence from the paleobotanical record. In: Biogeographical evolution of the malay archipelago (Ed.: Whitmore, T.C.) Clarendon Press, Oxford. pp 32-49.
259. Tuteja, N., Singh, M.B., Misra, M.K., Bhalla, P.L. and Tuteja, R. (2001) Molecular mechanisms of DNA damage and repair: progress in plants. Crit. Rev. Biochem. Mol. Biol. 36, 337-397.
260. Vakhrameev, V.A. (1991) Jurassic and Cretaceous floras and climates of the Earth. Cambridge University Press, Cambridge.
261. Vanyushin, B.F. and Belozerskii, A.N. (1959) Nucleotide composition of the desoxyribonucleotides of higher plants. Dokl. Akad. Nauk. USSR 129, 944-946.
262. Vergust, A.C. and Hooykaas, P.J.J. (1999) Recombination in the plant genome and its application in biotechnology. Crit. Rev. Plant Sci. 18, 1-31.
263. Vinogradov, E.V. (2003a) Selfish DNA is maladaptive: evidence from the plant Red List. Trends in Genetics 19, 609-614.
264. Vinogradov, A.E. (2003b) DNA helix: the importance of being GC-rich. Nucleic Acids Res. 31, 1838-1844.
265. Vinogradov, A.E. (2003c) Isochores and tissue-specificity. Nucleic Acids Res. 31, 5212-5220.
266. Vinogradov, A.E. (2004) Evolution of genome size: multilevel selection, mutation bias or dynamical chaos? Curr. Opin. Genet. Dev. 14, 620-626.
267. Voytas, D.F., Konieczny, A., Cummings, M.P. and Ausubel, F.M. (1990) The structure, distribution and evolution of the Ta1 retrotransposable element family of Arabidopsis thaliana. Genetics 126, 713-721.
268. Voytas, D.F. and Naylor, G.J. (1998) Rapid flux in plant genomes. Nat. Genetics 20, 6-7.
269. Wagner, I. and Capesius, I. (1981) Determination of 5-methylcytosine from plant DNA by high-performance liquid chromatography. Biochim. Biophys. Acta. 654, 52-56.
270. Whitelaw, C.A., Barbazuk, W.B., Pertea, G., Chan, A.P., Cheung, F., Lee, Y., Zheng, L., van Heeringen, S., Karamycheva, S., Bennetzen, J.L., SanMiguel, P., Lakey, N., Bedell, J., Yuan, Y., Budiman, M.A., Resnick, A., Van Aken, S., Utterback, T., Riedmuller, S., Williams, M., Feldblyum, T., Schubert, K., Beachy, R. and Quackenbush, J. (2003) Enrichment of gene-coding sequences in maize by genome filtration. Science 302, 2118-2120.
271. Winkler, H. (1920) Verbreitung und Ursache der Parthenogenesis im Pfanzen- und Tierreich. Fischer, Jena.
272. Wolfe, K.H., Gouy, M.Y., Yang, W., Sharp, P.M. and Li, W.H. (1989) Date of the monocot–dicot divergence estimated from chloroplast chloroplast DNA sequence data. Proc. Natl. Acad. Sci. USA 86, 6201-6205.
Nicolas Carels 194
273. Wolfe, K.H. and Sharp, P.M. (1993) Mammalian gene evolution : Nucleotide sequence divergence between mouse and rat. J. Mol. Evol. 37, 441-456.
274. Wright, S.I., Agrawal, N. and Bureau, T.E. (2003) Effects of recombination rate and gene density on transposable element distributions in Arabidopsis thaliana. Genome Res. 13, 1897-1903.
275. Wu, J., Maehara, T., Shimokawa, T., Yamamoto, S., Harada, C., Takazaki, Ono, N., Mukai, Y., Koike, K. and Yazaki, J. (2002). A comprehensive rice transcript map containing 6591 expressed sequence taq sites. Plant Cell 14, 525-535.
276. Xiao, W., Gehring, M., Choi, Y., Margossian, L., Pu, H., Harada, J.H., Goldberg, R.B., Pennell, R.I. and Fischer, R.L. (2003) Imprinting of the MEA Polycomb Gene Is Controlled by Antagonism between MET1 Methyltransferase and DME Glycosylase. Dev. Cell 5, 891-901.
277. Xie, W.W., Gai, X.W., Zhu, Y.X., Zappulla, D.C., Sternglanz, R. and Voytas, D.F. (2001) Targeting of the yeast Ty5 retrotransposon to silent chromatin is mediated by interactions between integrase and Sir4p. Mol. Cell. Biol. 21, 6606-6614.
278. Xiong, Y. and Eickbush, TH. (1990) Origin and evolution of retroelements based upon their reverse transcriptase sequences. EMBO J. 9, 3353-3362.
279. Yamada, K., Lim, J., Dale, J.M., Chen, H., Shinn, P., et al. (2003) Empirical analysis of transcriptional activity in the Arabidopsis genome. Science 302, 842-46.
280. Yuan, Y., SanMiguel, P.J. and Bennetzen, J.L. (2003) High-Cot sequence analysis of the maize genome. Plant J. 34, 249-255.
281. Zhang, X., Jiang, N., Feschotte, C. and Wessler, S.R. (2004a) PIF- and Pong-like transposable elements: distribution, evolution and relationship with Tourist-like miniature inverted-repeat transposable elements. Genetics 166, 971-986.
282. Zhang, Y., Huang, Y., Zhang, L., Li, Y., Lu, T., Lu, Y., Feng, Q., Zhao, Q., Cheng, Z., Xue, Y., Wing, R.A. and Han, B. (2004b) Structural features of the rice chromosome 4 centromere. Nucleic Acids Res. 32, 2023-2030.
283. Zilberman, D., Cao, X., Lisa K. Johansen, L.K., Xie, Z., Carrington, J.C. and Jacobsen, S.E. (2004) Role of Arabidopsis ARGONAUTE4 in RNA-Directed DNA methylation triggered by inverted repeats. Curr. Biol. 14, 1214–1220.
284. Zipper, P., Ribitsch, G., Schurz, J. and Bünemann, H. (1982) The interaction of calf thymus DNA with mercuric acetate and 3,6-bis-(acetatomercurimethyl)-dioxane. Small-angle X-ray scattering and viscosity studies. Z. Naturforsch [C]. 37, 824-832.
285. Zuckerkandl, E. and Hennig, W. (1995) Tracking heterochromatin. Chromosoma 104, 75-83.
286. Zuckerkandl, E. (2002) Why so many noncoding nucleotides? The eukaryote genome as an epigenetic machine. Genetica 115, 105-129.
287. Zoubak, S., Richardson, J.H., Rynditch, A., Höllsberg, P., Hafler, D.A., Boeri, E., Lever, A.M.L. and Bernardi, G. (1994) Regional specificity of HTLV-I proviral integration in the human genome. Gene 143, 155-163.
288. Zoubak, S., D'Onofrio, G., Cacciò, S., Bernardi, G. and Bernardi, G. (1995) Specific compositional patterns of synonymous positions in homologous mammalian genes. J. Mol. Evol. 40, 293-307.
289. Zoubak, S., Clay, O. and Bernardi, G. (1996) The gene distribution of the human genome. Gene 174, 95-102.