diversification of myco-heterotrophic angiosperms: evidence from burmanniaceae
TRANSCRIPT
BioMed CentralBMC Evolutionary Biology
ss
Open AcceResearch articleDiversification of myco-heterotrophic angiosperms: Evidence from BurmanniaceaeVincent Merckx*1, Lars W Chatrou2, Benny Lemaire1, Moses N Sainge3, Suzy Huysmans1 and Erik F Smets1,4Address: 1Laboratory of Plant Systematics, K.U. Leuven, Kasteelpark Arenberg 31, P.O. Box 2437, BE-3001 Leuven, Belgium, 2National Herbarium of the Netherlands, Wageningen University Branch, Generaal Foulkesweg 37, NL-6703 BL Wageningen, The Netherlands, 3Centre for Tropical Forest Sciences (CTFS), University of Buea, Department of Plant & Animal Sciences, P.O. Box 63, Buea, Cameroon and 4National Herbarium of the Netherlands, Leiden University Branch, P.O. Box 9514, NL-2300 RA, Leiden, The Netherlands
Email: Vincent Merckx* - [email protected]; Lars W Chatrou - [email protected]; Benny Lemaire - [email protected]; Moses N Sainge - [email protected]; Suzy Huysmans - [email protected]; Erik F Smets - [email protected]
* Corresponding author
AbstractBackground: Myco-heterotrophy evolved independently several times during angiospermevolution. Although many species of myco-heterotrophic plants are highly endemic and long-distance dispersal seems unlikely, some genera are widely dispersed and have pantropicaldistributions, often with large disjunctions. Traditionally this has been interpreted as evidence foran old age of these taxa. However, due to their scarcity and highly reduced plastid genomes ourunderstanding about the evolutionary histories of the angiosperm myco-heterotrophic groups ispoor.
Results: We provide a hypothesis for the diversification of the myco-heterotrophic familyBurmanniaceae. Phylogenetic inference, combined with biogeographical analyses, moleculardivergence time estimates, and diversification analyses suggest that Burmanniaceae originated inWest Gondwana and started to diversify during the Late Cretaceous. Diversification and migrationof the species-rich pantropical genera Burmannia and Gymnosiphon display congruent patterns.Diversification began during the Eocene, when global temperatures peaked and tropical forestsoccurred at low latitudes. Simultaneous migration from the New to the Old World in Burmanniaand Gymnosiphon occurred via boreotropical migration routes. Subsequent Oligocene cooling andbreakup of boreotropical flora ended New-Old World migration and caused a gradual decrease indiversification rate in Burmanniaceae.
Conclusion: Our results indicate that extant diversity and pantropical distribution of myco-heterotrophic Burmanniaceae is the result of diversification and boreotropical migration during theEocene when tropical rain forest expanded dramatically.
Published: 23 June 2008
BMC Evolutionary Biology 2008, 8:178 doi:10.1186/1471-2148-8-178
Received: 25 February 2008Accepted: 23 June 2008
This article is available from: http://www.biomedcentral.com/1471-2148/8/178
© 2008 Merckx et al; licensee BioMed Central Ltd. This is an Open Access article distributed under the terms of the Creative Commons Attribution License (http://creativecommons.org/licenses/by/2.0), which permits unrestricted use, distribution, and reproduction in any medium, provided the original work is properly cited.
Page 1 of 16(page number not for citation purposes)
BMC Evolutionary Biology 2008, 8:178 http://www.biomedcentral.com/1471-2148/8/178
BackgroundMyco-heterotrophic plants present a number of uniquechallenges to those who are trying to understand theirdiversification and distribution. Many myco-hetero-trophic plant species are rare and have very limited distri-bution ranges [1-4]. Their tiny, dust-like, seeds areassumed to be dispersed by wind or rainsplash [5]. Thisstrategy seems ineffective for long-distance dispersal par-ticularly because most species grow on the forest floor ofdense primary rain forests. Furthermore their occurrenceseems limited by their interaction with specific arbuscularmycorrhizal fungi, from which they obtain their organiccarbon [6,7]. Paradoxally, some myco-heterotrophic gen-era are widely distributed often with remarkable disjunc-tions. Examples are Sciaphila (Triuridaceae), Burmanniaand Gymnosiphon (Burmanniaceae), Thismia (This-miaceae), Voyria (Gentianaceae) and Monotropa (Eri-caceae), which all occur both in the New and the OldWorld [5]. While the disjunct distribution of Voyria hasbeen interpreted as a result of a long-distance dispersalevent [8], the widespread distributions of Sciaphila, Bur-mannia, Gymnosiphon, and Thismia were traditionallyexplained as an indication for a great antiquity, allowingvicariance explanation of the observed patterns [5,9,10].This would imply that these genera originated before thebreakup of western Gondwana, about 90–105 millionyears ago (Mya) [11,12]. A recent molecular dating analy-sis on monocots would not refute the western Gondwanavicariance hypothesis for Burmanniaceae (including This-miaceae), as the stem and crown nodes of the family wereestimated at 116 and 93 Mya respectively [13]. These dateswould roughly put the relevant divergences in a Late Cre-taceous timeframe, in particular when considering thegenerally large confidence intervals associated withmolecular dating experiments in flowering plants [14].The results of Janssen and Bremer [13], however, werebased on 14 species of Dioscoreales, only three of whichbelong to the Burmanniaceae. Poor taxon sampling is oneof the sources of error in molecular dating, though theeffect of undersampling may depend on the method usedto accommodate for rate variation [14-16].
The fossils used to calibrate the tree are another possiblesource of error in molecular dating [17]. Ambiguouslyinterpretable morphology may result in the calibration ofan erroneous node, and uncertain age of fossil-bearingrock may give rise to inaccurate dates [17,18]. Burman-niaceae are absent from the fossil record. A commonapproach in similar cases is to apply secondary calibra-tion, i.e. use ages derived from other molecular datingestimates. This approach has been criticized for generatinglarge confidence intervals [19]. We choose to rigorouslyexpand our taxon sampling, including all monocot line-ages, to estimate branch lengths based on one of the mostwidely available markers (18S rDNA), and to constrain
the phylogeny to the most accurate phylogenetic hypoth-eses available in the literature. The date estimates of thissingle gene approach are compared with a Bayesianrelaxed clock phylogenetic analysis [20] that uses second-ary calibrations on a multi-gene Burmanniaceae dataset.
In this study we attempt to elucidate the diversificationand biogeographic history of one of the most species-richclades of myco-heterotrophic plants, the Burmanniaceae,by analyzing a thoroughly sampled data set containingnuclear and mitochondrial sequence data. The familyconsists of seven species-poor Neotropical genera and twospecies-rich genera with a pantropical distribution (Bur-mannia and Gymnosiphon). While the pantropical distribu-tions of many angiosperm groups were traditionallyinterpreted as a result of tectonic vicariance, recent molec-ular dating studies have lead to a revival of long-distancedispersal theories [21,22]. Most recent studies on disjunctdispersal patterns between the Old and the New World ofangiosperm families have strongly rejected vicariance asan explanation for the observed biogeographic pattern(e.g. Malpighiaceae [23], Rapateaceae and Bromeliaceae[24], Sapotaceae [25], Burseraceae [26], Melastomataceae[27], Moraceae 28], Meliaceae [18], Renealmia [29].
ResultsPhylogenetic analysesThe three data partitions comprised the following num-bers of taxa and characters: (1) 18S rDNA with 51 acces-sions, 1694 characters, and 222 parsimony-informativecharacters; (2) nad1 b-c intron with 49 accessions, 1645characters, and 275 parsimony-informative charactersplus Simple Indel Coding of the gaps adding 112 parsi-mony-informative characters; (3) ITS with 47 accessions,598 characters, and 372 parsimony-informative charac-ters.
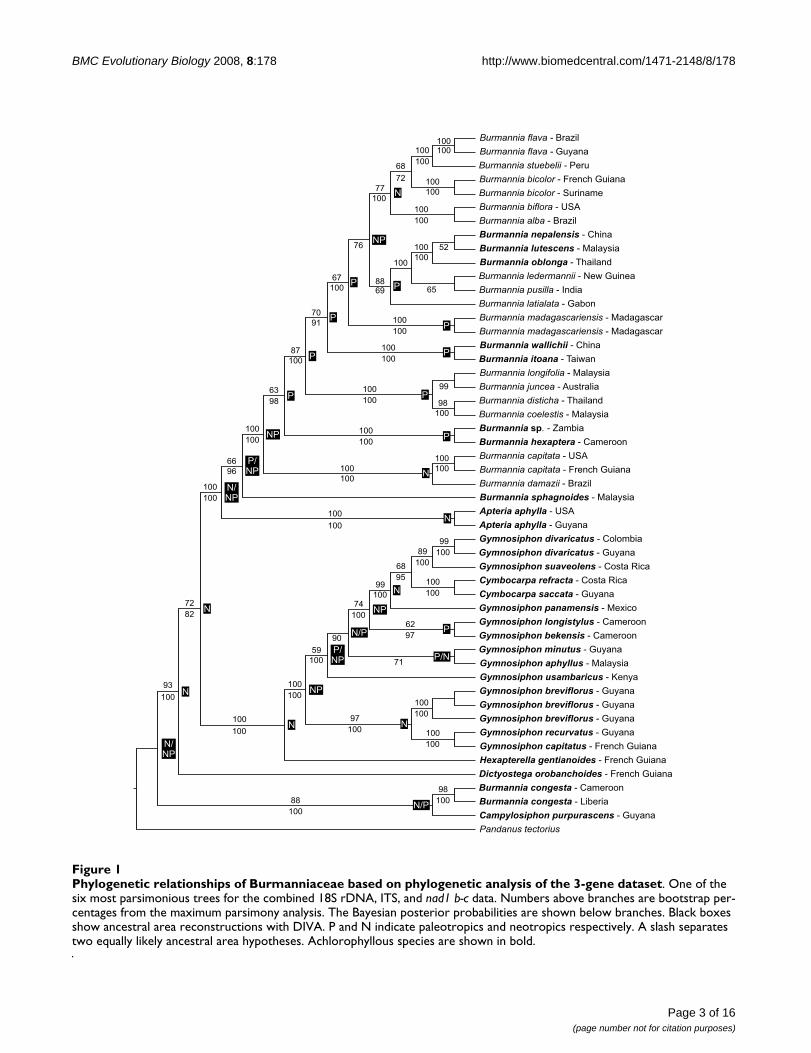
One of the six most parsimonious trees (tree length 4215;CI 0.522; RI 0.687) recovered during the parsimony anal-ysis on the combined data is shown in Figure 1. No signif-icant difference was observed between the maximumparsimony strict consensus tree and the Bayesian 50%majority-rule consensus tree. Most clades are well-sup-ported (≥85% bootstrap support/≥95% Bayesian poste-rior probability). A well-supported clade with twosamples of Burmannia congesta and Campylosiphon is sisterto all other Burmanniaceae. Consequently, Burmannia is aparaphyletic genus. The neotropical genus Dictyostega issister to the rest of the ingroup. Apteria is sister to the coreBurmannia clade. Within the core Burmannia species B.sphagnoides is sister to the other species, consisting of twoneotropical, two African, one Madagascan, and three EastAsian clades. Hexapterella is sister to Gymnosiphon. Cym-bocarpa is embedded in the Gymnosiphon clade. This clade
Page 2 of 16(page number not for citation purposes)
BMC Evolutionary Biology 2008, 8:178 http://www.biomedcentral.com/1471-2148/8/178
Page 3 of 16(page number not for citation purposes)
Phylogenetic relationships of Burmanniaceae based on phylogenetic analysis of the 3-gene datasetFigure 1Phylogenetic relationships of Burmanniaceae based on phylogenetic analysis of the 3-gene dataset. One of the six most parsimonious trees for the combined 18S rDNA, ITS, and nad1 b-c data. Numbers above branches are bootstrap per-centages from the maximum parsimony analysis. The Bayesian posterior probabilities are shown below branches. Black boxes show ancestral area reconstructions with DIVA. P and N indicate paleotropics and neotropics respectively. A slash separates two equally likely ancestral area hypotheses. Achlorophyllous species are shown in bold.
Burmannia flava - Brazil
Burmannia flava - Guyana
Burmannia stuebelii - Peru
Burmannia bicolor - French Guiana
Burmannia bicolor - Suriname
Burmannia biflora - USA
Burmannia alba - Brazil
Burmannia lutescens - Malaysia
Burmannia nepalensis - China
Burmannia ledermannii - New Guinea
Burmannia oblonga - Thailand
Burmannia pusilla - India
Burmannia madagascariensis - Madagascar
Burmannia madagascariensis - Madagascar
Burmannia wallichii - China
Burmannia itoana - Taiwan
Burmannia longifolia - Malaysia
Burmannia juncea - Australia
Burmannia disticha - Thailand
Burmannia coelestis - Malaysia
Burmannia sp. - Zambia
Burmannia hexaptera - Cameroon
Burmannia capitata - USA
Burmannia capitata - French Guiana
Burmannia damazii - Brazil
Burmannia sphagnoides - Malaysia
Apteria aphylla - USA
Apteria aphylla - Guyana
Gymnosiphon divaricatus - Colombia
Gymnosiphon divaricatus - Guyana
Gymnosiphon suaveolens - Costa Rica
Cymbocarpa refracta - Costa Rica
Cymbocarpa saccata - Guyana
Gymnosiphon panamensis - Mexico
Gymnosiphon longistylus - Cameroon
Gymnosiphon bekensis - Cameroon
Gymnosiphon minutus - Guyana
Gymnosiphon aphyllus - Malaysia
Gymnosiphon usambaricus - Kenya
Gymnosiphon breviflorus - Guyana
Gymnosiphon breviflorus - Guyana
Gymnosiphon breviflorus - Guyana
Gymnosiphon recurvatus - Guyana
Gymnosiphon capitatus - French Guiana
Hexapterella gentianoides - French Guiana
Dictyostega orobanchoides - French Guiana
Campylosiphon purpurascens - Guyana
Burmannia congesta - Cameroon
Burmannia congesta - Liberia
Pandanus tectorius
Burmannia latialata - Gabon
100100
100
100
77
100
88
100
100
100
100
100
100
100
98
67
70
100
87
63
100
66
100
82
100
100
72
100
100
100
76
65
100
52
69
100
100
100
100
99
100
100
91
100
98
100
96
100
100
100
100
90
100
100
95
100
100
100
97
71
100
100
100
100
100
68
100
88
98
100 97
100
100
59
100
74
99
62
68
100
89
99
100
100
72
93
100
NP
N
PP
P
P
P
N
NP
P/NP
N/NP
N
N
N/NP
N/P
N
NP
P/NP
N/P
NP
N
N
P
P
P
P
N
P
P/N
BMC Evolutionary Biology 2008, 8:178 http://www.biomedcentral.com/1471-2148/8/178
consists of three neotropical, one East Asian, and two Afri-can lineages.
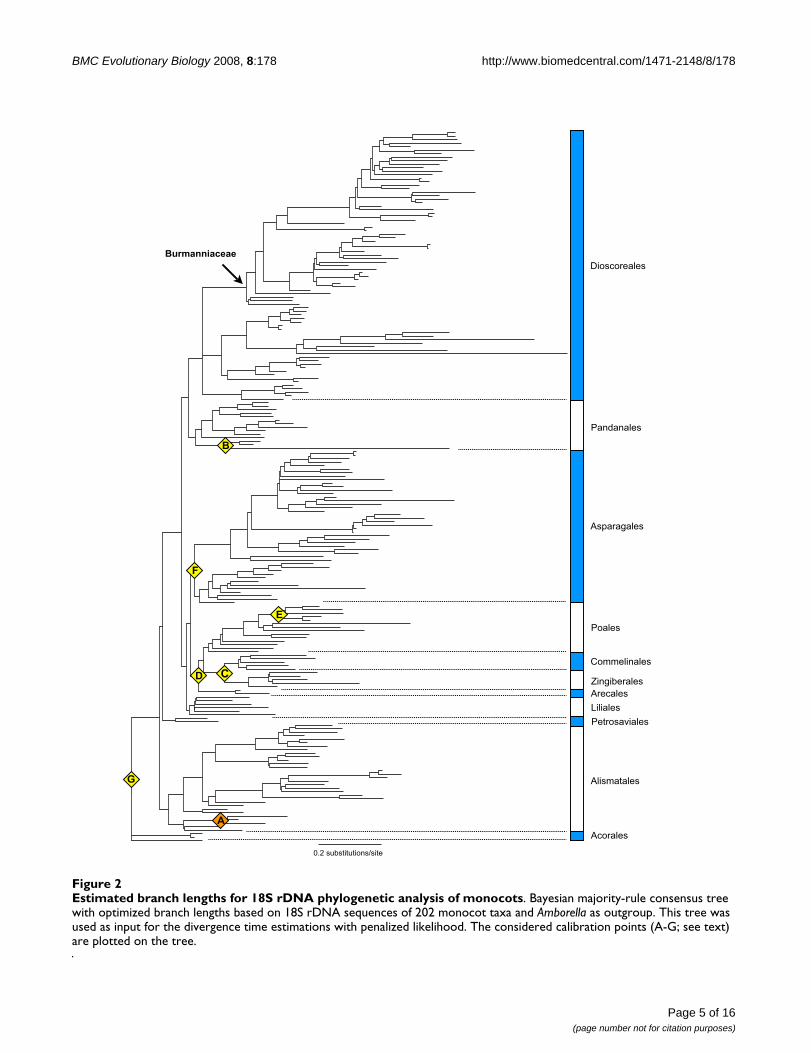
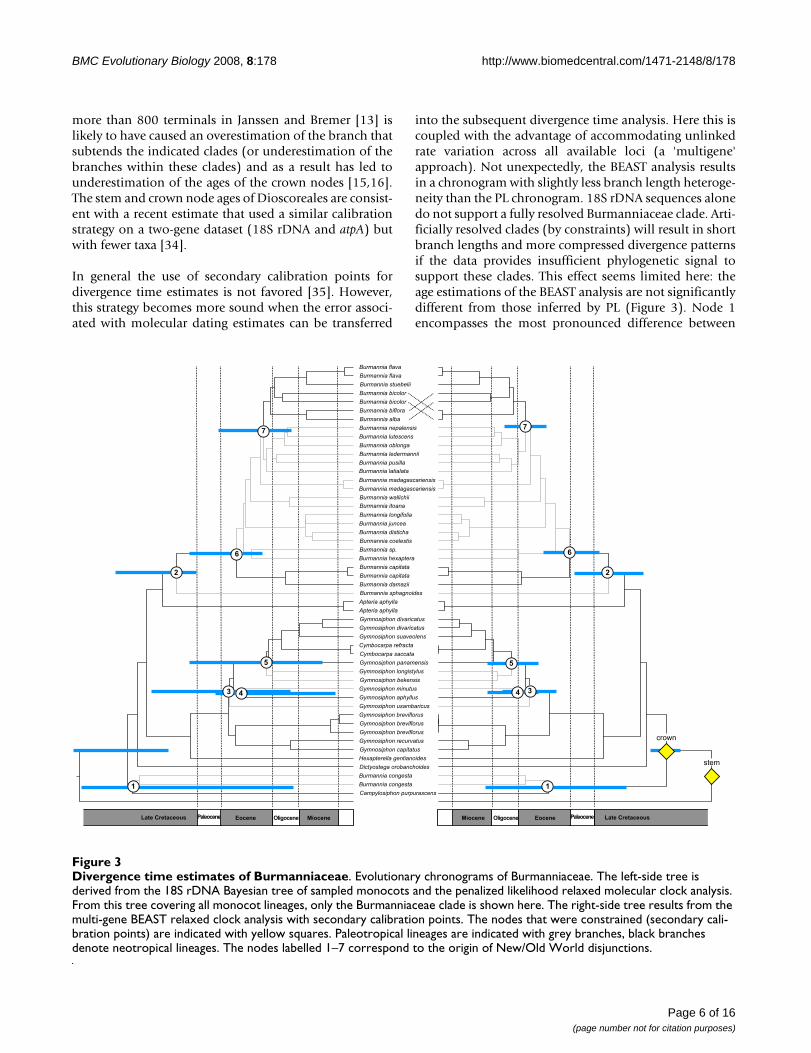
Molecular datingThe 50% majority-rule consensus tree of the constrainedBayesian analysis of the 18S rDNA monocot dataset withoptimized branch lengths is shown in Figure 2. The ageestimations with their standard deviations and credibilityintervals obtained for the monocot orders Acorales, Alis-matales, Petrosaviales, Dioscoreales, Pandanales, Liliales,Asparagales, Arecales, Zingiberales, Commelinales, andPoales are listed in Table 1. The stem-node age of the Bur-manniaceae is estimated to 116 ± 2.6 Mya, the crownnode to 96 ± 3.37 Mya. The Burmanniaceae clade clippedfrom the r8s chronogram of the monocots is shown in Fig-ure 3. The crown and stem age estimates of the Burman-niaceae were used as secondary calibration points for themultigene analysis with BEAST. The chronogram resultingfrom this analysis is also shown in Figure 3.
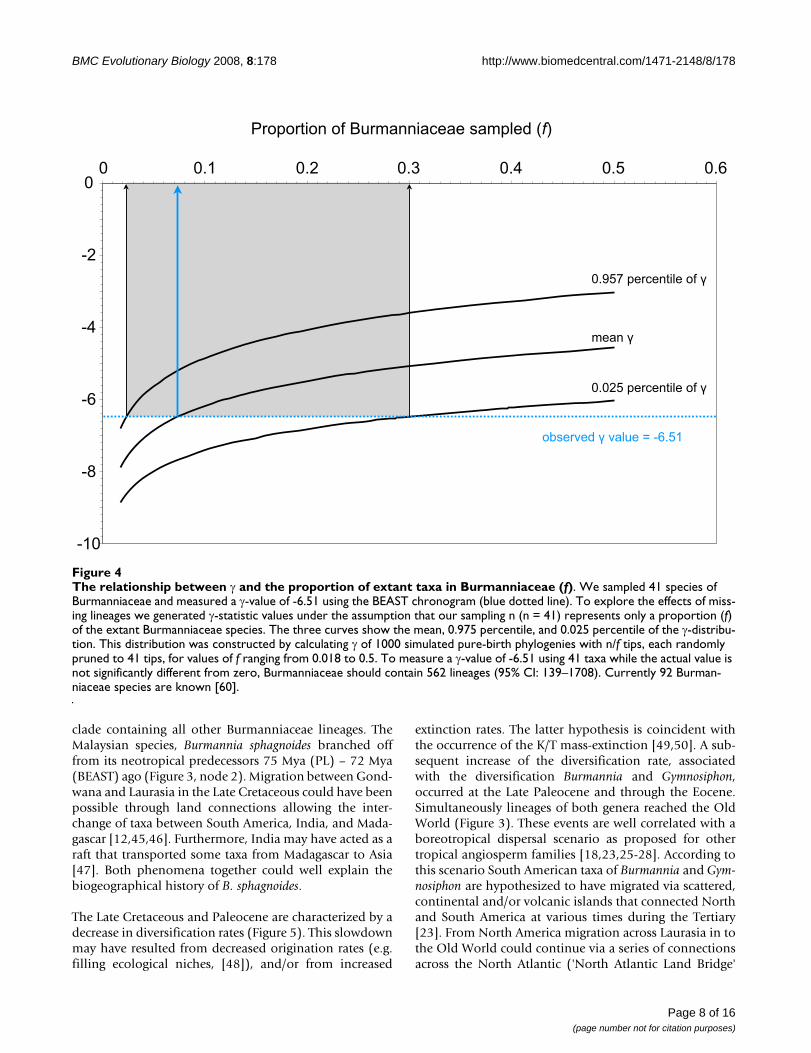
Tempo of diversificationWe measured a negative γ value for our chronogram (γ = -6.51), which rejects the hypothesis that rates of lineageaccumulation in Burmanniaceae remained constant overtime, in favour of a decrease of speciation rate throughtime [30]. Simulations indicate that with a sample of 41species for the γ-statistic to yield – 6.51 when the truevalue is zero, there would need to be 562 species of Bur-manniaceae (95% CI: 139–1708) (Figure 4). We cantherefore reject the possibility that the negative γ-value isthe result of a poor sampling artefact.
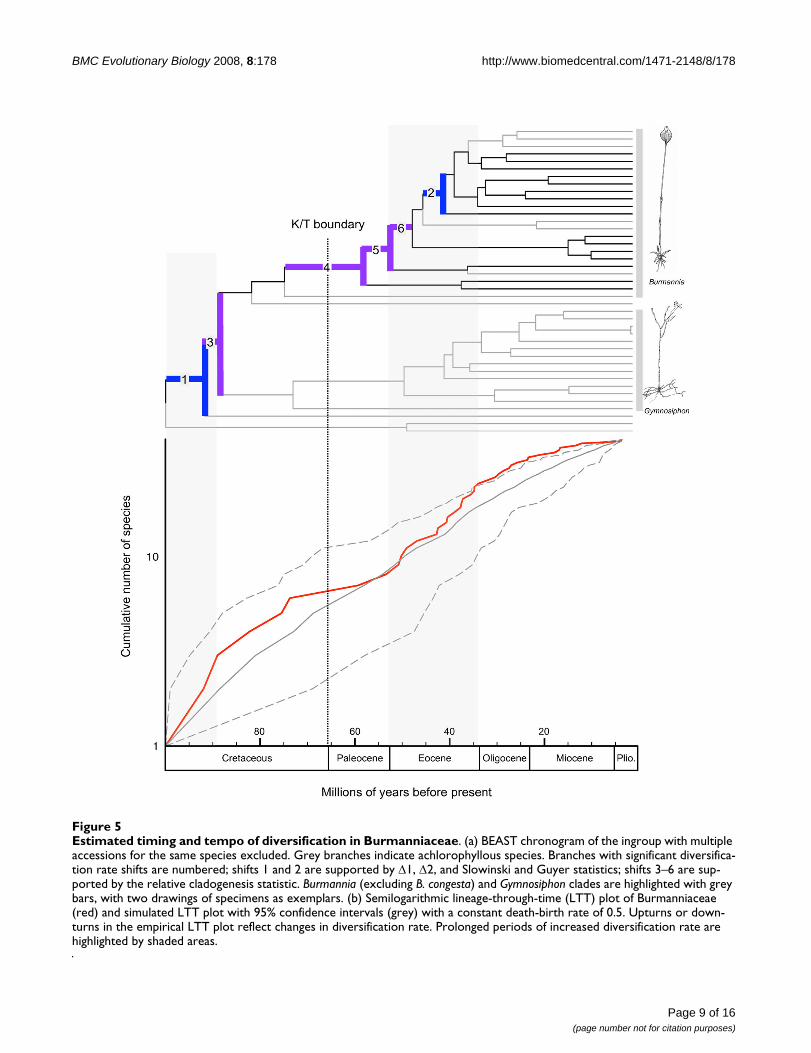
Lineage-through-time plotA semilogarithmic lineage-through-time (LTT) plot (Fig-ure 5) shows a trend toward reduced diversification ratesbeginning ≈72 Mya (Late Cretaceous), and an Eoceneincrease of diversification rate. A model of gradual changein diversification rate (model B, γ = 1.65, AIC = 360.15)was chosen over model A (AIC = 371.05) and model C(AIC = 391.02) as best fit of the empirical LTT plot usingAIC. Model B was preferred no matter which timing of anabrupt rate shift in model C was specified. The hLRTshowed significant difference between model A and B (P= 0.0004), while there was no significant differencebetween model A and C.
Significant diversification rate shifts were detected in twobranches by the Δ1, Δ2, and the Slowinski and Guyer (SG)statistic (Figure 5, branches 1 and 2). The relative clado-genesis (RC) test identified four different branches withrate shifts (Figure 5, branches 3–6). The shifts identifiedby RC should be treated with caution as the RC test is sen-sitive to temporal depth, phylogenetic scope, and the non-independence of diversification rate shifts [31].
Analysis of ancestral areasThe optimal solutions obtained with the DIVA analysiscalculated three equally likely possibilities for the distri-bution of the most recent common ancestor of the Bur-manniaceae: 1) the Amazonian Region; 2) the Guineo-Congolean and Amazonian Region; 3) the Amazonianand Brazilian Region. Thus despite the lack of resolutionto precisely identify the ancestral area of Burmanniaceae,the analysis indicates it was western Gondwanan. Accord-ing to the second DIVA analysis seven New-Old Worlddispersals are required to explain the distribution of theterminals. But again, the ancestral area of Burmanniaceaecannot be tracked solely to the paleotropics or neotropics(Figure 1). We assigned seven nodes that may representdispersal or vicariance events between the neotropics andthe paleotropics (Figure 3). Due to the ambiguous optimi-zation of the ancestral areas events 2 and 3 could equallylikely be placed on adjacent deeper nodes yet this wouldstill place these events in the same geological epoch.
DiscussionDivergence time estimatesThe araceous fossil Mayoa portugallica [32] was identifiedas the most inconsistent calibration point relative to theother calibration points and was therefore not used in thePL analysis, which estimated the node at 64 Mya or 42%younger than suggested by fossil data. This observationdoes not necessary imply that the fossil was assigned to awrong node. There are many possible explanations forthis result (for example, error in branch length estimation,failure of the rate smoothing method to comply with the18S rDNA rate heterogeneity, underestimation of the trueage by the other fossils as a result of an incomplete fossilrecord) [17,33]. A rerun of the PL analysis revealed thatcalibration point A had hardly any impact on the age esti-mations of the Burmanniaceae. With calibration point Aincluded Burmanniaceae age estimations were overall lessthan 1% older (results not shown). Apparently the longphylogenetic distance of calibration point A from the Bur-manniaceae clade or the influence of calibration points inmore closely related clades reduces the impact of this cal-ibration point.
The obtained divergence time estimations of the monocotorders, using a different marker (18S rDNA instead ofrbcL) and considerably fewer taxa, are mostly youngerthan those published by Janssen and Bremer ([13] see alsoTable 1). For most orders these differences in age estima-tions are small. However, the estimations of both crownand stem nodes of some more derived orders (Arecales,Commelinales, and Zingiberales) are considerablyyounger than those of Janssen and Bremer [13] (Table 1).We attempted to sample the earliest-diverging lineages ofeach order as well as some more derived taxa. But themuch lower taxon sampling in our study compared to the
Page 4 of 16(page number not for citation purposes)
BMC Evolutionary Biology 2008, 8:178 http://www.biomedcentral.com/1471-2148/8/178
Page 5 of 16(page number not for citation purposes)
Estimated branch lengths for 18S rDNA phylogenetic analysis of monocotsFigure 2Estimated branch lengths for 18S rDNA phylogenetic analysis of monocots. Bayesian majority-rule consensus tree with optimized branch lengths based on 18S rDNA sequences of 202 monocot taxa and Amborella as outgroup. This tree was used as input for the divergence time estimations with penalized likelihood. The considered calibration points (A-G; see text) are plotted on the tree.
0.2
Dioscoreales
Pandanales
Asparagales
Poales
Commelinales
Zingiberales
Arecales
Liliales
Petrosaviales
Alismatales
Acorales
Burmanniaceae
A
B
D C
F
E
G
0.2 substitutions/site
BMC Evolutionary Biology 2008, 8:178 http://www.biomedcentral.com/1471-2148/8/178
more than 800 terminals in Janssen and Bremer [13] islikely to have caused an overestimation of the branch thatsubtends the indicated clades (or underestimation of thebranches within these clades) and as a result has led tounderestimation of the ages of the crown nodes [15,16].The stem and crown node ages of Dioscoreales are consist-ent with a recent estimate that used a similar calibrationstrategy on a two-gene dataset (18S rDNA and atpA) butwith fewer taxa [34].
In general the use of secondary calibration points fordivergence time estimates is not favored [35]. However,this strategy becomes more sound when the error associ-ated with molecular dating estimates can be transferred
into the subsequent divergence time analysis. Here this iscoupled with the advantage of accommodating unlinkedrate variation across all available loci (a 'multigene'approach). Not unexpectedly, the BEAST analysis resultsin a chronogram with slightly less branch length heteroge-neity than the PL chronogram. 18S rDNA sequences alonedo not support a fully resolved Burmanniaceae clade. Arti-ficially resolved clades (by constraints) will result in shortbranch lengths and more compressed divergence patternsif the data provides insufficient phylogenetic signal tosupport these clades. This effect seems limited here: theage estimations of the BEAST analysis are not significantlydifferent from those inferred by PL (Figure 3). Node 1encompasses the most pronounced difference between
Divergence time estimates of BurmanniaceaeFigure 3Divergence time estimates of Burmanniaceae. Evolutionary chronograms of Burmanniaceae. The left-side tree is derived from the 18S rDNA Bayesian tree of sampled monocots and the penalized likelihood relaxed molecular clock analysis. From this tree covering all monocot lineages, only the Burmanniaceae clade is shown here. The right-side tree results from the multi-gene BEAST relaxed clock analysis with secondary calibration points. The nodes that were constrained (secondary cali-bration points) are indicated with yellow squares. Paleotropical lineages are indicated with grey branches, black branches denote neotropical lineages. The nodes labelled 1–7 correspond to the origin of New/Old World disjunctions.
Burmannia flava
Burmannia flava
Burmannia stuebelii
Burmannia bicolor
Burmannia bicolor
Burmannia biflora
Burmannia alba
Burmannia lutescens
Burmannia nepalensis
Burmannia ledermannii
Burmannia oblonga
Burmannia pusilla
Burmannia madagascariensis
Burmannia madagascariensis
Burmannia wallichii
Burmannia itoana
Burmannia longifolia
Burmannia juncea
Burmannia disticha
Burmannia coelestis
Burmannia sp.
Burmannia hexaptera
Burmannia capitata
Burmannia capitata
Burmannia damazii
Burmannia sphagnoides
Apteria aphylla
Apteria aphylla
Gymnosiphon divaricatus
Gymnosiphon divaricatus
Gymnosiphon suaveolens
Cymbocarpa refracta
Cymbocarpa saccata
Gymnosiphon panamensis
Gymnosiphon longistylus
Gymnosiphon bekensis
Gymnosiphon minutus
Gymnosiphon aphyllus
Gymnosiphon usambaricus
Gymnosiphon breviflorus
Gymnosiphon breviflorus
Gymnosiphon breviflorus
Gymnosiphon recurvatus
Gymnosiphon capitatus
Hexapterella gentianoides
Dictyostega orobanchoides
Campylosiphon purpurascens
Burmannia congesta
Burmannia congesta
Burmannia latialata
Late Cretaceous Paleocene Eocene Oligocene Miocene Late CretaceousPaleoceneEoceneOligoceneMiocene
1
2
3 4
5
6
7
2
6
1
7
5
34
crown
stem
Page 6 of 16(page number not for citation purposes)
BMC Evolutionary Biology 2008, 8:178 http://www.biomedcentral.com/1471-2148/8/178
the two strategies. While PL assigns this node to the Creta-ceous, BEAST favors an Eocene origin, but the credibilityintervals on both estimates are large and overlapping.
Biogeography and diversification of BurmanniaceaeThis study points towards a West Gondwanan origin ofBurmanniaceae. According to our results the familystarted to diversify 96.4 Mya (mid-Cretaceous), wellbefore the K/T boundary. The diversification rate shifttests and the LTT plot suggest a high initial diversificationrate. Mid-Cretaceous climate was relatively warm [36]although fossil data suggests tropical forests were openand dry adapted and modern closed-canopy rain forestdid not originate until after the K/T boundary [37]. How-ever, recent molecular studies suggest that closed-canopyrain forest existed during the mid-Cretaceous [38]. Themost recent common ancestor of Burmanniaceae wasphotosynthetic (see further) and it is possible that initialdiversification of the family started when Burmanniaceaelineages became parasitic on arbuscular mycorrhizal fungias an adaptation to shaded habitats [39]. The separationbetween South America and Africa has been dated to 105Mya [12], but the biogeographical timing of this conti-
nental breakup is somewhat uncertain because it isunclear when an effective dispersal barrier was established[40]. Furthermore, stepping-stone dispersal routesbetween South America and Africa may have delayed bio-geographical isolation into the Late Cretaceous [41].Because the Burmannia congesta-Campylosiphon clade is theearliest-diverging lineage in Burmanniaceae one proposedancestral area of the family includes both neotropics andpaleotropics (Figure 1). Under this assumption the sepa-ration between Africa and South America is likely to bereflected in the divergence time hypotheses. While such avicariance event is indeed suggested by the direct datingapproach with PL (node 1 = 94 Mya), BEAST analysisfavours an Eocene divergence (node 1 = 47 Mya). Due tothe large error associated with both estimates none of thehypotheses can be rejected. A Cretaceous continental driftscenario thus could explain the split between B. congestaand Campylosiphon, however, such a vicariance event hasbeen observed only rarely in flowering plants [42-44].Contrasting this hypothesis, an Eocene boreotropicalmigration scenario (see further) would be an equally pos-sible explanation for the disjunction observed in node 1.The DIVA analysis supports a neotropical origin for the
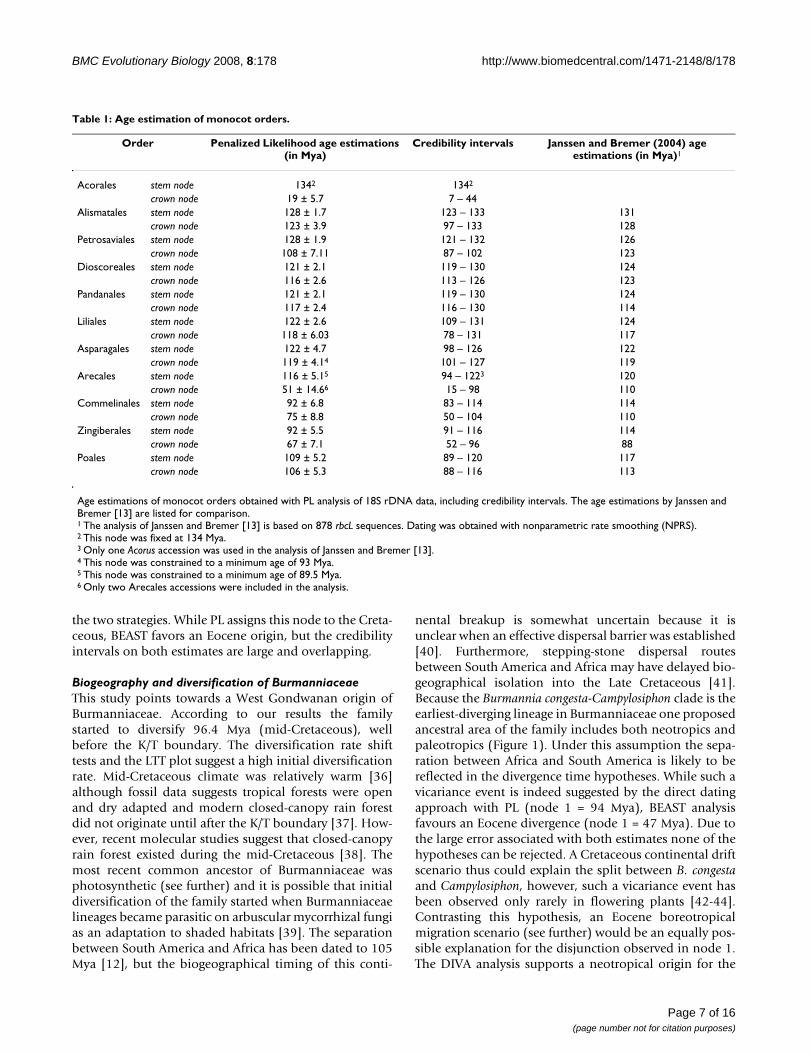
Table 1: Age estimation of monocot orders.
Order Penalized Likelihood age estimations (in Mya)
Credibility intervals Janssen and Bremer (2004) age estimations (in Mya)1
Acorales stem node 1342 1342
crown node 19 ± 5.7 7 – 44Alismatales stem node 128 ± 1.7 123 – 133 131
crown node 123 ± 3.9 97 – 133 128Petrosaviales stem node 128 ± 1.9 121 – 132 126
crown node 108 ± 7.11 87 – 102 123Dioscoreales stem node 121 ± 2.1 119 – 130 124
crown node 116 ± 2.6 113 – 126 123Pandanales stem node 121 ± 2.1 119 – 130 124
crown node 117 ± 2.4 116 – 130 114Liliales stem node 122 ± 2.6 109 – 131 124
crown node 118 ± 6.03 78 – 131 117Asparagales stem node 122 ± 4.7 98 – 126 122
crown node 119 ± 4.14 101 – 127 119Arecales stem node 116 ± 5.15 94 – 1223 120
crown node 51 ± 14.66 15 – 98 110Commelinales stem node 92 ± 6.8 83 – 114 114
crown node 75 ± 8.8 50 – 104 110Zingiberales stem node 92 ± 5.5 91 – 116 114
crown node 67 ± 7.1 52 – 96 88Poales stem node 109 ± 5.2 89 – 120 117
crown node 106 ± 5.3 88 – 116 113
Age estimations of monocot orders obtained with PL analysis of 18S rDNA data, including credibility intervals. The age estimations by Janssen and Bremer [13] are listed for comparison.1 The analysis of Janssen and Bremer [13] is based on 878 rbcL sequences. Dating was obtained with nonparametric rate smoothing (NPRS).2 This node was fixed at 134 Mya.3 Only one Acorus accession was used in the analysis of Janssen and Bremer [13].4 This node was constrained to a minimum age of 93 Mya.5 This node was constrained to a minimum age of 89.5 Mya.6 Only two Arecales accessions were included in the analysis.
Page 7 of 16(page number not for citation purposes)
BMC Evolutionary Biology 2008, 8:178 http://www.biomedcentral.com/1471-2148/8/178
clade containing all other Burmanniaceae lineages. TheMalaysian species, Burmannia sphagnoides branched offfrom its neotropical predecessors 75 Mya (PL) – 72 Mya(BEAST) ago (Figure 3, node 2). Migration between Gond-wana and Laurasia in the Late Cretaceous could have beenpossible through land connections allowing the inter-change of taxa between South America, India, and Mada-gascar [12,45,46]. Furthermore, India may have acted as araft that transported some taxa from Madagascar to Asia[47]. Both phenomena together could well explain thebiogeographical history of B. sphagnoides.
The Late Cretaceous and Paleocene are characterized by adecrease in diversification rates (Figure 5). This slowdownmay have resulted from decreased origination rates (e.g.filling ecological niches, [48]), and/or from increased
extinction rates. The latter hypothesis is coincident withthe occurrence of the K/T mass-extinction [49,50]. A sub-sequent increase of the diversification rate, associatedwith the diversification Burmannia and Gymnosiphon,occurred at the Late Paleocene and through the Eocene.Simultaneously lineages of both genera reached the OldWorld (Figure 3). These events are well correlated with aboreotropical dispersal scenario as proposed for othertropical angiosperm families [18,23,25-28]. According tothis scenario South American taxa of Burmannia and Gym-nosiphon are hypothesized to have migrated via scattered,continental and/or volcanic islands that connected Northand South America at various times during the Tertiary[23]. From North America migration across Laurasia in tothe Old World could continue via a series of connectionsacross the North Atlantic ('North Atlantic Land Bridge'
The relationship between γ and the proportion of extant taxa in Burmanniaceae (f)Figure 4The relationship between γ and the proportion of extant taxa in Burmanniaceae (f). We sampled 41 species of Burmanniaceae and measured a γ-value of -6.51 using the BEAST chronogram (blue dotted line). To explore the effects of miss-ing lineages we generated γ-statistic values under the assumption that our sampling n (n = 41) represents only a proportion (f) of the extant Burmanniaceae species. The three curves show the mean, 0.975 percentile, and 0.025 percentile of the γ-distribu-tion. This distribution was constructed by calculating γ of 1000 simulated pure-birth phylogenies with n/f tips, each randomly pruned to 41 tips, for values of f ranging from 0.018 to 0.5. To measure a γ-value of -6.51 using 41 taxa while the actual value is not significantly different from zero, Burmanniaceae should contain 562 lineages (95% CI: 139–1708). Currently 92 Burman-niaceae species are known [60].
-10
-9
-8
-7
-6
-5
-4
-3
-2
-1
0
0 0,1 0,2 0,3 0,4 0,5 0,6
0
-2
-4
-6
-8
-10
0 0.1 0.2 0.3 0.4 0.5 0.6
0.957 percentile of �
mean �
0.025 percentile of �
Proportion of Burmanniaceae sampled (f)
observed � value = -6.51
Page 8 of 16(page number not for citation purposes)
BMC Evolutionary Biology 2008, 8:178 http://www.biomedcentral.com/1471-2148/8/178
Page 9 of 16(page number not for citation purposes)
Estimated timing and tempo of diversification in BurmanniaceaeFigure 5Estimated timing and tempo of diversification in Burmanniaceae. (a) BEAST chronogram of the ingroup with multiple accessions for the same species excluded. Grey branches indicate achlorophyllous species. Branches with significant diversifica-tion rate shifts are numbered; shifts 1 and 2 are supported by Δ1, Δ2, and Slowinski and Guyer statistics; shifts 3–6 are sup-ported by the relative cladogenesis statistic. Burmannia (excluding B. congesta) and Gymnosiphon clades are highlighted with grey bars, with two drawings of specimens as exemplars. (b) Semilogarithmic lineage-through-time (LTT) plot of Burmanniaceae (red) and simulated LTT plot with 95% confidence intervals (grey) with a constant death-birth rate of 0.5. Upturns or down-turns in the empirical LTT plot reflect changes in diversification rate. Prolonged periods of increased diversification rate are highlighted by shaded areas.
BMC Evolutionary Biology 2008, 8:178 http://www.biomedcentral.com/1471-2148/8/178
[23,51]. Further diversification into Africa, Madagascar,and Asia would explain the current distribution patternsof these genera. Laurasian migration of tropical groupswas facilitated by warm and humid climates that occurredduring the Eocene [52]. Particularly at the beginning ofthe Eocene global temperatures peaked and plants withtropical affinities grew at middle and high latitudes[53,54]. This is also the reason why an eastern migrationthrough Beringia, which did not support tropical vegeta-tion, seems unlikely [23,26]. Significant cooling duringthe Oligocene caused a retraction of the boreotropicalflora from across the North Atlantic [55]. This cooling,which started at the end of the Eocene [51], probablycaused a 'climatic' vicariance in Burmannia and Gymnosi-phon: as both distributions moved southwards theybecame separated into New and Old World groups (Fig-ure 3, nodes 5 and 7). According to our results, no migra-tion between the neotropics and paleotropics occurred forthe remaining ≈30 My, illustrating the limited long-dis-tance dispersal capabilities of Burmanniaceae species.Simultaneously with the Oligocene cooling the LTT plotshows the start of a gradual decrease of the diversificationrate towards the present. An overall decrease in lineageaccumulation for Burmanniaceae is also suggested by theCR test.
Loss of chlorophyllOne of the most intriguing features of Burmanniaceae isthe absence of chlorophyll in most taxa, except for someBurmannia species. Almost nothing is known about thechloroplast genome in achlorophyllous Burmanniaceaeor myco-heterotrophic plants in general. Studies on thechloroplast genome of parasitic plants reported the loss ofmost chloroplast genes [56,57]. If we assume that thechloroplast genes in myco-heterotrophic Burmanniaceaeundergo the same fate, then a reversal to autotrophyseems highly improbable. With this assumption, at leasteight independent losses of chlorophyll took place in Bur-manniaceae (Figure 5). As each lineage may have lost itschlorophyll independently, it is difficult to speculateabout the age of these events. According to a most-parsi-monious pattern, the ancestral lineage leading to the Gym-nosiphon-Hexapterella clade lost its photosynthesis duringthe Late Cretaceous. The evolution from a mycorrhizalphotosynthetic plant towards a non-photosyntheticmyco-heterotroph has been explained as a phenomenonthat can provide escape from competitive exclusion in theshaded conditions of forest understory habitats [39]. ALate Cretaceous origin of myco-heterotrophy thus pro-vides evidence for the presence of closed-canopy environ-ments before the K/T boundary [38]. The chlorophylllosses in the core Burmannia clade would have occurredduring the Eocene and the Oligocene, when closed-can-opy rain forest was abundant even at low latitudes[53,58]. While Burmannia species seem to have lost their
chlorophyll after crossing the North Atlantic Land Bridge,a single loss event in the Gymnosiphon clade would haveoccurred before their Laurasian migration. This result sug-gests that achlorophyllous plant species were able tomigrate and diversify long after their adaptation to amyco-heterotrophic nutrition strategy.
ConclusionIn his excellent monograph of the Burmanniaceae Jonker[10] wrote: "Fossil Burmanniaceae are unknown. Thefamily however is very old, according to the occurrence ofclosely related species in America, Africa, and Asia [...]".Our analyses reveal that Burmanniaceae are a relativelyold family, and vicariance events possibly influenced theearly diversification of the family. Our study also suggeststhat the diversification and radiation of the pantropicalgenera Burmannia and Gymnosiphon started from SouthAmerica during the Eocene when continental drift hadseparated South America from Africa. The global temper-ature during that epoch was high enough to allow tropicalrain forests to expand significantly. This triggered anincreased diversification in Burmannia and Gymnosiphonand allowed for boreotropical migration across the NorthAtlantic Ocean in to the Old World for both genera. Ourresults imply that the increase of neotropical plant diver-sity during the Eocene [58] and the boreotropical migra-tion of tropical plants [23-29] also applies to myco-heterotrophic plants.
MethodsMolecular dataThis study samples 41 species of Burmanniaceae, coveringseven of the nine genera [10,59,60]. Only the monospe-cific neotropical genera Marthella and Miersiella are notrepresented. For Burmannia our sampling includes 23 ofthe approximately 60 described species (38%), for Gym-nosiphon 12 species of 24 known species were available(50%) [60]. With species from the New World, Africa, andAsia our sampling covers the current geographic distribu-tion range of both genera. For the phylogenetic inferenceof Burmanniaceae, sequence data of Pandanus tectorius(Pandanales) were used as outgroup. Herbarium vouchersand GenBank accessions for the taxa used in this study arelisted in Additional file 1.
Sequence data of 18S rDNA and nad1 b-c from a previousstudy [61] were supplemented with additional sequences.For most species ITS data was obtained using the follow-ing protocol. DNA was extracted from silica dried and her-barium material with the PureGene DNA extraction kit(Gentra Systems, Landgraaf, The Netherlands) followingthe manufacturer's instructions. The nuclear 18S rDNAregion and the mitochondrial nad1 b-c intron were ampli-fied following Merckx et al. [61]. Amplification of thenuclear ITS region was carried out with the primers ITS1
Page 10 of 16(page number not for citation purposes)
BMC Evolutionary Biology 2008, 8:178 http://www.biomedcentral.com/1471-2148/8/178
and ITS4 [62], with a premelt of 5 min at 94°C, followedby 30 cycles of 30 s of denaturation at 94°C, 30 s anneal-ing at 55°C, 1 min extension at 72°C, and a 7 min finalextension at 72°C. All PCR products were cleaned withthe Nucleospin Extract II columns (Machery-Nagel,Düren, Germany) following manufacturer's instructions.Sequencing reactions were run on an ABI 310 automatedsequencer (Applied Biosystems, Fostercity, USA). Somesamples were sequenced by the Macrogen sequencingfacilities (Macrogen, Seoul, South Korea). Sequencingfiles were edited and assembled using Staden for Mac OSX [63].
Due to contamination with fungal DNA no ITS data couldbe obtained for three taxa: Burmannia sphagnoides, Gym-nosiphon suaveolens, and G. panamensis. In the nad1 b-cdataset sequences of B. nepalensis and C. saccata are miss-ing. The nad1 b-c sequence of C. saccata (DQ786096) wasnot used as this sequence probably belongs to a Gymnosi-phon species.
Alignment was done by eye using MacClade 4.04 [64].Gaps in the nad1 b-c intron data were coded using the sim-ple indel coding method (SIC; [65]) as implemented inSeqState [66]. Autapomorphic indel characters were man-ually removed from the dataset.
Phylogenetic analysesMolecular data were analyzed using maximum parsimonyand Bayesian methods. Each of the three data partitions(18S rDNA, ITS, and nad1 b-c [including indel charac-ters]) was analyzed separately. Since no strongly sup-ported (>85% bootstrap percentage/>95% Bayesianposterior probability) incongruences were observedbetween the topologies, combined analyses of the molec-ular data were performed. Maximum parsimony (MP)analyses were done with PAUP* v4b10 [67] using a heu-ristic search with the TBR branch swapping algorithm for1,000 replicates, holding 5 trees at each step and with theMultrees option in effect. Branch stability was calculatedusing a bootstrap analysis with 1,000 pseudo-replicates.For each replicate a heuristic search was conducted withthe same settings as described above. Model selection forthe Bayesian analyses was done using Modeltest v3.06[68]. For all tree genes Modeltest selected the GTR+I+Gmodel. For the indel data we selected the restriction sitemodel as recommended in the MrBayes 3.1 manual [69].The combined analyses were performed with a partitionedmodel approach. Bayesian analyses were run on the K.U.Leuven UNIX cluster ('VIC') using MrBayes 3.1.2 [70,71].Each analysis was run three times for three million gener-ations sampling every 1,000 generations. The first 50% ofthe sampled trees were treated as burnin and discarded.The sump command in MrBayes was used to checkwhether the two separate analyses converged on similar
log-likelihoods. Additionally convergence of the chainswas checked using TRACER 1.4 [72] and the effective sam-pling size (ESS) parameter was found to exceed 100,which suggests acceptable mixing and sufficient sampling.
Divergence time estimationBurmanniaceae and Dioscoreales in general are absentfrom the fossil record [73] and because our sampling doesnot allow dating based on geographic history (e.g. vol-canic islands), it is impossible to calibrate the Burman-niaceae tree directly. To estimate ages of nodes in theBurmanniaceae phylogeny we expanded our phylogeny tocomprise all monocot lineages. This allowed the incorpo-ration of multiple fossil calibration points, in order tominimize bias produced by single calibration points. Anadditional purpose was to have fossils calibrating nodes atdifferent distances to the root of the phylogeny, averagingout any biases that might result from calibrating at differ-ent levels in the phylogeny. To this end we extended our18S rDNA sampling with 18S rDNA accessions from Gen-Bank of all monocot orders and Amborella as outgroup[see Additional file 1]. This dataset of 203 taxa and 1662characters was analyzed with MrBayes using the followingconstraints: (1) all monocot orders were forced to bemonophyletic; (2) the relationships between the orderswas constrained according to the multi-gene monocottopology by Chase [74], and (3) the relationshipsbetween the Burmanniaceae taxa were constrained to themulti-gene tree presented in this study. The Bayesian anal-ysis was run for five million generations, sampling every1,000 generations, and using the GTR+I+G model asselected by the AIC implemented in Modeltest 3.06. Amajority-rule consensus tree with branch lengths averagedover the last 2,500 trees (50%) was obtained with thesumt command. Branch lengths of this majority-rule con-sensus tree were then optimized with MrBayes under theGTR+I+G model by setting the proposal probability('props') of the 'node slider' to 5 and the proposal proba-bility of all other topology moves to 0 [69]. BecauseMrBayes requires a fully resolved starting tree polytomiesin the majority-rule consensus tree were arbitrarilyresolved. The MCMC was run over two million genera-tions, sampling every 1,000 generations. A majority ruletree was calculated over the last 1,000 sampled trees (Fig-ure 1). Because a χ2 likelihood ratio test strongly rejecteda strict molecular clock for our data (χ2 = 1316.36; df =201; P = 6.6 × 10-150), we applied a relaxed clock model,using penalized likelihood (PL) analysis as implementedin r8s [75] to obtain age estimations. Seven calibrationpoints were used to calibrate the 18S rDNA tree (Figure 2).A: a minimum age constraint of the stem node of Mons-teroideae (Araceae) of 110 Mya. This is consistent to theminimum age of Mayoa portugallica, an araceous fossilassigned to the tribe Spathiphylleae [32]. B: a minimumage constraint of 90 Mya to the crown node of Triuri-
Page 11 of 16(page number not for citation purposes)
BMC Evolutionary Biology 2008, 8:178 http://www.biomedcentral.com/1471-2148/8/178
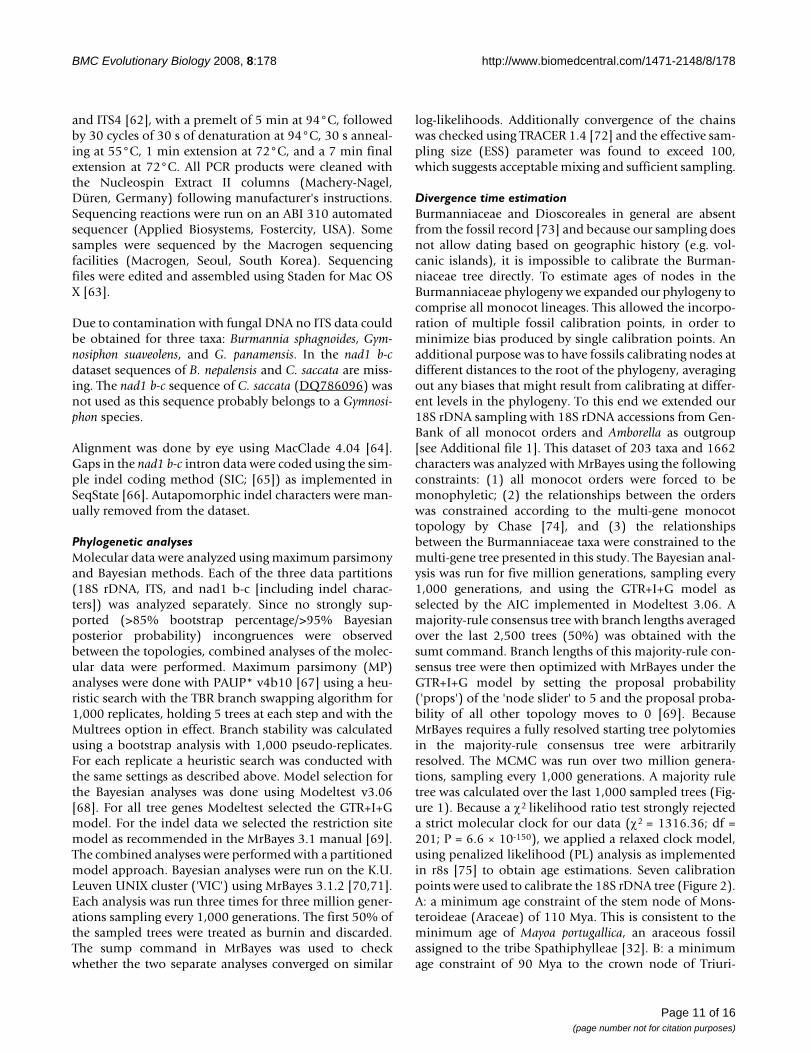
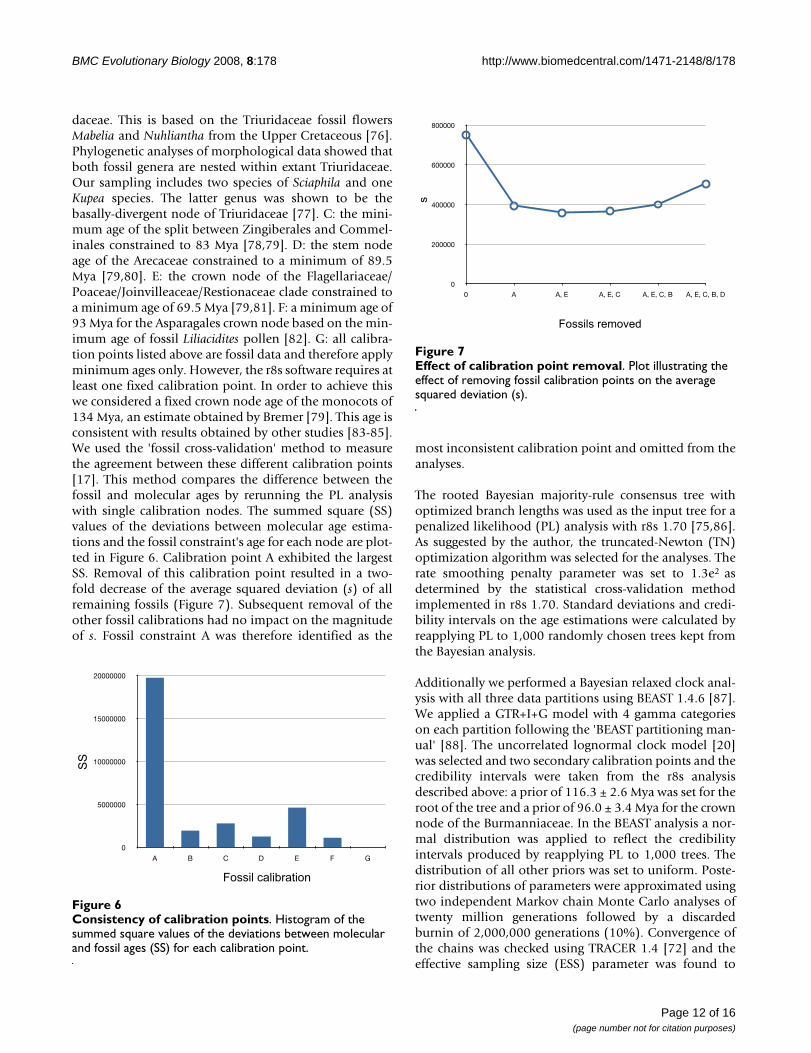
daceae. This is based on the Triuridaceae fossil flowersMabelia and Nuhliantha from the Upper Cretaceous [76].Phylogenetic analyses of morphological data showed thatboth fossil genera are nested within extant Triuridaceae.Our sampling includes two species of Sciaphila and oneKupea species. The latter genus was shown to be thebasally-divergent node of Triuridaceae [77]. C: the mini-mum age of the split between Zingiberales and Commel-inales constrained to 83 Mya [78,79]. D: the stem nodeage of the Arecaceae constrained to a minimum of 89.5Mya [79,80]. E: the crown node of the Flagellariaceae/Poaceae/Joinvilleaceae/Restionaceae clade constrained toa minimum age of 69.5 Mya [79,81]. F: a minimum age of93 Mya for the Asparagales crown node based on the min-imum age of fossil Liliacidites pollen [82]. G: all calibra-tion points listed above are fossil data and therefore applyminimum ages only. However, the r8s software requires atleast one fixed calibration point. In order to achieve thiswe considered a fixed crown node age of the monocots of134 Mya, an estimate obtained by Bremer [79]. This age isconsistent with results obtained by other studies [83-85].We used the 'fossil cross-validation' method to measurethe agreement between these different calibration points[17]. This method compares the difference between thefossil and molecular ages by rerunning the PL analysiswith single calibration nodes. The summed square (SS)values of the deviations between molecular age estima-tions and the fossil constraint's age for each node are plot-ted in Figure 6. Calibration point A exhibited the largestSS. Removal of this calibration point resulted in a two-fold decrease of the average squared deviation (s) of allremaining fossils (Figure 7). Subsequent removal of theother fossil calibrations had no impact on the magnitudeof s. Fossil constraint A was therefore identified as the
most inconsistent calibration point and omitted from theanalyses.
The rooted Bayesian majority-rule consensus tree withoptimized branch lengths was used as the input tree for apenalized likelihood (PL) analysis with r8s 1.70 [75,86].As suggested by the author, the truncated-Newton (TN)optimization algorithm was selected for the analyses. Therate smoothing penalty parameter was set to 1.3e2 asdetermined by the statistical cross-validation methodimplemented in r8s 1.70. Standard deviations and credi-bility intervals on the age estimations were calculated byreapplying PL to 1,000 randomly chosen trees kept fromthe Bayesian analysis.
Additionally we performed a Bayesian relaxed clock anal-ysis with all three data partitions using BEAST 1.4.6 [87].We applied a GTR+I+G model with 4 gamma categorieson each partition following the 'BEAST partitioning man-ual' [88]. The uncorrelated lognormal clock model [20]was selected and two secondary calibration points and thecredibility intervals were taken from the r8s analysisdescribed above: a prior of 116.3 ± 2.6 Mya was set for theroot of the tree and a prior of 96.0 ± 3.4 Mya for the crownnode of the Burmanniaceae. In the BEAST analysis a nor-mal distribution was applied to reflect the credibilityintervals produced by reapplying PL to 1,000 trees. Thedistribution of all other priors was set to uniform. Poste-rior distributions of parameters were approximated usingtwo independent Markov chain Monte Carlo analyses oftwenty million generations followed by a discardedburnin of 2,000,000 generations (10%). Convergence ofthe chains was checked using TRACER 1.4 [72] and theeffective sampling size (ESS) parameter was found to
Effect of calibration point removalFigure 7Effect of calibration point removal. Plot illustrating the effect of removing fossil calibration points on the average squared deviation (s).
0
200000
400000
600000
800000
0 A A, E A, E, C A, E, C, B A, E, C, B, D
Fossils removed
s
Consistency of calibration pointsFigure 6Consistency of calibration points. Histogram of the summed square values of the deviations between molecular and fossil ages (SS) for each calibration point.
0
5000000
10000000
15000000
20000000
A B C D E F G
Fossil calibration
SS
Page 12 of 16(page number not for citation purposes)
BMC Evolutionary Biology 2008, 8:178 http://www.biomedcentral.com/1471-2148/8/178
exceed 100, which suggests acceptable mixing and suffi-cient sampling. The XML BEAST input file is availablefrom the first author on request.
Tempo of diversificationWe evaluated the tempo of lineage accumulation in Bur-manniaceae using the constant-rate (CR) test [30]. Thistest uses the γ-statistic to compare the relative positions ofthe nodes in the chronogram to those expected under aCR model of diversification. A negative value of the γ-sta-tistic indicates that that nodes are closer to the root thanexpected under a CR model and implies a deceleration inthe accumulation of lineages. A positive value indicatesthat nodes are closer to the tips than expected under a CRmodel and implies an acceleration of lineages [30]. A CRmodel of diversification can be rejected at the 95% level ifγ < -1.645 [30]. We calculated the gamma-statistic of theBEAST chronogram of the ingroup with duplicate speciesexcluded. However, the γ-statistic is biased by extinction,because older lineages have higher risks of being extinct atpresent than younger ones (bias towards positive γ val-ues), and by incomplete taxon sampling, because nodesnear the root of the tree give rise to more extant descend-ants than nodes near the tips and are therefore more likelyto be included in a small random sample (bias towardsnegative γ values) [89,90]. To explore the effects of incom-plete taxon sampling on the γ-statistic calculated on theBurmanniaceae chronogram we simulated pure-birth (d:b= 0) trees with Phylogen 1.1 [91] under the assumptionthat our Burmanniaceae sampling n (n = 41) representsonly a proportion (f) of the actual diversity [92,93]. 1,000pure-birth trees were simulated with n/f tips for f valuesranging from 0.018 to 0.5. This corresponds to an extantBurmanniaceae diversity ranging from 82 to 2278 species.Each tree was then randomly pruned to 41 tips and the γ-statistic was calculated. For each simulated dataset of1000 phylogenies the mean value of γ and the 95% confi-dence interval were plotted to estimate the 95% confi-dence interval for the number of lineages that must bemissing to obtain a γ-statistic as extreme as the measuredone if γ actually is zero [93]. The resulting curves areshown in Figure 4. All γ-statistics were calculated withGenie 3.0 [94].
Lineage-through-time plotA lineage-through-time (LTT) plot of the BEAST chrono-gram without doublet species was constructed with END-EPI [95]. Our sampling consisted of ≈45% of describedBurmanniaceae lineages (41 out of 92 species [60]). Toevaluate the effects of incomplete taxon sampling on theslope of the LTT plot, we generated 1,000 phylogenieswith 92 taxa under a death-birth ratio of 0.5, and ran-domly pruned each tree to 41 taxa. The branch lengths ofthe resulting trees were scaled with TreeEdit 1.0 [95] to setthe root node of each tree 96.4 My from the tips (the
crown node age of the Burmanniaceae estimated usingBEAST). The scaled trees were used to construct a meanLTT curve with 95% confidence intervals. To evaluate thefit of the empirical LTT plot to three general models ofdiversification (A, B, and C [97,98]) we used the differentsurvival models implemented in the APE 1.8 package[97,99]. Model A assumes a constant diversification rate;Model B assumes a monotonically changing diversifica-tion rate. The parameter that controls the change of thisrate is called γ. If γ is greater than one, then the diversifica-tion rate decreases through time. Model C assumes anabrupt change in rate before and after some breakpoint inthe past. See McKenna & Farrell [98] for a visual compari-son between these models. For model C, optimal timepoints for a shift in rate of diversification suggested by theLTT plot were tested. To detect and locate significant diver-sification rate shifts we used the Δ1, Δ2, and the Slowinskiand Guyer (SG) [99] statistic (implemented in Symme-TREE 1.1 [100]), and the relative cladogenesis (RC) test(implemented in END-EPI).
Analysis of ancestral areasWe estimated ancestral areas of Burmanniaceae with a dis-persal-vicariance analysis using DIVA 1.1 [101]. Speciesdistributions were scored using floristic regions asdescribed by Takhtajan [102]. The ingroup taxa used inthis study are distributed over 12 regions: Guineo-Congo-lian Region, Sudano-Zambezian Region, MadagascanRegion, Indian Region, Indochinese Region, MalaysianRegion, Caribbean Region, Amazonian Region (includingGuyana Highlands), Brazilian Region, Eastern AsiaticRegion, Northeast Australian Region, North AmericanAtlantic Region. The number of unit areas allowed inancestral distributions was restricted to two with the max-areas option in DIVA. To estimate the number of disper-sals between the New and Old World the DIVA analysiswas repeated with the terminals scored for presence ineither the New World or the Old World.
Abbreviations18S rDNA: Nuclear small subunit ribosomal DNA; AIC:Akaike information criterion; CR test: Constant rate test;GTR: General time reversible model (a model of DNAsequence evolution); hLRT: Hierarchical likelihood ratiotest; I + G: Invariant sites plus gamma distribution; ITS:Internal transcribed spacer; LTT plot: Lineage-through-time plot; MCMC: Markov chain Monte Carlo (a simula-tion method used to approximate the posterior probabil-ity of trees); nad1 b-c: The intron between the b and cexons of subunit one of the mitochondrial gene forNADH dehydrogenase; PL: Penalized likelihood; RC test:Relative cladogenesis test; SG statistic: Slowinski andGuyer statistic.
Page 13 of 16(page number not for citation purposes)
BMC Evolutionary Biology 2008, 8:178 http://www.biomedcentral.com/1471-2148/8/178
Authors' contributionsVM conceived the study, gathered the molecular data, car-ried out the analyses, and wrote and edited the manu-script. LWC participated in the design of the study, helpedwith the analyses and writing of the manuscript. BL partic-ipated in the molecular study and the sequence align-ment. MNS collected samples and helped drafting themanuscript. SH contributed to the data interpretationsand writing of the manuscript. EFS participated in thecoordination of the study and helped drafting the manu-script. All authors read and approved the final manu-script.
Additional material
AcknowledgementsThe authors thank Joep Moonen, Michel De Bont, Marcus Etonge, Steven Dessein, Renske Ek, Thassilo Franke, William Hahn, Robert Harwood, Carel Jongkind, Kun-Ping Lo, Ray Neyland, Dan Nickrent, Axel Poulsen, Piet Ruijters, Sofie Ruysschaert, Inge Van Der Linden, Carel Jongkind, Olaf Banki, Paul Maas, Hiltje Maas, and Stephan Imhof for support during collec-tion trips or sending plant material. We are also grateful to Steven Janssens, Jan De Laet and Peter Schols for technical assistance. Susanne Renner and an anonymous reviewer provided helpful comments on earlier versions of this manuscript. VM has a research grant from the Institute for the Promo-tion of Innovation through Science and Technology in Flanders (IWT Vlaan-deren, no. 31536). General financial support was provided by the K.U. Leuven (OT/05/35) and FWO (G.0418.08).
References1. Cheek M, Williams S: A review of African saprophytic flowering
plants. In African plants: biodiversity, taxonomy Edited by: TimberlakeJ, Kativu S. Kew: Royal Botanic Gardens; 1999:39-49.
2. Zhang D, Saunders RMK, Hu C: Corsiopsis chinensis gen. et sp.nov. (Corsiaceae): first record of the family in Asia. Syst Bot1999, 24:311-314.
3. Sasidharan N, Sujanapal P: Rediscovery of Haplothismia exannu-lata Airy Shaw (Burmanniaceae) from its type locality. Rhee-dea 2000, 10:131-134.
4. Woodward C, Berry PE, Maas-van de Kamer H, Swing K: Tiputiniafoetida, a new mycoheterotrophic genus of Thismiaceaefrom Amazonian Ecuador, and a likely case of deceit pollina-tion. Taxon 2007, 56:157-162.
5. Leake JR: The biology of myco-heterotrophic ('saprophytic')plants. New Phytol 1994, 127:171-216.
6. Bidartondo MI, Redecker D, Hijri I, Wiemken A, Bruns TD,Domínguez L, Sérsic A, Leake JR, Read DJ: Epiparasitic plants spe-cialized on arbuscular mycorrhizal fungi. Nature 2002,419:389-392.
7. Franke T, Beenken L, Döring M, Kocyan A, Agerer R: Arbuscularmycorrhizal fungi of the Glomus-group A lineage (Glomer-ales; Glomeromycota) detected in myco-heterotrophicplants from tropical Africa. Mycol Progress 2006, 5:24-31.
8. Maas PJM, Ruyters P: Voyria and Voyriella (saprophytic Gen-tianaceae). Flora Neotropica 1986, 41:1-93.
9. Malme GOA: Die Burmannien der ersten Regnel'schen Expe-dition. Bih Kongl Svenska Vetensk-Akad Handl 1896, 22:1-32.
10. Jonker FP: A monograph of the Burmanniaceae. Meded Bot MusHerb Rijksuniv Utrecht 1938, 51:1-279.
11. Raven PH, Axelrod DI: Angiosperm biogeography and past con-tinental movements. Ann Miss Bot Gard 1974, 61:539-673.
12. McLoughlin S: The breakup history of Gondwana and itsimpact on pre-Cenozoic floristic provincialism. Aust J Bot2001, 49:271-300.
13. Janssen T, Bremer K: The age of major monocot groupsinferred from 800+ rbcL sequences. Bot J Linn Soc 2004,146:385-398.
14. Sanderson MJ, Doyle JA: Sources of error and confidence inter-vals in estimating the age of angiosperms from rbcL and 18SrDNA data. Am J Bot 2001, 88:1499-1516.
15. Linder HP, Hardy CR, Rutschmann F: Taxon sampling effects inmolecular clock dating: an example from the African Res-tionaceae. Mol Phylogenet Evol 2005, 35:569-582.
16. Pirie MD, Chatrou LW, Erkens RHJ, Maas JW, Niet T van der, MolsJB, Richardson JE: Phylogeny reconstruction and moleculardating in four Neotropical genera of Annonaceae: the effectof taxon sampling in age estimations. In Plant species-level sys-tematics: new perspectives on pattern & process. Regnum Vegetabile 143Edited by: Bakker FT, Chatrou LW, Gravendeel B, Pelser PB. Liech-tenstein: A.R.G. Gantner Verlag, Ruggell; 2005:149-174.
17. Near TJ, Sanderson MJ: Assessing the quality of moleculardivergence time estimates by fossil calibrations and fossil-based model selection. Philos Trans R Soc Lond B Biol Sci 2004,359(1450):1477-1483.
18. Muellner AN, Savolainen V, Samuel R, Chase MW: The mahoganyfamily "out of Africa": divergence time estimation, globalbiogeographic patterns inferred from plastid rbcL DNAsequences, extant, and fossil distribution of diversity. Mol Phy-logenet Evol 2006, 40:236-250.
19. Graur D, Martin W: Reading the entrails of chickens: Moleculartimescales of evolution and the illusion of precision. TrendsGenet 2004, 20:80-86.
20. Drummond AJ, Ho SYW, Phillips MJ, Rambaut A: Relaxed phyloge-netics and dating with confidence. PLoS Biol 2006, 4:e88.
21. de Queiroz A: The resurrection of oceanic dispersal in histor-ical biogeography. Trends Ecol Evol 2005, 20:68-73.
22. Renner SS: Relaxed molecular clocks for dating historicalplant dispersal events. Trends Plant Sci 2005, 10(11):550-558.
23. Davis CC, Bell CD, Mathews S, Donoghue MJ: Laurasian migrationexplains Gondwanan disjunctions: evidence from Malpighi-aceae. Proc Natl Acad Sci USA 2002, 99:6833-6837.
24. Givnish TJ, Millam KC, Evans TM, Hall JC, Pires JC, Berry PE, SytsmaKJ: Ancient vicariance or recent long-distance dispersal?Inferences about phylogeny and South American-Africandisjunctions in Rapateaceae and Bromeliaceae based onndhF sequence data. Int J Plant Sci 2004, 165:S35-S54.
25. Smedmark JEE, Anderberg A: Boreotropical migration explainshybridization between geographically distant lineages in thepantropical clade Sideroxyleae (Sapotaceae). Am J Bot 2007,94:1491-1505.
26. Weeks A, Daly DC, Simpson BB: The phylogenetic history andbiogeography of the frankincense and myrrh family (Burser-aceae) based on nuclear and chloroplast sequence data. MolPhylogenet Evol 2004, 35:85-101.
27. Renner SS, Clausing G, Meyer K: Historical biogeography ofMelastomataceae: the roles of Tertiary migration and long-distance dispersal. Am J Bot 2001, 88:1290-1300.
28. Zerega NJC, Clement WL, Datwyler SL, Weiblen GD: Biogeogra-phy and divergence times in the mulberry family (Mora-ceae). Mol Phylogenet Evol 2005, 37:402-416.
29. Särkinen TE, Newman MF, Maas PJM, Maas H, Poulsen AD, Harris DJ,Richardson JE, Clark A, Hollingsworth M, Pennington RT: Recentoceanic long-distance dispersal and divergence in the amphi-Atlantic rain forest genus Renealmia L.f. (Zingiberaceae).Mol Phylogenet Evol 2007, 44:968-980.
30. Pybus OG, Harvey PH: Testing macro-evolutionary modelsusing incomplete molecular phylogenies. Proc R Soc B 2000,267:2267-2272.
31. Moore BR, Chan KMA, Donoghue MJ: Detecting diversificationrate variation in supertrees. In Phylogenetic supertrees: combining
Additional file 1GenBank accessions. List of voucher numbers and Genbank accession numbers.Click here for file[http://www.biomedcentral.com/content/supplementary/1471-2148-8-178-S1.doc]
Page 14 of 16(page number not for citation purposes)
BMC Evolutionary Biology 2008, 8:178 http://www.biomedcentral.com/1471-2148/8/178
information to reveal the tree of life Edited by: Bininda-Emonds ORP.Dordrecht: Kluwer Academic; 2004:487-533.
32. Friis EM, Pedersen KR, Crane PR: Araceae from the early Creta-ceous of Portugal: evidence on the emergence of monocoty-ledons. Proc Natl Acad Sci U S A 2004, 101:16565-16570.
33. Rutschmann F: Molecular dating of phylogenetic trees: a briefreview of current methods that estimate divergence times.Diversity Distrib 2006, 12:35-48.
34. Merckx V, Bidartondo MI: Breakdown and delayed cospeciationin the arbuscular mycorrhizal mutualism. Proc R Soc B 2008,275:1029-1035.
35. Shaul S, Graur D: Playing chicken (Gallus gallus): methodologi-cal inconsistencies of molecular divergence date estimatesdue to secondary calibration points. Gene 2002, 300:59-61.
36. Wilson PA, Norris RD: Warm tropical ocean surface and globalanoxia during the mid-Cretaceous period. Nature 2001,412:425-429.
37. Wolfe JA, Upchurch GR: North American nonmarine climatesand vegetation during the Late Cretaceous. Palaeogeography,Palaeoclimatology, Palaeoecology 1987, 61:33-77.
38. Davis CC, Webb CO, Wurdack KJ, Jaramillo CA, Donoghue MJ:Explosive radiation of Malpighiales supports a mid-Creta-ceous origin of modern tropical rain forests. Am Nat 2005,165:E36-E65.
39. Bidartondo MI, Burghardt B, Gebauer G, Bruns TD, Read DJ: Chang-ing partners in the dark: isotopic and molecular evidence ofectomycorrhizal liaisons between forest orchids and trees.Proc R Soc B 2004, 271:1799-1806.
40. Bremer K, Janssen T: Gondwanan origin of major monocotgroups inferred from dispersal-vicariance analysis. In Mono-cots: comparative biology and evolution. Aliso 22 Edited by: Columbus JT,Friar EA, Hamilton CW, Porter JM, Prince LM, Simpson MG. Clare-mont: Rancho Santa Anna Botanic Garden; 2006:22-27.
41. Raven PH, Axelrod DI: Plate tectonics and Australasian paleo-biogeography. Science 1972, 176:1379-1386.
42. Chanderbali AS, Werff H Van Der, Renner SS: Phylogeny and his-torical biogeography of Lauraceae: evidence from the chlo-roplast and nuclear genomes. Ann Miss Bot Gard 2002,88:104-134.
43. Richardson JE, Chatrou LW, Mols JB, Erkens RHJ, Pirie MD: Histor-ical biogeography of two cosmopolitan families of floweringplants: Annonaceae and Rhamnaceae. Phil Trans R Soc B 2004,359:1495-1508.
44. Renner S, Won H: Repeated evolution of dioecy from monoecyin Siparunaceae. Syst Biol 2001, 50:700-712.
45. Veevers JJ, Powell C, Roots SR: Review of sea floor spreadingaround Australia. I. Synthesis of the patterns of spreading. JAfr Earth Sci 1991, 38:373-389.
46. Van Bocxlaer I, Roelants K, Biju SD, Nagaraju J, Bossuyt F: Late Cre-taceous vicariance in Gondwanan amphibians. PLoS ONE 2006,1:e74.
47. Morley RJ: Palynological evidence for Tertiary plant dispersalsin the SE Asian region in relation to plate tectonics and cli-mate. In Biogeography and Geological Evolution of SE Asia Edited by:Hall R, Holloway JD. Leiden: Backhuys Publishers; 1998:211-234.
48. Harmon LJ, Schulte JA, Larson A, Losos JB: Tempo and mode ofevolutionary radiation in iguanian lizards. Science 2003,301:961-964.
49. Johnson KR, Ellis B: A tropical rainforest in Colorado 1.4 mil-lion years after the Cretaceous-Tertiary boundary. Science2002, 296:2379-2383.
50. Wilf P, Johnson KR: Land plant extinction at the end of the Cre-taceous: a quantitative analysis of the North Dakota mega-floral record. Paleobiology 2004, 30:347-368.
51. Tiffney BH: Perspectives on the origin of the floristic similaritybetween eastern Asia and eastern North America. J ArnoldArb 1985, 66:73-94.
52. Zachos J, Pagani M, Sloan L, Thomas E, Billups K: Trends, rhythms,and aberrations in global climate 65 Ma to present. Science2001, 292:686-693.
53. Wilf P: Late Paleocene-early Eocene climate changes insouthwestern Wyoming: Paleobotanical analysis. Geol Soc AmBull 2000, 112:292-307.
54. Wilf P, Rubén Cuneo N, Johnson KR, Hicks JF, Wing SL, ObradovichJD: High plant diversity in Eocene South America: evidencefrom Patagonia. Science 2003, 300:122-125.
55. Wolfe JA: Some aspects of plant geography of the northernhemisphere during the Late Cretaceous and Tertiary. AnnMiss Bot Gard 1975, 62:264-279.
56. dePamphilis CW, Palmer JD: Loss of photosynthetic and chlo-rorespiratory genes from the plastid genome of a parasiticflowering plant. Nature 1990, 348:337-339.
57. Bungard RA: Photosynthetic evolution in parasitic plants:insights from the chloroplast genome. BioEssays 2004,26:235-247.
58. Jaramillo CA: Response of tropical vegetation to Paleogenewarming. Paleobiology 2002, 28:222-243.
59. Maas PJM, Maas-van de Kamer H, van Benthem J, Snelders HCM, Rüb-samen T: Burmanniaceae. Flora Neotropica 1986, 42:1-189.
60. Maas-van de Kamer H: Burmanniaceae. In Families and genera ofvascular plants, Monocotyledons, Lilianae (except Orchidaceae) Edited by:Kubitzki K. Berlin: Springer; 1998:154-164.
61. Merckx V, Schols P, Maas-Van de Kamer H, Maas P, Huysmans S,Smets E: Phylogeny and evolution of Burmanniaceae (Diosco-reales) based on nuclear and mitochondrial data. Am J Bot2006, 93:1684-1698.
62. White TJ, Burns T, Lee S, Taylor J: Amplification and directsequencing of fungal ribosomal RNA genes for phylogenet-ics. In PCR protocols: a guide to methods and applications Edited by: InnisM, Gelfand D, Sininsky J, White T. San Diego: Academic Press;1990:315-322.
63. Staden R, Beal K, Bonfield J: The Staden Package. In ComputerMethods in Molecular Biology Edited by: Miseners S, Krawetz S. NewYork: Humana Press; 1998:115-130.
64. Maddison DR, Maddison WP: MacClade 4: analysis of phylogeny andcharacter evolution, Version 4.01 Sunderland: Sinauer Associates; 2001.
65. Simmons MP, Ochoterena H: Gaps as characters in sequence-based phylogenetic analyses. Syst Biol 2000, 49:369-381.
66. Müller K: SeqState – Primer design and sequence statistics forphylogenetic DNA data sets. Appl Bioin 2005, 4:65-69.
67. Swofford DL: PAUP*. Phylogenetic analysis using parsimony (* and othermethods), Version 4 Sunderland: Sinauer Associates; 2002.
68. Posada D, Crandall KA: MODELTEST: testing the model ofDNA substitution. Bioinformatics 1998, 14:817-818.
69. Ronquist F, Huelsenbeck JP, Mark P van der: MrBayes 3.1 Manual.Draft 5/17/2005. [http://mrbayes.csit.fsu.edu/mb3.1_manual.pdf].
70. Huelsenbeck JP, Ronquist F: MRBAYES. Bayesian inference ofphylogeny. Bioinformatics 2001, 17:754-755.
71. Ronquist F, Huelsenbeck JP: MRBAYES 3: Bayesian phylogeneticinference under mixed models. Bioinformatics 2003,19:1572-1574.
72. Rambaut A, Drummond AJ: Tracer v1.4 2007 [http://beast.bio.ed.ac.uk/tracer].
73. Magallón S, Sanderson MJ: Absolute diversification rates inangiosperm clades. Evolution 2001, 55:1762-1780.
74. Chase MW: Monocot relationships: an overview. Am J Bot 2004,91:1645-1655.
75. Sanderson MJ: Estimating absolute rates of molecular evolu-tion and divergence times: a penalized likelihood approach.Mol Biol Evol 2002, 19:101-109.
76. Gandolfo MA, Nixon KC, Crepet WL: Triuridaceae fossil flowersfrom the Upper Cretaceous of New Jersey. Am J Bot 2002,89:1940-1957.
77. Rudall P, Bateman RM: Morphological phylogenetic analysis ofPandanales: testing constrasting hypotheses of floral evolu-tion. Syst Bot 2006, 31:223-238.
78. Rodriguez-de la Rosa RA, Cevallos-Ferriz SRS: Upper CretaceousZingiberalean fruits with in situ seeds from southeasternCoahuila, Mexico. Int J Plant Sci 1994, 155:786-805.
79. Bremer K: Early Cretaceous lineages of monocot floweringplants. Proc Natl Acad Sci USA 2000, 97:4707-4711.
80. Harley MM: Palm pollen and the fossil record. In PhD thesis Uni-versity of East London and Royal Botanic Garden, Kew; 1996.
81. Linder HP: The evolutionary history of the Poales/Restionales:a hypothesis. Kew Bull 1987, 42:297-318.
82. Ramírez SR, Gravendeel B, Singer RB, Marshall CR, Pierce NE: Dat-ing the origin of the Orchidaceae from a fossil orchid with itspollinator. Nature 2007, 448:1042-1045.
83. Wikström N, Savolainen V, Chase MW: Evolution of theangiosperms: calibrating the family tree. Proc R Soc B 2001,268:2211-2220.
Page 15 of 16(page number not for citation purposes)

BMC Evolutionary Biology 2008, 8:178 http://www.biomedcentral.com/1471-2148/8/178
Publish with BioMed Central and every scientist can read your work free of charge
"BioMed Central will be the most significant development for disseminating the results of biomedical research in our lifetime."
Sir Paul Nurse, Cancer Research UK
Your research papers will be:
available free of charge to the entire biomedical community
peer reviewed and published immediately upon acceptance
cited in PubMed and archived on PubMed Central
yours — you keep the copyright
Submit your manuscript here:http://www.biomedcentral.com/info/publishing_adv.asp
BioMedcentral
84. Davies TJ, Barraclough TG, Chase MW, Soltis PS, Soltis DE, Savol-ainen V: Darwin's abominable mystery: Insights from a super-tree of the angiosperms. Proc Natl Acad Sci USA 2004,101:1904-1909.
85. Leebens-Mack J, Raubeson LA, Cui L, Kuehl JV, Fourcade MH, Chum-ley TW, Boore JL, Jansen RK, dePamphilis CW: Identifying thebasal angiosperm node in chloroplast genome phylogenies:sampling one's way out of the Felsenstein zone. Mol Biol Evol2005, 22:1948-1963.
86. Sanderson MJ: r8s: inferring absolute rates of molecular evolu-tion and divergence times in the absence of a molecularclock. Bioinformatics 2003, 19:301-302.
87. Drummond AJ, Rambaut A: BEAST: Bayesian evolutionary anal-ysis by sampling trees. BMC Evol Biol 2007, 7:214.
88. BEAST partitioning [http://tlpcouvreur.googlepages.com/beastpartitioning]
89. Nee S, Holmes EC, May RM, Harvey PH: Extinction rates can beestimated from molecular phylogenies. Phil Trans R Soc B 1994,344:77-82.
90. Roelants K, Gower DJ, Wilkinson M, Loader SP, Biju SD, GuillaumeK, Moriau L, Bossuyt F: Global patterns of diversification in thehistory of modern amphibians. Proc Natl Acad Sci USA 2007,104:887-892.
91. Rambaut A: PhyloGen, version 1.1. 2002 [http://evolve.zoo.ox.ac.uk/software/PhyloGen].
92. Pybus OG, Rambaut A, Holmes EC, Harvey PJ: New inferencesfrom tree shape: numbers of missing taxa and populationgrowth rates. Syst Biol 2002, 51:881-888.
93. Kozak KH, Weisrock DW, Larson A: Rapid lineage accumulationin a non-adaptive radiation: phylogenetic analysis of diversi-fication rates in eastern North American woodland salaman-ders (Plethodontidae: Plethodon). Proc R Soc B 2006,273:539-546.
94. Pybus OG, Rambaut A: GENIE: estimating demographic his-tory from molecular phylogenies. Bioinformatics 2002,18:1404-1405.
95. Rambaut A, Harvey PH, Nee S: End-Epi: an application for infer-ring phylogenetic and population dynamical processes frommolecular sequences. CABIOS 1997, 13:303-306.
96. Rambaut A, Charleston M: TreeEdit v.1.0 alpha 10. 2002 [http://evolve.zoo.ox.ac.uk/software/TreeEdit].
97. Paradis E: Testing for constant diversification rates usingmolecular phylogenies: a general approach based on statisti-cal tests for goodness of fit. Mol Biol Evol 1998, 15:476-479.
98. McKenna DD, Farrell BD: Tropical forests are both evolution-ary cradles and museums of leaf beetle diversity. Proc NatlAcad Sci USA 2006, 103:10947-10951.
99. Paradis E, Claude J, Strimmer K: APE: Analyses of phylogeneticsand evolution in R language. Bioinformatics 2004, 20:289-290.
100. Chan KMA, Moore BR: SymmeTREE: whole-tree analysis of dif-ferential diversification rates. Bioinformatics 2005, 21:1709-1710.
101. Ronquist F: Dispersal-vicariance analysis: new approach to thequantification of historical biogeography. Syst Biol 1997,46:195-203.
102. Takhtajan AL: Floristic regions of the world Los Angeles: University ofCalifornia Press; 1986.
Page 16 of 16(page number not for citation purposes)