gene distribution and nucleotide sequence organization in the human genome
TRANSCRIPT
Eur. J. Biochem. 160,479-485 (1986) 0 FEBS 1986
Gene distribution and nucleotide sequence organization in the human genome Marino ZERIAL, Julio SALINAS, Jan FILIPSKI and Giorgio BERNARD1 Laboratoire de GenCtique Molkulaire, Institut Jacques Monod, Paris
(Received April 2, 1986) - EJB 86 0357
Human DNA was fractionated by centrifugation in Cs2S04 density gradients containing 3,6-bis(acetato- mercurimethy1)dioxane (BAMD). Fractions were investigated in their analytical CsCl profiles and a number of specific sequences were localized in them. The results so obtained led to an improved understanding of the organization of nucleotide sequences in the human genome, as well as to the discovery that a class of DNA having a very high G + C content and not represented in the mouse genome, is particularly rich in genes and interspersed repetitive sequences.
Although the general background for this work has been discussed in the introduction of the preceding paper [l], it may be worthwhile to recall here some specific points pre- viously made in our laboratory on the human genome as compared with the mouse genome. Even if the human genome could be resolved by density gradient centrifugation in the presence of Ag' into four major components, which were similar in relative amounts, modal buoyant densities and in- termolecular heterogeneities to those obtained from the mouse genome [2, 31, some of its properties are strikingly different. First of all, human DNA is characterized [2] by the presence of minor components (defined as components representing less than 3% of total DNA) which show buoyant densities of 1.712, 1.7135, 1.716 and 1.718g/cm3. In the mouse genome only a minute amount of 1.712 g/cm3 component was detected in this buoyant density range. Second, the reassociation properties of the four major components from the human genome [4] are different from those exhibited by the corresponding components from the mouse genome. Differences are particularly striking as far as heavy components are concerned and specially so for the heaviest component. While in the mouse genome 91 % of this component is made up by slow-reassociating sequences and 9% by intermediate ones, in the human genome only 46% of this component consists of slow-reassociating sequences, 10% of intermediate sequences and 22% each of foldback and fast sequences.
Other differences between the two genomes were found when families of repeated sequences present in both genomes were studied. The L1 family of repeats is less abundant in the human genome than in the mouse genome (40000 versus 100000 copies per haploid genome) and is present not only in the two light major components as in the mouse genome [5] but also in the first heavy component [6]. In contrast, the A h 1 family of repeats is much more abundant in the human
Correspondence to J. Filipski, Laboratoire de Ginttique Moleculaire, Institut Jacques Monod, 2, Place Jussieu, F-75005 Paris, France
Abbreviations. BAMD, 3,6-bis(acetatomercurimethyl)dioxane; r f , BAMD/nucleotide molar ratio; kb, lo3 bases.
genome compared to the mouse genome (4% versus 1 %; [7, 81). Its concentration in both cases increases from the light to the heavy components [6].
The present work has been done in parallel with that reported in the preceding paper [l], which it complements in several aspects. The results described here have provided new information on the organization of the genome. One particu- lar discovery reported here concerns the presence in the human genome of a (G + C)-rich fraction representing about 3% of total DNA, which is not represented in the mouse genome. This minor component contains a large number of genes and specific repetitive sequences.
MATERIALS AND METHODS
DNA preparation
This was a preparation obtained from human placenta [3]. Its s20,w value was 32 S corresponding to a relative molecular mass of 22 x lo6 (33 kb). Major components used in the pres- ent work were those obtained and characterized by Cuny et al. [3].
Methods
Preparative centrifugation of DNA in Cs2S04/BAMD density gradient, analytical CsCl density gradient centrifuga- tion, restriction enzyme digestion and hybridization were carried out as described in the preceding paper [l].
Probes
The localization of Alu sequences and of some genes in the fractions from the Cs2S04/BAMD preparative gradients was carried out by hybridization experiments using the following probes: Blur 8 (Alu repeats [9]); pH-G1 (a-globin [lo]); the 1.7-kb BarnHI restriction fragment of L33 [ l l ] sub- cloned into pBR322 (c-sis [12]); pRyc-7.4 (c-myc [13]); pAB (c-mos 1141); pHrI (ribosomal DNA [151).
480
t .z.20"
x,
I
2
3
4
5
6
7
8
9 10
1.690 1.7 I0
Total
2 4 6 8 1 3 5 7 9
t z 3 O o
2 4 6 8 1012 1 3 5 7 9 1 1
I
2
3
4
5
6
7
a
9
10
I I
12 I.
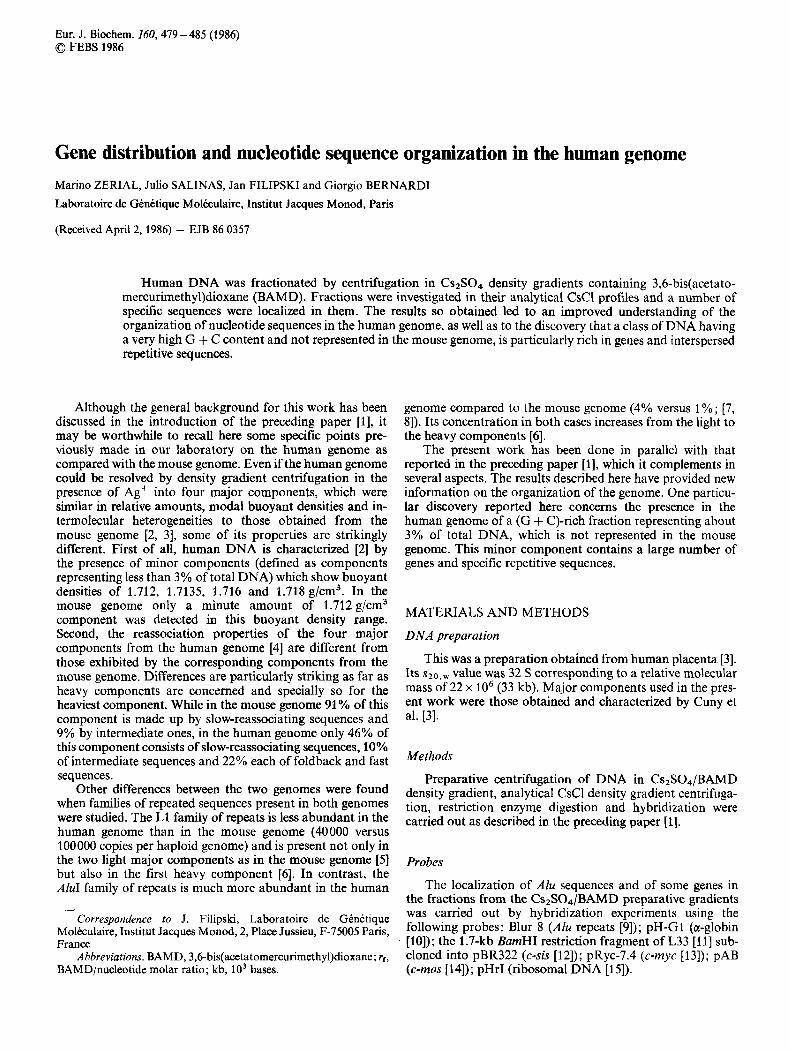
1.690 1.710 Fig. 1. Fractionation of human DNA by Cs2S04/BAMD density gradient centrifugation. DNA was centrifuged at the temperature and ri values indicated, using the 0.1 M ( 8 T , 20°C) or the 0.4 M (30°C) solvent. The top panel shows the transmission profiles of fractionated DNA as recorded at 253.7 nm. The middle panel shows the histograms of the relative amounts of DNA in the fractions; in all cases, fraction 1 corresponds to the pellet. The bottom panel shows the analytical CsCl profiles of pooled fractions. Corresponding fractions from six tubes were pooled in the experiment (b), single fractions were used in the experiments (a) and (c). The analytical CsCl profile of total DNA is also shown in experiment (b)
RESULTS The first experiment, presented in Fin. 1 a, concerns a pre-
Resolution of human DNA by Cs2S041BAMD density gradient centrijiugation
parative Cs2S04/BAMD density gradient centrifugation at 8 T , rf = 0.14, 0.1 M solvent. The amount of the pelleted material was 29%. The first three fractions had modal
A series of experiments were carried out with the purpose of defining experimental conditions leading to a satisfactory resolution of human DNA by Cs2S04/BAMD density gradient centrifugation. 1.713 g/cm3.
buoyant densities between 1.697 g/cm3 and 1.700 g/cm3 and represented about 65% of the material. The most (G + C)- rich fractions, 9 and 10, had modal buoyant densities close to
48 1
m 3 4 5678
2 4 6 8 I 3 5 7
'1.700' 1.720 1.690 1.710
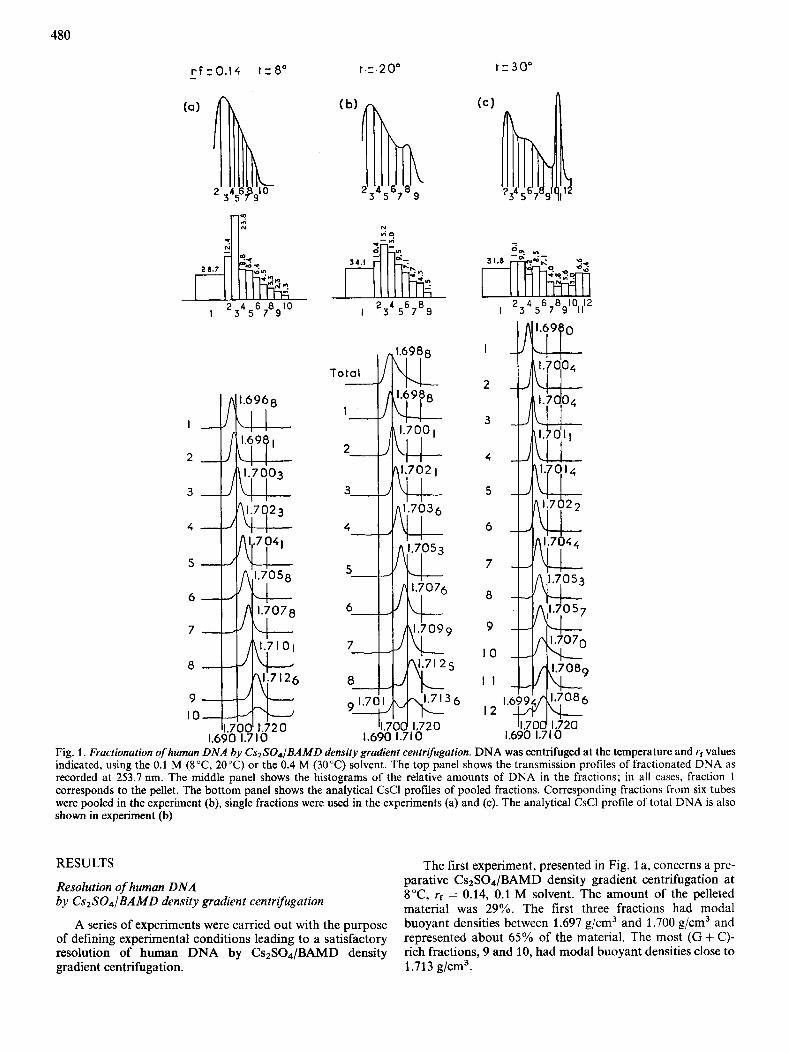
Fig. 2. Recentrifugation of human D N A ( G f C)-rich ,fractions in Cs2S04/BAMD density gradient. Fractions 10- 12 (2.5 AZ60 units) from four tubes of DNA fractionated in the experiment of Fig. l c were pooled and recentrifuged at 20T, rf = 0.14, using the 0.1 M solvent. Other indications as in Fig. 1
In the second experiment, run under the same conditions but using a temperature of 20°C (Fig. 1 b), the amount of pelleted material was 34% ; the first three fractions ranging in modal buoyant density from 1.698 g/cm3 to 1.702 g/cm3, represented about 60% of the material. The most (G + C)- rich fraction had a modal buoyant density close to 1.714 g/ cm3 and was accompanied by a peak centered at 1.701 g/cm3, probably largely corresponding to satellite IV [16].
The third experiment (Fig. lc) shows that, at 30"C, rf = 0.14, 0.4 M solvent, the pellet represents 32% of DNA, fractions in the 1.698 - 1.704 g/cm3 range are better resolved but heavier fractions are less well resolved. The first five fractions, ranging in modal buoyant density from 1.698 g/cm3 to 1.704 g/cm3, represented 67% of DNA. These conditions also led to the resolution of the 1.6994 g/cm3 satellite band.
Decreasing or increasing the rf values led to less satisfac- tory resolutions, since a lower rf value, 0.12, reduced both the amount of DNA in the pellet and the resolution of light fractions, whereas higher rf values (0.16 and 0.19) led to pelleting so much DNA that essentially only the heavy fractions remained in the gradient (not shown).
The last fractions in the gradients of Fig. 1 showed two phenomena (a) the presence of a much broader main peak;
and (b) a lower amount of DNA compared to what was expected from the absorbance measurement of the fractions. Both phenomena have already been commented upon in the preceding article [I].
A better resolution of heavy fractions from human DNA was achieved by recentrifuging at 20"C, rf = 0.14, fractions 10- 12 as obtained from the experiment of Fig. l c (Fig. 2). A CsCl analysis of the fractions so obtained revealed that, under these conditions, the pellet contained the 1.6994 g/cm3 satel- lite already detected in fraction 12 of the experiment of Fig. 1 c and that the material present in the gradient could be resolved into fractions ranging in buoyant density from 1.706 g/cm3 to 1.714 g/cm3.
Localization of specific sequences in the humun genome
A number of genes were localized in the fractions of human DNA obtained in the experiments just described.
Two experiments along this line had the aim of com- paring hybridization results as obtained on the major DNA components previously isolated [2] and on Cs2S04/BAMD fractions, in cases where the comparison was of special in- terest.
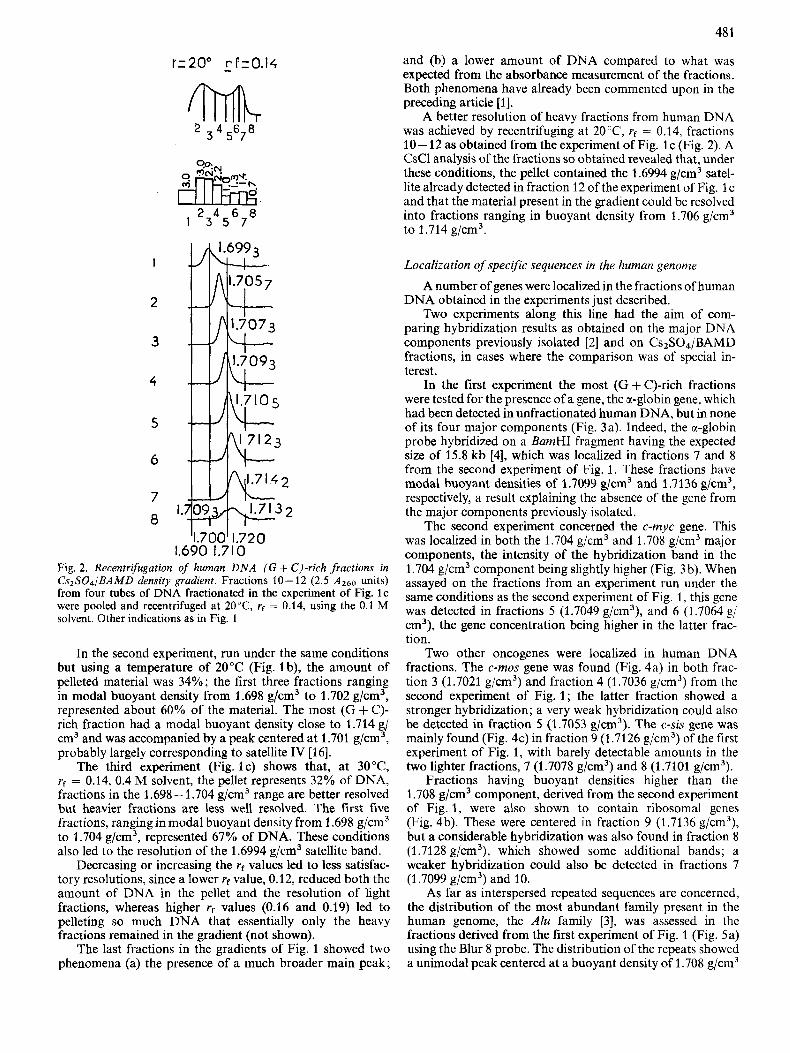
In the first experiment the most (G + C)-rich fractions were tested for the presence of a gene, the a-globin gene, which had been detected in unfractionated human DNA, but in none of its four major components (Fig. 3a). Indeed, the a-globin probe hybridized on a BamHI fragment having the expected size of 15.8 kb [4], which was localized in fractions 7 and 8 from the second experiment of Fig. 1. These fractions have modal buoyant densities of 1.7099 g/cm3 and 1.7136 g/cm3, respectively, a result explaining the absence of the gene from the major components previously isolated.
The second experiment concerned the c-myc gene. This was localized in both the 1.704 g/cm3 and 1.708 g/cm3 major components, the intensity of the hybridization band in the 1.704 g/cm3 component being slightly higher (Fig. 3b). When assayed on the fractions from an experiment run under the same conditions as the second experiment of Fig. 1, this gene was detected in fractions 5 (1.7049 g/cm3)), and 6 (1.7064 g/ cm3), the gene concentration being higher in the latter frac- tion.
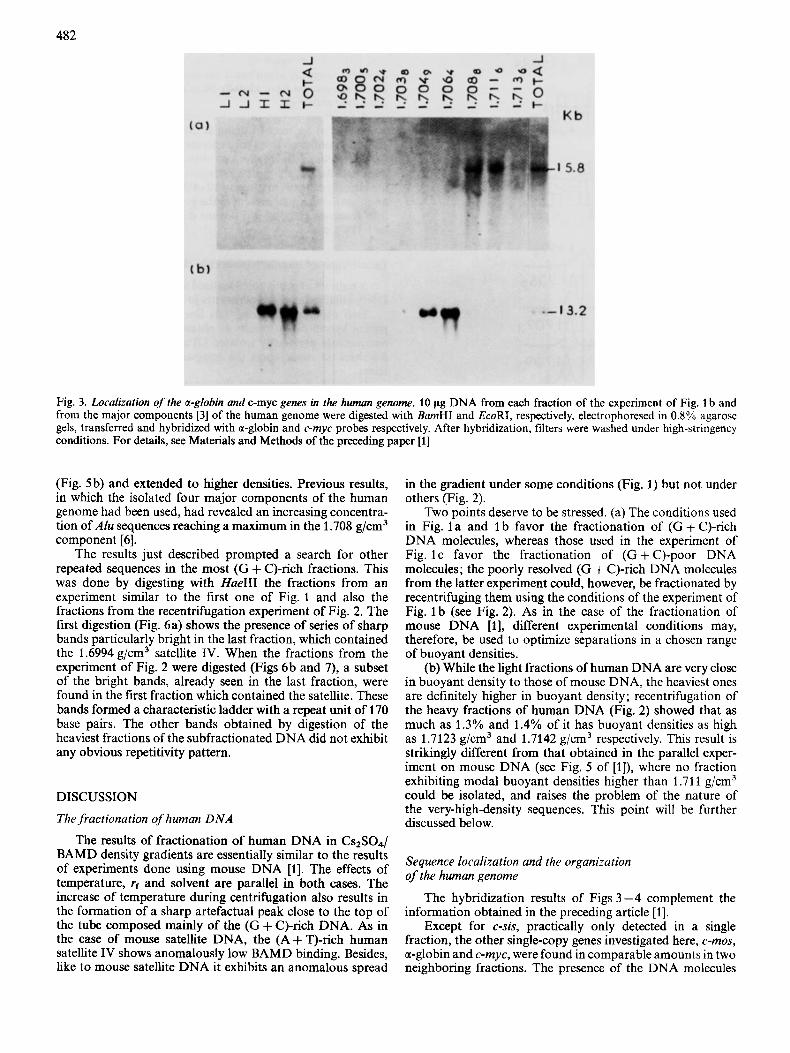
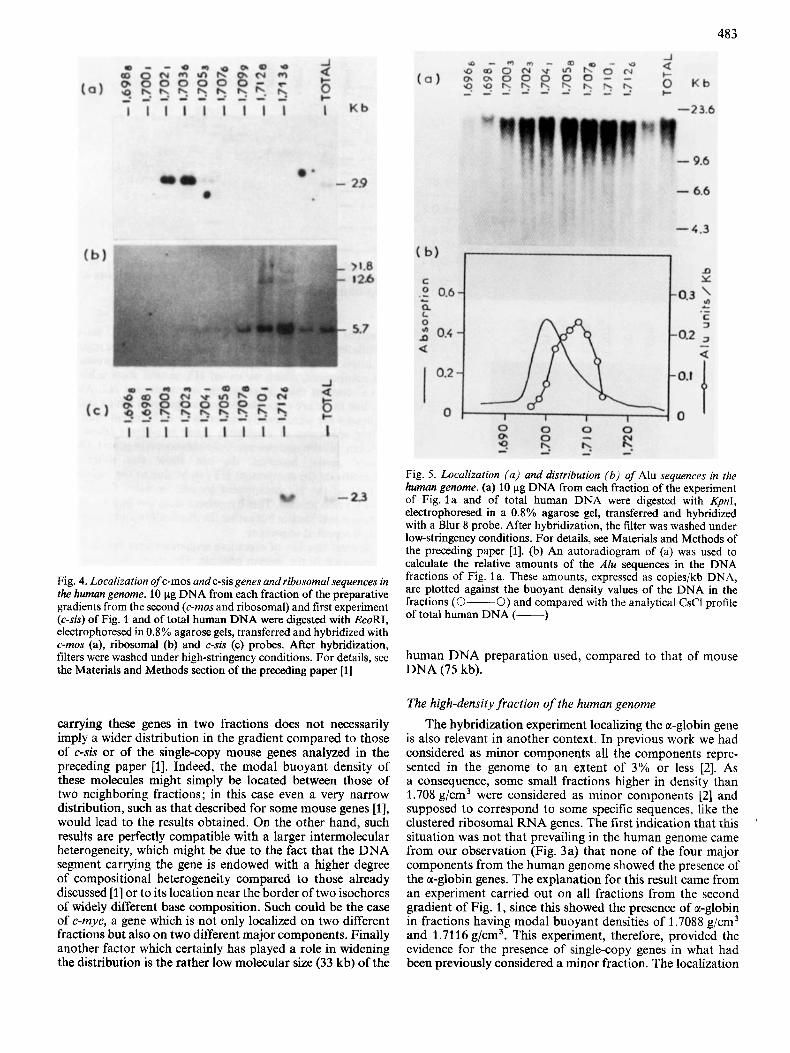
Two other oncogenes were localized in human DNA fractions. The c-mos gene was found (Fig. 4a) in both frac- tion 3 (1.7021 g/cm3) and fraction 4 (1.7036 g/cm3) from the second experiment of Fig. 1; the latter fraction showed a stronger hybridization; a very weak hybridization could also be detected in fraction 5 (1.7053 g/cm3). The c-sis gene was mainly found (Fig. 4c) in fraction 9 (1.7126 g/cm3) of the first experiment of Fig. 1, with barely detectable amounts in the two lighter fractions, 7 (1.7078 g/cm3) and 8 (1.7101 g/cm3).
Fractions having buoyant densities higher than the 1.708 g/cm3 component, derived from the second experiment of Fig. 1, were also shown to contain ribosomal genes (Fig. 4b). These were centered in fraction 9 (1.7136 g/cm3), but a considerable hybridization was also found in fraction 8 (1.7128 g/cm3), which showed some additional bands; a weaker hybridization could also be detected in fractions 7 (1.7099 g/cm3) and 10.
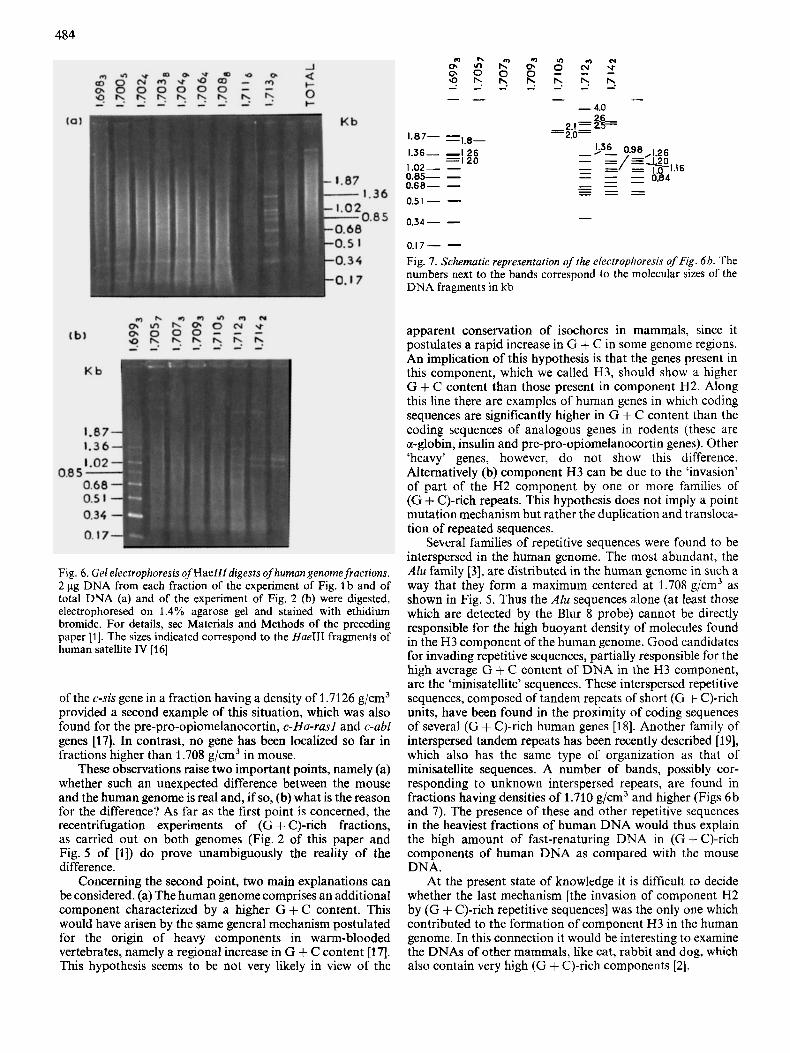
As far as interspersed repeated sequences are concerned, the distribution of the most abundant family present in the human genome, the A h family [3], was assessed in the fractions derived from the first experiment of Fig. 1 (Fig. 5a) using the Blur 8 probe. The distribution of the repeats showed a unimodal peak centered at a buoyant density of 1.708 g/cm3
482
Fig. 3. Loculizntion ofthe a-globin and c-myc genes in the human genome. 10 pg DNA from each fraction of the experiment of Fig. 1 b and from the major components [3] of the human genome were digested with BamHI and EcoRI, respectively, electrophoresed in 0.8% agarose gels, transferred and hybridized with a-globin and c-myc probes respectively. After hybridization, filters were washed under high-stringency conditions. For details, see Materials and Methods of the preceding paper [l]
(Fig. 5 b) and extended to higher densities. Previous results, in which the isolated four major components of the human genome had been used, had revealed an increasing concentra- tion of A h sequences reaching a maximum in the 1.708 g/cm3 component [6].
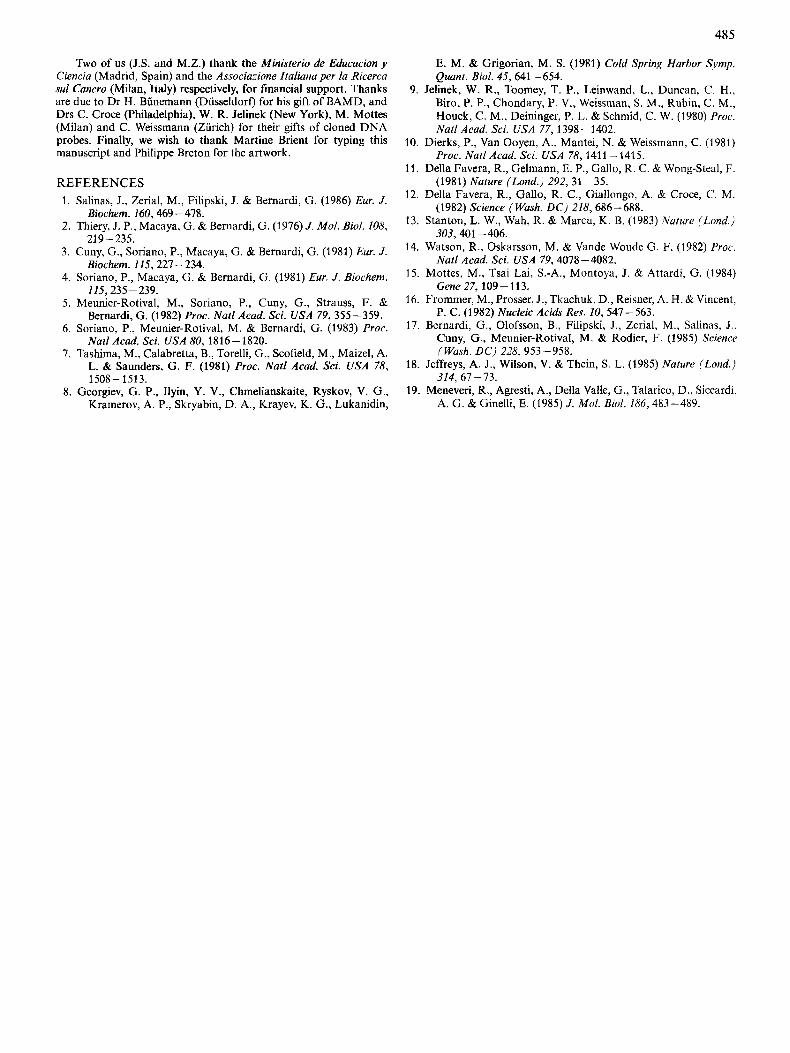
The results just described prompted a search for other repeated sequences in the most (G + C)-rich fractions. This was done by digesting with HaeIII the fractions from an experiment similar to the first one of Fig. 1 and also the fractions from the recentrifugation experiment of Fig. 2. The first digestion (Fig. 6a) shows the presence of series of sharp bands particularly bright in the last fraction, which contained the 1.6994 g/cm3 satellite IV. When the fractions from the experiment of Fig. 2 were digested (Figs 6b and 7), a subset of the bright bands, already seen in the last fraction, were found in the first fraction which contained the satellite. These bands formed a characteristic ladder with a repeat unit of 170 base pairs. The other bands obtained by digestion of the heaviest fractions of the subfractionated DNA did not exhbit any obvious repetitivity pattern.
DISCUSSION
The fractionation of human DNA
The results of fractionation of human DNA in Cs2S04/ BAMD density gradients are essentially similar to the results of experiments done using mouse DNA [l]. The effects of temperature, rf and solvent are parallel in both cases. The increase of temperature during centrifugation also results in the formation of a sharp artefactual peak close to the top of the tube composed mainly of the (G + C)-rich DNA. As in the case of mouse satellite DNA, the (A+T)-rich human satellite IV shows anomalously low BAMD binding. Besides, like to mouse satellite DNA it exhibits an anomalous spread
in the gradient under some conditions (Fig. 1) but not under others (Fig. 2).
Two points deserve to be stressed. (a) The conditions used in Fig. 1 a and 1 b favor the fractionation of (G + C)-rich DNA molecules, whereas those used in the experiment of Fig. l c favor the fractionation of (G + C)-poor DNA molecules; the poorly resolved (G + C)-rich DNA molecules from the latter experiment could, however, be fractionated by recentrifuging them using the conditions of the experiment of Fig. 1 b (see Fig. 2). As in the case of the fractionation of mouse DNA [l], different experimental conditions may, therefore, be used to optimize separations in a chosen range of buoyant densities.
(b) While the light fractions of human DNA are very close in buoyant density to those of mouse DNA, the heaviest ones are definitely higher in buoyant density; recentrifugation of the heavy fractions of human DNA (Fig. 2) showed that as much as 1.3% and 1.4% of it has buoyant densities as high as 1.7123 g/cm3 and 1.7142 g/cm3 respectively. This result is strikingly different from that obtained in the parallel exper- iment on mouse DNA (see Fig. 5 of [l]), where no fraction exhibiting modal buoyant densities higher than 1.71 1 g/cm3 could be isolated, and raises the problem of the nature of the very-high-density sequences. This point will be further discussed below.
Sequence localization and the organization of the human genome
The hybridization results of Figs 3 -4 complement the information obtained in the preceding article [l].
Except for c-sis, practically only detected in a single fraction, the other single-copy genes investigated here, c-mos, a-globin and c-myc, were found in comparable amounts in two neighboring fractions. The presence of the DNA molecules
483
Fig. 5 . Localization (a ) and distribution (b) of Alu sequences in the human genome. (a) 10 pg DNA from each fraction of the experiment of Fig. l a and of total human DNA were digested with Kpnl, electrophoresed in a 0.8% agarose gel, transferred and hybridized with a Blur 8 probe. After hybridization, the filter was washed under low-stringency conditions. For details, see Materials and Methods of the preceding paper [l]. (b) An autoradiogram of (a) was used to calculate the relative amounts of the Alu seauences in the DNA fractions of Fig. l a . These amounts, expressed as copies/kb DNA, are plotted against the buoyant density values of the DNA in the fractions (0-0) and compared with the analytical CsCl profile Of
Fig. 4. Localization of c-mos and c-sis genes and ribosomal sequences in the human genome. 10 pg DNA from each fraction of the preparative gradients from the second (c-mos and ribosomal) and first experiment (c-sis) of Fig. 1 and of total human DNA were digested with EcoRI, human DNA (-1 electrophoresed in 0.8 % agarose gels, transferred a i d hybridized with c-mos (a), ribosomal (b) and c-sis (c) probes. After hybridization, filters were washed under high-stringency conditions. For details, see the Materials and Methods section of the preceding paper [l]
human DNA Preparation used, compared to that of mouse DNA(75 kb).
carrying these genes in two fractions does not necessarily imply a wider distribution in the gradient compared to those of c-sis or of the single-copy mouse genes analyzed in the preceding paper [l]. Indeed, the modal buoyant density of these molecules might simply be located between those of two neighboring fractions; in this case even a very narrow distribution, such as that described for some mouse genes [l], would lead to the results obtained. On the other hand, such results are perfectly compatible with a larger intermolecular heterogeneity, which might be due to the fact that the DNA segment carrying the gene is endowed with a higher degree of compositional heterogeneity compared to those already discussed [l] or to its location near the border of two isochores of widely different base composition. Such could be the case of c-myc, a gene which is not only localized on two different fractions but also on two different major components. Finally another factor which certainly has played a role in widening the distribution is the rather low molecular size (33 kb) of the
The high-density fraction of the human genome
The hybridization experiment localizing the a-globin gene is also relevant in another context. In previous work we had considered as minor components all the components repre- sented in the genome to an extent of 3 % or less [2]. As a consequence, some small fractions higher in density than 1.708 g/cm3 were considered as minor components [2] and supposed to correspond to some specific sequences, like the clustered ribosomal RNA genes. The first indication that this situation was not that prevailing in the human genome came from our observation (Fig. 3a) that none of the four major components from the human genome showed the presence of the or-globin genes. The explanation for this result came from an experiment carried out on all fractions from the second gradient of Fig. 1, since this showed the presence of or-globin in fractions having modal buoyant densities of 1.7088 g/cm3 and 1.71 16 g/cm3. This experiment, therefore, provided the evidence for the presence of single-copy genes in what had been previously considered a minor fraction. The localization
'
484
Fig. 6 . GeL ekctrophoresis ofHaelll digests ofhuman genomefractions. 2 pg DNA from each fraction of the experiment of Fig. 1 b and of total DNA (a) and of the experiment of Fig. 2 (b) were digested, electrophoresed on 1.4% agarose gel and stained with ethidium bromide. For details, see Materials and Methods of the preceding paper [l]. The sizes indicated correspond to the Hue111 fragments of human satellite IV [16]
of the c-sis gene in a fraction having a density of 1.7126 g/cm3 provided a second example of this situation, which was also found for the pre-pro-opiomelanocortin, c-Ha-rasl and c-abl genes [17]. In contrast, no gene has been localized so far in fractions higher than 1.708 g/cm3 in mouse.
These observations raise two important points, namely (a) whether such an unexpected difference between the mouse and the human genome is real and, if so, (b) what is the reason for the difference? As far as the first point is concerned, the recentrifugation experiments of (G + C)-rich fractions, as carried out on both genomes (Fig. 2 of this paper and Fig. 5 of [l]) do prove unambiguously the reality of the difference.
Concerning the second point, two main explanations can be considered. (a) The human genome comprises an additional component characterized by a higher G + C content. This would have arisen by the same general mechanism postulated for the origin of heavy components in warm-blooded vertebrates, namely a regional increase in G + C content [17]. This hypothesis seems to be not very likely in view of the
1.87- - -1.8- 1.36- -126
= I 20 1.02- - 0.85- - 0.68- - 0.51 - - 0.34- - - O,I7- - Fig. 7. Schematic representation of the electrophoresis of Fig. 6h. The numbers next to the bands correspond to the molecular sizes of the DNA fragments in kb
apparent conservation of isochores in mammals, since it postulates a rapid increase in G + C in some genome regions. An implication of this hypothesis is that the genes present in this component, which we called H3, should show a higher G + C content than those present in component H2. Along this line there are examples of human genes in which coding sequences are significantly higher in G + C content than the coding sequences of analogous genes in rodents (these are a-globin, insulin and pre-pro-opiomelanocortin genes). Other ‘heavy’ genes, however, do not show this difference. Alternatively (b) component H3 can be due to the ‘invasion’ of part of the H2 component by one or more families of (G + C)-rich repeats. This hypothesis does not imply a point mutation mechanism but rather the duplication and transloca- tion of repeated sequences.
Several families of repetitive sequences were found to be interspersed in the human genome. The most abundant, the Alu family [3], are distributed in the human genome in such a way that they form a maximum centered at 1.708 g/cm3 as shown in Fig. 5. Thus the A h sequences alone (at least those which are detected by the Blur 8 probe) cannot be directly responsible for the high buoyant density of molecules found in the H3 component of the human genome. Good candidates for invading repetitive sequences, partially responsible for the high average G + C content of DNA in the H3 component, are the ‘minisatellite’ sequences. These interspersed repetitive sequences, composed of tandem repeats of short (G + C)-rich units, have been found in the proximity of coding sequences of several (G + C)-rich human genes [18]. Another family of interspersed tandem repeats has been recently described [ 191, which also has the same type of organization as that of minisatellite sequences. A number of bands, possibly cor- responding to unknown interspersed repeats, are found in fractions having densities of 1.710 g/cm3 and higher (Figs 6b and 7). The presence of these and other repetitive sequences in the heaviest fractions of human DNA would thus explain the high amount of fast-renaturing DNA in (G + C)-rich components of human DNA as compared with the mouse DNA.
At the present state of knowledge it is difficult to decide whether the last mechanism [the invasion of component H2 by (G + C)-rich repetitive sequences] was the only one which contributed to the formation of component H3 in the human genome. In this connection it would be interesting to examine the DNAs of other mammals, like cat, rabbit and dog, which also contain very high (G + C)-rich components [2].
485
Two of us (J.S. and M.Z.) thank the Ministerio de Educacion y Ciencia (Madrid, Spain) and the Associazione Ztaliana per la Ricerca sul Cancro (Milan, Italy) respectively, for financial support. Thanks are due to Dr H. Bunemann (Diisseldorf) for his gift of BAMD, and Drs C . Croce (Philadelphia), W. R. Jelinek (New York), M. Mottes (Milan) and C. Weissmann (Zurich) for their gifts of cloned DNA probes. Finally, we wish to thank Martine Brient for typing this manuscript and Philippe Breton for the artwork.
REFERENCES 1 . Salinas, J., Zerial, M., Filipski, J. & Bernardi, G. (1986) Eur. J.
2. Thiery, J. P., Macaya, G. & Bernardi, G. (1976) J. Mol. Biol. 108,
3. Cuny, G., Soriano, P., Macaya, G. & Bernardi, G. (1981) Eur. J .
4. Soriano, P., Macaya, G. & Bernardi, G. (1981) Eur. J. Biochem.
5. Meunier-Rotival, M., Soriano, P., Cuny, G., Strauss, F. & Bernardi, G. (1982) Proc. Nail Acad. Sci. USA 79,355-359.
6 . Soriano, P., Meunier-Rotival, M. & Bernardi, G. (1983) Proc. Natl Acad. Sci. USA 80,1816- 1820.
7. Tashima, M., Calabretta, B., Torelli, G., Scofield, M., Maizel, A. L. & Saunders, G. F. (1981) Proc. Natl Acad. Sci. USA 78,
8. Georgiev, G. P., Ilyin, Y. V., Chmelianskaite, Ryskov, V. G., Kramerov, A. P., Skryabin, D. A,, Krayev, K. G., Lukanidin,
Biochem. 160,469-478.
219 -235.
Biochem. 115,227-234.
115,235-239.
1508 - 151 3.
E. M. & Grigorian, M. S. (1981) Cold Spring Harbor Symp. Quant. Biol. 45,641 -654.
9. Jelinek, W. R., Toomey, T. P., Leinwand, L., Duncan, C. H., Biro, P. P., Chondary, P. V., Weissman, S. M., Rubin, C. M., Houck, C. M., Deininger, P. L. & Schmid, C. W. (1980) Proc. Natl Acad. Sci. USA 77,1398-1402.
10. Dierks, P., Van Ooyen, A., Mantei, N. & Weissmann, C. (1981) Proc. Natl Acad. Sci. USA 78, 1411 - 1415.
1 1 . Della Favera, R., Gelmann, E. P., Gallo, R. C. & Wong-Steal, F. (1981) Nature (Lond.) 292, 31 -35.
12. Della Favera, R., Gallo, R. C., Giallongo, A. & Croce, C. M. (1982) Science (Wash. DC) 218,686-688.
13. Stanton, L. W., Wah, R. & Marcu, K. B. (1983) Nature (Lond.)
14. Watson, R., Oskarsson, M. & Vande Woude G. F. (1982) Proc. Natl Acad. Sci. USA 79,4078 -4082.
15. Mottes, M., Tsai Lai, S.-A,, Montoya, J. & Attardi, G. (1984) Gene27,109-113.
16. Frommer, M., Prosser, J., Tkachuk, D., Reisner, A. H. &Vincent, P. C. (1982) Nucleic Acids Res. 10, 547-563.
17. Bernardi, G., Olofsson, B., Filipski, J., Zerial, M., Salinas, J., Cuny, G., Meunier-Rotival, M. & Rodier, F. (1985) Science (Wash. D C ) 228,953 -958.
18. Jeffreys, A. J., Wilson, V . & Thein, S. L. (1985) Nature (Lond.)
19. Meneveri, R., Agresti, A., Della Valle, G., Takdrico, D., Siccdrdi, A. G. & Ginelli, E. (1985) J . Mal. Biol. 186,483 -489.
303,401 -406.
314, 67-73.