the genetic origin and history of speed in the thoroughbred racehorse
TRANSCRIPT

ARTICLE
�nATuRE CommunICATIons | 3:643 | DoI: 10.1038/ncomms1644 | www.nature.com/naturecommunications
© 2012 Macmillan Publishers Limited. All rights reserved.
Received 27 Jul 2011 | Accepted 14 Dec 2011 | Published 24 Jan 2012 DOI: 10.1038/ncomms1644
selective breeding for speed in the racehorse has resulted in an unusually high frequency of the C-variant (g.66493737C/T) at the myostatin gene (MSTN) in cohorts of the Thoroughbred horse population that are best suited to sprint racing. Here we show using a combination of molecular- and pedigree-based approaches in 593 horses from 22 Eurasian and north-American horse populations, museum specimens from 12 historically important Thoroughbred stallions (b.1764–1930), 330 elite-performing modern Thoroughbreds and 42 samples from three other equid species that the T-allele was ancestral and there was a single introduction of the C-allele at the foundation stages of the Thoroughbred from a British-native mare. Furthermore, we show that although the C-allele was rare among the celebrated racehorses of the 18th and 19th centuries, it has proliferated recently in the population via the stallion nearctic (b.1954), the sire of the most influential stallion of modern time, northern Dancer (b.1961).
1 McDonald Institute for Archaeological Research, University of Cambridge, Cambridge, UK. 2 Equinome Ltd, NovaUCD, Belfield Innovation Park, Belfield, Dublin 4, Ireland. 3 Department of Archaeology, University of Cambridge, Cambridge, UK. 4 Department of Animal Breeding and Genetics, Swedish University of Agricultural Sciences, PO Box 597, Uppsala SE-751 24, Sweden. 5 Animal Genomics Laboratory, School of Agriculture and Food Science, University College Dublin, Belfield, Dublin 4, Ireland. 6 Smurfit Institute of Genetics, Trinity College, Dublin 2, Ireland. 7 Vavilov Institute of General Genetics, Russian Academy of Sciences, Moscow 119991 GSP-1, Russia. 8 Conway Institute of Biomolecular and Biomedical Research, University College Dublin, Dublin, Ireland. *These authors contributed equally to this work. Correspondence and requests for materials should be addressed to E.W.H. (email: [email protected]).
The genetic origin and history of speed in the Thoroughbred racehorsemim A. Bower1,*, Beatrice A. mcGivney2,*, michael G. Campana1,3, Jingjing Gu2, Lisa s. Andersson4, Elizabeth Barrett1, Catherine R. Davis2,5, sofia mikko4, Frauke stock6, Valery Voronkova7, Daniel G. Bradley6, Alan G. Fahey5, Gabriella Lindgren4, David E. macHugh2,5,8, Galina sulimova7 & Emmeline W. Hill2,5
ARTICLE
��
nATuRE CommunICATIons | DoI: 10.1038/ncomms1644
nATuRE CommunICATIons | 3:643 | DoI: 10.1038/ncomms1644 | www.nature.com/naturecommunications
© 2012 Macmillan Publishers Limited. All rights reserved.
The Thoroughbred is the most valuable breed of horse in the world and has been prized as a racehorse for centuries. The enthusiasm of the British aristocracy for racing in the 17th
century led to the development of the Thoroughbred1, and today all modern breed members trace their ancestry to one of three imported foundation stallions of Arab, Barb and Turk origin and 74 native British and imported mares2 that were recorded in the General Stud Book in 1791 (ref. 3). During the 300-year develop-ment of the breed, Thoroughbreds have been intensely selected for athletic phenotypes that enable superior racecourse performance in particular types of races4. In Britain and Ireland, the pattern of rac-ing has supported the breeding of disparate types of racehorses—precocious, fast, 2 year olds and sprinters, Classic middle-distance horses and horses with enhanced stamina.
Athletic phenotypes are influenced markedly by environment, management and training; however, it has long been accepted that there are underlying genetic factors that influence a horse’s athletic performance capabilities5. Indeed, selection and breeding of race-horses is predicated on the belief that racing performance is inher-ited. Although the physiological adaptations to elite athleticism and exercise are well described for the Thoroughbred6–13, few genes have been identified to explain these traits14–16. In humans more than 200 genes have been reported to be associated with fitness-related health and exercise traits17, and it is likely that racing performance in the Thoroughbred is also polygenic and is influenced by genes that contribute to the wide range of anatomical, metabolic and physiological adaptations that enable elite-racing performance. The athletic potential of a racehorse will therefore depend on a favour-able environment as well as inheriting the optimal combination of DNA variants at loci that significantly affect exercise.
Recently, variation at the MSTN locus has been found to be highly predictive of genetic potential for race distance aptitude in Thorough-bred racehorses18–21 and contributes to morphological type in other horse breeds22. The MSTN locus is associated with muscle hypertro-phy phenotypes in a range of mammalian species23–27 and a single nucleotide polymorphism (SNP, g.66493737C/T) located in the first intron of the MSTN gene influences speed in the Thoroughbred19. Thoroughbred homozygous C/C horses are best suited to fast, short-distance, sprint races (1,000–1,600 m); heterozygous C/T horses compete favourably in middle-distance races (1,400–2,400 m); and homozygous T/T horses have greater stamina ( > 2,000 m). Evalu-ation of retrospective racecourse performance, physical growth and stallion progeny performance has demonstrated that C/C and C/T horses are more likely to be physically precocious and enjoy greater racecourse success as 2-year-old racehorses than T/T horses19,28. These findings have been subsequently validated in three independ-ent genome-wide association (GWA) studies18,20,21 in populations of Thoroughbreds originating in Ireland, Great Britain, New Zealand20, USA18 and Japan21. The singular, genomic influence on optimum race distance at the MSTN locus in the Thoroughbred is supported by a high heritability for race distance (h2 = 0.94)29. Further evidence for the role of chromosomes containing the C-allele in influencing speed comes from association tests with field-measured speed indi-ces30 and from previous analysis of g.66493737C/T genotypes in the Quarter Horse, for which a high frequency of C/C homozygotes (0.83) has been reported19. The Quarter Horse is a North-American breed that excels at sprinting over distances of a quarter of a mile (400 m) or less. Because of the specificity of its role in short-distance racing, this breed has undergone intense selection for speed since its foundation in the mid-1800s31.
In a functional context, mRNA transcripts derived from the MSTN locus have the largest observed alterations in expression in the skele-tal muscle transcriptome of the Thoroughbred following the first year of training at the age of 2 years32, and mRNA expression variation is highly associated with genotype33. Although the g.66493737C variant disrupts a putative transcription factor binding site, it is
uncertain whether it represents the functional variant. However, the 50-bp sequence surrounding the g.66493737C/T SNP is conserved between horse and human and there is minimal divergence in the 200-bp 5′- and 3′-flanking sequences (5 and 1.25%, respectively). The presence of a 227-bp SINE insertion polymorphism (Ins227bp) located in the promoter region sequence may also be considered a putative functional variant and linkage disequilibrium between the two polymorphisms is high (r2 = 0.73) but not complete20. The g.66493737C/T and Ins227bp variants are polymorphic in the Thoroughbred population; however, in a re-sequencing study that included populations of European horse breeds, the g.66493737C/T SNP was not polymorphic (minor allele frequency (MAF) < 0.05) and the Ins227bp allele was not identified22.
Although g.66493737C/T variation has been well characterized in Thoroughbreds, the origins and history of this polymorphism are not known. Therefore, here we use a combination of popula-tion genetics-based molecular and pedigree approaches in modern and historic horse samples to trace the ancestry of this economically valuable allele in the Thoroughbred racehorse.
ResultsGenetic ancestry and geographic distribution. To determine the ancestral g.66493737C/T allele in equids we genotyped the SNP in n = 40 donkeys (Equus asinus) and two zebras (Equus grevyi and Equus quagga boehmi). As no donkey or zebra chromosome (2n = 84) had the g.66493737C variant, we ascertained that the T-allele was the ancestral wild type. This is consistent with wild-plains–grazing equid populations traversing large distances within expansive ranges34. Next, to determine a possible source population for the C-allele we mapped the geographic distribution of genotypes in n = 394 non-Thoroughbred Eurasian horses from 17 populations selected for genotyping on the basis that they represented putative Thoroughbred founding populations (British Isles representing local British and Irish horses; Middle East and North Africa representing Arab, Barb and Turk influences)35, and populations located at the geographic centre of domestication for the horse (Asia)36,37. To evaluate the effect of recent selection for different competition pressures we compared these data with genotypes from four recently derived breeds with recorded Thoroughbred influences (that is, French Trotter: harness racing; Irish Draught Horse: show jumping and eventing; Quarter Horse: sprint racing; Standardbred: harness racing) and also with a geographically and genetically isolated population of horses (Icelandic). We found that the C-allele occurs at a frequency of 0.51 in the Thoroughbred, is present at frequencies between 0.00 and 0.50 in Eurasian horses (British Isles, Middle East and North Africa and Asia), is absent in Standardbreds and is most common in the Quarter Horse (0.90). The C-allele is therefore not restricted to the Thoroughbred and Thoroughbred-derived populations, is not a new mutation, and seems to occur at variable frequencies depending on the selection pressures on the population (Table 1). In contrast to the high frequency of the C-allele in sprint racing Thoroughbreds and Quarter Horses, the C/C genotype was sampled in only 4% of Asia, 3% of Middle East and North Africa, and 20% of British Isles horses.
As the Thoroughbred has been a closed population since 1791 (ref. 3), the C-allele must have been introduced at the foundation stages of the breed (early to mid-17th century). During a founda-tion event, high-frequency alleles are more likely to be sampled than those at low frequency. In general, C-allele frequencies were low in Eurasian populations and have persisted predominantly in the het-erozygous state (Table 1). However, evaluation of allele frequencies among the putative source populations (British Isles, Middle East and North Africa) identified two populations with relatively high frequencies of C-alleles (Fulani, 0.33; Shetland 1, 0.50). The link between African horses (Fulani sampled in Cameroon) and Thor-oughbreds is clear, as the Barb horse, originating in North Africa,

ARTICLE
�
nATuRE CommunICATIons | DoI: 10.1038/ncomms1644
nATuRE CommunICATIons | 3:643 | DoI: 10.1038/ncomms1644 | www.nature.com/naturecommunications
© 2012 Macmillan Publishers Limited. All rights reserved.
is known to have contributed to the foundation of the Thorough-bred38. Also, recent analysis of equine mitochondrial DNA varia-tion has demonstrated that a large proportion of Thoroughbred foundation mares were from native British stock35. The Shetland is closely related (at least geographically) to the Galloway breed, which was the preeminent British racing population before the formal foundation of the Thoroughbred breed39,40. In Asia, the relatively high frequency of C-alleles (0.44) sampled in one of the Mongo-lian populations (Mongolia 1) is ambiguous, but may be explained by unintentional sampling of relatives. This is supported by resam-pling in two additional populations of horses from the same region (Mongolian Gobi and Mongolian 2), within which the C-allele was rare (0.10 and 0.03, respectively) and no homozygous C/C horses (n = 55) were sampled. There is little or no historic rationale to infer Mongolian horses as an immediate source population for the Thoroughbred.
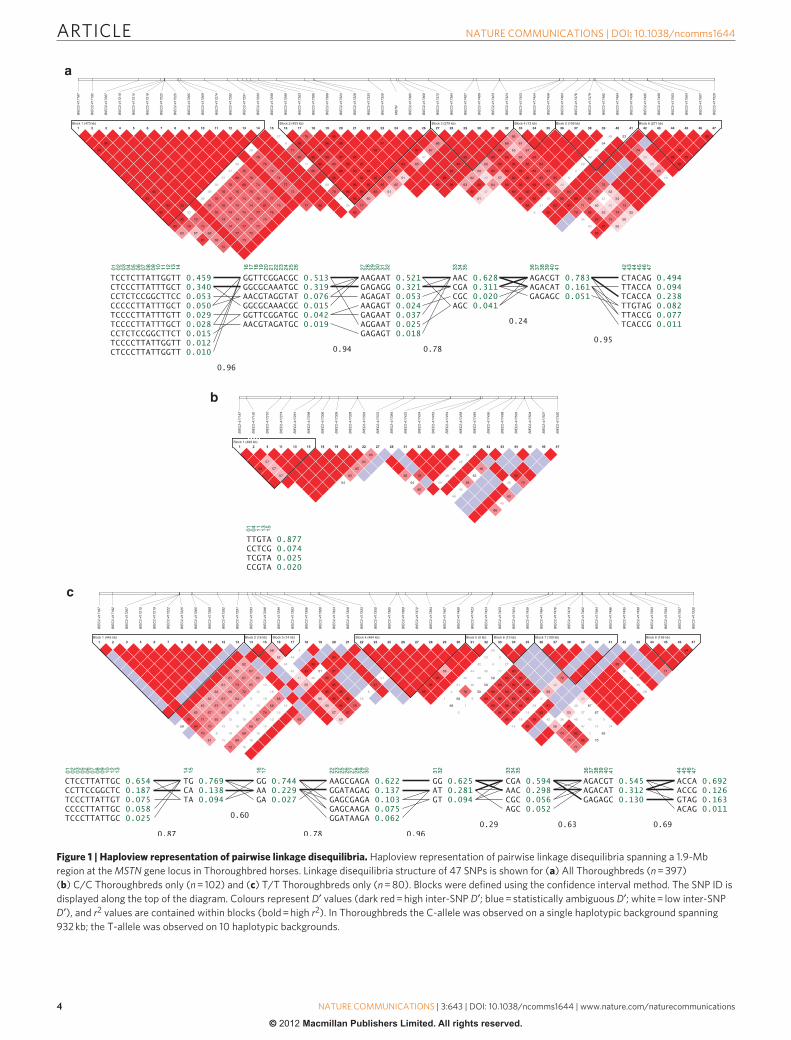
Haplotype diversity and population source. To determine the extent of C-allele introgression at the foundation stages, we recon-structed haplotypes in n = 204 C-chromosomes and n = 160 T-chromosomes in C/C and T/T Thoroughbreds only, for 46 SNPs (BIEC2-417187-BIEC2-417520) extracted from the EquineSNP50
Genotyping BeadChip (Illumina, San Diego, CA, USA) and the g.66493737C/T variant. The 47 SNP-haplotypes (Fig. 1a) spanned the 1.9-Mb region at the MSTN gene locus that contained a set of eight SNPs with genome-wide significance of association with best race distance in a previous genome-wide association study20. The C-allele was observed on a single haplotypic background spanning 932 kb (that is, no variation was detected between BIEC2-417299 and BIEC-417453; ECA18: 66064660–66996871 bp; n = 17 SNPs that were present at MAF > 0.05 in Thoroughbreds; Supplementary Data 1, TB_C1) and only minimal variation was detected in a sin-gle proximal region (Block 1) upstream of the g.66493737C/T SNP (Fig. 1b). In contrast, the T-allele arises on a complex genetic background, with multiple haplotype blocks across the region, and considerable variation (Fig. 1c) within the haplotype block (Block 4, spanning 484 kb) containing the g.66493737C/T SNP. In total, 10 haplotypes were identified among T-chromosomes within the 932-kb block that is invariant around the C-allele (Supplementary Data 1, TB_T1–TB_T10). In an attempt to identify the source of the Thoroughbred C-allele, haplotypes (n = 9 SNPs with MAF > 0.05) were reconstructed for a second set of Shetland samples (Shetland 2; n = 42; C/C, 0.29; C/T, 0.40; T/T, 0.31) and compared with the Thoroughbred chromosomal backgrounds. Sixteen haplotypes
Table 1 | Allele and genotype frequencies at the MSTN g.66493737C/T locus.
Population Geographic origin Rationale n 2n Genotype frequency Allele frequency
C/C C/T T/T C T
Equus asinus GB Ancestral 40 80 0.00 0.00 1.00 0.00 1.00E. grevyi, E. quagga boehmi Czech Republic Ancestral 2 4 0.00 0.00 1.00 0.00 1.00Other equids 42 84 0.00 0.00 1.00 0.00 1.00
Connemara Ireland British Isles local 22 44 0.05 0.09 0.86 0.09 0.91Highland scotland British Isles local 21 42 0.05 0.10 0.86 0.10 0.90shetland 1 scotland British Isles local 16 32 0.38 0.25 0.38 0.50 0.50shetland 2 sweden British Isles local 42 84 0.29 0.40 0.31 0.49 0.51British Isles 101 202 0.20 0.25 0.55 0.32 0.68
Akhal–Teke Russia/Turkmenistan Turk 18 36 0.00 0.11 0.89 0.06 0.94Anatolian Turkey Turk 19 38 0.00 0.11 0.89 0.05 0.95Egyptian Arabian Egypt Arab/Barb 30 60 0.03 0.10 0.87 0.08 0.92Fulani Cameroon Barb 18 36 0.11 0.44 0.44 0.33 0.67Turkoman Turkmenistan Turk 15 30 0.00 0.00 1.00 0.00 1.00Middle East and North Africa 100 200 0.03 0.15 0.82 0.10 0.90
Altai Altai Domestication 25 50 0.08 0.36 0.56 0.26 0.74mongolian 1 mongolia Domestication 16 32 0.25 0.38 0.38 0.44 0.56mongolian 2 mongolia Domestication 30 60 0.00 0.07 0.93 0.03 0.97mongolian Gobi mongolian Gobi Domestication 25 50 0.00 0.20 0.80 0.10 0.90TransBaikalia Baikal Domestication 25 50 0.04 0.24 0.72 0.16 0.84Tuva/siberia Tuva/siberia Domestication 25 50 0.00 0.20 0.80 0.10 0.90Tuva 1 Tuva/siberia Domestication 29 58 0.00 0.14 0.86 0.07 0.93Yakut Yakutia/siberia Domestication 18 36 0.00 0.06 0.94 0.03 0.97Asia 193 386 0.04 0.20 0.76 0.13 0.87
Thoroughbred ≤1,400 m GB/IRE/nZ/usA sprinter TB 69 138 0.46 0.46 0.07 0.70 0.30Thoroughbred ≥1,800 m GB/IRE/nZ/usA stayer TB 96 192 0.03 0.61 0.35 0.34 0.66Thoroughbred (Aus) Australia Elite TB 123 246 0.38 0.51 0.11 0.64 0.36*TB 1,000–3,200 m GB, IRE, nZ, usA Elite TB 207 414 0.22 0.57 0.21 0.51 0.49
French Trotter France Derived breed 46 92 0.00 0.02 0.98 0.01 0.99Icelandic Iceland Isolated breed 21 42 0.05 0.24 0.71 0.17 0.83Irish Draught Ireland Derived breed 30 60 0.07 0.27 0.67 0.20 0.80Quarter Horse usA Derived breed 35 70 0.83 0.14 0.03 0.90 0.10standardbred usA/Canada Derived breed 63 126 0.00 0.00 1.00 0.00 1.00
Aus, Australia; GB, Great Britain; IRE, Ireland; MSTN, myostatin; nZ, new Zealand; TB, Thoroughbred; usA, united states of America.Allele and genotype frequencies at the MSTN g.66493737C/T locus in Thoroughbreds, and putative ancestral source populations for the C-allele including local and geographically diverse horse breeds and other non-horse equids. Ancestral populations for the Thoroughbred: British Isles, middle East and north Africa; horse populations at the geographic centre of domestication: Asia; *TB: Thoroughbred; TB 1,000–3,200 m: elite TBs with racing phenotypes across the full spectrum of race distances including middle distances (1,400–1,800 m) that are not recorded elsewhere on the table.
ARTICLE
��
nATuRE CommunICATIons | DoI: 10.1038/ncomms1644
nATuRE CommunICATIons | 3:643 | DoI: 10.1038/ncomms1644 | www.nature.com/naturecommunications
© 2012 Macmillan Publishers Limited. All rights reserved.
Figure 1 | Haploview representation of pairwise linkage disequilibria. Haploview representation of pairwise linkage disequilibria spanning a 1.9-mb region at the MSTN gene locus in Thoroughbred horses. Linkage disequilibria structure of 47 snPs is shown for (a) All Thoroughbreds (n = 397) (b) C/C Thoroughbreds only (n = 102) and (c) T/T Thoroughbreds only (n = 80). Blocks were defined using the confidence interval method. The snP ID is displayed along the top of the diagram. Colours represent D′ values (dark red = high inter-snP D′; blue = statistically ambiguous D′; white = low inter-snP D′), and r2 values are contained within blocks (bold = high r2). In Thoroughbreds the C-allele was observed on a single haplotypic background spanning 932 kb; the T-allele was observed on 10 haplotypic backgrounds.
ARTICLE
�
nATuRE CommunICATIons | DoI: 10.1038/ncomms1644
nATuRE CommunICATIons | 3:643 | DoI: 10.1038/ncomms1644 | www.nature.com/naturecommunications
© 2012 Macmillan Publishers Limited. All rights reserved.
(Supplementary Data 1, Shet_T1–Shet_T16) were identified among n = 26 T-chromosomes (that is, T/T, n = 13). In contrast, four hap-lotypes were identified among Shetland C-chromosomes (C/C, n = 12; Supplementary Data 1, Shet_C1–Shet_C4; Frequency Shet_C1 = 0.456; Shet_C2 = 0.086; Shet_C3 = 0.414; Shet_C4 = 0.044). Shet_C3 was very similar to the C-chromosome haplotype observed in Thoroughbreds; 16 of the 17 SNPs spanning 750 kb (that is, exclud-ing the 178 kb proximal variant BIEC2-417453) were identical to the invariant region on Thoroughbred C-chromosomes. Together these data are consistent with a single introduction of the C-allele at the foundation stages of the Thoroughbred, introduced most likely by a local British horse. The absence of haplotype data for Fulani (or any other representative North-African population) precludes rejection of the possibility that the C-allele originated from a stallion or mare of Barb origin, although this is less likely.
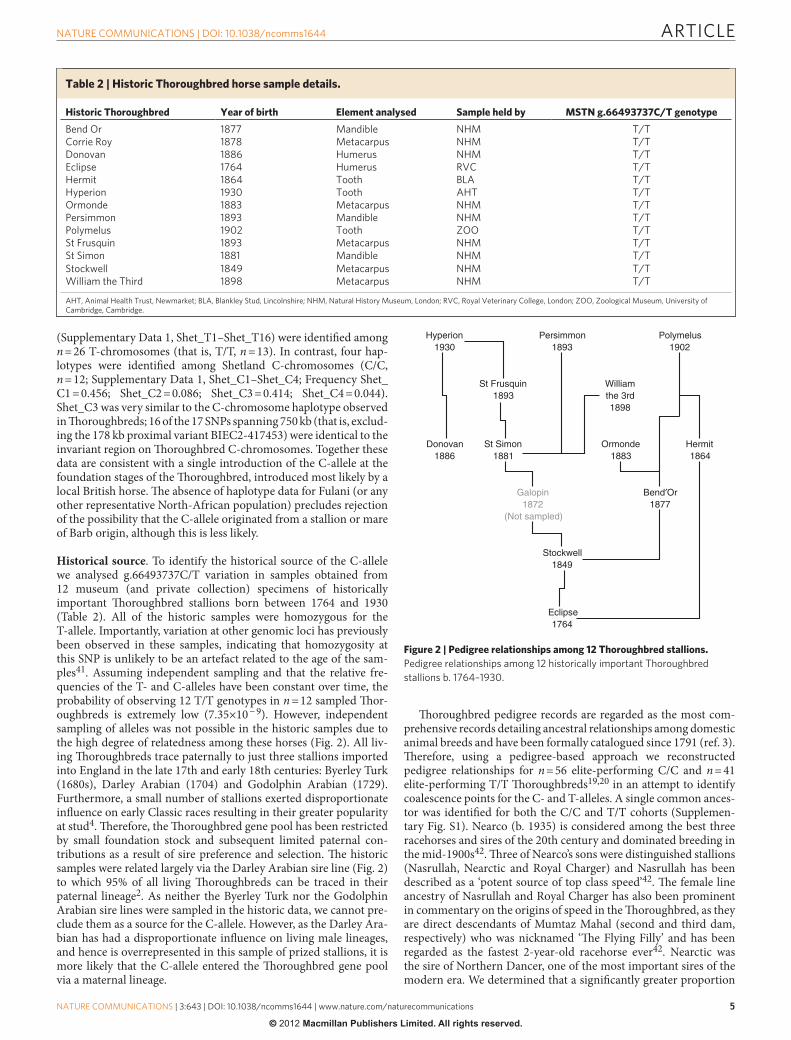
Historical source. To identify the historical source of the C-allele we analysed g.66493737C/T variation in samples obtained from 12 museum (and private collection) specimens of historically important Thoroughbred stallions born between 1764 and 1930 (Table 2). All of the historic samples were homozygous for the T-allele. Importantly, variation at other genomic loci has previously been observed in these samples, indicating that homozygosity at this SNP is unlikely to be an artefact related to the age of the sam-ples41. Assuming independent sampling and that the relative fre-quencies of the T- and C-alleles have been constant over time, the probability of observing 12 T/T genotypes in n = 12 sampled Thor-oughbreds is extremely low (7.35×10 − 9). However, independent sampling of alleles was not possible in the historic samples due to the high degree of relatedness among these horses (Fig. 2). All liv-ing Thoroughbreds trace paternally to just three stallions imported into England in the late 17th and early 18th centuries: Byerley Turk (1680s), Darley Arabian (1704) and Godolphin Arabian (1729). Furthermore, a small number of stallions exerted disproportionate influence on early Classic races resulting in their greater popularity at stud4. Therefore, the Thoroughbred gene pool has been restricted by small foundation stock and subsequent limited paternal con-tributions as a result of sire preference and selection. The historic samples were related largely via the Darley Arabian sire line (Fig. 2) to which 95% of all living Thoroughbreds can be traced in their paternal lineage2. As neither the Byerley Turk nor the Godolphin Arabian sire lines were sampled in the historic data, we cannot pre-clude them as a source for the C-allele. However, as the Darley Ara-bian has had a disproportionate influence on living male lineages, and hence is overrepresented in this sample of prized stallions, it is more likely that the C-allele entered the Thoroughbred gene pool via a maternal lineage.
Thoroughbred pedigree records are regarded as the most com-prehensive records detailing ancestral relationships among domestic animal breeds and have been formally catalogued since 1791 (ref. 3). Therefore, using a pedigree-based approach we reconstructed pedigree relationships for n = 56 elite-performing C/C and n = 41 elite-performing T/T Thoroughbreds19,20 in an attempt to identify coalescence points for the C- and T-alleles. A single common ances-tor was identified for both the C/C and T/T cohorts (Supplemen-tary Fig. S1). Nearco (b. 1935) is considered among the best three racehorses and sires of the 20th century and dominated breeding in the mid-1900s42. Three of Nearco’s sons were distinguished stallions (Nasrullah, Nearctic and Royal Charger) and Nasrullah has been described as a ‘potent source of top class speed’42. The female line ancestry of Nasrullah and Royal Charger has also been prominent in commentary on the origins of speed in the Thoroughbred, as they are direct descendants of Mumtaz Mahal (second and third dam, respectively) who was nicknamed ‘The Flying Filly’ and has been regarded as the fastest 2-year-old racehorse ever42. Nearctic was the sire of Northern Dancer, one of the most important sires of the modern era. We determined that a significantly greater proportion
Table 2 | Historic Thoroughbred horse sample details.
Historic Thoroughbred Year of birth Element analysed Sample held by MSTN g.66493737C/T genotype
Bend or 1877 mandible nHm T/TCorrie Roy 1878 metacarpus nHm T/TDonovan 1886 Humerus nHm T/TEclipse 1764 Humerus RVC T/THermit 1864 Tooth BLA T/THyperion 1930 Tooth AHT T/Tormonde 1883 metacarpus nHm T/TPersimmon 1893 mandible nHm T/TPolymelus 1902 Tooth Zoo T/Tst Frusquin 1893 metacarpus nHm T/Tst simon 1881 mandible nHm T/Tstockwell 1849 metacarpus nHm T/TWilliam the Third 1898 metacarpus nHm T/T
AHT, Animal Health Trust, newmarket; BLA, Blankley stud, Lincolnshire; nHm, natural History museum, London; RVC, Royal Veterinary College, London; Zoo, Zoological museum, university of Cambridge, Cambridge.
Stockwell1849
Eclipse1764
Donovan1886
Ormonde1883
Hermit1864
St Simon1881
Bend′Or1877
Galopin1872
(Not sampled)
St Frusquin1893
Williamthe 3rd1898
Hyperion1930
Persimmon1893
Polymelus1902
Figure 2 | Pedigree relationships among 12 Thoroughbred stallions. Pedigree relationships among 12 historically important Thoroughbred stallions b. 1764–1930.
ARTICLE
��
nATuRE CommunICATIons | DoI: 10.1038/ncomms1644
nATuRE CommunICATIons | 3:643 | DoI: 10.1038/ncomms1644 | www.nature.com/naturecommunications
© 2012 Macmillan Publishers Limited. All rights reserved.
of C/C horses traced to Nearctic than T/T horses (87.5 and 68.3%, respectively; Fisher’s exact test; two-tailed: P = 0.025), but there was no significant difference in the occurrence of the other Nearco-sired stallions in the ancestry of C/C and T/T horses.
DiscussionVariation at the MSTN locus has been found to influence racing phe-notypes in Thoroughbreds, and in particular influences early skeletal muscle development and the aptitude for racing at short distances. Changes in racing in the past century have shaped MSTN genotype distributions over time and in different racing regions. In the 17th and 18th centuries, races took the form of matches between two horses involving multiple heats, run over distances of two to four miles (3,200–6,400 m) and repeated until a horse had won the event twice or ‘distanced’ the opponent. Horses did not race until they were 5 or 6 years old, and then only two or three times in their lives. These particular demographics would have supported the prevalence of the T/T genotype among the prominent horses of the time. The founda-tion of the English Classic races in the late 1700s and early 1800s her-alded a change in racing, leading to selection for horses capable of excelling over distances from 1,600 m (1,000 and 2,000 Guineas)—2,800 m (The St Leger) at the age of 3 years. Races for younger horses became increasingly common and as younger horses competed, races became shorter. By the late 1860s heat races had almost entirely disappeared and there have been no 4-mile Flat races for more than 100 years. An increased premium on speed and precocity developed as 2-year-old races became more popular. In 1802 < 6% of horses were racing at the age of 2 years, and by 1870, 31% of runners were 2 year-olds43. The preference for younger and shorter distance racing has persisted in two of the principal racing regions of the world; in the USA Group 1 (most prestigious, highest grade) races > 2,000 m are limited (9% USA, 23% Australia, 28% Britain) and in Australia 37% of Group 1 races are competed over distances 1,000–1,400 m compared with 20% in USA and just 12% in Britain. These selection pressures continue to favour C-allele proliferation, which is reflected in the distribution of genotypes (n = 123; C/C, 0.38; C/T, 0.51; T/T, 0.11) among a sample of elite Australian mares and stallions.
Our population genetic survey is consistent with a single intro-duction of the C-allele in the Thoroughbred in the early founda-tion stages of the breed and the data indicate that the most likely source population for the C-allele in the Thoroughbred was a local British population. Furthermore, it is most likely that the C-allele entered via a female lineage, as the prized foundation stallions (17th and 18th centuries) were homozygous for the T-allele. However, the opportunity for proliferation of favourable alleles in the population will have been greatest among popular stallions that had large num-bers of offspring. Analysis of coalescence indicates that the opportu-nity for an increase in C-allele frequency in the Thoroughbred likely arose relatively recently (20th century) via Nearctic and his son Northern Dancer. These data are consistent with historical obser-vations and illustrate the power of population genetic analyses for determining the ancestry of economically valuable alleles subject to intense artificial selection in domestic animal populations.
The considerable changes in racing that took place between 1800 and 1914 (ref. 44) have ensured continued strong selection for speed and precocity in the Thoroughbred racehorse. Such trends have pro-moted the increase and retention of the MSTN C-allele that confers a tendency towards speed. The incorporation of genetic informa-tion in breeding and selection decisions is becoming increasingly adopted within the Thoroughbred industry and this information will continue to shape the diversity within the Thoroughbred popu-lation. Importantly, although knowledge of genetic variation at the MSTN locus is tantamount to determining the optimum race dis-tance for an individual Thoroughbred, the combination of favour-able alleles at other genomic loci will be vital to differentiate indi-viduals that excel at the distances to which they are best suited.
MethodsDNA isolation from modern samples. Samples for genotyping were collected and stored in laboratory repositories since the mid-1990s. Non-Thoroughbred horse genotypes were determined for n = 526 horses from 22 populations. Seventeen non-Thoroughbred horse populations were selected for genotyping on the basis of putative contributions to the Thoroughbred (British Isles—Connemara, Highland, Shetland 1, Shetland 2; Middle East and North Africa—Akhal-Teke, Anatolian, Egyptian Arabian, Fulani, Turkoman) and their origin at the geographic centre of horse domestication (Asia—Altai, Mongolian 1, Mongolian 2, Mongolian Gobi, Transbaikalia, Tuva/Siberia, Tuva 1, Yakut). Four populations were selected for genotyping on the basis of recorded Thoroughbred influence (French Trotter, Irish Draught, Quarter Horse, Standardbred) and a geographically isolated population (Icelandic) was also included. A total of 330 elite Thoroughbred horses sampled in Great Britain and Ireland, New Zealand, USA and Australia were genotyped. Horses were considered elite if they had won at least one Group (Stakes) or Listed race. Elite Thoroughbreds were subdivided on best race distance, defined as the distance of the highest grade of race won. Instances where multiple races of the same grade were won, the distance of the most valuable (in terms of prize money) race was determined the best race distance.
Genomic DNA was extracted from either fresh whole blood or hair samples. DNA was isolated from hair samples according to Allen et al.45 or a modified version of a standard phenol/chloroform method. DNA was isolated from fresh whole blood using a Nucleon HT Genomic DNA Extraction Kit (GE Healthcare Life Sciences, Buckinghamshire, UK) or the Maxwell 16 automated DNA purification system (Promega, Madison, WI, USA).
DNA isolation from historic samples. DNA from historic samples (Table 2) was extracted and analysed following previously published protocols46 at the Department of Biochemistry and the McDonald Institute for Archaeological Research, University of Cambridge. Briefly, for bone samples, the surface was removed and cortical bone was collected using a 300 Series Dremel drilling tool (Dremel UK; Uxbridge, UK) and/or a Certiprep SPEX Freezer/Mill (SPEX SamplePrep, Stanmore, UK). For tooth samples, a root was removed and dentine was collected from the crown using a Dremel drilling tool as described by Gilbert et al.47 Bone or dentine powder (125–250 mg) was collected per sample. To prevent cross-contamination, after a specimen was powdered, all equipment was re-sterilized using bleach, ethanol and ultraviolet light before tissue was collected from another sample.
Samples were digested overnight, inverting continuously, at 37 °C in 1 ml of an extraction buffer containing 0.5% w/v n-lauryl sarcosine, 0.1 M EDTA (pH 8.0), 0.1 mg proteinase K (Sigma-Aldrich Company Ltd., Dorset, UK) and 0.142% w/v phenacylthiazolium bromide solution (Prime Organics, Woburn, MA, USA). Purification followed procedure as given by Kalmár et al.48 For each sample, 250 µl aliquots were ethanol-precipitated for 30 mins at − 80 °C using 500 µl 96% ethanol, 250 µl 4.0 M ammonium acetate and 3.0 µg blue dextran. Afterwards, the precipitated DNA and blue dextran were pelleted at 3–4 °C at 13,000 r.p.m. for 30 mins, the aqueous phase was removed, and the pellets were resuspended in 20 µl double-distilled water, pH 8.0. The extracts were purified using a QIAquick PCR Purification Kit (Qiagen Ltd., Crawley, UK) according to the manufacturer’s instructions, except that the final elution step was replaced by two elutions of 30 and 20 µl elution buffer.
All appropriate ancient DNA authentication criteria were followed49, including the use of multiple controls50 and replication of results in an independent institu-tion. Amplification products were assessed for DNA damage and enzyme error by bacterial cloning51.
Single SNP genotyping. All modern samples were genotyped for the g.66493737C/T SNP using Taqman chemistry on the StepOnePlus Real-Time PCR System (Applied Biosystems, Foster City, CA, USA). The assay consisted of primer 1: 5′-CCAGGACTATTTGATAGCAGAGTCA-3′, primer 2: 3′-GACACAACAGTTTCAAAATATTGTTCTCCTT-5′ and two allelic-specific fluorescent dye labelled probes (VIC-AATGCACCAAGTAATTT; 6-FAM-AT-GCACCAAATAATTT).
Sequence variation at the g.66493737C/T locus was determined for the historic extracts following PCR amplification of a 144-bp fragment flanking and including the locus using the following primer sequences: 5′-CTACTCCAGGACTATTT GATAGCAGAG-3′ and 5′-TGCGATCCTGCTTTACCCAGT-3′. PCRs were conducted in 25 µl reactions containing 17–19 µl PLATINUM Taq High-Fidelity Supermix, 0.4–0.8 µM each primer, 8× bovine serum albumin, and 2–4 µl DNA extract. Genotyping was performed using the SNaPshot Multiplex Kit (Applied Biosystems) according to previously published protocols41 using the primer 5′-CTACTCCAGGACTATTTGATAGCAGAG-3′ and 1 µl purified DNA. SNaP-shot products were electrophoresed on an ABI PRISM 3730 automated genotyper. SNaPshot genotype results were confirmed by direct sequencing and by sequencing of multiple clones of amplification products. The reliability of this approach for genotyping in these samples has been demonstrated by the accurate determination of recorded coat colour phenotypes, many of which were heterozygous at the ASIP and MC1R loci41. To control for the misidentification of homozygotes caused by the occurrence of allelic dropout due to possible DNA degradation (for example,
ARTICLE
�
nATuRE CommunICATIons | DoI: 10.1038/ncomms1644
nATuRE CommunICATIons | 3:643 | DoI: 10.1038/ncomms1644 | www.nature.com/naturecommunications
© 2012 Macmillan Publishers Limited. All rights reserved.
C to T transition lesions), we performed an independent allelic dropout test comparing coat colour according to genotype and recorded phenotype41. Observed rates of allelic dropout for the coat colour loci ASIP and MC1R were 21 and 26%, respectively. Given the observed dropout rates, the probability of detecting hetero-zygotes in one of the three independent genotyping experiments was greater than 98%. Therefore, we performed a minimum of three PCRs from a minimum of three extracts for each historic Thoroughbred. Sequences were aligned in Mega 4 (ref. 52) using the Clustal-W algorithm53 and compared with the EquCab2.0 reference sequence. This procedure further demonstrates that the sequences determined from the historic Thoroughbred samples were not compromised by significant lev-els of degradation. The sequences generated from the MSTN locus were completely concordant with the reference sequence flanking the g.66493737C/T SNP.
Genotyping results for the historic extracts were replicated at Trinity College Dublin, using established protocols54, or at University College Dublin on the Ste-pOnePlus Real-Time PCR System from aliquots of DNA extracts prepared at the University of Cambridge. Preparation of samples for genotyping was performed in a laboratory that had never been used for the preparation of equine samples.
Haplotype reconstruction using data from Equine SNP50 BeadChips. Geno-types for 182 (C/C n = 102, T/T n = 80) Thoroughbred horses were extracted from data generated for a sample of 397 DNA samples genotyped using EquineSNP50 Genotyping BeadChips (Illumina). DNA was quantified using Quant-iT PicoGreen dsDNA kits (Invitrogen, Carlsbad, CA, USA) according to the manufacturer’s instructions and the DNA concentrations were adjusted to 20 ng µl − 1. Genotyping was performed by laboratories at AROS Applied Biotechnology (Denmark) and GeneSeek (Lincoln, NE, USA). The samples genotyped for the present study were a subset of samples genotyped in three separate batches (Batch 1, n = 96; Batch 2, n = 92; Batch 3, n = 228). We included four pairs of duplicate samples between Batch 1 and Batch 2, two additional pairs of duplicate samples between Batch 2 and Batch 3 and two pairs of duplicate samples within Batch 3 for quality control purposes and observed greater than 99.9% concordance in seven of the eight pairs. A parent–offspring trio was also included to verify the Mendelian transmission of SNPs. We successfully genotyped 53,922 loci. All samples had a genotyping rate > 90%. We omitted SNPs that had a genotyping completion rate of < 90%, were monomorphic or had MAFs < 0.05 in our samples. We omitted 18,109 SNPs leaving 35,813 SNPs in our working build of the data, and the overall genotype completion rate was 99.9%.
Genotypes for 42 Shetland horses were extracted from data generated using EquineSNP50 Genotyping BeadChips (Illumina). DNA was quantified using Nanodrop (Thermo Fisher Scientific Inc., Wilmington, DE, USA) according to the manufacturer’s instructions and the DNA concentrations were adjusted to 60 ng µl − 1. Genotyping was performed by GeneSeek (Lincoln, NE, USA). Six parent–offspring trios were included and used for quality control. Mendelian trans-mission errors were less than 99.8%. We successfully genotyped 54,602 loci and all samples had a genotyping rate > 93% (average 97.4%).
SNPs spanning a ~2-Mb region (BIEC2-417187—BIEC2-417520; that is, ECA18:65565128 bp—67457777 bp) on ECA18 containing the MSTN gene were extracted from the data. Haploview was used to calculate pairwise measures of linkage disequilibrium (LD) among 47 SNPs (including g.66493737C/T) and was used to create a visual representation of the data55 (Fig. 1). Using the default method, the region was divided into blocks of strong LD using a standard block definition based on confidence intervals for strong LD and minor allele frequencies > 0.05.
Pedigree reconstruction. Pedigree information for 56 elite-performing C/C and 41 elite-performing T/T Thoroughbreds was analysed using the PedigreeViewer v6.5b software (www-personal.une.edu.au/~bkinghor/pedigree.htm). Pedigree data were edited for identification and sex duplication, and any records with errors were corrected. A single coalescence point was identified for all individuals (Supplementary Fig. S1).
References1. Cassidy, R. The Sport of Kings: Kinship, Class and Thoroughbred Breeding in
Newmarket (Cambridge University Press, 2002).2. Cunningham, E. P., Dooley, J. J., Splan, R. K. & Bradley, D. G. Microsatellite
diversity, pedigree relatedness and the contributions of founder lineages to thoroughbred horses. Anim. Genet. 32, 360–364 (2001).
3. Weatherby, J. An Introduction to a General Stud Book (Weatherby and Sons, 1791).
4. Vamplew, W. & Kay, J. Encyclopedia of British Horseracing (Routledge, 2005).5. Gaffney, B. & Cunningham, E. P. Estimation of genetic trend in racing
performance of thoroughbred horses. Nature 332, 722–724 (1988).6. Dempsey, J. A. & Wagner, P. D. Exercise-induced arterial hypoxemia. J. Appl.
Physiol. 87, 1997–2006 (1999).7. Essen-Gustavsson, B. & Lindholm, A. Muscle fibre characteristics of active and
inactive standardbred horses. Equine Vet. J. 17, 434–438 (1985).8. Hinchcliff, K. & Geor, R. The Horse as an Athlete: A Physiological Overview.
Equine Exercise Physiology: the Science of Exercise in the Athletic Horse (Saunders/Elsevier, 2008).
9. Hyyppa, S., Rasanen, L. A. & Poso, A. R. Resynthesis of glycogen in skeletal muscle from standardbred trotters after repeated bouts of exercise. Am. J. Vet. Res. 58, 162–166 (1997).
10. Jones, J. H. et al. Oxygen transport during exercise in large mammals. I. Adaptive variation in oxygen demand. J. Appl. Physiol. 67, 862–870 (1989).
11. Katz, L., Bayly, W., Hines, M. & Sides, R. Ventilatory responses of ponies and horses to exercise. Equine Comp. Exercise Phys. 2, 229–240 (2005).
12. Poso, A. R., Essen-Gustavsson, B. & Persson, S. G. Metabolic response to standardised exercise test in standardbred trotters with red cell hypervolaemia. Equine Vet. J. 25, 527–531 (1993).
13. Wagner, P. Determinants of V-O2max: man vs horse. J. Equine Vet. Sci. 15, 398–404 (1995).
14. Gu, J. et al. Association of sequence variants in CKM (creatine kinase, muscle) and COX4I2 (cytochrome c oxidase, subunit 4, isoform 2) genes with racing performance in Thoroughbred horses. Equine Vet. J. 42, 569–575 (2010).
15. Gu, J. et al. A genome scan for positive selection in thoroughbred horses. PLoS One 4, 5767 (2009).
16. Hill, E. W., Gu, J., McGivney, B. A. & MacHugh, D. E. Targets of selection in the Thoroughbred genome contain exercise-relevant gene SNPs associated with elite racecourse performance. Anim. Genet. 41 (Suppl 2), 56–63 (2010).
17. Bray, M. S. et al. The human gene map for performance and health-related fitness phenotypes: the 2006–2007 update. Med. Sci. Sports Exerc. 41, 35–73 (2009).
18. Binns, M. M., Boehler, D. A. & Lambert, D. H. Identification of the myostatin locus (MSTN) as having a major effect on optimum racing distance in the Thoroughbred horse in the USA. Anim. Genet. 41 (Suppl 2), 154–158 (2010).
19. Hill, E. W. et al. A sequence polymorphism in MSTN predicts sprinting ability and racing stamina in thoroughbred horses. PLoS One 5, e8645 (2010).
20. Hill, E. W., McGivney, B. A., Gu, J., Whiston, R. & Machugh, D. E. A genome-wide SNP-association study confirms a sequence variant (g.66493737C > T) in the equine myostatin (MSTN) gene as the most powerful predictor of optimum racing distance for Thoroughbred racehorses. BMC Genomics 11, 552 (2010).
21. Tozaki, T. et al. A genome-wide association study for racing performances in Thoroughbreds clarifies a candidate region near the MSTN gene. Anim. Genet. 41 (Suppl 2), 28–35 (2010).
22. Dall’Olio, S. et al. Analysis of horse myostatin gene and identification of single nucleotide polymorphisms in breeds of different morphological types. J. Biomed. Biotechnol. 2010, 1–11 (2010).
23. Grobet, L. et al. A deletion in the bovine myostatin gene causes the double-muscled phenotype in cattle. Nat. Genet. 17, 71–74 (1997).
24. McPherron, A. C., Lawler, A. M. & Lee, S. J. Regulation of skeletal muscle mass in mice by a new TGF-beta superfamily member. Nature 387, 83–90 (1997).
25. McPherron, A. C. & Lee, S. J. Double muscling in cattle due to mutations in the myostatin gene. Proc. Natl Acad. Sci. USA 94, 12457–12461 (1997).
26. Mosher, D. S. et al. A mutation in the myostatin gene increases muscle mass and enhances racing performance in heterozygote dogs. PLoS Genet 3, e79 (2007).
27. Schuelke, M. et al. Myostatin mutation associated with gross muscle hypertrophy in a child. N. Engl. J. Med. 350, 2682–2688 (2004).
28. Tozaki, T. et al. Sequence variants at the myostatin gene locus influence the body composition of Thoroughbred horses. J. Vet. Med. Sci. 73, 1617–1624 (2011).
29. Williamson, S. & Beilharz, R. The inheritance of speed, stamina and other racing performance characters in the Australian Thoroughbred. J. Anim. Breed Genet. 115, 1–16 (1998).
30. Hill, E. W. et al. MSTN genotype (g.66493737C/T) association with speed indices in Thoroughbred racehorses. J. Appl. Physiol. 112, 86–90 (2012).
31. Mackay-Smith, A. The Colonial Quarter Race Horse (Whittet & Shepperson, 1983).
32. McGivney, B. A. et al. Characterization of the equine skeletal muscle transcriptome identifies novel functional responses to exercise training. BMC Genomics 11, 398 (2010).
33. McGivney, B. A. et al. MSTN genotypes in Thoroughbred horses influence skeletal muscle gene expression and racetrack performance. Anim. Genet. (In the Press).
34. Levine, M. Domestication and early history of the horse. In The Domestic Horse (eds Mills, D. & McDonnell, S.) 5–22 (Cambridge University Press, 2005).
35. Bower, M. et al. The cosmopolitan maternal heritage of the Thoroughbred racehorse breed shows a significant contribution from British and Irish Native mares. Biol. Lett. 7, 316–320 (2011).
36. Olsen, S. Early horse domestication: weighing the evidence. In Horses and Humans: The Evolution of Human-Equine Relationships, Vol. 1560 (eds Olsen, S.L., Grant, S., Choyke, A.M. & Bartosiewicz, L.) 81–113 (British Archaeological Reports, International Series Oxford, 2006).
37. Outram, A. et al. The earliest horse harnessing and milking. Science 323, 1332–1335 (2009).
38. Wentworth, L. Thoroughbred Racing Stock (Geo Allen and Unwin, 1960).39. Prior, C. M. Early Records of the Thoroughbred Horse (Sportsman Office, 1924).40. Prior, C. M. The Royal Studs of the Sixteenth and Seventeenth Centuries 213
(Horse & Hound Publications Ltd, London, 1935).

ARTICLE
��
nATuRE CommunICATIons | DoI: 10.1038/ncomms1644
nATuRE CommunICATIons | 3:643 | DoI: 10.1038/ncomms1644 | www.nature.com/naturecommunications
© 2012 Macmillan Publishers Limited. All rights reserved.
41. Campana, M. G. et al. Accurate determination of phenotypic information from historic thoroughbred horses by single base extension. PLoS One 5, e15172 (2010).
42. Willett, P. The Classic Racehorse (University Press of Kentucky, 1982).43. Huggins, M. Flat Racing and British Society, 1790–1914: A Social and Economic
History (Portland or Frank Cass, 2000).44. Vamplew, W. The Turf: A Social and Economic History of Horse Racing (Allen
Lane, 1976).45. Allen, M. et al. Mitochondrial DNA sequencing of shed hairs and saliva
on robbery caps: sensitivity and matching probabilities. J. Forensic Sci. 43, 453–464 (1998).
46. McGahern, A. et al. Mitochondrial DNA sequence diversity in Irish extant horse populations and ancient horses. Anim. Genet. 37, 498–502 (2006).
47. Gilbert, M. et al. Absence of Yersinia pestis-specific DNA in human teeth from five European excavations of putative plague victims. Microbiology 150, 341–354 (2004).
48. Kalmár, T., Bachrati, C., Marcsik, A. & Raskó, I. A simple and efficient method for PCR amplifiable DNA extraction from ancient bones. Nucleic Acids Res. 28, 67–71 (2000).
49. Cooper, A. & Poinar, H. Ancient DNA: do it right or not at all. Science 289, 1139 (2000).
50. Spencer, M. & Howe, C. Authenticity of ancient DNA results: a statistical approach. Am. J. Hum. Genet 75, 240–250 (2004).
51. Bower, M., Spencer, M., Matsumura, S., Nisbet, R. & Howe, C. How many clones need to be sequenced from a single forensic or ancient DNA sample in oder to determine a reliable consensus sequence? Nucleic Acids Res. 33, 2549–2556 (2005).
52. Kumar, S., Tamura, K. & Nei, M. MEGA3: integrated software for molecular evolutionary genetics analysis and sequence alignment. Brief. Bioinform. 5, 150–163 (2004).
53. Higgins, D. et al. CLUSTAL W: improving the sensitivity of progressive multiple sequence alignment through sequence weighting, position-specific gap penalties and weight matrix choice. Nucleic Acids Res. 22, 4673–4680 (1994).
54. MacHugh, D. et al. Early mediaeval cattle remains from a Scandinavian settlement in Dublin: genetic analysis and comparison with extant breeds. Philos. Trans. R Soc Lond. B Biol. Sci. 354, 99–109 (1999).
55. Barrett, J. Haploview: visualization and analysis of SNP genotype data. Cold Spring Harb. Protoc. 2009, pdb.ip71 (2009).
AcknowledgementsWe thank the horse owners for provision of Thoroughbred and modern horsebreed samples; The Donkey Sanctuary, UK, for provision of donkey samples; P. Horin, University of Veterinary and Pharmaceutical Sciences, Brno, Czech Republic, for provision of zebra samples; Animal Health Trust, Newmarket, Blankley Stud, Lincolnshire, Natural History Museum, London, Royal Veterinary College, London, and Zoological Museum, University of Cambridge, Cambridge, for historic Thoroughbred samples. This work was supported by grants from The Horserace Betting Levy Board, McDonald Institute for Archaeological Research and Leverhulme Trust to M.A.B.; by an Overseas Research Studentship, the Cambridge Overseas Trust and Peterhouse College, Cambridge to M.G.C.; and by a Science Foundation Ireland President of Ireland Young Researcher Award (grant number 04/YI1/B539) to E.W.H.
Author contributionsE.W.H. and M.A.B. conceived and designed the experiments. E.W.H. coordinated the different contributions and supervised the study. J.G., B.A.M., C.R.D., M.G.C., F.S., D.G.B., D.E.M. and A.G.F. performed or supervised experiments. M.A.B., E.W.H., B.A.M., C.R.D. and M.G.C. analysed the data. G.L., S.M., L.S.A., G.S. and V.V. provided data. E.W.H. and M.A.B. wrote the paper. All authors read and approved the manuscript.
Additional informationSupplementary Information accompanies this paper at http://www.nature.com/naturecommunications
Competing financial interests: E.W.H and D.E.M. are Directors of Equinome Ltd. E.W.H., J.G., B.A.M. and D.E.M. are named on the applications. Equinome Ltd. has been granted a licence for commercial use of data contained within patent applications: United States Provisional Serial Number 61/136553; Irish Patent Application Number 2008/0735 and 2010/0151; Patent Cooperation Treaty number PCT/IE2009/000062. The PCT publication WO2010/029527A published 18 March 2010. Title: “A method for predicting athletic performance potential” and US publication US2011/0262915 published 27 October 2011. Title: “Method for predicting the athletic performance potential of a subject”.
Reprints and permission information is available online at http://npg.nature.com/reprintsandpermissions/
How to cite this article: Bower, M.A. et al. The genetic origin and history of speed in the Thoroughbred racehorse. Nat. Commun. 3:643 doi: 10.1038/ncomms1644 (2012).