the functional consequences of variation in transcription factor binding
TRANSCRIPT
The Functional Consequences of Variation inTranscription Factor BindingDarren A. Cusanovich1, Bryan Pavlovic1,2, Jonathan K. Pritchard1,2,3*, Yoav Gilad1*
1 Department of Human Genetics, University of Chicago, Chicago, Illinois, United States of America, 2 Howard Hughes Medical Institute, University of Chicago, Chicago,
Illinois, United States of America, 3 Departments of Genetics and Biology and Howard Hughes Medical Institute, Stanford University, Stanford, California, United States of
America
Abstract
One goal of human genetics is to understand how the information for precise and dynamic gene expression programs isencoded in the genome. The interactions of transcription factors (TFs) with DNA regulatory elements clearly play animportant role in determining gene expression outputs, yet the regulatory logic underlying functional transcription factorbinding is poorly understood. Many studies have focused on characterizing the genomic locations of TF binding, yet it isunclear to what extent TF binding at any specific locus has functional consequences with respect to gene expressionoutput. To evaluate the context of functional TF binding we knocked down 59 TFs and chromatin modifiers in one HapMaplymphoblastoid cell line. We then identified genes whose expression was affected by the knockdowns. We intersected thegene expression data with transcription factor binding data (based on ChIP-seq and DNase-seq) within 10 kb of thetranscription start sites of expressed genes. This combination of data allowed us to infer functional TF binding. Using thisapproach, we found that only a small subset of genes bound by a factor were differentially expressed following theknockdown of that factor, suggesting that most interactions between TF and chromatin do not result in measurablechanges in gene expression levels of putative target genes. We found that functional TF binding is enriched in regulatoryelements that harbor a large number of TF binding sites, at sites with predicted higher binding affinity, and at sites that areenriched in genomic regions annotated as ‘‘active enhancers.’’
Citation: Cusanovich DA, Pavlovic B, Pritchard JK, Gilad Y (2014) The Functional Consequences of Variation in Transcription Factor Binding. PLoS Genet 10(3):e1004226. doi:10.1371/journal.pgen.1004226
Editor: Yitzhak Pilpel, Weizmann Institute of Science, Israel
Received October 21, 2013; Accepted January 22, 2014; Published March 6, 2014
Copyright: � 2014 Cusanovich et al. This is an open-access article distributed under the terms of the Creative Commons Attribution License, which permitsunrestricted use, distribution, and reproduction in any medium, provided the original author and source are credited.
Funding: Funded by NIH grant HG006123 to YG and by Howard Hughes Medical Institute funds to JKP. DAC is partially supported by NIH grant T32 GM007197.The funders had no role in study design, data collection and analysis, decision to publish, or preparation of the manuscript.
Competing Interests: The authors have declared that no competing interests exist.
* E-mail: [email protected] (JKP); [email protected] (YG)
Introduction
Understanding the regulatory logic of the genome is critical to
understanding human biology. Ultimately, we aim to be able to
predict the expression pattern of a gene based on its regulatory
sequence alone. However, the regulatory code of the human
genome is much more complicated than the triplet code of protein
coding sequences, and is highly context-specific, depending on
cell-type and other factors [1]. In addition, regulatory regions are
not necessarily organized into discrete, easily identifiable regions of
the genome and may exert their influence on genes over large
genomic distances [2]. Consequently, the rules governing the
sequence specificity as well as the functional output of even the
most common regulatory interactions, such as interactions
between transcription factors and the genome, are not yet fully
understood.
To date, genomic studies addressing questions of the regulatory
logic of the human genome have largely taken one of two
approaches. On the one hand are studies aimed at collecting
transcription factor binding maps using techniques such as ChIP-
seq and DNase-seq [3–6]. These studies are mainly focused on
identifying the specific genomic locations and DNA sequences
associated with transcription factor binding and histone modifica-
tions. On the other hand are studies aimed at mapping various
quantitative trait loci (QTL), such as gene expression levels
(eQTLs) [7], DNA methylation (meQTLs) [8] and chromatin
accessibility (dsQTLs) [9]. These studies are mainly focused on
identifying specific genetic variants that functionally impact gene
regulation. Cumulatively, binding map studies and QTL map
studies have led to many insights into the principles and
mechanisms of gene regulation [7,10–12].
However, there are questions that neither mapping approach on
its own is well equipped to address. One outstanding issue is the
fraction of factor binding in the genome that is ‘‘functional’’,
which we define here to mean that disturbing the protein-DNA
interaction leads to a measurable downstream effect on gene
regulation. (Note that we do not concern ourselves with the
question of whether the regulatory outcome and/or the interaction
are evolving under natural selection). An experimental technique
that could help address this issue is transcription factor knock-
down. In knockdown experiments, the RNA interference pathway
is employed to greatly reduce the expression level of a specific
target gene by using small interfering RNAs (siRNAs). The cellular
or organismal response to the knockdown can then be measured
(e.g. [13]). Instead of measuring a cellular phenotype, one can
collect RNA after the knockdown and measure global changes in
gene expression patterns after specifically attenuating the expres-
sion level of a given factor.
Combining a TF knockdown approach with TF binding data
can help us to distinguish functional binding from non-functional
PLOS Genetics | www.plosgenetics.org 1 March 2014 | Volume 10 | Issue 3 | e1004226

binding. This approach has previously been applied to the study of
human TFs (e.g. [14–16]), although for the most part studies have
only focused on the regulatory relationship of a single factor with
its downstream targets. The FANTOM consortium previously
knocked down 52 different transcription factors in the THP-1 cell
line [17], an acute monocytic leukemia-derived cell line, and used
a subset of these knockdowns to validate certain regulatory
predictions based on binding motif enrichments [18]. However,
the amount of transcription factor binding information available
for the THP-1 cell line is limited (it is not a part of the ENCODE
reference lines).
Many groups, including our own, have previously studied the
regulatory architecture of gene expression in the model system of
HapMap lymphoblastoid cell lines (LCLs) using both binding map
strategies [3,19,20] and QTL mapping strategies [7,9]. As a
complement to that work, we sought to use knockdown
experiments targeting transcription factors in a HapMap LCL to
refine our understanding of the gene regulatory circuitry of the
human genome. We integrated the results of the knockdown
experiments with previous data on transcription factor binding to
better characterize the regulatory targets of 59 different factors
and to learn when a disruption in transcription factor binding is
most likely to be associated with variation in the expression level of
a nearby gene.
Results
Our goal was to better characterize gene regulation by
transcription factors (TFs). To do so, we measured the impact
that knocking down the expression level of TFs and chromatin
modifiers had on global gene expression levels in a single HapMap
LCL (GM19238). As a first step, we used a high-throughput
pipeline to screen siRNAs targeting 112 TFs for their efficiency in
knocking down the target transcript (see Table S1 for a list of
factors) to identify factors that were knocked down by at least 50%.
We evaluated the knockdown efficiency using qPCR to measure
transcript levels of the targeted gene in RNA samples extracted
48 hours after the siRNA transfection. Based on the qPCR results,
we chose to focus on 59 TFs and chromatin modifiers, which were
effectively knocked down using our approach (see Methods for
specific details).
We repeated the knockdown experiment for the 59 factors in
triplicate, and collected RNA 72 hours after transfection for gene
expression analysis using Illumina HT-12 microarrays. This time
point was chosen to provide ample time for the transcript
knockdown to impact the protein level of the targeted factor
[21,22]. All factors were knocked down in independent cultures of
the same LCL. Gene expression levels following the knockdown
were compared to expression data collected from six samples that
were transfected with negative control siRNA. The expression
data from all samples were normalized together using quantile
normalization followed by batch correction using the RUV-2
method. We then performed several quality control analyses to
confirm that the quality of the data was high, that there were no
outlier samples, and that the normalization methods reduced the
influence of confounders as much as possible (see Methods, Table
S2 and Figures S1, S2, S3, S4, S5). Following these steps, we were
able to consider expression data for 7,139–8,249 genes (depending
on the TF knockdown experiment) that showed detectable
expression on all of the knockdown arrays or all of the control
arrays (Figure S6). In order to identify genes that were expressed at
a significantly different level in the knockdown samples compared
to the negative controls, we used likelihood-ratio tests within the
framework of a fixed effect linear model (Figure 1, see Methods for
details).
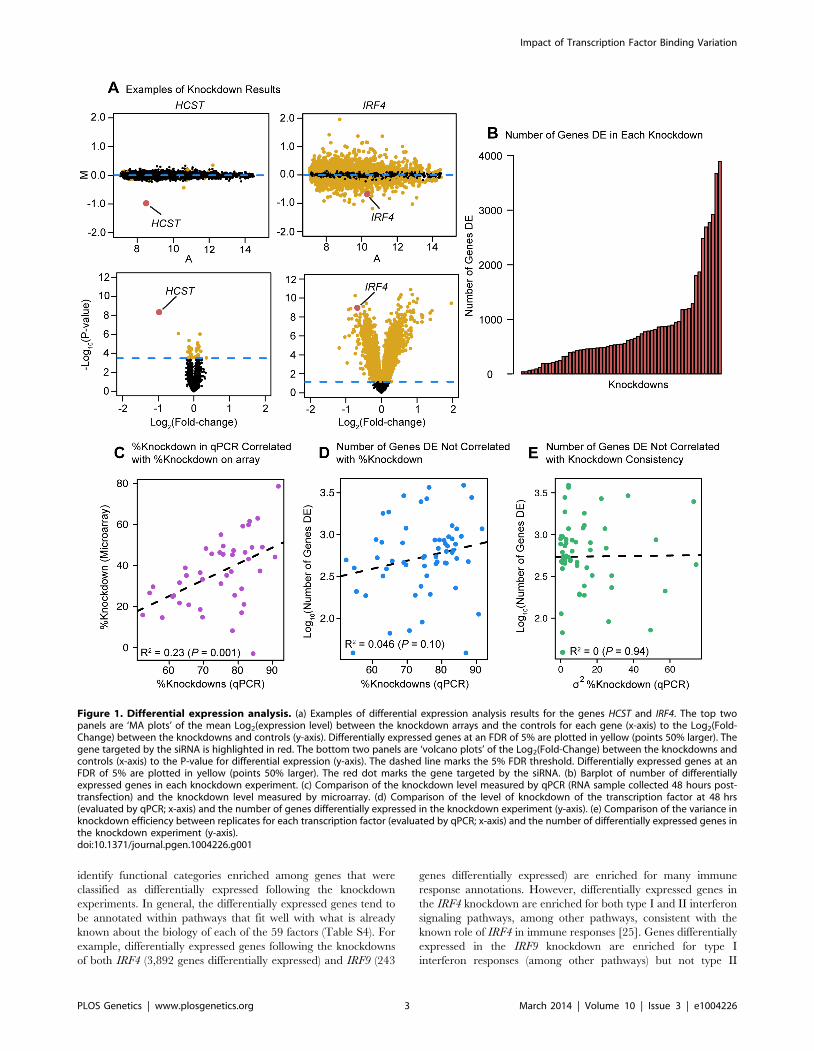
Knockdown effect on global gene expression levelsFollowing normalization and quality control of the arrays, we
identified genes that were differentially expressed between the
three knockdown replicates of each factor and the six controls.
Depending on the factor targeted, the knockdowns resulted in
between 39 and 3,892 differentially expressed genes at an FDR of
5% (Figure 1B; see Table S3 for a summary of the results). The
knockdown efficiency for the 59 factors ranged from 50% to 90%
(based on qPCR; Table S1). The qPCR measurements of the
knockdown level were significantly correlated with estimates of the
TF expression levels based on the microarray data (P = 0.001;
Figure 1C). Reassuringly, we did not observe a significant
correlation between the knockdown efficiency of a given factor
and the number of genes classified as differentially expressed
following the knockdown experiment (this was true whether we
estimated the knockdown effect based on qPCR (P = 0.10;
Figure 1D) or microarray (P = 0.99; not shown) data. Nor did
we observe a correlation between variance in qPCR-estimated
knockdown efficiency (between replicates) and the number of
genes differentially expressed (P = 0.94; Figure 1E). We noticed
that the large variation in the number of differentially expressed
genes extended even to knockdowns of factors from the same gene
family. For example, knocking down IRF4 (with a knockdown
efficiency of 86%) resulted in 3,892 differentially expressed genes
(including IRF4), while knocking down IRF3 (with a knockdown
efficiency of 91%), a paralog of IRF4 [23], only significantly
affected the expression of 113 genes (including IRF3).
Because we knocked down 59 different factors in this
experiment we were able to assess general patterns associated
with the perturbation of transcription factors beyond merely the
number of affected target genes. Globally, despite the range in the
number of genes we identified as differentially expressed in each
knockdown, the effect sizes of the differences in expression were
relatively modest and consistent in magnitude across all knock-
downs. The median effect size for genes classified as differentially
expressed at an FDR of 5% in any knockdown was a 9.2%
difference in expression level between the controls and the
knockdown (Figure 2), while the median effect size for any
individual knockdown experiment ranged between 8.1% and
11.0%.
To further evaluate the biological implications of our observa-
tions, we used the Gene Ontology (GO) [24] annotations to
Author Summary
An important question in genomics is to understand how aclass of proteins called ‘‘transcription factors’’ controls theexpression level of other genes in the genome in a cell-type-specific manner – a process that is essential to humandevelopment. One major approach to this problem is tostudy where these transcription factors bind in thegenome, but this does not tell us about the effect of thatbinding on gene expression levels and it is generallyaccepted that much of the binding does not stronglyinfluence gene expression. To address this issue, weartificially reduced the concentration of 59 differenttranscription factors in the cell and then examined whichgenes were impacted by the reduced transcription factorlevel. Our results implicate some attributes that mightinfluence what binding is functional, but they also suggestthat a simple model of functional vs. non-functionalbinding may not suffice.
Impact of Transcription Factor Binding Variation
PLOS Genetics | www.plosgenetics.org 2 March 2014 | Volume 10 | Issue 3 | e1004226
identify functional categories enriched among genes that were
classified as differentially expressed following the knockdown
experiments. In general, the differentially expressed genes tend to
be annotated within pathways that fit well with what is already
known about the biology of each of the 59 factors (Table S4). For
example, differentially expressed genes following the knockdowns
of both IRF4 (3,892 genes differentially expressed) and IRF9 (243
genes differentially expressed) are enriched for many immune
response annotations. However, differentially expressed genes in
the IRF4 knockdown are enriched for both type I and II interferon
signaling pathways, among other pathways, consistent with the
known role of IRF4 in immune responses [25]. Genes differentially
expressed in the IRF9 knockdown are enriched for type I
interferon responses (among other pathways) but not type II
Figure 1. Differential expression analysis. (a) Examples of differential expression analysis results for the genes HCST and IRF4. The top twopanels are ‘MA plots’ of the mean Log2(expression level) between the knockdown arrays and the controls for each gene (x-axis) to the Log2(Fold-Change) between the knockdowns and controls (y-axis). Differentially expressed genes at an FDR of 5% are plotted in yellow (points 50% larger). Thegene targeted by the siRNA is highlighted in red. The bottom two panels are ‘volcano plots’ of the Log2(Fold-Change) between the knockdowns andcontrols (x-axis) to the P-value for differential expression (y-axis). The dashed line marks the 5% FDR threshold. Differentially expressed genes at anFDR of 5% are plotted in yellow (points 50% larger). The red dot marks the gene targeted by the siRNA. (b) Barplot of number of differentiallyexpressed genes in each knockdown experiment. (c) Comparison of the knockdown level measured by qPCR (RNA sample collected 48 hours post-transfection) and the knockdown level measured by microarray. (d) Comparison of the level of knockdown of the transcription factor at 48 hrs(evaluated by qPCR; x-axis) and the number of genes differentially expressed in the knockdown experiment (y-axis). (e) Comparison of the variance inknockdown efficiency between replicates for each transcription factor (evaluated by qPCR; x-axis) and the number of differentially expressed genes inthe knockdown experiment (y-axis).doi:10.1371/journal.pgen.1004226.g001
Impact of Transcription Factor Binding Variation
PLOS Genetics | www.plosgenetics.org 3 March 2014 | Volume 10 | Issue 3 | e1004226

responses, which is again consistent with the known biology [26].
As another example, knocking down SREBF2 (1,286 genes
differentially expressed), a key regulator of cholesterol homeostasis
[27], results in changes in the expression of genes that are
significantly enriched for cholesterol and sterol biosynthesis
annotations. While not all factors exhibited striking enrichments
for relevant functional categories and pathways, the overall picture
is that perturbations of many of the factors primarily affected
pathways consistent with their known biology.
A combined analysis of factor binding and geneexpression data
In order to assess functional TF binding, we next incorporated
binding maps together with the knockdown expression data. In
particular, we combined binding data based on DNase-seq
footprints in 70 HapMap LCLs, reported by Degner et al. [9]
(Table S5) and from ChIP-seq experiments in LCL GM12878,
published by ENCODE [3]. We were thus able to obtain genome-
wide binding maps for a total of 131 factors that were either
directly targeted by an siRNA in our experiment (29 factors) or
were differentially expressed in one of the knockdown experiments
(see Methods for more details). We classified a gene as a bound
target of a particular factor when binding of that factor was
inferred within 10kb of the transcription start site (TSS) of the
target gene. Using this approach, we found that the 131 TFs were
bound in proximity to a median of 1,922 genes per factor (range
11 to 7,053 target genes; Figure S7A; only the 8,872 genes
expressed in at least one knockdown experiment were considered
for this analysis). Target genes were bound by a median of 34
different factors (range 0 to 96; Figure S7B; only 288 genes
expressed in our experiments were not classified as bound targets
of any of the 131 factors considered).
We considered binding of a factor to be functional if the target
gene was differentially expressed after perturbing the expression
level the bound transcription factor. We then asked about the
concordance between the transcription factor binding data and the
knockdown expression data. Specifically, we studied the extent to
which differences in gene expression levels following the knock-
downs might be predicted by binding of the transcription factors
within the putative regulatory regions of the responsive genes.
Likewise, we asked what proportion of putative target (bound)
genes of a given TF were also differentially expressed following the
knockdown of the factor.
We performed this analysis in two stages. First, we only
considered binding data for the specific TF that was knocked down
in each experiment (binding data was available for 29 different
factors). In general, we found that the number of differentially
expressed genes following the knockdowns was positively corre-
lated with the number of bound target genes by these 29 factors
(Spearman’s r= 0.45; permutation P = 0.015). For 12 of the 29
knockdowns, we observed significant overlaps between binding
and differential expression (Fisher’s exact test; P,0.05). We also
found that between 3.4–75.9% (median = 32.3%) of differentially
expressed genes were bound by the TF in a given knockdown
(mean relative enrichment = 1.08). Perhaps somewhat less expect-
ed, we found that between 46.4% and 99.1% (median = 88.9%) of
the binding was apparently not functional, namely it was not
associated with changes in gene expression levels. This observation
is robust with respect to the size of the window we used to classify
genes as bound by a factor (range 1–20 kb from the TSS; Table
S6). It is also consistent with our previous findings that most
DNase-I sensitive QTLs are not also classified as eQTLs [9].
We next considered the expression data in the context of the
binding data for both the knocked down TFs and any other TF
whose expression level was indirectly affected by the knockdown.
We again examined the overlap between binding and differential
expression (Figure 3). Considering only the expressed genes in
each experiment, the fraction of genes bound (by any TF whose
expression has changed) ranged between 16.2% and 95.3% with a
median of 85.4% (Figure 3B). However, the fraction of bound
genes that were also differentially expressed in a given experiment
was generally quite low (median = 7.9%; Figure 3C; mean relative
enrichment = 1.02), with significant (P,0.05) overlap between
bound and differentially expressed genes seen for only 13 of the 59
knockdown experiments. Even if we relaxed the statistical
threshold with which we classify genes as differentially expressed
four-fold (to an FDR of 20%), a majority of bound genes still failed
to show significant evidence of differential expression (medi-
an = 68.8%; Figure 3C; mean relative enrichment = 1.01). The
discrepancy in the number of genes bound by a particular factor
(or the TFs it regulates) and the number of differentially expressed
genes in a knockdown experiment begged the question of whether
any characteristics of factor binding might distinguish functionally
bound target genes. In order to address this question, we examined
a variety of features.
Functional factor binding is enriched in enhancerchromatin states
First, focusing only on the binding sites classified using the
DNase-seq data (which were assigned to a specific instance of the
binding motif, unlike the ChIP data), we examined sequence
features that might distinguish functional binding. In particular,
we considered whether binding at conserved sites was more likely
to be functional (estimating conservation by using PhastCons 46
way placental scores [28]) and we also considered whether binding
sites that better matched the known PWM for the factor were
more likely to be functional. Interestingly, we did not observe a
significant shift in the conservation of functional binding sites
(Wilcoxon rank sum P = 0.34), but we did observe that binding
around differentially expressed genes occurred at sites that were
significantly better matches to the canonical binding motif
Figure 2. Effect sizes for differentially expressed genes.Boxplots of absolute Log2(fold-change) between knockdown arraysand control arrays for all genes identified as differentially expressed ineach experiment. Outliers are not plotted. The gray bar indicates theinterquartile range across all genes differentially expressed in allknockdowns. Boxplots are ordered by the number of genes differen-tially expressed in each experiment. Outliers were not plotted.doi:10.1371/journal.pgen.1004226.g002
Impact of Transcription Factor Binding Variation
PLOS Genetics | www.plosgenetics.org 4 March 2014 | Volume 10 | Issue 3 | e1004226

(P,1028), although the absolute difference in PWM score was
very small.
Next, considering bound targets determined from either the
ChIP-seq or DNase-seq data, we observed that differentially
expressed genes were associated with both a higher number of
binding events for the relevant factors within 10 kb of the TSS
(P,10216; Figure 4A) as well as with a larger number of different
binding factors (considering the siRNA-targeted factor and any TFs
that were DE in the knockdown; P,10216; Figure 4B). We hoped to
distinguish between coordinated co-regulation of the factors and
generally higher levels of binding nearby differentially expressed
genes. To do so, we asked whether the genes differentially expressed
in common between any two knockdown experiments were more
likely to be co-occupied by the same transcription factors
(considering only transcription factors whose expression was
affected by the knockdown). Binning all pairwise comparisons
between knockdown experiments based on the fraction of
differentially expressed transcription factors in common, we
observed that enrichment for functional co-occupancy increased
proportionally to the fraction of TFs in common (Figure 4C). This
suggests that co-regulation is at least partially responsible for the
increased numbers of factors binding near differentially expressed
genes.
We proceeded by examining the distribution of binding about
the TSS. Most factor binding was concentrated near the TSS
whether or not the genes were classified as differentially expressed
(Figure 5A). However, surprisingly, the distance from the TSS to
the binding sites was significantly longer for differentially expressed
genes (P,10216; Fig. 5B). We then investigated the distribution of
factor binding across various chromatin states, as defined by Ernst
et al. [11]. This dataset lists regions of the genome that have been
assigned to different activity states based on ChIP-seq data for
various histone modifications and CTCF binding. For each
knockdown, we separated binding events by the genomic state in
which they occurred and then tested whether binding in that state
was enriched around differentially expressed genes. After correct-
ing for multiple testing, 19 knockdowns showed significant
enrichment for binding in ‘‘strong enhancers’’ around genes that
were differentially expressed and four knockdowns had significant
enrichments for ‘‘weak enhancers’’. Further, eight knockdowns
showed significant depletion of binding in ‘‘active promoters’’ of
genes that were differentially expressed and six knockdowns had
significant depletions for ‘‘transcription elongation’’.
The direction of expression changeFinally, we asked whether the factors tended to have a
consistent effect (either up- or down-regulation) on the expression
levels of genes they purportedly regulated. Perhaps surprisingly,
all factors we tested are associated with both up- and down-
regulation of downstream targets (Figure 6). A slight majority of
Figure 3. Intersecting binding data and expression data for each knockdown. (a) Example Venn diagrams showing the overlap of bindingand differential expression for the knockdowns of HCST and IRF4 (the same genes as in Figure 1). (b) Boxplot summarizing the distribution of thefraction of all expressed genes that are bound by the targeted gene or downstream factors. (c) Boxplot summarizing the distribution of the fraction ofbound genes that are classified as differentially expressed, using an FDR of either 5% or 20%.doi:10.1371/journal.pgen.1004226.g003
Impact of Transcription Factor Binding Variation
PLOS Genetics | www.plosgenetics.org 5 March 2014 | Volume 10 | Issue 3 | e1004226
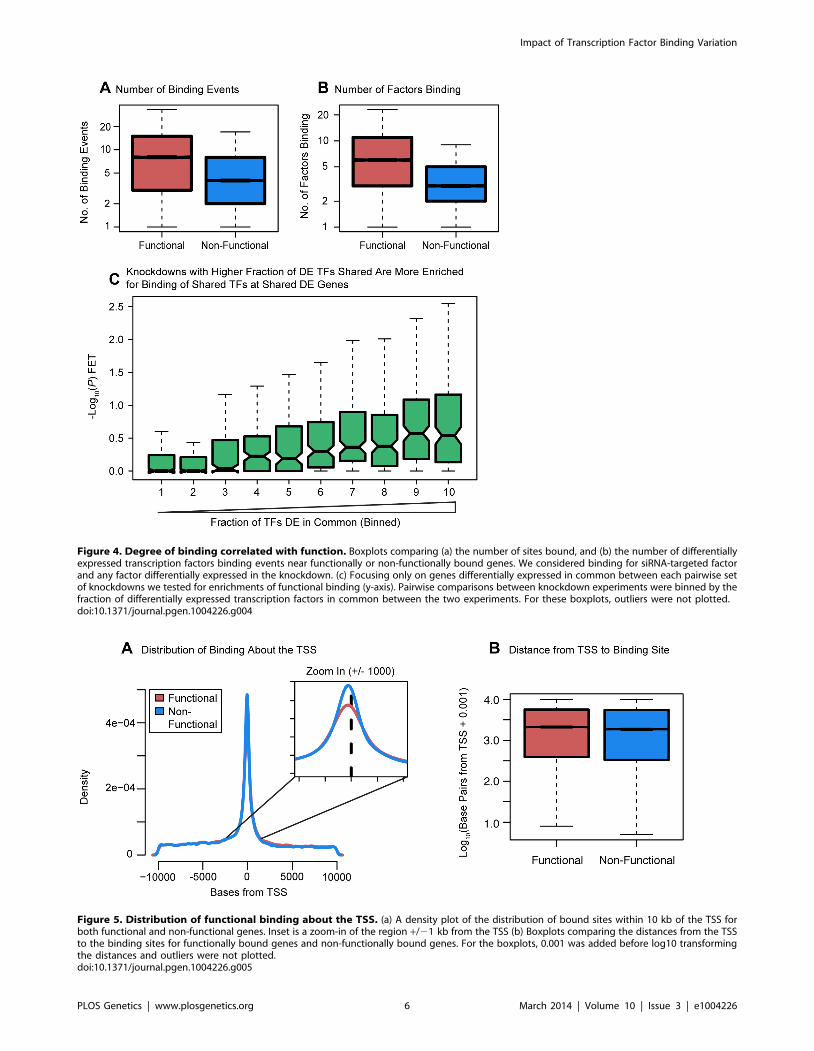
Figure 4. Degree of binding correlated with function. Boxplots comparing (a) the number of sites bound, and (b) the number of differentiallyexpressed transcription factors binding events near functionally or non-functionally bound genes. We considered binding for siRNA-targeted factorand any factor differentially expressed in the knockdown. (c) Focusing only on genes differentially expressed in common between each pairwise setof knockdowns we tested for enrichments of functional binding (y-axis). Pairwise comparisons between knockdown experiments were binned by thefraction of differentially expressed transcription factors in common between the two experiments. For these boxplots, outliers were not plotted.doi:10.1371/journal.pgen.1004226.g004
Figure 5. Distribution of functional binding about the TSS. (a) A density plot of the distribution of bound sites within 10 kb of the TSS forboth functional and non-functional genes. Inset is a zoom-in of the region +/21 kb from the TSS (b) Boxplots comparing the distances from the TSSto the binding sites for functionally bound genes and non-functionally bound genes. For the boxplots, 0.001 was added before log10 transformingthe distances and outliers were not plotted.doi:10.1371/journal.pgen.1004226.g005
Impact of Transcription Factor Binding Variation
PLOS Genetics | www.plosgenetics.org 6 March 2014 | Volume 10 | Issue 3 | e1004226
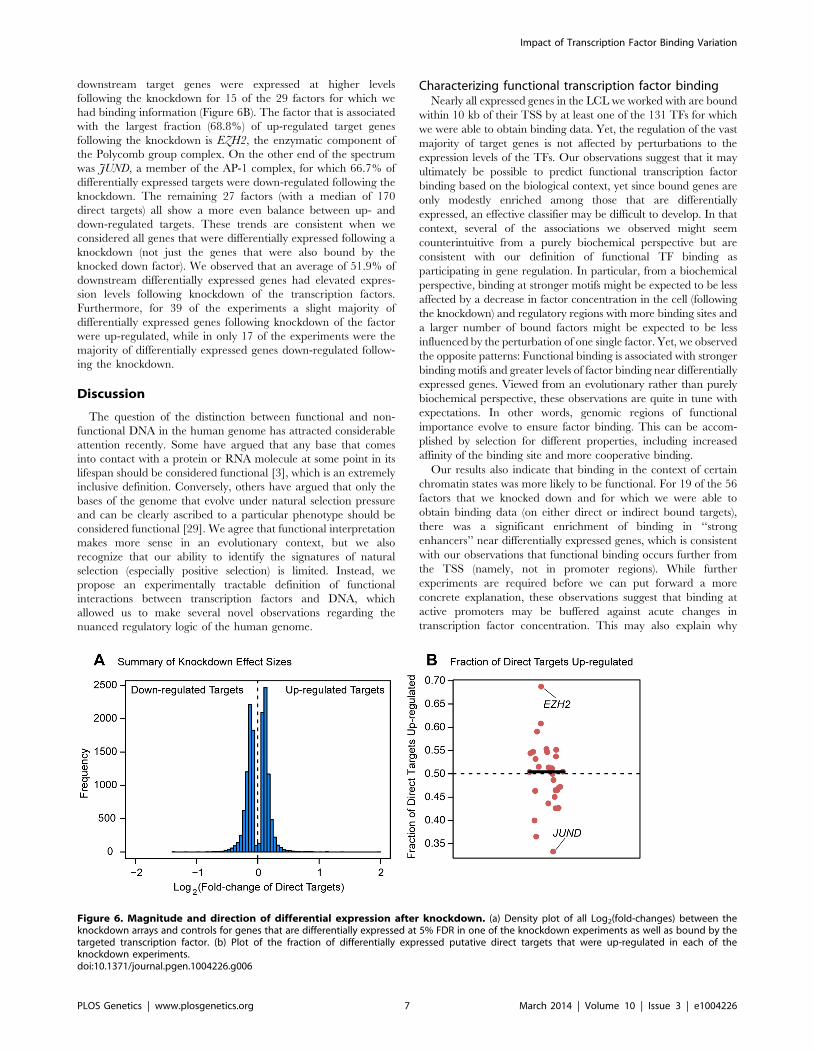
downstream target genes were expressed at higher levels
following the knockdown for 15 of the 29 factors for which we
had binding information (Figure 6B). The factor that is associated
with the largest fraction (68.8%) of up-regulated target genes
following the knockdown is EZH2, the enzymatic component of
the Polycomb group complex. On the other end of the spectrum
was JUND, a member of the AP-1 complex, for which 66.7% of
differentially expressed targets were down-regulated following the
knockdown. The remaining 27 factors (with a median of 170
direct targets) all show a more even balance between up- and
down-regulated targets. These trends are consistent when we
considered all genes that were differentially expressed following a
knockdown (not just the genes that were also bound by the
knocked down factor). We observed that an average of 51.9% of
downstream differentially expressed genes had elevated expres-
sion levels following knockdown of the transcription factors.
Furthermore, for 39 of the experiments a slight majority of
differentially expressed genes following knockdown of the factor
were up-regulated, while in only 17 of the experiments were the
majority of differentially expressed genes down-regulated follow-
ing the knockdown.
Discussion
The question of the distinction between functional and non-
functional DNA in the human genome has attracted considerable
attention recently. Some have argued that any base that comes
into contact with a protein or RNA molecule at some point in its
lifespan should be considered functional [3], which is an extremely
inclusive definition. Conversely, others have argued that only the
bases of the genome that evolve under natural selection pressure
and can be clearly ascribed to a particular phenotype should be
considered functional [29]. We agree that functional interpretation
makes more sense in an evolutionary context, but we also
recognize that our ability to identify the signatures of natural
selection (especially positive selection) is limited. Instead, we
propose an experimentally tractable definition of functional
interactions between transcription factors and DNA, which
allowed us to make several novel observations regarding the
nuanced regulatory logic of the human genome.
Characterizing functional transcription factor bindingNearly all expressed genes in the LCL we worked with are bound
within 10 kb of their TSS by at least one of the 131 TFs for which
we were able to obtain binding data. Yet, the regulation of the vast
majority of target genes is not affected by perturbations to the
expression levels of the TFs. Our observations suggest that it may
ultimately be possible to predict functional transcription factor
binding based on the biological context, yet since bound genes are
only modestly enriched among those that are differentially
expressed, an effective classifier may be difficult to develop. In that
context, several of the associations we observed might seem
counterintuitive from a purely biochemical perspective but are
consistent with our definition of functional TF binding as
participating in gene regulation. In particular, from a biochemical
perspective, binding at stronger motifs might be expected to be less
affected by a decrease in factor concentration in the cell (following
the knockdown) and regulatory regions with more binding sites and
a larger number of bound factors might be expected to be less
influenced by the perturbation of one single factor. Yet, we observed
the opposite patterns: Functional binding is associated with stronger
binding motifs and greater levels of factor binding near differentially
expressed genes. Viewed from an evolutionary rather than purely
biochemical perspective, these observations are quite in tune with
expectations. In other words, genomic regions of functional
importance evolve to ensure factor binding. This can be accom-
plished by selection for different properties, including increased
affinity of the binding site and more cooperative binding.
Our results also indicate that binding in the context of certain
chromatin states was more likely to be functional. For 19 of the 56
factors that we knocked down and for which we were able to
obtain binding data (on either direct or indirect bound targets),
there was a significant enrichment of binding in ‘‘strong
enhancers’’ near differentially expressed genes, which is consistent
with our observations that functional binding occurs further from
the TSS (namely, not in promoter regions). While further
experiments are required before we can put forward a more
concrete explanation, these observations suggest that binding at
active promoters may be buffered against acute changes in
transcription factor concentration. This may also explain why
Figure 6. Magnitude and direction of differential expression after knockdown. (a) Density plot of all Log2(fold-changes) between theknockdown arrays and controls for genes that are differentially expressed at 5% FDR in one of the knockdown experiments as well as bound by thetargeted transcription factor. (b) Plot of the fraction of differentially expressed putative direct targets that were up-regulated in each of theknockdown experiments.doi:10.1371/journal.pgen.1004226.g006
Impact of Transcription Factor Binding Variation
PLOS Genetics | www.plosgenetics.org 7 March 2014 | Volume 10 | Issue 3 | e1004226
most of the effect sizes associated with differences in gene
expression levels following the knockdowns were relatively modest.
While there is compelling evidence for our inferences, the current
chromatin functional annotations do not fully explain the
regulatory effects of the knockdown experiments. For example,
the enrichments for binding in ‘‘strong enhancer’’ regions of the
genome range from 7.2% to 50.1% (median = 19.2%), much
beyond what is expected by chance alone, but far from accounting
for all functional binding.
Previous studies in model organisms suggested redundancy as a
partial explanation for the common observation of non-functional
TF binding. For example, Gitter et al. examined similar themes
using gene expression data from yeast in which transcription
factors had been knocked out [30]. They found that factors
without identifiable paralogs were more likely to have a regulatory
affect on bound targets than factors with identifiable paralogs,
which can potentially have overlapping functions. We considered
a similar explanation for our observations. To do so, we used
Ensembl’s definition of paralogs [31] to stratify the 29 factors that
we knocked down, and for which we also had direct binding data,
by the number of identifiable paralogs each had (range 1–5). We
found no correlation between the number of paralogs and the
fraction of bound targets that were differentially expressed. We
also did not observe a significant correlation when we considered
whether the percent identity of the closest paralog might be
predicative of the fraction of bound genes that were differentially
expressed following the knockdown (Figure S8).
Evaluating the impact of transcription factor binding ondirect targets
In addition to considering the distinguishing characteristics of
functional binding, we also examined the direction of effect that
perturbing a transcription factor had on the expression level of its
direct targets. We specifically addressed whether knocking down a
particular factor tended to drive expression of its putatively direct
(namely, bound) targets up or down, which can be used to infer
that the factor represses or activates the target, respectively.
Transcription factors have traditionally been thought of primarily
as activators [11,32,33], and previous work from our group is
consistent with that notion [9]. Surprisingly, the most straightfor-
ward inference from the present study is that many of the factors
function as repressors at least as often as they function as
activators. For example, we inferred that EZH2 had a negative
regulatory relationship with the largest fraction of direct targets
(68.8%), while JUND seemed to have a positive regulatory
relationship with the largest fraction of direct targets (66.7%).
These particular observations seem consistent with the known role
of EZH2 as the active member of the Polycomb group complex
PC2 [34] and the biochemical characterization of the AP-1
complex (of which JUND is a component) as a transactivator [35].
More generally, however, our results, combined with the previous
work from our group and others (e.g. [9,11]) make for a
complicated view of the role of transcription factors in gene
regulation as it seems difficult to reconcile the inference from
previous work that many transcription factors should primarily act
as activators with the results presented here.
One somewhat complicated hypothesis, which nevertheless can
resolve the apparent discrepancy, is that the ‘‘repressive’’ effects
we observe for known activators may be at sites in which the
activator is acting as a weak enhancer of transcription and that
reducing the cellular concentration of the factor releases the
regulatory region to binding by an alternative, stronger activator.
We believe that this may alleviate the apparently contradictory
interpretations of transcription factor activity, although additional
work on this topic is needed.
Possible caveats and future studiesThere are important caveats that should be kept in mind when
interpreting our results. Care must be taken in interpreting the
lack of evidence for gene expression differences in our system as
previous studies have suggested that the specific effects of
knockdowns may be difficult to detect because of redundancy in
gene regulatory mechanisms [36,37]. In addition, our definition of
target genes, which is based on genomic proximity, is certain to be
somewhat noisy. For some genes, we are undoubtedly assigning
irrelevant binding while for others we are missing true regulatory
interactions that may occur further than 10 kb from the
transcription start site. Moreover, we only considered binding
and expression in one set of conditions (one cell type at one
timepoint). Some binding events may require co-factors that are
only present after specific stimuli in order to become functional or
may otherwise be functional in other contexts. Because of all of
this, we are likely underestimating the fraction of bound genes that
are functionally regulated. We have taken measures to control for
this as much as possible. First, integrating our results with binding
data allows us to focus our analysis on the most likely direct
targets. Second, the consistency of our results across a variety of
factors (including factors with very different numbers of differen-
tially expressed genes following the knockdown), suggests that
technical explanations for our observations are unlikely.
To more explicitly address the effect that our proximity-based
definition of target genes might have on our analyses, we
reanalyzed the overlap between factor binding and differential
expression following the knockdowns using an independent,
empirically determined set of target genes. Specifically, Thurman
et al. used correlations in DNase hypersensitivity between
intergenic hypersensitive sites and promoter hypersensitive sites
across diverse tissues in order to assign intergenic regulatory
regions to specific genes, independently of proximity to a
particular promoter [38]. We thus performed an alternative
analysis in which we assigned binding events to genes based on the
classification of Thurman et al. We then considered the overlap
between binding and differential expression in this new dataset.
The results were largely consistent with our proximity-based
observations. A median of 9.5% of genes that were bound by a
factor were also differentially expressed following the knockdown
of that factor (compared to 11.1% when the assignment of binding
sites to genes is based on proximity). From the opposite
perspective, a median of 28.0% of differentially expressed genes
were bound by that factor (compared to 32.3% for the proximity-
based definition). The results of this analysis are summarized in
Table S7.
Another practical limitation of our study design is the choice of
microarrays instead of a more advanced technology such as RNA-
seq. As a result of this choice, the expression of only the genes
represented by probes on the arrays could be measured. In
addition, alternative splicing events and novel transcription were
not measured in our experiments. Furthermore, microarrays are
known to have sensitivity issues at the extreme ranges of expression
levels (although this will only affect a small subset of transcripts)
[39]. Because of this, our results should not be considered a
comprehensive census of regulatory events in the human genome.
Instead, we adopted a gene-centric approach, focusing only on
binding events near the genes for which we could measure
expression to learn some of the principles of functional transcrip-
tion factor binding.
Impact of Transcription Factor Binding Variation
PLOS Genetics | www.plosgenetics.org 8 March 2014 | Volume 10 | Issue 3 | e1004226
In light of our observations a reassessment of our estimates of
binding may be warranted. In particular, because functional
binding is skewed away from promoters (our system is apparently
not well-suited to observe functional promoter binding, perhaps
because of protection by large protein complexes), a more
conservative estimate of the fraction of binding that is indeed
functional would not consider data within the promoter.
Importantly, excluding the putative promoter region from our
analysis (i.e. only considering a window .1 kb from the TSS and
,10 kb from the TSS) does not change our conclusions.
Considering this smaller window, a median of 67.0% of expressed
genes are still classified as bound by either the knocked down
transcription factor or a downstream factors that is differentially
expressed in each experiment, yet a median of only 8.1% of the
bound genes are also differentially expressed after the knockdowns.
Further work in this field is clearly justified. Much of what
distinguishes functional binding (as we define it) has yet to be
explained. Furthermore, we are unable to explain much of the
differential expression observed in our experiments by the
presence of least one relevant binding event. This may not be
altogether surprising, as we are only considering binding in a
limited window around the transcription start site. To address
these issues, more factors should be perturbed to further evaluate
the robustness of our results and to add insight. Together, such
studies will help us develop a more sophisticated understanding of
functional transcription factor binding in particular, the gene
regulatory logic more generally.
Methods
Cell culture and siRNA transfectionsThe cell line (GM19238) was cultured at 5% CO2 and 37uC in
RPMI 1640 medium supplemented with 2 mM L-glutamine and
15% fetal bovine serum, per Coriell’s recommendations (http://ccr.
coriell.org/Sections/Support/Global/Lymphoblastoid.aspx?PgId
= 213). The medium was also supplemented with 100 IU/ml
penicillin and 100 mg/ml streptomycin. Cells were counted and split
three times a week to 350,000 cells/ml. Transfections were
performed with the Lonza 96-well nucleofector system, using
transfection solution SF and transfection program DN-100. On-
Target SmartPool siRNAs from Dharmacon were used to
knockdown target genes. For each transfection, one million cells
were transfected with 50 pmol siRNA. After transfection, cells were
plated in 1 ml of medium in 96-well plates and incubated for 48. At
the 48 hour time point, 500 ml of cell culture were removed for
RNA extraction (for qPCR), 100 ml of fresh medium was added to
each well and plates were incubated for an additional 24 hours. At
the 72 hour time point, the remaining culture was pelleted for RNA
extraction (for array hybridization). RNA from all timepoints was
extracted using the RNeay Plus 96 kit (Qiagen). The control siRNAs
consisted of a pool of four siRNAs specifically designed not to target
any human or mouse gene. In addition to two replicates of the
negative control pool, we also transfected each of the negative
control siRNAs independently for a total of six negative control
samples. We learned from an initial pilot experiment that there were
strong batch effects between rounds of transfection and so we
included negative control transfection in parallel with all three
batches of transfection.
The transfections were conducted in two phases. For the first
phase, we screened siRNAs for their knockdown efficiency under
our experimental conditions by transfecting cells and extracting
RNA 48 hours later. qPCR was performed with SYBR Green and
custom primers (Table S1). Knockdown efficiency was assessed
relative to a sample transfected with the negative control siRNA
pool. We used a relative quantification approach, referencing the
POLR2C control gene and using the DART-PCR method [40] to
determine PCR efficiency. For the second phase, those siRNA
transfections resulting in $50% knockdown (arbitrary cutoff) were
transfected again and RNA was extracted at both 48 hours (to
confirm the knockdown level by qPCR) and 72 hours (for
hybridization to microarrays). Two genes (NFYC and ZHX2) were
not knocked down by 50% in the screen but were included in the
final transfection where they did reach 50% (in all three replicates)
and were therefore included in the microarray experiment.
Additionally, 16 factors that passed the screen were not knocked
down by 50% at 48 hours in all three replicates in the final
transfection and were not included in the microarray experiment
(Table S1). The quality and concentration of all RNA samples
were measured using the Agilent 2100 Bioanalyzer.
Transcription factors and chromatin modifiers targetedby siRNA
ARNTL2, BATF, BCL3, CEBPG, CEBPZ, CLOCK, CREBBP,
DIP2B, E2F1, E2F4, E2F6, EP300, ESRRA, EZH2, FOXA3,
GTF2B, HCST, HOXB7, IKZF3, IRF3, IRF4, IRF5, IRF7, IRF8,
IRF9, JUND, KLF13, LCORL, NFE2L1, NFKB2, NFX1, NFYC,
NR1D2, NR2F6, NR3C1, PAX5, POU2F1, POU2F2, RAD21,
RDBP, RELA, RELB, RXRA, SKIL, SP1, SP3, SREBF2, STAT2,
STAT6, TAF1, TCF12, TFDP1, TFDP2, TFE3, USF1, WHSC1,
YY1, ZBTB38, ZHX2.
Gene expression arrays and normalizationSamples were hybridized to Illumina HT-12 v4R2 arrays in two
batches. For the first batch, 69 samples (150 ng of total RNA),
representing 21 knockdowns and one set of controls, were sent to
the UCLA Southern California Genotyping Consortium where
the RNA was converted to cRNA and then hybridized to arrays
using the standard protocol. For the second batch, 132 samples
(1 mg of total RNA), representing 40 knockdowns and two sets of
controls, were sent to the University of Chicago Functional
Genomics Core where the RNA was converted to cRNA and then
hybridized to the arrays using the standard protocol. Both cores
returned raw probe intensities to us. The batch aspect of the study
design is clearly less than optimal, but it was a result of necessary
practical considerations. As mentioned above, we included a full
set of negative controls with each batch. We also accounted for
batch effects explicitly in our analysis (see below).
Before processing the arrays, we determined the set of usable
probes. To do this, we first mapped probes to the hg19 reference
genome using the BWA alignment program [41] and only retained
probes that mapped perfectly to the genome (probes spanning
introns were discarded). We then removed probes that mapped
perfectly to a single site in the genome and also mapped to a second
site allowing for one mismatch. As GM19238 was derived from a
female donor, we excluded all probes for Y chromosome genes. We
then removed probes that contained a SNP for which GM19238
was heterozygous based on 1000 Genomes data [42] (http://ftp.
1000genomes.ebi.ac.uk/vol1/ftp/pilot_data/paper_data_sets/a_
map_of_human_variation/trio/snps/) to avoid detecting spurious
results from an interaction between allele specific expression and
probe effects influencing hybridization intensities. After this series of
exclusions, for each gene that was assayed by more than one
remaining probe, we chose the 39-most probe to represent the gene.
We then excluded probes for genes that were not expressed
(detection P,0.01) in the knockdown triplicates or the full set of
controls (18 arrays) for each experiment.
We log-transformed and quantile normalized the data from all
arrays together using the ‘lumi’ Bioconductor package [43,44] in
Impact of Transcription Factor Binding Variation
PLOS Genetics | www.plosgenetics.org 9 March 2014 | Volume 10 | Issue 3 | e1004226
the R statistical environment. Our initial analysis indicated that
this was not sufficient to correct for all of the batch effects present
between different rounds of transfection (Figure S5), so we also
used the RUV-2 method [45] to further adjust the data. To do so,
we defined a set of genes that should not be differentially expressed
under any conditions in our experiment as the basis for the RUV-2
correction. While the choice of unaffected genes might not be
straightforward in all experimental settings, the fact that we had 59
different knockdown experiments (and controls) across three
rounds of transfections provided an opportunity to define a
reasonable set of control probes. Specifically, we created a list of
the 2,000 least variable probes (considering only probes for genes
that passed our expression threshold) for each of the batches of
arrays separately. We then intersected the three lists to obtain a
high confidence list of 787 invariant genes. These are the genes
with the least evidence of difference in expression levels in any
knockdown experiment.
We also needed to specify the number of components to regress
out. Again, this choice may not always be straightforward,
however, we had two knockdown experiments (IRF5 and SP1)
that were each repeated across different batches. We thus
maximized the correlation between these experiments in deciding
on the number of components to remove. We found that removing
eight components resulted in zero genes identified as differentially
expressed (at an FDR of 5%) between replicate experiments (or the
control arrays by themselves, across batches) and had the
maximum number of differentially expressed genes replicated
between the two experiments for both IRF5 and SP1 (Figure S2;
these models were fit with the ‘limma’ package [46]). Lastly, we
averaged each of the negative control knockdowns across each of
the time points in order to have a single set of controls with which
to compare each of the knockdowns. In addition to examining
heatmaps for the arrays (Figures S1, S3), the quality of each array
was assessed by relative log expression (‘RLE’) plots (Figure S4;
[47,48]) and PCA (Figure S5, Table S2). For the remainder of the
analyses, we only used the IRF5 and SP1 experiment that had the
greater knockdown efficiency.
We note that the top principle components of the adjusted data
are still correlated with the microarray chip (Table S2), but we
decided that further correction was not helpful for several reasons.
First, the amount of variance captured by any one component is
quite low after RUV-2 adjustment (Table S2). Second, our
analysis indicated that removing additional components with
RUV-2 reduced the correlations between replicate knockdown
experiments (Figure S2). Third, we randomized samples across
chips so as to avoid the introduction of a bias in our results based
on such an effect.
Determining differentially expressed genesIn order to identify differentially expressed genes in each
knockdown, we compared the expression level of each gene on the
three knockdown arrays to its expression level on the six control
arrays. We used a likelihood-ratio test within the framework of a
fixed-effect linear model:
Yij~mizbjXizeij
Here, Yij is the expression level of gene i on array j. mi is the mean
expression level for gene i. bj is the status of array j (either
‘‘knockdown’’ or ‘‘control’’) and Xi is the knockdown effect for
gene i. eij is the error term for gene i on array j. For each gene, we
compared a model with a bjXi term to the nested model with no
bjXi term using a likelihood ratio test to determine which model fit
the data better. To adjust for multiple testing within each
knockdown experiment, we calculated the q-value for each gene
using the Storey and Tibshirani method [49] as provided in the
‘qvalues’ R package.
Gene ontology analysisFor each knockdown, we also assessed whether there were any
Gene Ontology categories (either from the ‘‘MF’’ or ‘‘BP’’
categories) that were overrepresented among the differentially
expressed genes. To do so, we used the ‘topGO’ package and the
‘org.Hs.eg’ database in R. For each knockdown, we tested both
‘‘MF’’ and ‘‘BP’’ categories, combined the results, and filtered out
any categories without a single gene differentially expressed. P-
values were adjusted for multiple testing using the ‘BH’ method in
the ‘p.adjust’ function in R.
Combining with other genomic datasetsAfter identifying differentially expressed genes, we intersected
the gene expression data with factor binding data from both
DNase-seq experiments and ChIP-seq experiments. We consid-
ered binding data within a fixed window around the TSS of each
gene. To determine a single TSS for each gene, we used the
ENCODE CAGE data downloaded from UCSC [3,50]. For each
gene, we chose the TSS with the highest CAGE score as the
reference TSS for that gene unless there was a tie between multiple
TSSs, in which case we used the midpoint between these TSSs as
the reference TSS. The DNase data was from a previous study
conducted in our lab [9]. Binding was determined using the
Centipede algorithm [4] on DNase-seq data from 70 Yoruba
HapMap cell lines. For each factor expressed in our experiments,
we classified all sites with a Centipede posterior probability greater
than 0.95 as bound. The binding was originally mapped to the
hg18 reference genome, so we used liftOver (http://hgdownload.
cse.ucsc.edu/admin/exe/) to convert the coordinates to h19.
For the ChIP data, we downloaded all ENCODE ChIP-seq data for
GM12878 called using the SPP peak caller, except for the POL2
datasets and an NFKB dataset that was collected following tumor
necrosis factor-a stimulation [3] (http://ftp.ebi.ac.uk/pub/databases/
ensembl/encode/integration_data_jan2011/byDataType/peaks/
jan2011/spp/optimal/hub/). For each gene that we were able to link
to a ChIP dataset or a TRANSFAC binding motif [51], we combined
all binding records and then considered the union of that set as the
binding profile for the factor. After obtaining the union set, we
calculated the midpoint for each discrete binding record and used the
midpoints as the estimated binding location in all subsequent analyses.
Using this approach, we obtained binding data for 201 factors;
138 of these factors were represented by a usable probe on the
array and were expressed in at least one of the knockdown
experiments. 131 of the factors were differentially expressed in at
least one knockdown experiment. For DNase-based binding sites,
we also evaluated the PhastCons alignment score [28]. PhastCons
46 way placental wig files were downloaded from UCSC and the
average score for each DNase-seq binding site was calculated. For
all of the comparisons between functional and non-functional
binding, we used the Wilcoxon rank sum test to assess differences.
We also downloaded the Ernst chromatin states [11] from
UCSC. This file contained 15 different chromatin states, including
two separate categories each for ‘‘strong enhancer’’, ‘‘weak
enhancer’’, and ‘‘repetitive’’. We combined each of the replicate
states into a single category so that we ended up with 12 distinct
chromatin states. To identify which state the binding occurred in,
we intersected the binding record midpoints with the chromatin
states. We calculated the enrichment or depletion of functional
binding in specific chromatin states using a Fisher’s Exact Test.
Impact of Transcription Factor Binding Variation
PLOS Genetics | www.plosgenetics.org 10 March 2014 | Volume 10 | Issue 3 | e1004226

To test whether the number of paralogs or the degree of
similarity with the closest paralog for each transcription factor
knocked down might influence the number of genes differentially
expressed in our experiments, we obtained definitions of paralogy
and the calculations of percent identity for 29 different factors
from Ensembl’s BioMart (http://useast.ensembl.org/biomart/
martview/) [31]. We used genome build GRCh37.p13. For each
gene, we counted the number of paralogs classified as a
‘‘within_species_paralog’’. After selecting only genes considered
a ‘‘within_species_paralog’’, we also assigned the maximum
percent identity as the closest paralog. To evaluate the effect that
an independent assignment of target genes to regulatory regions
might have on our analyses, we used the definition of target genes
defined by Thurman et al. (ftp://ftp.ebi.ac.uk/pub/databases/
ensembl/encode/integration_data_jan2011/byDataType/openchrom/
jan2011/dhs_gene_connectivity/genomewideCorrs_above0.7_promoter
PlusMinus500kb_withGeneNames_32celltypeCategories.bed8.gz),
which use correlations in DNase hypersensitivity between distal
and proximal regulatory regions across different cell types to link
distal elements to putative target genes [38]. We intersected the
midpoints of our called binding events (defined above) with these
regulatory elements in order to assign our binding events to
specific target genes and then re-analyzed the overlap between
binding and differential expression in our experiments.
All analyses were performed with a combination of BedTools
[52,53] and BEDOPS [54] commands, along with custom Python
and R scripts.
Data availabilityThe knockdown data have been deposited in NCBI’s Gene
Expression Omnibus ([55]; accessible through GEO Series
accession number GSE50588 at http://www.ncbi.nlm.nih.gov/
geo/query/acc.cgi?acc = GSE50588)
Supporting Information
Figure S1 Heatmap of microarray correlations. A heatmap
showing the pairwise Spearman correlations between all of the
arrays used in our experiment after quantile normalization and
filtering out probes not meeting certain quality thresholds (see
Methods). The clustering was based on a correlation-derived
distance matrix. The color bar represents the three dates on which
the samples were transfected. Samples clearly cluster based on the
date on which they were transfected.
(TIF)
Figure S2 Diagnostic plots for RUV-2 normalization procedure.
(a) The number of genes classified as differentially expressed (5%
FDR; y-axis) in pairwise comparisons between the samples from
the three transfection dates at different values of ‘k’ (x-axis). ‘k’
represents the number of factors regressed out of the expression
estimates. No genes are detected as differentially expressed after
regressing out two or more factors (k$2). (b) The number of genes
classified as differentially expressed in pairwise comparisons
between the control samples (y-axis) from the three different
transfection dates at a range of values for ‘k’ (x-axis). We repeated
knockdowns for two factors on different transfection dates and so
we used these replicate experiments to evaluate the effects of
RUV-2. (c) The number of genes classified as differentially
expressed in common between the two experiments where we
knocked down IRF5 (y-axis) at different values of ‘k’ (x-axis). (d)
The number of genes classified as differentially expressed in
common between the two experiments where we knocked down
SP1 (y-axis) at different values of ‘k’ (x-axis). (e) Correlation of
2Log10(P-values) for the two IRF5 experiments (y-axis) at different
values of ‘k’ (x-axis). (f) Correlation of 2Log10(P-values) for the two
SP1 experiments (y-axis) at different values of ‘k’ (x-axis). The
dashed red lines in (c–f) highlight the results for k = 8, the value we
ultimately chose for our normalization.
(TIF)
Figure S3 Heatmap of microarray correlations after RUV-2
correction. A heatmap showing the pairwise Spearman correla-
tions between all of the arrays used in our experiment after
quantile normalization, RUV-2 correction and filtering out probes
not meeting certain quality thresholds (see Methods). The
clustering was based on a correlation-derived distance matrix.
The color bar represents the three dates on which the samples
were transfected. Samples no longer cluster based on the date on
which they were transfected after RUV-2 correction.
(TIF)
Figure S4 RLE plots for microarrays in our experiment. RLE
plots can be used to identify a bias or increased variance in probe
intensities for each microarray in an experiment. For each probe
on the array, the difference between the probe intensity for a
particular microarray and the median intensity across all
microarrays is calculated. The deviations for all probes on the
array are then visualized with a boxplot. A systematic shift from 0
would indicate a bias in expression estimates the array, while an
increased interquartile range would indicate increased variance in
probe intensities compared to the global median. Arrays in (a)
have been quantile normalized. The colors of the boxes indicate
the date of transcription for that particular array. There are no
obvious biases for any arrays and overall the variance is low for all
arrays. However, there is clearly increased variance for the ‘‘batch
3’’ arrays compared to the others. Arrays in (b) have been quantile
normalized and RUV-2 corrected. All samples are now more
centered on 0 and have smaller interquartile ranges. In addition,
the variance is more consistent across all arrays than when the
arrays were only quantile normalized.
(TIF)
Figure S5 Principal components analysis of the arrays before
and after RUV-2 correction. (a) The first and second principal
components (x- and y-axis, respectively) appear correlated with
the three transfection dates even after quantile normalizing
the data (as indicated by the color scheme). (b) The first two
principal components do not appear correlated with transfection
date following RUV-2 correction. The three samples in the upper
right hand corner are the three replicates for the knockdown of
IRF4.
(TIF)
Figure S6 Number of genes expressed in each knockdown
experiment. Barplot of the number of genes detected as expressed
in each knockdown experiment. To be classified as expressed, the
probe for the gene had to have a detection p-value less than 0.01 in
either all of the knockdown triplicates or all 18 control samples.
The color scheme identifies which date the transfection took place
on.
(TIF)
Figure S7 Distributions of factor binding from the perspective of
(a) the factor and (b) the target gene. Histograms showing the
distribution of (a) the number of genes expressed in at least one
experiment that were bound (binding +/210 kb form the TSS) by
each factor that was differentially expressed in at least one
knockdown experiment (N = 131) and (b) the number of factors
binding each gene (N = 8,872).
(TIF)
Impact of Transcription Factor Binding Variation
PLOS Genetics | www.plosgenetics.org 11 March 2014 | Volume 10 | Issue 3 | e1004226
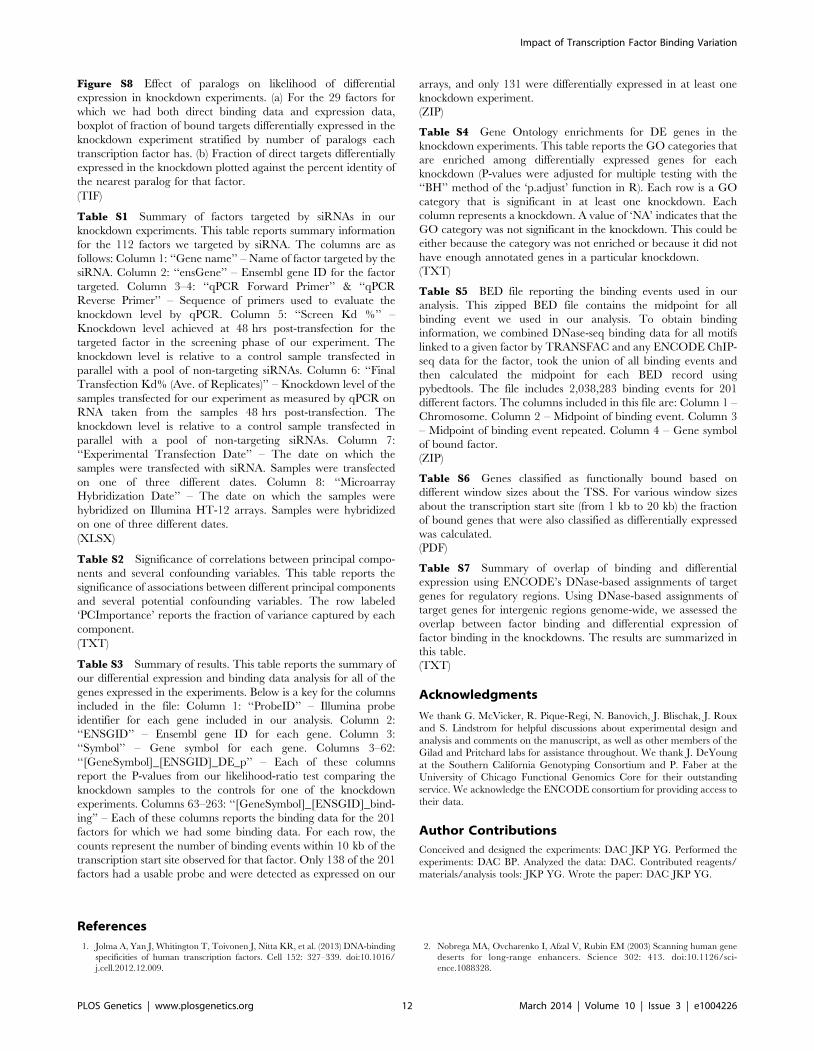
Figure S8 Effect of paralogs on likelihood of differential
expression in knockdown experiments. (a) For the 29 factors for
which we had both direct binding data and expression data,
boxplot of fraction of bound targets differentially expressed in the
knockdown experiment stratified by number of paralogs each
transcription factor has. (b) Fraction of direct targets differentially
expressed in the knockdown plotted against the percent identity of
the nearest paralog for that factor.
(TIF)
Table S1 Summary of factors targeted by siRNAs in our
knockdown experiments. This table reports summary information
for the 112 factors we targeted by siRNA. The columns are as
follows: Column 1: ‘‘Gene name’’ – Name of factor targeted by the
siRNA. Column 2: ‘‘ensGene’’ – Ensembl gene ID for the factor
targeted. Column 3–4: ‘‘qPCR Forward Primer’’ & ‘‘qPCR
Reverse Primer’’ – Sequence of primers used to evaluate the
knockdown level by qPCR. Column 5: ‘‘Screen Kd %’’ –
Knockdown level achieved at 48 hrs post-transfection for the
targeted factor in the screening phase of our experiment. The
knockdown level is relative to a control sample transfected in
parallel with a pool of non-targeting siRNAs. Column 6: ‘‘Final
Transfection Kd% (Ave. of Replicates)’’ – Knockdown level of the
samples transfected for our experiment as measured by qPCR on
RNA taken from the samples 48 hrs post-transfection. The
knockdown level is relative to a control sample transfected in
parallel with a pool of non-targeting siRNAs. Column 7:
‘‘Experimental Transfection Date’’ – The date on which the
samples were transfected with siRNA. Samples were transfected
on one of three different dates. Column 8: ‘‘Microarray
Hybridization Date’’ – The date on which the samples were
hybridized on Illumina HT-12 arrays. Samples were hybridized
on one of three different dates.
(XLSX)
Table S2 Significance of correlations between principal compo-
nents and several confounding variables. This table reports the
significance of associations between different principal components
and several potential confounding variables. The row labeled
‘PCImportance’ reports the fraction of variance captured by each
component.
(TXT)
Table S3 Summary of results. This table reports the summary of
our differential expression and binding data analysis for all of the
genes expressed in the experiments. Below is a key for the columns
included in the file: Column 1: ‘‘ProbeID’’ – Illumina probe
identifier for each gene included in our analysis. Column 2:
‘‘ENSGID’’ – Ensembl gene ID for each gene. Column 3:
‘‘Symbol’’ – Gene symbol for each gene. Columns 3–62:
‘‘[GeneSymbol]_[ENSGID]_DE_p’’ – Each of these columns
report the P-values from our likelihood-ratio test comparing the
knockdown samples to the controls for one of the knockdown
experiments. Columns 63–263: ‘‘[GeneSymbol]_[ENSGID]_bind-
ing’’ – Each of these columns reports the binding data for the 201
factors for which we had some binding data. For each row, the
counts represent the number of binding events within 10 kb of the
transcription start site observed for that factor. Only 138 of the 201
factors had a usable probe and were detected as expressed on our
arrays, and only 131 were differentially expressed in at least one
knockdown experiment.
(ZIP)
Table S4 Gene Ontology enrichments for DE genes in the
knockdown experiments. This table reports the GO categories that
are enriched among differentially expressed genes for each
knockdown (P-values were adjusted for multiple testing with the
‘‘BH’’ method of the ‘p.adjust’ function in R). Each row is a GO
category that is significant in at least one knockdown. Each
column represents a knockdown. A value of ‘NA’ indicates that the
GO category was not significant in the knockdown. This could be
either because the category was not enriched or because it did not
have enough annotated genes in a particular knockdown.
(TXT)
Table S5 BED file reporting the binding events used in our
analysis. This zipped BED file contains the midpoint for all
binding event we used in our analysis. To obtain binding
information, we combined DNase-seq binding data for all motifs
linked to a given factor by TRANSFAC and any ENCODE ChIP-
seq data for the factor, took the union of all binding events and
then calculated the midpoint for each BED record using
pybedtools. The file includes 2,038,283 binding events for 201
different factors. The columns included in this file are: Column 1 –
Chromosome. Column 2 – Midpoint of binding event. Column 3
– Midpoint of binding event repeated. Column 4 – Gene symbol
of bound factor.
(ZIP)
Table S6 Genes classified as functionally bound based on
different window sizes about the TSS. For various window sizes
about the transcription start site (from 1 kb to 20 kb) the fraction
of bound genes that were also classified as differentially expressed
was calculated.
(PDF)
Table S7 Summary of overlap of binding and differential
expression using ENCODE’s DNase-based assignments of target
genes for regulatory regions. Using DNase-based assignments of
target genes for intergenic regions genome-wide, we assessed the
overlap between factor binding and differential expression of
factor binding in the knockdowns. The results are summarized in
this table.
(TXT)
Acknowledgments
We thank G. McVicker, R. Pique-Regi, N. Banovich, J. Blischak, J. Roux
and S. Lindstrom for helpful discussions about experimental design and
analysis and comments on the manuscript, as well as other members of the
Gilad and Pritchard labs for assistance throughout. We thank J. DeYoung
at the Southern California Genotyping Consortium and P. Faber at the
University of Chicago Functional Genomics Core for their outstanding
service. We acknowledge the ENCODE consortium for providing access to
their data.
Author Contributions
Conceived and designed the experiments: DAC JKP YG. Performed the
experiments: DAC BP. Analyzed the data: DAC. Contributed reagents/
materials/analysis tools: JKP YG. Wrote the paper: DAC JKP YG.
References
1. Jolma A, Yan J, Whitington T, Toivonen J, Nitta KR, et al. (2013) DNA-binding
specificities of human transcription factors. Cell 152: 327–339. doi:10.1016/
j.cell.2012.12.009.
2. Nobrega MA, Ovcharenko I, Afzal V, Rubin EM (2003) Scanning human gene
deserts for long-range enhancers. Science 302: 413. doi:10.1126/sci-
ence.1088328.
Impact of Transcription Factor Binding Variation
PLOS Genetics | www.plosgenetics.org 12 March 2014 | Volume 10 | Issue 3 | e1004226
3. Bernstein BE, Birney E, Dunham I, Green ED, Gunter C, et al. (2012) An
integrated encyclopedia of DNA elements in the human genome. Nature 489:57–74. doi:10.1038/nature11247.
4. Pique-Regi R, Degner JF, Pai AA, Gaffney DJ, Gilad Y, et al. (2011) Accurate
inference of transcription factor binding from DNA sequence and chromatinaccessibility data. Genome Res 21: 447–455. doi:10.1101/gr.112623.110.
5. Song L, Crawford GE (2010) DNase-seq: a high-resolution technique formapping active gene regulatory elements across the genome from mammalian
cells. Cold Spring Harb Protoc 2010: pdb.prot5384. doi:10.1101/pdb.prot5384.
6. Yan J, Enge M, Whitington T, Dave K, Liu J, et al. (2013) Transcription factorbinding in human cells occurs in dense clusters formed around cohesin anchor
sites. Cell 154: 801–813. doi:10.1016/j.cell.2013.07.034.7. Gaffney DJ, Veyrieras J-B, Degner JF, Pique-Regi R, Pai AA, et al. (2012)
Dissecting the regulatory architecture of gene expression QTLs. Genome Biol13: R7. doi:10.1186/gb-2012-13-1-r7.
8. Bell JT, Pai AA, Pickrell JK, Gaffney DJ, Pique-Regi R, et al. (2011) DNA
methylation patterns associate with genetic and gene expression variation inHapMap cell lines. Genome Biol 12: R10. doi:10.1186/gb-2011-12-1-r10.
9. Degner JF, Pai AA, Pique-Regi R, Veyrieras J-B, Gaffney DJ, et al. (2012)DNase I sensitivity QTLs are a major determinant of human expression
variation. Nature 482: 390–394. doi:10.1038/nature10808.
10. Spivakov M, Akhtar J, Kheradpour P, Beal K, Girardot C, et al. (2012) Analysisof variation at transcription factor binding sites in Drosophila and humans.
Genome Biol 13: R49. doi:10.1186/gb-2012-13-9-r49.11. Ernst J, Kheradpour P, Mikkelsen TS, Shoresh N, Ward LD, et al. (2011)
Mapping and analysis of chromatin state dynamics in nine human cell types.Nature 473: 43–49. doi:10.1038/nature09906.
12. Gilad Y, Rifkin SA, Pritchard JK (2008) Revealing the architecture of gene
regulation: the promise of eQTL studies. Trends Genet 24: 408–415.doi:10.1016/j.tig.2008.06.001.
13. Chia N-Y, Chan Y-S, Feng B, Lu X, Orlov YL, et al. (2010) A genome-wideRNAi screen reveals determinants of human embryonic stem cell identity.
Nature 468: 316–320. doi:10.1038/nature09531.
14. Yang A, Zhu Z, Kapranov P, McKeon F, Church GM, et al. (2006)Relationships between p63 binding, DNA sequence, transcription activity, and
biological function in human cells. Mol Cell 24: 593–602. doi:10.1016/j.molcel.2006.10.018.
15. Krig SR, Jin VX, Bieda MC, O’Geen H, Yaswen P, et al. (2007) Identificationof genes directly regulated by the oncogene ZNF217 using chromatin
immunoprecipitation (ChIP)-chip assays. J Biol Chem 282: 9703–9712.
doi:10.1074/jbc.M611752200.16. Xu X, Bieda M, Jin VX, Rabinovich A, Oberley MJ, et al. (2007) A
comprehensive ChIP-chip analysis of E2F1, E2F4, and E2F6 in normal andtumor cells reveals interchangeable roles of E2F family members. Genome Res
17: 1550–1561. doi:10.1101/gr.6783507.
17. Kawaji H, Severin J, Lizio M, Waterhouse A, Katayama S, et al. (2009) TheFANTOM web resource: from mammalian transcriptional landscape to its
dynamic regulation. Genome Biol 10: R40. doi:10.1186/gb-2009-10-4-r40.18. Suzuki H, Forrest ARR, van Nimwegen E, Daub CO, Balwierz PJ, et al. (2009)
The transcriptional network that controls growth arrest and differentiation in ahuman myeloid leukemia cell line. Nat Genet 41: 553–562. doi:10.1038/ng.375.
19. Cheng C, Alexander R, Min R, Leng J, Yip KY, et al. (2012) Understanding
transcriptional regulation by integrative analysis of transcription factor bindingdata. Genome Res 22: 1658–1667. doi:10.1101/gr.136838.111.
20. Gerstein MB, Kundaje A, Hariharan M, Landt SG, Yan K-K, et al. (2012)Architecture of the human regulatory network derived from ENCODE data.
Nature 489: 91–100. doi:10.1038/nature11245.
21. Aleman LM, Doench J, Sharp PA (2007) Comparison of siRNA-induced off-target RNA and protein effects. RNA 13: 385–395. doi:10.1261/rna.352507.
22. De Candia P, Blekhman R, Chabot AE, Oshlack A, Gilad Y (2008) Acombination of genomic approaches reveals the role of FOXO1a in regulating
an oxidative stress response pathway. PLoS One 3: e1670. doi:10.1371/
journal.pone.0001670.23. Tamura T, Yanai H, Savitsky D, Taniguchi T (2008) The IRF family
transcription factors in immunity and oncogenesis. Annu Rev Immunol 26: 535–584. doi:10.1146/annurev.immunol.26.021607.090400.
24. Ashburner M, Ball CA, Blake JA, Botstein D, Butler H, et al. (2000) Geneontology: tool for the unification of biology. The Gene Ontology Consortium.
Nat Genet 25: 25–29. doi:10.1038/75556.
25. Kanno Y, Levi B-Z, Tamura T, Ozato K (2005) Immune cell-specificamplification of interferon signaling by the IRF-4/8-PU.1 complex.
J Interferon Cytokine Res 25: 770–779. doi:10.1089/jir.2005.25.770.26. Tsuno T, Mejido J, Zhao T, Schmeisser H, Morrow A, et al. (2009) IRF9 is a
key factor for eliciting the antiproliferative activity of IFN-alpha. J Immunother
32: 803–816. doi:10.1097/CJI.0b013e3181ad4092.27. Eberle D, Hegarty B, Bossard P, Ferre P, Foufelle F (2004) SREBP transcription
factors: master regulators of lipid homeostasis. Biochimie 86: 839–848.doi:10.1016/j.biochi.2004.09.018.
28. Siepel A, Bejerano G, Pedersen JS, Hinrichs AS, Hou M, et al. (2005)
Evolutionarily conserved elements in vertebrate, insect, worm, and yeastgenomes. Genome Res 15: 1034–1050. doi:10.1101/gr.3715005.
29. Graur D, Zheng Y, Price N, Azevedo RBR, Zufall RA, et al. (2013) On the
immortality of television sets: ‘‘function’’ in the human genome according to theevolution-free gospel of ENCODE. Genome Biol Evol 5: 578–590. doi:10.1093/
gbe/evt028.30. Gitter A, Siegfried Z, Klutstein M, Fornes O, Oliva B, et al. (2009) Backup in
gene regulatory networks explains differences between binding and knockout
results. Mol Syst Biol 5: 276. doi:10.1038/msb.2009.33.31. Vilella AJ, Severin J, Ureta-Vidal A, Heng L, Durbin R, et al. (2009)
EnsemblCompara GeneTrees: Complete, duplication-aware phylogenetic treesin vertebrates. Genome Res 19: 327–335. doi:10.1101/gr.073585.107.
32. Latchman DS (2001) Transcription factors: bound to activate or repress. TrendsBiochem Sci 26: 211–213. doi:10.1016/S0968-0004(01)01812-6.
33. Boyle P, Despres C (2010) Dual-function transcription factors and their
entourage: unique and unifying themes governing two pathogenesis-relatedgenes. Plant Signal Behav 5: 629–634.
34. Hobert O, Jallal B, Ullrich A (1996) Interaction of Vav with ENX-1, a putativetranscriptional regulator of homeobox gene expression. Mol Cell Biol 16: 3066–
3073.
35. Hirai SI, Ryseck RP, Mechta F, Bravo R, Yaniv M (1989) Characterization ofjunD: a new member of the jun proto-oncogene family. EMBO J 8: 1433–1439.
36. Farnham PJ (2009) Insights from genomic profiling of transcription factors. NatRev Genet 10: 605–616. doi:10.1038/nrg2636.
37. Biggin MD (2011) Animal transcription networks as highly connected,quantitative continua. Dev Cell 21: 611–626. doi:10.1016/j.devcel.2011.09.008.
38. Thurman RE, Rynes E, Humbert R, Vierstra J, Maurano MT, et al. (2012) The
accessible chromatin landscape of the human genome. Nature 489: 75–82.doi:10.1038/nature11232.
39. Wang Z, Gerstein M, Snyder M (2009) RNA-Seq: a revolutionary tool fortranscriptomics. Nat Rev Genet 10: 57–63. doi:10.1038/nrg2484.
40. Peirson SN (2003) Experimental validation of novel and conventional
approaches to quantitative real-time PCR data analysis. Nucleic Acids Res 31:73e–73. doi:10.1093/nar/gng073.
41. Li H, Durbin R (2009) Fast and accurate short read alignment with Burrows-Wheeler transform. Bioinformatics 25: 1754–1760. doi:10.1093/bioinformatics/
btp324.42. Abecasis GR, Altshuler D, Auton A, Brooks LD, Durbin RM, et al. (2010) A
map of human genome variation from population-scale sequencing. Nature 467:
1061–1073. doi:10.1038/nature09534.43. Du P, Kibbe WA, Lin SM (2008) lumi: a pipeline for processing Illumina
microarray. Bioinformatics 24: 1547–1548. doi:10.1093/bioinformatics/btn224.44. Gentleman RC, Carey VJ, Bates DM, Bolstad B, Dettling M, et al. (2004)
Bioconductor: open software development for computational biology and
bioinformatics. Genome Biol 5: R80. doi:10.1186/gb-2004-5-10-r80.45. Gagnon-Bartsch JA, Speed TP (2012) Using control genes to correct for
unwanted variation in microarray data. Biostatistics 13: 539–552. doi:10.1093/biostatistics/kxr034.
46. Smyth GK (2004) Linear models and empirical bayes methods for assessingdifferential expression in microarray experiments. Stat Appl Genet Mol Biol 3:
Article3. doi:10.2202/1544-6115.1027.
47. Bolstad B, Irizarry R, Astrand M, Speed T (2003) A comparison ofnormalization methods for high density oligonucleotide array data based on
variance and bias. Bioinformatics 19: 185–193.48. Brettschneider J, Collin F, Bolstad BM, Speed TP (2008) Quality assessment for
short oligonucleotide microarray data. Technometrics 50: 241–264.
doi:10.1198/004017008000000334.49. Storey JD, Tibshirani R (2003) Statistical significance for genomewide studies.
Proc Natl Acad Sci 100: 9440–9445. doi:10.1073/pnas.1530509100.50. Djebali S, Davis CA, Merkel A, Dobin A, Lassmann T, et al. (2012) Landscape
of transcription in human cells. Nature 489: 101–108. doi:10.1038/na-
ture11233.51. Matys V, Kel-Margoulis O V, Fricke E, Liebich I, Land S, et al. (2006)
TRANSFAC and its module TRANSCompel: transcriptional gene regulation ineukaryotes. Nucleic Acids Res 34: D108–10. doi:10.1093/nar/gkj143.
52. Quinlan AR, Hall IM (2010) BEDTools: a flexible suite of utilities for comparinggenomic features. Bioinformatics 26: 841–842. doi:10.1093/bioinformatics/
btq033.
53. Dale RK, Pedersen BS, Quinlan AR (2011) Pybedtools: a flexible Python libraryfor manipulating genomic datasets and annotations. Bioinformatics 27: 3423–
3424. doi:10.1093/bioinformatics/btr539.54. Neph S, Kuehn MS, Reynolds AP, Haugen E, Thurman RE, et al. (2012)
BEDOPS: high-performance genomic feature operations. Bioinformatics 28:
1919–1920. doi:10.1093/bioinformatics/bts277.55. Edgar R (2002) Gene Expression Omnibus: NCBI gene expression and
hybridization array data repository. Nucleic Acids Res 30: 207–210.doi:10.1093/nar/30.1.207.
Impact of Transcription Factor Binding Variation
PLOS Genetics | www.plosgenetics.org 13 March 2014 | Volume 10 | Issue 3 | e1004226