testing for sub-colony variation in seabird foraging behaviour: ecological and methodological...
TRANSCRIPT

MARINE ECOLOGY PROGRESS SERIESMar Ecol Prog Ser
Vol 498 275ndash285 2014doi 103354meps10628
Published February 17
INTRODUCTION
Around 96 of seabird species form densely popu-lated colonies (Coulson 2002) While the processesthat ultimately led to the evolution of colonialityare unknown (Danchin amp Wagner 1997) it is clearthat intraspecific interactions among colony membersplay an important role in seabird ecology during the
breeding season Studying interactions among col -ony members has implications for both our under-standing of the ecological processes associated withcolonial living (Wakefield et al 2013) and conserva-tion biology (Votier et al 2007 Weimerskirch et al2010)
Intra-colony differences in individual foraging be -haviour may be driven in part by intense intraspecific
copy Inter-Research 2014 middot wwwint-rescomCorresponding author r01jjw11abdnacuk
Testing for sub-colony variation in seabird foragingbehaviour ecological and methodological
consequences for understanding colonial living
J J Waggitt1 M Briffa2 W J Grecian3 J Newton4 S C Patrick5 C Stauss2 S C Votier6
1School of Biological Sciences Institute of Biological and Environmental Sciences University of Aberdeen Aberdeen AB24 2TZ UK
2Marine Biology and Ecology Research Centre University of Plymouth Plymouth PL4 8AA UK3Institute of Biodiversity Animal Health and Comparative Medicine University of Glasgow Glasgow G12 8QQ UK
4Natural Environment Research Council Life Sciences Mass Spectrometry Facility Scottish Universities Environmental Research Centre Ranking Avenue East Kilbride G75 0QF UK
5Centre drsquoEtudes Biologiques de Chizeacute CNRS 79360 Villiers-en-Bois France6Environment and Sustainability Institute University of Exeter Cornwall Campus Penryn Cornwall TR10 9EZ UK
ABSTRACT Intraspecific interactions have important roles in shaping foraging behaviours Forcolonial species such as seabirds intense competition for prey around colonies may drive differ-ences in foraging behaviour between age-classes and sexes or lead to individual specialisationWhile much research has focussed on understanding these differences in foraging behaviour fewstudies have investigated the possibility of sub-colony foraging asymmetries within colonies Suchknowledge could improve our understanding of the ecological processes associated with colonialliving It may also have important methodological implications in studies where the foragingbehaviours recorded from individuals in a small number of sub-colonies are assumed to be repre-sentative of those from the colony as a whole Here we use GPS loggers and stable isotope analy-sis of red blood cells to test for differences in foraging behaviour among 7 sub-colonies of a largenorthern gannet Morus bassanus colony over 3 yr We found no instances of statistically significantdifferences in foraging behaviour among sub-colonies Although complimentary in situ observa-tions found similarities among neighboursrsquo departure directions these results may be attributableto wind vectors We therefore conclude that sub-colony foraging asymmetries are either limited orabsent in northern gannets However given the current lack of knowledge across seabird specieswe urge similar studies elsewhere
KEY WORDS Morus bassanus middot Foraging ecology middot Social information middot GPS tracking middot Stable isotope analysis middot Colonial living
Resale or republication not permitted without written consent of the publisher
Mar Ecol Prog Ser 498 275ndash285 2014
competition for prey around colonies Foraging dif-ferences may arise because of age (Daunt et al 2007Votier et al 2011) and sex (Wearmouth amp Sims 2008)while individual-level specialisations independent ofthese factors are also increasingly apparent (Arauacutejoet al 2011) In addition there may also be differencesin foraging behaviour that arise because of spatialstructuring of individuals within the colony but thesehave been less well studied For instance coloniescan often be divided into several discrete and iso-lated sub-colonies An exchange of social informa-tion among neighbours at the nest site re garding thelocation of foraging opportunities (Ward amp Zahavi1973) could lead to at-sea segregation among sub-colonies Alternatively if colony members groupedthemselves by age or intrinsic qualities (Velando ampFreire 2001) then sub-colonies containing mainlyolder or more dominant individuals may forage closerto the colony or spend less time at sea (Catry amp Furness 1999 Daunt et al 2007 Votier et al 2011)Therefore sub-colony foraging asymmetries couldoffer useful insights into the ecological processesassociated with colonial living but such studies arescarce (Hipfner et al 2007)
The presence of sub-colony foraging asymmetriescould also have important methodological conse-quences In recent years there has been a rapid in -crease in the use of GPS loggers (Ropert-Coudert ampWilson 2005) and stable isotope analysis (SIA Ingeramp Bearhop 2008) to study the foraging behaviour ofcolonial seabirds during the breeding season Muchof this work requires individuals to be captured atthe nest site However because of problems of acces-sibility individuals are rarely captured randomlythroughout the colony Instead many are capturedfrom a few easily accessible sub-colonies In mostcases the foraging behaviours recorded from theseindividuals are then assumed to be representativeof those from the colony as a whole (Soanes et al2013b) In the presence of sub-colony foraging asym-metries these assumptions may be incorrect Thiscould have important implications in studies esti -mating colony-level impacts from marine renewableenergy installations (Soanes et al 2013a) commer-cial fisheries (Votier et al 2010 2013) marine pollu-tion (Montevecchi et al 2012) and climate change(Weimerskirch et al 2012)
Here we test for differences in foraging behaviouramong 7 sub-colonies of a large northern gannetMorus bassanus (hereafter gannet) colony over 3 yrduring the chick-rearing stages We used a combina-tion of GPS loggers and SIA to quantify and thencompare a range of individual foraging behaviours
among sub-colonies We also tested for similarities inneighboursrsquo (individuals from the same sub-colony)initial flight directions at the start of their foragingtrips by performing in situ observations in 1 sub-colony in 1 yr Our overall aim was to determine theextent to which sub-colonies explained the variationin individual foraging behaviours within the colonyWe then considered these results with regards tospatial structuring of individuals within colonies aswell as the sampling design of GPS logger and SIAstudies aiming to quantify the foraging behaviours ofthe colony as a whole
MATERIALS AND METHODS
Study site and sampling
Fieldwork was conducted on Grassholm WalesUK (51deg 43rsquo N 05deg 28rsquo W Fig 1a) in June and July2006 2010 and 2011 Approximately 40 000 pairsof gannets breed on Grassholm between April andOctober We were able to access 7 sub-colonies without causing detrimental levels of disturbance tobreeding birds (Fig 1b) As northern and westernsub-colonies were inaccessible our sampling effortswere biased towards southern and eastern sub-colonies However in all cases sub-colonies repre-sented groups of neighbours that were isolated fromthe rest of the colony by topographic features suchas valleys and rocky outcrops Therefore birdsfrom one sub-colony were unable to see those fromanother sub-colony while at their nest site
276
0 200 km 0 200 m
Celtic Sea
Irish Sea
Ireland
UK
Grassholm
Colony
Sc7Sc6 Sc5
Sc4Sc3
Sc2
Sc1
a b
Fig 1 Morus bassanus Study sites (a) Fieldwork was con-ducted on the large (~40 000 breeding pairs) northern gan-net colony on Grassholm Wales UK indicated by a blacksquare (b) We focused on 7 sub-colonies (Sc1 to Sc7) thatwere situated around the periphery of the colony Sub-colonies were separated from one another by topographicfeatures such as rocky outcrops and valleys Therefore birdsfrom one sub-colony were unable to see those from another
sub-colony while at their nest site
Waggitt et al Sub-colony variation in northern gannets
We caught 72 chick-rearing gannets at their nestsites using a brass noose or hook on a carbon-fibrepole under licence from the Countryside Council forWales All birds were equipped with a GPS loggerwith permission from the British Trust for Ornithol-ogy (see lsquoGPS trackingrsquo below) and blood was sam-pled (see lsquoSIArsquo below) under licence from the UKHome Office Blood samples were also used for sub-sequent sexing using molecular techniques (Stauss etal 2012) Following release all birds flew off stronglywith no obvious ill effects Our sample sizes anddates are summarised in Table 1
GPS tracking
We equipped all 72 birds with GPS loggers In2006 we used 65 g GPSlog loggers (earthampOCEANTechnologies) whereas in 2010 to 2011 we used 35 gi-gotu GPS loggers (Mobile Action Technology)These were attached to the base of the tail or lowerback using Tesareg tape Devices recorded GPS fixesat 3 and 1 min intervals in 2006 and 2010 to 2011respectively In many cases devices recorded multi-ple foraging trips from a single bird However be -cause gannets on Grassholm have consistent forag-ing behaviours within breeding seasons (Patrick etal 2014) we only analysed the first foraging trip toprevent issues of pseudoreplication
We calculated each birdrsquos departure direction (deg)distal direction (deg) trip duration (decimal days) triplength (total distance covered km) and range (maxi-mum distance from the colony km) Departure direc-
tions were calculated between Grassholm and theirfirst location at 10 km distance from the colony toexclude any rafting behaviour (resting on the sea surface) near the coastline Distal directions werecalculated between Grassholm and their most distantlocation from the colony In addition to these 5 meas-urements we also estimated each birdrsquos core forag-ing areas using fixed kernel density estimation (KDE)with a smoothing parameter (h) of 10 km and a cellsize of 1 km2 This smoothing parameter was chosenbe cause of the mean scale of area-restricted search(ARS) be haviour (sinuous and slow movements as -sociated with foraging activities) in gannets (91 plusmn19 km Hamer et al 2009) In many cases 50 den-sity contours are used to identify a birdrsquos core forag-ing area (Hamer et al 2007) Here comparisons be -tween KDE analysis and GPS fixes showed that 50contours often included commuting flights betweenforaging locations and the colony However for themost part 25 contours only identified areas wherebirds intensified their ARS behaviours (Hamer et al2009) Therefore we used 25 contours to identifyand quantify core foraging areas taking the centroidof their easting and northing values (km) using theUniversal Transverse Mercator zone 30N coordinatesystem KDE was performed using the lsquoadehabitatHRrsquo package (Calenge 2006) in R (version 2130R Development Core Team 2010)
SIA
We analysed stable carbon (13C12C δ13C) andnitro gen (15N14N δ15N) isotope ratios of red bloodcells (RBCs) in all 72 birds This provides integratedforaging information from the previous 3 to 4 wkThis approach relies on the fact that stable isotoperatios in consumer tissues reflect those in their preyin a predictable manner δ13C exhibits a slight step-wise trophic enrichment (~1) but varies mainly be -cause of geographical differences in photosyntheticbiochemistry within and among marine primary pro-ducer communities In marine environments δ13Calso varies because of differences in latitude depthand distance to land masses (Farqu har et al 1989Robinson 2001) δ15N becomes en riched by 3 to 5permilwith each trophic level (Deniro amp Epstein 1981 Hob-son amp Clark 1992 Bearhop et al 2002) and reflectsdifferences in the trophic level of prey or differencesin food chain length Therefore combining δ15N andδ13C values into an isotopic signature can provide auseful proxy for foraging locations by quantifyingboth their geographical properties and prey composi-
277
Year Sampling date Sub- No of No of colony males females
2006 12minus14 July Sc5 5 2 12minus14 July Sc6 2 5 17 Juneminus14 July Sc7 2 7
2010 6minus11 July Sc1 1 4 5minus11 July Sc2 1 3 5minus11 July Sc4 1 4 6minus12 July Sc7 1 2
2011 23 Juneminus13 July Sc1 3 4 10minus22 July Sc2 2 4 10minus22 July Sc3 1 2 27 Juneminus23 July Sc4 1 5 27 Juneminus23 July Sc7 6 4
Table 1 Morus bassanus Sample sizes divided into sexsub-colonies and years on Grassholm UK Also shown aresampling dates within each sub-colony (Sc1 to Sc7) by yearAll birds were equipped with GPS loggers and blood was
sampled for stable isotope analysis
Mar Ecol Prog Ser 498 275ndash285 2014
tion If there are consistent differences in foraginglocations among sub-colonies this should be re -flected in the respective isotopic signatures of birdssampled there
Approximately 02 ml of blood was taken from thetarsal vein using a 23 gauge needle under licensefrom the UK Home Office Within 2 to 3 h RBCs wereseparated from plasma using a centrifuge beforebeing stored on ice Prior to elemental analysis sam-ples were freeze dried and homogenised and ap -proximately 07 mg was weighed into tin capsulesIsotope analysis was conducted at the East Kilbridenode of the Natural Environment Research Council(NERC) Life Sciences Mass Spectrometry Facility(LSMSF) via continuous flow isotope ratio massspectro metry using a Costech ECS 4010 elementalana lyser interfaced with a Thermo Electron delta XPmass spectrometer Isotope ratios (R) of 15N14N and13C12C are expressed in delta (δ) units as parts perthousand (permil) where δ13C or δ15N = [(R sampleR standard) minus 1] times 1000 The international standards(= 0permil) for SIA are atmospheric N2 for nitrogen andPee Dee Belemnite for carbon
In situ observations
Previous studies using GPS loggers found that theinitial flight directions of most gannets at around1 km from the nest site differed only slightly (lt40deg)from their subsequent departure directions at 10 kmfrom the nest site (Pettex et al 2010) Thereforerecording a birdrsquos initial flight direction at the start ofa foraging trip may be a useful proxy of its subse-quent departure direction To record departure di -rections from a larger number of birds than we couldfrom our GPS loggers we performed in situ ob -servations within 1 sub-colony (Sc6 Fig 1b) on 6 12and 13 July 2010 Observations were performed be -tween 0600 and 1100 h GMT to coincide with thetime period when most birds start their foragingtrips Observation periods avoided times of poor visi-bility We recorded departure directions for each birdstarting a foraging trip during observation periodsDeparture directions were recorded as the bearingbetween Sc6 and the location where they were nolonger visible with the naked eye As visibility wasgood during observation periods this was usuallyaround 1 km from their nest site All birds departedindividually (ie birds did not depart in flocks) andeach recording represented an independent sampleBecause of the topography around the observationpoint our field of view was re stricted to between 140
and 280deg However only 7 of 305 birds starting a foraging trip during observations periods took bear-ings of lt140deg and 280deg Despite our restricted field ofview we expected that neighbours commutingtowards the same foraging location would have simi-lar departure directions within this range of values(140 to 280deg)
Analysis
Because combinations of sub-colonies were not thesame in all years (Table 1) we statistically tested fordifferences in foraging behaviours among sub-colonies in 2006 2010 and 2011 separately This re -moved the possibility of Type I errors ie interpret-ing differences between years as differencesbe tween sub-colonies In all statistical tests we in -cluded both sub-colony and sex as explanatory vari-ables to account for differences in foraging behav-iours between sexes (Stauss et al 2012)
We tested for sub-colony differences in trip dura-tion trip length and range using ANOVA tests withone of these 3 foraging behaviours as the responsevariable and sub-colony and sex as explanatory fac-tors We log transformed trip duration trip lengthand range to correct for a small number of very longforaging trips As isotopic signatures (δ15N and δ13C)and core foraging areas (eastings and northings km)both had 2 response variables we tested for sub-colony differences using multivariate analysis of vari-ance (MANOVA Pillairsquos trace V) These models hadeither δ15N and δ13C or eastings and northings as re -sponse variables and sub-colony and sex as ex plana -tory variables For directional tracking data (depar-ture directions distal directions) we calculated thenortherly and easterly components using their cosineand sine values respectively By using cosine andsine values we were able to use conventional ratherthan circular statistics We then tested for sub-colonydifferences using MANOVA tests with cosine andsine values as response variables and sub-colony andsex as explanatory variables
In all ANOVA and MANOVA tests residuals werenormally distributed (following log transformation oftrip duration trip length and range) with no clearoutliers or high leverage points For all tests we in -cluded 2 additional analyses First we calculated anestimate of statistical power (based on an alpha of005) to quantify the probability of committing Type IIerrors When using MANOVA tests we chose the re sponse variable with the least leverage as a conser-vative measure of power (Murphy et al 2012) Sec-
278
Waggitt et al Sub-colony variation in northern gannets 279
ond we calculated the intra-class correlation coeffi-cient (Nakagawa amp Schielzeth 2010) to compare thevariance in foraging behaviours within sub-coloniesto the variance among sub-colonies This provides arepeatability index between 0 and 1 where an indexof 0 would indicate low similarities among neigh-bours and an index of 1 would indicate high similari-ties among neighbours Here we interpret high re -peatability indices as consistent with the emergenceof sub-colony foraging asymmetries (ie that the vari-ance in foraging behaviours within sub-colonies wasgreater than the variance among sub-colonies)
For our in situ observations we tested for similari-ties among neighboursrsquo departure directions in Sc6using 2 approaches First we calculated the variance(σ2) to mean (μ) ratio (VMR) among departure direc-tions for each day This provided a dispersion indexbetween 0 and 10 where an index of 0 would indi-cate maximum similarities with all neighboursrsquo de -parture directions being identical and an index of~10 would indicate maximum dissimilarities withneighboursrsquo departure directions being equally dis-tributed between 140 and 280deg Second we tested fordifferences in departure directions among days usingan ANOVA test In this test we used departure direc-tions as response variables and the day as the ex -planatory variable From the results of this ANOVAwe were able to calculate the intra-class correlationcoefficient (see above) to provide an indication of thevariance in departure directions within each daycompared to the variance among days VMR andrepeatability indices were then used in conjunctionwith a visual inspection of histograms to determinewhether neighbours had similar departure directionsand may have been commuting towards the sameforaging locations
All statistical analysis was performed in R (version2130 R Development Core Team 2010) For poweranalysis we used the lsquopwrrsquo package (Champely2009) and for repeatability analysis we used thelsquorptRrsquo package (Nakagawa amp Schielzeth 2010)Means are usually shown with standard deviationsHowever in the case of the directional data that wererecorded from GPS loggers (departure and distaldirections) means are shown with estimations of cir-cular variance This is a dispersion index between 0and 1 where values of 0 indicate that all directionsare equal and values of 1 indicate that directionswere equally distributed across 360deg (Zar 2010) Thisap proach was taken because the use of standarddeviations is inappropriate on directional data witha potential range of values greater than 180deg (Zar2010)
RESULTS
GPS tracking
Mean foraging behaviours by sub-colony and yearare shown in Table 2 At-sea movements and core foraging areas by sub-colony and year are shown inFigs 2 amp 3 respectively Visual inspection of at-seamovements and core foraging areas revealed no clearqualitative differences among sub-colonies in anyyear We also found no statistically significant differ-ences in foraging behaviours among sub-colonies inany year Repeatability within sub-colonies was alsogenerally low (Table 3) However there was a statisti-cally significant influence of sex on distal directionsand core foraging areas in 2006 (Table 3)
SIA
Mean δ13C and δ15N RBC values by sub-colony andyear are shown in Table 2 and Fig 4 We found no statistically significant differences in mean isotopicsignatures among sub-colonies Repeatability withinsub-colonies was also generally low (Table 3) How-ever there was a statistically significant influence ofsex on isotopic signatures in 2006 (Table 3)
In situ observations
Our in situ observations are summarised in Table 4and Fig 5 In total we recorded departure directionsfrom 305 birds in Sc6 Counts ranged from 87 to 113birds per day The daily VMR varied between 212 and562 and the overall repeatability index was 0267Taken together with visual inspections of histograms(Fig 5) these results suggested some similarities inneighboursrsquo departure directions Significant differ-ences in departure direction were seen among days(ANOVA F2303 = 37735 p lt 001) with a shift to wardsmore westerly bearings seen on 13 July This shift to-wards more westerly bearings coincided with strongereasterly winds during the observation period (6 Julyspeed = 249 m sminus1 direction = 133deg 12 July speed =249 m sminus1 direction = 119deg 13 July speed = 675 msminus1 direction = 148deg Skomer Reserve Marine Team)
DISCUSSION
Here we investigate whether foraging behavioursdiffered among 7 sub-colonies of a large gannet
Mar Ecol Prog Ser 498 275ndash285 2014280
colony using a combination of GPS loggers and SIAEven when sampling 72 individuals from 7 sub-colonies across 3 yr we found no clear evidence ofany sub-colony foraging asymmetries Repeatabilityindices also suggested low similarities in neigh-boursrsquo foraging behaviours (Table 3) Despite ourhighly variable statistical power (Table 3) there isno clear indication that this lack of a statistically sig-nificant difference is a Type II error Although com-plimentary in situ observations suggested similari-ties among neighboursrsquo departure directions in 1sub-colony (Fig 5) this may be attributable to astrong influence of wind vectors on individualsrsquo ini-tial flight directions at the start of a foraging tripBelow we discuss our results from GPS loggers SIAand in situ observations separately before consider-ing the ecological and methodological implicationsof this research
GPS loggers
While we found no clear differences among 7sub-colonies in 6 different measures of foragingbehaviour derived from GPS loggers we need todiscuss the possibility of falsely accepting our nullhypothesis Within each year the foraging tripsused in our analysis were spread over severalweeks (Table 1) This could render it difficult todetect sub-colony foraging asymmetries becauseof the temporal variations in foraging behaviourassociated with for ex ample changes in preyavailability and distribution (Wanless et al 1998)or reproductive duties (Ito et al 2010) withinbreeding seasons However we think this isunlikely Previous studies show that gannets onGrassholm are consistent in their departure direc-tions their most distant locations and also theirdive locations within breeding seasons (Patricket al 2014) This indicates that gannets are proba-bly ex ploiting temporally predictable foraging lo -cations something which would reduce these po -tentially confounding effects We did find muchvariation in our 5 measurements of foraging be -haviours (Table 2) and this led to greatly varyinglevels of statistical power (Table 3) However atleast for some measurements of foraging behav-iours (distance departure direction and core forag-ing area depending on the year) there was goodstatistical power (Table 3) suggesting that wewere correct to accept the null hypothesis of nodifferences in foraging behaviour among sub-colonies
Yea
r
S
ub
-
At-
sea
mov
emen
t
Dir
ecti
on
Is
otop
ic s
ign
atu
re i
n R
BC
sC
ore
fora
gin
g a
rea
c
olon
y (n
)
Ran
ge
(km
)
D
ista
nce
(k
m)
D
ura
tion
(d
)
D
epar
ture
(deg)
Dis
tal
(deg)
δ15
N
δ13
C
E
asti
ng
s (k
m)
N
orth
ing
s (k
m)
2006
Sc5
(7)
144
71
plusmn 8
917
4
674
3 plusmn
251
07
1
01 plusmn
04
3
31
180
plusmn 0
41
331
10
plusmn 0
40
15
10 plusmn
07
1 1
728
plusmn 0
95
2
953
4 plusmn
110
16
565
906
plusmn 4
420
Sc6
(7)
112
71
plusmn 7
676
3
338
6 plusmn
217
24
0
86 plusmn
03
9
6
906
plusmn 0
35
3
213
plusmn 0
44
15
33 plusmn
06
1 1
731
plusmn 0
58
2
919
7 plusmn
92
69
5693
20
plusmn 2
524
Sc7
(9)
104
33
plusmn 5
428
3
144
4 plusmn
169
80
1
06 plusmn
07
8
14
467
plusmn 0
23
109
54
plusmn 0
21
15
31 plusmn
06
2 1
725
plusmn 0
53
2
666
9 plusmn
58
87
5700
99
plusmn 3
563
2010
Sc1
(5)
14
92
plusmn 7
715
435
8 plusmn
176
84
0
65 plusmn
02
6
28
302
plusmn 0
36
348
44
plusmn 0
42
14
29 plusmn
04
8 1
784
plusmn 0
41
3
232
8 plusmn
36
09
5663
33
plusmn 9
398
Sc2
(4)
16
25
plusmn 9
160
43
5 plusmn
269
77
1
03 plusmn
06
8
4
877
plusmn 0
19
1
982
plusmn 0
28
14
02 plusmn
04
8 1
764
plusmn 0
23
3
099
4 plusmn
38
35
5593
42
plusmn 9
134
Sc4
(5)
13
54
plusmn 2
802
518
6 plusmn
138
64
1
20 plusmn
06
5
31
129
plusmn 0
54
324
19
plusmn 0
61
14
14 plusmn
07
5 1
761
plusmn 0
41
3
424
8 plusmn
59
48
5677
36
plusmn 8
521
Sc7
(3)
116
33
plusmn 8
334
3
143
3 plusmn
205
90
0
62 plusmn
02
5
12
319
plusmn 0
11
8
393
plusmn 0
12
14
96 plusmn
09
2 1
730
plusmn 0
59
2
668
0 plusmn
73
35
5660
70
plusmn 4
270
2011
Sc1
(7)
100
plusmn 3
806
3
354
3 plusmn
132
84
0
66 plusmn
02
3
1
162
plusmn 0
49
326
38
plusmn 0
43
14
85 plusmn
05
1 1
764
plusmn 0
48
3
335
3 plusmn
41
21
5681
55
plusmn 6
400
Sc2
(6)
174
83
plusmn 1
406
8 6
888
3 plusmn
552
30
1
94 plusmn
16
1
8
175
plusmn 0
25
103
31
plusmn 0
16
15
27 plusmn
07
0 1
714
plusmn 0
55
2
522
6 plusmn
49
71
5680
17
plusmn 6
142
Sc3
(3)
87
plusmn 5
803
2
966
7 plusmn
254
30
0
80 plusmn
09
2
30
738
plusmn 0
55
276
16
plusmn 0
45
14
81 plusmn
03
3 1
756
plusmn 0
51
3
561
7 plusmn
38
90
5741
60
plusmn 7
685
Sc4
(6)
139
83
plusmn 5
740
4
338
3 plusmn
171
92
0
83 plusmn
03
9
5
914
plusmn 0
70
383
plusmn 0
78
14
94 plusmn
04
7 1
729
plusmn 0
49
3
102
9 plusmn
81
50
5685
06
plusmn 9
145
Sc7
(10
)
145
plusmn 1
275
7
402
2 plusmn
324
28
0
90 plusmn
06
8
13
023
plusmn 0
11
127
65
plusmn 0
15
14
86 plusmn
05
9 1
740
plusmn 0
47
2
292
7 plusmn
109
58
567
114
plusmn 6
885
Tab
le 2
Mor
us
bas
san
us
Su
mm
ary
of fo
rag
ing
beh
avio
urs
rec
ord
ed fr
om 7
2 ch
ick
-rea
rin
g g
ann
ets
on G
rass
hol
m U
K s
how
ing
mea
n v
alu
es b
y su
b-c
olon
y (S
c1 to
Sc7
)an
d y
ear
(200
6 2
010
and
201
1)
Sam
ple
siz
es a
re s
how
n (
n)
Val
ues
are
pre
sen
ted
as
mea
ns
plusmn S
D w
ith
th
e ex
cep
tion
of
mea
n d
epar
ture
an
d d
ista
l d
irec
tion
s w
her
em
ean
s ar
e p
rese
nte
d w
ith
cir
cula
r va
rian
ces
Th
is is
a d
isp
ersi
on in
dex
bet
wee
n 0
an
d 1
wh
ere
valu
es o
f 0
ind
icat
e th
at d
irec
tion
s w
ere
equ
al a
nd
val
ues
of
1 in
dic
ate
that
dir
ecti
ons
wer
e eq
ual
ly d
istr
ibu
ted
ove
r a
360deg
ran
ge
For
agin
g b
ehav
iou
rs w
ere
reco
rded
usi
ng
GP
S l
ogg
ers
(ran
ge
dis
tan
ce
du
rati
on
dep
artu
re d
irec
tion
s
dis
tal d
irec
tion
cor
e fo
rag
ing
are
as)
and
sta
ble
isot
ope
anal
ysis
of
red
blo
od c
ells
(R
BC
s δ
13C
an
d δ
15N
)
Waggitt et al Sub-colony variation in northern gannets
SIA
Previous work demonstrated clear differences inthe isotope signatures (δ13C and δ15N) of tufted puffinFratercula cirrhata eggs and chick blood cells be -tween 2 sub-colonies on Triangle Island in BritishColumbia Canada (Hipfner et al 2007) These re -sults suggested differences in foraging locations be -tween sub-colonies Here we interpret similar iso-topic signatures among sub-colonies as evidence ofno differences in foraging location among sub-colonies Although it is possible that individuals cap-
tured different prey from the same foraging locationthis would typically lead to differences in δ15N onlyFor example individuals taking discards from dem-ersal fishing vessels will have much higher δ15N val-ues than those taking pelagic fish (Votier et al 2010)However individuals exploiting the same foraginglocation will have broadly similar δ13C values regard-less of their prey choice (Farquhar et al 1989 Robin-son 2001) Therefore when considering the relativelyhigh statistical power in some cases (Table 3) thelack of significant differences represents good evi-dence that foraging locations did not differ among
281
Fig 2 Morus bassanus Foraging movements of chick-rearing northern gannets on Grassholm UK recorded from GPS loggersForaging movements are divided into sub-colonies (Sc1 to Sc7) and years (2006 = blue 2010 = red 2011 = green) The location
of Grassholm is indicated by the black square Sample sizes are also shown (n)
Mar Ecol Prog Ser 498 275ndash285 2014
sub-colonies Furthermore by analysing RBCs thereis also a low likelihood of any temporal variations inforaging behaviour (see above) influencing our re -sults because they represent an integrated signatureover the 3 to 4 wk prior to sampling
In situ observations
Based on previous studies we believed that re -cording gannetsrsquo initial flight directions at the start of
a foraging trip should provide reasonably accurate(eg lt40deg) proxies of their subsequent departure di -rection (Pettex et al 2010) However wind vectorsseemed to influence gannetsrsquo initial flight directionsat the start of foraging trips as an almost 3-foldincrease in the strength of easterly winds on 13 Julyresulted in much more westerly departure directionsbeing recorded on this day Because of this doubt wecannot interpret the similarities seen among neighboursrsquodeparture directions as evidence that they may havebeen commuting towards similar foraging locations
282
Fig 3 Morus bassanus Twenty-five percent kernel density (KD) contours from chick-rearing northern gannets on GrassholmUK calculated from GPS logger data (Fig 2) KD contours are divided into sub-colonies (Sc1 to Sc7) and years (2006 = blue2010 = red 2011 = green) The location of Grassholm is indicated by the black square Sample sizes are also shown (n) Kernel
smoothing parameter = 10 km cell size = 1 km
Waggitt et al Sub-colony variation in northern gannets
Ecological implications
Although the precise mechanisms remain un -known there is growing evidence suggesting thatgannets use social information to inform foraging de-cisions (Gremillet et al 2004 Wakefield et al 2013)Theoretical models suggest that both local en hance -ment and the exchange of social information withinthe colony could influence the at-sea distributions ofgannets (Wakefield et al 2013) If social information
283
Fig 4 Morus bassanus Mean (plusmn SE) δ13C and δ15N values in red blood cells of chick-rearing northern gannets on GrassholmUK Mean δ13C and δ15N values are divided into sub-colonies (Sc1 to Sc7) and years (2006 = blue 2010 = red 2011 = green)
Sample sizes are also shown (n)
Year Foraging behaviour Sex Sub-colony Repeatability Power V F df p V F df p ()
2006 Range (km) 2925 122 0103 0499 221 0615 minus005 55 Distance (km) 3987 122 0060 1329 221 0290 002 79 Duration (d) 0558 122 0464 0158 221 0855 minus011 15 Departure direction (EW NS) 0247 2965 221 0070 0396 2347 419 0072 EW = 011 NS = 027 85 Distal direction (EW NS) 0295 3772 221 0042 0232 1245 419 0308 EW = minus011 NS = 017 23 Isotope signature (δ15N δ13C) 0531 10213 221 0001 0180 0960 419 0440 δ13C = minus015 δ15N = minus011 99 Core foraging area (Lat Lon) 0401 6038 221 0009 0295 1645 419 0183 Lat = 02 Lon = minus011 76
2010 Range (km) 1274 116 0281 0281 314 0838 minus013 24 Distance (km) 4122 116 0065 1001 314 0426 minus010 69 Duration (d) 0424 116 0527 0482 314 0701 minus001 22 Departure direction (EW NS) 0084 0507 215 0615 0598 1669 611 0172 EW = minus011 NS = 053 17 Distal direction (EW NS) 0011 0063 215 0939 0207 0562 611 0829 EW = 003 NS = 0 11 Isotope signature (δ15N δ13C) 0586 0668 215 0532 0580 1660 611 0170 δ13C = minus006 δ15N = minus006 45 Core foraging area (Lat Lon) 0909 0407 215 0675 0417 1055 611 0416 Lat = minus004 Lon = 009 90
2011 Range (km) 0789 131 0382 0636 428 0641 minus006 28 Distance (km) 1434 131 0242 0718 428 0587 004 36 Duration (d) 1633 131 0213 0567 428 0688 016 32 Departure direction (EW NS) 0019 0240 230 0782 0360 1428 824 0207 EW = minus013 NS = 025 17 Distal direction (EW NS) 0021 0270 230 0765 0441 1838 824 0091 EW = minus01 NS = 032 11 Isotope signature (δ15N δ13C) 0164 2461 230 0106 0320 1250 824 0280 δ13C = minus001 δ15N = minus006 53 Core foraging area (Lat Lon) 0013 0185 230 0832 0412 1817 824 0093 Lat = minus007 Lon = 025 42
Table 3 Morus bassanus Summary of ANOVA and MANOVA tests for differences in the foraging behaviour of chick-rearing gannets among sub-colonies and sexes on Grassholm UK in 2006 2010 and 2011 Also displayed are estimates of statistical powerand calculations of repeatability within sub-colonies V = Pillairsquos trace test EW = easterly component NS = northerly component
Significant differences shown in bold
Date n Departure direction (deg) VMR
6 July 2010 87 215 plusmn 35 56312 July 2010 113 205 plusmn 21 21213 July 2010 105 236 plusmn 24 249
Table 4 Morus bassanus Mean plusmn SD departure directions ofgannets nesting in sub-colony 6 (Sc6) on Grassholm UKthat were seen starting foraging trips between 0600 and1100 h GMT on 3 d in July 2010 Sample sizes are shown
(n) Also shown are the variance to mean ratios (VMR)
Mar Ecol Prog Ser 498 275ndash285 2014
was primarily exchanged at the nest site where indi-viduals can observe their neighboursrsquo chick-provision-ing duties and flight directions then we might expectat-sea segregation among sub-colonies This is not thecase here Al though we cannot completely dis miss anexchange at the nest site it seems possible that mostex changes of social information in the colony couldoccur elsewhere such as when individuals raft on thewater surface before starting a foraging trip (Weimers -kirch et al 2010)
The tendency for older or more dominant individu-als to occupy preferential nest sites (Velando amp Freire2001) could lead to colony members grouping them-selves by age or intrinsic quality If it is as sumed thatolder or more dominant individuals are competitivelysuperior or more efficient foragers then sub-coloniescontaining mainly older or dominant individualswould tend to forage closer to the colony or spendless time at sea (Catry amp Furness 1999 Daunt et al2007 Votier et al 2011) Results here suggest thatcolony members are probably not grouping them-selves by age or intrinsic qualities This could indi-cate that there is low variation in the quality of nestsites andor that the locations of preferential nestsites are not spatially aggregated
Methodological implications
Our results suggest that sampling several differentsub-colonies of gannets may not be necessary whenquantifying the foraging behaviours of the colonyas a whole However we cannot yet draw ro bust conclusions for seabirds in general For in stancethere are likely to be variations in the accuracy andexploitability and therefore the use of social infor-mation at the nest site among different species (Kingamp Cowlishaw 2007) Grouping by age or intrinsicqualities may also be more likely in species where
there is high variation in the quality of nest sites andthe locations of preferential nest sites are spatiallyaggregated (Velando amp Freire 2001) Given our cur-rent lack of knowledge across seabird species weurge further tests of this hypothesis elsewhere Byunderstanding when and why sub-colony foragingasymmetries occur appropriate sampling designscan be developed to ensure that the foraging behav-iours recorded from both GPS loggers and SIA arerepresentative of the colony as a whole By increas-ing our confidence in the accuracy of studies aimingto record and monitor individual foraging behaviourswithin colonies we can start to improve our under-standing of how changes to the en vironment broughtabout by marine renewable en ergies commercialfisheries marine pollution or climate change couldaffect seabird populations
Acknowledgements The opportunity to conduct fieldworkon Grassholm Island was kindly provided by the Royal Soci-ety for the Protection of Birds and device attachment andblood sampling was conducted with the permission of theCountryside Council for Wales We thank G Morgan LMorgan and T Brooke for their assistance during fieldworkand T Guilford R Freeman H Kirk and B Dean for theiradvice on the GPS logger programme and attachmentFinally we also thank 3 anonymous re viewers whose com-ments greatly improved this manuscript Funding was pro-vided by the European Union Interreg CHARM III projectNERC (NEH0071991 and NEG0010141) NERC LSMSFgrant lsquoEK134-1708rsquo and the Peninsula Research Institutefor Marine Renewable Energy
LITERATURE CITED
Arauacutejo MS Bolnick DI Layman CA (2011) The ecologicalcauses of individual specialisation Ecol Lett 14 948minus958
Bearhop S Waldron S Votier SC Furness RW (2002) Factorsthat influence assimilation rates and fractionation ofnitrogen and carbon stable isotopes in avian blood andfeathers Physiol Biochem Zool 75 451minus458
Calenge C (2006) The package adehabitat for the R soft-ware a tool for the analysis of space and habitat use by
284
Fig 5 Morus bassanus Departure directions of breeding northern gannets in sub-colony 6 (Sc6) on Grassholm UK on 3 d in July 2010
Waggitt et al Sub-colony variation in northern gannets
animals Ecol Model 197 516minus519Catry P Furness RW (1999) The influence of adult age on
territorial attendance by breeding great skuas Catharac -ta skua an experimental study J Avian Biol 30 399minus406
Champely S (2009) pwr basic functions for power analysisR package version 111 httpcranr-project org webpackagespwrindexhtml
Coulson JC (2002) Colonial breeding in seabirds In Schreiber EA Burger J (eds) Biology of marine birdsCRC Press Boca Raton FL p 87minus113
Danchin E Wagner RH (1997) The evolution of coloniality the emergence of new perspectives Trends Ecol Evol 12 342minus347
Daunt F Wanless S Harris MP Money L Monaghan P(2007) Older and wiser improvements in breeding suc-cess are linked to better foraging performance in Euro-pean shags Funct Ecol 21 561minus567
Deniro MJ Epstein S (1981) Influence of diet on the distribu-tion of nitrogen isotopes in animals Geochim Cosmo -chim Acta 45 341minus351
Farquhar GD Ehleringer JR Hubick KT (1989) Carbon iso-tope discrimination and photosynthesis Annu Rev PlantPhysiol Plant Mol Biol 40 503minus537
Gremillet D DellrsquoOmo G Ryan PG Peters G Ropert-Coudert Y Weeks SJ (2004) Offshore diplomacy or howseabirds mitigate intra-specific competition a case studybased on GPS tracking of Cape gannets from neighbour-ing colonies Mar Ecol Prog Ser 268 265minus279
Hamer KC Humphreys EM Garthe S Hennicke J and oth-ers (2007) Annual variation in diets feeding locationsand foraging behaviour of gannets in the North Sea flex-ibility consistency and constraint Mar Ecol Prog Ser 338 295minus305
Hamer KC Humphreys EM Magalhatildees MC Garthe S andothers (2009) Fine-scale foraging behaviour of amedium- ranging marine predator J Anim Ecol 78 880minus889
Hipfner JM Charette MR Blackburn GY (2007) Subcolonyvariation in breeding success in the tufted puffin Frater-cula cirrhata association with foraging ecology andimplications Auk 124 1149minus1157
Hobson KA Clark RG (1992) Assessing avian diets usingstable isotopes II factors influencing diet-tissue fraction-ation Condor 94 189minus197
Inger R Bearhop S (2008) Applications of stable isotopeanalyses to avian ecology Ibis 150 447minus461
Ito M Takahashi A Kokubun N Kitaysky AS Watanuki Y(2010) Foraging behavior of incubating and chick-rearing thick-billed murres Uria lomvia Aquat Biol 8 279minus287
King AJ Cowlishaw G (2007) When to use social informa-tion the advantage of large group size in individual deci-sion making Biol Lett 3 137minus139
Montevecchi W Fifield D Burke C Garthe S Hedd A RailJ Robertson G (2012) Tracking long-distance migrationto assess marine pollution impact Biol Lett 8 218minus221
Murphy KR Myors B Wolach A (2012) Statistical poweranalysis a simple and general model for traditional andmodern hypothesis tests 3rd edn Taylor amp Francis NewYork NY
Nakagawa S Schielzeth H (2010) Repeatability for Gaussianand non-Gaussian data a practical guide for biologistsBiol Rev Camb Philos Soc 85 935minus956
Patrick SC Bearhop S Greacutemillet D Lescroeumll A and others(2014) Individual differences in searching behaviour andspatial foraging consistency in a central place marinepredator Oikos 12333ndash40
Pettex E Bonadonna F Enstipp MR Siorat F Greacutemillet D(2010) Northern gannets anticipate the spatio-temporaloccurrence of their prey J Exp Biol 213 2365minus2371
R Development Core Team (2010) R a language and en -vironment for statistical computing R Foundation for Statistical Computing Vienna
Robinson D (2001) δ15N as an integrator of the nitrogencycle Trends Ecol Evol 16 153minus162
Ropert-Coudert Y Wilson RP (2005) Trends and perspec-tives in animal-attached remote sensing Front Ecol Env-iron 3 437minus444
Soanes LM Atkinson PW Gauvain RD Green JA (2013a)Individual consistency in the foraging behaviour ofnorthern gannets implications for interactions with off-shore renewable energy developments Mar Policy 38 507minus514
Soanes LM Arnould JPY Dodd SG Sumner MD Green JA(2013b) How many seabirds do we need to track todefine home-range area J Appl Ecol 50 671minus679
Stauss C Bearhop S Bodey TW Garthe S and others (2012)Sex-specific foraging behaviour in northern gannetsMorus bassanus incidence and implications Mar EcolProg Ser 457 151minus162
Velando A Freire J (2001) How general is the central-periphery distribution among seabird colonies Nestspatial pattern in the European shag Condor 103 544minus554
Votier SC Bearhop S Crane JE Arcos JM Furness RW(2007) Seabird predation by great skuas Stercorariusskua mdash intra-specific competition for food J Avian Biol38 234minus246
Votier SC Bearhop S Witt MJ Inger R Thompson D New-ton J (2010) Individual responses of seabirds to commer-cial fisheries revealed using GPS tracking stable iso-topes and vessel monitoring systems J Appl Ecol 47 487minus497
Votier SC Grecian WJ Patrick S Newton J (2011) Inter-colony movements at-sea behaviour and foraging in animmature seabird results from GPS-PPT tracking radio-tracking and stable isotope analysis Mar Biol 158 355minus362
Votier SC Bicknell A Cox SL Scales KL Patrick SC (2013)A birdrsquos eye view of discard reforms bird-borne camerasreveal seabirdfishery interactions PLoS ONE 8 e57376
Wakefield ED Bodey TW Bearhop S Blackburn J and others (2013) Space partitioning without territoriality ingannets Science 341 68minus70
Wanless S Greacutemillet D Harris MP (1998) Foraging activityand performance of shags Phalacrocorax aristotelis inrelation to environmental characteristics J Avian Biol 29 49minus54
Ward P Zahavi A (1973) The importance of certain assem-blages of birds as information centres for food findingIbis 115 517minus534
Wearmouth VJ Sims DW (2008) Sexual segregation in mar-ine fish reptiles birds and mammals behaviour pat-terns mechanisms and conservation implications AdvMar Biol 54 107minus170
Weimerskirch H Bertrand S Silva J Marques JC Goya E(2010) Use of social information in seabirds compassrafts indicate the heading of food patches PLoS ONE 5 e9928
Weimerskirch H Louzao M de Grissac S Delord K (2012)Changes in wind pattern alter albatross distribution andlife-history traits Science 335 211minus214
Zar JH (2010) Biostatistical analysis 5th edn Pearson Pren-tice Hall Upper Saddle River NJ
285
Editorial responsibility Jacob Gonzaacutelez-Soliacutes Barcelona Spain
Submitted May 14 2013 Accepted October 28 2013Proofs received from author(s) January 24 2014

Mar Ecol Prog Ser 498 275ndash285 2014
competition for prey around colonies Foraging dif-ferences may arise because of age (Daunt et al 2007Votier et al 2011) and sex (Wearmouth amp Sims 2008)while individual-level specialisations independent ofthese factors are also increasingly apparent (Arauacutejoet al 2011) In addition there may also be differencesin foraging behaviour that arise because of spatialstructuring of individuals within the colony but thesehave been less well studied For instance coloniescan often be divided into several discrete and iso-lated sub-colonies An exchange of social informa-tion among neighbours at the nest site re garding thelocation of foraging opportunities (Ward amp Zahavi1973) could lead to at-sea segregation among sub-colonies Alternatively if colony members groupedthemselves by age or intrinsic qualities (Velando ampFreire 2001) then sub-colonies containing mainlyolder or more dominant individuals may forage closerto the colony or spend less time at sea (Catry amp Furness 1999 Daunt et al 2007 Votier et al 2011)Therefore sub-colony foraging asymmetries couldoffer useful insights into the ecological processesassociated with colonial living but such studies arescarce (Hipfner et al 2007)
The presence of sub-colony foraging asymmetriescould also have important methodological conse-quences In recent years there has been a rapid in -crease in the use of GPS loggers (Ropert-Coudert ampWilson 2005) and stable isotope analysis (SIA Ingeramp Bearhop 2008) to study the foraging behaviour ofcolonial seabirds during the breeding season Muchof this work requires individuals to be captured atthe nest site However because of problems of acces-sibility individuals are rarely captured randomlythroughout the colony Instead many are capturedfrom a few easily accessible sub-colonies In mostcases the foraging behaviours recorded from theseindividuals are then assumed to be representativeof those from the colony as a whole (Soanes et al2013b) In the presence of sub-colony foraging asym-metries these assumptions may be incorrect Thiscould have important implications in studies esti -mating colony-level impacts from marine renewableenergy installations (Soanes et al 2013a) commer-cial fisheries (Votier et al 2010 2013) marine pollu-tion (Montevecchi et al 2012) and climate change(Weimerskirch et al 2012)
Here we test for differences in foraging behaviouramong 7 sub-colonies of a large northern gannetMorus bassanus (hereafter gannet) colony over 3 yrduring the chick-rearing stages We used a combina-tion of GPS loggers and SIA to quantify and thencompare a range of individual foraging behaviours
among sub-colonies We also tested for similarities inneighboursrsquo (individuals from the same sub-colony)initial flight directions at the start of their foragingtrips by performing in situ observations in 1 sub-colony in 1 yr Our overall aim was to determine theextent to which sub-colonies explained the variationin individual foraging behaviours within the colonyWe then considered these results with regards tospatial structuring of individuals within colonies aswell as the sampling design of GPS logger and SIAstudies aiming to quantify the foraging behaviours ofthe colony as a whole
MATERIALS AND METHODS
Study site and sampling
Fieldwork was conducted on Grassholm WalesUK (51deg 43rsquo N 05deg 28rsquo W Fig 1a) in June and July2006 2010 and 2011 Approximately 40 000 pairsof gannets breed on Grassholm between April andOctober We were able to access 7 sub-colonies without causing detrimental levels of disturbance tobreeding birds (Fig 1b) As northern and westernsub-colonies were inaccessible our sampling effortswere biased towards southern and eastern sub-colonies However in all cases sub-colonies repre-sented groups of neighbours that were isolated fromthe rest of the colony by topographic features suchas valleys and rocky outcrops Therefore birdsfrom one sub-colony were unable to see those fromanother sub-colony while at their nest site
276
0 200 km 0 200 m
Celtic Sea
Irish Sea
Ireland
UK
Grassholm
Colony
Sc7Sc6 Sc5
Sc4Sc3
Sc2
Sc1
a b
Fig 1 Morus bassanus Study sites (a) Fieldwork was con-ducted on the large (~40 000 breeding pairs) northern gan-net colony on Grassholm Wales UK indicated by a blacksquare (b) We focused on 7 sub-colonies (Sc1 to Sc7) thatwere situated around the periphery of the colony Sub-colonies were separated from one another by topographicfeatures such as rocky outcrops and valleys Therefore birdsfrom one sub-colony were unable to see those from another
sub-colony while at their nest site
Waggitt et al Sub-colony variation in northern gannets
We caught 72 chick-rearing gannets at their nestsites using a brass noose or hook on a carbon-fibrepole under licence from the Countryside Council forWales All birds were equipped with a GPS loggerwith permission from the British Trust for Ornithol-ogy (see lsquoGPS trackingrsquo below) and blood was sam-pled (see lsquoSIArsquo below) under licence from the UKHome Office Blood samples were also used for sub-sequent sexing using molecular techniques (Stauss etal 2012) Following release all birds flew off stronglywith no obvious ill effects Our sample sizes anddates are summarised in Table 1
GPS tracking
We equipped all 72 birds with GPS loggers In2006 we used 65 g GPSlog loggers (earthampOCEANTechnologies) whereas in 2010 to 2011 we used 35 gi-gotu GPS loggers (Mobile Action Technology)These were attached to the base of the tail or lowerback using Tesareg tape Devices recorded GPS fixesat 3 and 1 min intervals in 2006 and 2010 to 2011respectively In many cases devices recorded multi-ple foraging trips from a single bird However be -cause gannets on Grassholm have consistent forag-ing behaviours within breeding seasons (Patrick etal 2014) we only analysed the first foraging trip toprevent issues of pseudoreplication
We calculated each birdrsquos departure direction (deg)distal direction (deg) trip duration (decimal days) triplength (total distance covered km) and range (maxi-mum distance from the colony km) Departure direc-
tions were calculated between Grassholm and theirfirst location at 10 km distance from the colony toexclude any rafting behaviour (resting on the sea surface) near the coastline Distal directions werecalculated between Grassholm and their most distantlocation from the colony In addition to these 5 meas-urements we also estimated each birdrsquos core forag-ing areas using fixed kernel density estimation (KDE)with a smoothing parameter (h) of 10 km and a cellsize of 1 km2 This smoothing parameter was chosenbe cause of the mean scale of area-restricted search(ARS) be haviour (sinuous and slow movements as -sociated with foraging activities) in gannets (91 plusmn19 km Hamer et al 2009) In many cases 50 den-sity contours are used to identify a birdrsquos core forag-ing area (Hamer et al 2007) Here comparisons be -tween KDE analysis and GPS fixes showed that 50contours often included commuting flights betweenforaging locations and the colony However for themost part 25 contours only identified areas wherebirds intensified their ARS behaviours (Hamer et al2009) Therefore we used 25 contours to identifyand quantify core foraging areas taking the centroidof their easting and northing values (km) using theUniversal Transverse Mercator zone 30N coordinatesystem KDE was performed using the lsquoadehabitatHRrsquo package (Calenge 2006) in R (version 2130R Development Core Team 2010)
SIA
We analysed stable carbon (13C12C δ13C) andnitro gen (15N14N δ15N) isotope ratios of red bloodcells (RBCs) in all 72 birds This provides integratedforaging information from the previous 3 to 4 wkThis approach relies on the fact that stable isotoperatios in consumer tissues reflect those in their preyin a predictable manner δ13C exhibits a slight step-wise trophic enrichment (~1) but varies mainly be -cause of geographical differences in photosyntheticbiochemistry within and among marine primary pro-ducer communities In marine environments δ13Calso varies because of differences in latitude depthand distance to land masses (Farqu har et al 1989Robinson 2001) δ15N becomes en riched by 3 to 5permilwith each trophic level (Deniro amp Epstein 1981 Hob-son amp Clark 1992 Bearhop et al 2002) and reflectsdifferences in the trophic level of prey or differencesin food chain length Therefore combining δ15N andδ13C values into an isotopic signature can provide auseful proxy for foraging locations by quantifyingboth their geographical properties and prey composi-
277
Year Sampling date Sub- No of No of colony males females
2006 12minus14 July Sc5 5 2 12minus14 July Sc6 2 5 17 Juneminus14 July Sc7 2 7
2010 6minus11 July Sc1 1 4 5minus11 July Sc2 1 3 5minus11 July Sc4 1 4 6minus12 July Sc7 1 2
2011 23 Juneminus13 July Sc1 3 4 10minus22 July Sc2 2 4 10minus22 July Sc3 1 2 27 Juneminus23 July Sc4 1 5 27 Juneminus23 July Sc7 6 4
Table 1 Morus bassanus Sample sizes divided into sexsub-colonies and years on Grassholm UK Also shown aresampling dates within each sub-colony (Sc1 to Sc7) by yearAll birds were equipped with GPS loggers and blood was
sampled for stable isotope analysis
Mar Ecol Prog Ser 498 275ndash285 2014
tion If there are consistent differences in foraginglocations among sub-colonies this should be re -flected in the respective isotopic signatures of birdssampled there
Approximately 02 ml of blood was taken from thetarsal vein using a 23 gauge needle under licensefrom the UK Home Office Within 2 to 3 h RBCs wereseparated from plasma using a centrifuge beforebeing stored on ice Prior to elemental analysis sam-ples were freeze dried and homogenised and ap -proximately 07 mg was weighed into tin capsulesIsotope analysis was conducted at the East Kilbridenode of the Natural Environment Research Council(NERC) Life Sciences Mass Spectrometry Facility(LSMSF) via continuous flow isotope ratio massspectro metry using a Costech ECS 4010 elementalana lyser interfaced with a Thermo Electron delta XPmass spectrometer Isotope ratios (R) of 15N14N and13C12C are expressed in delta (δ) units as parts perthousand (permil) where δ13C or δ15N = [(R sampleR standard) minus 1] times 1000 The international standards(= 0permil) for SIA are atmospheric N2 for nitrogen andPee Dee Belemnite for carbon
In situ observations
Previous studies using GPS loggers found that theinitial flight directions of most gannets at around1 km from the nest site differed only slightly (lt40deg)from their subsequent departure directions at 10 kmfrom the nest site (Pettex et al 2010) Thereforerecording a birdrsquos initial flight direction at the start ofa foraging trip may be a useful proxy of its subse-quent departure direction To record departure di -rections from a larger number of birds than we couldfrom our GPS loggers we performed in situ ob -servations within 1 sub-colony (Sc6 Fig 1b) on 6 12and 13 July 2010 Observations were performed be -tween 0600 and 1100 h GMT to coincide with thetime period when most birds start their foragingtrips Observation periods avoided times of poor visi-bility We recorded departure directions for each birdstarting a foraging trip during observation periodsDeparture directions were recorded as the bearingbetween Sc6 and the location where they were nolonger visible with the naked eye As visibility wasgood during observation periods this was usuallyaround 1 km from their nest site All birds departedindividually (ie birds did not depart in flocks) andeach recording represented an independent sampleBecause of the topography around the observationpoint our field of view was re stricted to between 140
and 280deg However only 7 of 305 birds starting a foraging trip during observations periods took bear-ings of lt140deg and 280deg Despite our restricted field ofview we expected that neighbours commutingtowards the same foraging location would have simi-lar departure directions within this range of values(140 to 280deg)
Analysis
Because combinations of sub-colonies were not thesame in all years (Table 1) we statistically tested fordifferences in foraging behaviours among sub-colonies in 2006 2010 and 2011 separately This re -moved the possibility of Type I errors ie interpret-ing differences between years as differencesbe tween sub-colonies In all statistical tests we in -cluded both sub-colony and sex as explanatory vari-ables to account for differences in foraging behav-iours between sexes (Stauss et al 2012)
We tested for sub-colony differences in trip dura-tion trip length and range using ANOVA tests withone of these 3 foraging behaviours as the responsevariable and sub-colony and sex as explanatory fac-tors We log transformed trip duration trip lengthand range to correct for a small number of very longforaging trips As isotopic signatures (δ15N and δ13C)and core foraging areas (eastings and northings km)both had 2 response variables we tested for sub-colony differences using multivariate analysis of vari-ance (MANOVA Pillairsquos trace V) These models hadeither δ15N and δ13C or eastings and northings as re -sponse variables and sub-colony and sex as ex plana -tory variables For directional tracking data (depar-ture directions distal directions) we calculated thenortherly and easterly components using their cosineand sine values respectively By using cosine andsine values we were able to use conventional ratherthan circular statistics We then tested for sub-colonydifferences using MANOVA tests with cosine andsine values as response variables and sub-colony andsex as explanatory variables
In all ANOVA and MANOVA tests residuals werenormally distributed (following log transformation oftrip duration trip length and range) with no clearoutliers or high leverage points For all tests we in -cluded 2 additional analyses First we calculated anestimate of statistical power (based on an alpha of005) to quantify the probability of committing Type IIerrors When using MANOVA tests we chose the re sponse variable with the least leverage as a conser-vative measure of power (Murphy et al 2012) Sec-
278
Waggitt et al Sub-colony variation in northern gannets 279
ond we calculated the intra-class correlation coeffi-cient (Nakagawa amp Schielzeth 2010) to compare thevariance in foraging behaviours within sub-coloniesto the variance among sub-colonies This provides arepeatability index between 0 and 1 where an indexof 0 would indicate low similarities among neigh-bours and an index of 1 would indicate high similari-ties among neighbours Here we interpret high re -peatability indices as consistent with the emergenceof sub-colony foraging asymmetries (ie that the vari-ance in foraging behaviours within sub-colonies wasgreater than the variance among sub-colonies)
For our in situ observations we tested for similari-ties among neighboursrsquo departure directions in Sc6using 2 approaches First we calculated the variance(σ2) to mean (μ) ratio (VMR) among departure direc-tions for each day This provided a dispersion indexbetween 0 and 10 where an index of 0 would indi-cate maximum similarities with all neighboursrsquo de -parture directions being identical and an index of~10 would indicate maximum dissimilarities withneighboursrsquo departure directions being equally dis-tributed between 140 and 280deg Second we tested fordifferences in departure directions among days usingan ANOVA test In this test we used departure direc-tions as response variables and the day as the ex -planatory variable From the results of this ANOVAwe were able to calculate the intra-class correlationcoefficient (see above) to provide an indication of thevariance in departure directions within each daycompared to the variance among days VMR andrepeatability indices were then used in conjunctionwith a visual inspection of histograms to determinewhether neighbours had similar departure directionsand may have been commuting towards the sameforaging locations
All statistical analysis was performed in R (version2130 R Development Core Team 2010) For poweranalysis we used the lsquopwrrsquo package (Champely2009) and for repeatability analysis we used thelsquorptRrsquo package (Nakagawa amp Schielzeth 2010)Means are usually shown with standard deviationsHowever in the case of the directional data that wererecorded from GPS loggers (departure and distaldirections) means are shown with estimations of cir-cular variance This is a dispersion index between 0and 1 where values of 0 indicate that all directionsare equal and values of 1 indicate that directionswere equally distributed across 360deg (Zar 2010) Thisap proach was taken because the use of standarddeviations is inappropriate on directional data witha potential range of values greater than 180deg (Zar2010)
RESULTS
GPS tracking
Mean foraging behaviours by sub-colony and yearare shown in Table 2 At-sea movements and core foraging areas by sub-colony and year are shown inFigs 2 amp 3 respectively Visual inspection of at-seamovements and core foraging areas revealed no clearqualitative differences among sub-colonies in anyyear We also found no statistically significant differ-ences in foraging behaviours among sub-colonies inany year Repeatability within sub-colonies was alsogenerally low (Table 3) However there was a statisti-cally significant influence of sex on distal directionsand core foraging areas in 2006 (Table 3)
SIA
Mean δ13C and δ15N RBC values by sub-colony andyear are shown in Table 2 and Fig 4 We found no statistically significant differences in mean isotopicsignatures among sub-colonies Repeatability withinsub-colonies was also generally low (Table 3) How-ever there was a statistically significant influence ofsex on isotopic signatures in 2006 (Table 3)
In situ observations
Our in situ observations are summarised in Table 4and Fig 5 In total we recorded departure directionsfrom 305 birds in Sc6 Counts ranged from 87 to 113birds per day The daily VMR varied between 212 and562 and the overall repeatability index was 0267Taken together with visual inspections of histograms(Fig 5) these results suggested some similarities inneighboursrsquo departure directions Significant differ-ences in departure direction were seen among days(ANOVA F2303 = 37735 p lt 001) with a shift to wardsmore westerly bearings seen on 13 July This shift to-wards more westerly bearings coincided with strongereasterly winds during the observation period (6 Julyspeed = 249 m sminus1 direction = 133deg 12 July speed =249 m sminus1 direction = 119deg 13 July speed = 675 msminus1 direction = 148deg Skomer Reserve Marine Team)
DISCUSSION
Here we investigate whether foraging behavioursdiffered among 7 sub-colonies of a large gannet
Mar Ecol Prog Ser 498 275ndash285 2014280
colony using a combination of GPS loggers and SIAEven when sampling 72 individuals from 7 sub-colonies across 3 yr we found no clear evidence ofany sub-colony foraging asymmetries Repeatabilityindices also suggested low similarities in neigh-boursrsquo foraging behaviours (Table 3) Despite ourhighly variable statistical power (Table 3) there isno clear indication that this lack of a statistically sig-nificant difference is a Type II error Although com-plimentary in situ observations suggested similari-ties among neighboursrsquo departure directions in 1sub-colony (Fig 5) this may be attributable to astrong influence of wind vectors on individualsrsquo ini-tial flight directions at the start of a foraging tripBelow we discuss our results from GPS loggers SIAand in situ observations separately before consider-ing the ecological and methodological implicationsof this research
GPS loggers
While we found no clear differences among 7sub-colonies in 6 different measures of foragingbehaviour derived from GPS loggers we need todiscuss the possibility of falsely accepting our nullhypothesis Within each year the foraging tripsused in our analysis were spread over severalweeks (Table 1) This could render it difficult todetect sub-colony foraging asymmetries becauseof the temporal variations in foraging behaviourassociated with for ex ample changes in preyavailability and distribution (Wanless et al 1998)or reproductive duties (Ito et al 2010) withinbreeding seasons However we think this isunlikely Previous studies show that gannets onGrassholm are consistent in their departure direc-tions their most distant locations and also theirdive locations within breeding seasons (Patricket al 2014) This indicates that gannets are proba-bly ex ploiting temporally predictable foraging lo -cations something which would reduce these po -tentially confounding effects We did find muchvariation in our 5 measurements of foraging be -haviours (Table 2) and this led to greatly varyinglevels of statistical power (Table 3) However atleast for some measurements of foraging behav-iours (distance departure direction and core forag-ing area depending on the year) there was goodstatistical power (Table 3) suggesting that wewere correct to accept the null hypothesis of nodifferences in foraging behaviour among sub-colonies
Yea
r
S
ub
-
At-
sea
mov
emen
t
Dir
ecti
on
Is
otop
ic s
ign
atu
re i
n R
BC
sC
ore
fora
gin
g a
rea
c
olon
y (n
)
Ran
ge
(km
)
D
ista
nce
(k
m)
D
ura
tion
(d
)
D
epar
ture
(deg)
Dis
tal
(deg)
δ15
N
δ13
C
E
asti
ng
s (k
m)
N
orth
ing
s (k
m)
2006
Sc5
(7)
144
71
plusmn 8
917
4
674
3 plusmn
251
07
1
01 plusmn
04
3
31
180
plusmn 0
41
331
10
plusmn 0
40
15
10 plusmn
07
1 1
728
plusmn 0
95
2
953
4 plusmn
110
16
565
906
plusmn 4
420
Sc6
(7)
112
71
plusmn 7
676
3
338
6 plusmn
217
24
0
86 plusmn
03
9
6
906
plusmn 0
35
3
213
plusmn 0
44
15
33 plusmn
06
1 1
731
plusmn 0
58
2
919
7 plusmn
92
69
5693
20
plusmn 2
524
Sc7
(9)
104
33
plusmn 5
428
3
144
4 plusmn
169
80
1
06 plusmn
07
8
14
467
plusmn 0
23
109
54
plusmn 0
21
15
31 plusmn
06
2 1
725
plusmn 0
53
2
666
9 plusmn
58
87
5700
99
plusmn 3
563
2010
Sc1
(5)
14
92
plusmn 7
715
435
8 plusmn
176
84
0
65 plusmn
02
6
28
302
plusmn 0
36
348
44
plusmn 0
42
14
29 plusmn
04
8 1
784
plusmn 0
41
3
232
8 plusmn
36
09
5663
33
plusmn 9
398
Sc2
(4)
16
25
plusmn 9
160
43
5 plusmn
269
77
1
03 plusmn
06
8
4
877
plusmn 0
19
1
982
plusmn 0
28
14
02 plusmn
04
8 1
764
plusmn 0
23
3
099
4 plusmn
38
35
5593
42
plusmn 9
134
Sc4
(5)
13
54
plusmn 2
802
518
6 plusmn
138
64
1
20 plusmn
06
5
31
129
plusmn 0
54
324
19
plusmn 0
61
14
14 plusmn
07
5 1
761
plusmn 0
41
3
424
8 plusmn
59
48
5677
36
plusmn 8
521
Sc7
(3)
116
33
plusmn 8
334
3
143
3 plusmn
205
90
0
62 plusmn
02
5
12
319
plusmn 0
11
8
393
plusmn 0
12
14
96 plusmn
09
2 1
730
plusmn 0
59
2
668
0 plusmn
73
35
5660
70
plusmn 4
270
2011
Sc1
(7)
100
plusmn 3
806
3
354
3 plusmn
132
84
0
66 plusmn
02
3
1
162
plusmn 0
49
326
38
plusmn 0
43
14
85 plusmn
05
1 1
764
plusmn 0
48
3
335
3 plusmn
41
21
5681
55
plusmn 6
400
Sc2
(6)
174
83
plusmn 1
406
8 6
888
3 plusmn
552
30
1
94 plusmn
16
1
8
175
plusmn 0
25
103
31
plusmn 0
16
15
27 plusmn
07
0 1
714
plusmn 0
55
2
522
6 plusmn
49
71
5680
17
plusmn 6
142
Sc3
(3)
87
plusmn 5
803
2
966
7 plusmn
254
30
0
80 plusmn
09
2
30
738
plusmn 0
55
276
16
plusmn 0
45
14
81 plusmn
03
3 1
756
plusmn 0
51
3
561
7 plusmn
38
90
5741
60
plusmn 7
685
Sc4
(6)
139
83
plusmn 5
740
4
338
3 plusmn
171
92
0
83 plusmn
03
9
5
914
plusmn 0
70
383
plusmn 0
78
14
94 plusmn
04
7 1
729
plusmn 0
49
3
102
9 plusmn
81
50
5685
06
plusmn 9
145
Sc7
(10
)
145
plusmn 1
275
7
402
2 plusmn
324
28
0
90 plusmn
06
8
13
023
plusmn 0
11
127
65
plusmn 0
15
14
86 plusmn
05
9 1
740
plusmn 0
47
2
292
7 plusmn
109
58
567
114
plusmn 6
885
Tab
le 2
Mor
us
bas
san
us
Su
mm
ary
of fo
rag
ing
beh
avio
urs
rec
ord
ed fr
om 7
2 ch
ick
-rea
rin
g g
ann
ets
on G
rass
hol
m U
K s
how
ing
mea
n v
alu
es b
y su
b-c
olon
y (S
c1 to
Sc7
)an
d y
ear
(200
6 2
010
and
201
1)
Sam
ple
siz
es a
re s
how
n (
n)
Val
ues
are
pre
sen
ted
as
mea
ns
plusmn S
D w
ith
th
e ex
cep
tion
of
mea
n d
epar
ture
an
d d
ista
l d
irec
tion
s w
her
em
ean
s ar
e p
rese
nte
d w
ith
cir
cula
r va
rian
ces
Th
is is
a d
isp
ersi
on in
dex
bet
wee
n 0
an
d 1
wh
ere
valu
es o
f 0
ind
icat
e th
at d
irec
tion
s w
ere
equ
al a
nd
val
ues
of
1 in
dic
ate
that
dir
ecti
ons
wer
e eq
ual
ly d
istr
ibu
ted
ove
r a
360deg
ran
ge
For
agin
g b
ehav
iou
rs w
ere
reco
rded
usi
ng
GP
S l
ogg
ers
(ran
ge
dis
tan
ce
du
rati
on
dep
artu
re d
irec
tion
s
dis
tal d
irec
tion
cor
e fo
rag
ing
are
as)
and
sta
ble
isot
ope
anal
ysis
of
red
blo
od c
ells
(R
BC
s δ
13C
an
d δ
15N
)
Waggitt et al Sub-colony variation in northern gannets
SIA
Previous work demonstrated clear differences inthe isotope signatures (δ13C and δ15N) of tufted puffinFratercula cirrhata eggs and chick blood cells be -tween 2 sub-colonies on Triangle Island in BritishColumbia Canada (Hipfner et al 2007) These re -sults suggested differences in foraging locations be -tween sub-colonies Here we interpret similar iso-topic signatures among sub-colonies as evidence ofno differences in foraging location among sub-colonies Although it is possible that individuals cap-
tured different prey from the same foraging locationthis would typically lead to differences in δ15N onlyFor example individuals taking discards from dem-ersal fishing vessels will have much higher δ15N val-ues than those taking pelagic fish (Votier et al 2010)However individuals exploiting the same foraginglocation will have broadly similar δ13C values regard-less of their prey choice (Farquhar et al 1989 Robin-son 2001) Therefore when considering the relativelyhigh statistical power in some cases (Table 3) thelack of significant differences represents good evi-dence that foraging locations did not differ among
281
Fig 2 Morus bassanus Foraging movements of chick-rearing northern gannets on Grassholm UK recorded from GPS loggersForaging movements are divided into sub-colonies (Sc1 to Sc7) and years (2006 = blue 2010 = red 2011 = green) The location
of Grassholm is indicated by the black square Sample sizes are also shown (n)
Mar Ecol Prog Ser 498 275ndash285 2014
sub-colonies Furthermore by analysing RBCs thereis also a low likelihood of any temporal variations inforaging behaviour (see above) influencing our re -sults because they represent an integrated signatureover the 3 to 4 wk prior to sampling
In situ observations
Based on previous studies we believed that re -cording gannetsrsquo initial flight directions at the start of
a foraging trip should provide reasonably accurate(eg lt40deg) proxies of their subsequent departure di -rection (Pettex et al 2010) However wind vectorsseemed to influence gannetsrsquo initial flight directionsat the start of foraging trips as an almost 3-foldincrease in the strength of easterly winds on 13 Julyresulted in much more westerly departure directionsbeing recorded on this day Because of this doubt wecannot interpret the similarities seen among neighboursrsquodeparture directions as evidence that they may havebeen commuting towards similar foraging locations
282
Fig 3 Morus bassanus Twenty-five percent kernel density (KD) contours from chick-rearing northern gannets on GrassholmUK calculated from GPS logger data (Fig 2) KD contours are divided into sub-colonies (Sc1 to Sc7) and years (2006 = blue2010 = red 2011 = green) The location of Grassholm is indicated by the black square Sample sizes are also shown (n) Kernel
smoothing parameter = 10 km cell size = 1 km
Waggitt et al Sub-colony variation in northern gannets
Ecological implications
Although the precise mechanisms remain un -known there is growing evidence suggesting thatgannets use social information to inform foraging de-cisions (Gremillet et al 2004 Wakefield et al 2013)Theoretical models suggest that both local en hance -ment and the exchange of social information withinthe colony could influence the at-sea distributions ofgannets (Wakefield et al 2013) If social information
283
Fig 4 Morus bassanus Mean (plusmn SE) δ13C and δ15N values in red blood cells of chick-rearing northern gannets on GrassholmUK Mean δ13C and δ15N values are divided into sub-colonies (Sc1 to Sc7) and years (2006 = blue 2010 = red 2011 = green)
Sample sizes are also shown (n)
Year Foraging behaviour Sex Sub-colony Repeatability Power V F df p V F df p ()
2006 Range (km) 2925 122 0103 0499 221 0615 minus005 55 Distance (km) 3987 122 0060 1329 221 0290 002 79 Duration (d) 0558 122 0464 0158 221 0855 minus011 15 Departure direction (EW NS) 0247 2965 221 0070 0396 2347 419 0072 EW = 011 NS = 027 85 Distal direction (EW NS) 0295 3772 221 0042 0232 1245 419 0308 EW = minus011 NS = 017 23 Isotope signature (δ15N δ13C) 0531 10213 221 0001 0180 0960 419 0440 δ13C = minus015 δ15N = minus011 99 Core foraging area (Lat Lon) 0401 6038 221 0009 0295 1645 419 0183 Lat = 02 Lon = minus011 76
2010 Range (km) 1274 116 0281 0281 314 0838 minus013 24 Distance (km) 4122 116 0065 1001 314 0426 minus010 69 Duration (d) 0424 116 0527 0482 314 0701 minus001 22 Departure direction (EW NS) 0084 0507 215 0615 0598 1669 611 0172 EW = minus011 NS = 053 17 Distal direction (EW NS) 0011 0063 215 0939 0207 0562 611 0829 EW = 003 NS = 0 11 Isotope signature (δ15N δ13C) 0586 0668 215 0532 0580 1660 611 0170 δ13C = minus006 δ15N = minus006 45 Core foraging area (Lat Lon) 0909 0407 215 0675 0417 1055 611 0416 Lat = minus004 Lon = 009 90
2011 Range (km) 0789 131 0382 0636 428 0641 minus006 28 Distance (km) 1434 131 0242 0718 428 0587 004 36 Duration (d) 1633 131 0213 0567 428 0688 016 32 Departure direction (EW NS) 0019 0240 230 0782 0360 1428 824 0207 EW = minus013 NS = 025 17 Distal direction (EW NS) 0021 0270 230 0765 0441 1838 824 0091 EW = minus01 NS = 032 11 Isotope signature (δ15N δ13C) 0164 2461 230 0106 0320 1250 824 0280 δ13C = minus001 δ15N = minus006 53 Core foraging area (Lat Lon) 0013 0185 230 0832 0412 1817 824 0093 Lat = minus007 Lon = 025 42
Table 3 Morus bassanus Summary of ANOVA and MANOVA tests for differences in the foraging behaviour of chick-rearing gannets among sub-colonies and sexes on Grassholm UK in 2006 2010 and 2011 Also displayed are estimates of statistical powerand calculations of repeatability within sub-colonies V = Pillairsquos trace test EW = easterly component NS = northerly component
Significant differences shown in bold
Date n Departure direction (deg) VMR
6 July 2010 87 215 plusmn 35 56312 July 2010 113 205 plusmn 21 21213 July 2010 105 236 plusmn 24 249
Table 4 Morus bassanus Mean plusmn SD departure directions ofgannets nesting in sub-colony 6 (Sc6) on Grassholm UKthat were seen starting foraging trips between 0600 and1100 h GMT on 3 d in July 2010 Sample sizes are shown
(n) Also shown are the variance to mean ratios (VMR)
Mar Ecol Prog Ser 498 275ndash285 2014
was primarily exchanged at the nest site where indi-viduals can observe their neighboursrsquo chick-provision-ing duties and flight directions then we might expectat-sea segregation among sub-colonies This is not thecase here Al though we cannot completely dis miss anexchange at the nest site it seems possible that mostex changes of social information in the colony couldoccur elsewhere such as when individuals raft on thewater surface before starting a foraging trip (Weimers -kirch et al 2010)
The tendency for older or more dominant individu-als to occupy preferential nest sites (Velando amp Freire2001) could lead to colony members grouping them-selves by age or intrinsic quality If it is as sumed thatolder or more dominant individuals are competitivelysuperior or more efficient foragers then sub-coloniescontaining mainly older or dominant individualswould tend to forage closer to the colony or spendless time at sea (Catry amp Furness 1999 Daunt et al2007 Votier et al 2011) Results here suggest thatcolony members are probably not grouping them-selves by age or intrinsic qualities This could indi-cate that there is low variation in the quality of nestsites andor that the locations of preferential nestsites are not spatially aggregated
Methodological implications
Our results suggest that sampling several differentsub-colonies of gannets may not be necessary whenquantifying the foraging behaviours of the colonyas a whole However we cannot yet draw ro bust conclusions for seabirds in general For in stancethere are likely to be variations in the accuracy andexploitability and therefore the use of social infor-mation at the nest site among different species (Kingamp Cowlishaw 2007) Grouping by age or intrinsicqualities may also be more likely in species where
there is high variation in the quality of nest sites andthe locations of preferential nest sites are spatiallyaggregated (Velando amp Freire 2001) Given our cur-rent lack of knowledge across seabird species weurge further tests of this hypothesis elsewhere Byunderstanding when and why sub-colony foragingasymmetries occur appropriate sampling designscan be developed to ensure that the foraging behav-iours recorded from both GPS loggers and SIA arerepresentative of the colony as a whole By increas-ing our confidence in the accuracy of studies aimingto record and monitor individual foraging behaviourswithin colonies we can start to improve our under-standing of how changes to the en vironment broughtabout by marine renewable en ergies commercialfisheries marine pollution or climate change couldaffect seabird populations
Acknowledgements The opportunity to conduct fieldworkon Grassholm Island was kindly provided by the Royal Soci-ety for the Protection of Birds and device attachment andblood sampling was conducted with the permission of theCountryside Council for Wales We thank G Morgan LMorgan and T Brooke for their assistance during fieldworkand T Guilford R Freeman H Kirk and B Dean for theiradvice on the GPS logger programme and attachmentFinally we also thank 3 anonymous re viewers whose com-ments greatly improved this manuscript Funding was pro-vided by the European Union Interreg CHARM III projectNERC (NEH0071991 and NEG0010141) NERC LSMSFgrant lsquoEK134-1708rsquo and the Peninsula Research Institutefor Marine Renewable Energy
LITERATURE CITED
Arauacutejo MS Bolnick DI Layman CA (2011) The ecologicalcauses of individual specialisation Ecol Lett 14 948minus958
Bearhop S Waldron S Votier SC Furness RW (2002) Factorsthat influence assimilation rates and fractionation ofnitrogen and carbon stable isotopes in avian blood andfeathers Physiol Biochem Zool 75 451minus458
Calenge C (2006) The package adehabitat for the R soft-ware a tool for the analysis of space and habitat use by
284
Fig 5 Morus bassanus Departure directions of breeding northern gannets in sub-colony 6 (Sc6) on Grassholm UK on 3 d in July 2010
Waggitt et al Sub-colony variation in northern gannets
animals Ecol Model 197 516minus519Catry P Furness RW (1999) The influence of adult age on
territorial attendance by breeding great skuas Catharac -ta skua an experimental study J Avian Biol 30 399minus406
Champely S (2009) pwr basic functions for power analysisR package version 111 httpcranr-project org webpackagespwrindexhtml
Coulson JC (2002) Colonial breeding in seabirds In Schreiber EA Burger J (eds) Biology of marine birdsCRC Press Boca Raton FL p 87minus113
Danchin E Wagner RH (1997) The evolution of coloniality the emergence of new perspectives Trends Ecol Evol 12 342minus347
Daunt F Wanless S Harris MP Money L Monaghan P(2007) Older and wiser improvements in breeding suc-cess are linked to better foraging performance in Euro-pean shags Funct Ecol 21 561minus567
Deniro MJ Epstein S (1981) Influence of diet on the distribu-tion of nitrogen isotopes in animals Geochim Cosmo -chim Acta 45 341minus351
Farquhar GD Ehleringer JR Hubick KT (1989) Carbon iso-tope discrimination and photosynthesis Annu Rev PlantPhysiol Plant Mol Biol 40 503minus537
Gremillet D DellrsquoOmo G Ryan PG Peters G Ropert-Coudert Y Weeks SJ (2004) Offshore diplomacy or howseabirds mitigate intra-specific competition a case studybased on GPS tracking of Cape gannets from neighbour-ing colonies Mar Ecol Prog Ser 268 265minus279
Hamer KC Humphreys EM Garthe S Hennicke J and oth-ers (2007) Annual variation in diets feeding locationsand foraging behaviour of gannets in the North Sea flex-ibility consistency and constraint Mar Ecol Prog Ser 338 295minus305
Hamer KC Humphreys EM Magalhatildees MC Garthe S andothers (2009) Fine-scale foraging behaviour of amedium- ranging marine predator J Anim Ecol 78 880minus889
Hipfner JM Charette MR Blackburn GY (2007) Subcolonyvariation in breeding success in the tufted puffin Frater-cula cirrhata association with foraging ecology andimplications Auk 124 1149minus1157
Hobson KA Clark RG (1992) Assessing avian diets usingstable isotopes II factors influencing diet-tissue fraction-ation Condor 94 189minus197
Inger R Bearhop S (2008) Applications of stable isotopeanalyses to avian ecology Ibis 150 447minus461
Ito M Takahashi A Kokubun N Kitaysky AS Watanuki Y(2010) Foraging behavior of incubating and chick-rearing thick-billed murres Uria lomvia Aquat Biol 8 279minus287
King AJ Cowlishaw G (2007) When to use social informa-tion the advantage of large group size in individual deci-sion making Biol Lett 3 137minus139
Montevecchi W Fifield D Burke C Garthe S Hedd A RailJ Robertson G (2012) Tracking long-distance migrationto assess marine pollution impact Biol Lett 8 218minus221
Murphy KR Myors B Wolach A (2012) Statistical poweranalysis a simple and general model for traditional andmodern hypothesis tests 3rd edn Taylor amp Francis NewYork NY
Nakagawa S Schielzeth H (2010) Repeatability for Gaussianand non-Gaussian data a practical guide for biologistsBiol Rev Camb Philos Soc 85 935minus956
Patrick SC Bearhop S Greacutemillet D Lescroeumll A and others(2014) Individual differences in searching behaviour andspatial foraging consistency in a central place marinepredator Oikos 12333ndash40
Pettex E Bonadonna F Enstipp MR Siorat F Greacutemillet D(2010) Northern gannets anticipate the spatio-temporaloccurrence of their prey J Exp Biol 213 2365minus2371
R Development Core Team (2010) R a language and en -vironment for statistical computing R Foundation for Statistical Computing Vienna
Robinson D (2001) δ15N as an integrator of the nitrogencycle Trends Ecol Evol 16 153minus162
Ropert-Coudert Y Wilson RP (2005) Trends and perspec-tives in animal-attached remote sensing Front Ecol Env-iron 3 437minus444
Soanes LM Atkinson PW Gauvain RD Green JA (2013a)Individual consistency in the foraging behaviour ofnorthern gannets implications for interactions with off-shore renewable energy developments Mar Policy 38 507minus514
Soanes LM Arnould JPY Dodd SG Sumner MD Green JA(2013b) How many seabirds do we need to track todefine home-range area J Appl Ecol 50 671minus679
Stauss C Bearhop S Bodey TW Garthe S and others (2012)Sex-specific foraging behaviour in northern gannetsMorus bassanus incidence and implications Mar EcolProg Ser 457 151minus162
Velando A Freire J (2001) How general is the central-periphery distribution among seabird colonies Nestspatial pattern in the European shag Condor 103 544minus554
Votier SC Bearhop S Crane JE Arcos JM Furness RW(2007) Seabird predation by great skuas Stercorariusskua mdash intra-specific competition for food J Avian Biol38 234minus246
Votier SC Bearhop S Witt MJ Inger R Thompson D New-ton J (2010) Individual responses of seabirds to commer-cial fisheries revealed using GPS tracking stable iso-topes and vessel monitoring systems J Appl Ecol 47 487minus497
Votier SC Grecian WJ Patrick S Newton J (2011) Inter-colony movements at-sea behaviour and foraging in animmature seabird results from GPS-PPT tracking radio-tracking and stable isotope analysis Mar Biol 158 355minus362
Votier SC Bicknell A Cox SL Scales KL Patrick SC (2013)A birdrsquos eye view of discard reforms bird-borne camerasreveal seabirdfishery interactions PLoS ONE 8 e57376
Wakefield ED Bodey TW Bearhop S Blackburn J and others (2013) Space partitioning without territoriality ingannets Science 341 68minus70
Wanless S Greacutemillet D Harris MP (1998) Foraging activityand performance of shags Phalacrocorax aristotelis inrelation to environmental characteristics J Avian Biol 29 49minus54
Ward P Zahavi A (1973) The importance of certain assem-blages of birds as information centres for food findingIbis 115 517minus534
Wearmouth VJ Sims DW (2008) Sexual segregation in mar-ine fish reptiles birds and mammals behaviour pat-terns mechanisms and conservation implications AdvMar Biol 54 107minus170
Weimerskirch H Bertrand S Silva J Marques JC Goya E(2010) Use of social information in seabirds compassrafts indicate the heading of food patches PLoS ONE 5 e9928
Weimerskirch H Louzao M de Grissac S Delord K (2012)Changes in wind pattern alter albatross distribution andlife-history traits Science 335 211minus214
Zar JH (2010) Biostatistical analysis 5th edn Pearson Pren-tice Hall Upper Saddle River NJ
285
Editorial responsibility Jacob Gonzaacutelez-Soliacutes Barcelona Spain
Submitted May 14 2013 Accepted October 28 2013Proofs received from author(s) January 24 2014
Waggitt et al Sub-colony variation in northern gannets
We caught 72 chick-rearing gannets at their nestsites using a brass noose or hook on a carbon-fibrepole under licence from the Countryside Council forWales All birds were equipped with a GPS loggerwith permission from the British Trust for Ornithol-ogy (see lsquoGPS trackingrsquo below) and blood was sam-pled (see lsquoSIArsquo below) under licence from the UKHome Office Blood samples were also used for sub-sequent sexing using molecular techniques (Stauss etal 2012) Following release all birds flew off stronglywith no obvious ill effects Our sample sizes anddates are summarised in Table 1
GPS tracking
We equipped all 72 birds with GPS loggers In2006 we used 65 g GPSlog loggers (earthampOCEANTechnologies) whereas in 2010 to 2011 we used 35 gi-gotu GPS loggers (Mobile Action Technology)These were attached to the base of the tail or lowerback using Tesareg tape Devices recorded GPS fixesat 3 and 1 min intervals in 2006 and 2010 to 2011respectively In many cases devices recorded multi-ple foraging trips from a single bird However be -cause gannets on Grassholm have consistent forag-ing behaviours within breeding seasons (Patrick etal 2014) we only analysed the first foraging trip toprevent issues of pseudoreplication
We calculated each birdrsquos departure direction (deg)distal direction (deg) trip duration (decimal days) triplength (total distance covered km) and range (maxi-mum distance from the colony km) Departure direc-
tions were calculated between Grassholm and theirfirst location at 10 km distance from the colony toexclude any rafting behaviour (resting on the sea surface) near the coastline Distal directions werecalculated between Grassholm and their most distantlocation from the colony In addition to these 5 meas-urements we also estimated each birdrsquos core forag-ing areas using fixed kernel density estimation (KDE)with a smoothing parameter (h) of 10 km and a cellsize of 1 km2 This smoothing parameter was chosenbe cause of the mean scale of area-restricted search(ARS) be haviour (sinuous and slow movements as -sociated with foraging activities) in gannets (91 plusmn19 km Hamer et al 2009) In many cases 50 den-sity contours are used to identify a birdrsquos core forag-ing area (Hamer et al 2007) Here comparisons be -tween KDE analysis and GPS fixes showed that 50contours often included commuting flights betweenforaging locations and the colony However for themost part 25 contours only identified areas wherebirds intensified their ARS behaviours (Hamer et al2009) Therefore we used 25 contours to identifyand quantify core foraging areas taking the centroidof their easting and northing values (km) using theUniversal Transverse Mercator zone 30N coordinatesystem KDE was performed using the lsquoadehabitatHRrsquo package (Calenge 2006) in R (version 2130R Development Core Team 2010)
SIA
We analysed stable carbon (13C12C δ13C) andnitro gen (15N14N δ15N) isotope ratios of red bloodcells (RBCs) in all 72 birds This provides integratedforaging information from the previous 3 to 4 wkThis approach relies on the fact that stable isotoperatios in consumer tissues reflect those in their preyin a predictable manner δ13C exhibits a slight step-wise trophic enrichment (~1) but varies mainly be -cause of geographical differences in photosyntheticbiochemistry within and among marine primary pro-ducer communities In marine environments δ13Calso varies because of differences in latitude depthand distance to land masses (Farqu har et al 1989Robinson 2001) δ15N becomes en riched by 3 to 5permilwith each trophic level (Deniro amp Epstein 1981 Hob-son amp Clark 1992 Bearhop et al 2002) and reflectsdifferences in the trophic level of prey or differencesin food chain length Therefore combining δ15N andδ13C values into an isotopic signature can provide auseful proxy for foraging locations by quantifyingboth their geographical properties and prey composi-
277
Year Sampling date Sub- No of No of colony males females
2006 12minus14 July Sc5 5 2 12minus14 July Sc6 2 5 17 Juneminus14 July Sc7 2 7
2010 6minus11 July Sc1 1 4 5minus11 July Sc2 1 3 5minus11 July Sc4 1 4 6minus12 July Sc7 1 2
2011 23 Juneminus13 July Sc1 3 4 10minus22 July Sc2 2 4 10minus22 July Sc3 1 2 27 Juneminus23 July Sc4 1 5 27 Juneminus23 July Sc7 6 4
Table 1 Morus bassanus Sample sizes divided into sexsub-colonies and years on Grassholm UK Also shown aresampling dates within each sub-colony (Sc1 to Sc7) by yearAll birds were equipped with GPS loggers and blood was
sampled for stable isotope analysis
Mar Ecol Prog Ser 498 275ndash285 2014
tion If there are consistent differences in foraginglocations among sub-colonies this should be re -flected in the respective isotopic signatures of birdssampled there
Approximately 02 ml of blood was taken from thetarsal vein using a 23 gauge needle under licensefrom the UK Home Office Within 2 to 3 h RBCs wereseparated from plasma using a centrifuge beforebeing stored on ice Prior to elemental analysis sam-ples were freeze dried and homogenised and ap -proximately 07 mg was weighed into tin capsulesIsotope analysis was conducted at the East Kilbridenode of the Natural Environment Research Council(NERC) Life Sciences Mass Spectrometry Facility(LSMSF) via continuous flow isotope ratio massspectro metry using a Costech ECS 4010 elementalana lyser interfaced with a Thermo Electron delta XPmass spectrometer Isotope ratios (R) of 15N14N and13C12C are expressed in delta (δ) units as parts perthousand (permil) where δ13C or δ15N = [(R sampleR standard) minus 1] times 1000 The international standards(= 0permil) for SIA are atmospheric N2 for nitrogen andPee Dee Belemnite for carbon
In situ observations
Previous studies using GPS loggers found that theinitial flight directions of most gannets at around1 km from the nest site differed only slightly (lt40deg)from their subsequent departure directions at 10 kmfrom the nest site (Pettex et al 2010) Thereforerecording a birdrsquos initial flight direction at the start ofa foraging trip may be a useful proxy of its subse-quent departure direction To record departure di -rections from a larger number of birds than we couldfrom our GPS loggers we performed in situ ob -servations within 1 sub-colony (Sc6 Fig 1b) on 6 12and 13 July 2010 Observations were performed be -tween 0600 and 1100 h GMT to coincide with thetime period when most birds start their foragingtrips Observation periods avoided times of poor visi-bility We recorded departure directions for each birdstarting a foraging trip during observation periodsDeparture directions were recorded as the bearingbetween Sc6 and the location where they were nolonger visible with the naked eye As visibility wasgood during observation periods this was usuallyaround 1 km from their nest site All birds departedindividually (ie birds did not depart in flocks) andeach recording represented an independent sampleBecause of the topography around the observationpoint our field of view was re stricted to between 140
and 280deg However only 7 of 305 birds starting a foraging trip during observations periods took bear-ings of lt140deg and 280deg Despite our restricted field ofview we expected that neighbours commutingtowards the same foraging location would have simi-lar departure directions within this range of values(140 to 280deg)
Analysis
Because combinations of sub-colonies were not thesame in all years (Table 1) we statistically tested fordifferences in foraging behaviours among sub-colonies in 2006 2010 and 2011 separately This re -moved the possibility of Type I errors ie interpret-ing differences between years as differencesbe tween sub-colonies In all statistical tests we in -cluded both sub-colony and sex as explanatory vari-ables to account for differences in foraging behav-iours between sexes (Stauss et al 2012)
We tested for sub-colony differences in trip dura-tion trip length and range using ANOVA tests withone of these 3 foraging behaviours as the responsevariable and sub-colony and sex as explanatory fac-tors We log transformed trip duration trip lengthand range to correct for a small number of very longforaging trips As isotopic signatures (δ15N and δ13C)and core foraging areas (eastings and northings km)both had 2 response variables we tested for sub-colony differences using multivariate analysis of vari-ance (MANOVA Pillairsquos trace V) These models hadeither δ15N and δ13C or eastings and northings as re -sponse variables and sub-colony and sex as ex plana -tory variables For directional tracking data (depar-ture directions distal directions) we calculated thenortherly and easterly components using their cosineand sine values respectively By using cosine andsine values we were able to use conventional ratherthan circular statistics We then tested for sub-colonydifferences using MANOVA tests with cosine andsine values as response variables and sub-colony andsex as explanatory variables
In all ANOVA and MANOVA tests residuals werenormally distributed (following log transformation oftrip duration trip length and range) with no clearoutliers or high leverage points For all tests we in -cluded 2 additional analyses First we calculated anestimate of statistical power (based on an alpha of005) to quantify the probability of committing Type IIerrors When using MANOVA tests we chose the re sponse variable with the least leverage as a conser-vative measure of power (Murphy et al 2012) Sec-
278
Waggitt et al Sub-colony variation in northern gannets 279
ond we calculated the intra-class correlation coeffi-cient (Nakagawa amp Schielzeth 2010) to compare thevariance in foraging behaviours within sub-coloniesto the variance among sub-colonies This provides arepeatability index between 0 and 1 where an indexof 0 would indicate low similarities among neigh-bours and an index of 1 would indicate high similari-ties among neighbours Here we interpret high re -peatability indices as consistent with the emergenceof sub-colony foraging asymmetries (ie that the vari-ance in foraging behaviours within sub-colonies wasgreater than the variance among sub-colonies)
For our in situ observations we tested for similari-ties among neighboursrsquo departure directions in Sc6using 2 approaches First we calculated the variance(σ2) to mean (μ) ratio (VMR) among departure direc-tions for each day This provided a dispersion indexbetween 0 and 10 where an index of 0 would indi-cate maximum similarities with all neighboursrsquo de -parture directions being identical and an index of~10 would indicate maximum dissimilarities withneighboursrsquo departure directions being equally dis-tributed between 140 and 280deg Second we tested fordifferences in departure directions among days usingan ANOVA test In this test we used departure direc-tions as response variables and the day as the ex -planatory variable From the results of this ANOVAwe were able to calculate the intra-class correlationcoefficient (see above) to provide an indication of thevariance in departure directions within each daycompared to the variance among days VMR andrepeatability indices were then used in conjunctionwith a visual inspection of histograms to determinewhether neighbours had similar departure directionsand may have been commuting towards the sameforaging locations
All statistical analysis was performed in R (version2130 R Development Core Team 2010) For poweranalysis we used the lsquopwrrsquo package (Champely2009) and for repeatability analysis we used thelsquorptRrsquo package (Nakagawa amp Schielzeth 2010)Means are usually shown with standard deviationsHowever in the case of the directional data that wererecorded from GPS loggers (departure and distaldirections) means are shown with estimations of cir-cular variance This is a dispersion index between 0and 1 where values of 0 indicate that all directionsare equal and values of 1 indicate that directionswere equally distributed across 360deg (Zar 2010) Thisap proach was taken because the use of standarddeviations is inappropriate on directional data witha potential range of values greater than 180deg (Zar2010)
RESULTS
GPS tracking
Mean foraging behaviours by sub-colony and yearare shown in Table 2 At-sea movements and core foraging areas by sub-colony and year are shown inFigs 2 amp 3 respectively Visual inspection of at-seamovements and core foraging areas revealed no clearqualitative differences among sub-colonies in anyyear We also found no statistically significant differ-ences in foraging behaviours among sub-colonies inany year Repeatability within sub-colonies was alsogenerally low (Table 3) However there was a statisti-cally significant influence of sex on distal directionsand core foraging areas in 2006 (Table 3)
SIA
Mean δ13C and δ15N RBC values by sub-colony andyear are shown in Table 2 and Fig 4 We found no statistically significant differences in mean isotopicsignatures among sub-colonies Repeatability withinsub-colonies was also generally low (Table 3) How-ever there was a statistically significant influence ofsex on isotopic signatures in 2006 (Table 3)
In situ observations
Our in situ observations are summarised in Table 4and Fig 5 In total we recorded departure directionsfrom 305 birds in Sc6 Counts ranged from 87 to 113birds per day The daily VMR varied between 212 and562 and the overall repeatability index was 0267Taken together with visual inspections of histograms(Fig 5) these results suggested some similarities inneighboursrsquo departure directions Significant differ-ences in departure direction were seen among days(ANOVA F2303 = 37735 p lt 001) with a shift to wardsmore westerly bearings seen on 13 July This shift to-wards more westerly bearings coincided with strongereasterly winds during the observation period (6 Julyspeed = 249 m sminus1 direction = 133deg 12 July speed =249 m sminus1 direction = 119deg 13 July speed = 675 msminus1 direction = 148deg Skomer Reserve Marine Team)
DISCUSSION
Here we investigate whether foraging behavioursdiffered among 7 sub-colonies of a large gannet
Mar Ecol Prog Ser 498 275ndash285 2014280
colony using a combination of GPS loggers and SIAEven when sampling 72 individuals from 7 sub-colonies across 3 yr we found no clear evidence ofany sub-colony foraging asymmetries Repeatabilityindices also suggested low similarities in neigh-boursrsquo foraging behaviours (Table 3) Despite ourhighly variable statistical power (Table 3) there isno clear indication that this lack of a statistically sig-nificant difference is a Type II error Although com-plimentary in situ observations suggested similari-ties among neighboursrsquo departure directions in 1sub-colony (Fig 5) this may be attributable to astrong influence of wind vectors on individualsrsquo ini-tial flight directions at the start of a foraging tripBelow we discuss our results from GPS loggers SIAand in situ observations separately before consider-ing the ecological and methodological implicationsof this research
GPS loggers
While we found no clear differences among 7sub-colonies in 6 different measures of foragingbehaviour derived from GPS loggers we need todiscuss the possibility of falsely accepting our nullhypothesis Within each year the foraging tripsused in our analysis were spread over severalweeks (Table 1) This could render it difficult todetect sub-colony foraging asymmetries becauseof the temporal variations in foraging behaviourassociated with for ex ample changes in preyavailability and distribution (Wanless et al 1998)or reproductive duties (Ito et al 2010) withinbreeding seasons However we think this isunlikely Previous studies show that gannets onGrassholm are consistent in their departure direc-tions their most distant locations and also theirdive locations within breeding seasons (Patricket al 2014) This indicates that gannets are proba-bly ex ploiting temporally predictable foraging lo -cations something which would reduce these po -tentially confounding effects We did find muchvariation in our 5 measurements of foraging be -haviours (Table 2) and this led to greatly varyinglevels of statistical power (Table 3) However atleast for some measurements of foraging behav-iours (distance departure direction and core forag-ing area depending on the year) there was goodstatistical power (Table 3) suggesting that wewere correct to accept the null hypothesis of nodifferences in foraging behaviour among sub-colonies
Yea
r
S
ub
-
At-
sea
mov
emen
t
Dir
ecti
on
Is
otop
ic s
ign
atu
re i
n R
BC
sC
ore
fora
gin
g a
rea
c
olon
y (n
)
Ran
ge
(km
)
D
ista
nce
(k
m)
D
ura
tion
(d
)
D
epar
ture
(deg)
Dis
tal
(deg)
δ15
N
δ13
C
E
asti
ng
s (k
m)
N
orth
ing
s (k
m)
2006
Sc5
(7)
144
71
plusmn 8
917
4
674
3 plusmn
251
07
1
01 plusmn
04
3
31
180
plusmn 0
41
331
10
plusmn 0
40
15
10 plusmn
07
1 1
728
plusmn 0
95
2
953
4 plusmn
110
16
565
906
plusmn 4
420
Sc6
(7)
112
71
plusmn 7
676
3
338
6 plusmn
217
24
0
86 plusmn
03
9
6
906
plusmn 0
35
3
213
plusmn 0
44
15
33 plusmn
06
1 1
731
plusmn 0
58
2
919
7 plusmn
92
69
5693
20
plusmn 2
524
Sc7
(9)
104
33
plusmn 5
428
3
144
4 plusmn
169
80
1
06 plusmn
07
8
14
467
plusmn 0
23
109
54
plusmn 0
21
15
31 plusmn
06
2 1
725
plusmn 0
53
2
666
9 plusmn
58
87
5700
99
plusmn 3
563
2010
Sc1
(5)
14
92
plusmn 7
715
435
8 plusmn
176
84
0
65 plusmn
02
6
28
302
plusmn 0
36
348
44
plusmn 0
42
14
29 plusmn
04
8 1
784
plusmn 0
41
3
232
8 plusmn
36
09
5663
33
plusmn 9
398
Sc2
(4)
16
25
plusmn 9
160
43
5 plusmn
269
77
1
03 plusmn
06
8
4
877
plusmn 0
19
1
982
plusmn 0
28
14
02 plusmn
04
8 1
764
plusmn 0
23
3
099
4 plusmn
38
35
5593
42
plusmn 9
134
Sc4
(5)
13
54
plusmn 2
802
518
6 plusmn
138
64
1
20 plusmn
06
5
31
129
plusmn 0
54
324
19
plusmn 0
61
14
14 plusmn
07
5 1
761
plusmn 0
41
3
424
8 plusmn
59
48
5677
36
plusmn 8
521
Sc7
(3)
116
33
plusmn 8
334
3
143
3 plusmn
205
90
0
62 plusmn
02
5
12
319
plusmn 0
11
8
393
plusmn 0
12
14
96 plusmn
09
2 1
730
plusmn 0
59
2
668
0 plusmn
73
35
5660
70
plusmn 4
270
2011
Sc1
(7)
100
plusmn 3
806
3
354
3 plusmn
132
84
0
66 plusmn
02
3
1
162
plusmn 0
49
326
38
plusmn 0
43
14
85 plusmn
05
1 1
764
plusmn 0
48
3
335
3 plusmn
41
21
5681
55
plusmn 6
400
Sc2
(6)
174
83
plusmn 1
406
8 6
888
3 plusmn
552
30
1
94 plusmn
16
1
8
175
plusmn 0
25
103
31
plusmn 0
16
15
27 plusmn
07
0 1
714
plusmn 0
55
2
522
6 plusmn
49
71
5680
17
plusmn 6
142
Sc3
(3)
87
plusmn 5
803
2
966
7 plusmn
254
30
0
80 plusmn
09
2
30
738
plusmn 0
55
276
16
plusmn 0
45
14
81 plusmn
03
3 1
756
plusmn 0
51
3
561
7 plusmn
38
90
5741
60
plusmn 7
685
Sc4
(6)
139
83
plusmn 5
740
4
338
3 plusmn
171
92
0
83 plusmn
03
9
5
914
plusmn 0
70
383
plusmn 0
78
14
94 plusmn
04
7 1
729
plusmn 0
49
3
102
9 plusmn
81
50
5685
06
plusmn 9
145
Sc7
(10
)
145
plusmn 1
275
7
402
2 plusmn
324
28
0
90 plusmn
06
8
13
023
plusmn 0
11
127
65
plusmn 0
15
14
86 plusmn
05
9 1
740
plusmn 0
47
2
292
7 plusmn
109
58
567
114
plusmn 6
885
Tab
le 2
Mor
us
bas
san
us
Su
mm
ary
of fo
rag
ing
beh
avio
urs
rec
ord
ed fr
om 7
2 ch
ick
-rea
rin
g g
ann
ets
on G
rass
hol
m U
K s
how
ing
mea
n v
alu
es b
y su
b-c
olon
y (S
c1 to
Sc7
)an
d y
ear
(200
6 2
010
and
201
1)
Sam
ple
siz
es a
re s
how
n (
n)
Val
ues
are
pre
sen
ted
as
mea
ns
plusmn S
D w
ith
th
e ex
cep
tion
of
mea
n d
epar
ture
an
d d
ista
l d
irec
tion
s w
her
em
ean
s ar
e p
rese
nte
d w
ith
cir
cula
r va
rian
ces
Th
is is
a d
isp
ersi
on in
dex
bet
wee
n 0
an
d 1
wh
ere
valu
es o
f 0
ind
icat
e th
at d
irec
tion
s w
ere
equ
al a
nd
val
ues
of
1 in
dic
ate
that
dir
ecti
ons
wer
e eq
ual
ly d
istr
ibu
ted
ove
r a
360deg
ran
ge
For
agin
g b
ehav
iou
rs w
ere
reco
rded
usi
ng
GP
S l
ogg
ers
(ran
ge
dis
tan
ce
du
rati
on
dep
artu
re d
irec
tion
s
dis
tal d
irec
tion
cor
e fo
rag
ing
are
as)
and
sta
ble
isot
ope
anal
ysis
of
red
blo
od c
ells
(R
BC
s δ
13C
an
d δ
15N
)
Waggitt et al Sub-colony variation in northern gannets
SIA
Previous work demonstrated clear differences inthe isotope signatures (δ13C and δ15N) of tufted puffinFratercula cirrhata eggs and chick blood cells be -tween 2 sub-colonies on Triangle Island in BritishColumbia Canada (Hipfner et al 2007) These re -sults suggested differences in foraging locations be -tween sub-colonies Here we interpret similar iso-topic signatures among sub-colonies as evidence ofno differences in foraging location among sub-colonies Although it is possible that individuals cap-
tured different prey from the same foraging locationthis would typically lead to differences in δ15N onlyFor example individuals taking discards from dem-ersal fishing vessels will have much higher δ15N val-ues than those taking pelagic fish (Votier et al 2010)However individuals exploiting the same foraginglocation will have broadly similar δ13C values regard-less of their prey choice (Farquhar et al 1989 Robin-son 2001) Therefore when considering the relativelyhigh statistical power in some cases (Table 3) thelack of significant differences represents good evi-dence that foraging locations did not differ among
281
Fig 2 Morus bassanus Foraging movements of chick-rearing northern gannets on Grassholm UK recorded from GPS loggersForaging movements are divided into sub-colonies (Sc1 to Sc7) and years (2006 = blue 2010 = red 2011 = green) The location
of Grassholm is indicated by the black square Sample sizes are also shown (n)
Mar Ecol Prog Ser 498 275ndash285 2014
sub-colonies Furthermore by analysing RBCs thereis also a low likelihood of any temporal variations inforaging behaviour (see above) influencing our re -sults because they represent an integrated signatureover the 3 to 4 wk prior to sampling
In situ observations
Based on previous studies we believed that re -cording gannetsrsquo initial flight directions at the start of
a foraging trip should provide reasonably accurate(eg lt40deg) proxies of their subsequent departure di -rection (Pettex et al 2010) However wind vectorsseemed to influence gannetsrsquo initial flight directionsat the start of foraging trips as an almost 3-foldincrease in the strength of easterly winds on 13 Julyresulted in much more westerly departure directionsbeing recorded on this day Because of this doubt wecannot interpret the similarities seen among neighboursrsquodeparture directions as evidence that they may havebeen commuting towards similar foraging locations
282
Fig 3 Morus bassanus Twenty-five percent kernel density (KD) contours from chick-rearing northern gannets on GrassholmUK calculated from GPS logger data (Fig 2) KD contours are divided into sub-colonies (Sc1 to Sc7) and years (2006 = blue2010 = red 2011 = green) The location of Grassholm is indicated by the black square Sample sizes are also shown (n) Kernel
smoothing parameter = 10 km cell size = 1 km
Waggitt et al Sub-colony variation in northern gannets
Ecological implications
Although the precise mechanisms remain un -known there is growing evidence suggesting thatgannets use social information to inform foraging de-cisions (Gremillet et al 2004 Wakefield et al 2013)Theoretical models suggest that both local en hance -ment and the exchange of social information withinthe colony could influence the at-sea distributions ofgannets (Wakefield et al 2013) If social information
283
Fig 4 Morus bassanus Mean (plusmn SE) δ13C and δ15N values in red blood cells of chick-rearing northern gannets on GrassholmUK Mean δ13C and δ15N values are divided into sub-colonies (Sc1 to Sc7) and years (2006 = blue 2010 = red 2011 = green)
Sample sizes are also shown (n)
Year Foraging behaviour Sex Sub-colony Repeatability Power V F df p V F df p ()
2006 Range (km) 2925 122 0103 0499 221 0615 minus005 55 Distance (km) 3987 122 0060 1329 221 0290 002 79 Duration (d) 0558 122 0464 0158 221 0855 minus011 15 Departure direction (EW NS) 0247 2965 221 0070 0396 2347 419 0072 EW = 011 NS = 027 85 Distal direction (EW NS) 0295 3772 221 0042 0232 1245 419 0308 EW = minus011 NS = 017 23 Isotope signature (δ15N δ13C) 0531 10213 221 0001 0180 0960 419 0440 δ13C = minus015 δ15N = minus011 99 Core foraging area (Lat Lon) 0401 6038 221 0009 0295 1645 419 0183 Lat = 02 Lon = minus011 76
2010 Range (km) 1274 116 0281 0281 314 0838 minus013 24 Distance (km) 4122 116 0065 1001 314 0426 minus010 69 Duration (d) 0424 116 0527 0482 314 0701 minus001 22 Departure direction (EW NS) 0084 0507 215 0615 0598 1669 611 0172 EW = minus011 NS = 053 17 Distal direction (EW NS) 0011 0063 215 0939 0207 0562 611 0829 EW = 003 NS = 0 11 Isotope signature (δ15N δ13C) 0586 0668 215 0532 0580 1660 611 0170 δ13C = minus006 δ15N = minus006 45 Core foraging area (Lat Lon) 0909 0407 215 0675 0417 1055 611 0416 Lat = minus004 Lon = 009 90
2011 Range (km) 0789 131 0382 0636 428 0641 minus006 28 Distance (km) 1434 131 0242 0718 428 0587 004 36 Duration (d) 1633 131 0213 0567 428 0688 016 32 Departure direction (EW NS) 0019 0240 230 0782 0360 1428 824 0207 EW = minus013 NS = 025 17 Distal direction (EW NS) 0021 0270 230 0765 0441 1838 824 0091 EW = minus01 NS = 032 11 Isotope signature (δ15N δ13C) 0164 2461 230 0106 0320 1250 824 0280 δ13C = minus001 δ15N = minus006 53 Core foraging area (Lat Lon) 0013 0185 230 0832 0412 1817 824 0093 Lat = minus007 Lon = 025 42
Table 3 Morus bassanus Summary of ANOVA and MANOVA tests for differences in the foraging behaviour of chick-rearing gannets among sub-colonies and sexes on Grassholm UK in 2006 2010 and 2011 Also displayed are estimates of statistical powerand calculations of repeatability within sub-colonies V = Pillairsquos trace test EW = easterly component NS = northerly component
Significant differences shown in bold
Date n Departure direction (deg) VMR
6 July 2010 87 215 plusmn 35 56312 July 2010 113 205 plusmn 21 21213 July 2010 105 236 plusmn 24 249
Table 4 Morus bassanus Mean plusmn SD departure directions ofgannets nesting in sub-colony 6 (Sc6) on Grassholm UKthat were seen starting foraging trips between 0600 and1100 h GMT on 3 d in July 2010 Sample sizes are shown
(n) Also shown are the variance to mean ratios (VMR)
Mar Ecol Prog Ser 498 275ndash285 2014
was primarily exchanged at the nest site where indi-viduals can observe their neighboursrsquo chick-provision-ing duties and flight directions then we might expectat-sea segregation among sub-colonies This is not thecase here Al though we cannot completely dis miss anexchange at the nest site it seems possible that mostex changes of social information in the colony couldoccur elsewhere such as when individuals raft on thewater surface before starting a foraging trip (Weimers -kirch et al 2010)
The tendency for older or more dominant individu-als to occupy preferential nest sites (Velando amp Freire2001) could lead to colony members grouping them-selves by age or intrinsic quality If it is as sumed thatolder or more dominant individuals are competitivelysuperior or more efficient foragers then sub-coloniescontaining mainly older or dominant individualswould tend to forage closer to the colony or spendless time at sea (Catry amp Furness 1999 Daunt et al2007 Votier et al 2011) Results here suggest thatcolony members are probably not grouping them-selves by age or intrinsic qualities This could indi-cate that there is low variation in the quality of nestsites andor that the locations of preferential nestsites are not spatially aggregated
Methodological implications
Our results suggest that sampling several differentsub-colonies of gannets may not be necessary whenquantifying the foraging behaviours of the colonyas a whole However we cannot yet draw ro bust conclusions for seabirds in general For in stancethere are likely to be variations in the accuracy andexploitability and therefore the use of social infor-mation at the nest site among different species (Kingamp Cowlishaw 2007) Grouping by age or intrinsicqualities may also be more likely in species where
there is high variation in the quality of nest sites andthe locations of preferential nest sites are spatiallyaggregated (Velando amp Freire 2001) Given our cur-rent lack of knowledge across seabird species weurge further tests of this hypothesis elsewhere Byunderstanding when and why sub-colony foragingasymmetries occur appropriate sampling designscan be developed to ensure that the foraging behav-iours recorded from both GPS loggers and SIA arerepresentative of the colony as a whole By increas-ing our confidence in the accuracy of studies aimingto record and monitor individual foraging behaviourswithin colonies we can start to improve our under-standing of how changes to the en vironment broughtabout by marine renewable en ergies commercialfisheries marine pollution or climate change couldaffect seabird populations
Acknowledgements The opportunity to conduct fieldworkon Grassholm Island was kindly provided by the Royal Soci-ety for the Protection of Birds and device attachment andblood sampling was conducted with the permission of theCountryside Council for Wales We thank G Morgan LMorgan and T Brooke for their assistance during fieldworkand T Guilford R Freeman H Kirk and B Dean for theiradvice on the GPS logger programme and attachmentFinally we also thank 3 anonymous re viewers whose com-ments greatly improved this manuscript Funding was pro-vided by the European Union Interreg CHARM III projectNERC (NEH0071991 and NEG0010141) NERC LSMSFgrant lsquoEK134-1708rsquo and the Peninsula Research Institutefor Marine Renewable Energy
LITERATURE CITED
Arauacutejo MS Bolnick DI Layman CA (2011) The ecologicalcauses of individual specialisation Ecol Lett 14 948minus958
Bearhop S Waldron S Votier SC Furness RW (2002) Factorsthat influence assimilation rates and fractionation ofnitrogen and carbon stable isotopes in avian blood andfeathers Physiol Biochem Zool 75 451minus458
Calenge C (2006) The package adehabitat for the R soft-ware a tool for the analysis of space and habitat use by
284
Fig 5 Morus bassanus Departure directions of breeding northern gannets in sub-colony 6 (Sc6) on Grassholm UK on 3 d in July 2010
Waggitt et al Sub-colony variation in northern gannets
animals Ecol Model 197 516minus519Catry P Furness RW (1999) The influence of adult age on
territorial attendance by breeding great skuas Catharac -ta skua an experimental study J Avian Biol 30 399minus406
Champely S (2009) pwr basic functions for power analysisR package version 111 httpcranr-project org webpackagespwrindexhtml
Coulson JC (2002) Colonial breeding in seabirds In Schreiber EA Burger J (eds) Biology of marine birdsCRC Press Boca Raton FL p 87minus113
Danchin E Wagner RH (1997) The evolution of coloniality the emergence of new perspectives Trends Ecol Evol 12 342minus347
Daunt F Wanless S Harris MP Money L Monaghan P(2007) Older and wiser improvements in breeding suc-cess are linked to better foraging performance in Euro-pean shags Funct Ecol 21 561minus567
Deniro MJ Epstein S (1981) Influence of diet on the distribu-tion of nitrogen isotopes in animals Geochim Cosmo -chim Acta 45 341minus351
Farquhar GD Ehleringer JR Hubick KT (1989) Carbon iso-tope discrimination and photosynthesis Annu Rev PlantPhysiol Plant Mol Biol 40 503minus537
Gremillet D DellrsquoOmo G Ryan PG Peters G Ropert-Coudert Y Weeks SJ (2004) Offshore diplomacy or howseabirds mitigate intra-specific competition a case studybased on GPS tracking of Cape gannets from neighbour-ing colonies Mar Ecol Prog Ser 268 265minus279
Hamer KC Humphreys EM Garthe S Hennicke J and oth-ers (2007) Annual variation in diets feeding locationsand foraging behaviour of gannets in the North Sea flex-ibility consistency and constraint Mar Ecol Prog Ser 338 295minus305
Hamer KC Humphreys EM Magalhatildees MC Garthe S andothers (2009) Fine-scale foraging behaviour of amedium- ranging marine predator J Anim Ecol 78 880minus889
Hipfner JM Charette MR Blackburn GY (2007) Subcolonyvariation in breeding success in the tufted puffin Frater-cula cirrhata association with foraging ecology andimplications Auk 124 1149minus1157
Hobson KA Clark RG (1992) Assessing avian diets usingstable isotopes II factors influencing diet-tissue fraction-ation Condor 94 189minus197
Inger R Bearhop S (2008) Applications of stable isotopeanalyses to avian ecology Ibis 150 447minus461
Ito M Takahashi A Kokubun N Kitaysky AS Watanuki Y(2010) Foraging behavior of incubating and chick-rearing thick-billed murres Uria lomvia Aquat Biol 8 279minus287
King AJ Cowlishaw G (2007) When to use social informa-tion the advantage of large group size in individual deci-sion making Biol Lett 3 137minus139
Montevecchi W Fifield D Burke C Garthe S Hedd A RailJ Robertson G (2012) Tracking long-distance migrationto assess marine pollution impact Biol Lett 8 218minus221
Murphy KR Myors B Wolach A (2012) Statistical poweranalysis a simple and general model for traditional andmodern hypothesis tests 3rd edn Taylor amp Francis NewYork NY
Nakagawa S Schielzeth H (2010) Repeatability for Gaussianand non-Gaussian data a practical guide for biologistsBiol Rev Camb Philos Soc 85 935minus956
Patrick SC Bearhop S Greacutemillet D Lescroeumll A and others(2014) Individual differences in searching behaviour andspatial foraging consistency in a central place marinepredator Oikos 12333ndash40
Pettex E Bonadonna F Enstipp MR Siorat F Greacutemillet D(2010) Northern gannets anticipate the spatio-temporaloccurrence of their prey J Exp Biol 213 2365minus2371
R Development Core Team (2010) R a language and en -vironment for statistical computing R Foundation for Statistical Computing Vienna
Robinson D (2001) δ15N as an integrator of the nitrogencycle Trends Ecol Evol 16 153minus162
Ropert-Coudert Y Wilson RP (2005) Trends and perspec-tives in animal-attached remote sensing Front Ecol Env-iron 3 437minus444
Soanes LM Atkinson PW Gauvain RD Green JA (2013a)Individual consistency in the foraging behaviour ofnorthern gannets implications for interactions with off-shore renewable energy developments Mar Policy 38 507minus514
Soanes LM Arnould JPY Dodd SG Sumner MD Green JA(2013b) How many seabirds do we need to track todefine home-range area J Appl Ecol 50 671minus679
Stauss C Bearhop S Bodey TW Garthe S and others (2012)Sex-specific foraging behaviour in northern gannetsMorus bassanus incidence and implications Mar EcolProg Ser 457 151minus162
Velando A Freire J (2001) How general is the central-periphery distribution among seabird colonies Nestspatial pattern in the European shag Condor 103 544minus554
Votier SC Bearhop S Crane JE Arcos JM Furness RW(2007) Seabird predation by great skuas Stercorariusskua mdash intra-specific competition for food J Avian Biol38 234minus246
Votier SC Bearhop S Witt MJ Inger R Thompson D New-ton J (2010) Individual responses of seabirds to commer-cial fisheries revealed using GPS tracking stable iso-topes and vessel monitoring systems J Appl Ecol 47 487minus497
Votier SC Grecian WJ Patrick S Newton J (2011) Inter-colony movements at-sea behaviour and foraging in animmature seabird results from GPS-PPT tracking radio-tracking and stable isotope analysis Mar Biol 158 355minus362
Votier SC Bicknell A Cox SL Scales KL Patrick SC (2013)A birdrsquos eye view of discard reforms bird-borne camerasreveal seabirdfishery interactions PLoS ONE 8 e57376
Wakefield ED Bodey TW Bearhop S Blackburn J and others (2013) Space partitioning without territoriality ingannets Science 341 68minus70
Wanless S Greacutemillet D Harris MP (1998) Foraging activityand performance of shags Phalacrocorax aristotelis inrelation to environmental characteristics J Avian Biol 29 49minus54
Ward P Zahavi A (1973) The importance of certain assem-blages of birds as information centres for food findingIbis 115 517minus534
Wearmouth VJ Sims DW (2008) Sexual segregation in mar-ine fish reptiles birds and mammals behaviour pat-terns mechanisms and conservation implications AdvMar Biol 54 107minus170
Weimerskirch H Bertrand S Silva J Marques JC Goya E(2010) Use of social information in seabirds compassrafts indicate the heading of food patches PLoS ONE 5 e9928
Weimerskirch H Louzao M de Grissac S Delord K (2012)Changes in wind pattern alter albatross distribution andlife-history traits Science 335 211minus214
Zar JH (2010) Biostatistical analysis 5th edn Pearson Pren-tice Hall Upper Saddle River NJ
285
Editorial responsibility Jacob Gonzaacutelez-Soliacutes Barcelona Spain
Submitted May 14 2013 Accepted October 28 2013Proofs received from author(s) January 24 2014

Mar Ecol Prog Ser 498 275ndash285 2014
tion If there are consistent differences in foraginglocations among sub-colonies this should be re -flected in the respective isotopic signatures of birdssampled there
Approximately 02 ml of blood was taken from thetarsal vein using a 23 gauge needle under licensefrom the UK Home Office Within 2 to 3 h RBCs wereseparated from plasma using a centrifuge beforebeing stored on ice Prior to elemental analysis sam-ples were freeze dried and homogenised and ap -proximately 07 mg was weighed into tin capsulesIsotope analysis was conducted at the East Kilbridenode of the Natural Environment Research Council(NERC) Life Sciences Mass Spectrometry Facility(LSMSF) via continuous flow isotope ratio massspectro metry using a Costech ECS 4010 elementalana lyser interfaced with a Thermo Electron delta XPmass spectrometer Isotope ratios (R) of 15N14N and13C12C are expressed in delta (δ) units as parts perthousand (permil) where δ13C or δ15N = [(R sampleR standard) minus 1] times 1000 The international standards(= 0permil) for SIA are atmospheric N2 for nitrogen andPee Dee Belemnite for carbon
In situ observations
Previous studies using GPS loggers found that theinitial flight directions of most gannets at around1 km from the nest site differed only slightly (lt40deg)from their subsequent departure directions at 10 kmfrom the nest site (Pettex et al 2010) Thereforerecording a birdrsquos initial flight direction at the start ofa foraging trip may be a useful proxy of its subse-quent departure direction To record departure di -rections from a larger number of birds than we couldfrom our GPS loggers we performed in situ ob -servations within 1 sub-colony (Sc6 Fig 1b) on 6 12and 13 July 2010 Observations were performed be -tween 0600 and 1100 h GMT to coincide with thetime period when most birds start their foragingtrips Observation periods avoided times of poor visi-bility We recorded departure directions for each birdstarting a foraging trip during observation periodsDeparture directions were recorded as the bearingbetween Sc6 and the location where they were nolonger visible with the naked eye As visibility wasgood during observation periods this was usuallyaround 1 km from their nest site All birds departedindividually (ie birds did not depart in flocks) andeach recording represented an independent sampleBecause of the topography around the observationpoint our field of view was re stricted to between 140
and 280deg However only 7 of 305 birds starting a foraging trip during observations periods took bear-ings of lt140deg and 280deg Despite our restricted field ofview we expected that neighbours commutingtowards the same foraging location would have simi-lar departure directions within this range of values(140 to 280deg)
Analysis
Because combinations of sub-colonies were not thesame in all years (Table 1) we statistically tested fordifferences in foraging behaviours among sub-colonies in 2006 2010 and 2011 separately This re -moved the possibility of Type I errors ie interpret-ing differences between years as differencesbe tween sub-colonies In all statistical tests we in -cluded both sub-colony and sex as explanatory vari-ables to account for differences in foraging behav-iours between sexes (Stauss et al 2012)
We tested for sub-colony differences in trip dura-tion trip length and range using ANOVA tests withone of these 3 foraging behaviours as the responsevariable and sub-colony and sex as explanatory fac-tors We log transformed trip duration trip lengthand range to correct for a small number of very longforaging trips As isotopic signatures (δ15N and δ13C)and core foraging areas (eastings and northings km)both had 2 response variables we tested for sub-colony differences using multivariate analysis of vari-ance (MANOVA Pillairsquos trace V) These models hadeither δ15N and δ13C or eastings and northings as re -sponse variables and sub-colony and sex as ex plana -tory variables For directional tracking data (depar-ture directions distal directions) we calculated thenortherly and easterly components using their cosineand sine values respectively By using cosine andsine values we were able to use conventional ratherthan circular statistics We then tested for sub-colonydifferences using MANOVA tests with cosine andsine values as response variables and sub-colony andsex as explanatory variables
In all ANOVA and MANOVA tests residuals werenormally distributed (following log transformation oftrip duration trip length and range) with no clearoutliers or high leverage points For all tests we in -cluded 2 additional analyses First we calculated anestimate of statistical power (based on an alpha of005) to quantify the probability of committing Type IIerrors When using MANOVA tests we chose the re sponse variable with the least leverage as a conser-vative measure of power (Murphy et al 2012) Sec-
278
Waggitt et al Sub-colony variation in northern gannets 279
ond we calculated the intra-class correlation coeffi-cient (Nakagawa amp Schielzeth 2010) to compare thevariance in foraging behaviours within sub-coloniesto the variance among sub-colonies This provides arepeatability index between 0 and 1 where an indexof 0 would indicate low similarities among neigh-bours and an index of 1 would indicate high similari-ties among neighbours Here we interpret high re -peatability indices as consistent with the emergenceof sub-colony foraging asymmetries (ie that the vari-ance in foraging behaviours within sub-colonies wasgreater than the variance among sub-colonies)
For our in situ observations we tested for similari-ties among neighboursrsquo departure directions in Sc6using 2 approaches First we calculated the variance(σ2) to mean (μ) ratio (VMR) among departure direc-tions for each day This provided a dispersion indexbetween 0 and 10 where an index of 0 would indi-cate maximum similarities with all neighboursrsquo de -parture directions being identical and an index of~10 would indicate maximum dissimilarities withneighboursrsquo departure directions being equally dis-tributed between 140 and 280deg Second we tested fordifferences in departure directions among days usingan ANOVA test In this test we used departure direc-tions as response variables and the day as the ex -planatory variable From the results of this ANOVAwe were able to calculate the intra-class correlationcoefficient (see above) to provide an indication of thevariance in departure directions within each daycompared to the variance among days VMR andrepeatability indices were then used in conjunctionwith a visual inspection of histograms to determinewhether neighbours had similar departure directionsand may have been commuting towards the sameforaging locations
All statistical analysis was performed in R (version2130 R Development Core Team 2010) For poweranalysis we used the lsquopwrrsquo package (Champely2009) and for repeatability analysis we used thelsquorptRrsquo package (Nakagawa amp Schielzeth 2010)Means are usually shown with standard deviationsHowever in the case of the directional data that wererecorded from GPS loggers (departure and distaldirections) means are shown with estimations of cir-cular variance This is a dispersion index between 0and 1 where values of 0 indicate that all directionsare equal and values of 1 indicate that directionswere equally distributed across 360deg (Zar 2010) Thisap proach was taken because the use of standarddeviations is inappropriate on directional data witha potential range of values greater than 180deg (Zar2010)
RESULTS
GPS tracking
Mean foraging behaviours by sub-colony and yearare shown in Table 2 At-sea movements and core foraging areas by sub-colony and year are shown inFigs 2 amp 3 respectively Visual inspection of at-seamovements and core foraging areas revealed no clearqualitative differences among sub-colonies in anyyear We also found no statistically significant differ-ences in foraging behaviours among sub-colonies inany year Repeatability within sub-colonies was alsogenerally low (Table 3) However there was a statisti-cally significant influence of sex on distal directionsand core foraging areas in 2006 (Table 3)
SIA
Mean δ13C and δ15N RBC values by sub-colony andyear are shown in Table 2 and Fig 4 We found no statistically significant differences in mean isotopicsignatures among sub-colonies Repeatability withinsub-colonies was also generally low (Table 3) How-ever there was a statistically significant influence ofsex on isotopic signatures in 2006 (Table 3)
In situ observations
Our in situ observations are summarised in Table 4and Fig 5 In total we recorded departure directionsfrom 305 birds in Sc6 Counts ranged from 87 to 113birds per day The daily VMR varied between 212 and562 and the overall repeatability index was 0267Taken together with visual inspections of histograms(Fig 5) these results suggested some similarities inneighboursrsquo departure directions Significant differ-ences in departure direction were seen among days(ANOVA F2303 = 37735 p lt 001) with a shift to wardsmore westerly bearings seen on 13 July This shift to-wards more westerly bearings coincided with strongereasterly winds during the observation period (6 Julyspeed = 249 m sminus1 direction = 133deg 12 July speed =249 m sminus1 direction = 119deg 13 July speed = 675 msminus1 direction = 148deg Skomer Reserve Marine Team)
DISCUSSION
Here we investigate whether foraging behavioursdiffered among 7 sub-colonies of a large gannet
Mar Ecol Prog Ser 498 275ndash285 2014280
colony using a combination of GPS loggers and SIAEven when sampling 72 individuals from 7 sub-colonies across 3 yr we found no clear evidence ofany sub-colony foraging asymmetries Repeatabilityindices also suggested low similarities in neigh-boursrsquo foraging behaviours (Table 3) Despite ourhighly variable statistical power (Table 3) there isno clear indication that this lack of a statistically sig-nificant difference is a Type II error Although com-plimentary in situ observations suggested similari-ties among neighboursrsquo departure directions in 1sub-colony (Fig 5) this may be attributable to astrong influence of wind vectors on individualsrsquo ini-tial flight directions at the start of a foraging tripBelow we discuss our results from GPS loggers SIAand in situ observations separately before consider-ing the ecological and methodological implicationsof this research
GPS loggers
While we found no clear differences among 7sub-colonies in 6 different measures of foragingbehaviour derived from GPS loggers we need todiscuss the possibility of falsely accepting our nullhypothesis Within each year the foraging tripsused in our analysis were spread over severalweeks (Table 1) This could render it difficult todetect sub-colony foraging asymmetries becauseof the temporal variations in foraging behaviourassociated with for ex ample changes in preyavailability and distribution (Wanless et al 1998)or reproductive duties (Ito et al 2010) withinbreeding seasons However we think this isunlikely Previous studies show that gannets onGrassholm are consistent in their departure direc-tions their most distant locations and also theirdive locations within breeding seasons (Patricket al 2014) This indicates that gannets are proba-bly ex ploiting temporally predictable foraging lo -cations something which would reduce these po -tentially confounding effects We did find muchvariation in our 5 measurements of foraging be -haviours (Table 2) and this led to greatly varyinglevels of statistical power (Table 3) However atleast for some measurements of foraging behav-iours (distance departure direction and core forag-ing area depending on the year) there was goodstatistical power (Table 3) suggesting that wewere correct to accept the null hypothesis of nodifferences in foraging behaviour among sub-colonies
Yea
r
S
ub
-
At-
sea
mov
emen
t
Dir
ecti
on
Is
otop
ic s
ign
atu
re i
n R
BC
sC
ore
fora
gin
g a
rea
c
olon
y (n
)
Ran
ge
(km
)
D
ista
nce
(k
m)
D
ura
tion
(d
)
D
epar
ture
(deg)
Dis
tal
(deg)
δ15
N
δ13
C
E
asti
ng
s (k
m)
N
orth
ing
s (k
m)
2006
Sc5
(7)
144
71
plusmn 8
917
4
674
3 plusmn
251
07
1
01 plusmn
04
3
31
180
plusmn 0
41
331
10
plusmn 0
40
15
10 plusmn
07
1 1
728
plusmn 0
95
2
953
4 plusmn
110
16
565
906
plusmn 4
420
Sc6
(7)
112
71
plusmn 7
676
3
338
6 plusmn
217
24
0
86 plusmn
03
9
6
906
plusmn 0
35
3
213
plusmn 0
44
15
33 plusmn
06
1 1
731
plusmn 0
58
2
919
7 plusmn
92
69
5693
20
plusmn 2
524
Sc7
(9)
104
33
plusmn 5
428
3
144
4 plusmn
169
80
1
06 plusmn
07
8
14
467
plusmn 0
23
109
54
plusmn 0
21
15
31 plusmn
06
2 1
725
plusmn 0
53
2
666
9 plusmn
58
87
5700
99
plusmn 3
563
2010
Sc1
(5)
14
92
plusmn 7
715
435
8 plusmn
176
84
0
65 plusmn
02
6
28
302
plusmn 0
36
348
44
plusmn 0
42
14
29 plusmn
04
8 1
784
plusmn 0
41
3
232
8 plusmn
36
09
5663
33
plusmn 9
398
Sc2
(4)
16
25
plusmn 9
160
43
5 plusmn
269
77
1
03 plusmn
06
8
4
877
plusmn 0
19
1
982
plusmn 0
28
14
02 plusmn
04
8 1
764
plusmn 0
23
3
099
4 plusmn
38
35
5593
42
plusmn 9
134
Sc4
(5)
13
54
plusmn 2
802
518
6 plusmn
138
64
1
20 plusmn
06
5
31
129
plusmn 0
54
324
19
plusmn 0
61
14
14 plusmn
07
5 1
761
plusmn 0
41
3
424
8 plusmn
59
48
5677
36
plusmn 8
521
Sc7
(3)
116
33
plusmn 8
334
3
143
3 plusmn
205
90
0
62 plusmn
02
5
12
319
plusmn 0
11
8
393
plusmn 0
12
14
96 plusmn
09
2 1
730
plusmn 0
59
2
668
0 plusmn
73
35
5660
70
plusmn 4
270
2011
Sc1
(7)
100
plusmn 3
806
3
354
3 plusmn
132
84
0
66 plusmn
02
3
1
162
plusmn 0
49
326
38
plusmn 0
43
14
85 plusmn
05
1 1
764
plusmn 0
48
3
335
3 plusmn
41
21
5681
55
plusmn 6
400
Sc2
(6)
174
83
plusmn 1
406
8 6
888
3 plusmn
552
30
1
94 plusmn
16
1
8
175
plusmn 0
25
103
31
plusmn 0
16
15
27 plusmn
07
0 1
714
plusmn 0
55
2
522
6 plusmn
49
71
5680
17
plusmn 6
142
Sc3
(3)
87
plusmn 5
803
2
966
7 plusmn
254
30
0
80 plusmn
09
2
30
738
plusmn 0
55
276
16
plusmn 0
45
14
81 plusmn
03
3 1
756
plusmn 0
51
3
561
7 plusmn
38
90
5741
60
plusmn 7
685
Sc4
(6)
139
83
plusmn 5
740
4
338
3 plusmn
171
92
0
83 plusmn
03
9
5
914
plusmn 0
70
383
plusmn 0
78
14
94 plusmn
04
7 1
729
plusmn 0
49
3
102
9 plusmn
81
50
5685
06
plusmn 9
145
Sc7
(10
)
145
plusmn 1
275
7
402
2 plusmn
324
28
0
90 plusmn
06
8
13
023
plusmn 0
11
127
65
plusmn 0
15
14
86 plusmn
05
9 1
740
plusmn 0
47
2
292
7 plusmn
109
58
567
114
plusmn 6
885
Tab
le 2
Mor
us
bas
san
us
Su
mm
ary
of fo
rag
ing
beh
avio
urs
rec
ord
ed fr
om 7
2 ch
ick
-rea
rin
g g
ann
ets
on G
rass
hol
m U
K s
how
ing
mea
n v
alu
es b
y su
b-c
olon
y (S
c1 to
Sc7
)an
d y
ear
(200
6 2
010
and
201
1)
Sam
ple
siz
es a
re s
how
n (
n)
Val
ues
are
pre
sen
ted
as
mea
ns
plusmn S
D w
ith
th
e ex
cep
tion
of
mea
n d
epar
ture
an
d d
ista
l d
irec
tion
s w
her
em
ean
s ar
e p
rese
nte
d w
ith
cir
cula
r va
rian
ces
Th
is is
a d
isp
ersi
on in
dex
bet
wee
n 0
an
d 1
wh
ere
valu
es o
f 0
ind
icat
e th
at d
irec
tion
s w
ere
equ
al a
nd
val
ues
of
1 in
dic
ate
that
dir
ecti
ons
wer
e eq
ual
ly d
istr
ibu
ted
ove
r a
360deg
ran
ge
For
agin
g b
ehav
iou
rs w
ere
reco
rded
usi
ng
GP
S l
ogg
ers
(ran
ge
dis
tan
ce
du
rati
on
dep
artu
re d
irec
tion
s
dis
tal d
irec
tion
cor
e fo
rag
ing
are
as)
and
sta
ble
isot
ope
anal
ysis
of
red
blo
od c
ells
(R
BC
s δ
13C
an
d δ
15N
)
Waggitt et al Sub-colony variation in northern gannets
SIA
Previous work demonstrated clear differences inthe isotope signatures (δ13C and δ15N) of tufted puffinFratercula cirrhata eggs and chick blood cells be -tween 2 sub-colonies on Triangle Island in BritishColumbia Canada (Hipfner et al 2007) These re -sults suggested differences in foraging locations be -tween sub-colonies Here we interpret similar iso-topic signatures among sub-colonies as evidence ofno differences in foraging location among sub-colonies Although it is possible that individuals cap-
tured different prey from the same foraging locationthis would typically lead to differences in δ15N onlyFor example individuals taking discards from dem-ersal fishing vessels will have much higher δ15N val-ues than those taking pelagic fish (Votier et al 2010)However individuals exploiting the same foraginglocation will have broadly similar δ13C values regard-less of their prey choice (Farquhar et al 1989 Robin-son 2001) Therefore when considering the relativelyhigh statistical power in some cases (Table 3) thelack of significant differences represents good evi-dence that foraging locations did not differ among
281
Fig 2 Morus bassanus Foraging movements of chick-rearing northern gannets on Grassholm UK recorded from GPS loggersForaging movements are divided into sub-colonies (Sc1 to Sc7) and years (2006 = blue 2010 = red 2011 = green) The location
of Grassholm is indicated by the black square Sample sizes are also shown (n)
Mar Ecol Prog Ser 498 275ndash285 2014
sub-colonies Furthermore by analysing RBCs thereis also a low likelihood of any temporal variations inforaging behaviour (see above) influencing our re -sults because they represent an integrated signatureover the 3 to 4 wk prior to sampling
In situ observations
Based on previous studies we believed that re -cording gannetsrsquo initial flight directions at the start of
a foraging trip should provide reasonably accurate(eg lt40deg) proxies of their subsequent departure di -rection (Pettex et al 2010) However wind vectorsseemed to influence gannetsrsquo initial flight directionsat the start of foraging trips as an almost 3-foldincrease in the strength of easterly winds on 13 Julyresulted in much more westerly departure directionsbeing recorded on this day Because of this doubt wecannot interpret the similarities seen among neighboursrsquodeparture directions as evidence that they may havebeen commuting towards similar foraging locations
282
Fig 3 Morus bassanus Twenty-five percent kernel density (KD) contours from chick-rearing northern gannets on GrassholmUK calculated from GPS logger data (Fig 2) KD contours are divided into sub-colonies (Sc1 to Sc7) and years (2006 = blue2010 = red 2011 = green) The location of Grassholm is indicated by the black square Sample sizes are also shown (n) Kernel
smoothing parameter = 10 km cell size = 1 km
Waggitt et al Sub-colony variation in northern gannets
Ecological implications
Although the precise mechanisms remain un -known there is growing evidence suggesting thatgannets use social information to inform foraging de-cisions (Gremillet et al 2004 Wakefield et al 2013)Theoretical models suggest that both local en hance -ment and the exchange of social information withinthe colony could influence the at-sea distributions ofgannets (Wakefield et al 2013) If social information
283
Fig 4 Morus bassanus Mean (plusmn SE) δ13C and δ15N values in red blood cells of chick-rearing northern gannets on GrassholmUK Mean δ13C and δ15N values are divided into sub-colonies (Sc1 to Sc7) and years (2006 = blue 2010 = red 2011 = green)
Sample sizes are also shown (n)
Year Foraging behaviour Sex Sub-colony Repeatability Power V F df p V F df p ()
2006 Range (km) 2925 122 0103 0499 221 0615 minus005 55 Distance (km) 3987 122 0060 1329 221 0290 002 79 Duration (d) 0558 122 0464 0158 221 0855 minus011 15 Departure direction (EW NS) 0247 2965 221 0070 0396 2347 419 0072 EW = 011 NS = 027 85 Distal direction (EW NS) 0295 3772 221 0042 0232 1245 419 0308 EW = minus011 NS = 017 23 Isotope signature (δ15N δ13C) 0531 10213 221 0001 0180 0960 419 0440 δ13C = minus015 δ15N = minus011 99 Core foraging area (Lat Lon) 0401 6038 221 0009 0295 1645 419 0183 Lat = 02 Lon = minus011 76
2010 Range (km) 1274 116 0281 0281 314 0838 minus013 24 Distance (km) 4122 116 0065 1001 314 0426 minus010 69 Duration (d) 0424 116 0527 0482 314 0701 minus001 22 Departure direction (EW NS) 0084 0507 215 0615 0598 1669 611 0172 EW = minus011 NS = 053 17 Distal direction (EW NS) 0011 0063 215 0939 0207 0562 611 0829 EW = 003 NS = 0 11 Isotope signature (δ15N δ13C) 0586 0668 215 0532 0580 1660 611 0170 δ13C = minus006 δ15N = minus006 45 Core foraging area (Lat Lon) 0909 0407 215 0675 0417 1055 611 0416 Lat = minus004 Lon = 009 90
2011 Range (km) 0789 131 0382 0636 428 0641 minus006 28 Distance (km) 1434 131 0242 0718 428 0587 004 36 Duration (d) 1633 131 0213 0567 428 0688 016 32 Departure direction (EW NS) 0019 0240 230 0782 0360 1428 824 0207 EW = minus013 NS = 025 17 Distal direction (EW NS) 0021 0270 230 0765 0441 1838 824 0091 EW = minus01 NS = 032 11 Isotope signature (δ15N δ13C) 0164 2461 230 0106 0320 1250 824 0280 δ13C = minus001 δ15N = minus006 53 Core foraging area (Lat Lon) 0013 0185 230 0832 0412 1817 824 0093 Lat = minus007 Lon = 025 42
Table 3 Morus bassanus Summary of ANOVA and MANOVA tests for differences in the foraging behaviour of chick-rearing gannets among sub-colonies and sexes on Grassholm UK in 2006 2010 and 2011 Also displayed are estimates of statistical powerand calculations of repeatability within sub-colonies V = Pillairsquos trace test EW = easterly component NS = northerly component
Significant differences shown in bold
Date n Departure direction (deg) VMR
6 July 2010 87 215 plusmn 35 56312 July 2010 113 205 plusmn 21 21213 July 2010 105 236 plusmn 24 249
Table 4 Morus bassanus Mean plusmn SD departure directions ofgannets nesting in sub-colony 6 (Sc6) on Grassholm UKthat were seen starting foraging trips between 0600 and1100 h GMT on 3 d in July 2010 Sample sizes are shown
(n) Also shown are the variance to mean ratios (VMR)
Mar Ecol Prog Ser 498 275ndash285 2014
was primarily exchanged at the nest site where indi-viduals can observe their neighboursrsquo chick-provision-ing duties and flight directions then we might expectat-sea segregation among sub-colonies This is not thecase here Al though we cannot completely dis miss anexchange at the nest site it seems possible that mostex changes of social information in the colony couldoccur elsewhere such as when individuals raft on thewater surface before starting a foraging trip (Weimers -kirch et al 2010)
The tendency for older or more dominant individu-als to occupy preferential nest sites (Velando amp Freire2001) could lead to colony members grouping them-selves by age or intrinsic quality If it is as sumed thatolder or more dominant individuals are competitivelysuperior or more efficient foragers then sub-coloniescontaining mainly older or dominant individualswould tend to forage closer to the colony or spendless time at sea (Catry amp Furness 1999 Daunt et al2007 Votier et al 2011) Results here suggest thatcolony members are probably not grouping them-selves by age or intrinsic qualities This could indi-cate that there is low variation in the quality of nestsites andor that the locations of preferential nestsites are not spatially aggregated
Methodological implications
Our results suggest that sampling several differentsub-colonies of gannets may not be necessary whenquantifying the foraging behaviours of the colonyas a whole However we cannot yet draw ro bust conclusions for seabirds in general For in stancethere are likely to be variations in the accuracy andexploitability and therefore the use of social infor-mation at the nest site among different species (Kingamp Cowlishaw 2007) Grouping by age or intrinsicqualities may also be more likely in species where
there is high variation in the quality of nest sites andthe locations of preferential nest sites are spatiallyaggregated (Velando amp Freire 2001) Given our cur-rent lack of knowledge across seabird species weurge further tests of this hypothesis elsewhere Byunderstanding when and why sub-colony foragingasymmetries occur appropriate sampling designscan be developed to ensure that the foraging behav-iours recorded from both GPS loggers and SIA arerepresentative of the colony as a whole By increas-ing our confidence in the accuracy of studies aimingto record and monitor individual foraging behaviourswithin colonies we can start to improve our under-standing of how changes to the en vironment broughtabout by marine renewable en ergies commercialfisheries marine pollution or climate change couldaffect seabird populations
Acknowledgements The opportunity to conduct fieldworkon Grassholm Island was kindly provided by the Royal Soci-ety for the Protection of Birds and device attachment andblood sampling was conducted with the permission of theCountryside Council for Wales We thank G Morgan LMorgan and T Brooke for their assistance during fieldworkand T Guilford R Freeman H Kirk and B Dean for theiradvice on the GPS logger programme and attachmentFinally we also thank 3 anonymous re viewers whose com-ments greatly improved this manuscript Funding was pro-vided by the European Union Interreg CHARM III projectNERC (NEH0071991 and NEG0010141) NERC LSMSFgrant lsquoEK134-1708rsquo and the Peninsula Research Institutefor Marine Renewable Energy
LITERATURE CITED
Arauacutejo MS Bolnick DI Layman CA (2011) The ecologicalcauses of individual specialisation Ecol Lett 14 948minus958
Bearhop S Waldron S Votier SC Furness RW (2002) Factorsthat influence assimilation rates and fractionation ofnitrogen and carbon stable isotopes in avian blood andfeathers Physiol Biochem Zool 75 451minus458
Calenge C (2006) The package adehabitat for the R soft-ware a tool for the analysis of space and habitat use by
284
Fig 5 Morus bassanus Departure directions of breeding northern gannets in sub-colony 6 (Sc6) on Grassholm UK on 3 d in July 2010
Waggitt et al Sub-colony variation in northern gannets
animals Ecol Model 197 516minus519Catry P Furness RW (1999) The influence of adult age on
territorial attendance by breeding great skuas Catharac -ta skua an experimental study J Avian Biol 30 399minus406
Champely S (2009) pwr basic functions for power analysisR package version 111 httpcranr-project org webpackagespwrindexhtml
Coulson JC (2002) Colonial breeding in seabirds In Schreiber EA Burger J (eds) Biology of marine birdsCRC Press Boca Raton FL p 87minus113
Danchin E Wagner RH (1997) The evolution of coloniality the emergence of new perspectives Trends Ecol Evol 12 342minus347
Daunt F Wanless S Harris MP Money L Monaghan P(2007) Older and wiser improvements in breeding suc-cess are linked to better foraging performance in Euro-pean shags Funct Ecol 21 561minus567
Deniro MJ Epstein S (1981) Influence of diet on the distribu-tion of nitrogen isotopes in animals Geochim Cosmo -chim Acta 45 341minus351
Farquhar GD Ehleringer JR Hubick KT (1989) Carbon iso-tope discrimination and photosynthesis Annu Rev PlantPhysiol Plant Mol Biol 40 503minus537
Gremillet D DellrsquoOmo G Ryan PG Peters G Ropert-Coudert Y Weeks SJ (2004) Offshore diplomacy or howseabirds mitigate intra-specific competition a case studybased on GPS tracking of Cape gannets from neighbour-ing colonies Mar Ecol Prog Ser 268 265minus279
Hamer KC Humphreys EM Garthe S Hennicke J and oth-ers (2007) Annual variation in diets feeding locationsand foraging behaviour of gannets in the North Sea flex-ibility consistency and constraint Mar Ecol Prog Ser 338 295minus305
Hamer KC Humphreys EM Magalhatildees MC Garthe S andothers (2009) Fine-scale foraging behaviour of amedium- ranging marine predator J Anim Ecol 78 880minus889
Hipfner JM Charette MR Blackburn GY (2007) Subcolonyvariation in breeding success in the tufted puffin Frater-cula cirrhata association with foraging ecology andimplications Auk 124 1149minus1157
Hobson KA Clark RG (1992) Assessing avian diets usingstable isotopes II factors influencing diet-tissue fraction-ation Condor 94 189minus197
Inger R Bearhop S (2008) Applications of stable isotopeanalyses to avian ecology Ibis 150 447minus461
Ito M Takahashi A Kokubun N Kitaysky AS Watanuki Y(2010) Foraging behavior of incubating and chick-rearing thick-billed murres Uria lomvia Aquat Biol 8 279minus287
King AJ Cowlishaw G (2007) When to use social informa-tion the advantage of large group size in individual deci-sion making Biol Lett 3 137minus139
Montevecchi W Fifield D Burke C Garthe S Hedd A RailJ Robertson G (2012) Tracking long-distance migrationto assess marine pollution impact Biol Lett 8 218minus221
Murphy KR Myors B Wolach A (2012) Statistical poweranalysis a simple and general model for traditional andmodern hypothesis tests 3rd edn Taylor amp Francis NewYork NY
Nakagawa S Schielzeth H (2010) Repeatability for Gaussianand non-Gaussian data a practical guide for biologistsBiol Rev Camb Philos Soc 85 935minus956
Patrick SC Bearhop S Greacutemillet D Lescroeumll A and others(2014) Individual differences in searching behaviour andspatial foraging consistency in a central place marinepredator Oikos 12333ndash40
Pettex E Bonadonna F Enstipp MR Siorat F Greacutemillet D(2010) Northern gannets anticipate the spatio-temporaloccurrence of their prey J Exp Biol 213 2365minus2371
R Development Core Team (2010) R a language and en -vironment for statistical computing R Foundation for Statistical Computing Vienna
Robinson D (2001) δ15N as an integrator of the nitrogencycle Trends Ecol Evol 16 153minus162
Ropert-Coudert Y Wilson RP (2005) Trends and perspec-tives in animal-attached remote sensing Front Ecol Env-iron 3 437minus444
Soanes LM Atkinson PW Gauvain RD Green JA (2013a)Individual consistency in the foraging behaviour ofnorthern gannets implications for interactions with off-shore renewable energy developments Mar Policy 38 507minus514
Soanes LM Arnould JPY Dodd SG Sumner MD Green JA(2013b) How many seabirds do we need to track todefine home-range area J Appl Ecol 50 671minus679
Stauss C Bearhop S Bodey TW Garthe S and others (2012)Sex-specific foraging behaviour in northern gannetsMorus bassanus incidence and implications Mar EcolProg Ser 457 151minus162
Velando A Freire J (2001) How general is the central-periphery distribution among seabird colonies Nestspatial pattern in the European shag Condor 103 544minus554
Votier SC Bearhop S Crane JE Arcos JM Furness RW(2007) Seabird predation by great skuas Stercorariusskua mdash intra-specific competition for food J Avian Biol38 234minus246
Votier SC Bearhop S Witt MJ Inger R Thompson D New-ton J (2010) Individual responses of seabirds to commer-cial fisheries revealed using GPS tracking stable iso-topes and vessel monitoring systems J Appl Ecol 47 487minus497
Votier SC Grecian WJ Patrick S Newton J (2011) Inter-colony movements at-sea behaviour and foraging in animmature seabird results from GPS-PPT tracking radio-tracking and stable isotope analysis Mar Biol 158 355minus362
Votier SC Bicknell A Cox SL Scales KL Patrick SC (2013)A birdrsquos eye view of discard reforms bird-borne camerasreveal seabirdfishery interactions PLoS ONE 8 e57376
Wakefield ED Bodey TW Bearhop S Blackburn J and others (2013) Space partitioning without territoriality ingannets Science 341 68minus70
Wanless S Greacutemillet D Harris MP (1998) Foraging activityand performance of shags Phalacrocorax aristotelis inrelation to environmental characteristics J Avian Biol 29 49minus54
Ward P Zahavi A (1973) The importance of certain assem-blages of birds as information centres for food findingIbis 115 517minus534
Wearmouth VJ Sims DW (2008) Sexual segregation in mar-ine fish reptiles birds and mammals behaviour pat-terns mechanisms and conservation implications AdvMar Biol 54 107minus170
Weimerskirch H Bertrand S Silva J Marques JC Goya E(2010) Use of social information in seabirds compassrafts indicate the heading of food patches PLoS ONE 5 e9928
Weimerskirch H Louzao M de Grissac S Delord K (2012)Changes in wind pattern alter albatross distribution andlife-history traits Science 335 211minus214
Zar JH (2010) Biostatistical analysis 5th edn Pearson Pren-tice Hall Upper Saddle River NJ
285
Editorial responsibility Jacob Gonzaacutelez-Soliacutes Barcelona Spain
Submitted May 14 2013 Accepted October 28 2013Proofs received from author(s) January 24 2014
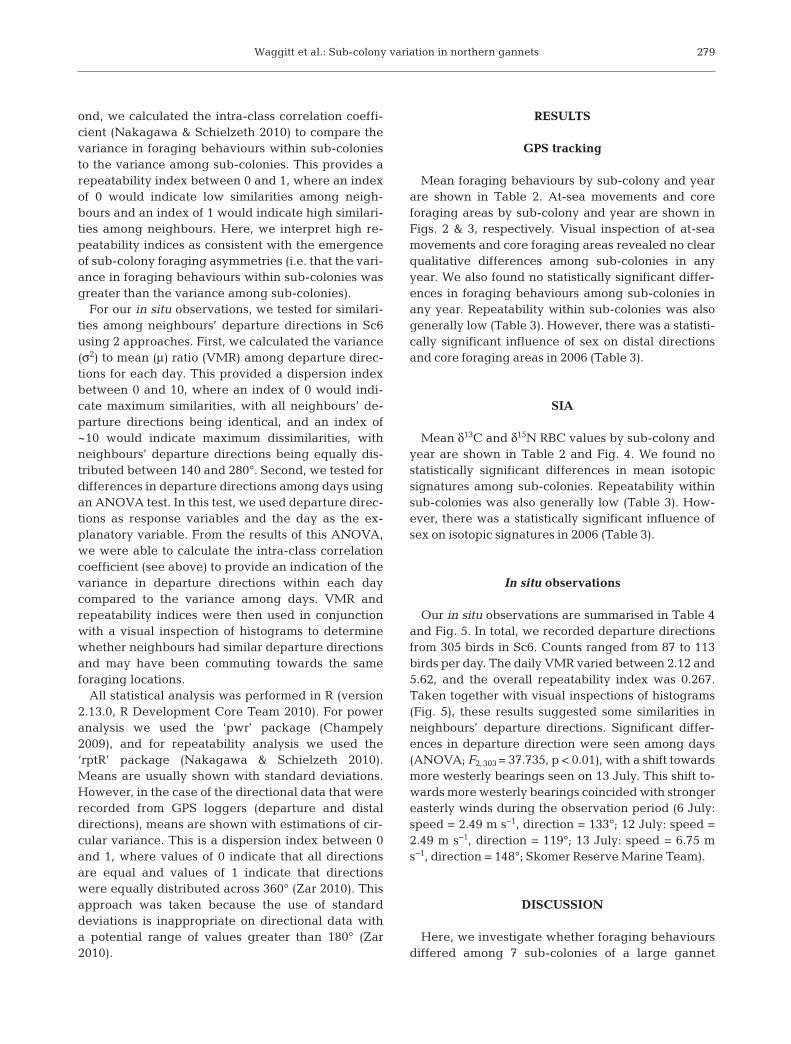
Waggitt et al Sub-colony variation in northern gannets
SIA
Previous work demonstrated clear differences inthe isotope signatures (δ13C and δ15N) of tufted puffinFratercula cirrhata eggs and chick blood cells be -tween 2 sub-colonies on Triangle Island in BritishColumbia Canada (Hipfner et al 2007) These re -sults suggested differences in foraging locations be -tween sub-colonies Here we interpret similar iso-topic signatures among sub-colonies as evidence ofno differences in foraging location among sub-colonies Although it is possible that individuals cap-
tured different prey from the same foraging locationthis would typically lead to differences in δ15N onlyFor example individuals taking discards from dem-ersal fishing vessels will have much higher δ15N val-ues than those taking pelagic fish (Votier et al 2010)However individuals exploiting the same foraginglocation will have broadly similar δ13C values regard-less of their prey choice (Farquhar et al 1989 Robin-son 2001) Therefore when considering the relativelyhigh statistical power in some cases (Table 3) thelack of significant differences represents good evi-dence that foraging locations did not differ among
281
Fig 2 Morus bassanus Foraging movements of chick-rearing northern gannets on Grassholm UK recorded from GPS loggersForaging movements are divided into sub-colonies (Sc1 to Sc7) and years (2006 = blue 2010 = red 2011 = green) The location
of Grassholm is indicated by the black square Sample sizes are also shown (n)
Mar Ecol Prog Ser 498 275ndash285 2014
sub-colonies Furthermore by analysing RBCs thereis also a low likelihood of any temporal variations inforaging behaviour (see above) influencing our re -sults because they represent an integrated signatureover the 3 to 4 wk prior to sampling
In situ observations
Based on previous studies we believed that re -cording gannetsrsquo initial flight directions at the start of
a foraging trip should provide reasonably accurate(eg lt40deg) proxies of their subsequent departure di -rection (Pettex et al 2010) However wind vectorsseemed to influence gannetsrsquo initial flight directionsat the start of foraging trips as an almost 3-foldincrease in the strength of easterly winds on 13 Julyresulted in much more westerly departure directionsbeing recorded on this day Because of this doubt wecannot interpret the similarities seen among neighboursrsquodeparture directions as evidence that they may havebeen commuting towards similar foraging locations
282
Fig 3 Morus bassanus Twenty-five percent kernel density (KD) contours from chick-rearing northern gannets on GrassholmUK calculated from GPS logger data (Fig 2) KD contours are divided into sub-colonies (Sc1 to Sc7) and years (2006 = blue2010 = red 2011 = green) The location of Grassholm is indicated by the black square Sample sizes are also shown (n) Kernel
smoothing parameter = 10 km cell size = 1 km
Waggitt et al Sub-colony variation in northern gannets
Ecological implications
Although the precise mechanisms remain un -known there is growing evidence suggesting thatgannets use social information to inform foraging de-cisions (Gremillet et al 2004 Wakefield et al 2013)Theoretical models suggest that both local en hance -ment and the exchange of social information withinthe colony could influence the at-sea distributions ofgannets (Wakefield et al 2013) If social information
283
Fig 4 Morus bassanus Mean (plusmn SE) δ13C and δ15N values in red blood cells of chick-rearing northern gannets on GrassholmUK Mean δ13C and δ15N values are divided into sub-colonies (Sc1 to Sc7) and years (2006 = blue 2010 = red 2011 = green)
Sample sizes are also shown (n)
Year Foraging behaviour Sex Sub-colony Repeatability Power V F df p V F df p ()
2006 Range (km) 2925 122 0103 0499 221 0615 minus005 55 Distance (km) 3987 122 0060 1329 221 0290 002 79 Duration (d) 0558 122 0464 0158 221 0855 minus011 15 Departure direction (EW NS) 0247 2965 221 0070 0396 2347 419 0072 EW = 011 NS = 027 85 Distal direction (EW NS) 0295 3772 221 0042 0232 1245 419 0308 EW = minus011 NS = 017 23 Isotope signature (δ15N δ13C) 0531 10213 221 0001 0180 0960 419 0440 δ13C = minus015 δ15N = minus011 99 Core foraging area (Lat Lon) 0401 6038 221 0009 0295 1645 419 0183 Lat = 02 Lon = minus011 76
2010 Range (km) 1274 116 0281 0281 314 0838 minus013 24 Distance (km) 4122 116 0065 1001 314 0426 minus010 69 Duration (d) 0424 116 0527 0482 314 0701 minus001 22 Departure direction (EW NS) 0084 0507 215 0615 0598 1669 611 0172 EW = minus011 NS = 053 17 Distal direction (EW NS) 0011 0063 215 0939 0207 0562 611 0829 EW = 003 NS = 0 11 Isotope signature (δ15N δ13C) 0586 0668 215 0532 0580 1660 611 0170 δ13C = minus006 δ15N = minus006 45 Core foraging area (Lat Lon) 0909 0407 215 0675 0417 1055 611 0416 Lat = minus004 Lon = 009 90
2011 Range (km) 0789 131 0382 0636 428 0641 minus006 28 Distance (km) 1434 131 0242 0718 428 0587 004 36 Duration (d) 1633 131 0213 0567 428 0688 016 32 Departure direction (EW NS) 0019 0240 230 0782 0360 1428 824 0207 EW = minus013 NS = 025 17 Distal direction (EW NS) 0021 0270 230 0765 0441 1838 824 0091 EW = minus01 NS = 032 11 Isotope signature (δ15N δ13C) 0164 2461 230 0106 0320 1250 824 0280 δ13C = minus001 δ15N = minus006 53 Core foraging area (Lat Lon) 0013 0185 230 0832 0412 1817 824 0093 Lat = minus007 Lon = 025 42
Table 3 Morus bassanus Summary of ANOVA and MANOVA tests for differences in the foraging behaviour of chick-rearing gannets among sub-colonies and sexes on Grassholm UK in 2006 2010 and 2011 Also displayed are estimates of statistical powerand calculations of repeatability within sub-colonies V = Pillairsquos trace test EW = easterly component NS = northerly component
Significant differences shown in bold
Date n Departure direction (deg) VMR
6 July 2010 87 215 plusmn 35 56312 July 2010 113 205 plusmn 21 21213 July 2010 105 236 plusmn 24 249
Table 4 Morus bassanus Mean plusmn SD departure directions ofgannets nesting in sub-colony 6 (Sc6) on Grassholm UKthat were seen starting foraging trips between 0600 and1100 h GMT on 3 d in July 2010 Sample sizes are shown
(n) Also shown are the variance to mean ratios (VMR)
Mar Ecol Prog Ser 498 275ndash285 2014
was primarily exchanged at the nest site where indi-viduals can observe their neighboursrsquo chick-provision-ing duties and flight directions then we might expectat-sea segregation among sub-colonies This is not thecase here Al though we cannot completely dis miss anexchange at the nest site it seems possible that mostex changes of social information in the colony couldoccur elsewhere such as when individuals raft on thewater surface before starting a foraging trip (Weimers -kirch et al 2010)
The tendency for older or more dominant individu-als to occupy preferential nest sites (Velando amp Freire2001) could lead to colony members grouping them-selves by age or intrinsic quality If it is as sumed thatolder or more dominant individuals are competitivelysuperior or more efficient foragers then sub-coloniescontaining mainly older or dominant individualswould tend to forage closer to the colony or spendless time at sea (Catry amp Furness 1999 Daunt et al2007 Votier et al 2011) Results here suggest thatcolony members are probably not grouping them-selves by age or intrinsic qualities This could indi-cate that there is low variation in the quality of nestsites andor that the locations of preferential nestsites are not spatially aggregated
Methodological implications
Our results suggest that sampling several differentsub-colonies of gannets may not be necessary whenquantifying the foraging behaviours of the colonyas a whole However we cannot yet draw ro bust conclusions for seabirds in general For in stancethere are likely to be variations in the accuracy andexploitability and therefore the use of social infor-mation at the nest site among different species (Kingamp Cowlishaw 2007) Grouping by age or intrinsicqualities may also be more likely in species where
there is high variation in the quality of nest sites andthe locations of preferential nest sites are spatiallyaggregated (Velando amp Freire 2001) Given our cur-rent lack of knowledge across seabird species weurge further tests of this hypothesis elsewhere Byunderstanding when and why sub-colony foragingasymmetries occur appropriate sampling designscan be developed to ensure that the foraging behav-iours recorded from both GPS loggers and SIA arerepresentative of the colony as a whole By increas-ing our confidence in the accuracy of studies aimingto record and monitor individual foraging behaviourswithin colonies we can start to improve our under-standing of how changes to the en vironment broughtabout by marine renewable en ergies commercialfisheries marine pollution or climate change couldaffect seabird populations
Acknowledgements The opportunity to conduct fieldworkon Grassholm Island was kindly provided by the Royal Soci-ety for the Protection of Birds and device attachment andblood sampling was conducted with the permission of theCountryside Council for Wales We thank G Morgan LMorgan and T Brooke for their assistance during fieldworkand T Guilford R Freeman H Kirk and B Dean for theiradvice on the GPS logger programme and attachmentFinally we also thank 3 anonymous re viewers whose com-ments greatly improved this manuscript Funding was pro-vided by the European Union Interreg CHARM III projectNERC (NEH0071991 and NEG0010141) NERC LSMSFgrant lsquoEK134-1708rsquo and the Peninsula Research Institutefor Marine Renewable Energy
LITERATURE CITED
Arauacutejo MS Bolnick DI Layman CA (2011) The ecologicalcauses of individual specialisation Ecol Lett 14 948minus958
Bearhop S Waldron S Votier SC Furness RW (2002) Factorsthat influence assimilation rates and fractionation ofnitrogen and carbon stable isotopes in avian blood andfeathers Physiol Biochem Zool 75 451minus458
Calenge C (2006) The package adehabitat for the R soft-ware a tool for the analysis of space and habitat use by
284
Fig 5 Morus bassanus Departure directions of breeding northern gannets in sub-colony 6 (Sc6) on Grassholm UK on 3 d in July 2010
Waggitt et al Sub-colony variation in northern gannets
animals Ecol Model 197 516minus519Catry P Furness RW (1999) The influence of adult age on
territorial attendance by breeding great skuas Catharac -ta skua an experimental study J Avian Biol 30 399minus406
Champely S (2009) pwr basic functions for power analysisR package version 111 httpcranr-project org webpackagespwrindexhtml
Coulson JC (2002) Colonial breeding in seabirds In Schreiber EA Burger J (eds) Biology of marine birdsCRC Press Boca Raton FL p 87minus113
Danchin E Wagner RH (1997) The evolution of coloniality the emergence of new perspectives Trends Ecol Evol 12 342minus347
Daunt F Wanless S Harris MP Money L Monaghan P(2007) Older and wiser improvements in breeding suc-cess are linked to better foraging performance in Euro-pean shags Funct Ecol 21 561minus567
Deniro MJ Epstein S (1981) Influence of diet on the distribu-tion of nitrogen isotopes in animals Geochim Cosmo -chim Acta 45 341minus351
Farquhar GD Ehleringer JR Hubick KT (1989) Carbon iso-tope discrimination and photosynthesis Annu Rev PlantPhysiol Plant Mol Biol 40 503minus537
Gremillet D DellrsquoOmo G Ryan PG Peters G Ropert-Coudert Y Weeks SJ (2004) Offshore diplomacy or howseabirds mitigate intra-specific competition a case studybased on GPS tracking of Cape gannets from neighbour-ing colonies Mar Ecol Prog Ser 268 265minus279
Hamer KC Humphreys EM Garthe S Hennicke J and oth-ers (2007) Annual variation in diets feeding locationsand foraging behaviour of gannets in the North Sea flex-ibility consistency and constraint Mar Ecol Prog Ser 338 295minus305
Hamer KC Humphreys EM Magalhatildees MC Garthe S andothers (2009) Fine-scale foraging behaviour of amedium- ranging marine predator J Anim Ecol 78 880minus889
Hipfner JM Charette MR Blackburn GY (2007) Subcolonyvariation in breeding success in the tufted puffin Frater-cula cirrhata association with foraging ecology andimplications Auk 124 1149minus1157
Hobson KA Clark RG (1992) Assessing avian diets usingstable isotopes II factors influencing diet-tissue fraction-ation Condor 94 189minus197
Inger R Bearhop S (2008) Applications of stable isotopeanalyses to avian ecology Ibis 150 447minus461
Ito M Takahashi A Kokubun N Kitaysky AS Watanuki Y(2010) Foraging behavior of incubating and chick-rearing thick-billed murres Uria lomvia Aquat Biol 8 279minus287
King AJ Cowlishaw G (2007) When to use social informa-tion the advantage of large group size in individual deci-sion making Biol Lett 3 137minus139
Montevecchi W Fifield D Burke C Garthe S Hedd A RailJ Robertson G (2012) Tracking long-distance migrationto assess marine pollution impact Biol Lett 8 218minus221
Murphy KR Myors B Wolach A (2012) Statistical poweranalysis a simple and general model for traditional andmodern hypothesis tests 3rd edn Taylor amp Francis NewYork NY
Nakagawa S Schielzeth H (2010) Repeatability for Gaussianand non-Gaussian data a practical guide for biologistsBiol Rev Camb Philos Soc 85 935minus956
Patrick SC Bearhop S Greacutemillet D Lescroeumll A and others(2014) Individual differences in searching behaviour andspatial foraging consistency in a central place marinepredator Oikos 12333ndash40
Pettex E Bonadonna F Enstipp MR Siorat F Greacutemillet D(2010) Northern gannets anticipate the spatio-temporaloccurrence of their prey J Exp Biol 213 2365minus2371
R Development Core Team (2010) R a language and en -vironment for statistical computing R Foundation for Statistical Computing Vienna
Robinson D (2001) δ15N as an integrator of the nitrogencycle Trends Ecol Evol 16 153minus162
Ropert-Coudert Y Wilson RP (2005) Trends and perspec-tives in animal-attached remote sensing Front Ecol Env-iron 3 437minus444
Soanes LM Atkinson PW Gauvain RD Green JA (2013a)Individual consistency in the foraging behaviour ofnorthern gannets implications for interactions with off-shore renewable energy developments Mar Policy 38 507minus514
Soanes LM Arnould JPY Dodd SG Sumner MD Green JA(2013b) How many seabirds do we need to track todefine home-range area J Appl Ecol 50 671minus679
Stauss C Bearhop S Bodey TW Garthe S and others (2012)Sex-specific foraging behaviour in northern gannetsMorus bassanus incidence and implications Mar EcolProg Ser 457 151minus162
Velando A Freire J (2001) How general is the central-periphery distribution among seabird colonies Nestspatial pattern in the European shag Condor 103 544minus554
Votier SC Bearhop S Crane JE Arcos JM Furness RW(2007) Seabird predation by great skuas Stercorariusskua mdash intra-specific competition for food J Avian Biol38 234minus246
Votier SC Bearhop S Witt MJ Inger R Thompson D New-ton J (2010) Individual responses of seabirds to commer-cial fisheries revealed using GPS tracking stable iso-topes and vessel monitoring systems J Appl Ecol 47 487minus497
Votier SC Grecian WJ Patrick S Newton J (2011) Inter-colony movements at-sea behaviour and foraging in animmature seabird results from GPS-PPT tracking radio-tracking and stable isotope analysis Mar Biol 158 355minus362
Votier SC Bicknell A Cox SL Scales KL Patrick SC (2013)A birdrsquos eye view of discard reforms bird-borne camerasreveal seabirdfishery interactions PLoS ONE 8 e57376
Wakefield ED Bodey TW Bearhop S Blackburn J and others (2013) Space partitioning without territoriality ingannets Science 341 68minus70
Wanless S Greacutemillet D Harris MP (1998) Foraging activityand performance of shags Phalacrocorax aristotelis inrelation to environmental characteristics J Avian Biol 29 49minus54
Ward P Zahavi A (1973) The importance of certain assem-blages of birds as information centres for food findingIbis 115 517minus534
Wearmouth VJ Sims DW (2008) Sexual segregation in mar-ine fish reptiles birds and mammals behaviour pat-terns mechanisms and conservation implications AdvMar Biol 54 107minus170
Weimerskirch H Bertrand S Silva J Marques JC Goya E(2010) Use of social information in seabirds compassrafts indicate the heading of food patches PLoS ONE 5 e9928
Weimerskirch H Louzao M de Grissac S Delord K (2012)Changes in wind pattern alter albatross distribution andlife-history traits Science 335 211minus214
Zar JH (2010) Biostatistical analysis 5th edn Pearson Pren-tice Hall Upper Saddle River NJ
285
Editorial responsibility Jacob Gonzaacutelez-Soliacutes Barcelona Spain
Submitted May 14 2013 Accepted October 28 2013Proofs received from author(s) January 24 2014
Mar Ecol Prog Ser 498 275ndash285 2014
sub-colonies Furthermore by analysing RBCs thereis also a low likelihood of any temporal variations inforaging behaviour (see above) influencing our re -sults because they represent an integrated signatureover the 3 to 4 wk prior to sampling
In situ observations
Based on previous studies we believed that re -cording gannetsrsquo initial flight directions at the start of
a foraging trip should provide reasonably accurate(eg lt40deg) proxies of their subsequent departure di -rection (Pettex et al 2010) However wind vectorsseemed to influence gannetsrsquo initial flight directionsat the start of foraging trips as an almost 3-foldincrease in the strength of easterly winds on 13 Julyresulted in much more westerly departure directionsbeing recorded on this day Because of this doubt wecannot interpret the similarities seen among neighboursrsquodeparture directions as evidence that they may havebeen commuting towards similar foraging locations
282
Fig 3 Morus bassanus Twenty-five percent kernel density (KD) contours from chick-rearing northern gannets on GrassholmUK calculated from GPS logger data (Fig 2) KD contours are divided into sub-colonies (Sc1 to Sc7) and years (2006 = blue2010 = red 2011 = green) The location of Grassholm is indicated by the black square Sample sizes are also shown (n) Kernel
smoothing parameter = 10 km cell size = 1 km
Waggitt et al Sub-colony variation in northern gannets
Ecological implications
Although the precise mechanisms remain un -known there is growing evidence suggesting thatgannets use social information to inform foraging de-cisions (Gremillet et al 2004 Wakefield et al 2013)Theoretical models suggest that both local en hance -ment and the exchange of social information withinthe colony could influence the at-sea distributions ofgannets (Wakefield et al 2013) If social information
283
Fig 4 Morus bassanus Mean (plusmn SE) δ13C and δ15N values in red blood cells of chick-rearing northern gannets on GrassholmUK Mean δ13C and δ15N values are divided into sub-colonies (Sc1 to Sc7) and years (2006 = blue 2010 = red 2011 = green)
Sample sizes are also shown (n)
Year Foraging behaviour Sex Sub-colony Repeatability Power V F df p V F df p ()
2006 Range (km) 2925 122 0103 0499 221 0615 minus005 55 Distance (km) 3987 122 0060 1329 221 0290 002 79 Duration (d) 0558 122 0464 0158 221 0855 minus011 15 Departure direction (EW NS) 0247 2965 221 0070 0396 2347 419 0072 EW = 011 NS = 027 85 Distal direction (EW NS) 0295 3772 221 0042 0232 1245 419 0308 EW = minus011 NS = 017 23 Isotope signature (δ15N δ13C) 0531 10213 221 0001 0180 0960 419 0440 δ13C = minus015 δ15N = minus011 99 Core foraging area (Lat Lon) 0401 6038 221 0009 0295 1645 419 0183 Lat = 02 Lon = minus011 76
2010 Range (km) 1274 116 0281 0281 314 0838 minus013 24 Distance (km) 4122 116 0065 1001 314 0426 minus010 69 Duration (d) 0424 116 0527 0482 314 0701 minus001 22 Departure direction (EW NS) 0084 0507 215 0615 0598 1669 611 0172 EW = minus011 NS = 053 17 Distal direction (EW NS) 0011 0063 215 0939 0207 0562 611 0829 EW = 003 NS = 0 11 Isotope signature (δ15N δ13C) 0586 0668 215 0532 0580 1660 611 0170 δ13C = minus006 δ15N = minus006 45 Core foraging area (Lat Lon) 0909 0407 215 0675 0417 1055 611 0416 Lat = minus004 Lon = 009 90
2011 Range (km) 0789 131 0382 0636 428 0641 minus006 28 Distance (km) 1434 131 0242 0718 428 0587 004 36 Duration (d) 1633 131 0213 0567 428 0688 016 32 Departure direction (EW NS) 0019 0240 230 0782 0360 1428 824 0207 EW = minus013 NS = 025 17 Distal direction (EW NS) 0021 0270 230 0765 0441 1838 824 0091 EW = minus01 NS = 032 11 Isotope signature (δ15N δ13C) 0164 2461 230 0106 0320 1250 824 0280 δ13C = minus001 δ15N = minus006 53 Core foraging area (Lat Lon) 0013 0185 230 0832 0412 1817 824 0093 Lat = minus007 Lon = 025 42
Table 3 Morus bassanus Summary of ANOVA and MANOVA tests for differences in the foraging behaviour of chick-rearing gannets among sub-colonies and sexes on Grassholm UK in 2006 2010 and 2011 Also displayed are estimates of statistical powerand calculations of repeatability within sub-colonies V = Pillairsquos trace test EW = easterly component NS = northerly component
Significant differences shown in bold
Date n Departure direction (deg) VMR
6 July 2010 87 215 plusmn 35 56312 July 2010 113 205 plusmn 21 21213 July 2010 105 236 plusmn 24 249
Table 4 Morus bassanus Mean plusmn SD departure directions ofgannets nesting in sub-colony 6 (Sc6) on Grassholm UKthat were seen starting foraging trips between 0600 and1100 h GMT on 3 d in July 2010 Sample sizes are shown
(n) Also shown are the variance to mean ratios (VMR)
Mar Ecol Prog Ser 498 275ndash285 2014
was primarily exchanged at the nest site where indi-viduals can observe their neighboursrsquo chick-provision-ing duties and flight directions then we might expectat-sea segregation among sub-colonies This is not thecase here Al though we cannot completely dis miss anexchange at the nest site it seems possible that mostex changes of social information in the colony couldoccur elsewhere such as when individuals raft on thewater surface before starting a foraging trip (Weimers -kirch et al 2010)
The tendency for older or more dominant individu-als to occupy preferential nest sites (Velando amp Freire2001) could lead to colony members grouping them-selves by age or intrinsic quality If it is as sumed thatolder or more dominant individuals are competitivelysuperior or more efficient foragers then sub-coloniescontaining mainly older or dominant individualswould tend to forage closer to the colony or spendless time at sea (Catry amp Furness 1999 Daunt et al2007 Votier et al 2011) Results here suggest thatcolony members are probably not grouping them-selves by age or intrinsic qualities This could indi-cate that there is low variation in the quality of nestsites andor that the locations of preferential nestsites are not spatially aggregated
Methodological implications
Our results suggest that sampling several differentsub-colonies of gannets may not be necessary whenquantifying the foraging behaviours of the colonyas a whole However we cannot yet draw ro bust conclusions for seabirds in general For in stancethere are likely to be variations in the accuracy andexploitability and therefore the use of social infor-mation at the nest site among different species (Kingamp Cowlishaw 2007) Grouping by age or intrinsicqualities may also be more likely in species where
there is high variation in the quality of nest sites andthe locations of preferential nest sites are spatiallyaggregated (Velando amp Freire 2001) Given our cur-rent lack of knowledge across seabird species weurge further tests of this hypothesis elsewhere Byunderstanding when and why sub-colony foragingasymmetries occur appropriate sampling designscan be developed to ensure that the foraging behav-iours recorded from both GPS loggers and SIA arerepresentative of the colony as a whole By increas-ing our confidence in the accuracy of studies aimingto record and monitor individual foraging behaviourswithin colonies we can start to improve our under-standing of how changes to the en vironment broughtabout by marine renewable en ergies commercialfisheries marine pollution or climate change couldaffect seabird populations
Acknowledgements The opportunity to conduct fieldworkon Grassholm Island was kindly provided by the Royal Soci-ety for the Protection of Birds and device attachment andblood sampling was conducted with the permission of theCountryside Council for Wales We thank G Morgan LMorgan and T Brooke for their assistance during fieldworkand T Guilford R Freeman H Kirk and B Dean for theiradvice on the GPS logger programme and attachmentFinally we also thank 3 anonymous re viewers whose com-ments greatly improved this manuscript Funding was pro-vided by the European Union Interreg CHARM III projectNERC (NEH0071991 and NEG0010141) NERC LSMSFgrant lsquoEK134-1708rsquo and the Peninsula Research Institutefor Marine Renewable Energy
LITERATURE CITED
Arauacutejo MS Bolnick DI Layman CA (2011) The ecologicalcauses of individual specialisation Ecol Lett 14 948minus958
Bearhop S Waldron S Votier SC Furness RW (2002) Factorsthat influence assimilation rates and fractionation ofnitrogen and carbon stable isotopes in avian blood andfeathers Physiol Biochem Zool 75 451minus458
Calenge C (2006) The package adehabitat for the R soft-ware a tool for the analysis of space and habitat use by
284
Fig 5 Morus bassanus Departure directions of breeding northern gannets in sub-colony 6 (Sc6) on Grassholm UK on 3 d in July 2010
Waggitt et al Sub-colony variation in northern gannets
animals Ecol Model 197 516minus519Catry P Furness RW (1999) The influence of adult age on
territorial attendance by breeding great skuas Catharac -ta skua an experimental study J Avian Biol 30 399minus406
Champely S (2009) pwr basic functions for power analysisR package version 111 httpcranr-project org webpackagespwrindexhtml
Coulson JC (2002) Colonial breeding in seabirds In Schreiber EA Burger J (eds) Biology of marine birdsCRC Press Boca Raton FL p 87minus113
Danchin E Wagner RH (1997) The evolution of coloniality the emergence of new perspectives Trends Ecol Evol 12 342minus347
Daunt F Wanless S Harris MP Money L Monaghan P(2007) Older and wiser improvements in breeding suc-cess are linked to better foraging performance in Euro-pean shags Funct Ecol 21 561minus567
Deniro MJ Epstein S (1981) Influence of diet on the distribu-tion of nitrogen isotopes in animals Geochim Cosmo -chim Acta 45 341minus351
Farquhar GD Ehleringer JR Hubick KT (1989) Carbon iso-tope discrimination and photosynthesis Annu Rev PlantPhysiol Plant Mol Biol 40 503minus537
Gremillet D DellrsquoOmo G Ryan PG Peters G Ropert-Coudert Y Weeks SJ (2004) Offshore diplomacy or howseabirds mitigate intra-specific competition a case studybased on GPS tracking of Cape gannets from neighbour-ing colonies Mar Ecol Prog Ser 268 265minus279
Hamer KC Humphreys EM Garthe S Hennicke J and oth-ers (2007) Annual variation in diets feeding locationsand foraging behaviour of gannets in the North Sea flex-ibility consistency and constraint Mar Ecol Prog Ser 338 295minus305
Hamer KC Humphreys EM Magalhatildees MC Garthe S andothers (2009) Fine-scale foraging behaviour of amedium- ranging marine predator J Anim Ecol 78 880minus889
Hipfner JM Charette MR Blackburn GY (2007) Subcolonyvariation in breeding success in the tufted puffin Frater-cula cirrhata association with foraging ecology andimplications Auk 124 1149minus1157
Hobson KA Clark RG (1992) Assessing avian diets usingstable isotopes II factors influencing diet-tissue fraction-ation Condor 94 189minus197
Inger R Bearhop S (2008) Applications of stable isotopeanalyses to avian ecology Ibis 150 447minus461
Ito M Takahashi A Kokubun N Kitaysky AS Watanuki Y(2010) Foraging behavior of incubating and chick-rearing thick-billed murres Uria lomvia Aquat Biol 8 279minus287
King AJ Cowlishaw G (2007) When to use social informa-tion the advantage of large group size in individual deci-sion making Biol Lett 3 137minus139
Montevecchi W Fifield D Burke C Garthe S Hedd A RailJ Robertson G (2012) Tracking long-distance migrationto assess marine pollution impact Biol Lett 8 218minus221
Murphy KR Myors B Wolach A (2012) Statistical poweranalysis a simple and general model for traditional andmodern hypothesis tests 3rd edn Taylor amp Francis NewYork NY
Nakagawa S Schielzeth H (2010) Repeatability for Gaussianand non-Gaussian data a practical guide for biologistsBiol Rev Camb Philos Soc 85 935minus956
Patrick SC Bearhop S Greacutemillet D Lescroeumll A and others(2014) Individual differences in searching behaviour andspatial foraging consistency in a central place marinepredator Oikos 12333ndash40
Pettex E Bonadonna F Enstipp MR Siorat F Greacutemillet D(2010) Northern gannets anticipate the spatio-temporaloccurrence of their prey J Exp Biol 213 2365minus2371
R Development Core Team (2010) R a language and en -vironment for statistical computing R Foundation for Statistical Computing Vienna
Robinson D (2001) δ15N as an integrator of the nitrogencycle Trends Ecol Evol 16 153minus162
Ropert-Coudert Y Wilson RP (2005) Trends and perspec-tives in animal-attached remote sensing Front Ecol Env-iron 3 437minus444
Soanes LM Atkinson PW Gauvain RD Green JA (2013a)Individual consistency in the foraging behaviour ofnorthern gannets implications for interactions with off-shore renewable energy developments Mar Policy 38 507minus514
Soanes LM Arnould JPY Dodd SG Sumner MD Green JA(2013b) How many seabirds do we need to track todefine home-range area J Appl Ecol 50 671minus679
Stauss C Bearhop S Bodey TW Garthe S and others (2012)Sex-specific foraging behaviour in northern gannetsMorus bassanus incidence and implications Mar EcolProg Ser 457 151minus162
Velando A Freire J (2001) How general is the central-periphery distribution among seabird colonies Nestspatial pattern in the European shag Condor 103 544minus554
Votier SC Bearhop S Crane JE Arcos JM Furness RW(2007) Seabird predation by great skuas Stercorariusskua mdash intra-specific competition for food J Avian Biol38 234minus246
Votier SC Bearhop S Witt MJ Inger R Thompson D New-ton J (2010) Individual responses of seabirds to commer-cial fisheries revealed using GPS tracking stable iso-topes and vessel monitoring systems J Appl Ecol 47 487minus497
Votier SC Grecian WJ Patrick S Newton J (2011) Inter-colony movements at-sea behaviour and foraging in animmature seabird results from GPS-PPT tracking radio-tracking and stable isotope analysis Mar Biol 158 355minus362
Votier SC Bicknell A Cox SL Scales KL Patrick SC (2013)A birdrsquos eye view of discard reforms bird-borne camerasreveal seabirdfishery interactions PLoS ONE 8 e57376
Wakefield ED Bodey TW Bearhop S Blackburn J and others (2013) Space partitioning without territoriality ingannets Science 341 68minus70
Wanless S Greacutemillet D Harris MP (1998) Foraging activityand performance of shags Phalacrocorax aristotelis inrelation to environmental characteristics J Avian Biol 29 49minus54
Ward P Zahavi A (1973) The importance of certain assem-blages of birds as information centres for food findingIbis 115 517minus534
Wearmouth VJ Sims DW (2008) Sexual segregation in mar-ine fish reptiles birds and mammals behaviour pat-terns mechanisms and conservation implications AdvMar Biol 54 107minus170
Weimerskirch H Bertrand S Silva J Marques JC Goya E(2010) Use of social information in seabirds compassrafts indicate the heading of food patches PLoS ONE 5 e9928
Weimerskirch H Louzao M de Grissac S Delord K (2012)Changes in wind pattern alter albatross distribution andlife-history traits Science 335 211minus214
Zar JH (2010) Biostatistical analysis 5th edn Pearson Pren-tice Hall Upper Saddle River NJ
285
Editorial responsibility Jacob Gonzaacutelez-Soliacutes Barcelona Spain
Submitted May 14 2013 Accepted October 28 2013Proofs received from author(s) January 24 2014

Waggitt et al Sub-colony variation in northern gannets
Ecological implications
Although the precise mechanisms remain un -known there is growing evidence suggesting thatgannets use social information to inform foraging de-cisions (Gremillet et al 2004 Wakefield et al 2013)Theoretical models suggest that both local en hance -ment and the exchange of social information withinthe colony could influence the at-sea distributions ofgannets (Wakefield et al 2013) If social information
283
Fig 4 Morus bassanus Mean (plusmn SE) δ13C and δ15N values in red blood cells of chick-rearing northern gannets on GrassholmUK Mean δ13C and δ15N values are divided into sub-colonies (Sc1 to Sc7) and years (2006 = blue 2010 = red 2011 = green)
Sample sizes are also shown (n)
Year Foraging behaviour Sex Sub-colony Repeatability Power V F df p V F df p ()
2006 Range (km) 2925 122 0103 0499 221 0615 minus005 55 Distance (km) 3987 122 0060 1329 221 0290 002 79 Duration (d) 0558 122 0464 0158 221 0855 minus011 15 Departure direction (EW NS) 0247 2965 221 0070 0396 2347 419 0072 EW = 011 NS = 027 85 Distal direction (EW NS) 0295 3772 221 0042 0232 1245 419 0308 EW = minus011 NS = 017 23 Isotope signature (δ15N δ13C) 0531 10213 221 0001 0180 0960 419 0440 δ13C = minus015 δ15N = minus011 99 Core foraging area (Lat Lon) 0401 6038 221 0009 0295 1645 419 0183 Lat = 02 Lon = minus011 76
2010 Range (km) 1274 116 0281 0281 314 0838 minus013 24 Distance (km) 4122 116 0065 1001 314 0426 minus010 69 Duration (d) 0424 116 0527 0482 314 0701 minus001 22 Departure direction (EW NS) 0084 0507 215 0615 0598 1669 611 0172 EW = minus011 NS = 053 17 Distal direction (EW NS) 0011 0063 215 0939 0207 0562 611 0829 EW = 003 NS = 0 11 Isotope signature (δ15N δ13C) 0586 0668 215 0532 0580 1660 611 0170 δ13C = minus006 δ15N = minus006 45 Core foraging area (Lat Lon) 0909 0407 215 0675 0417 1055 611 0416 Lat = minus004 Lon = 009 90
2011 Range (km) 0789 131 0382 0636 428 0641 minus006 28 Distance (km) 1434 131 0242 0718 428 0587 004 36 Duration (d) 1633 131 0213 0567 428 0688 016 32 Departure direction (EW NS) 0019 0240 230 0782 0360 1428 824 0207 EW = minus013 NS = 025 17 Distal direction (EW NS) 0021 0270 230 0765 0441 1838 824 0091 EW = minus01 NS = 032 11 Isotope signature (δ15N δ13C) 0164 2461 230 0106 0320 1250 824 0280 δ13C = minus001 δ15N = minus006 53 Core foraging area (Lat Lon) 0013 0185 230 0832 0412 1817 824 0093 Lat = minus007 Lon = 025 42
Table 3 Morus bassanus Summary of ANOVA and MANOVA tests for differences in the foraging behaviour of chick-rearing gannets among sub-colonies and sexes on Grassholm UK in 2006 2010 and 2011 Also displayed are estimates of statistical powerand calculations of repeatability within sub-colonies V = Pillairsquos trace test EW = easterly component NS = northerly component
Significant differences shown in bold
Date n Departure direction (deg) VMR
6 July 2010 87 215 plusmn 35 56312 July 2010 113 205 plusmn 21 21213 July 2010 105 236 plusmn 24 249
Table 4 Morus bassanus Mean plusmn SD departure directions ofgannets nesting in sub-colony 6 (Sc6) on Grassholm UKthat were seen starting foraging trips between 0600 and1100 h GMT on 3 d in July 2010 Sample sizes are shown
(n) Also shown are the variance to mean ratios (VMR)
Mar Ecol Prog Ser 498 275ndash285 2014
was primarily exchanged at the nest site where indi-viduals can observe their neighboursrsquo chick-provision-ing duties and flight directions then we might expectat-sea segregation among sub-colonies This is not thecase here Al though we cannot completely dis miss anexchange at the nest site it seems possible that mostex changes of social information in the colony couldoccur elsewhere such as when individuals raft on thewater surface before starting a foraging trip (Weimers -kirch et al 2010)
The tendency for older or more dominant individu-als to occupy preferential nest sites (Velando amp Freire2001) could lead to colony members grouping them-selves by age or intrinsic quality If it is as sumed thatolder or more dominant individuals are competitivelysuperior or more efficient foragers then sub-coloniescontaining mainly older or dominant individualswould tend to forage closer to the colony or spendless time at sea (Catry amp Furness 1999 Daunt et al2007 Votier et al 2011) Results here suggest thatcolony members are probably not grouping them-selves by age or intrinsic qualities This could indi-cate that there is low variation in the quality of nestsites andor that the locations of preferential nestsites are not spatially aggregated
Methodological implications
Our results suggest that sampling several differentsub-colonies of gannets may not be necessary whenquantifying the foraging behaviours of the colonyas a whole However we cannot yet draw ro bust conclusions for seabirds in general For in stancethere are likely to be variations in the accuracy andexploitability and therefore the use of social infor-mation at the nest site among different species (Kingamp Cowlishaw 2007) Grouping by age or intrinsicqualities may also be more likely in species where
there is high variation in the quality of nest sites andthe locations of preferential nest sites are spatiallyaggregated (Velando amp Freire 2001) Given our cur-rent lack of knowledge across seabird species weurge further tests of this hypothesis elsewhere Byunderstanding when and why sub-colony foragingasymmetries occur appropriate sampling designscan be developed to ensure that the foraging behav-iours recorded from both GPS loggers and SIA arerepresentative of the colony as a whole By increas-ing our confidence in the accuracy of studies aimingto record and monitor individual foraging behaviourswithin colonies we can start to improve our under-standing of how changes to the en vironment broughtabout by marine renewable en ergies commercialfisheries marine pollution or climate change couldaffect seabird populations
Acknowledgements The opportunity to conduct fieldworkon Grassholm Island was kindly provided by the Royal Soci-ety for the Protection of Birds and device attachment andblood sampling was conducted with the permission of theCountryside Council for Wales We thank G Morgan LMorgan and T Brooke for their assistance during fieldworkand T Guilford R Freeman H Kirk and B Dean for theiradvice on the GPS logger programme and attachmentFinally we also thank 3 anonymous re viewers whose com-ments greatly improved this manuscript Funding was pro-vided by the European Union Interreg CHARM III projectNERC (NEH0071991 and NEG0010141) NERC LSMSFgrant lsquoEK134-1708rsquo and the Peninsula Research Institutefor Marine Renewable Energy
LITERATURE CITED
Arauacutejo MS Bolnick DI Layman CA (2011) The ecologicalcauses of individual specialisation Ecol Lett 14 948minus958
Bearhop S Waldron S Votier SC Furness RW (2002) Factorsthat influence assimilation rates and fractionation ofnitrogen and carbon stable isotopes in avian blood andfeathers Physiol Biochem Zool 75 451minus458
Calenge C (2006) The package adehabitat for the R soft-ware a tool for the analysis of space and habitat use by
284
Fig 5 Morus bassanus Departure directions of breeding northern gannets in sub-colony 6 (Sc6) on Grassholm UK on 3 d in July 2010
Waggitt et al Sub-colony variation in northern gannets
animals Ecol Model 197 516minus519Catry P Furness RW (1999) The influence of adult age on
territorial attendance by breeding great skuas Catharac -ta skua an experimental study J Avian Biol 30 399minus406
Champely S (2009) pwr basic functions for power analysisR package version 111 httpcranr-project org webpackagespwrindexhtml
Coulson JC (2002) Colonial breeding in seabirds In Schreiber EA Burger J (eds) Biology of marine birdsCRC Press Boca Raton FL p 87minus113
Danchin E Wagner RH (1997) The evolution of coloniality the emergence of new perspectives Trends Ecol Evol 12 342minus347
Daunt F Wanless S Harris MP Money L Monaghan P(2007) Older and wiser improvements in breeding suc-cess are linked to better foraging performance in Euro-pean shags Funct Ecol 21 561minus567
Deniro MJ Epstein S (1981) Influence of diet on the distribu-tion of nitrogen isotopes in animals Geochim Cosmo -chim Acta 45 341minus351
Farquhar GD Ehleringer JR Hubick KT (1989) Carbon iso-tope discrimination and photosynthesis Annu Rev PlantPhysiol Plant Mol Biol 40 503minus537
Gremillet D DellrsquoOmo G Ryan PG Peters G Ropert-Coudert Y Weeks SJ (2004) Offshore diplomacy or howseabirds mitigate intra-specific competition a case studybased on GPS tracking of Cape gannets from neighbour-ing colonies Mar Ecol Prog Ser 268 265minus279
Hamer KC Humphreys EM Garthe S Hennicke J and oth-ers (2007) Annual variation in diets feeding locationsand foraging behaviour of gannets in the North Sea flex-ibility consistency and constraint Mar Ecol Prog Ser 338 295minus305
Hamer KC Humphreys EM Magalhatildees MC Garthe S andothers (2009) Fine-scale foraging behaviour of amedium- ranging marine predator J Anim Ecol 78 880minus889
Hipfner JM Charette MR Blackburn GY (2007) Subcolonyvariation in breeding success in the tufted puffin Frater-cula cirrhata association with foraging ecology andimplications Auk 124 1149minus1157
Hobson KA Clark RG (1992) Assessing avian diets usingstable isotopes II factors influencing diet-tissue fraction-ation Condor 94 189minus197
Inger R Bearhop S (2008) Applications of stable isotopeanalyses to avian ecology Ibis 150 447minus461
Ito M Takahashi A Kokubun N Kitaysky AS Watanuki Y(2010) Foraging behavior of incubating and chick-rearing thick-billed murres Uria lomvia Aquat Biol 8 279minus287
King AJ Cowlishaw G (2007) When to use social informa-tion the advantage of large group size in individual deci-sion making Biol Lett 3 137minus139
Montevecchi W Fifield D Burke C Garthe S Hedd A RailJ Robertson G (2012) Tracking long-distance migrationto assess marine pollution impact Biol Lett 8 218minus221
Murphy KR Myors B Wolach A (2012) Statistical poweranalysis a simple and general model for traditional andmodern hypothesis tests 3rd edn Taylor amp Francis NewYork NY
Nakagawa S Schielzeth H (2010) Repeatability for Gaussianand non-Gaussian data a practical guide for biologistsBiol Rev Camb Philos Soc 85 935minus956
Patrick SC Bearhop S Greacutemillet D Lescroeumll A and others(2014) Individual differences in searching behaviour andspatial foraging consistency in a central place marinepredator Oikos 12333ndash40
Pettex E Bonadonna F Enstipp MR Siorat F Greacutemillet D(2010) Northern gannets anticipate the spatio-temporaloccurrence of their prey J Exp Biol 213 2365minus2371
R Development Core Team (2010) R a language and en -vironment for statistical computing R Foundation for Statistical Computing Vienna
Robinson D (2001) δ15N as an integrator of the nitrogencycle Trends Ecol Evol 16 153minus162
Ropert-Coudert Y Wilson RP (2005) Trends and perspec-tives in animal-attached remote sensing Front Ecol Env-iron 3 437minus444
Soanes LM Atkinson PW Gauvain RD Green JA (2013a)Individual consistency in the foraging behaviour ofnorthern gannets implications for interactions with off-shore renewable energy developments Mar Policy 38 507minus514
Soanes LM Arnould JPY Dodd SG Sumner MD Green JA(2013b) How many seabirds do we need to track todefine home-range area J Appl Ecol 50 671minus679
Stauss C Bearhop S Bodey TW Garthe S and others (2012)Sex-specific foraging behaviour in northern gannetsMorus bassanus incidence and implications Mar EcolProg Ser 457 151minus162
Velando A Freire J (2001) How general is the central-periphery distribution among seabird colonies Nestspatial pattern in the European shag Condor 103 544minus554
Votier SC Bearhop S Crane JE Arcos JM Furness RW(2007) Seabird predation by great skuas Stercorariusskua mdash intra-specific competition for food J Avian Biol38 234minus246
Votier SC Bearhop S Witt MJ Inger R Thompson D New-ton J (2010) Individual responses of seabirds to commer-cial fisheries revealed using GPS tracking stable iso-topes and vessel monitoring systems J Appl Ecol 47 487minus497
Votier SC Grecian WJ Patrick S Newton J (2011) Inter-colony movements at-sea behaviour and foraging in animmature seabird results from GPS-PPT tracking radio-tracking and stable isotope analysis Mar Biol 158 355minus362
Votier SC Bicknell A Cox SL Scales KL Patrick SC (2013)A birdrsquos eye view of discard reforms bird-borne camerasreveal seabirdfishery interactions PLoS ONE 8 e57376
Wakefield ED Bodey TW Bearhop S Blackburn J and others (2013) Space partitioning without territoriality ingannets Science 341 68minus70
Wanless S Greacutemillet D Harris MP (1998) Foraging activityand performance of shags Phalacrocorax aristotelis inrelation to environmental characteristics J Avian Biol 29 49minus54
Ward P Zahavi A (1973) The importance of certain assem-blages of birds as information centres for food findingIbis 115 517minus534
Wearmouth VJ Sims DW (2008) Sexual segregation in mar-ine fish reptiles birds and mammals behaviour pat-terns mechanisms and conservation implications AdvMar Biol 54 107minus170
Weimerskirch H Bertrand S Silva J Marques JC Goya E(2010) Use of social information in seabirds compassrafts indicate the heading of food patches PLoS ONE 5 e9928
Weimerskirch H Louzao M de Grissac S Delord K (2012)Changes in wind pattern alter albatross distribution andlife-history traits Science 335 211minus214
Zar JH (2010) Biostatistical analysis 5th edn Pearson Pren-tice Hall Upper Saddle River NJ
285
Editorial responsibility Jacob Gonzaacutelez-Soliacutes Barcelona Spain
Submitted May 14 2013 Accepted October 28 2013Proofs received from author(s) January 24 2014