the evolution of the cold interstellar medium in galaxies ... - hal-insu
TRANSCRIPT

MNRAS 448, 258–279 (2015) doi:10.1093/mnras/stu2714
The evolution of the cold interstellar medium in galaxies following astarburst
�
K. Rowlands,1† V. Wild,1 N. Nesvadba,2 B. Sibthorpe,3 A. Mortier,4 M. Lehnert5
and E. da Cunha6
1(SUPA) School of Physics & Astronomy, University of St Andrews, North Haugh, St Andrews, Fife KY16 9SS, UK2Institut d’Astrophysique Spatiale, CNRS, Universite Paris-Sud, Bat. 120-121, F-91405 Orsay, France3SRON Netherlands Institute for Space Research, Zernike Building, PO Box 800, NL-9700 AV Groningen, the Netherlands4School of Physics & Astronomy, The University of Nottingham, University Park Campus, Nottingham NG7 2RD, UK5Institut d’Astrophysique de Paris, UMR 7095, CNRS, Universite Pierre et Marie Curie, 98 bis boulevard Arago, F-75014 Paris, France6Max Planck Institute for Astronomy, Konigstuhl 17, D-69117 Heidelberg, Germany
Accepted 2014 December 18. Received 2014 December 17; in original form 2014 October 17
ABSTRACTWe present the evolution of dust and molecular gas properties in a sample of 11 z ∼ 0.03starburst to post-starburst (PSB) galaxies selected to span an age sequence from ongoingstarburst to 1 Gyr after the starburst ended. All PSBs harbour significant molecular gas anddust reservoirs and residual star formation, indicating that complete quenching of the starburstdue to exhaustion or expulsion of gas has not occurred during this timespan. As the starburstages, we observe a clear decrease in the star formation efficiency, molecular gas and starformation rate (SFR) surface density, and effective dust temperature, from levels coincidentwith starburst galaxies to those of normal star-forming galaxies. These trends are consistentwith a natural decrease in the SFR following consumption of molecular gas by the starburst,and corresponding decrease in the interstellar radiation field strength as the starburst ages.The gas and dust contents of the PSBs are coincident with those of star-forming galaxiesand molecular gas-rich early-type galaxies, and are not consistent with galaxies on the redsequence. We find no evidence that the global gas reservoir is expelled by stellar winds oractive galactic nuclei feedback. Our results show that although a strong starburst in a low-redshift galaxy may cause the galaxy to ultimately have a lower specific SFR and be of anearlier morphological type, the galaxy will remain in the ‘green valley’ for an extended time.Multiple such episodes may be needed to complete migration of the galaxy from the blue- tored sequence.
Key words: dust, extinction – galaxies: evolution – galaxies: interactions – galaxies: ISM –galaxies: starburst – submillimetre: galaxies.
1 IN T RO D U C T I O N
It has long been known that the galaxy population displays a colourbimodality (Strateva et al. 2001; Blanton et al. 2003; Baldry et al.2004; Bell et al. 2004). The dearth of green valley galaxies relativeto the optically blue and red populations, together with the gradualbuild-up of mass on the red sequence over cosmic time, has led tothe idea that many galaxies must undergo a rapid change in colourdue to quenching of star formation on a �1 Gyr time-scale (Kaviraj
�Herschel is an ESA space observatory with science instruments providedby European-led Principal Investigator consortia and with important partic-ipation from National Aeronautics and Space Administration (NASA).†E-mail: [email protected]
et al. 2007; Martin et al. 2007; Schawinski et al. 2007; Wild et al.2009; Yesuf et al. 2014).
Post-starburst (PSB) galaxies are candidates for such a transitionpopulation. These galaxies have undergone a starburst in the recent(�1 Gyr) past which has since declined rapidly in strength, leaving adominant A/F-star population. Local PSBs which have completelyquenched their star formation are found to have predominantlyearly-type morphologies (Wong et al. 2012; Mendel et al. 2013), anda large fraction exhibit morphological disturbances (Zabludoff et al.1996; Blake et al. 2004; Goto 2005; Yang et al. 2008; Pracy et al.2009; Pawlik et al., in preparation). This has led to the hypothesisthat the starburst was triggered by a merger or interaction, at leastin the local Universe where gas-to-stellar mass ratios of massivegalaxies are relatively low (Bekki, Shioya & Couch 2001; Bekkiet al. 2005; Snyder et al. 2011, but see Dressler et al. 2013 for
C© 2015 The AuthorsPublished by Oxford University Press on behalf of the Royal Astronomical Society
Dow
nloaded from https://academ
ic.oup.com/m
nras/article/448/1/258/1748852 by CN
RS - ISTO
user on 25 April 2022

Evolution of the cold ISM after a starburst 259
an alternative view). Simulations show how an interaction mayfunnel gas towards the centre of the galaxy (e.g. Mihos & Hernquist1994, 1996; Barnes & Hernquist 1996), leading to an increase in gasdensity and subsequent strong star formation, ultimately consumingthe entire gas reservoir.
While the number density of PSB galaxies at z � 1 indicates thatthey could represent a significant channel for red-sequence growth(Wild et al. 2009; Whitaker et al. 2012a; Yesuf et al. 2014), the trueglobal importance of PSB galaxies for the wider picture of galaxyevolution depends on whether the quenching of star formation ispermanent or temporary.
To reach the red sequence, the gas reservoir in galaxies must beexhausted, and/or prevented from forming stars via feedback mech-anisms (e.g. Benson et al. 2003; Di Matteo, Springel & Hernquist2005). Using simple energetics arguments, Kaviraj et al. (2007)suggested that supernova (SN) feedback is consistent with beingthe dominant quenching mechanism of star formation in nearbylow stellar mass (M∗ < 1010 M�) PSBs, and feedback from activegalactic nuclei (AGN) dominates in high-mass (M∗ > 1010 M�)PSBs (see also Wong et al. 2012). Smoothed particle hydrodynamicsimulations of merging galaxies routinely show how the starburstinitially declines through the depletion of gas supplies, but addi-tional energy must be injected into the interstellar medium (ISM)to completely quench star formation throughout the entire galaxy.Energy input from an AGN is usually invoked to complete the tran-sition of galaxies from blue to red sequence, through gas heatingor expulsion (e.g. Springel, Di Matteo & Hernquist 2005; Hopkinset al. 2007; Khalatyan et al. 2008; Kaviraj et al. 2011). However,there remains no direct observational evidence for such a scenario(although see Alatalo et al. 2014).
Due to the rarity of PSBs in the local Universe, they are not rou-tinely included in large neutral and molecular gas surveys. With-out the need for selection with moderate signal-to-noise opticalspectroscopy, close pair/pre-merger samples and IR bright star-burst/coalescence phases have been better studied with targeted ob-servations (e.g. Sanders, Scoville & Soifer 1991; Braine & Combes1993; Solomon et al. 1997; Casasola, Bettoni & Galletta 2004;Boquien et al. 2011b; Garcıa-Burillo et al. 2012). Recently, Zwaanet al. (2013) detected H I gas in 6/11 galaxies with PSB populationsat z ∼ 0.03, finding that they have atomic gas-to-stellar mass ratiosbetween those of early-type galaxies (ETGs) and spirals. Althoughthese results show that local PSBs may not have run out of gasentirely, H I is not directly connected to star formation as it domi-nates the ISM when gas surface densities are <10 M� pc−2 (Bigielet al. 2008). Knowledge of their molecular gas contents is requiredto ascertain why galaxies have stopped forming stars. It is also ad-vantageous to study PSBs with a range of ages, and in conjunctionwith samples of starbursts from which they originated, so we cantrack how the state of the ISM alters as the impact of the starburstdecays. This has not been the case in previous studies, where strin-gent limits placed on nebula emission line strengths ensures that allstar formation has completely ceased and therefore only the oldestPSBs (and those without type-II AGN) are selected for follow-up.
In this paper, we examine the cold gas and dust properties of asample of starbursts and PSBs at z ∼ 0.03 with a range of ages from0 to 1 Gyr after the starburst, selected from the spectroscopic sam-ple of the Sloan Digital Sky Survey (SDSS) Data Release 7 (DR7;Abazajian et al. 2009). We focus purely on galaxies with significantbulges (selected with high stellar surface mass density, μ∗) where thestar formation processes are more extreme than in disc-dominatedsystems (Kennicutt 1998, hereafter K98), and the majority of accre-tion on to black holes occurs (Kauffmann et al. 2003b). The sample
is selected purely based on the properties of the stellar population ofthe galaxies, i.e. with no cut on nebular emission line strength. Thisserves two purposes: (1) it does not bias against objects containingobscured (narrow line) AGN which may be more prevalent in PSBsthan other phases of galaxy evolution (Yan et al. 2006; Georgakakiset al. 2008; Brown et al. 2009; Yesuf et al. 2014), and (2) allows us toselect PSBs with a range of ages, as starbursts are not instantaneous,but rather decay over ∼100 Myr time-scales meaning nebular emis-sion lines are expected to be present even during the PSB phase(Yan et al. 2006; Falkenberg, Kotulla & Fritze 2009; Snyder et al.2011). By selecting purely based on known physical properties ofthe stellar population, (i.e. starburst age and burst strength), wecan select a complete sample of objects in a physically meaningfulsense. In Section 2, we describe the method used to select a com-plete sample of starburst to PSB galaxies. In Section 3, we describethe multiwavelength data obtained for this study and our spectralenergy distribution (SED) fitting method. The results are presentedin Section 4 and our conclusions in Section 5. We adopt a cosmologywith �m = 0.30, �� = 0.70 and H0 = 70 km s−1 Mpc−1.
2 SA M P L E SE L E C T I O N
In the integrated optical fibre spectrum of a galaxy, the different sig-natures of stars of different ages can be used to obtain informationabout a galaxy’s recent star formation history (SFH). To define oursample, we make use of two particular features of optical spectra: the4000 Å break strength and Balmer absorption line strength. In Fig. 1,we show the distribution of two spectral indices which parametrizethese features for 70 000 bulge-dominated galaxies with stellarsurface mass density μ∗= M∗/(2πr2
50,z) > 3 × 10⁸ M� kpc−2 at0.01 < z < 0.07 in the SDSS. These two spectral indices arebased on a principal component analysis (PCA) of the 3175–4150 Å
Figure 1. The 4000 Å break strength and Balmer absorption line strength asmeasured by a principal component analysis of the 4000 Å spectral region ofthe targeted galaxies (stars). The grey-scale indicates the distribution of allSDSS DR7 galaxies with spectral per-pixel-SNR >8 in the g-band, redshift0.01 < z < 0.07 and stellar surface mass densities >3 × 10⁸ M� kpc−2.The coloured dots indicate the (post-)starburst sample from which the targetswere selected. The open star indicates the position of the additional target‘PSB11’, an older PSB galaxy than the completeness limit of the originalstarburst sample. Errors are indicated only where they are significantly largerthan the symbol size.
MNRAS 448, 258–279 (2015)
Dow
nloaded from https://academ
ic.oup.com/m
nras/article/448/1/258/1748852 by CN
RS - ISTO
user on 25 April 2022

260 K. Rowlands et al.
region of the spectra, and describe the strength of the 4000 Å break,and excess Balmer absorption over that expected for the 4000 Åbreak strength (Wild et al. 2007). As expected for bulge-dominatedgalaxies, the majority of the galaxies show no evidence of recentor current star formation, they form the ‘red sequence’ which lieson the right, with strong 4000 Å break strength from the old stars.Galaxies that are forming stars have younger mean stellar ages andtherefore weaker 4000 Å break strengths and form the ‘blue se-quence’. A small number of galaxies are undergoing a ‘starburst’,i.e. there has been a sharp increase in the galaxy’s star formationrate (SFR) over a short time-scale (∼107 yr). These galaxies areidentified by their unusually weak Balmer absorption lines, strongUV–blue continua and weak 4000 Å breaks, i.e. spectra dominatedby light from O/B stars. These objects lie in the lower left of Fig. 1.As the starburst ages to a few 108 yr, the Balmer absorption lines in-crease in strength as the galaxy passes into the PSB phase (Dressler& Gunn 1983; Couch & Sharples 1987), i.e. A/F star light dominatesthe integrated galaxy spectrum. These objects lie in the upper leftof Fig. 1. A comparison of our selection technique to the classicaldefinition of PSB galaxies (e.g. lack of Hα, [O II] and deep Balmerabsorption) is presented in Appendix A.
2.1 Measuring starburst age
The rapidly changing appearance of the galaxy optical spectrumduring and following a starburst, together with the enhanced lumi-nosity of young stars compared to the old (non-starburst) population,allows the robust measurement of starburst age. A full Bayesianspectral synthesis model analysis of the optical spectra, allowingfor variations in dust attenuation and previous SFH, yields uncer-tainties of the order of 20 Myr for the youngest objects to 100 Myras the starburst ages to ∼1 Gyr (Wild, Heckman & Charlot 2010).Unfortunately, burst strength at a given starburst age is less wellconstrained for individual objects, and is more dependent on theunderlying SFH of the galaxy. At ages older than ∼600 Myr, a de-generacy becomes apparent between burst age and mass, leadingWild et al. (2010) to restrict their evolutionary sequence to agesyounger than this.
Through comparison with population synthesis models, usingsimple toy model SFHs or more complex histories derived fromsimulations, Wild et al. (2007, 2009) showed that the shape of theleft-hand side of the distribution in Fig. 1 describes the evolutionarytrack of a starburst galaxy, with time since the starburst increasingfrom bottom to top, and burst strength increasing from right toleft. The galaxies lying at the outermost edge of the distributionhave undergone the strongest recent bursts of star formation inthe entire sample. At these low redshifts, these starbursts are notstrong; Bayesian fits to spectral synthesis models imply typical burstmass fractions (i.e. fraction of stellar mass formed in the burst) of∼10 per cent. The models show that if galaxies that had undergonestronger bursts existed, they would lie to the left of the distribution atintermediate starburst ages, where no galaxies are observed. Thus,the visualization of the full distribution of objects, rather than fitsto individual objects, allows us to better constrain the parameters ofthe population as a whole.
The coloured dots in Fig. 1 are selected to form a complete(constant number per unit starburst age) sample of the 400 strongeststarbursts in SDSS galaxies with high μ∗. The definition of thissample is discussed in greater detail in Wild et al. (2010, hereafterWHC10). Briefly, a Bayesian fit was performed to the PCA indicesof the individual galaxies to determine starburst age (tSB) using
a set of 107 spectral synthesis models with SFHs composed ofan old bulge population with superposed exponentially decayingstarbursts. Burst mass fraction, burst age, decay rate and dust contentwere free to vary with uniform priors. The resulting errors on thestarburst age therefore take into account the potential variations inrecent SFH and dust content of the galaxies and account for possibledegeneracies between model parameters.
2.2 Sample for follow-up millimetre and far-infraredobservations
From this base sample of galaxies which have undergone thestrongest recent bursts of star formation in the local Universe, weselected 11 targets for follow-up carbon monoxide (CO) and far-infrared (FIR) observations, indicated as stars in Fig. 1.
(i) We targeted four starburst ages (tSB), either side of the ob-served discontinuities in L(Hα) (see Section 3.1): three galaxieswith tSB < 50 Myr, two with tSB ∼ 100 Myr, two with tSB ∼ 400 Myrand three with tSB ∼ 600 Myr. To extend the time baseline probedby our observations, we additionally targeted an older PSB galaxy,which is too old to form part of the complete sample describedabove (open star in Fig. 1). As discussed above, typical errors ontSB are significantly less than the difference in ages between thebins.
(ii) All objects have typical Hα luminosities for their starburstage (see Section 3.1).
(iii) We ensured that galaxies in each of the four samples havesimilar stellar mass1 (9.6 < log10(M∗/M�) < 10.4) and redshift(0.025 < z < 0.05).
Table 1 gives the name, position, SDSS spectroscopic ID andredshift of all targets. The final column gives the integration timefor the CO observations (Section 3.2).
The r-band half-light radius (Petrosian R50) of the sample rangesfrom 1.5–5.2 arcesc (1.0–3.4 kpc in physical radius). It is importantto note that our sample has been selected primarily on propertiesderived from spectra which probe the central 3 arcesc of the galaxies(0.9–1.4 kpc in physical radius), which extends from 0.3–1.0 timesthe half-light radius. We take care to note this where relevant to ourresults.
Fig. 2 shows how the central SFR (measured from dust-correctedHα luminosity within the 3 arcesc SDSS fibre) declines with star-burst age as derived from the stellar continuum. Overall, we measurea decline time-scale of ∼300 Myr similar to that expected from discdynamical time-scales (Lehnert & Heckman 1996). However, weclearly identify three phases: a short ‘starburst’ phase of the orderof 10–30 Myr, an almost flat ‘coasting’ phase which lasts to around400 Myr, and a subsequent decline. It is clear, even from the SDSSdata, that star formation has not shut down instantaneously follow-ing the starburst, and residual star formation continues long into thePSB phase. The aim of the CO and FIR observations presented inthis paper is to study the galaxy-wide reservoir of molecular gasthat is fuelling this ongoing star formation.
1 During selection, the stellar mass was measured using a Bayesian fitof stellar population synthesis models to the five-band SDSS photometry(J. Brinchmann; http://www.mpa-garching.mpg.de/SDSS).
MNRAS 448, 258–279 (2015)
Dow
nloaded from https://academ
ic.oup.com/m
nras/article/448/1/258/1748852 by CN
RS - ISTO
user on 25 April 2022

Evolution of the cold ISM after a starburst 261
Table 1. Object name, position, SDSS DR7 specobjid, optical redshift and total on-sourceintegration time for the millimetre observations.
Object ID RA Dec Specobjid z tint
(J2000 deg) (J2000 deg) (min)
PSB1 233.132 57.8829 173331940055711744 0.039 570 (600)a
PSB2 228.951 20.0224 607094233467191296 0.036 240PSB3 225.401 16.7297 782453208889950208 0.032 300PSB4 246.455 40.3452 330115272746729472 0.029 240PSB5 244.398 14.0523 711521640860614656 0.034 240PSB6 252.924 41.6684 177834388912865280 0.043 120PSB7 249.495 13.8594 622289631202770944 0.047 240PSB8 232.702 55.3288 173055146299752448 0.046 420PSB9 239.568 52.4893 174175084368363520 0.049 480PSB10 247.179 22.3971 442707057922015232 0.034 480PSB11 237.803 14.6964 709269844574339072 0.048 360
Note. aCombined spectra contain 38 scans at CO(1–0) and 40 scans at CO(2–1).
Figure 2. The SFR (SFR, left-hand panel) and specific SFR (SSFR = SFR/M∗, right-hand panel) within the 3 arcsec SDSS fibre of the targeted galaxies (stars)and full starburst sample (dots), as a function of time since the starburst. Galaxies are classified as star forming (blue), composites (orange) or AGN (red) on theBPT diagram (Baldwin, Phillips & Terlevich 1981; Veilleux & Osterbrock 1987). Composite galaxies have had the AGN contribution to their Hα luminosityremoved, based on the correction presented in WHC10, before their SFR is calculated. A similar correction is not attempted for the AGN, and these are shownas upper limits based on their total Hα luminosity. ‘PSB11’ has a starburst age of ∼1 Gyr, and is indicated as an open star at the rightmost edge of each panel.
3 DATA A N D M E T H O D S
3.1 Optical data
The SDSS is an optical photometric and spectroscopic surveyof local galaxies (York et al. 2000). The final data release ofSDSS-II (DR7, Abazajian et al. 2009) includes 9380 deg2 withspectroscopic coverage, targeting nearly 106 galaxies with Pet-rosian r-band magnitudes <17.77. The spectra have good signalto noise and moderate resolution which allows the deconvolu-tion of stellar continuum from nebular emission that is crucialto accurately measure Balmer decrements. Such a deconvolutionhas been carried out by Brinchmann et al. (2004) and Tremontiet al. (2004) and the emission line measurements are available athttp://www.mpa-garching.mpg.de/SDSS.
From the SDSS data, we extract the following information.
(i) Model magnitudes in the u, g, r, i and z bands as an input tothe MAGPHYS SED fitting.2
(ii) Nebular emission line fluxes in the central 3 arcsec, correctedfor underlying stellar continuum absorption, from Brinchmann et al.(2004) and Tremonti et al. (2004). These provide the Hα and Hβ linefluxes to estimate dust-corrected Hα luminosity, and allow detectionof a possible AGN using the BPT diagram ([N II]/Hα and [O III]/Hβ
emission line ratios; Baldwin et al. 1981; Veilleux & Osterbrock1987).
(iii) Stellar continuum indices measured in the central 3 arcsec,PC1 and PC2, which measure the 4000 Å break strength
2 To the u and z bands, we apply a small correction of −0.04 and +0.02magnitudes, respectively, to bring them on to the AB magnitude calibration(http://classic.sdss.org/dr7/algorithms/fluxcal.html#sdss2ab).
MNRAS 448, 258–279 (2015)
Dow
nloaded from https://academ
ic.oup.com/m
nras/article/448/1/258/1748852 by CN
RS - ISTO
user on 25 April 2022

262 K. Rowlands et al.
Table 2. Physical parameters derived from SDSS data. Note that starburst age, stellar mass, SFR, metallicity andemission line class are measured within the central 3 arcsec (0.9–1.4 kpc in physical radius). Composite galaxies havehad the AGN contribution to their Hα luminosity removed, based on the correction presented in WHC10, before theirSFR is calculated. A similar correction is not attempted for the AGN, for which SFR is given as an upper limit basedon their total Hα luminosity.
Name σ ∗ Starburst age log10(Stellar mass) 12+log(O/H)a SFR Emission line class(km s−1) (Myr) (M�) (M� yr−1)
PSB1 86 ± 13 18+4−8 9.8 8.9 6.4+0.4
−0.4 SF
PSB2 131 ± 10 16+2−6 10.7 9.0 9.1+0.4
−0.5 SF
PSB3 114 ± 10 18+1−4 9.6 9.0 ∼5.8 comp
PSB4 96 ± 12 78+15−31 10.4 8.8 1.9+0.1
−0.2 SF
PSB5 88 ± 8 116+36−65 9.9 − 99.9 ∼2.7 comp
PSB6 110 ± 7 394+38−74 10.4 − 99.9 ∼1.8 comp
PSB7 76 ± 7 394+36−63 10.2 9.1 ∼0.9 comp
PSB8 96 ± 6 598+111−82 10.0 − 99.9 <0.2 AGN
PSB9 87 ± 8 594+514−12 10.3 9.0 ∼0.4 comp
PSB10 93 ± 15 573+165−57 10.2 8.9 1.0+0.1
−0.1 SF
PSB11 101 ± 6 996+55−169 10.5 − 99.9 <0.2 AGN
Note. aGas phase oxygen abundance from Tremonti et al. (2004), −99.9 where unmeasured for galaxies with AGNsignatures. Note that due to a slightly less stringent demarcation between star-forming and composite galaxies usedin Tremonti et al. (2004), some galaxies we class as ‘composite’ are classed as star forming in Tremonti et al. (2004)and therefore have a metallicity measurement.
and the Balmer absorption lines as described in Section 2(Wild et al. 2007).
(iv) Stellar surface mass density (μ∗) calculated as M∗/(2πr250,z)
where r50, z is the physical size in kpc of the radius which contains50 per cent of the z-band Petrosian flux.
In Table 2, we give the parameters derived from SDSS data thatare most relevant to this paper for each object in our sample. Themulticolour gri SDSS images of the target galaxies are shown inAppendix B1 with the size of the 3 arcsec SDSS fibre and the Institutde Radioastronomie Millimetrique (IRAM) beam size at 115 and230 GHz. The images are ordered by starburst age indicated atthe top of each panel. Visual inspection of the images reveals thatgalaxies with the youngest starbursts are generally extremely blue,with clear signs of recent disruption. The host galaxies of olderstarbursts are redder, with occasional signs of past disruption (seePawlik et al. in preparation). For a larger selection of images of theoldest and youngest starbursts in the parent sample, see figs A1 andA2 in WHC10.
The SDSS spectra are shown in Fig. B2, over the full opticalrange in the right-hand column and zoomed in on the 4000 Å breakregion in the left-hand column. The PCA fits to the 4000 Å breakregion, from which the stellar indices PC1 and PC2 and in turn thestarburst ages are measured, are overplotted in red. The emissionline classification of each object is given in the right-hand panels,based upon their position on the BPT diagram. Galaxies that liebelow the demarcation line of WHC10 are classified as star forming,those lying above the demarcation line of Kewley et al. (2001)are classified as AGN and those lying in between are classifiedas star-forming-AGN composites. We note that these classes areartificial: first, the lines are either empirically derived in the case ofWHC10, or derived from theoretical models subsequently shown tobe inaccurate (Levesque, Kewley & Larson 2010); and secondly theposition of a galaxy in the diagram depends on the SFR relative toblack hole accretion rate in the 3 arcsec SDSS fibre. However, theyprovide a useful first-order classification between objects where thenebular emission lines are dominated by star formation and therefore
only a weak AGN can exist, or those with a rapidly accreting AGN.It should be noted that pure AGN are not visible until the older PSBstage, due to the high SFRs at young ages. See WHC10 for moredetails.
3.2 CO data
We observed all objects on the nights of 2010 June 29/30 withthe IRAM-30m telescope. The Eight MIxer Receiver (EMIR) wasused in wobbler switching mode with reference positions offset by±100 arcsec. We used the Wideband Line Multiple Autocorrelator(WILMA) backend with the standard instrument setup which al-lowed us to obtain simultaneous measurements of CO(1–0) at 3 mmand CO(2–1) at 1 mm, with a resolution of 2 MHz (∼5 kms−1 atthe observing frequency). We also simultaneously recorded data at3 mm with VErsatile SPectrometer Assembly (VESPA) and with the4 MHz filterbank at 1 mm as a backup. In general, measurementsfrom the different receivers are consistent within the 1σ errors.Conditions were generally good, with only 2 h lost due to rain orexcessive cloud. The precipitable water vapour at 3 mm rangedfrom 4.7–37.8 mm, with a mean of 13.9 mm. The total on-sourceintegration time in minutes is shown in Table 1.
Scans of 6 min duration were performed, and were comprisedof 12 individual on-source and off-source sub-scans of 30 s du-ration. Observations were interspersed with pointing calibrationstaken every 1–3 h on Mars or a bright nearby quasar. Telescoperefocusing was carried out approximately every 6 h and followingsunset and sunrise. We used the standard reduction software, MIRA,to calibrate each science scan using the calibration scan taken clos-est in time. Integrations were repeated until a signal was detected,or a sufficient upper limit on a line detection was reached. Mul-tiple integrations were combined in the software package, CLASS,using sigma weighting following first-order baseline subtraction.In general, baselines were calculated using a linear fit in line-freeregions typically between [−500, −200] and [200, 500] km s−1, al-though in a few cases we determined that higher order polynomialswere required following visual inspection of the spectra. A small
MNRAS 448, 258–279 (2015)
Dow
nloaded from https://academ
ic.oup.com/m
nras/article/448/1/258/1748852 by CN
RS - ISTO
user on 25 April 2022

Evolution of the cold ISM after a starburst 263
Table 3. Object name, line intensity, line width, velocity offset from systemic (from the optical spectra), gas masses derived from theCO(1–0) line. These are the values measured from the WILMA spectra and do not include a small aperture correction. The final columnlists the CO(1–0) aperture correction based on the g-band isophotal radius (see text for details) which can be applied to correct the gas massto total.
Name I a1−0 �V(1 − 0) δvsys(1 − 0) I b
2−1 �V(2 − 1) δvsys(2 − 1) Mgas f(Jy km s−1) (km s−1) (km s−1) (Jy km s−1) (km s−1) (km s−1) (109 M�)
PSB1 < 1.4 – – 13.2 ± 2.0 87.4 ± 11.8 −5.1 ± 11.8 < 0.3 1.04 ± 0.28PSB2 13.8 ± 1.0 146.9 ± 8.9 −13.8 ± 8.9 19.0 ± 3.1 125.0 ± 16.4 83.1 ± 16.3 3.6 ± 0.3 1.12 ± 0.50PSB3 1.4 ± 0.4 127.4 ± 0.0 0.0 ± 0.0 7.8 ± 2.0 127.4 ± 0.0 0.0 ± 0.0 0.3 ± 0.1 1.08 ± 0.39PSB4 12.6 ± 1.4 88.9 ± 9.1 22.3 ± 9.1 35.2 ± 2.6 91.5 ± 5.9 31.5 ± 5.9 2.1 ± 0.2 1.12 ± 0.49PSB5 11.5 ± 0.6 98.6 ± 4.8 3.1 ± 4.8 27.1 ± 2.9 102.1 ± 9.7 52.1 ± 9.7 2.6 ± 0.1 1.03 ± 0.22PSB6 11.3 ± 1.3 107.5 ± 10.8 14.3 ± 10.8 27.7 ± 3.6 81.1 ± 9.5 18.3 ± 9.5 4.1 ± 0.5 1.05 ± 0.31PSB7 6.8 ± 1.1 122.1 ± 16.4 −0.4 ± 16.4 7.6 ± 1.7 66.3 ± 13.0 1.2 ± 13.0 3.0 ± 0.5 1.02 ± 0.19PSB8 1.8 ± 0.4 65.0 ± 10.5 −164.7 ± 10.5 < 5.3 – – 0.8 ± 0.2 1.02 ± 0.18PSB9 6.6 ± 0.7 129.5 ± 12.2 36.1 ± 12.2 < 7.3 – – 3.1 ± 0.3 1.04 ± 0.28PSB10 8.0 ± 0.9 132.1 ± 12.9 −1.7 ± 12.9 12.9 ± 1.6 64.6 ± 7.2 77.4 ± 7.2 1.9 ± 0.2 1.08 ± 0.39PSB11 1.4 ± 0.3 < 42.5 −71.7 ± 7.9 6.3 ± 1.4 127.4 ± 0.0 0.0 ± 0.0 0.7 ± 0.1 1.07 ± 0.36
number of scans on PSB1 with significantly higher noise levelswere discarded, possibly caused by the worse conditions in whichthey were taken.
The averaged spectra were smoothed and the channels binned toa velocity resolution of 21 km s−1. Line intensities were measuredby summing over the line profile, with a velocity width definedby the full width at half-maximum of a Gaussian fit to the lineprofile (using least-squares minimization with width, amplitude andcentroid free to vary). We estimate the line intensity using a sumunder the line profile. Following Young et al. (2011) and Saintongeet al. (2011a) in the case of a non-detection/weak line (i.e. <4σ ),we calculated upper limits by summing over a velocity width of300 km s−1 centred on the systemic velocity of the galaxy measuredfrom the SDSS spectrum.
We determined the statistical uncertainty on each line intensity(σ 2
l ) following Sage, Welch & Young (2007) and Young et al. (2011)as
σ 2l = (�v)2σ 2Nl
(1 + Nl
Nb
), (1)
for a line of width �v with Nl line channels and Nb baseline chan-nels. The rms noise level σ is equal to the standard deviation of theflux measured in line-free regions. Where a line was not detectedat >4σ , we define an upper limit as four times the statistical un-certainty of the integrated line intensity. 10/11 PSBs were detectedwith >4σ significance in the CO(1–0) transition and 9/11 PSBs inthe CO(2–1) transition. Table 3 presents the CO line measurementsand Fig. B1 shows the observed spectra.
Conversion from antenna temperature to main beam brightnesstemperature was achieved using the ratio of the beam and for-ward efficiencies Beff/Feff = 0.83 at 2.6 mm and 0.64 at 1.3 mm.3
We then converted from main beam temperature to flux assum-ing a factor of 4.73 Jy K−1. Gas masses were estimated from theCO(1–0) line flux using a Galactic CO to H2 conversion factorαCO=3.2 M� (K km s−1 pc2)−1, with an additional factor of 1.36for helium.
Given the optical extent of the galaxies, it is possible that the CObeam (∼22 arcsec at 115 GHz and ∼11 arcsec at 230 GHz) does notencompass all of the emission. We compute aperture corrections (f )following Lisenfeld et al. (2011) and Stark et al. (2013) assuming
3 http://www.iram.es/IRAMES/mainWiki/Iram30mEfficiencies
that the CO distribution follows an exponential disc with scalelengthgiven by the g-band isophotal radius. The aperture corrections aretypically small, with a median correction of 10 per cent at 115 GHzand 20 per cent at 230 GHz. Where we aperture correct CO fluxesand gas masses, we add in quadrature to the errors 5 per cent of theg-band size, to account for the uncertainty of aperture correction.Whether we choose to apply aperture corrections or not does notchange our conclusions. This is because the optical size of the PSBsis often comparable to or slightly smaller than the half-power beamwidth at 115 GHz, meaning that the aperture correction is small. Inthe following results, we use aperture corrected line fluxes and gasmasses unless explicitly stated.
3.3 Herschel data
The Herschel (Pilbratt et al. 2010) data were obtained from theOT1_vwild_1 open time programme. All PSBs were observed withthe PACS (Poglitsch et al. 2010) and SPIRE (Griffin et al. 2010)instruments in scan map mode in six bands at 70, 100, 160, 250, 350and 500 μm with a medium scan speed of 20 arcsec s−1. We use theSCANAMORPHOS map-maker (Roussel 2013), implemented in version12 of HIPE (Ott 2010), to mitigate the low-frequency 1/f noise in thePACS data, whilst preserving extended source emission. The sameversion of HIPE was used to create the SPIRE maps, with the naıvemap-maker being used in this case.
PACS and SPIRE fluxes were determined by summing the fluxwithin a circular aperture centred on the peak flux of the source. Weused apertures with radii of 12, 12, 22, 22, 30 and 40 arcsec corre-sponding to 12, 12, 11, 3.7, 3.0 and 2.9 pixels at 70, 100, 160, 250,350 and 500 μm, respectively. To estimate the background, we usedannuli with inner and outer radii of 35 and 45 arcsec for flux densitiesat 70–160 μm and 60 and 90 arcsec for flux densities at 250–500 μm.We applied the aperture corrections as recommended in the PACS4
and SPIRE5 observers manuals for the FM7 calibration.6 For SPIREsources, we assume beam areas of 436, 772 and 1590 arcsec2 at 250,350 and 500 μm, which include a correction for point sources witha flux density assumed to be dependent on the spectral index asSν ∼ ν3.5. One object, PSB8, was found to lie in a crowded field,
4 http://herschel.esac.esa.int/Docs/PACS/html/pacs_om.html5 http://herschel.esac.esa.int/Docs/SPIRE/html/spire_handbook.html6 1.247, 1.289, 1.224, 1.261, 1.226, 1.202.
MNRAS 448, 258–279 (2015)
Dow
nloaded from https://academ
ic.oup.com/m
nras/article/448/1/258/1748852 by CN
RS - ISTO
user on 25 April 2022

264 K. Rowlands et al.
with the standard aperture at 160 μm overlapping a neighbouringsource. For this object, we reduced the aperture radius by a factorof 2 for the 160 μm observations, increasing the aperture correctionaccordingly. For observations at ≥250 μm, we set the fluxes to upperlimits at the measured flux values. The observing strategy requiredto obtain both 70 and 100 μm maps means that two independentmaps were obtained at 160 μm. We treated the two 160 μm mapsindependently, deriving flux densities which were combined usingsigma weighting. In all cases, the independent 160 μm fluxes agreeto within the 1σ errors. We also apply the standard colour correc-tions for point sources from the SPIRE observers manual of 0.8930,0.8978, 0.8757 assuming that the flux density can be described asSν ∼ ν3.5 in the Rayleigh–Jeans (R–J) regime.
We determined the uncertainties on the PACS flux densities fol-lowing Balog et al. (2014), by measuring the signal rms in the back-ground annulus used for sky subtraction in each band. We correctfor the correlated noise between pixels which results from regrid-ding the data from the detector pixel size on to pixels projectedon the sky. The noise increases by a factor of 3.4, 3.2 and 8.0. Weuse this method of error estimation as it results in a higher (moreconservative) estimate of the noise than those using the standarddeviation of the flux density measured in six sky apertures.
For the SPIRE fluxes, following Ciesla et al. (2012) the total error(σ tot) encompasses the instrumental error (σ inst), the sky backgrounderror (σ sky) and the confusion error (σ conf), and is calculated as
σtot =√
σ 2inst + σ 2
sky + σ 2conf . (2)
For SPIRE data, σ inst was calculated by summing in quadrature thevalues on the error map within the same aperture as the source.For each SPIRE band, we estimated the sky background noise level(Npixσ skymean) by measuring the standard deviation of the mean skyvalue in each aperture around the source, using 16 apertures at 250and 350 μm, and eight apertures at 500 μm with the same size as thesource aperture, where Npix is the number of pixels in the aperture.For the SPIRE maps, we adopt the confusion noise estimates (errconf)from Nguyen et al. (2010) of 5.8, 6.3 and 6.8 mJy beam−1 at 250,350 and 500 μm, respectively. The confusion error is
σconf = errconf ×√
Npix × pixsize2
beamarea, (3)
following Ciesla et al. (2012). The confusion noise at the depthof the PACs maps is negligible. We convolve the uncertainties inquadrature with a flux calibration error of 5 and 5.5 per cent ofthe PACS7 and SPIRE fluxes, respectively, as recommended in thePACS and SPIRE manuals, (Bendo et al. 2013). Following Smithet al. (2013), we use all positive flux measurements in each bandregardless of the signal to noise in order to include as much infor-mation as possible in the SED. Where a negative flux is measured,we include the flux as an upper limit consistent with a flux densityof zero.
3.4 Ancillary data
For each source, we compile far-ultraviolet (FUV) and near-ultraviolet (NUV) data from the GALEX DR7 catalogue server. Allsources are matched to the nearest source within a 3 arcsec radius.We reject fluxes which have artefact flags and where the sourceis too close to the detector edge for reliable flux measurements
7 Note that due to the uncertainty in the appropriate colour correction, thePACS flux could be uncertain by up to 20 per cent.
(field-of-view radius >0.◦55). Where multiple observations exist,we select the deepest observation. We correct the UV fluxes forgalactic extinction using the values of E(B − V) from Schlegel,Finkbeiner & Davis (1998) and the factor AFUV = 7.9E(B − V) andANUV = 8.0E(B − V), derived using the Cardelli, Clayton & Mathis(1989) Galactic extinction law for a total-to-selective extinction ra-tio of RV = 3.1. Non-detections (<5σ ) are included as upper limitsin the SED fitting.
We compile near-infrared J, H and K elliptical isophotal mag-nitudes from the Two Micron All Sky Survey (Skrutskie et al.2006) Extended Source Catalog (Jarrett et al. 2000). We also com-pile Wide-field Infrared Space Explorer (WISE; Wright et al. 2010)3−22 μm fluxes from the all-sky data release. We use the profilemags (w4mpro) for point sources (defined with ext flg = 0), andthe aperture magnitudes (w4gmag) for extended sources. FollowingJarrett et al. (2012), we add small zero-point corrections of 0.03,0.04, 0.03 and −0.03 to the WISE W1, W2, W3 and W4 magnitudes,respectively. We convert the WISE magnitudes to fluxes includinga colour correction dependent on the spectral slope.8 We apply afurther colour correction to the W4 band as our sources have risingspectral slopes in this band, following the updated calibration inBrown et al. (2014). Where fluxes are not detected in the WISEbands we utilize upper limits in the SED fitting at the 2σ level.
We compiled fluxes from the IRAS Faint Source Catalogue(Moshir 1989) at 25 and 60 μm which have a quality flag >2.Where fluxes were of low quality or undetected, we used 5σ upperlimits of 0.2 Jy in the SED fitting.
In the UV, optical, near- and mid-infrared fluxes, we convolvethe catalogue error in quadrature with a calibration error of 20, 10,15 and 10 per cent of the flux, respectively, to allow for differencesin the methods used to measure total photometry and errors in thespectral synthesis models used to fit the underlying stellar popula-tions. To account for larger calibration uncertainty in the WISE W4band, we convolve the catalogue error in quadrature with 20 per centof the measured, colour-corrected flux.
3.5 SED fitting
The wealth of multiwavelength data for our sample of PSBs allowsus to derive global physical properties by fitting models to theirbroad-band photometric SEDs. We use the physically motivatedmethod of da Cunha, Charlot & Elbaz (2008, hereafter DCE089) torecover the physical properties of the PSBs.
DCE08 employ an energy balance prescription, whereby the UV–optical radiation emitted by stellar populations is absorbed by dust,and this absorbed energy is matched to that re-radiated in the FIR.The optical library of 50 000 spectra is produced using the latest ver-sion of the population synthesis code of Bruzual & Charlot (2003),Charlot & Bruzual (in preparation), and assumes exponentially de-clining SFHs with additional superimposed random bursts (knownas stochastic SFHs). The model spectra cover a wide range of age,metallicity, SFH and dust attenuation and a Chabrier (2003) is as-sumed. The infrared libraries contain 50 000 SEDs comprised offour different temperature dust components. In stellar birth clouds,these components are polycyclic aromatic hydrocarbons, hot dust(stochastically heated small grains with a temperature 130–250 K)and warm dust in thermal equilibrium (30–60 K). In the diffuse ISM,the relative fractions of these three dust components are fixed, but
8 http://wise2.ipac.caltech.edu/docs/release/allsky/expsup/sec4_4h.html9 The DCE08 models are publicly available as a user-friendly model packageMAGPHYS at www.iap.fr/magphys/
MNRAS 448, 258–279 (2015)
Dow
nloaded from https://academ
ic.oup.com/m
nras/article/448/1/258/1748852 by CN
RS - ISTO
user on 25 April 2022

Evolution of the cold ISM after a starburst 265
Table 4. Physical parameters derived from fitting the UV to FIR SEDs of each galaxy. The columns are (from leftto right): Name, M∗/M�, log10(stellar mass); Md/M�, log10(dust mass); Md/M∗, log10(dust-to-stellar mass ratio);T ISM
C /K, temperature of the cold diffuse ISM dust component; Ld/L�, log10(dust luminosity); SFR/M� yr−1, thelog10(SFR) averaged over the last 108 yr and SSFR/yr−1, the log10(SSFR) averaged over the last 108 yr. Uncertaintiesare indicated by the median 84th–16th percentile range from each individual parameter PDF. Note that T ISM
C should betreated with caution as the median likelihood values are close to the bounds on the temperature prior.
Name M∗ Md Md/M∗ T ISMC Ld SFR SSFR
log10(M�) log10(M�) log10(Md/M∗) (K) log10(L�) log10(M�yr−1) log10(yr−1)
PSB1 9.33+0.15−0.03 7.32+0.09
−0.03 −2.01+0.06−0.16 23.8+1.2
−0.7 11.00+0.02−0.01 1.04+0.04
−0.03 −8.27+0.01−0.15
PSB2 10.48+0.06−0.01 7.61+0.01
−0.01 −2.88+0.01−0.05 24.6+0.1
−0.1 11.36+0.01−0.01 1.21+0.15
−0.01 −9.27+0.10−0.01
PSB3 9.50+0.05−0.04 6.93+0.12
−0.06 −2.55+0.13−0.10 23.8+0.7
−2.2 10.62+0.04−0.09 0.74+0.05
−0.04 −8.77+0.10−0.05
PSB4 9.81+0.01−0.07 7.45+0.03
−0.01 −2.34+0.07−0.03 24.3+0.5
−0.4 10.84+0.01−0.02 0.74+0.01
−0.02 −9.07+0.10−0.01
PSB5 9.46+0.08−0.06 7.23+0.01
−0.01 −2.24+0.08−0.09 24.1+0.6
−0.1 10.86+0.01−0.03 0.80+0.03
−0.04 −8.68+0.10−0.20
PSB6 10.47+0.02−0.15 7.50+0.08
−0.14 −2.95+0.11−0.15 21.4+1.5
−0.8 10.58+0.04−0.02 0.40+0.07
−0.03 −10.07+0.24−0.01
PSB7 10.08+0.09−0.02 6.91+0.06
−0.05 −3.18+0.08−0.09 24.6+0.3
−0.8 10.24+0.05−0.02 −0.13+0.04
−0.02 −10.22+0.05−0.05
PSB8 9.89+0.15−0.11 6.41+0.27
−0.18 −3.47+0.30−0.23 22.9+1.5
−2.5 9.57+0.05−0.08 −0.94+0.18
−0.23 −10.87+0.25−0.25
PSB9 10.11+0.03−0.10 7.19+0.08
−0.10 −2.92+0.14−0.12 23.1+1.1
−1.0 10.23+0.03−0.02 −0.16+0.11
−0.01 −10.22+0.05−0.05
PSB10 10.04+0.05−0.23 7.24+0.02
−0.02 −2.79+0.22−0.06 24.6+0.2
−0.2 10.57+0.01−0.04 0.23+0.06
−0.05 −9.82+0.30−0.05
PSB11 10.49+0.03−0.06 7.03+0.23
−0.27 −3.46+0.23−0.28 19.5+2.2
−1.8 9.70+0.03−0.06 −0.82+0.03
−0.07 −11.32+0.10−0.05
an additional cold dust component with an adjustable temperaturebetween 15 and 25 K is added. The dust mass absorption coefficientκλ ∝ λ−β has a normalization of κ850 = 0.077 m2 kg−1 (Dunne et al.2000). A dust emissivity index of β = 1.5 is assumed for warmdust, and β = 2.0 for cold dust.
Statistical constraints on the various parameters of the model arederived using the Bayesian approach described in DCE08, whichensures that possible degeneracies between model parameters areincluded in the final probability density function (PDF) of each pa-rameter. The effects of individual wavebands on the derived param-eters are explored in DCE08 and Smith et al. (2012). The MAGPHYS
code used in this paper has been modified from the public versionto take into account flux density upper limits in the χ2 calculationto give additional constraints on physical parameters, as describedin Smith et al. (2012) and Rowlands et al. (2014a). For more detailsof the method, we refer the reader to DCE08.
The best-fitting SEDs are shown in Fig. C1, and the fitted valuesand errors on the main parameters of interest are provided in Table 4.In Fig. 3, we compare the total SFR derived from the SED fitting(averaged over the last 108 yr) to the SFR in the central 3 arcsecfibre derived from the dust-corrected Hα emission. There is a verygood agreement between the two measurements over the wide rangeof SFR probed; however; there is an offset with the total SFRhigher than the fibre SFR by around a factor of 2 on average. Thismay be due to: (1) the fibre only covering the inner 0.9–1.4 kpcin radius (30–100 per cent of the r-band half-light radius, and 10-30 per cent of the r-band Petrosian R90 radius); (2) the Hα-derivedSFR is not exactly equivalent to a SFR derived from SED fitting,and in particular relates to an average over a shorter time interval;(3) the extinction corrected Hα may underestimate the true SFR inthe mostly heavily extincted sites of star formation. It is thereforedifficult to draw any firm conclusions about the distribution of starformation in the galaxies from these observations. In the followingresults, we consider the total SFR, unless stated otherwise.
4 R ESULTS
In WHC10, we used the full sample of local (z < 0.07) bulge-dominated SDSS galaxies to study the black hole accretion activity
Figure 3. Comparison of the total SFR from multiwavelength SED fittingand the 3 arcsec SFR (0.9–1.4 kpc in radius), from the dust-corrected Hα
luminosity. The solid line is the one-to-one relation. The lower plot showsthe ratio of total SFR to 3 arcsec SFR as a function total SFR. In the lowerpanel, we account for the propagation of asymmetric error values via aMonte Carlo analysis. The total SFR is on average slightly higher than thefibre SFR by around a factor of 2.
as a function of starburst age (‘Timing the starburst-AGN connec-tion’). Here, we wish to address very specifically the question ofhow and why star formation declines following a starburst, whichis currently very poorly constrained observationally.
MNRAS 448, 258–279 (2015)
Dow
nloaded from https://academ
ic.oup.com/m
nras/article/448/1/258/1748852 by CN
RS - ISTO
user on 25 April 2022
266 K. Rowlands et al.
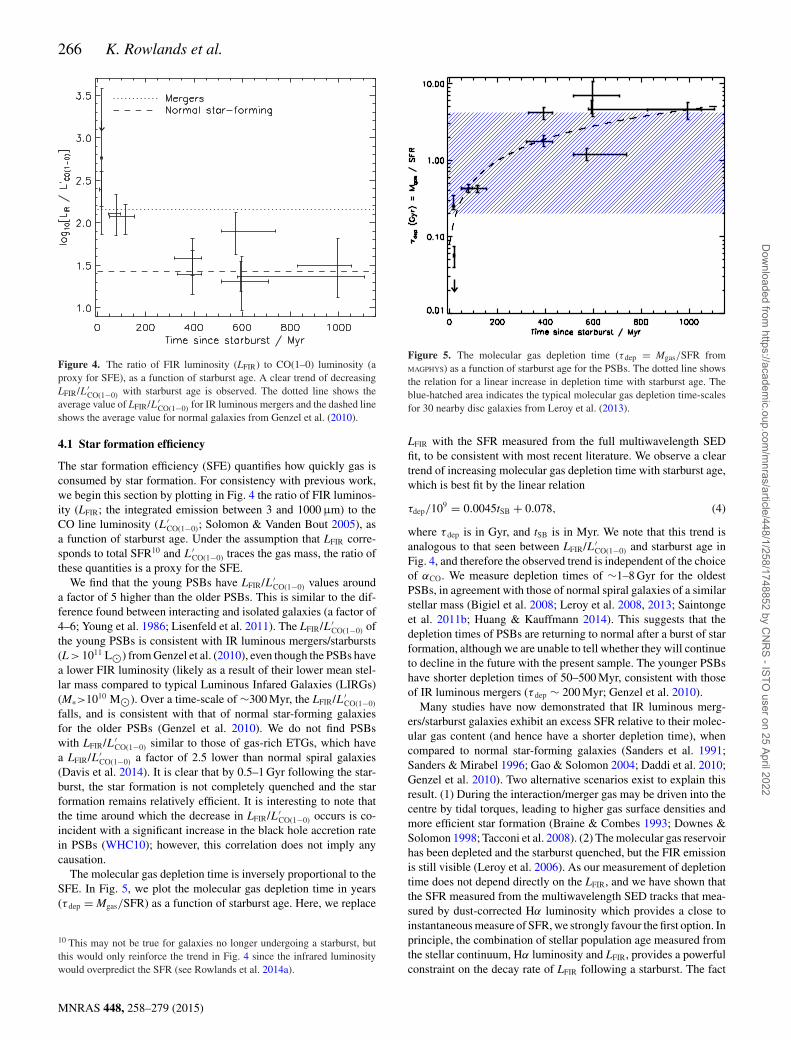
Figure 4. The ratio of FIR luminosity (LFIR) to CO(1–0) luminosity (aproxy for SFE), as a function of starburst age. A clear trend of decreasingLFIR/L′
CO(1−0) with starburst age is observed. The dotted line shows theaverage value of LFIR/L′
CO(1−0) for IR luminous mergers and the dashed lineshows the average value for normal galaxies from Genzel et al. (2010).
4.1 Star formation efficiency
The star formation efficiency (SFE) quantifies how quickly gas isconsumed by star formation. For consistency with previous work,we begin this section by plotting in Fig. 4 the ratio of FIR luminos-ity (LFIR; the integrated emission between 3 and 1000 μm) to theCO line luminosity (L′
CO(1−0); Solomon & Vanden Bout 2005), asa function of starburst age. Under the assumption that LFIR corre-sponds to total SFR10 and L′
CO(1−0) traces the gas mass, the ratio ofthese quantities is a proxy for the SFE.
We find that the young PSBs have LFIR/L′CO(1−0) values around
a factor of 5 higher than the older PSBs. This is similar to the dif-ference found between interacting and isolated galaxies (a factor of4–6; Young et al. 1986; Lisenfeld et al. 2011). The LFIR/L′
CO(1−0) ofthe young PSBs is consistent with IR luminous mergers/starbursts(L > 1011 L�) from Genzel et al. (2010), even though the PSBs havea lower FIR luminosity (likely as a result of their lower mean stel-lar mass compared to typical Luminous Infared Galaxies (LIRGs)(M∗>1010 M�). Over a time-scale of ∼300 Myr, the LFIR/L′
CO(1−0)falls, and is consistent with that of normal star-forming galaxiesfor the older PSBs (Genzel et al. 2010). We do not find PSBswith LFIR/L′
CO(1−0) similar to those of gas-rich ETGs, which havea LFIR/L′
CO(1−0) a factor of 2.5 lower than normal spiral galaxies(Davis et al. 2014). It is clear that by 0.5–1 Gyr following the star-burst, the star formation is not completely quenched and the starformation remains relatively efficient. It is interesting to note thatthe time around which the decrease in LFIR/L′
CO(1−0) occurs is co-incident with a significant increase in the black hole accretion ratein PSBs (WHC10); however, this correlation does not imply anycausation.
The molecular gas depletion time is inversely proportional to theSFE. In Fig. 5, we plot the molecular gas depletion time in years(τ dep = Mgas/SFR) as a function of starburst age. Here, we replace
10 This may not be true for galaxies no longer undergoing a starburst, butthis would only reinforce the trend in Fig. 4 since the infrared luminositywould overpredict the SFR (see Rowlands et al. 2014a).
Figure 5. The molecular gas depletion time (τ dep = Mgas/SFR fromMAGPHYS) as a function of starburst age for the PSBs. The dotted line showsthe relation for a linear increase in depletion time with starburst age. Theblue-hatched area indicates the typical molecular gas depletion time-scalesfor 30 nearby disc galaxies from Leroy et al. (2013).
LFIR with the SFR measured from the full multiwavelength SEDfit, to be consistent with most recent literature. We observe a cleartrend of increasing molecular gas depletion time with starburst age,which is best fit by the linear relation
τdep/109 = 0.0045tSB + 0.078, (4)
where τ dep is in Gyr, and tSB is in Myr. We note that this trend isanalogous to that seen between LFIR/L′
CO(1−0) and starburst age inFig. 4, and therefore the observed trend is independent of the choiceof αCO. We measure depletion times of ∼1–8 Gyr for the oldestPSBs, in agreement with those of normal spiral galaxies of a similarstellar mass (Bigiel et al. 2008; Leroy et al. 2008, 2013; Saintongeet al. 2011b; Huang & Kauffmann 2014). This suggests that thedepletion times of PSBs are returning to normal after a burst of starformation, although we are unable to tell whether they will continueto decline in the future with the present sample. The younger PSBshave shorter depletion times of 50–500 Myr, consistent with thoseof IR luminous mergers (τ dep ∼ 200 Myr; Genzel et al. 2010).
Many studies have now demonstrated that IR luminous merg-ers/starburst galaxies exhibit an excess SFR relative to their molec-ular gas content (and hence have a shorter depletion time), whencompared to normal star-forming galaxies (Sanders et al. 1991;Sanders & Mirabel 1996; Gao & Solomon 2004; Daddi et al. 2010;Genzel et al. 2010). Two alternative scenarios exist to explain thisresult. (1) During the interaction/merger gas may be driven into thecentre by tidal torques, leading to higher gas surface densities andmore efficient star formation (Braine & Combes 1993; Downes &Solomon 1998; Tacconi et al. 2008). (2) The molecular gas reservoirhas been depleted and the starburst quenched, but the FIR emissionis still visible (Leroy et al. 2006). As our measurement of depletiontime does not depend directly on the LFIR, and we have shown thatthe SFR measured from the multiwavelength SED tracks that mea-sured by dust-corrected Hα luminosity which provides a close toinstantaneous measure of SFR, we strongly favour the first option. Inprinciple, the combination of stellar population age measured fromthe stellar continuum, Hα luminosity and LFIR, provides a powerfulconstraint on the decay rate of LFIR following a starburst. The fact
MNRAS 448, 258–279 (2015)
Dow
nloaded from https://academ
ic.oup.com/m
nras/article/448/1/258/1748852 by CN
RS - ISTO
user on 25 April 2022

Evolution of the cold ISM after a starburst 267
Figure 6. The SFR surface density (�SFR) as a function of moleculargas mass surface density (�H2 ) for the PSBs (crosses), with points colourcoded by starburst age. Grey circles show normal star-forming galax-ies, and grey squares show circumnuclear starbursts from K98 (correcteddown by a factor of 1.6 to a Chabrier IMF). ETGs with molecular gas(and H I gas, although this is negligible) are shown as unfilled diamonds(Davis et al. 2014). All values of �H2 assume a Galactic CO conversionfactor, and literature values have been corrected to a common value ofαCO = 4.35 M� (K km s−1 pc2)−1. The grey line shows the K–S relation(with the scaling factor corrected downwards by a factor of 1.6 to a ChabrierIMF), with the 1σ scatter as the grey filled area. The red lines indicate therelation for star-forming galaxies (solid) and mergers (dotted) from Genzelet al. (2010). The black horizontal and vertical bar indicates the medianpossible systematic in the SFR and gas surface densities when using theu-band Petrosian R50 instead of the R90 radius.
that we find no significant offset in time-scales between the decayin SFE implied by Figs 4 and 5 rules out the possibility that theFIR emission remains visible for an extended period following thestarburst. However, larger numbers of galaxies would be required todetermine precisely the impact of using LFIR to infer star formationefficiencies and depletion times.
4.2 Kennicutt–Schmidt relation
Gas mass surface density (�H2 ) and SFR surface density (�SFR) ingalaxies are linked by the Kennicutt–Schmidt (K–S) relation (K98).In Fig. 6, we plot the molecular �H2 and �SFR for the PSBs andcompare them to normal star-forming galaxies and circumnuclearstarbursts from K98, and ETGs with molecular gas from Daviset al. (2014). For the PSBs, we do not have resolved CO or SFRobservations so we assume that the CO emitting region is the sameas where young stars are located, and use the u-band PetrosianR90 radius as the area over which we calculate �H2 and �SFR. Thisapproximation leads to a substantial uncertainty in both parameters:a factor of 2 decrease in the radius for star formation and gasemission (i.e going from Petrosian R90 to R50 radius) shifts the PSBs∼1 dex to the upper right of the plot. All �H2 estimates assume aGalactic CO-to-H2 conversion factor, although Genzel et al. (2010)suggest a lower value of αCO may be appropriate for IR luminousmergers. Adopting a lower value of αCO would decrease the gassurface density of the PSBs.
Under the assumptions of size and αCO made above, we find thatthe PSBs sit in an intermediate region between normal star-formingspirals and circumnuclear starbursts. There is a clear trend of star-burst age relative to position on the K–S relation. The youngest PSBswith an age <100 Myr have the highest SFR and gas mass surface
densities, and lie in a region coincident with ETGs with moleculargas (Davis et al. 2014), and have slightly lower gas mass and SFRsurface densities than local circumnuclear starbursts (K98). Notethat only 22 per cent of all ETGs in the local Universe (<42 Mpc)harbour a detectable mass of molecular gas, so PSBs have a muchhigher gas mass surface density than the vast majority of ETGs(those not plotted here).
The higher gas surface densities of the young PSBs (which arethe most morphologically disturbed) relative to normal galaxies isconsistent with Braine & Combes (1993) and Downes & Solomon(1998), who found higher gas surface densities in interacting sys-tems. The increased gas surface density could be a result of the fun-nelling of gas into the central regions during interactions/mergers(e.g. Mihos & Hernquist 1994, 1996; Barnes & Hernquist 1996).Observations of dense gas tracers in young PSBs would help con-firm this hypothesis (Gao & Solomon 2004). Beyond the ∼600 Myrtimespan of our observations, it is unclear whether the PSBs willcontinue to evolve back to the region occupied by the spirals, orexhaust their gas supplies to become gas-poor ETGs. More obser-vations of the gas content of PSBs older than 600 Myr are neededin order to examine the late-time evolution of this population.
Note that we do not consider the total (neutral and atomic) gassurface density in this work, as only three PSBs have detections ofH I gas [PSB4, PSB5 and PSB11 from Davoust & Contini (2004)and the ALFALFA survey (Haynes et al. 2011)], an additionalthree PSBs have upper limits from the Northern HIPASS Cata-logue (Wong et al. 2006, 2009) which do not put strong constraintson the H I gas mass. In normal galaxies, there is a large variation inH2/H I mass (Saintonge et al. 2011b), therefore we cannot reliablypredict H I from H2 in the PSBs. The detection of substantial atomicgas reservoirs in some PSBs indicates that either the H I reservoirhas not been depleted (Zwaan et al. 2013), or re-accretion of gas canoccur after the star formation has been quenched (Saintonge et al.2011a; Stark et al. 2013; Yates & Kauffmann 2014), which may beparticularly efficient in low-mass systems (Saintonge et al. 2011b).Alternatively, H I gas exists in the outer disc and is not affected bythe starburst and subsequent quenching event in the central region(Saintonge et al. 2011b; Pracy et al. 2014).
4.3 Cold ISM content
In this section, we discuss the physical properties of the cold ISMof PSBs. From the MAGPHYS SED fitting, we derive a range of dustmasses from 0.3 − 4.0 × 10⁷ M�, with a median dust mass of1.7 × 107 M�. This is similar to that of low-redshift spiral galaxieswith a similar stellar mass to the PSBs in the Herschel-ATLAS(Rowlands et al. 2012). The median molecular gas mass derivedfrom the 12CO(1–0) integrated line fluxes is 2.7 × 10⁹ M� witha range from (< 0.3–4.3) × 109 M�, assuming a Galactic CO toH2 conversion factor. The molecular gas masses of the PSBs aresimilar to those of the most gas-rich ETGs (Young et al. 2011) andspiral galaxies (Lisenfeld et al. 2011) in the local Universe (see alsoFrench et al. 2015).
4.3.1 Gas-to-stellar mass
In Fig. 7(a), we show the gas-to-stellar mass ratio (Mgas/M∗) ofthe PSBs as a function of starburst age, which ranges from 0.02to 0.92 with a median of 0.18. The gas-to-stellar mass ratios ofthe majority of the PSBs are consistent with the range found for
MNRAS 448, 258–279 (2015)
Dow
nloaded from https://academ
ic.oup.com/m
nras/article/448/1/258/1748852 by CN
RS - ISTO
user on 25 April 2022

268 K. Rowlands et al.
Figure 7. (a) Molecular gas-to-stellar mass ratio as a function of starburstage. We observe a wide range of gas-to-stellar mass ratios in both young andold PSBs. The blue-hatched region is the range of observed gas-to-stellarmass ratios for normal nearby galaxies (∼0.1 for CO detected galaxiesof a similar stellar mass to the PSBs; M∗ ∼ 1010 M�; Saintonge et al.2011a; Boselli et al. 2014). (b) Dust-to-stellar mass ratio versus starburstage. The blue-hatched region is the standard deviation either side of themean Md/M∗ for z < 0.1 spiral galaxies detected in the Herschel-ATLAS(Rowlands et al. 2012). The orange-hatched region is the standard deviationeither side of the mean Md/M∗ for z < 0.06 dusty ETGs from Agius et al.(2013), using updated FIR photometry. The red-hatched region is the rangeof Md/M∗ for non-dusty ETGs (representative of red-sequence galaxies) fora range of dust temperatures (Rowlands et al. 2012). (c) Gas-to-dust massratio as a function of starburst age. Values in the right of each plot indicate thenon-parametric Spearman rank coefficient (ρ) and the two-sided significanceof the deviation of the correlation from zero, or the null hypothesis (σ , alow value indicates a significant correlation). On each plot, we show closed-box chemical evolution models with dust produced by LIMS only with nodestruction (thin black line), LIMS+SNe with no destruction (thick blackline) and dust from LIMS+SNe (green dashed line; assuming all metalsare converted into dust) with strong destruction from 0–0.1 Gyr and weakdestruction from 0.1–1.0 Gyr. Note that the chemical evolution models arenot fits to the data.
normal nearby galaxies (∼0.1 for CO detected galaxies;11 Boselliet al. 2014) of a similar stellar mass to the PSBs (M∗ ∼ 1010 M�;see also Saintonge et al. 2011a). The gas-to-stellar mass ratios ofthe PSBs are on average a factor of 20 higher than those of red-sequence galaxies (NUV − r = 6) which have a typical gas-to-stellarmass ratio of 0.012 (Saintonge et al. 2011a). However, local red-sequence samples will be dominated by objects with higher stellarmasses, which have lower gas-to-stellar mass ratios. For a detailedcomparison, a mass-matched sample would be essential. The gas-to-stellar mass ratios of the PSBs are also greater than those ofETGs in the Herschel Reference Survey (Mgas/M∗∼5.3 × 10−3;Boselli et al. 2014) and in the ATLAS3D sample with detectedmolecular gas (Cappellari et al. 2013). The ATLAS3D ETGs havegas-to-stellar mass ratios12 ranging from 8.9 × 10⁻⁵ to 5.6 × 10⁻³,with an average of 7.1 × 10⁻⁴.
Fig. 7(a) also shows that there is no significant correlation ofthe gas-to-stellar mass ratio with time since the starburst ended(Spearman correlation coefficient ρ = −0.26, with the two-sidedsignificance of the deviation of the correlation from zero, or thenull hypothesis σ = 0.48), although there is a large scatter in oursample. This suggests that the majority of gas may have already beenconsumed in the starburst and we are just observing the residual gasreservoir. Alternatively, the global molecular gas reservoir may notbe affected by a nuclear starburst event (Pracy et al. 2014) and onlygas in the central region (∼2 kpc for the galaxies here) may beconsumed by star formation or affected by feedback processes fromstar formation or an AGN. High spatial resolution mapping of themolecular gas is needed to determine this.
Over time, one may expect a slow depletion of the gas reservoirdue to star formation, with typical time-scales of 0.3 Gyr relatedto disc dynamical time-scales (Lehnert & Heckman 1996, K98).A much larger sample may be required to observe this expecteddecline, given the typical errors on gas mass measurements at theseredshifts. A rapid decline in gas-to-stellar mass ratio at early times,which would indicate expulsion of gas by SNe and/or fast stellarwinds, is not observed. A later rapid decline, which would be thesmoking gun for the heating or expulsion of gas from an accretingsupermassive black hole, is also not observed. Our results disagreewith those of Schawinski et al. (2009), who suggested that in ETGsthe molecular gas mass drops 200 Myr after the starburst, interpret-ing this as evidence that low-luminosity AGN are responsible forthe destruction of the gas reservoir. We note that their sample isnot directly comparable to ours as their ETGs are classified spec-troscopically as blue-sequence (normal star-forming) galaxies andnot PSBs, and therefore there is no well-defined age for the stellarpopulation as is the case for PSB galaxies.
The presence of substantial molecular gas reservoirs in the 600-Myr old PSBs suggests that these galaxies are still capable of form-ing stars and are not entering the red sequence. The oldest PSB(PSB11) has a gas-to-stellar mass ratio of 0.02, still significantlyhigher than ETGs found in the literature. If low-redshift PSBs ulti-mately lead to red-sequence galaxies, these results imply a transitiontime-scale of more than 1 Gyr. We can conclude that the PSBs arenot transitioning to the red sequence any more rapidly than the
11 Note that including CO non-detections decreases the average gas-to-stellar mass ratio to ∼0.04.12 Where the stellar mass is the Jeans anisotropic mass, i.e the total stellarmass from dynamical modelling, and should be comparable to our SED-derived M∗ within a factor of 2.
MNRAS 448, 258–279 (2015)
Dow
nloaded from https://academ
ic.oup.com/m
nras/article/448/1/258/1748852 by CN
RS - ISTO
user on 25 April 2022

Evolution of the cold ISM after a starburst 269
Milky Way (MW) or any other local nearby spiral (Leroy et al.2013).
4.3.2 Dust-to-stellar mass ratio
The median dust-to-stellar mass ratio (Md/M∗) of the PSBs is1.3 × 10−3 with a range of (0.3–10.0) × 10−3, similar to dustygalaxies in the local Universe (Smith et al. 2012). In Fig. 7(b), wecompare the dust-to-stellar mass ratios of the PSBs to those of othergalaxies, as a function of starburst age. We observe a significantdecrease in the dust-to-stellar mass ratio of the PSBs with starburstage (Spearman coefficient ρ = −0.71, σ = 0.01). The dust-to-stellarmass ratios of the young PSBs are slightly higher than those of spi-ral galaxies in the H-ATLAS survey which have a mean Md/M∗ of2.1 × 10−3, and have values similar to those of ultra-luminous in-frared galaxies (ULIRGs) and high-redshift submillimetre galaxies(SMGs; da Cunha et al. 2010; Rowlands et al. 2014a). Intermedi-ate and older PSBs have Md/M∗ values similar to those of dustyETGs (Rowlands et al. 2012; Agius et al. 2013), and are higher thanthose of non-detected ETGs in H-ATLAS. This shows that the olderPSBs still harbour a cold ISM. The decrease in dust content withstarburst age suggests that the dust in PSBs is being destroyed inthe ISM and is no longer balanced by stellar dust production. Thesimilarity of the Md/M∗ of older PSBs and dusty ETGs suggests apossible connection, which should be investigated through furtherspectroscopic and morphological analyses.
4.3.3 Gas-to-dust ratio
In Fig. 7(c), we show the gas-to-dust ratios (G/D) of the PSBs,as function of starburst age. The PSBs have a large range of G/D,with values of 40–380, with a median of 140. This is similar tothe molecular G/D of high metallicity (12 +log(O/H) >8.5) nearbygalaxies in the KINGFISH sample, which have a mean of G/D of130 (assuming a MW CO to H2 conversion factor; Remy-Ruyeret al. 2014). In Fig. 7(c), we observe no significant correlation ofG/D with starburst age (Spearman coefficient ρ = 0.35, σ = 0.33).The weakness of the correlation is largely caused by one source(PSB11). Excluding this source from the correlation analysis resultsin a Spearman coefficient of 0.72, indicating a significant (σ = 0.03)positive correlation between G/D and starburst age. Typically theyoung (<100 Myr) PSBs have low G/D of <100 which is lower thannormal spirals, and is more similar to that of high-redshift SMGs(Kovacs et al. 2006; Swinbank et al. 2014). The majority of PSBs(>100 Myr) have a molecular G/D consistent with that of normalstar-forming galaxies in the nearby Universe.
4.3.4 Chemical evolution models
We now compare our observations to the one-zone chemical evo-lution models of Morgan & Edmunds (2003) and Rowlands et al.(2014b) to investigate the evolution of the dust and gas in PSBs. Byrelaxing the instantaneous recycling approximation to account forthe lifetimes of stars of different masses, the model tracks the build-up of heavy elements over time produced by low–intermediate massstars (LIMS) and SNe, where some fraction of the heavy elementswill condense into dust. Given an input SFH, gas is converted intostars over time, assuming a Chabrier (2003) initial mass function(IMF). To model the PSBs, we consider a closed-box model, assum-ing no inflow or outflow of gas or metals. This is justified during the
recent evolution of the PSBs by the observed lack of change in gas-to-stellar mass ratio over time, implying that recent strong outflowsare unlikely. The initial gas mass is set at 1.0 × 10¹⁰ M�, and atthe end of the SFH ∼85 per cent of the total galaxy mass ends up instars and ∼15 per cent is in gas, in agreement with our observations.By design, the final stellar masses in the chemical evolution mod-els are in close agreement with the observed stellar masses (meanM∗= 1 × 10¹⁰ M�) derived from the SED fitting. We adopt a con-stant SFH of 2 M� yr−1 from 0–4.9 Gyr (assuming arbitrarily thatour PSBs formed at z ∼ 1), followed by a starburst of 10 M� yr−1 of100 Myr duration. The starburst produces ∼10 per cent of the stellarmass in the galaxy, in agreement with observations (Wild et al. 2007,2009). At t = 5.0 Gyr, the SFH is parametrized by an exponentiallydeclining SFR of the form exp−(t/τ ), with τ = 300 Myr, whichmatches the measured SFRs of the PSBs as a function of starburstage (WHC10).
In Fig. 7(a), the overplotted lines show that the choice of theseinitial conditions and SFH allow us to match the evolution of thegas-to-stellar mass with starburst age. However, we find that dustproduced only by LIMS is not sufficient to match the Md/M∗ andG/D for the young PSBs (thin black line in Figs 7b and c). The largedust masses in these galaxies indicates that rapid dust production(most likely from SNe) is necessary (thick black line). The negativerelation between Md/M∗ and starburst age indicates that dust is lostfrom the system over time, either via outflows or dust destructionby SN shocks or AGN feedback. The closed-box model with nodust destruction results in an almost flat evolution of Md/M∗ withstarburst age, regardless of the dust source. We tested that rea-sonable variations in the assumed SFH of the PSBs are unable toreproduce the observed trends. In order to reproduce the decrease inMd/M∗ with time, we require a model in which moderately strongdust destruction (mISM = 500 M� of ISM cleared of dust per SNexplosion) occurs for a short time after the starburst (here assumedto be from 0–100 Myr following the starburst), after which the dustdestruction is weaker (mISM = 200 M�). We note that when dustdestruction is included, our models require very efficient dust pro-duction, such that all of the metals produced in SNe are incorporatedinto dust. This may not be physical, therefore grain growth in theISM may also play an important role in the dust budget (Rowlandset al. 2014b). We note that dust destruction much stronger thanthat assumed here, e.g. mISM = 1000 M�, as is often assumed inchemical evolution models (Dwek, Galliano & Jones 2007), resultsin a rapid increase in G/D and a final ratio that is inconsistent withthat observed in PSBs older than 100 Myr. One way out of this is toinvoke subsequent rapid grain growth in the ISM, but such complexmodels are not justified by the data presented here.
4.4 Dust temperature
Dust is primarily heated by UV–optical photons from stars, althoughAGN heating can also contribute in the central regions of massivegalaxies (Sauvage & Thuan 1994). Dust then re-radiates the ab-sorbed light in the FIR–submillimetre, with young stars thought tobe responsible for heating warm (>60 K) dust (e.g. Sauvage, Vi-groux & Thuan 1990; Xu 1990; Popescu et al. 2000; Misiriotis et al.2001; Bendo et al. 2010). Colder dust is thought to be heated bythe diffuse interstellar radiation field (ISRF; Rowan-Robinson &Crawford 1989; Xu & Helou 1996; Stevens, Amure & Gear 2005;Boquien et al. 2011a; Komugi et al. 2011), which originates fromphotons from old stars (Bendo et al. 2010; Boquien et al. 2011a;Groves et al. 2012) and also young stars where photons leak out ofthe birth clouds (Kirkpatrick et al. 2014).
MNRAS 448, 258–279 (2015)
Dow
nloaded from https://academ
ic.oup.com/m
nras/article/448/1/258/1748852 by CN
RS - ISTO
user on 25 April 2022
270 K. Rowlands et al.
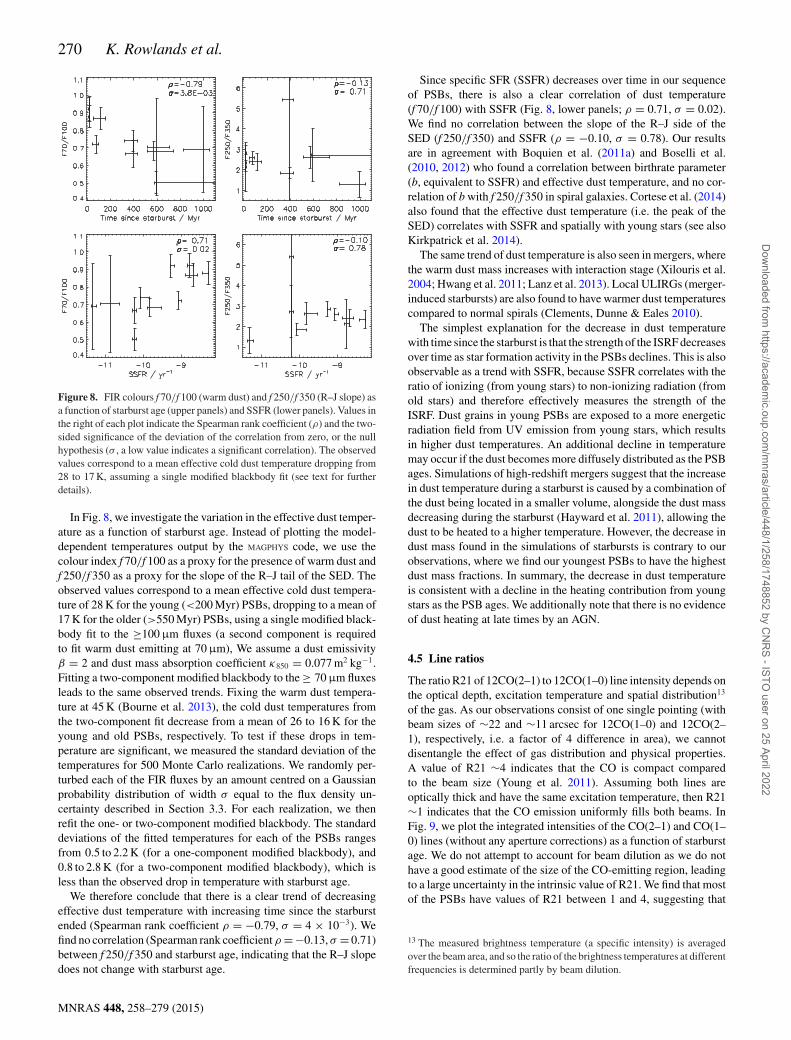
Figure 8. FIR colours f 70/f 100 (warm dust) and f 250/f 350 (R–J slope) asa function of starburst age (upper panels) and SSFR (lower panels). Values inthe right of each plot indicate the Spearman rank coefficient (ρ) and the two-sided significance of the deviation of the correlation from zero, or the nullhypothesis (σ , a low value indicates a significant correlation). The observedvalues correspond to a mean effective cold dust temperature dropping from28 to 17 K, assuming a single modified blackbody fit (see text for furtherdetails).
In Fig. 8, we investigate the variation in the effective dust temper-ature as a function of starburst age. Instead of plotting the model-dependent temperatures output by the MAGPHYS code, we use thecolour index f 70/f 100 as a proxy for the presence of warm dust andf 250/f 350 as a proxy for the slope of the R–J tail of the SED. Theobserved values correspond to a mean effective cold dust tempera-ture of 28 K for the young (<200 Myr) PSBs, dropping to a mean of17 K for the older (>550 Myr) PSBs, using a single modified black-body fit to the ≥100 μm fluxes (a second component is requiredto fit warm dust emitting at 70 μm), We assume a dust emissivityβ = 2 and dust mass absorption coefficient κ850 = 0.077 m2 kg−1.Fitting a two-component modified blackbody to the ≥ 70 μm fluxesleads to the same observed trends. Fixing the warm dust tempera-ture at 45 K (Bourne et al. 2013), the cold dust temperatures fromthe two-component fit decrease from a mean of 26 to 16 K for theyoung and old PSBs, respectively. To test if these drops in tem-perature are significant, we measured the standard deviation of thetemperatures for 500 Monte Carlo realizations. We randomly per-turbed each of the FIR fluxes by an amount centred on a Gaussianprobability distribution of width σ equal to the flux density un-certainty described in Section 3.3. For each realization, we thenrefit the one- or two-component modified blackbody. The standarddeviations of the fitted temperatures for each of the PSBs rangesfrom 0.5 to 2.2 K (for a one-component modified blackbody), and0.8 to 2.8 K (for a two-component modified blackbody), which isless than the observed drop in temperature with starburst age.
We therefore conclude that there is a clear trend of decreasingeffective dust temperature with increasing time since the starburstended (Spearman rank coefficient ρ = −0.79, σ = 4 × 10⁻³). Wefind no correlation (Spearman rank coefficient ρ =−0.13, σ = 0.71)between f 250/f 350 and starburst age, indicating that the R–J slopedoes not change with starburst age.
Since specific SFR (SSFR) decreases over time in our sequenceof PSBs, there is also a clear correlation of dust temperature(f 70/f 100) with SSFR (Fig. 8, lower panels; ρ = 0.71, σ = 0.02).We find no correlation between the slope of the R–J side of theSED (f 250/f 350) and SSFR (ρ = −0.10, σ = 0.78). Our resultsare in agreement with Boquien et al. (2011a) and Boselli et al.(2010, 2012) who found a correlation between birthrate parameter(b, equivalent to SSFR) and effective dust temperature, and no cor-relation of b with f 250/f 350 in spiral galaxies. Cortese et al. (2014)also found that the effective dust temperature (i.e. the peak of theSED) correlates with SSFR and spatially with young stars (see alsoKirkpatrick et al. 2014).
The same trend of dust temperature is also seen in mergers, wherethe warm dust mass increases with interaction stage (Xilouris et al.2004; Hwang et al. 2011; Lanz et al. 2013). Local ULIRGs (merger-induced starbursts) are also found to have warmer dust temperaturescompared to normal spirals (Clements, Dunne & Eales 2010).
The simplest explanation for the decrease in dust temperaturewith time since the starburst is that the strength of the ISRF decreasesover time as star formation activity in the PSBs declines. This is alsoobservable as a trend with SSFR, because SSFR correlates with theratio of ionizing (from young stars) to non-ionizing radiation (fromold stars) and therefore effectively measures the strength of theISRF. Dust grains in young PSBs are exposed to a more energeticradiation field from UV emission from young stars, which resultsin higher dust temperatures. An additional decline in temperaturemay occur if the dust becomes more diffusely distributed as the PSBages. Simulations of high-redshift mergers suggest that the increasein dust temperature during a starburst is caused by a combination ofthe dust being located in a smaller volume, alongside the dust massdecreasing during the starburst (Hayward et al. 2011), allowing thedust to be heated to a higher temperature. However, the decrease indust mass found in the simulations of starbursts is contrary to ourobservations, where we find our youngest PSBs to have the highestdust mass fractions. In summary, the decrease in dust temperatureis consistent with a decline in the heating contribution from youngstars as the PSB ages. We additionally note that there is no evidenceof dust heating at late times by an AGN.
4.5 Line ratios
The ratio R21 of 12CO(2–1) to 12CO(1–0) line intensity depends onthe optical depth, excitation temperature and spatial distribution13
of the gas. As our observations consist of one single pointing (withbeam sizes of ∼22 and ∼11 arcsec for 12CO(1–0) and 12CO(2–1), respectively, i.e. a factor of 4 difference in area), we cannotdisentangle the effect of gas distribution and physical properties.A value of R21 ∼4 indicates that the CO is compact comparedto the beam size (Young et al. 2011). Assuming both lines areoptically thick and have the same excitation temperature, then R21∼1 indicates that the CO emission uniformly fills both beams. InFig. 9, we plot the integrated intensities of the CO(2–1) and CO(1–0) lines (without any aperture corrections) as a function of starburstage. We do not attempt to account for beam dilution as we do nothave a good estimate of the size of the CO-emitting region, leadingto a large uncertainty in the intrinsic value of R21. We find that mostof the PSBs have values of R21 between 1 and 4, suggesting that
13 The measured brightness temperature (a specific intensity) is averagedover the beam area, and so the ratio of the brightness temperatures at differentfrequencies is determined partly by beam dilution.
MNRAS 448, 258–279 (2015)
Dow
nloaded from https://academ
ic.oup.com/m
nras/article/448/1/258/1748852 by CN
RS - ISTO
user on 25 April 2022

Evolution of the cold ISM after a starburst 271
Figure 9. Ratio of the observed 12CO(2–1) to 12CO(1–0) line intensities(no aperture correction applied) as a function of starburst age. The widerange of line ratios indicates that the CO emission does not fill each beamuniformly. There is no trend of line ratio with starburst age.
Figure 10. Comparison of the total SFR and the stellar mass of the PSBs(with points colour coded by starburst age) to the median location of bluestar-forming galaxies in the local Universe (0.015 < z < 0.1) from Elbazet al. (2007, solid black line). The dashed lines indicate the 68 per centdispersion in the median of the local relation between SFR and M∗.
the CO does not fill both CO beams uniformly. Furthermore, we donot see a correlation of R21 with starburst age. This indicates thateither the distribution and excitation of molecular gas does not varywith starburst age, or that the excitation of the gas is decreasingas the CO distribution becomes more compact. It is likely is thatPSBs have a wide range of global excitation conditions, as well asvariations within each galaxy. Further investigation of the excitationtemperatures of PSBs will require spatially resolved measurementsof these sources.
4.6 Where do PSBs lie on the SFR–M∗ relation?
Clues to the stellar mass build-up of galaxies can be found viathe relatively tight correlation between stellar mass and SFR (e.g.Brinchmann et al. 2004; Daddi et al. 2007; Elbaz et al. 2007; Noeskeet al. 2007; Rodighiero et al. 2010; Wuyts et al. 2011; Whitaker et al.2012b). In Fig. 10, we compare the location of the PSBs to those of
blue star-forming galaxies in the local Universe (0.015 < z < 0.1)from Elbaz et al. (2007). The SFRs of the galaxies in Elbaz et al.(2007) were taken from Brinchmann et al. (2004) and utilize thedust-corrected Hα luminosity (corrected to total SFR), and the stel-lar masses are from Kauffmann et al. (2003a) and use the Bruzual& Charlot (2003) stellar population models. We therefore plot theequivalent observations for the PSBs. The young PSBs lie signifi-cantly above the local SFR–M∗ relation, with the intermediate-agePSBs coincident with normal star-forming galaxies. Two PSBs liesignificantly below the location of blue star-forming galaxies andare consistent with those of 0.02 < z < 0.05 green valley galaxies(Schawinski et al. 2014).
In the last few years, significant attention has been given to galax-ies which lie below the SFR–M∗ relation (e.g. Wuyts et al. 2011;Whitaker et al. 2012b; Eales et al., in preparation), which are as-sumed to be ‘quenching’ (i.e. switching off their star formation).Given the extra information provided by our detailed SFHs, wehave a different picture of where quenching galaxies lie relativeto the SFR–M∗ relation: galaxies which are ‘quenching’ can lieon, above and below the location of star-forming galaxies. Further-more, we have shown in this paper that the older PSBs are not fully‘quenched’, with considerable cold gas supplies remaining. Thelimited information provided by instantaneous SFR and M∗ doesnot give a full picture of the physical mechanisms of quenching.Caution should therefore be exercised when classifying galaxies onthe SFR–M∗ relation as star-forming galaxies which have remained,and will remain, on the relation for an extended period of time.
4.7 Environment
The large-scale environment of galaxies affects their gas supply. Inclusters, the supply of gas can be terminated via interaction of thegalaxy ISM with the intracluster medium, which heats or strips gasfrom the galaxy. In less dense regions such as the field, gas maybe readily accreted from the intergalactic medium, although galaxyinteractions in small groups can alter gas supplies by triggering astarburst.
We examine the environment of the PSBs in our sample by match-ing to the SDSS DR7 galaxy group catalogue of Yang et al. (2007).The group catalogue utilizes a halo-based group finder to identifygalaxies which reside in the same dark matter halo. We use thegroup catalogue based on SDSS model magnitudes and redshiftsfrom both SDSS and the 2dF Galaxy Redshift Survey. Halo massesare assigned by rank ordering the groups by stellar mass, althoughusing masses assigned by rank ordering by luminosity would notchange our results. We find 10/11 PSBs are identified in the groupcatalogue, six of which are isolated galaxies, and four PSBs are ingroups with 12–59 members. The halo masses of the groups rangefrom 1011.9 to 1014.6 M�. Our PSBs therefore reside in a variety ofgalaxy environments, in agreement with previous studies (Dressler& Gunn 1983; Zabludoff et al. 1996; Blake et al. 2004; Quinteroet al. 2004; Balogh et al. 2005; Hogg et al. 2006; Poggianti 2009;Yan et al. 2009).
5 D I S C U S S I O N A N D C O N C L U S I O N S
It is often stated in the literature that PSBs could be a channel forthe growth of the red sequence, through migration from the bluecloud to the red sequence over a time-scale of 100 Myr to 1 Gyr(Kaviraj et al. 2007; Wild et al. 2009). Transition through the PSBphase potentially represents the fastest ‘quenching’ mode availableto galaxies (Faber et al. 2007; Martin et al. 2007; Barro et al. 2013,2014; Yesuf et al. 2014), requiring a dramatic starburst event which
MNRAS 448, 258–279 (2015)
Dow
nloaded from https://academ
ic.oup.com/m
nras/article/448/1/258/1748852 by CN
RS - ISTO
user on 25 April 2022
272 K. Rowlands et al.
can rapidly exhaust gas supplies. Such an event may be triggeredby an external interaction or merger, certainly at lower redshiftswhere gas mass fractions are low. Slower quenching processes mayalso occur through secular processes (Cortese & Hughes 2009;Fang et al. 2012, 2013; Salim et al. 2012; Schawinski et al. 2014;Eales et al., in preparation), that transfer galaxies through the greenvalley on longer time-scales. Revealing the existence, and under-standing the relative importance, of these two channels for buildingthe red sequence is one of the most important challenges in galaxyevolution.
We have examined the global cold gas, dust and star formationproperties of a sample of 11 PSB galaxies which have undergone acentral starburst in the last 0–1 Gyr. We derived the physical proper-ties of the PSBs using a multiwavelength data set with optical fibrespectroscopy of the central 3 arcsec, total broad-band photometryfrom the UV–FIR, and CO measurements which trace the globalmolecular gas reservoir. As our sample represents some of the mostextreme starbursts in massive galaxies in the SDSS volume, wewould expect them to experience the fastest quenching of star for-mation. However, the existence of substantial cold gas reservoirsin all the PSBs studied here suggest that the transition time for lo-cal galaxies to become truly ‘red and dead’ with no possibility forsubsequent star formation is 1 Gyr, i.e. not particularly fast. Thesignificant cold gas supplies in the recently ‘quenched’ galaxies,makes it unclear as to whether the galaxies will continue evolv-ing on to the red sequence, or remain in the ‘green valley’ for anextended period of time (see also French et al. 2015).
AGN feedback is often proposed as a mechanism for fully haltingstar formation following a starburst (either through gas outflows orheating; e.g. Di Matteo et al. 2005; Croton et al. 2006; Kavirajet al. 2007; Schawinski et al. 2007, 2009). The lack of change ingas-to-stellar mass ratio with increasing starburst age shows thatthe bulk of the cold ISM remaining after a starburst is not expelledby stellar winds or AGN feedback. Similarly, the steady decreasein dust temperature indicates that the global ISM is not heated byAGN feedback at later times. For the sample of objects studied inthis paper, WHC10 found that the peak in black hole accretion rateoccurred ∼250 Myr following the starburst and therefore could notbe contributing to the initial rapid decline in star formation observed∼107 yr following the starburst (see also Shin, Strauss & Tojeiro2011, for radio-loud AGN). In this paper, we show that there is nosignificant alteration in the physical conditions of the cold ISM thatmay be attributed to the late-time triggering of an AGN.
Our sample provides a new way to study the alteration in globalISM conditions following a burst of star formation. We observe asteady decline in SFE with starburst age, consistent with a naturaldecrease in the SFR following consumption of the dense gas reser-voir (not traced by our CO observations) by the starburst. A similarsteady decrease is observed in the effective dust temperature, whichis likely due to a decrease in the ISRF strength as the starburst ages.In the young PSBs, we observe a high dust-to-stellar mass ratio,which declines with increasing starburst age.
Using chemical evolution modelling, we show that rapid andefficient dust production must be important during the starburst,and dust must be formed by both LIMS and SNe in order to matchthe dust-to-stellar mass ratio and the gas-to-dust mass ratio. Theobserved decrease of the dust-to-stellar mass ratio with starburstage cannot be modelled only by low rates of dust production dueto declining star formation activity. Instead, models must includemoderately strong dust destruction due to SN shocks which weakenswith starburst age, possibly due to the declining SN rate or changesin density of the ISM.
The gas-to-stellar mass ratio (∼0.2), dust-to-stellar mass ratio(1 × 10⁻³) and gas-to-dust mass ratio (100–300) of the oldest PSBsin our sample with ages ∼0.5–1 Gyr are consistent with those ofnormal spiral galaxies and dust/gas-rich ETGs, and do not resemblethose of normal ETGs or red-sequence galaxies. The similarity ofthe morphology and physical properties (gas-to-stellar mass ratio,dust-to-stellar mass ratio) of the older PSBs to dusty/molecular gas-rich ETGs suggests that these populations may be related, or mayhave similar endpoints in cold ISM content after a starburst. Furthercomparisons may reveal that these two populations are intimatelylinked.
As the central starburst has been identified through 3 arcsec fibrespectroscopy, it is possible that the lack of change in the moleculargas-to-stellar mass ratio may be because the central starburst doesnot affect the global properties of the galaxy. However, we showedthat the global SFR estimated by SED fitting tracks the central SFRas the starburst ages with only a small offset in some objects. Ittherefore seems unlikely that we will find a significant offset be-tween central and global gas reservoirs. Significant aperture effectscertainly do exist in some local SDSS-selected PSBs, for examplePracy et al. (2014) found that star formation is ongoing outside ofthe PSB core in two very low redshift HI-rich galaxies. It is possiblethat galaxies that undergo a strong global (rather than central) star-burst may be more efficient at completely exhausting or expellingtheir cold ISM and be a more effective channel by which the redsequence is built. It is also possible that such intense events may bemore common at high redshift (Le Borgne et al. 2006; Wild et al.2009, 2014). Such galaxies can now be selected in large multiwave-length surveys via their UV–near-infrared colours as demonstratedin Wild et al. (2014); these truly global PSBs will be the topic offuture investigations.
Recent work on our own Galaxy, the MW, has found that itlies in the ‘green valley’ (Mutch, Croton & Poole 2011), and its starformation has been roughly constant over the last 3 Gyr (Hernandez,Valls-Gabaud & Gilmore 2000), and perhaps for the last ∼8 Gyr(Haywood et al. 2013; Snaith et al. 2014). A constant SFR suggeststhat the MW must have been in the green valley for a substantial time(last few Gyr). However, the time resolution of the SFH of the MWis ∼1 Gyr, therefore it is quite possible that bursts of star formationhave occurred from time to time, as observed in the objects studiedin this paper. It is important to note that despite the status of theMW as a green valley galaxy, it is considered to be unlikely that it israpidly heading to the red sequence as its gas depletion time is verysimilar to other local spiral galaxies (Leroy et al. 2013) and to theolder PSBs studied here (>300 Myr; Fig. 5). Thus, the MW wouldfit into a picture where starbursts in local galaxies are followed bya return to pre-disruption normality, although possibly in a slightlyearlier-type system, and may lie in the green valley for a few Gyror longer.
In this paper, we conclude that, while the SFR of PSB galaxiesin the local Universe steadily declines with time following the star-burst, substantial cold gas reservoirs remain to fuel future star for-mation, at least up to 0.5–1 Gyr following the starburst. It thereforeseems unlikely that massive galaxies in the local Universe whichhave undergone a strong starburst will contribute to an increase inthe number of red-sequence galaxies on even a 1 Gyr time-scale,and they may remain in the ‘green valley’ for an extended period oftime. Morphological analyses of PSB time sequences will help tounderstand whether the galaxies become increasingly ‘early-type’following such starburst episodes. Further observations of the coldISM in a larger number of older (�1 Gyr) PSB galaxies are requiredin order to track their late-time evolution, and reveal whether the
MNRAS 448, 258–279 (2015)
Dow
nloaded from https://academ
ic.oup.com/m
nras/article/448/1/258/1748852 by CN
RS - ISTO
user on 25 April 2022

Evolution of the cold ISM after a starburst 273
decline in star formation continues and whether they enter the redsequence despite their residual cold gas supplies, perhaps as gas-rich ETGs. Ultimately, studies of galaxies in the local Universe arelimited to revealing only what is happening currently. In order tounderstand the origin of the present-day galaxy bimodality, suchobservations will have to be repeated at higher redshifts, wherepresent-day red-sequence/elliptical galaxies are forming.
AC K N OW L E D G E M E N T S
We thank the referee for useful suggestions which improved theclarity of the paper, and the IRAM duty astronomer Hans Un-gerecht for his help and advice during the observations. VWand KR acknowledge support from the European Research Coun-cil Starting Grant SEDmorph (P.I. VW). This publication hasmade use of code written by James R. A. Davenport, theIDL Astronomy Library (Landsman 1993) and David Fanning’sCoyote IDL library (http://www.idlcoyote.com/). Herschel is anESA space observatory with science instruments provided byEuropean-led Principal Investigator consortia and with impor-tant participation from NASA. This publication makes use ofdata products from the WISE, which is a joint project of theUniversity of California, Los Angeles, and the Jet PropulsionLaboratory/California Institute of Technology, funded by theNASA. Funding for the SDSS and SDSS-II has been provided bythe Alfred P. Sloan Foundation, the Participating Institutions, theNational Science Foundation, the US Department of Energy, theNASA, the Japanese Monbukagakusho, the Max Planck Societyand the Higher Education Funding Council for England. The SDSSwebsite is http://www.sdss.org/. The SDSS is managed by the As-trophysical Research Consortium for the Participating Institutions.The Participating Institutions are the American Museum of NaturalHistory, Astrophysical Institute Potsdam, University of Basel, Uni-versity of Cambridge, Case Western Reserve University, Universityof Chicago, Drexel University, Fermilab, the Institute for AdvancedStudy, the Japan Participation Group, Johns Hopkins University,the Joint Institute for Nuclear Astrophysics, the Kavli Institute forParticle Astrophysics and Cosmology, the Korean Scientist Group,the Chinese Academy of Sciences (LAMOST), Los Alamos Na-tional Laboratory, the Max-Planck-Institute for Astronomy (MPIA),the Max-Planck-Institute for Astrophysics (MPA), New MexicoState University, Ohio State University, University of Pittsburgh,University of Portsmouth, Princeton University, the United StatesNaval Observatory and the University of Washington.
R E F E R E N C E S
Abazajian K. N. et al., 2009, ApJS, 182, 543Agius N. K. et al., 2013, MNRAS, 431, 1929Alatalo K. et al., 2014, ApJ, 780, 186Baldry I. K., Glazebrook K., Brinkmann J., Ivezic Z., Lupton R. H., Nichol
R. C., Szalay A. S., 2004, ApJ, 600, 681Baldwin J. A., Phillips M. M., Terlevich R., 1981, PASP, 93, 5Balog Z. et al., 2014, Exp. Astron., 37, 129Balogh M. L., Miller C., Nichol R., Zabludoff A., Goto T., 2005, MNRAS,
360, 587Barnes J. E., Hernquist L., 1996, ApJ, 471, 115Barro G. et al., 2013, ApJ, 765, 104Barro G. et al., 2014, ApJ, 791, 52Bekki K., Shioya Y., Couch W. J., 2001, ApJ, 547, L17Bekki K., Couch W. J., Shioya Y., Vazdekis A., 2005, MNRAS, 359, 949Bell E. F. et al., 2004, ApJ, 608, 752Bendo G. J. et al., 2010, A&A, 518, L65Bendo G. J. et al., 2013, MNRAS, 433, 3062
Benson A. J., Bower R. G., Frenk C. S., Lacey C. G., Baugh C. M., Cole S.,2003, ApJ, 599, 38
Bigiel F., Leroy A., Walter F., Brinks E., de Blok W. J. G., Madore B.,Thornley M. D., 2008, AJ, 136, 2846
Blake C. et al., 2004, MNRAS, 355, 713Blanton M. R. et al., 2003, ApJ, 594, 186Boquien M. et al., 2011a, AJ, 142, 111Boquien M., Lisenfeld U., Duc P.-A., Braine J., Bournaud F., Brinks E.,
Charmandaris V., 2011b, A&A, 533, A19Boselli A. et al., 2010, A&A, 518, L61Boselli A. et al., 2012, A&A, 540, A54Boselli A., Cortese L., Boquien M., Boissier S., Catinella B., Lagos C.,
Saintonge A., 2014, A&A, 564, A66Bourne N. et al., 2013, MNRAS, 436, 479Braine J., Combes F., 1993, A&A, 269, 7Brinchmann J., Charlot S., White S. D. M., Tremonti C., Kauffmann G.,
Heckman T., Brinkmann J., 2004, MNRAS, 351, 1151Brown M. J. I. et al., 2009, ApJ, 703, 150Brown M. J. I. et al., 2014, ApJS, 212, 18Bruzual G., Charlot S., 2003, MNRAS, 344, 1000Cappellari M. et al., 2013, MNRAS, 432, 1862Cardelli J. A., Clayton G. C., Mathis J. S., 1989, ApJ, 345, 245Casasola V., Bettoni D., Galletta G., 2004, A&A, 422, 941Chabrier G., 2003, PASP, 115, 763Ciesla L. et al., 2012, A&A, 543, A161Clements D. L., Dunne L., Eales S., 2010, MNRAS, 403, 274Cortese L., Hughes T. M., 2009, MNRAS, 400, 1225Cortese L. et al., 2014, MNRAS, 440, 942Couch W. J., Sharples R. M., 1987, MNRAS, 229, 423Croton D. J. et al., 2006, MNRAS, 365, 11da Cunha E., Charlot S., Elbaz D., 2008, MNRAS, 388, 1595 (DCE08)da Cunha E., Charmandaris V., Dıaz-Santos T., Armus L., Marshall J. A.,
Elbaz D., 2010, A&A, 523, A78Daddi E. et al., 2007, ApJ, 670, 156Daddi E. et al., 2010, ApJ, 714, L118Davis T. A. et al., 2014, MNRAS, 444, 3427Davoust E., Contini T., 2004, A&A, 416, 515Di Matteo T., Springel V., Hernquist L., 2005, Nature, 433, 604Downes D., Solomon P. M., 1998, ApJ, 507, 615Dressler A., Gunn J. E., 1983, ApJ, 270, 7Dressler A., Oemler A., Jr, Poggianti B. M., Gladders M. D., Abramson L.,
Vulcani B., 2013, ApJ, 770, 62Dunne L., Eales S., Edmunds M., Ivison R., Alexander P., Clements D. L.,
2000, MNRAS, 315, 115Dwek E., Galliano F., Jones A. P., 2007, ApJ, 662, 927Elbaz D. et al., 2007, A&A, 468, 33Faber S. M. et al., 2007, ApJ, 665, 265Falkenberg M. A., Kotulla R., Fritze U., 2009, MNRAS, 397, 1940Fang J. J., Faber S. M., Salim S., Graves G. J., Rich R. M., 2012, ApJ, 761,
23Fang J. J., Faber S. M., Koo D. C., Dekel A., 2013, ApJ, 776, 63French K. D., Yang Y., Zabludoff A., Narayanan D., Shirley Y., Walter F.,
Smith J.-D., Tremonti C. A., 2015, ApJ, preprint (arXiv:1501.00983)Gao Y., Solomon P. M., 2004, ApJ, 606, 271Garcıa-Burillo S., Usero A., Alonso-Herrero A., Gracia-Carpio J., Pereira-
Santaella M., Colina L., Planesas P., Arribas S., 2012, A&A, 539, A8Genzel R. et al., 2010, MNRAS, 407, 2091Georgakakis A. et al., 2008, MNRAS, 385, 2049Goto T., 2005, MNRAS, 357, 937Goto T., 2007, MNRAS, 381, 187Goto T. et al., 2003, PASJ, 55, 771Griffin M. J. et al., 2010, A&A, 518, L3Groves B. et al., 2012, MNRAS, 426, 892Haynes M. P. et al., 2011, AJ, 142, 170Hayward C. C., Keres D., Jonsson P., Narayanan D., Cox T. J.,
Hernquist L., 2011, ApJ, 743, 159Haywood M., Di Matteo P., Lehnert M. D., Katz D., Gomez A., 2013, A&A,
560, A109
MNRAS 448, 258–279 (2015)
Dow
nloaded from https://academ
ic.oup.com/m
nras/article/448/1/258/1748852 by CN
RS - ISTO
user on 25 April 2022

274 K. Rowlands et al.
Hernandez X., Valls-Gabaud D., Gilmore G., 2000, MNRAS, 316, 605Hogg D. W., Masjedi M., Berlind A. A., Blanton M. R., Quintero A. D.,
Brinkmann J., 2006, ApJ, 650, 763Hopkins P. F., Bundy K., Hernquist L., Ellis R. S., 2007, ApJ, 659, 976Huang M.-L., Kauffmann G., 2014, MNRAS, 443, 1329Hwang H. S. et al., 2011, A&A, 535, A60Jarrett T. H., Chester T., Cutri R., Schneider S., Skrutskie M., Huchra J. P.,
2000, AJ, 119, 2498Jarrett T. H. et al., 2012, AJ, 144, 68Kauffmann G. et al., 2003a, MNRAS, 341, 33Kauffmann G. et al., 2003b, MNRAS, 346, 1055Kaviraj S., Kirkby L. A., Silk J., Sarzi M., 2007, MNRAS, 382, 960Kaviraj S., Schawinski K., Silk J., Shabala S. S., 2011, MNRAS, 415, 3798Kennicutt R. C., Jr, 1998, ApJ, 498, 541 (K98)Kewley L. J., Dopita M. A., Sutherland R. S., Heisler C. A., Trevena J.,
2001, ApJ, 556, 121Khalatyan A., Cattaneo A., Schramm M., Gottlober S., Steinmetz M.,
Wisotzki L., 2008, MNRAS, 387, 13Kirkpatrick A. et al., 2014, ApJ, 789, 130Komugi S. et al., 2011, PASJ, 63, 1139Kovacs A., Chapman S. C., Dowell C. D., Blain A. W., Ivison R. J., Smail
I., Phillips T. G., 2006, ApJ, 650, 592Landsman W. B., 1993, in Hanisch R. J., Brissenden R. J. V., Barnes J.,
eds, ASP Conf. Ser. Vol. 52, Astronomical Data Analysis Software andSystems II. Astron. Soc. Pac., San Francisco, p. 246
Lanz L. et al., 2013, ApJ, 768, 90Le Borgne D. et al., 2006, ApJ, 642, 48Lehnert M. D., Heckman T. M., 1996, ApJ, 472, 546Leroy A., Bolatto A., Walter F., Blitz L., 2006, ApJ, 643, 825Leroy A. K., Walter F., Brinks E., Bigiel F., de Blok W. J. G., Madore B.,
Thornley M. D., 2008, AJ, 136, 2782Leroy A. K. et al., 2013, AJ, 146, 19Levesque E. M., Kewley L. J., Larson K. L., 2010, AJ, 139, 712Lisenfeld U. et al., 2011, A&A, 534, A102Martin D. C. et al., 2007, ApJS, 173, 342Mendel J. T., Simard L., Ellison S. L., Patton D. R., 2013, MNRAS, 429,
2212Mihos J. C., Hernquist L., 1994, ApJ, 431, L9Mihos J. C., Hernquist L., 1996, ApJ, 464, 641Misiriotis A., Popescu C. C., Tuffs R., Kylafis N. D., 2001, A&A, 372, 775Morgan H. L., Edmunds M. G., 2003, MNRAS, 343, 427Moshir M., 1989, IRAS Faint Source Survey, Explanatory Supplement Ser-
sion 1 and Tape. Infrared Processing and Analysis Center, CaliforniaInstitute of Technology, Pasadena, CA
Mutch S. J., Croton D. J., Poole G. B., 2011, ApJ, 736, 84Nguyen H. T. et al., 2010, A&A, 518, L5Noeske K. G. et al., 2007, ApJ, 660, L43Ott S., 2010, in Mizumoto Y., Morita K.-I., Ohishi M., eds, ASP Conf.
Ser. Vol. 434, Astronomical Data Analysis Software and Systems XIX.Astron. Soc. Pac., San Francisco, p. 139
Pilbratt G. L. et al., 2010, A&A, 518, L1Poggianti B. M. O., 2009, ApJ, 693, 112Poglitsch A. et al., 2010, A&A, 518, L2Popescu C. C., Misiriotis A., Kylafis N. D., Tuffs R. J., Fischera J., 2000,
A&A, 362, 138Pracy M. B., Kuntschner H., Couch W. J., Blake C., Bekki K., Briggs F.,
2009, MNRAS, 396, 1349Pracy M. B., Owers M. S., Zwaan M., Couch W., Kuntschner H., Croom
S. M., Sadler E. M., 2014, MNRAS, 443, 388Quintero A. D. et al., 2004, ApJ, 602, 190Remy-Ruyer A. et al., 2014, A&A, 563, A31Rodighiero G. et al., 2010, A&A, 518, L25Roussel H., 2013, PASP, 125, 1126Rowan-Robinson M., Crawford J., 1989, MNRAS, 238, 523Rowlands K. et al., 2012, MNRAS, 419, 2545Rowlands K. et al., 2014a, MNRAS, 441, 1017Rowlands K., Gomez H. L., Dunne L., Aragon-Salamanca A., Dye S.,
Maddox S., da Cunha E., Werf P. v. d., 2014b, MNRAS, 441, 1040
Sage L. J., Welch G. A., Young L. M., 2007, ApJ, 657, 232Saintonge A. et al., 2011a, MNRAS, 415, 32Saintonge A. et al., 2011b, MNRAS, 415, 61Salim S., Fang J. J., Rich R. M., Faber S. M., Thilker D. A., 2012, ApJ, 755,
105Sanders D. B., Mirabel I. F., 1996, ARA&A, 34, 749Sanders D. B., Scoville N. Z., Soifer B. T., 1991, ApJ, 370, 158Sauvage M., Thuan T. X., 1994, ApJ, 429, 153Sauvage M., Vigroux L., Thuan T. X., 1990, A&A, 237, 296Schawinski K., Thomas D., Sarzi M., Maraston C., Kaviraj S., Joo S.-J., Yi
S. K., Silk J., 2007, MNRAS, 382, 1415Schawinski K. et al., 2009, ApJ, 690, 1672Schawinski K. et al., 2014, MNRAS, 440, 889Schlegel D. J., Finkbeiner D. P., Davis M., 1998, ApJ, 500, 525Shin M.-S., Strauss M. A., Tojeiro R., 2011, MNRAS, 410, 1583Skrutskie M. F. et al., 2006, AJ, 131, 1163Smith D. J. B. et al., 2012, MNRAS, 427, 703Smith D. J. B. et al., 2013, MNRAS, 436, 2435Snaith O. N., Haywood M., Di Matteo P., Lehnert M. D., Combes F.,
Katz D., Gomez A., 2014, ApJ, 781, L31Snyder G. F., Cox T. J., Hayward C. C., Hernquist L., Jonsson P., 2011, ApJ,
741, 77Solomon P. M., Vanden Bout P. A., 2005, ARA&A, 43, 677Solomon P. M., Downes D., Radford S. J. E., Barrett J. W., 1997, ApJ, 478,
144Springel V., Di Matteo T., Hernquist L., 2005, ApJ, 620, L79Stark D. V., Kannappan S. J., Wei L. H., Baker A. J., Leroy A. K., Eckert
K. D., Vogel S. N., 2013, ApJ, 769, 82Stevens J. A., Amure M., Gear W. K., 2005, MNRAS, 357, 361Strateva I. et al., 2001, AJ, 122, 1861Swinbank A. M. et al., 2014, MNRAS, 438, 1267Tacconi L. J. et al., 2008, ApJ, 680, 246Tremonti C. A. et al., 2004, ApJ, 613, 898Veilleux S., Osterbrock D. E., 1987, ApJS, 63, 295Whitaker K. E., Kriek M., van Dokkum P. G., Bezanson R., Brammer G.,
Franx M., Labbe I., 2012a, ApJ, 745, 179Whitaker K. E., van Dokkum P. G., Brammer G., Franx M., 2012b, ApJ,
754, L29Wild V., Kauffmann G., Heckman T., Charlot S., Lemson G., Brinchmann
J., Reichard T., Pasquali A., 2007, MNRAS, 381, 543Wild V., Walcher C. J., Johansson P. H., Tresse L., Charlot S., Pollo A., Le
Fevre O., de Ravel L., 2009, MNRAS, 395, 144Wild V., Heckman T., Charlot S., 2010, MNRAS, 405, 933 (WHC10)Wild V. et al., 2014, MNRAS, 440, 1880Wong O. I. et al., 2006, MNRAS, 371, 1855Wong O. I., Webster R. L., Kilborn V. A., Waugh M., Staveley-Smith L.,
2009, MNRAS, 399, 2264Wong O. I. et al., 2012, MNRAS, 420, 1684Wright E. L. et al., 2010, AJ, 140, 1868Wuyts S. et al., 2011, ApJ, 742, 96Xilouris E. M., Georgakakis A. E., Misiriotis A., Charmandaris V., 2004,
MNRAS, 355, 57Xu C., 1990, ApJ, 365, L47Xu C., Helou G., 1996, ApJ, 456, 163Yan R., Newman J. A., Faber S. M., Konidaris N., Koo D., Davis M., 2006,
ApJ, 648, 281Yan R. et al., 2009, MNRAS, 398, 735Yang X., Mo H. J., van den Bosch F. C., Pasquali A., Li C., Barden M.,
2007, ApJ, 671, 153Yang Y., Zabludoff A. I., Zaritsky D., Mihos J. C., 2008, ApJ, 688,
945Yates R. M., Kauffmann G., 2014, MNRAS, 439, 3817Yesuf H. M., Faber S. M., Trump J. R., Koo D. C., Fang J. J., Liu F. S., Wild
V., Hayward C. C., 2014, ApJ, 792, 84York D. G. et al., 2000, AJ, 120, 1579Young J. S., Kenney J. D., Tacconi L., Claussen M. J., Huang Y.-L., Tacconi-
Garman L., Xie S., Schloerb F. P., 1986, ApJ, 311, L17Young L. M. et al., 2011, MNRAS, 414, 940
MNRAS 448, 258–279 (2015)
Dow
nloaded from https://academ
ic.oup.com/m
nras/article/448/1/258/1748852 by CN
RS - ISTO
user on 25 April 2022

Evolution of the cold ISM after a starburst 275
Zabludoff A. I., Zaritsky D., Lin H., Tucker D., Hashimoto Y., ShectmanS. A., Oemler A., Kirshner R. P., 1996, ApJ, 466, 104
Zwaan M. A., Kuntschner H., Pracy M. B., Couch W. J., 2013, MNRAS,432, 492
APPENDIX A : PSB GALAXY SELECTION
Samples of PSB galaxies are traditionally selected to lack emissionlines which trace star formation (e.g. Hα, [O II]), and exhibit deep
Figure A1. EWs of the HδA, Hα and [O II] emission lines as a function ofstarburst age for the SDSS bulge-dominated PSB parent sample (dots) andthe 11 PSBs studied in this paper (thick points with error bars). The greyareas denote the equivalent width at which a galaxy would be identifiedas a PSB galaxy by Goto et al. (2003). The blue crosses indicate galaxieswhich meet all three criteria required by Goto et al. (2003) to be classifiedas a PSB. Upper limits at the 3σ level are shown for galaxies with SNR<3,sources with blue upper limits have SNR<3 in either Hα or [O II] EW andmeet the Goto et al. (2003) criteria at the 3σ level.
Balmer absorption lines which signify a dominant A/F stellar popu-lation. We briefly examine which of our PSBs selected via our PCAtechnique would be selected as PSBs using the criteria of Goto et al.(2003), Goto (2005, 2007), who require Hα equivalent width (EW)>−2.5 Å, Hδ EW > 5 Å, [O II] EW > −3 Å (where absorption ispositive EW and emission is negative EW).
In Fig. A1, we show the line EWs as a function of starburstage for the 11 PSBs studied in this sample and the SDSS bulge-dominated PSB parent sample. The line EWs are from the MPA-JHU catalogue.14 Of the 11 PSBs studied in this paper, none wouldmeet the Goto et al. (2003) criteria due to the presence of Hα and[O II] emission. Of the parent sample of PSBs with starburst age<600 Myr and measurements of all three lines, only 5/377 meet thecriteria, although four of these sources have SNR <3 in either Hα
or [O II] EW.15 Of these four sources, only one PSB meets the Gotoet al. (2003) criteria at the 3σ level. It can be seen from Fig. A1that selection criteria requiring no emission only select PSBs withages older than 400 Myr. This is primarily due to the relativelyslow decline in SFR following a starburst, although additionally itexcludes all narrow-line AGN which are more prevalent in PSBsthan other galaxies (Yan et al. 2006; Wild et al. 2010). Sampleswhere an emission line cut has been applied cannot be used to studythe evolution of starbursts into PSBs.
A P P E N D I X B: SP E C T R A A N D I M AG E S
APPENDIX C : SED FITS
14 http://www.mpa-garching.mpg.de/SDSS/DR7/. We apply the appropriatescaling to the EW errors as recommended in the MPA-JHU documentation.15 Note that Goto et al. (2003) do not apply an SNR cut to their EW mea-surements.
MNRAS 448, 258–279 (2015)
Dow
nloaded from https://academ
ic.oup.com/m
nras/article/448/1/258/1748852 by CN
RS - ISTO
user on 25 April 2022

276 K. Rowlands et al.
Figure B1. Left: SDSS gri cutouts of the PSBs, cutouts are 60 arcsec on a side. In the first image, we show the extent of the 3 arcsec SDSS fibre (solid),the CO(1–0) beam (dashed) and the CO(2–1) beam (dotted). The CO 12CO(1–0) (centre) and 12CO(2–1) (right) spectra in units of main beam brightnesstemperature for the PSBs. The x-axis indicates the velocity offset of the line corrected to the systemic velocity of the galaxy from optical spectra. The rawCO(1–0) and CO(2–1) data have been smoothed with a boxcar of 10 and 15 velocity resolution elements, respectively, and binned to 21 km s−1. The greyshaded area indicates the CO line, and the dashed lines indicate the 3σ scatter around the baseline.
MNRAS 448, 258–279 (2015)
Dow
nloaded from https://academ
ic.oup.com/m
nras/article/448/1/258/1748852 by CN
RS - ISTO
user on 25 April 2022

Evolution of the cold ISM after a starburst 277
Figure B1. continued
MNRAS 448, 258–279 (2015)
Dow
nloaded from https://academ
ic.oup.com/m
nras/article/448/1/258/1748852 by CN
RS - ISTO
user on 25 April 2022

278 K. Rowlands et al.
Figure B2. The optical spectra of the 11 PSBs. The left-hand panel shows the 4000 Å break region in detail, with the fitted eigenspectra overplotted in red(the emission lines are masked during the fitting). The right-hand panel shows the full extent of the SDSS spectra. The spectra are ordered by starburst age:<20 Myr (PSB1, 2, 3), ∼100 Myr (PSB4 and 5), ∼400 Myr (PSB6, 7), ∼600 Myr (PSB8, 9 and 10) and ∼1 Gyr (PSB11).
MNRAS 448, 258–279 (2015)
Dow
nloaded from https://academ
ic.oup.com/m
nras/article/448/1/258/1748852 by CN
RS - ISTO
user on 25 April 2022

Evolution of the cold ISM after a starburst 279
Figure C1. Multiwavelength SEDs of the 11 PSBs in our sample, with observed photometry (red points) from the rest-frame UV to the submillimetre. Upperlimits are shown as arrows, and errors on the photometry are described in Section 3. The solid black line is the best-fitting model SED and the solid blue lineis the unattenuated optical model. The residuals of the fit are shown in the panel below each SED.
This paper has been typeset from a TEX/LATEX file prepared by the author.
MNRAS 448, 258–279 (2015)
Dow
nloaded from https://academ
ic.oup.com/m
nras/article/448/1/258/1748852 by CN
RS - ISTO
user on 25 April 2022