the “emulator effect” of the uruguay round on us regionalism
TRANSCRIPT
ISSN 2042-2695
CEP Discussion Paper No 973
March 2010
The ‘Emulator Effect’ of the Uruguay Round On US Regionalism
Marco Fugazza and Frédéric Robert-Nicoud
Abstract Using a detailed data set at the tariff line level, we find an emulator effect of multilateralism on subsequent regional trade agreements involving the US. We exploit the variation in the frequency with which the US has granted immediate duty free access (IDA) to its Free Trade Area partners across tariff lines. A key finding is that the US has granted IDA status especially on goods for which it had cut the multilateral MFN tariff during the Uruguay round the most. Thus, the Uruguay Round (multilateral) ‘concessions’ have emulated subsequent (preferential) trade liberalisation. We conclude from this that past liberalisation sows the seeds of future liberalisation and that multilateral and preferential trade agreements are dynamic complements. Keywords: Regionalism, multilateralism, stumbling bloc, Uruguay round JEL Classifications: F13, F14, F15, N70 This paper was produced as part of the Centre’s Globalisation Programme. The Centre for Economic Performance is financed by the Economic and Social Research Council. Acknowledgements We are especially grateful to Alessandro Nicita, Marcelo Olarreaga and Emanuel Ornelas for detailed feedback and comments as well as to Richard Baldwin, Emily Blanchard, Caroline Freund, Jaya Krishnakumar, Ugo Panizza and Esteban Rossi-Hansberg and participants in seminars at the WTO, Glasgow University and the Workshop on "The New Political Economy of Trade" at the European University Institute for useful discussions and suggestions. Robert-Nicoud is also a Peter B. Kenen Visiting Scholar at Princeton University and gratefully acknowledges the hospitality of its International Economics Section. Marco Fugazza is the Economic Affairs Officer, United Nations Conference on Trade and Development (UNCTAD), Division on International Trade, Geneva. Frédéric Robert-Nicoud is an Associate at the Centre for Economic Performance, London School of Economics and an Economics Professor at the University of Geneva. Published by Centre for Economic Performance London School of Economics and Political Science Houghton Street London WC2A 2AE All rights reserved. No part of this publication may be reproduced, stored in a retrieval system or transmitted in any form or by any means without the prior permission in writing of the publisher nor be issued to the public or circulated in any form other than that in which it is published. Requests for permission to reproduce any article or part of the Working Paper should be sent to the editor at the above address. © M. Fugazza and F. Robert-Nicoud, submitted 2010

2
1. INTRODUCTION
Many preferential trade agreements came to light since the completion in 1994 of the
Uruguay Round of multilateral trade negotiations under the auspices of the GATT. The US is
no exception. These agreements involving the US vary in scope – the number of goods
included in the agreement varies across agreements – and breadth – the US tariff on some
goods goes to zero immediately upon implementing the agreement but the imports of many
other are fully liberalised only gradually. In this paper, we shed light on the causes of these
cross-good variations and show that they are best though as the continuation of a process that
includes multilateral liberalisations. Specifically, we find that the imports of goods that the
US liberalises swiftly the most frequently on a preferential basis are also the goods for which
it granted the boldest tariff cuts during the Uruguay Round. This finding is robust to a variety
of specifications. The quantitative effect is also quite large. We interpret these findings as
evidence that past multilateral (or non-discriminatory) trade agreements are a dynamic
complement, or emulator, to consecutives regional (or preferential) agreements.1
Our results matter for three reasons at least. First, one striking feature of the current world
trading system is the explosion of regionalism, that is, the growth in the number of
preferential trade agreements (PTAs). Only 37 such agreements were in place at the launch of
the World Trade Organisation (WTO) in 1994 but 421 PTAs had been notified to the
GATT/WTO and 230 of them were in force as of December 2008. What is driving this
growing proliferation of PTAs? In this paper, we make ours Wilfred Ethier’s assertion that
‘regionalism is an endogenous response to the multilateral trading system (Ethier 1998:
1216)’. Our research question can thus be summarized as asking the question “is
multilateralism driving the proliferation of PTAs in any way?” This question has received
surprisingly little academic interest so far. To the best of our knowledge, Ethier (1998) and
Freund’s (2000a) theoretical papers are rare, perhaps unique, exceptions. Our paper studies
this question from an empirical perspective, focusing on the United States.
1 We also find some interesting and systematic deviation from this pattern, to which we return below.
3
Second, our paper contributes to the large research agenda that asks whether regionalism and
multilateralism substitutes or complements. Answering such questions is important, not least
because several scholars fear that regionalism is a dynamic substitute, or stumbling block, to
multilateral free trade and a menace to the multilateral trading system incarnated by the
GATT/WTO (Bhagwati 1991, Grossman and Helpman 1995, Levy 1997, Bagwell and Staiger
1998, Krishna 1998, McLaren 2002, Limão 2007).2 Limão (2006) finds empirical support for
the stumbling block hypothesis for the US case; Estevadeordal, Freund and Ornelas (2008)
find a ‘building block’ effect in a sample of ten Latin American countries; Freund and Ornelas
(forthcoming) provide an excellent review of this abundant literature.3 We complement it by
asking the causality question in the opposite direction, as Ethier (1998) and Freund (2000a),
but from an empirical angle.
Third, with few exceptions, existing theoretical studies on the complements-vs-substitutes
issue address this question using either one-shot games or dynamic games that exhibit stable
steady-state equilibrium tariffs. Therefore, these models are ill-suited to address the stylised
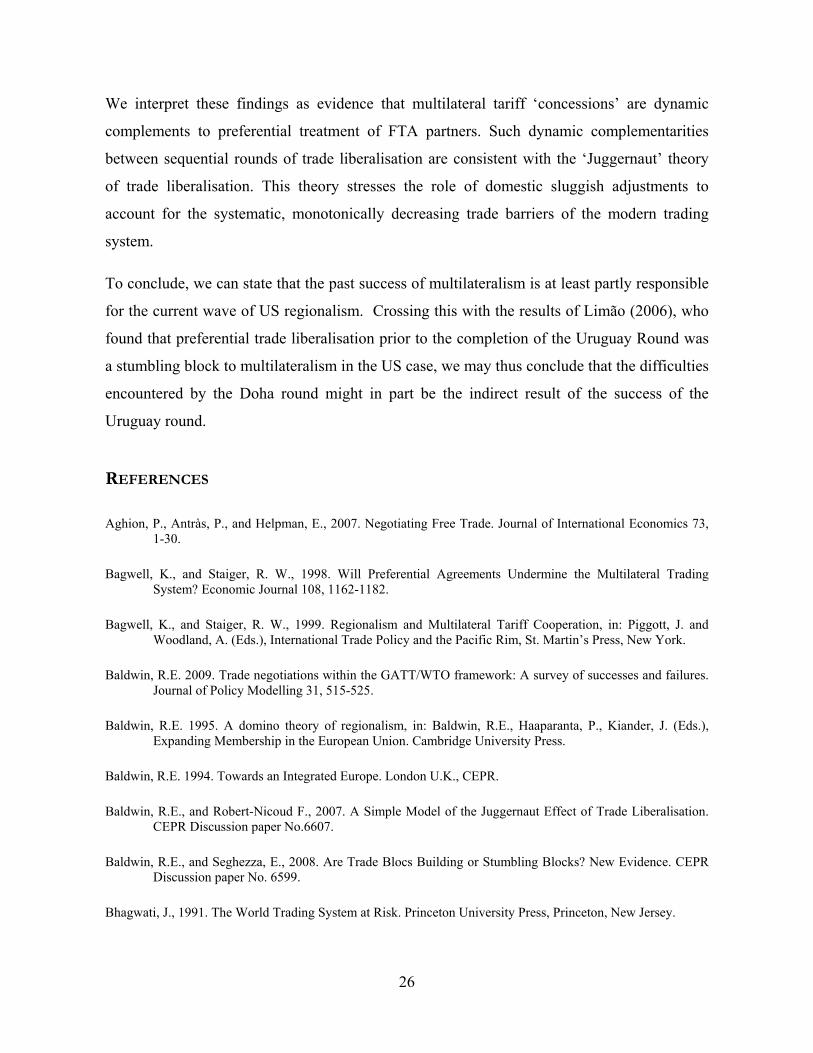
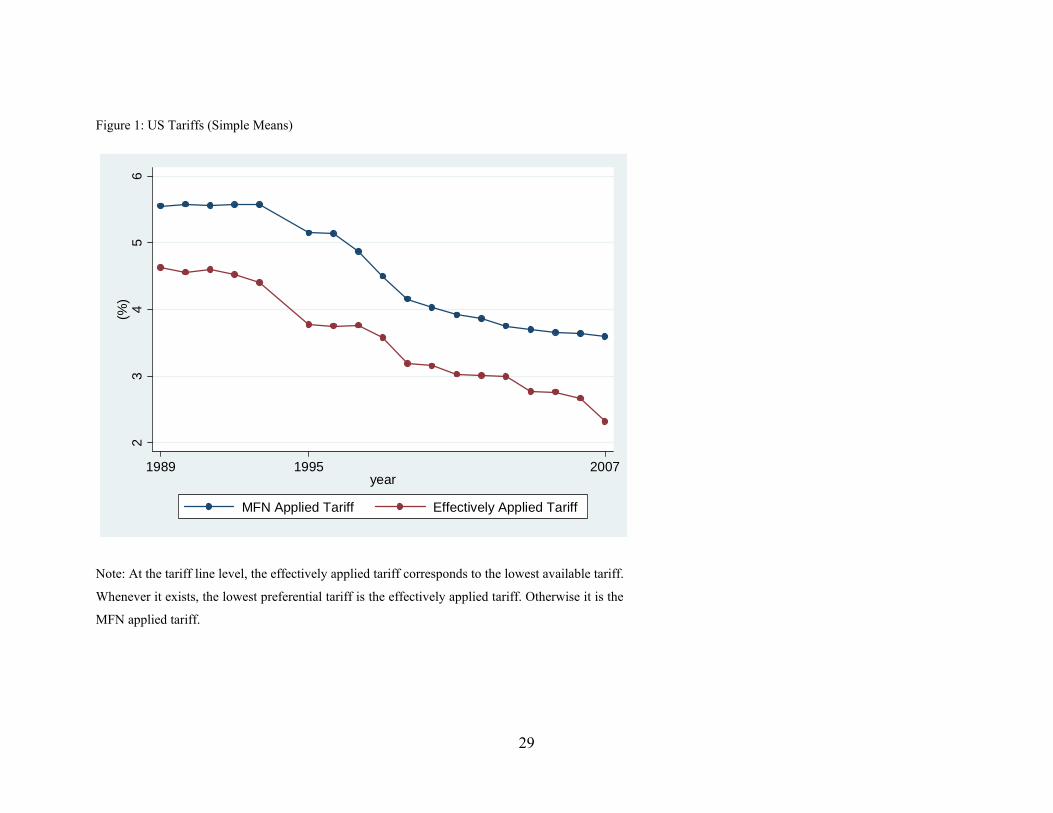
fact illustrated in Figure 1: US tariffs, both preferential and multilateral, keep falling over
time.4 Consequently, in addressing the question as to whether there exists any (causal) link
between the two series, we ask whether multilateral tariff cuts are associated with more
preferential tariff cuts: in noticeable departure from the existing literature, we don’t run our
regressions in level. Our regression results reveal that the US’ preferential tariff cuts are a
dynamic complement to its multilateral cuts. This provides (to the best of our knowledge:
original) evidence in favour of the ‘Juggernaut theory’ of trade liberalisation, whereby current
2 Also not one month elapses without the economic press worrying about this issue. Editorial lines
predominantly echoe the ‘stumbling block’ hypothesis. For economic and political mechanisms consistent with
the ‘building block’ hypothesis, see e.g. Kennan and Riezman (1990), Richardson (1993), Bagwell and Staiger
(1999) and Ornelas (2005a).
3 Limão and Karakaovali (2008) find a stumbling block effect for the EU. Baldwin and Seghezza (2008) find a
negative correlation between MFN tariffs and preference margins in their sample of 23 large countries. They
conclude from this that the stumbling block mechanism, if it exists, is not of first order importance.
4 In Figure 1, the ‘effectively applied tariff’ series is a simple average of MFN and preferential tariffs across
tariff lines. For reasons that will become clear below, most of the preferential tariffs are zero.

4
liberalisation, by eroding protectionist forces and hence resistance to future trade reforms, is
sowing the seeds of future liberalisation (Baldwin 1994, Staiger 1995, Maggi and Rodrìguez-
Clare 2007, Baldwin and Robert-Nicoud 2007).
The explanatory variable that is the focus of our interest is the multilateral tariff cut that we
label ‘CUT’. Our measure for CUT is the difference between the Tokyo Round and the
Uruguay Round MFN tariffs. We want to relate this to a measure of the intensity of
preferential trade liberalisation subsequent to the completion and much of the implementation
of the Uruguay Round. In the US, resistance to preferential trade liberalisation (conditional on
it taking place) cannot take the form of positive preferential tariffs for institutional reasons, as
we explain in the data section of the paper. It can only take the form of delayed liberalisation.
Therefore, our measure of the intensity of post-Uruguay Round preferential trade
liberalisation (or ‘PTL’) for each good is the frequency at which the US grants immediate
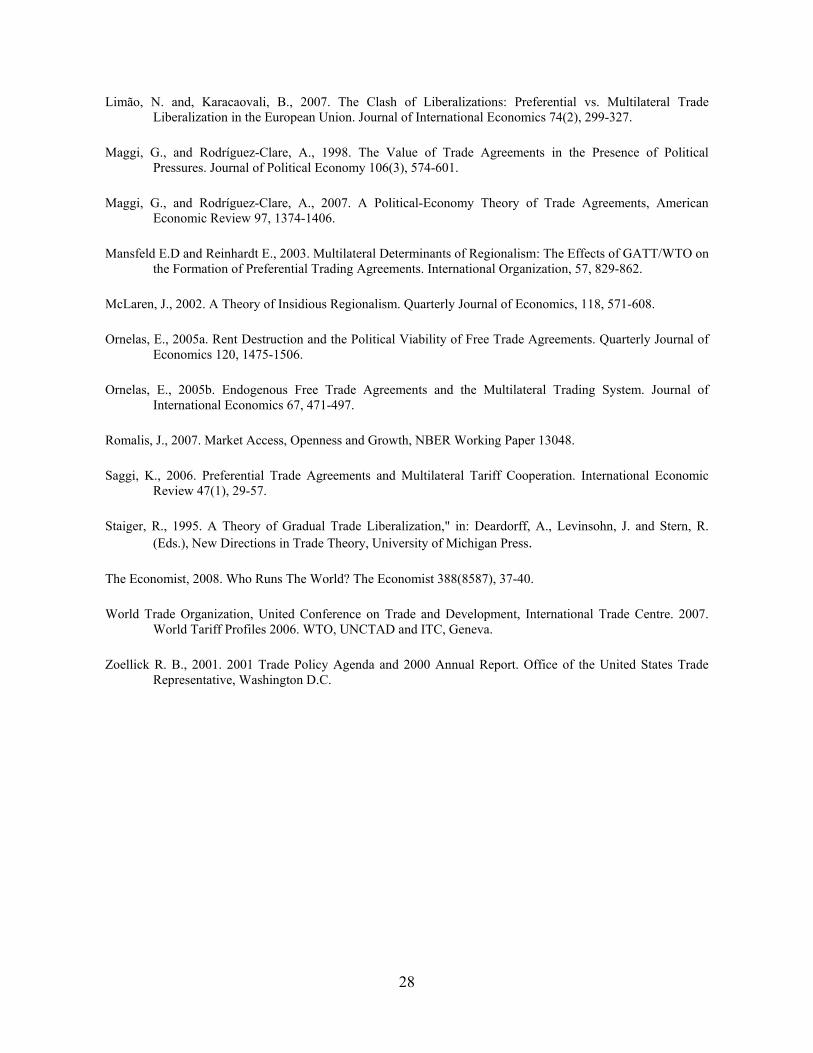
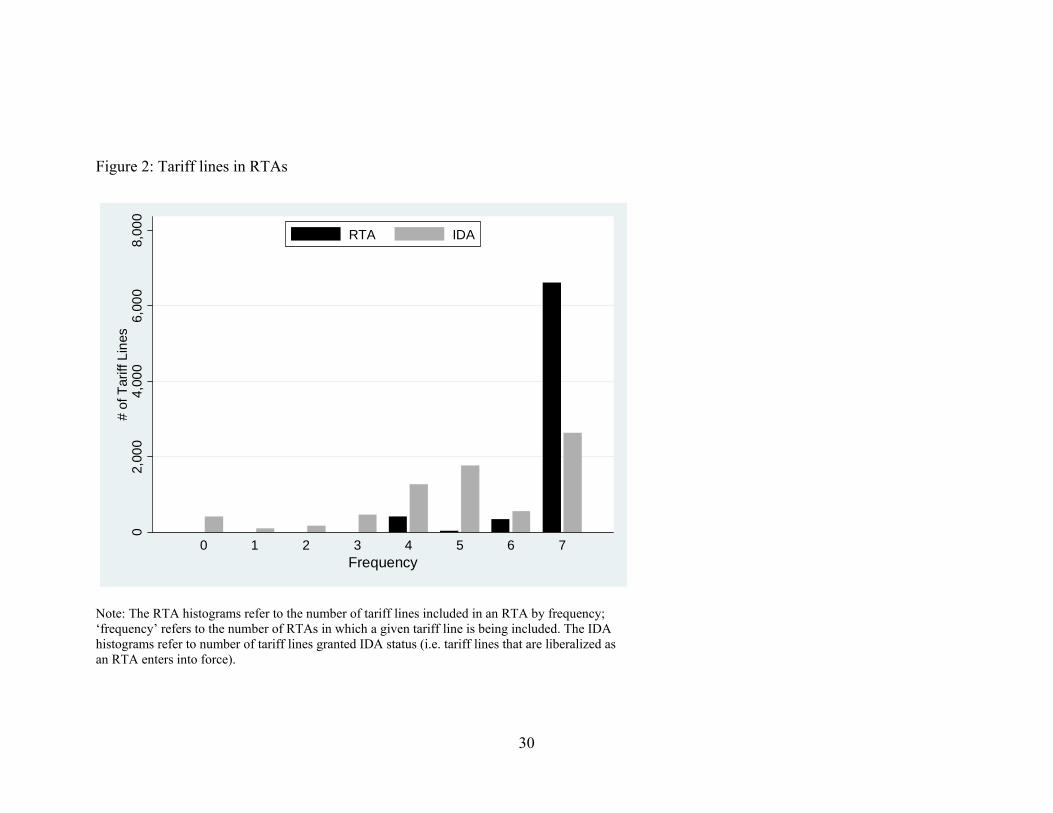
duty-free access to its market to its FTA trading partners.5 For instance, the US grants
immediate duty free access to all seven partners in our sample for 35% of the goods (2,627
goods out of 7,419), to none for 6% of the goods and to between one and all but one partners
for 59% of the goods (See Figure 2).
We find that an increase in the tariff CUT of one percentage point is associated with an
increase in the probability of the US granting immediate duty-free access to its market to all
trade partners by about twenty-five percent at the sample mean. Given that the standard error
for CUT in the sample is 4.34 percentage points, this is a large effect.
An alternative interpretation for our results is also possible: the dynamic complementarities
between the Uruguay Round and the preferential tariff cuts might just reflect dynamic
complementarities between past and current liberalisations – regardless of the level
(preferential or multilateral) at which they are conducted. Perhaps the US grants these
5 A free trade area, or ‘FTA’, is a special kind of PTL: its preferential tariffs are zero.
5
‘concessions’ at the preferential level because the Doha Round of multilateral trade talks is
currently stalling. This latter hypothesis, which we label ‘the money left on the table
hypothesis’, is quite popular among many pundits or in the press (The Economist is a
particularly ardent propagator of this view of the world). Note that the two explanations are
not mutually exclusive. We control for this hypothesis in two ways. First, we introduce the
Uruguay Round MFN tariff rate as a control in all our regressions. The estimated coefficient
is negative, implying that the US disproportionately grants duty free access to its market on a
preferential basis for goods that have a low MFN tariff rate already. This rejects the money
left on the table hypothesis. Second, it turns out that the US did not cut MFN tariffs at the
Uruguay Round on about 22% of goods in our sample; so, we introduce a dummy variable for
such goods as an additional control, recognizing that these might be different for some reason.
The estimated coefficient of this control is statistically significant and positive, implying that
the Uruguay Round and the ensuing preferential tariff cuts are dynamic substitutes for these
goods. The presence of this control among the independent variables also increases the
estimated coefficient of CUT, which reinforces our emulator finding for the remaining 78% of
tariff lines. We also control for the share of each partner in US trade; we find no effect,
suggesting that no partner is any more ‘natural’ in getting favourable tariff cuts than in
triggering trade creation relative to trade diversion, as first pointed out by Krishna (2003).
Several explanations may explain this emulator effect but not all of them imply that past
(multilateral) trade liberalisation is a force behind current (preferential) trade liberalisation.
We pursue several routes in order to interpret the positive correlation between multilateral
tariff cuts and preferential liberalisation in causal way. As we explain in Section 4, we rely on
the timing of events to rule out reverse causation. Dealing with the presence of omitted
variables like political economics forces is more involved (Baldwin and Seghezza 2008,
Estevadeordal et al. 2008). We start by introducing 2-digit sector dummies to control for
characteristics that are common across goods of the same industry. Our results show that this
improves the identification of the emulator hypothesis. We then estimate a different CUT
coefficient for goods that are protected by non-tariff measures (NTM) and/or prohibitively
costly rules of origin (RoO). If third factors were to explain the correlation between CUT and
preferential trade liberalisation in full, then the conditional CUT coefficients should not
systematically differ across goods categories. By contrast, if multilateral tariff cuts cause
6
preferential tariff cuts, then our identifying assumption for the emulator effect is that it be
strongest when it maters the most, namely, for goods that have no NTMs or prohibitive RoOs.
The results are consistent with this assumption: there is no emulator effect for goods with
NTMs; the emulator effect is stronger for goods with prohibitively costly RoOs.
We also use existing theoretical results as an alternative way of identifying the emulator
effect. We construct our argument by combining two ingredients. Our first ingredient is
dynamic: Maggi and Rodriguez-Clare (2007) and others postulate that past trade liberalisation
in a given sector undermines its current resistance to trade openness because trade
liberalisation decreases the (quasi) rents associated with the (quasi) fixed factors that fight for
protection. Over time, these factors depreciate and with them the resistance to trade
liberalisation. Thus, over the years, this logic repeats and the past trade liberalisation feeds
current and future liberalisation; once started, like a juggernaut, it keeps rolling. Our second
ingredient is static: in the Protection For Sale (PFS) framework due to Grossman and
Helpman (1994), Gawande, Krishna and Olarreaga (2009) formalize the idea that downstream
sectors oppose protection of domestic upstream sectors from which they source. By a
symmetric argument, upstream sectors favour protection in the domestic downstream sectors
they sell to. Taken together, the PFS and the juggernaut logics imply that the emulator effect
is strongest in upstream sectors and weakest in downstream ones. Consistent with this prior,
the data reject the alternative hypothesis whereby there should be no differential effect.
Finally, we also experimented with instrumenting for MFN tariff cuts and levels with the
corresponding EU tariff cuts and levels. This strategy is not faultless, but EU tariffs were too
weakly correlated with their US counterparts to make them valid instruments anyway (this
came as a surprise to us). We therefore do not discuss these issues or the results further.
The rest of the paper is organised as follows. Section 2 further discusses work related to ours.
Section 3 defines the variables and the data. Section 4 introduces our estimation strategy and
displays the baseline empirical results; Section 5 reports various identification strategies of
the emulator effect while robustness checks are relegated to Section 6. Section 7 concludes.
7
2. RELATED LITERATURE
Our findings are consistent with two different arguments put forth in the theoretical literature.
The first class of models studies the welfare effects of preferential versus multilateral trade
liberalisation and, on the positive side, whether liberalising on a preferential basis first, by
changing the status quo ante, undermines multilateralism (see Bhagwatti 1991 and the
subsequent literature). Even in this case, though, the models are essentially static: the supply
side of the economy is exogenously given and the only dynamic thought experiment is an
application of the agenda-setting game, a classic in political science. Aghion, Antràs and
Helpman (2007) study this canonical game in a trade liberalisation context explicitly. Freund
(2002b) emphasizes that the same type of logic also entails that the incentives to form an FTA
are shaped by the state of multilateral tariff levels. In an oligopolistic setting, she finds that
the profit-shifting effect of regionalism, whereby discriminatory trade agreements expand
output and profits in the participating countries at the expense of the countries left out, is
especially strong when multilateral tariffs are low. She concludes from her analysis that ‘each
round of multilateral tariff reduction should lead to a new wave of PTAs’ (Freund 2002b:
359). Our results vindicate her conclusion. In a PFS setting, Ornelas (2005a) points out that
preferential trade liberalisation erodes the rents from protection, which encourages
participating countries to lower their external tariff. Insofar as this line of reasoning also
applies in the opposite direction, our results are consistent with Ornelas’ theoretical findings.
A similar line of analysis as the one above asks whether the conditions under which PTAs are
enforceable are affected by the multilateral trading environment (Freund 2002b and Ornelas
2005b). In these models, the static costs and benefits from protection are time-invariant by
construction, so that natural solution to this kind of dynamic problem is a stationary tariff.
However, if anything, tariffs fall over time and hence this line of explanation misses an
important dimension of the real world.
The second strand of the theoretical literature that is related to our empirical work focuses on
the dynamic aspect of trade agreements, putting aside the dimension of regionalism versus
multilateralism, and seeks to explain why tariffs tend to fall over time. Maggi and Rodriguez-
Clare (2007) is a key contribution here. Recognising that some sector-specific factors of
production like (human) capital depreciate gradually over time, they stress that the politically
8
optimal tariff is thus also decreasing over time as a result. See also Baldwin (1994), Staiger
(1995) and Baldwin and Robert-Nicoud (2007). The central finding for our purpose is that
past liberalisation sows the seeds of current liberalisation by eroding the rents from
protection. Freund (2000a) and McLaren (2002) also combine dynamic aspects of trade
liberalisation with the regionalism versus multilateralism issue but their focus (the hysteretic
effects of preferential trade barriers) is different.
From an empirical point of view, the main strand of the literature that relates to our research is
on the determinants of RTAs formation. Several papers study the economic determinants of
RTAs (Baier and Bergstrand 2004, Egger and Larch 2008). The main identifying assumption
remains that RTA-related trade gains are closely linked to the standard gravity covariates.
Baier and Bergstrand (2004) find that the likelihood of an RTA is larger, the closer the two
countries are to each other, the more remote they are from the rest of the world, the larger
their GDPs, the smaller the difference between their GDPs, the larger their relative factor
endowment difference, and the wider the (absolute) difference between their and the rest of
the world capital-labor ratios. Building on Baier and Bergstrand (2004), Egger and Larch
(2009) find evidence consistent with Baldwin’s (1995) Domino theory of regionalism,
whereby pre-existing PTAs increase the likelihood that two countries participate in a common
PTA. In a separate but no less interesting line of research, Martin, Mayer and Thoenig (2009)
find that multilateralism causes peace-motivated regional trade agreements (RTA). The logic
goes as follows: countries that have fought wars in the distant past tend to sign RTAs as a way
of increasing the opportunity cost of a bilateral war, thereby reducing the probability that
possible bilateral conflicts might escalate into wars. In previous work (Martin et al. 2008), the
same authors show that multilateral trade reduces the opportunity cost of a bilateral war.
Taken together, this line of reasoning and these results imply that an increase of
multilateralism raises the probability of bilateral war among old foes and they then enter
bilateral or regional trade deals as an endogenous response to this threat it poses to bilateral
peace. The macro-level empirical evidence in Martin et al. (2009), which is supportive of this
argument, complements our micro-level evidence.
9
Importantly, whereas we take the existence of the Free Trade Agreement as given, and aim to
find out which tariff lines are liberalised the most swiftly, the three aforementioned papers
aim to explain the formation of PTAs.
3. DEFINITION OF VARIABLES, DATA AND SUMMARY STATISTICS
In the case of the United States (and others), the legally binding and the applied MFN tariffs
coincide exactly (by definition the latter may not be higher than the former), so we refer to
them as the MFN tariff for short.6 All US MFN tariffs are non-increasing in the post-Uruguay
round period. Our key explanatory variable, denoted by CUT, is defined as the (non-negative)
difference (or tariff ‘cut’) between the Tokyo and Uruguay MFN rates, i.e. CUT ≡ MFNTokyo -
MFNUruguay. CUT is our good-specific measure of the intensity of multilateral trade
liberalisation, so we may write CUTg to be more explicit (with the subscript g denoting the
good). The stated aim of the Uruguay Round was to cut tariffs by about 30% but in the end
Canada, the EU, Japan, and the US achieved a larger reduction on average (Baldwin 2009).
The main sources for data are the UNCTAD-TRAINS and the WTO-CTS Bound Duty Rates
databases. Both databases provide information at the legal tariff line level (8-digit in the HS
nomenclature), what we refer to as goods. They do not include goods subjected to non-ad
valorem duties.7 This leaves 9,303 goods. The WTO-CTS database provides information on
bound rates negotiated at both the Tokyo and the Uruguay rounds. Hence, CUTg corresponds
to the effective reduction in bound tariffs negotiated during the Uruguay round. The database
also provides information on the implementation period of bound tariff reductions that were
negotiated during the Uruguay round
In our analysis, we want to understand to what extent past multilateral trade liberalisation is a
factor towards current preferential trade liberalisation. A measure of the intensity of the
preferential trade liberalisation similar in spirit to CUT is the preference margin PM, defined
as the (non-negative) difference between the MFN tariff and the preferential tariff, or PMg,p ≡
6 See the World Tariff Profiles (2007).
7 Such tariff lines account for around 8% of the HS-6 subheadings of the World Tariff Profiles (2007).
10
MFNgUruguay – PTg,p, where PTg,p is the good- and partner-specific preferential tariff. We
exclude tariff lines for which the Uruguay MFN tariff was already zero, since no preference
margin can be granted for such goods by definition. This leaves us with our reference sample
that includes 7,419 goods. Figure 2 illustrates various features of the sample. No tariff line has
been included in fewer than four PTAs and the majority of them is part of all agreements
(dark bars). Variation is clearly higher when considering the implementation of duty free
access (light bars). Many tariff lines (35%) are always set to zero on the date entry into force
of the trade agreement. However, we also find some tariff lines (6%) which are set to zero
only gradually in all trade agreements.
The UNCTAD-TRAINS database includes MFN applied rates and preferential rates. The
informed period is 1996-2008. This exhaustive database covers fifteen PTAs, from which we
exclude the PTAs that were negotiated before the end of the Uruguay round (1994) so as to
eliminate an obvious source of reverse causality bias from our regressions (more on this in the
next section); we also exclude the unilateral PTAs, for the focus of our analysis is not
unilateral but preferential trade liberalisation or ‘regionalism’. We are thus left with seven
PTAs: Jordan (2001), Chile (2004), Singapore (2004), Morocco (2006), Bahrain (2006),
Australia (2005), and the Central American-Dominican Republic FTA (2006).8 In our
analysis, an ‘observation’ is a good-and-partner entry for PTg,p. Our reference sample has
51,814 observations, which is slightly lower than 7 x 7,419 = 51,933, because not all goods
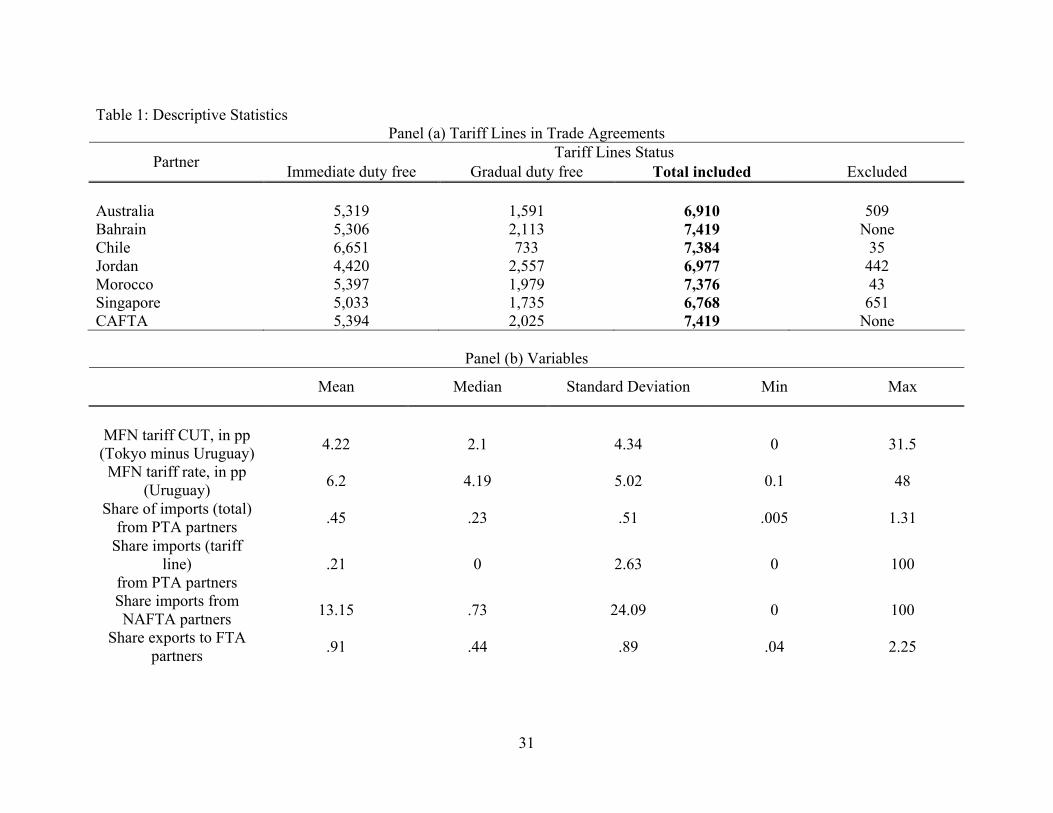
are included in all PTAs. Table 1 (panel a) breaks down the number of tariff lines included in
our reference sample by partner. Table 1 (panel b) presents the summary statistics of our
quantitative variables. For instance, the sample mean of CUTg is 4,22 percentage points.
8 That is, we exclude the Generalized System of Preferences (1976), Israel (1985), the Caribbean Basin
Economic Recovery Act (1986), the Andean Trade Preference Act (1992), NAFTA (1994), the Generalised
System of Preferences (GSP) for Least Developed Countries (1997), the African Growth and Opportunity Act
(2000, 2001, 2002), and the Caribbean Basin Trade Partnership Act (2000). See Romalis (2007).

11
It turns out that in the US case, each PTA is in fact a free trade agreement (FTA) de jure,
namely, the tariffs of all included goods all eventually go to zero. In our notation, this implies
that PT = 0 at the end of the so-called ‘implementation period’ (specified in the agreement).
By contrast, there is considerable variation in the timing of the implementation of this free
trade policy about both goods and partners: overall, 69% of our observations are fully
liberalised at the start of the implementation of the FTA, whereas goods that are included in
any of the FTAs but that are liberalised only gradually represent 27% of our observations; the
rest consists of good-partner pairs that are excluded from the corresponding FTA altogether
(fewer than 4% of observations).
We also use the information available in the TRAINS database for non tariff measures
(NTM). We focus on NTMs classified as Technical Measures in the UNCTAD Coding
System of Trade Control Measures (chapter 8). This covers inter alia both sanitary and phyto-
sanitary (SPS) and technical barriers to trade (TBT) type of measures. Data are available only
for the year 1999. Our control variables include imports at the tariff line; this information is
also provided by UNCTAD-TRAINS. Table 1 (panel b) reports the summary statistics of the
share of imports at the tariff line level that are covered by a preference margin as well as of
the other controls.
4. ESTIMATION STRATEGY AND ESTIMATION RESULTS
At a very general level, we would ideally like to regress the preference margin on the
multilateral CUT, that is, estimate an equation of the form
pggpg CUTPM ,, (1)
The ‘emulator effect’ predicts a positive , whereas a negative would be consistent with a
dynamic version of the ‘money left on the table hypothesis’.
The problem with a naïve estimation of (1) is that the US institutional setting is such that a
Preferential Trade Agreement is de jure a Free Trade Agreement. This makes using the
intensive margin of preferential trade liberalisation as the dependent variable problematic (at
the end of the implementation period PT = 0, hence PM boils down to MFNUruguay by
12
definition). For this reason we exploit instead its extensive margin and the timing of the
preferential liberalisation. Our first cut through the data is to set goods that are granted duty
free access to the US market immediately upon implementation of each of the seven FTAs in
the sample apart from other goods. The idea is that these goods are the easiest to liberalise on
a preferential basis and we want to understand the dimensions that make such goods special.
Inspection of FIGURE 2 also shows that the most frequent number of times a good is granted
‘immediate duty-free access’ (IDA) to the US market is the maximum (seven). For these
reasons, we create a binary variable for each good g, SEVEN, with SEVENg = 1 if good g is
granted IDA status in all the seven FTAs and 0 otherwise (i.e. if the good is granted only
gradual duty-free access in, or excluded altogether from, at least one FTA); formally,
7 ,I # : 0implg g pSEVEN p PT , where impl denotes the implementation year and I7{
.} denotes
an indicator function that takes value 1 if its component is equal to seven and 0 otherwise.9
We also create two additional measures along those lines, the binary variable ONEg that takes
value 1 if good g gets IDA status in at least one FTA and 0 otherwise and the count variable
NTLg that counts the number of FTAs in which g gets IDA; these being mostly robustness
checks, we postpone the regression results for ONEg and NTLg to Section 6.
As our second measure of the extensive margin of preferential trade liberalisation, we define a
good- and partner- specific measure of preferential trade liberalisation for our central
specification that takes value 1 if imports of good g from partner p are granted the IDA status
upon implementation of the FTA in question and zero otherwise.
We include the most-favoured-nation (MFN) tariff rate in application MFNg in all
specifications. The motivation for doing this has to do with testing the static version of the
‘money left on the table hypothesis’, whereby there is more room to include a tariff line in a
PTA if the MFN rate is relatively high to start with. Let us emphasize that MFNg is orthogonal
to CUTg (the correlation is -.01 in our reference sample) so including it or not does not affect
9 A comment about goods-partner pairs that do net get the IDA status is in order here. Goods g that are included
in the PTA p but that are liberalised only gradually and goods that are excluded from that PTA altogether are
both coded the same way. This is because the frequency of the latter in the data is very low (less than 5 percent
of good-partner pairs). Our qualitative results do not change if we drop these observations from the sample.

13
the estimated coefficient 1. This somewhat surprising feature of the data is also helpful for
our identification strategy and we return to it shortly.
4.1. Evidence at the good level: Logit
We start by running the following logit:
( ) 1 2Pr{ 1} g G g g gSEVEN f CUT MFN g,pX β , (2)
where ( ) exp( ) / 1 exp( ) is the logistic cumulative distribution function, fG(p) is sector
dummy, CUT is the reduction in the MFN tariff negotiated over the course of the Uruguay
round (in percentage points), MFNg is the ad-valorem Uruguay MFN tariff rate (in percentage
points) and Xg,p is a set of additional controls; 1 is our coefficient of interest. Denote the set
of all goods by 1,..., gN ; then G is a partition of and we use ( )G g to denote the HS-2
sector in which good g is classified. Thus, G is also a mapping : good sectorG .
Though we view (2) as a closed form relationship between PTL and CUT, we must assume
that gCUT is exogenous in order to obtain consistent and unbiased estimates of the
coefficients. Our strategy to rid ourselves of the reverse causation bias rests on the timing of
events. We limit our sample to the seven PTAs that entered into force after the conclusion of
the Uruguay round in 1994. This sample selection is expected to eliminate any reverse-
causality bias for two main reasons: first, no new multilateral trade agreements had been
implemented by the US between 1994 and 2000. This buffer is likely to be long enough to
ensure that these trade agreements to come did not influence the Uruguay Round trade
negotiators. The second reason reinforces this point: no trade agreement signed in the post
Uruguay round period had actually been negotiated during the pre-Uruguay round period. The
Clinton administration did undertake talks to form a Free Trade Area of the Americas (FTAA)
and to sign a trade agreement with the Asian Pacific Economic Cooperation (APEC) country
members in 1994. However, no agreement has yet been reached in the context of FTAA
negotiations. In addition, the APEC forum held in Bogor in 1994 signed a declaration to work
toward free trade in the region by 2010 for developed countries and by 2020 for all member-
countries. A sixteen-year time frame makes any influence of those talks on tariff cuts defined
14
the Uruguay round quite implausible.10 Note that the absence of correlation between CUT and
MFN is also helpful: it implies that the past determinants of trade liberalisation (at the good
level) that cumulated to give rise to the Tokyo tariff level are different from those that led to
the Uruguay Round tariff cut: in line with the Juggernaut hypothesis, this suggests that the
sectoral determinants of tariffs are not as long-lived as one might think. However, if an
omitted variable affects PTL and CUT simultaneously then regressing the former on the later
will cause a spurious correlation. We thus introduce sector dummies ( )G gf in (2) to capture
sector invariant sources of unobserved heterogeneity, like the political economy determinants
of tariffs (e.g. lobbying), as suggested in our theoretical discussion in the introduction, or the
determinants of comparative advantage. Insofar as such unobserved shocks are common to
goods within sectors, then including ( )G gf in (2) corrects for this source of omitted variable
bias in our cross section exercise.11 Together, these three working assumption constitute our
maintained identification hypothesis. We complement them with additional approaches in
Section 5.
We use sector fixed effects at a relatively high degree of aggregation so that our sample has a
large number of observations for each partner p and for each sector G; as a result, the β’s in
the conditional logit in (3) are consistently estimated.
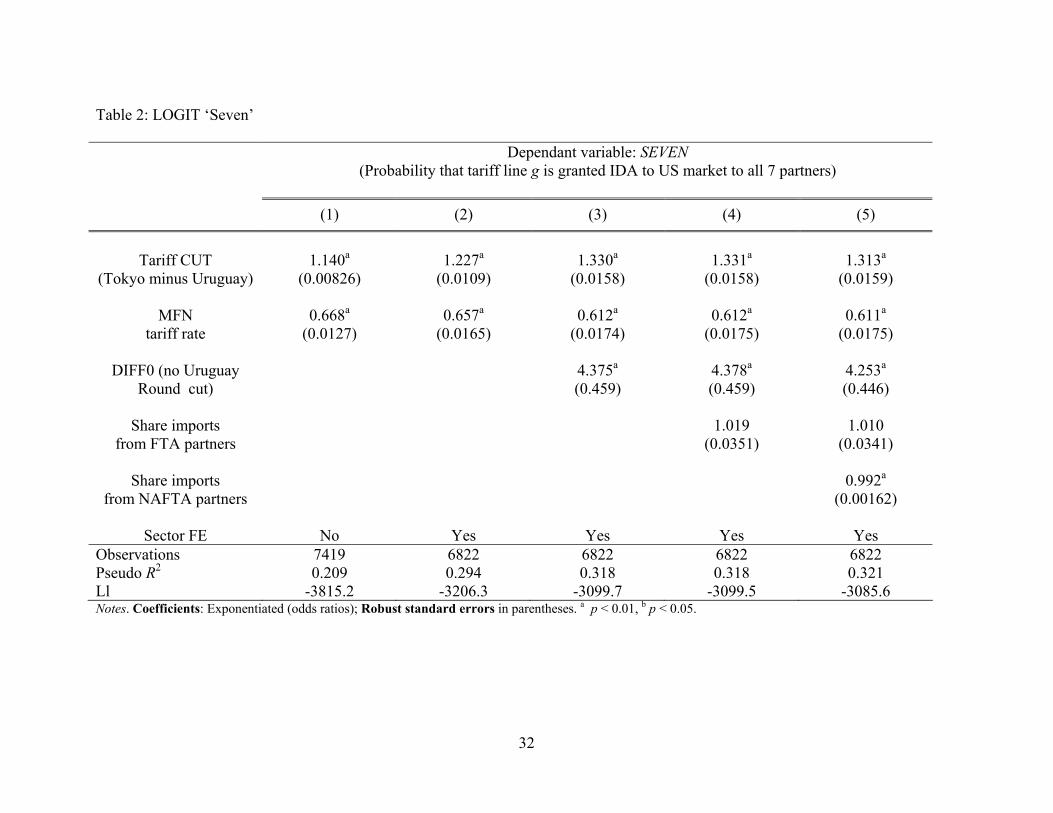
Table 2 presents the results. We report odds ratios throughout. The odds ratios associated to j
is defined as exp j (j = 1,2,...) and has the meaning that a one extra percentage point in CUT
raises the probability of granting IDA status to all partners for the good in question by a factor
1exp relative to not including the tariff line or delaying setting this preferential tariff to zero.
The two independent variables of interest, CUT and MFN, are significant beyond the one
10 What is usually recognized is that the APEC summit together with NAFTA helped "squeeze the European
Union to complete the Uruguay round of GATT" in the words of Robert Zoellick’s (2001) statement as US
Trade Representative.
11 See also Broda, Limão and Weinstein (2008) on this.
15
percent level in all specifications and the results are stable across specifications. The
regression in Column (1) includes the two independent variables and Column (2) adds sector
dummies. The findings are consistent with the emulator hypothesis: the odds ratio implies that
one extra percentage point of CUT raises the probability that good g gets IDA treatment for
all US’s FTA partners by almost a fourth (1.227 – 1 = .227) relative to getting it only for a
subset of those. By contrast, the ‘money left on the table’ hypothesis is rejected by the data:
raising the MFN tariff by one percentage point decreases the odds that good g gets IDA status
by a third (1 – .657 = .343).
In Column (3), we add a good-specific dummy DIFF0 that takes value DIFF0g = 1 if the US
did not liberalise good g during the Uruguay Round (i.e. if CUTg = 0) and zero otherwise.12
That is, we estimate
( ) 1 2 3Pr 1 0g G g g gSEVEN f CUT MFN DIFF .
The fact that goods that were not liberalised during the Uruguay round – because these sectors
are better organised and successfully fought to be left out of the Uruguay round entirely, say –
might be quite different from other goods motivates this specification. The coefficient 3 is
positive at the one percent level, implying that goods that were not liberalised at the
multilateral level were more likely to be liberalised at the preferential level: this is consistent
with a dynamic version of the ‘money left on the table hypothesis.’ Adding this control also
raises the odds ratio of CUT to 1.33. Thus, the effect of CUT on IDA is ‘non-linear’: the US
grants IDA status more frequently for goods for which the Uruguay Round CUT was zero as
well as for those that had a large CUT. The net effect is consistent with the emulator
hypothesis by our finding reported in Table 2, Col. (2).
The results reported in Columns (4) and (5) show that these qualitative findings are robust to
the inclusion of several controls. Column (3) introduces the import share of all seven partners
in the US’ total imports of good g, defined as , /g g p gpSM M M (where M denotes the
value of imports), to control for the possibility that the US might be granting IDA access to
12 This is verified for 21.8% of the tariff lines in our reference sample.
16
prominent exporters more easily. The estimated coefficient in Col. (4) is statistically
insignificant: thus, the US does not seem to discriminate between large and small exporters
when granting IDA status.
Column (5) adds SNAFTA to the set of controls, with SNAFTA being defined as the good-
specific import share of NAFTA products, i.e. , /g g NAFTA gSNAFTA M M . Its coefficient is
statistically negative at the one-percent level (its odds ratio is lower than unity), implying that
the US is less likely to grant IDA status from markets that NAFTA already penetrates widely.
This suggests that NAFTA and ensuing FTAs are substitutes, that is, NAFTA worked as a
‘stumbling block’ to post-Uruguay Round regionalism.
4.2. Evidence at the good-partner level: logit
The evidence so far indicates that CUT and MFN influence the extensive margin of
preferential trade liberalisation. The evidence portrayed is at the good level. However, we can
address a more demanding question to the data: given some other good characteristics
(observable or not), how do CUT and MFN influence the likelihood that the US grants IDA
status to partner p’s exports of good g to the US? For this purpose, we create a good-partner
indicator variable, , ,I 0implg p g pIDA PT , that takes value 1 if partner p gets immediate duty-
free access to the US market for good g and zero otherwise. We then estimate the following
logit:
, ( ) 1 2Pr 1 ,g p p G g g gIDA f f CUT MFN g,pX β (3)
where fp is a partner dummy and the other right-hand side variables are as in (2).13 Running
(3) is similar to running (2) at the good-partner level. The implicit assumption in (3) is that the
functional form that maps the right-hand-side variables into IDA is symmetric for each
partner. As we shall see, though, the effect of CUT on IDA is non-linear. For this reason, we
13 Preferential trade Agreements can be motivated by non trade objectives as argued in Limão (2007). The
inclusion of partner dummies in specification (3) absorbs any effect possibly related to such non trade objectives.
17
consider running (3) as a conservative robustness check that provides a lower bound for the
emulator effect and the other effects we control for.
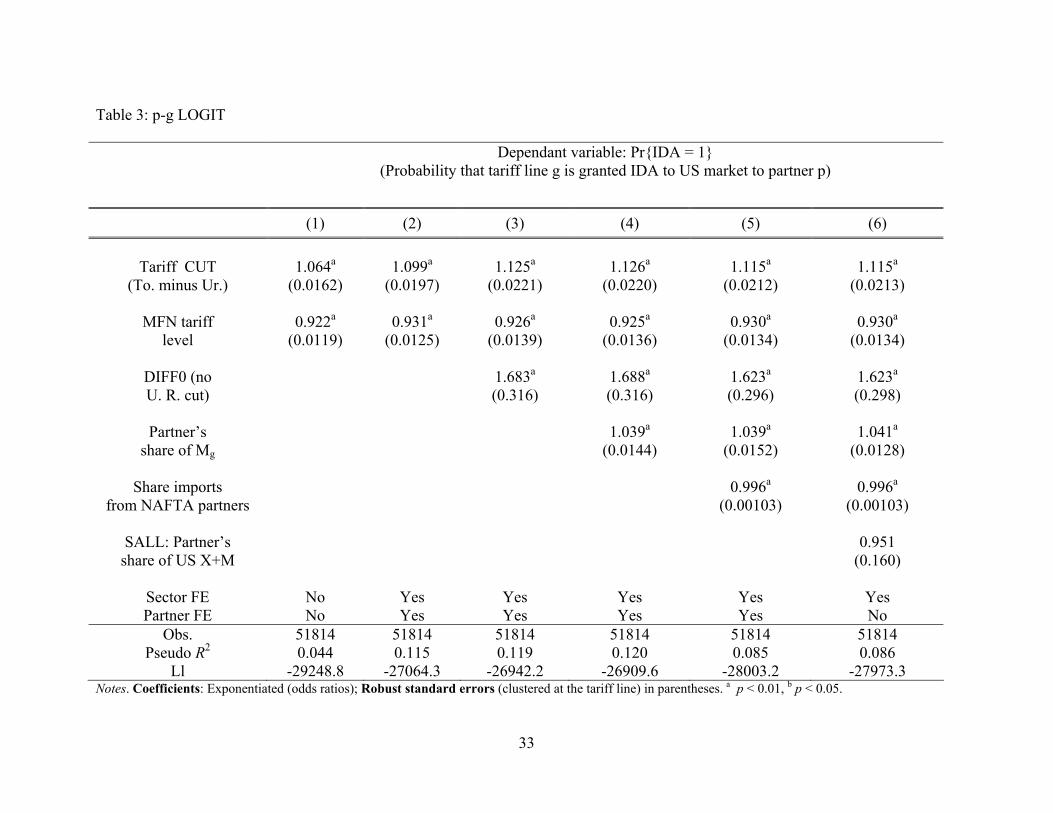
With this caveat in mind, turn to Table 3, which reports the results (standard errors clustered
at the tariff line in parenthesis). The qualitative results are in line with those of Tables 2. The
coefficients for CUT, MFN, DIFF0 and SNAFTA are still precisely estimated and they have
the expected sign.
Running (3) enables us to control explicitly for partner and good-partner characteristics. Thus,
let , , /g p g p gSM M M define the share of good-g imports that are sourced in country p. What
are our priors on the sign of its coefficient? In Grossman and Helpman’s (1994) ‘protection
for sale’ (PFS) framework, keeping the elasticity of imports and the domestic production
constant (both vary across goods but are constant across partners), protection decreases in the
volume of imports (which does vary across partners) in organised sectors. In non-organised
sectors, the opposite is true. Estimation of
, ( ) 1 2 3 4 ,Pr 1 0g p p G g g g g g pIDA f f CUT MFN DIFF SM
includes neither domestic production nor import elasticities. The former omission is harmless:
for each good, there are several import sources (the partners) and possibly a different PT for
each of them; this enables us to estimate 4 via the cross-sectional variation of SM along the
p-dimension. The latter, however, introduces measurement error in the estimation of 4. Also,
the left-hand side of the structural PFS model is different from the LHS of (3). With these
caveats in mind, the estimated coefficient in column (5) of Table 3 is statistically positive at
the one-percent level. This is consistent with the PFS qualitative prediction for organised
sectors. This finding is important for the interpretation of the emulator effect as evidence of
the juggernaut mechanism. The estimated odds ratio corresponding to 4 is equal to 1.04,
which implies that an increase in the import penetration ratio of the pair (g, p) by 1 percent
increases the odds of the US granting IDA status to p’s exports of good g by 4 percentage
points. In other words, the US grants IDA status disproportionately to important import
sources. The estimated coefficient is stable across specifications.
18
We might also expect the US to grant tariff-free access to important trading partners as part of
broader foreign and trade policy objectives. To check whether this intuition is verified in the
data, we introduce the Partner’s share of imports across all tariff lines as a an additional
control in (3), namely , /p g pgSMALL M M , as well as the US’ share of exports towards
p, defined as , /p g pgSXALL X X , where X denotes exports. In the same spirit, we also
create pSALL as , ,( ) / ( )p g p g pgSALL M X M X as an overall measure of the
importance of p as a trading partner for the US. SALL, SMALL and SXALL are defined at the
partner level, so we drop the partner dummy in these regressions. Column (6) reports the
results for SALL (the results for SMALL and SXALL are similar so we omit them). The
estimated coefficient is statistically indistinguishable from zero, rejecting the hypothesis that
the US grants free access to its markets disproportionately to large partners.
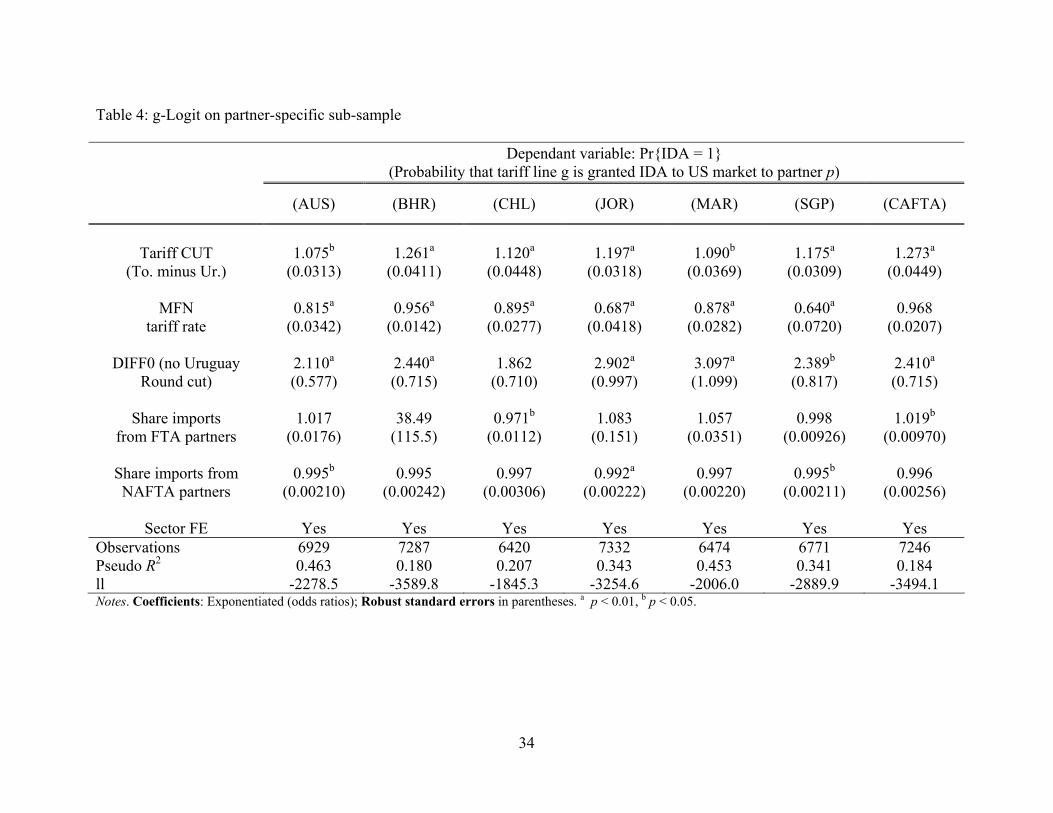
Finally, we re-run (3) for each partner separately (more precisely, the specification
corresponding to Table 3, Col. 5). Table 4 reports the results. The coefficients of CUT and
MFN have the expected signs. The emulator effect is economically and statistically weakest
for Australia and Morocco and especially large for CAFTA. The ‘money left on the table
hypothesis’ is rejected in all cases, albeit only in a weak sense in the case of CAFTA.
5. IDENTIFICATION OF THE ‘EMULATOR EFFECT’
The ‘emulator’ effect seems to be a robust feature of the data, unlike the ‘money left on the
table’ argument. We have so far relied mostly on the timing of events to identify the effect. In
this section, we use the interaction between our variable of interest (CUT) and non-tariff
measures (Section 5.1), the rules of origin (Section 5.2) or the type of goods (Section 5.3) to
interpret the positive correlation between CUT and IDA in a causal way.

19
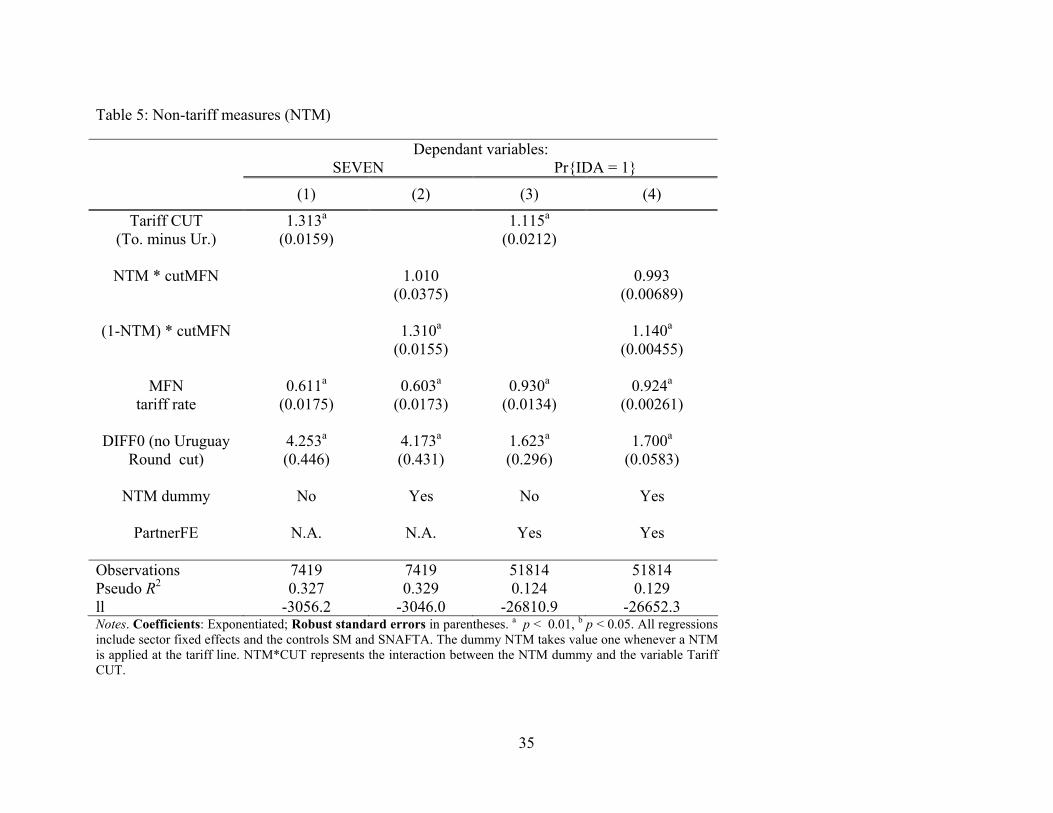
5.1. Non-tariff measures
We start by controlling for the presence of non tariff measures, or ‘NTM’, at the tariff line.14
The idea is that the presence of such non-tariff measures should weaken the effect of CUT on
preferential liberalisation: a multilaterally agreed tariff cut is less effective if the imports of
that good are impeded by other measures. We thus expect the CUT coefficient to be larger for
NTM-free goods than for goods with some NTM. To test this idea, we create a dummy
variable NTMg that takes value one if the tariff line g has some NTM and zero if g is NTM-
free.
We first re-run (2), adding the NTM dummy and its interaction with CUT. Table 5, Col. (2)
reports the results; these have to be compared with Col. (1), which reports the odds ratios of
our baseline specification (Table 2, Col. 5). As expected, the CUT coefficient for NTM-free
goods is (much) larger than for NTM goods; the difference is significant at any conventional
level. The coefficient for CUT in goods with non-tariff measures is insignificant (the odds
ratio is one). This finding is exactly what we should expect if multilateral and preferential
tariff cuts are dynamic complements and if the presence of NTMs prevents the emulator effect
from playing its role. We repeat this exercise for the good-partner specification (3) and the
results, reported in Table 5, Col. (4), do not affect these conclusions.15 These findings thus
vindicate our emulator hypothesis further. By contrast, the odds ratio of MFN falls,
weakening further the ‘money left on the table hypothesis’.
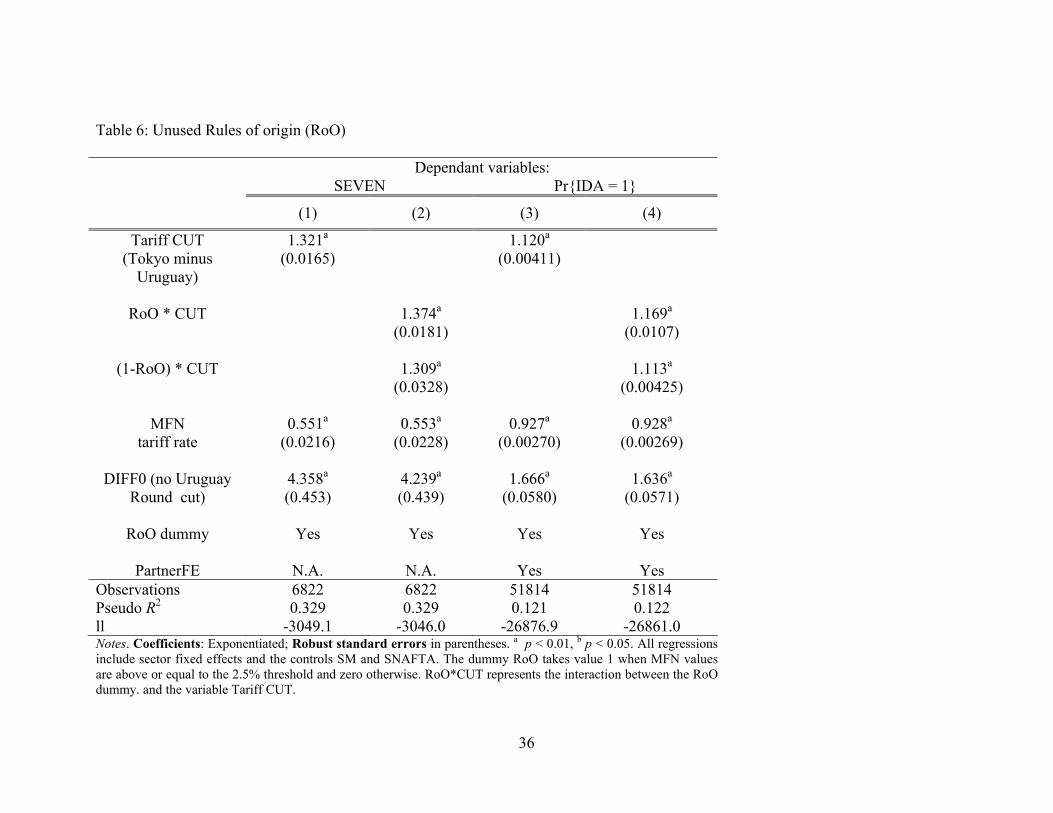
5.2. Unused rules of origin
It is well-known that the compliance costs of rules of origin (RoO henceforth) can be
prohibitive (Krishna 2006). Specifically, when the preference margin is low, foreign exporters
might not bother with complying with rules of origin. In our setting, the preference margin is
14 There are 19% of tariff lines with an NTM in our reference sample.
15 Table 5, Col. (3) reproduces Table 3, Col. (5) to ease comparison.
20
the MFN tariff rate. If the emulator effect is the manifestation of an actual economic
mechanism whereby trade agreements are dynamic complements, then we expect the
coefficient of CUT to be higher for the goods where the rules of origin are actually exploited
by foreign exporters. Preference margins are irrelevant when below 2 to 3 percentage points
(Estevadeordal et al. 2008). We expect the CUT coefficient to be larger for RoO-goods than
for goods that have irrelevant rules of origin. To identify this differential effect in the data, we
construct a dummy variable RoOg that takes value 1 if MFNg > 2.5 (when foreign exporters
are expected to use the preference and thus to comply with the rules of origin) and zero
otherwise and we re-run (2) and (3) with this dummy as an additional control variable.
Table 6, Col. (2) reports the results for (2), which have to be compared with those of the
baseline specification, reproduced in Col. (1). The results are supportive of the emulator
hypothesis: as expected, the CUT coefficient is larger for the goods for which it maters than
for goods with an irrelevant preference margin. By contrast, the coefficient and the odds ratio
for MFN shrink noticeably, rejecting the ‘money left on the table hypothesis’ further.
Table 6, Col. (4) reports the results for (3), which have to be compared with those of Col. (3).
Here, the results are as again supportive; the Wald statistics rejects the hypothesis that the
coefficients are the same at the one percent level. We have re-ran (2) and (3) with 2 and 3
percentage points as thresholds (results not reported); the qualitative results were not affected.
In sum, the differential effect of CUT on granting IDA status for goods affected by rules of
origin or non-tariff measures that we find in the data confirms this set of predictions of the
emulator hypothesis.
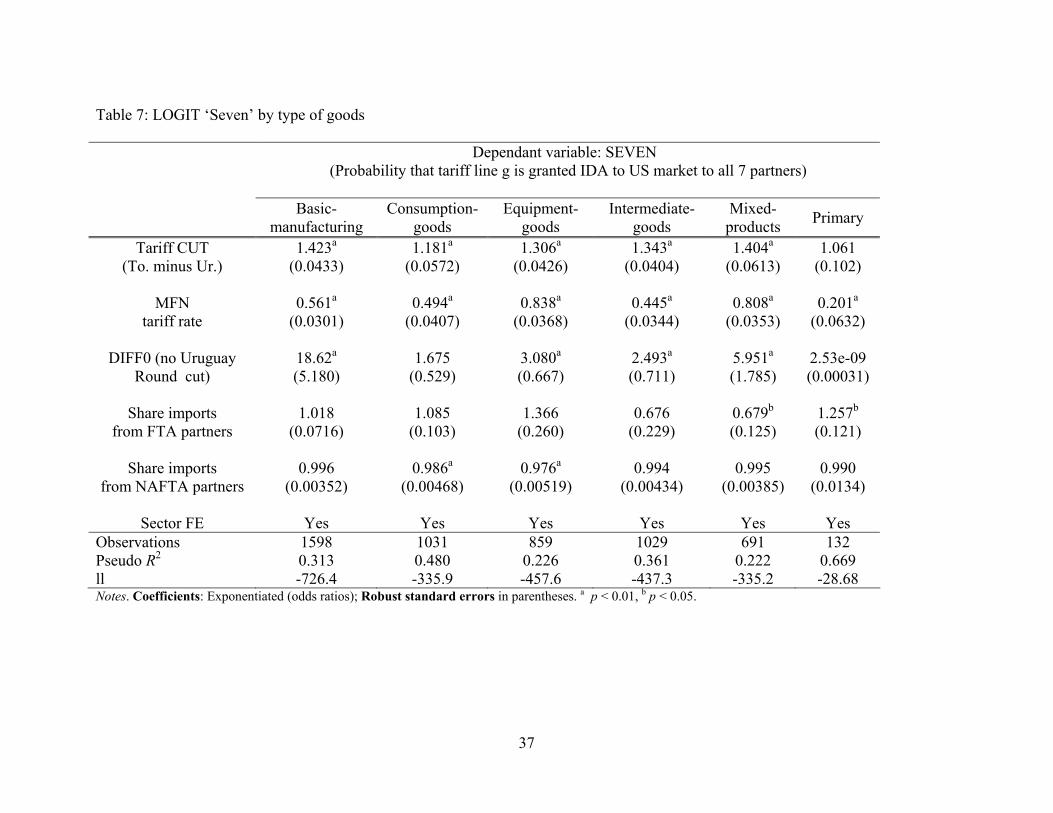
5.3. The role of intermediate goods
As we shall see in Section 6, the emulator effect is non-linear. Specifically, the largest
emulator effect is between granting this preferential access to all partners or not, rather than
between some partners or none. This in turn suggests that the type of goods might be more
important than the partners’ characteristics; also, when we include sector dummies in our
regressions, the coefficients of interest tend to rise in a significant way, suggesting that
21
unobserved sector-invariant characteristics are indeed important. Therefore, we split the
sample among the following categories of goods that correspond to different stages of
production in the value chain: Basic manufacturing, Consumption goods, Equipment goods,
Intermediate goods, Mixed products and Primary goods and we estimate one β1 for each
category in our baseline regression (with MFN and DIFF0 as controls). Table 7 reports the
results. The estimated coefficients are positive and significant at the one percent level in all
cases but for consumption and primary goods, for which it is insignificant. It is particularly
strong for equipment and intermediate goods and weakest for consumption and primary
goods.
These results also are helpful in the quest of identifying the emulator hypothesis. To see why,
recall that in our interpretation of the dynamic complementarity between trade agreements,
past trade liberalisation in a given sector undermines its current resistance to trade openness
because trade liberalisation decreases the (quasi) rents associated with the (quasi) fixed
factors that fight for protection. Over time, these factors depreciate and with them the
resistance to trade liberalisation. By the same logic, downstream sectors oppose tariffs in
upstream sectors from which they source, and this opposition increases as downstream tariffs
fall; also, upstream sectors that sell domestically have an interest in keeping downstream
tariffs high (Gawande, Krishna and Olarreaga 2009). As a result, we expect the emulator
effect to be strongest in upstream sectors, weakest in downstream sectors and somewhere in
between for ‘Mixed’ goods. With the exception of the ranking of Mixed goods, this is what
we find in Table 7. The emulator effect is weakest for Primary, Consumption and Basic
manufacturing goods; it is statistically much stronger for Equipment and Intermediate goods.
6. SENSITIVITY ANALYSIS
In this section we subject our results to a variety of robustness checks. We start by running
alternative specifications to (2); as we shall see, these establish that the emulator effect is non-
linear.

22
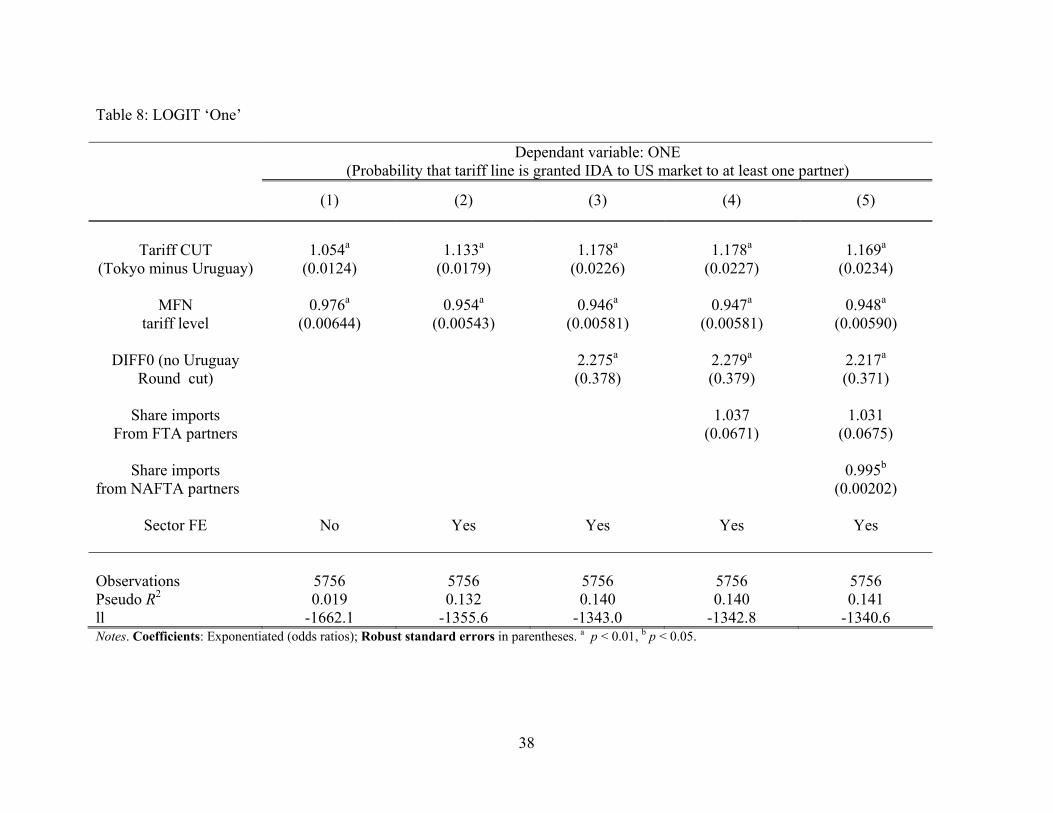
6.1. Evidence at the good level: Alternative logit
In our quest for the effects of CUT on the IDA status of goods, specification (2) with SEVEN
as the dependent variable is quite conservative insofar as it lumps together goods that are
excluded from all FTAs altogether with goods that are granted IDA status in all but one FTA.
Other categorizations of the data are possible.
Our first robustness check is to run a logit that is the mirror image of (2):
( ) 1 2Pr 1 g G g g gONE f CUT MFN g,pX β , (4)
where ONE takes value one if the specific good gets IDA status into the US market in at least
one FTA and zero otherwise (i.e. 0 ,1 I # : 0implg g pONE p PT , where I0{
.} denotes an
indicator function that takes value 1 if its component is equal to zero and value 0 otherwise).
We report the results in the Table 8, which is symmetric to Table 2 (same set of controls,
same estimator). Qualitatively, all the findings are similar to those of Table 2. Quantitatively,
the positive effect of CUT and the negative effects of MFN, DIFF0 and SNAFTA in (4) are
smaller (in absolute value) than in (2). The odds ratio corresponding to the coefficient of
interest 1 is ranges from 1.13 in the baseline specification to 1.17 with the DIFF0, SM and
SNAFTA controls, implying that an additional one-percentage point multilateral tariff CUT is
associated with a 13 – 17 % increase in the odds of including the good in the group of IDA
goods. Though quite strong, the effect of CUT on ONE is weaker than its effect on SEVEN.
This suggests that the domestic resistance to preferential trade liberalisation is decreasing in
the number of IDA statuses being granted at the margin.
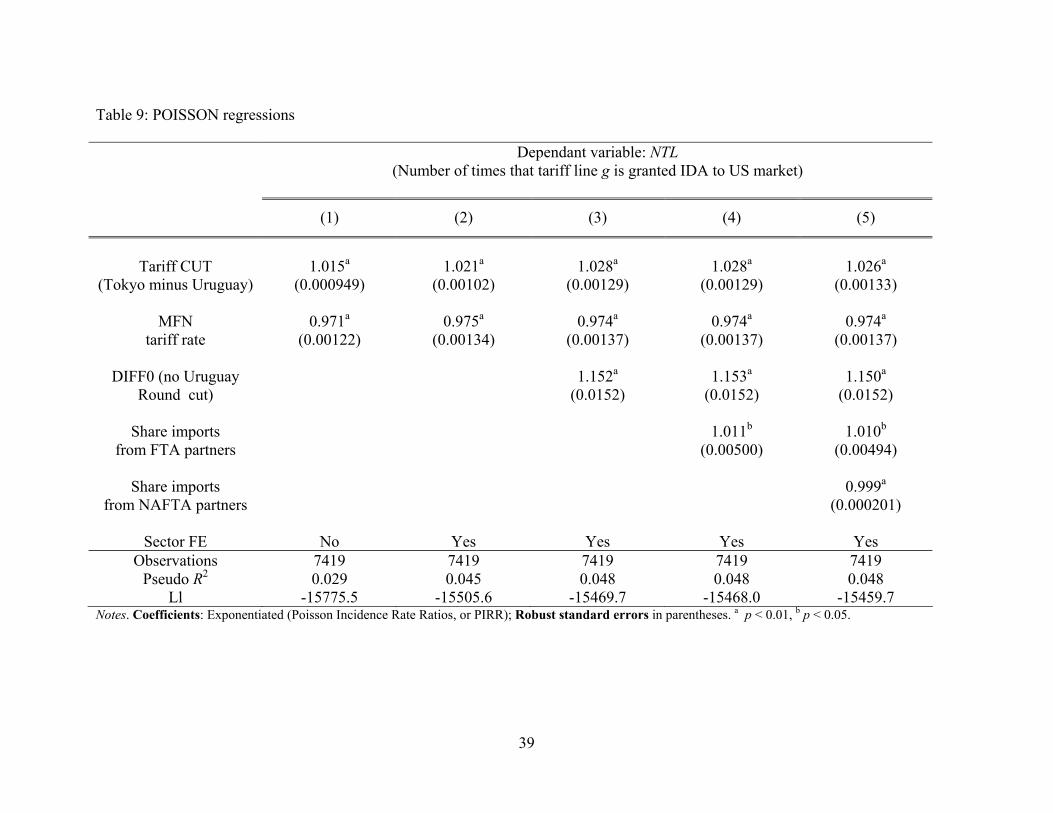
6.2. Evidence at the good level: Poisson
A natural alternative to (2) and (4) is to regress the number of times good g is being granted
IDA status, defined, as ,#{ : 0}implg g pNTL p PT , on our list of control variables. This
23
alternative measure of the extensive margin of the ‘emulator effect’ is a count variable, so we
run the constant semi-elasticity model (Poisson regression)
( ) 1 2E , , expg g g G g g gNTL CUT MFN f CUT MFN g,p g,pX β X β , (5)
with one observation per good g.
Table 9 presents our findings. The results are consistent with those of Tables 2 and 8.
Columns (1) and (2) report the results of specification (5), respectively excluding and
including the sector dummies fG(g), excluding any other control,. The coefficients are precisely
estimated. In column (2), the Poisson incidence rate ratio (PIRR = exp 1) is equal to 1.02,
implying that an extra one percentage point CUT increases the expected number of times that
the good in question is granted IDA status by two percents. The PIRR rises to 1.03 when we
add the additional controls of columns (3) and (4) (our preferred specification). The effect is
not strong quantitatively but it is statistically significant and robust.
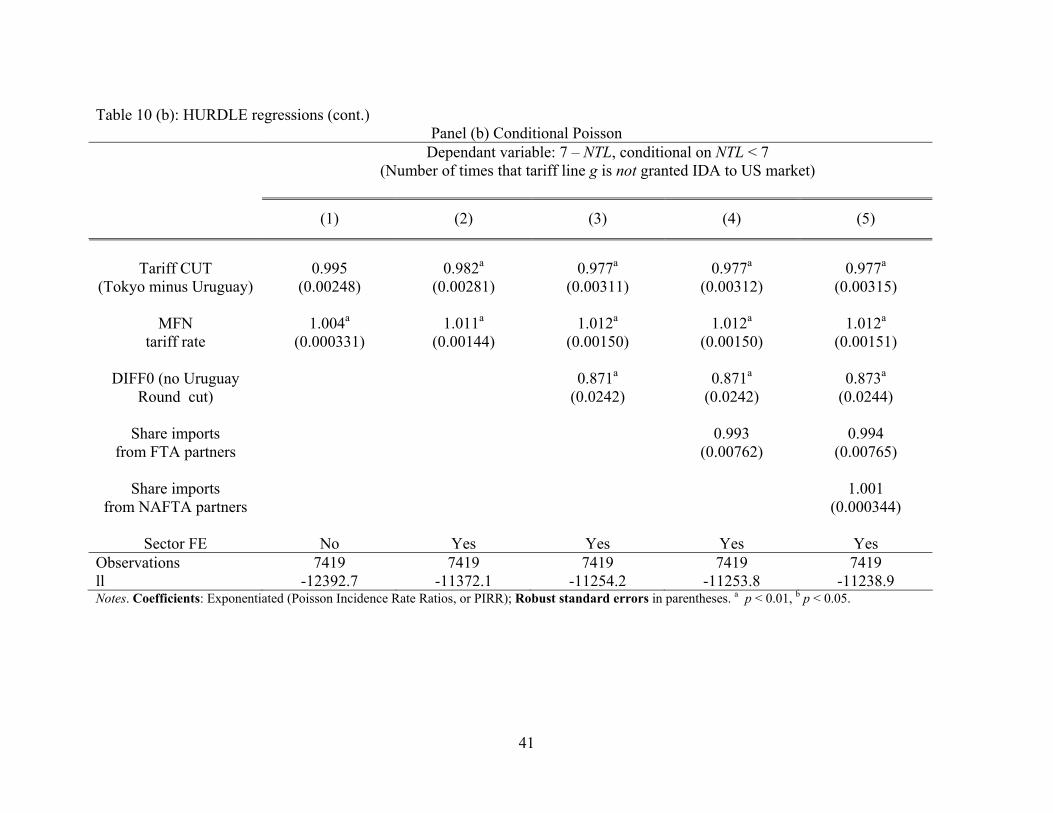
6.3. Evidence at the good level: Hurdle
We verify that the effect of CUT on the extensive margin of preferential trade liberalisation as
captured by the IDA status is non-linear by implementing a two-stage Hurdle regression. The
first step is a logit that is the mirror image of (2),
( ) 1 2Pr{ 0}g G g g gSEVEN f b CUT b MFN g,pX b , (6)
and the second step is the conditional Poisson regression:
( ) 1 2E 7 0; exp .g g G g g gNTL SEVEN f c CUT c MFN g,pX c (7)
For instance, b1 informs us about the extent to which one extra percentage point of CUT for
good g is associated with a reduction of the likelihood of that good of being granted IDA
status to all seven partners and, failing this, c1 says how this extra percentage point cut
24
reduces the likelihood of good g being included in one extra FTA. In line of our previous
findings, we expect b1 to be negative (and b2 to be positive).
The results of the first step (6) are reported in Table 10, panel (a). As expected, the
exponentiated coefficients are the mirror image of those of Table 2 (the values of 1j in
tables 2 and 5 are comparable for all j = 1,2,…) and thus require no further discussion.
Likewise, the results for the second step (7) are comparable to those of (5) by the same token.
They also confirm our priors, in line with our earlier finding, that most of the emulator effect
is captured by SEVEN. The economic significance of the coefficients is small (though all
coefficients are statistically significant at the one percent level with the exception of SM,
which is significant at the five percent level).
Taken together, the findings of Tables 2 and 8 to 10 imply that the manifestation of the
emulator effect is non-linear and most strongly felt between granting 7 IDA statuses and 6
IDA statuses or fewer.
6.4. Interaction between CUT and MFN
Finally, we interact CUT with MFN in all the specifications above. The motivation for this
exercise is to further distinguish between the ‘money left on the table hypothesis’ and the
emulator effect. Indeed, it could be said that current preferential IDA is a substitute to current
multilateral liberalisation; put differently, it could be that the dynamic complementarity
between past (multilateral) cuts and current (preferential) liberalisation that we have
uncovered so far hides a static substitution between multilateralism and regionalism. If that
‘static substitution’ hypothesis was true, then we should expect the effect of CUT on IDA to
be strongest where there is more room for manoeuvre, that is, where MFN tariff rates are
largest. In order to verify this empirically, we re-run all the baseline specifications above with
an interaction term.
25
Table 11 reports the results. The first thing to note is that the coefficient of MFN * CUT is
strongly negative (its odds ratio is lower than unity), which rebukes this hypothesis. Second,
comparing the results of Table 11, Col. (1), (2), (3) and (4) to Col. (5) in Tables 2, 3, 8 and 9,
respectively, adding this interaction term increases the coefficient on CUT and reduces the
coefficient on MFN. Results obtained with the Hurdle estimation strategy largely confirm
these patterns.
We interpret all these results as adding extra pieces of evidence if favour of the emulator
hypothesis and against the alternative money left on the table hypothesis.
7. SUMMARY AND CONCLUDING REMARKS
This paper investigates the empirical relationship between cuts in MFN bound rates
negotiated during the Uruguay Round of the GATT (1986-1994) and the depth and breadth of
Preferential Trade Agreements signed in the aftermath of its completion. Our empirical
investigation focuses on the United States using official tariff line level data. To the best of
our knowledge, our paper is unique in looking at the causal relationship from multilateralism
to regionalism. The existing empirical literature is exclusively looking at the relationship
running the other way. This line of research is motivated by the view expressed in numerous
theoretical contributions that regionalism may have a ‘stumbling block’ effect on multilateral
trade liberalisation (Bhagwati 1991). If the stumbling block hypothesis is correct, then the
proliferation of PTAs involving at least one WTO member is guilty of slowing down and
threatening the ‘Doha round’ of negotiations at the GATT/WTO. A related and pessimistic
received wisdom, which runs in the other direction, is that the explosion of regionalism is a
symptom of the difficulties encountered by the Doha round.
The main findings of the paper are that (i) the imports of goods that the US liberalises swiftly
the most frequently on a preferential basis are also the goods for which it granted the largest
MFN tariff reductions during the Uruguay Round, (ii) this effect is robust qualitatively but
varies across the types of goods being stronger for goods in upstream sectors and weaker for
goods in downstream sectors, (iii) it holds only for goods that have no alternative import
restrictions in the form of Non Tariff Measures, (iv) it is weaker for goods with prohibitively
costly Rules of Origin.
26
We interpret these findings as evidence that multilateral tariff ‘concessions’ are dynamic
complements to preferential treatment of FTA partners. Such dynamic complementarities
between sequential rounds of trade liberalisation are consistent with the ‘Juggernaut’ theory
of trade liberalisation. This theory stresses the role of domestic sluggish adjustments to
account for the systematic, monotonically decreasing trade barriers of the modern trading
system.
To conclude, we can state that the past success of multilateralism is at least partly responsible
for the current wave of US regionalism. Crossing this with the results of Limão (2006), who
found that preferential trade liberalisation prior to the completion of the Uruguay Round was
a stumbling block to multilateralism in the US case, we may thus conclude that the difficulties
encountered by the Doha round might in part be the indirect result of the success of the
Uruguay round.
REFERENCES
Aghion, P., Antràs, P., and Helpman, E., 2007. Negotiating Free Trade. Journal of International Economics 73, 1-30.
Bagwell, K., and Staiger, R. W., 1998. Will Preferential Agreements Undermine the Multilateral Trading System? Economic Journal 108, 1162-1182.
Bagwell, K., and Staiger, R. W., 1999. Regionalism and Multilateral Tariff Cooperation, in: Piggott, J. and Woodland, A. (Eds.), International Trade Policy and the Pacific Rim, St. Martin’s Press, New York.
Baldwin, R.E. 2009. Trade negotiations within the GATT/WTO framework: A survey of successes and failures. Journal of Policy Modelling 31, 515-525.
Baldwin, R.E. 1995. A domino theory of regionalism, in: Baldwin, R.E., Haaparanta, P., Kiander, J. (Eds.), Expanding Membership in the European Union. Cambridge University Press.
Baldwin, R.E. 1994. Towards an Integrated Europe. London U.K., CEPR.
Baldwin, R.E., and Robert-Nicoud F., 2007. A Simple Model of the Juggernaut Effect of Trade Liberalisation. CEPR Discussion paper No.6607.
Baldwin, R.E., and Seghezza, E., 2008. Are Trade Blocs Building or Stumbling Blocks? New Evidence. CEPR Discussion paper No. 6599.
Bhagwati, J., 1991. The World Trading System at Risk. Princeton University Press, Princeton, New Jersey.

27
Baier S. L. and Bergstrand J. H., 2004. Economic Determinants of Free Trade Agreements. Journal of International Economics 64 (1), 29-63.
Brander, J., Krugman, P., 1983. A ‘reciprocal dumping’ model of international trade. Journal of International Economics 15, 313–323.
Broda, C., Limão, N. and Weinstein, D. 2008. Optimal Tariffs and Market Power: The Evidence. American Economic Review 98(5), 2032-65.
Cadot, O., de Melo, J. and Olarreaga, M., 1999. Regional Integration and Lobbying for Tariffs against Non-Members. International Economic Review 40, 635-657.
Egger, P. and Larch, M. 2008. Interdependent Preferential Trade Agreement Memberships: An empirical analysis. Journal of International Economics 76(2), 384-399
Ethier, W.J., 1998. Regionalism in a Multilateral World. Journal of Political Economy 106(6), 1214-1245.
Estevadeordal, A., Freund, C., and E. Ornelas, 2008. Does Regionalism Affect Trade Liberalization towards Non-Members? Quarterly Journal of Economics 123(4), 1531-1575.
Freund, C., 2000a. Multilateralism and the Endogenous Formation of Preferential Trade Agreements, Journal of International Economics 52, 359-376.
Freund, C., 2000b. Different Paths to Free Trade: The Gains from Regionalism. Quarterly Journal of Economics, 52 (2000b), 359-376.
Freund, C. and Ornelas, E. forthcoming. Regional trade agreements. Annual Review of Economics (also CEP discussion papers no. 961, LSE).
Gawande, K., Krishna, P. and Olarreaga, M., forthcoming. Lobbying Competition Over Trade Policy. Journal of European Economic Association.
Grossman, G.M. and Helpman, E., 1994. Protection For Sale. American Economic Review 84(4), 833-850.
Grossman, G.M. and Helpman, E., 1995. The Politics of Free-Trade Agreements. American Economic Review 85(4), 667-690.
Krishna, K., 2006. Understanding Rues of Origins, in: Cadot, O., Estevadeordal O., A., Suwa-Eisenmann A., and Verdier, T. (eds.) The Origin of Goods: Rules of Origin in Regional Trade Agreements. Oxford University Press, 2006.
Krishna, P., 2003. Are regional Trade Partners “Natural”? Journal of Political Economy 111(1), 202-226.
Krishna, P., 1998. Regionalism and Multilateralism: A Political Economy Approach, Quarterly Journal of Economics 113, 227-252.
Limão, N., 2007. “Are Preferential Trade Agreements with Non-trade Objectives a Stumbling Block for Multilateral Liberalization?” Review of Economic Studies 74(3), 821-855.
Limão, N., 2006. Preferential Trade Agreements as Stumbling Blocks for Multilateral Trade Liberalization: Evidence for the U.S. American Economic Review 96(3), 896-914.
28
Limão, N. and, Karacaovali, B., 2007. The Clash of Liberalizations: Preferential vs. Multilateral Trade Liberalization in the European Union. Journal of International Economics 74(2), 299-327.
Maggi, G., and Rodríguez-Clare, A., 1998. The Value of Trade Agreements in the Presence of Political Pressures. Journal of Political Economy 106(3), 574-601.
Maggi, G., and Rodríguez-Clare, A., 2007. A Political-Economy Theory of Trade Agreements, American Economic Review 97, 1374-1406.
Mansfeld E.D and Reinhardt E., 2003. Multilateral Determinants of Regionalism: The Effects of GATT/WTO on the Formation of Preferential Trading Agreements. International Organization, 57, 829-862.
McLaren, J., 2002. A Theory of Insidious Regionalism. Quarterly Journal of Economics, 118, 571-608.
Ornelas, E., 2005a. Rent Destruction and the Political Viability of Free Trade Agreements. Quarterly Journal of Economics 120, 1475-1506.
Ornelas, E., 2005b. Endogenous Free Trade Agreements and the Multilateral Trading System. Journal of International Economics 67, 471-497.
Romalis, J., 2007. Market Access, Openness and Growth, NBER Working Paper 13048.
Saggi, K., 2006. Preferential Trade Agreements and Multilateral Tariff Cooperation. International Economic Review 47(1), 29-57.
Staiger, R., 1995. A Theory of Gradual Trade Liberalization," in: Deardorff, A., Levinsohn, J. and Stern, R. (Eds.), New Directions in Trade Theory, University of Michigan Press.
The Economist, 2008. Who Runs The World? The Economist 388(8587), 37-40.
World Trade Organization, United Conference on Trade and Development, International Trade Centre. 2007. World Tariff Profiles 2006. WTO, UNCTAD and ITC, Geneva.
Zoellick R. B., 2001. 2001 Trade Policy Agenda and 2000 Annual Report. Office of the United States Trade Representative, Washington D.C.
29
Figure 1: US Tariffs (Simple Means) 2
34
56
(%)
1989 1995 2007year
MFN Applied Tariff Effectively Applied Tariff
Note: At the tariff line level, the effectively applied tariff corresponds to the lowest available tariff.
Whenever it exists, the lowest preferential tariff is the effectively applied tariff. Otherwise it is the
MFN applied tariff.
30
Figure 2: Tariff lines in RTAs
02,
000
4,00
06,
000
8,00
0#
of T
ariff
Lin
es
0 1 2 3 4 5 6 7Frequency
RTA IDA
Note: The RTA histograms refer to the number of tariff lines included in an RTA by frequency; ‘frequency’ refers to the number of RTAs in which a given tariff line is being included. The IDA histograms refer to number of tariff lines granted IDA status (i.e. tariff lines that are liberalized as an RTA enters into force).
31
Table 1: Descriptive Statistics Panel (a) Tariff Lines in Trade Agreements
Tariff Lines Status Partner
Immediate duty free Gradual duty free Total included Excluded Australia 5,319 1,591 6,910 509 Bahrain 5,306 2,113 7,419 None Chile 6,651 733 7,384 35 Jordan 4,420 2,557 6,977 442 Morocco 5,397 1,979 7,376 43 Singapore 5,033 1,735 6,768 651 CAFTA 5,394 2,025 7,419 None
Panel (b) Variables
Mean Median Standard Deviation Min Max
MFN tariff CUT, in pp
(Tokyo minus Uruguay) 4.22 2.1 4.34 0 31.5
MFN tariff rate, in pp (Uruguay)
6.2 4.19 5.02 0.1 48
Share of imports (total) from PTA partners
.45 .23 .51 .005 1.31
Share imports (tariff line)
from PTA partners .21 0 2.63 0 100
Share imports from NAFTA partners
13.15 .73 24.09 0 100
Share exports to FTA partners
.91 .44 .89 .04 2.25
32
Table 2: LOGIT ‘Seven’ Dependant variable: SEVEN
(Probability that tariff line g is granted IDA to US market to all 7 partners)
(1) (2) (3) (4) (5)
Tariff CUT 1.140a 1.227a 1.330a 1.331a 1.313a
(Tokyo minus Uruguay) (0.00826) (0.0109) (0.0158) (0.0158) (0.0159)
MFN 0.668a 0.657a 0.612a 0.612a 0.611a tariff rate (0.0127) (0.0165) (0.0174) (0.0175) (0.0175)
DIFF0 (no Uruguay 4.375a 4.378a 4.253a
Round cut) (0.459) (0.459) (0.446)
Share imports 1.019 1.010 from FTA partners (0.0351) (0.0341)
Share imports 0.992a
from NAFTA partners (0.00162)
Sector FE No Yes Yes Yes Yes Observations 7419 6822 6822 6822 6822 Pseudo R2 0.209 0.294 0.318 0.318 0.321 Ll -3815.2 -3206.3 -3099.7 -3099.5 -3085.6 Notes. Coefficients: Exponentiated (odds ratios); Robust standard errors in parentheses. a p < 0.01, b p < 0.05.
33
Table 3: p-g LOGIT
Dependant variable: Pr{IDA = 1}
(Probability that tariff line g is granted IDA to US market to partner p)
(1) (2) (3) (4) (5) (6)
Tariff CUT 1.064a 1.099a 1.125a 1.126a 1.115a 1.115a
(To. minus Ur.) (0.0162) (0.0197) (0.0221) (0.0220) (0.0212) (0.0213)
MFN tariff 0.922a 0.931a 0.926a 0.925a 0.930a 0.930a level (0.0119) (0.0125) (0.0139) (0.0136) (0.0134) (0.0134)
DIFF0 (no 1.683a 1.688a 1.623a 1.623a U. R. cut) (0.316) (0.316) (0.296) (0.298)
Partner’s 1.039a 1.039a 1.041a
share of Mg (0.0144) (0.0152) (0.0128)
Share imports 0.996a 0.996a from NAFTA partners (0.00103) (0.00103)
SALL: Partner’s 0.951
share of US X+M (0.160)
Sector FE No Yes Yes Yes Yes Yes Partner FE No Yes Yes Yes Yes No
Obs. 51814 51814 51814 51814 51814 51814 Pseudo R2 0.044 0.115 0.119 0.120 0.085 0.086
Ll -29248.8 -27064.3 -26942.2 -26909.6 -28003.2 -27973.3 Notes. Coefficients: Exponentiated (odds ratios); Robust standard errors (clustered at the tariff line) in parentheses. a p < 0.01, b p < 0.05.
34
Table 4: g-Logit on partner-specific sub-sample Dependant variable: Pr{IDA = 1}
(Probability that tariff line g is granted IDA to US market to partner p)
(AUS) (BHR) (CHL) (JOR) (MAR) (SGP) (CAFTA)
Tariff CUT 1.075b 1.261a 1.120a 1.197a 1.090b 1.175a 1.273a
(To. minus Ur.) (0.0313) (0.0411) (0.0448) (0.0318) (0.0369) (0.0309) (0.0449)
MFN 0.815a 0.956a 0.895a 0.687a 0.878a 0.640a 0.968 tariff rate (0.0342) (0.0142) (0.0277) (0.0418) (0.0282) (0.0720) (0.0207)
2.110a 2.440a 1.862 2.902a 3.097a 2.389b 2.410a DIFF0 (no Uruguay
Round cut) (0.577) (0.715) (0.710) (0.997) (1.099) (0.817) (0.715)
1.017 38.49 0.971b 1.083 1.057 0.998 1.019b Share imports from FTA partners (0.0176) (115.5) (0.0112) (0.151) (0.0351) (0.00926) (0.00970)
0.995b 0.995 0.997 0.992a 0.997 0.995b 0.996 Share imports from
NAFTA partners (0.00210) (0.00242) (0.00306) (0.00222) (0.00220) (0.00211) (0.00256)
Sector FE Yes Yes Yes Yes Yes Yes Yes Observations 6929 7287 6420 7332 6474 6771 7246 Pseudo R2 0.463 0.180 0.207 0.343 0.453 0.341 0.184 ll -2278.5 -3589.8 -1845.3 -3254.6 -2006.0 -2889.9 -3494.1 Notes. Coefficients: Exponentiated (odds ratios); Robust standard errors in parentheses. a p < 0.01, b p < 0.05.
35
Table 5: Non-tariff measures (NTM) Dependant variables: SEVEN Pr{IDA = 1} (1) (2) (3) (4)
Tariff CUT 1.313a 1.115a (To. minus Ur.) (0.0159) (0.0212)
1.010 0.993 NTM * cutMFN
(0.0375) (0.00689)
1.310a 1.140a (1-NTM) * cutMFN (0.0155) (0.00455)
MFN 0.611a 0.603a 0.930a 0.924a
tariff rate (0.0175) (0.0173) (0.0134) (0.00261)
4.253a 4.173a 1.623a 1.700a DIFF0 (no Uruguay Round cut) (0.446) (0.431) (0.296) (0.0583)
NTM dummy No Yes No Yes
PartnerFE N.A. N.A. Yes Yes
Observations 7419 7419 51814 51814 Pseudo R2 0.327 0.329 0.124 0.129 ll -3056.2 -3046.0 -26810.9 -26652.3 Notes. Coefficients: Exponentiated; Robust standard errors in parentheses. a p < 0.01, b p < 0.05. All regressions include sector fixed effects and the controls SM and SNAFTA. The dummy NTM takes value one whenever a NTM is applied at the tariff line. NTM*CUT represents the interaction between the NTM dummy and the variable Tariff CUT.
36
Table 6: Unused Rules of origin (RoO)
Dependant variables: SEVEN Pr{IDA = 1} (1) (2) (3) (4)
Tariff CUT 1.321a 1.120a (Tokyo minus
Uruguay) (0.0165) (0.00411)
RoO * CUT 1.374a 1.169a
(0.0181) (0.0107)
(1-RoO) * CUT 1.113a (0.00425)
1.309a (0.0328)
MFN 0.551a 0.553a 0.927a 0.928a
tariff rate (0.0216) (0.0228) (0.00270) (0.00269)
DIFF0 (no Uruguay 1.636a Round cut)
4.358a (0.453)
4.239a (0.439)
1.666a (0.0580) (0.0571)
RoO dummy Yes Yes Yes Yes
PartnerFE N.A. N.A. Yes Yes
Observations 6822 6822 51814 51814 Pseudo R2 0.329 0.329 0.121 0.122 ll -3049.1 -3046.0 -26876.9 -26861.0 Notes. Coefficients: Exponentiated; Robust standard errors in parentheses. a p < 0.01, b p < 0.05. All regressions include sector fixed effects and the controls SM and SNAFTA. The dummy RoO takes value 1 when MFN values are above or equal to the 2.5% threshold and zero otherwise. RoO*CUT represents the interaction between the RoO dummy. and the variable Tariff CUT.
37
Table 7: LOGIT ‘Seven’ by type of goods
Dependant variable: SEVEN (Probability that tariff line g is granted IDA to US market to all 7 partners)
Basic-
manufacturing Consumption-
goods Equipment-
goods Intermediate-
goods Mixed-
products Primary
Tariff CUT 1.423a 1.181a 1.306a 1.343a 1.404a 1.061 (To. minus Ur.) (0.0433) (0.0572) (0.0426) (0.0404) (0.0613) (0.102)
MFN 0.561a 0.494a 0.838a 0.445a 0.808a 0.201a
tariff rate (0.0301) (0.0407) (0.0368) (0.0344) (0.0353) (0.0632)
DIFF0 (no Uruguay 18.62a 1.675 3.080a 2.493a 5.951a 2.53e-09 Round cut) (5.180) (0.529) (0.667) (0.711) (1.785) (0.00031)
Share imports 1.018 1.085 1.366 0.676 0.679b 1.257b
from FTA partners (0.0716) (0.103) (0.260) (0.229) (0.125) (0.121)
0.996 0.986a 0.976a 0.994 0.995 0.990 Share imports from NAFTA partners (0.00352) (0.00468) (0.00519) (0.00434) (0.00385) (0.0134)
Sector FE Yes Yes Yes Yes Yes Yes
Observations 1598 1031 859 1029 691 132 Pseudo R2 0.313 0.480 0.226 0.361 0.222 0.669 ll -726.4 -335.9 -457.6 -437.3 -335.2 -28.68 Notes. Coefficients: Exponentiated (odds ratios); Robust standard errors in parentheses. a p < 0.01, b p < 0.05.
38
Table 8: LOGIT ‘One’ Dependant variable: ONE
(Probability that tariff line is granted IDA to US market to at least one partner)
(1) (2) (3) (4) (5)
Tariff CUT 1.054a 1.133a 1.178a 1.178a 1.169a
(Tokyo minus Uruguay) (0.0124) (0.0179) (0.0226) (0.0227) (0.0234)
MFN 0.976a 0.954a 0.946a 0.947a 0.948a tariff level (0.00644) (0.00543) (0.00581) (0.00581) (0.00590)
DIFF0 (no Uruguay 2.275a 2.279a 2.217a
Round cut) (0.378) (0.379) (0.371)
Share imports 1.037 1.031 From FTA partners (0.0671) (0.0675)
Share imports 0.995b
from NAFTA partners (0.00202)
Sector FE No Yes Yes Yes Yes
Observations 5756 5756 5756 5756 5756 Pseudo R2 0.019 0.132 0.140 0.140 0.141 ll -1662.1 -1355.6 -1343.0 -1342.8 -1340.6 Notes. Coefficients: Exponentiated (odds ratios); Robust standard errors in parentheses. a p < 0.01, b p < 0.05.
39
Table 9: POISSON regressions Dependant variable: NTL (Number of times that tariff line g is granted IDA to US market)
(1) (2) (3) (4) (5)
Tariff CUT 1.015a 1.021a 1.028a 1.028a 1.026a
(Tokyo minus Uruguay) (0.000949) (0.00102) (0.00129) (0.00129) (0.00133)
MFN 0.971a 0.975a 0.974a 0.974a 0.974a tariff rate (0.00122) (0.00134) (0.00137) (0.00137) (0.00137)
DIFF0 (no Uruguay 1.152a 1.153a 1.150a
Round cut) (0.0152) (0.0152) (0.0152)
Share imports 1.011b 1.010b from FTA partners (0.00500) (0.00494)
Share imports 0.999a
from NAFTA partners (0.000201)
Sector FE No Yes Yes Yes Yes Observations 7419 7419 7419 7419 7419
Pseudo R2 0.029 0.045 0.048 0.048 0.048 Ll -15775.5 -15505.6 -15469.7 -15468.0 -15459.7
Notes. Coefficients: Exponentiated (Poisson Incidence Rate Ratios, or PIRR); Robust standard errors in parentheses. a p < 0.01, b p < 0.05.

40
Table 10 (a): HURDLE regressions Panel (a) Logit
Dependant variable: 1- SEVEN (Probability that tariff line g is not granted IDA to US market to all 7 partners)
(1) (2) (3) (4) (5)
Tariff CUT 0.877a 0.815a 0.752a 0.751a 0.761a
(Tokyo minus Uruguay) (0.00636) (0.00727) (0.00892) (0.00894) (0.00924)
MFN 1.496a 1.522a 1.635a 1.635a 1.637a tariff rate (0.0286) (0.0382) (0.0466) (0.0467) (0.0469)
DIFF0 (no Uruguay 0.229a 0.228a 0.235a
Round cut) (0.0240) (0.0240) (0.0247)
Share imports 0.981 0.990 from FTA partners (0.0338) (0.0334)
Share imports 1.008a
from NAFTA partners (0.00165)
Observations 7419 7419 7419 7419 7419 ll -12392.7 -11372.1 -11254.2 -11253.8 -11238.9 Notes. Coefficients: Exponentiated (odds ratios); Robust standard errors in parentheses. a p < 0.01, b p < 0.05.
41
Table 10 (b): HURDLE regressions (cont.) Panel (b) Conditional Poisson
Dependant variable: 7 – NTL, conditional on NTL < 7 (Number of times that tariff line g is not granted IDA to US market)
(1) (2) (3) (4) (5)
Tariff CUT 0.995 0.982a 0.977a 0.977a 0.977a
(Tokyo minus Uruguay) (0.00248) (0.00281) (0.00311) (0.00312) (0.00315)
MFN 1.004a 1.011a 1.012a 1.012a 1.012a tariff rate (0.000331) (0.00144) (0.00150) (0.00150) (0.00151)
DIFF0 (no Uruguay 0.871a 0.871a 0.873a
Round cut) (0.0242) (0.0242) (0.0244)
Share imports 0.993 0.994 from FTA partners (0.00762) (0.00765)
Share imports 1.001
from NAFTA partners (0.000344)
Sector FE No Yes Yes Yes Yes Observations 7419 7419 7419 7419 7419 ll -12392.7 -11372.1 -11254.2 -11253.8 -11238.9 Notes. Coefficients: Exponentiated (Poisson Incidence Rate Ratios, or PIRR); Robust standard errors in parentheses. a p < 0.01, b p < 0.05.
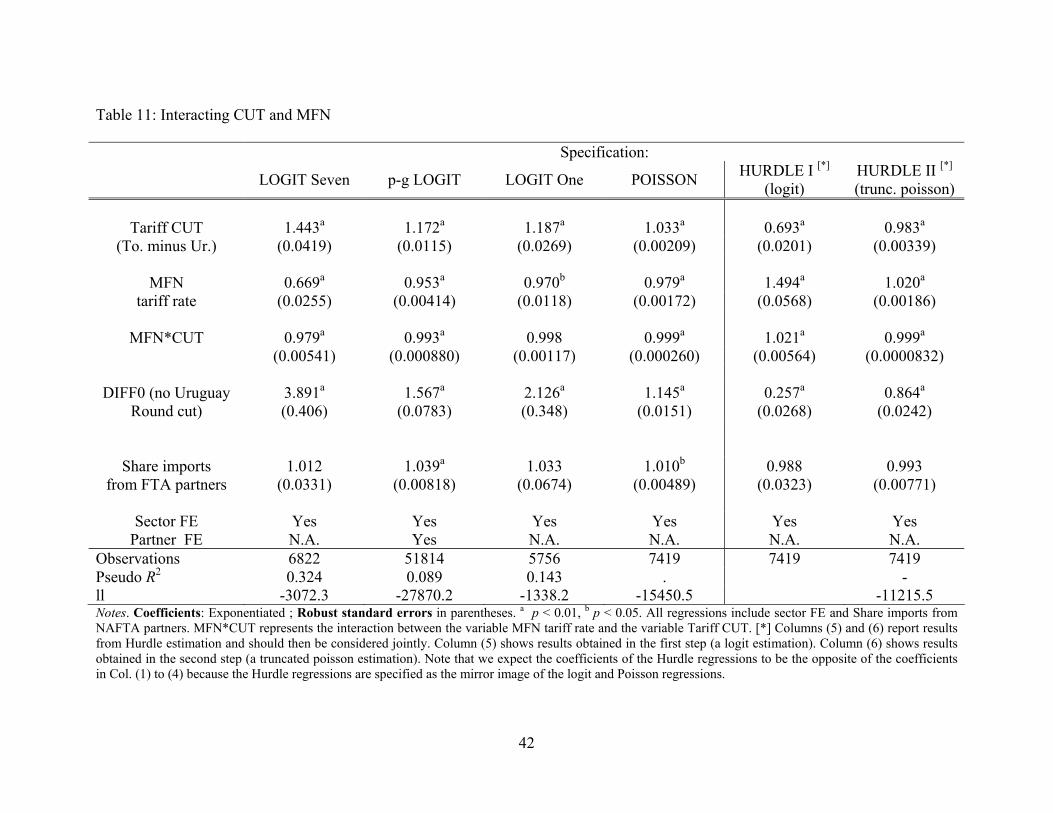
42
Table 11: Interacting CUT and MFN Specification:
LOGIT Seven p-g LOGIT LOGIT One POISSON HURDLE I [*]
(logit) HURDLE II [*] (trunc. poisson)
Tariff CUT 1.443a 1.172a 1.187a 1.033a 0.693a 0.983a
(To. minus Ur.) (0.0419) (0.0115) (0.0269) (0.00209) (0.0201) (0.00339)
MFN 0.669a 0.953a 0.970b 0.979a 1.494a 1.020a tariff rate (0.0255) (0.00414) (0.0118) (0.00172) (0.0568) (0.00186)
MFN*CUT 0.979a 0.993a 0.998 0.999a 1.021a 0.999a
(0.00541) (0.000880) (0.00117) (0.000260) (0.00564) (0.0000832) DIFF0 (no Uruguay
Round cut)
3.891a (0.406)
1.567a (0.0783)
2.126a (0.348)
1.145a (0.0151)
0.257a (0.0268)
0.864a (0.0242)
Share imports
from FTA partners 1.012
(0.0331) 1.039a
(0.00818) 1.033
(0.0674) 1.010b
(0.00489) 0.988
(0.0323)
0.993 (0.00771)
Sector FE Yes Yes Yes Yes Yes Yes Partner FE N.A. Yes N.A. N.A. N.A. N.A.
Observations 6822 51814 5756 7419 7419 7419 Pseudo R2 0.324 0.089 0.143 . - ll -3072.3 -27870.2 -1338.2 -15450.5 -11215.5 Notes. Coefficients: Exponentiated ; Robust standard errors in parentheses. a p < 0.01, b p < 0.05. All regressions include sector FE and Share imports from NAFTA partners. MFN*CUT represents the interaction between the variable MFN tariff rate and the variable Tariff CUT. [*] Columns (5) and (6) report results from Hurdle estimation and should then be considered jointly. Column (5) shows results obtained in the first step (a logit estimation). Column (6) shows results obtained in the second step (a truncated poisson estimation). Note that we expect the coefficients of the Hurdle regressions to be the opposite of the coefficients in Col. (1) to (4) because the Hurdle regressions are specified as the mirror image of the logit and Poisson regressions.
CENTRE FOR ECONOMIC PERFORMANCE Recent Discussion Papers
972 Andreas Georgiadis Christos N. Pitelis
The Interrelationship between HR, Strategy and Profitability in Service SMEs: Empirical Evidence from the UK Tourism Hospitality and Leisure Sector
971 John T. Addison Alex Bryson Paulino Teixeira André Pahnke
Slip Sliding Away: Further Union Decline in Germany and Britain
970 Nicholas Bloom Raffaella Sadun John Van Reenen
Recent Advances in the Empirics of Organizational Economics
969 Nicholas Bloom John Van Reenen
New Approaches to Measuring Management and Firm Organiz\ation
968 Andrew B. Bernard J. Bradford Jensen Stephen J. Redding Peter K. Schott
Wholesalers and Retailers in U.S. Trade (Long Version)
967 Pooyan Amir Ahmadi Albrecht Ritschl
Depression Econometrics: A FAVAR Model of Monetary Policy During the Great Depression
966 Nicholas Bloom Raffaella Sadun John Van Reenen
Does Product Market Competition Lead Firms to Decentralize?
965 Ralf Martin Why is the US so Energy Intensive? Evidence from Multinationals in the UK
964 Christian A. L. Hilber Frédéric Robert-Nicoud
Origins of Land Use Regulations: Theory and Evidence from US Metro Areas
963 Maria Bas Juan Carluccio
Wage Bargaining and the Boundaries of the Multinational Firm
962 L. Rachel Ngai Christopher A. Pissarides
Welfare Policy and the Distribution of Hours of Work
961 Caroline Freund Emanuel Ornelas
Regional Trade Agreements
960 Francesco Caselli Guy Michaels
Do Oil Windfalls Improve Living Standards? Evidence from Brazil
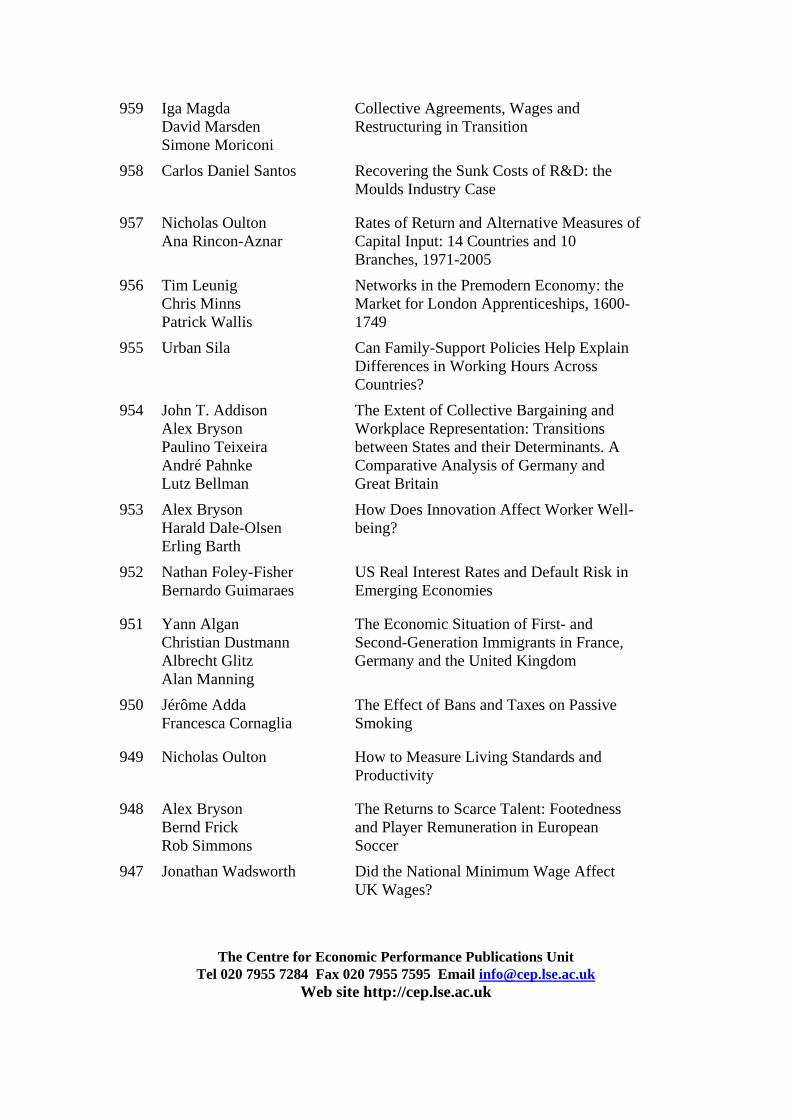
959 Iga Magda David Marsden Simone Moriconi
Collective Agreements, Wages and Restructuring in Transition
958 Carlos Daniel Santos Recovering the Sunk Costs of R&D: the Moulds Industry Case
957 Nicholas Oulton Ana Rincon-Aznar
Rates of Return and Alternative Measures of Capital Input: 14 Countries and 10 Branches, 1971-2005
956 Tim Leunig Chris Minns Patrick Wallis
Networks in the Premodern Economy: the Market for London Apprenticeships, 1600-1749
955 Urban Sila Can Family-Support Policies Help Explain Differences in Working Hours Across Countries?
954 John T. Addison Alex Bryson Paulino Teixeira André Pahnke Lutz Bellman
The Extent of Collective Bargaining and Workplace Representation: Transitions between States and their Determinants. A Comparative Analysis of Germany and Great Britain
953 Alex Bryson Harald Dale-Olsen Erling Barth
How Does Innovation Affect Worker Well-being?
952 Nathan Foley-Fisher Bernardo Guimaraes
US Real Interest Rates and Default Risk in Emerging Economies
951 Yann Algan Christian Dustmann Albrecht Glitz Alan Manning
The Economic Situation of First- and Second-Generation Immigrants in France, Germany and the United Kingdom
950 Jérôme Adda Francesca Cornaglia
The Effect of Bans and Taxes on Passive Smoking
949 Nicholas Oulton How to Measure Living Standards and Productivity
948 Alex Bryson Bernd Frick Rob Simmons
The Returns to Scarce Talent: Footedness and Player Remuneration in European Soccer
947 Jonathan Wadsworth Did the National Minimum Wage Affect UK Wages?
The Centre for Economic Performance Publications Unit Tel 020 7955 7284 Fax 020 7955 7595 Email [email protected]
Web site http://cep.lse.ac.uk