mplab ice emulator user's guide - microchip technology
TRANSCRIPT
2001 Microchip Technology Inc. DS51159C
MPLAB® ICEEMULATOR
USER’S GUIDE
M
Note the following details of the code protection feature on PICmicro® MCUs.
• The PICmicro family meets the specifications contained in the Microchip Data Sheet.• Microchip believes that its family of PICmicro microcontrollers is one of the most secure products of its kind on the market today,
when used in the intended manner and under normal conditions.• There are dishonest and possibly illegal methods used to breach the code protection feature. All of these methods, to our knowl-
edge, require using the PICmicro microcontroller in a manner outside the operating specifications contained in the data sheet. The person doing so may be engaged in theft of intellectual property.
• Microchip is willing to work with the customer who is concerned about the integrity of their code.• Neither Microchip nor any other semiconductor manufacturer can guarantee the security of their code. Code protection does not
mean that we are guaranteeing the product as “unbreakable”.• Code protection is constantly evolving. We at Microchip are committed to continuously improving the code protection features of
our product.
If you have any further questions about this matter, please contact the local sales office nearest to you.
Information contained in this publication regarding deviceapplications and the like is intended through suggestion onlyand may be superseded by updates. It is your responsibility toensure that your application meets with your specifications.No representation or warranty is given and no liability isassumed by Microchip Technology Incorporated with respectto the accuracy or use of such information, or infringement ofpatents or other intellectual property rights arising from suchuse or otherwise. Use of Microchip’s products as critical com-ponents in life support systems is not authorized except withexpress written approval by Microchip. No licenses are con-veyed, implicitly or otherwise, under any intellectual propertyrights.
DS51159C - page ii
Trademarks
The Microchip name and logo, the Microchip logo, PIC, PICmicro,PICMASTER, PICSTART, PRO MATE, KEELOQ, SEEVAL,MPLAB and The Embedded Control Solutions Company are reg-istered trademarks of Microchip Technology Incorporated in theU.S.A. and other countries.
Total Endurance, ICSP, In-Circuit Serial Programming, Filter-Lab, MXDEV, microID, FlexROM, fuzzyLAB, MPASM,MPLINK, MPLIB, PICC, PICDEM, PICDEM.net, ICEPIC,Migratable Memory, FanSense, ECONOMONITOR, SelectMode and microPort are trademarks of Microchip TechnologyIncorporated in the U.S.A.
Serialized Quick Term Programming (SQTP) is a service markof Microchip Technology Incorporated in the U.S.A.
All other trademarks mentioned herein are property of theirrespective companies.
© 2001, Microchip Technology Incorporated, Printed in theU.S.A., All Rights Reserved.
Printed on recycled paper.
2001 Microchip Technology Inc.
Microchip received QS-9000 quality system certification for its worldwide headquarters, design and wafer fabrication facilities in Chandler and Tempe, Arizona in July 1999. The Company’s quality system processes and procedures are QS-9000 compliant for its PICmicro® 8-bit MCUs, KEELOQ® code hopping devices, Serial EEPROMs and microperipheral products. In addition, Microchip’s quality system for the design and manufacture of development systems is ISO 9001 certified.
12 MPLAB® ICE USER’S GUIDE
Table of Contents
2001 Microchip Technology Inc. DS51159B-page iii
Quick StartIntroduction ................................................................................................ 9
Highlights ................................................................................................... 9
MPLAB ICE System Components ............................................................. 9
Installing MPLAB ICE .............................................................................. 10
Setting Up MPLAB ICE ........................................................................... 12
Using MPLAB ICE ................................................................................... 14
General InformationIntroduction .............................................................................................. 19
Highlights ................................................................................................. 19
About This Guide ..................................................................................... 19
Warranty Registration .............................................................................. 21
Recommended Reading .......................................................................... 22
Troubleshooting ....................................................................................... 22
The Microchip Internet Web Site ............................................................. 23
Development Systems Customer Notification Service ............................ 24
Customer Support ................................................................................... 26
Chapter 1. Overview and Installation1.1 Introduction ................................................................................... 27
1.2 Highlights ...................................................................................... 27
1.3 What MPLAB ICE Is ..................................................................... 27
1.4 MPLAB ICE System Components ................................................ 28
1.5 How MPLAB ICE Helps You ......................................................... 29
1.6 MPLAB ICE Kit Components ........................................................ 30
1.7 Installing MPLAB ICE Hardware ................................................... 31
1.8 Applying Power to the System Components ................................ 32
1.9 Installing MPLAB IDE Software .................................................... 35
MPLAB® ICE User’s Guide
Chapter 2. Tutorial - PIC16CXXX2.1 Introduction ...................................................................................37
2.2 Highlights ......................................................................................37
2.3 Reviewing the Hardware ...............................................................37
2.4 Running MPLAB ............................................................................38
2.5 Setting Up the Development Mode ...............................................39
2.6 Creating a Project .........................................................................42
2.7 Building the Project .......................................................................48
2.8 Using Software Break Points ........................................................48
2.9 Using Named Software Break Points ............................................50
2.10 Using Hardware Break Points .......................................................51
2.11 Using the Complex Trigger ...........................................................52
2.12 Using Code Coverage ...................................................................55
2.13 Going Forward ..............................................................................57
Chapter 3. Tutorial - PIC18CXXX3.1 Introduction ...................................................................................59
3.2 Highlights ......................................................................................59
3.3 Reviewing the Hardware ...............................................................59
3.4 Running MPLAB ............................................................................60
3.5 Setting Up the Development Mode ...............................................61
3.6 Creating a Project .........................................................................64
3.7 Building the Project .......................................................................70
3.8 Using Software Break Points ........................................................70
3.9 Using Named Software Break Points ............................................72
3.10 Using Hardware Break Points .......................................................73
3.11 Using the Complex Trigger ...........................................................74
3.12 Using Code Coverage ...................................................................77
3.13 Going Forward ..............................................................................79
DS51159B-page iv 2001 Microchip Technology Inc.
Table of Contents
Chapter 4. General Set Up4.1 Introduction ................................................................................... 81
4.2 Highlights ...................................................................................... 81
4.3 Running MPLAB ........................................................................... 81
4.4 Configuring the LPT Port .............................................................. 82
4.5 Selecting the Development Mode and Processor ......................... 83
4.6 Selecting Processor Power ........................................................... 84
4.7 Setting Up the Processor Clock .................................................... 86
4.8 Setting Up Miscellaneous Hardware ............................................. 87
4.9 Using MPLAB Projects ................................................................. 89
Chapter 5. Basic Features5.1 Introduction ................................................................................... 91
5.2 Highlights ...................................................................................... 91
5.3 Resetting the Processor ............................................................... 91
5.4 Viewing Processor Memory .......................................................... 92
5.5 Viewing Files ................................................................................. 93
5.6 Using the Status Bar and Tool Bars ............................................. 93
5.7 Starting and Stopping Emulation .................................................. 93
5.8 Using Software Break Points ........................................................ 94
5.9 Using Hardware Break Points ....................................................... 95
5.10 Using Trigger In/Out Settings ....................................................... 96
Chapter 6. Advanced Features6.1 Introduction ................................................................................... 97
6.2 Highlights ...................................................................................... 97
6.3 Using Complex Triggering ............................................................ 98
6.4 Using Code Coverage ................................................................ 118
6.5 Using the Trace Memory Window ............................................... 120
2001 Microchip Technology Inc. DS51159B-page v
MPLAB® ICE User’s Guide
Chapter 7. Verification7.1 Introduction .................................................................................127
7.2 Highlights ....................................................................................127
7.3 Running Verify .............................................................................127
7.4 Troubleshooting Verify Failures ..................................................132
Chapter 8. Troubleshooting8.1 Introduction .................................................................................133
8.2 Highlights ....................................................................................133
8.3 Common Problems .....................................................................133
8.4 Configuring a PC’s Parallel Interface for MPLAB ICE .................135
Appendix A. Debugging Techniques
A.1 Introduction .................................................................................141
A.2 Highlights ....................................................................................141
A.3 Complex Triggering Examples ....................................................141
A.4 Additional Debugging Examples .................................................142
Appendix B. Pod Electrical SpecificationB.1 Introduction .................................................................................159
B.2 Highlights ....................................................................................159
B.3 Power ..........................................................................................159
B.4 Parallel Port .................................................................................160
B.5 Indicator Lights ............................................................................161
B.6 Logic Probes ...............................................................................163
Appendix C. Migrating from PICMASTERC.1 Introduction .................................................................................165
C.2 Highlights ....................................................................................165
C.3 Unchanged Items ........................................................................165
C.4 Hardware Setup ..........................................................................165
C.5 How to Time Events ....................................................................166
C.6 Setting Break Points ....................................................................167
C.7 External Inputs and Outputs ........................................................168
DS51159B-page vi 2001 Microchip Technology Inc.
Table of Contents
GlossaryIntroduction ............................................................................................ 169
Highlights ............................................................................................... 169
Terms .................................................................................................... 169
Index ......................................................................................................................... 185
Worldwide Sales and Service .......................................................................... 192
2001 Microchip Technology Inc. DS51159B-page vii

MPLAB® ICE User’s Guide
DS51159B-page viii 2001 Microchip Technology Inc.
®
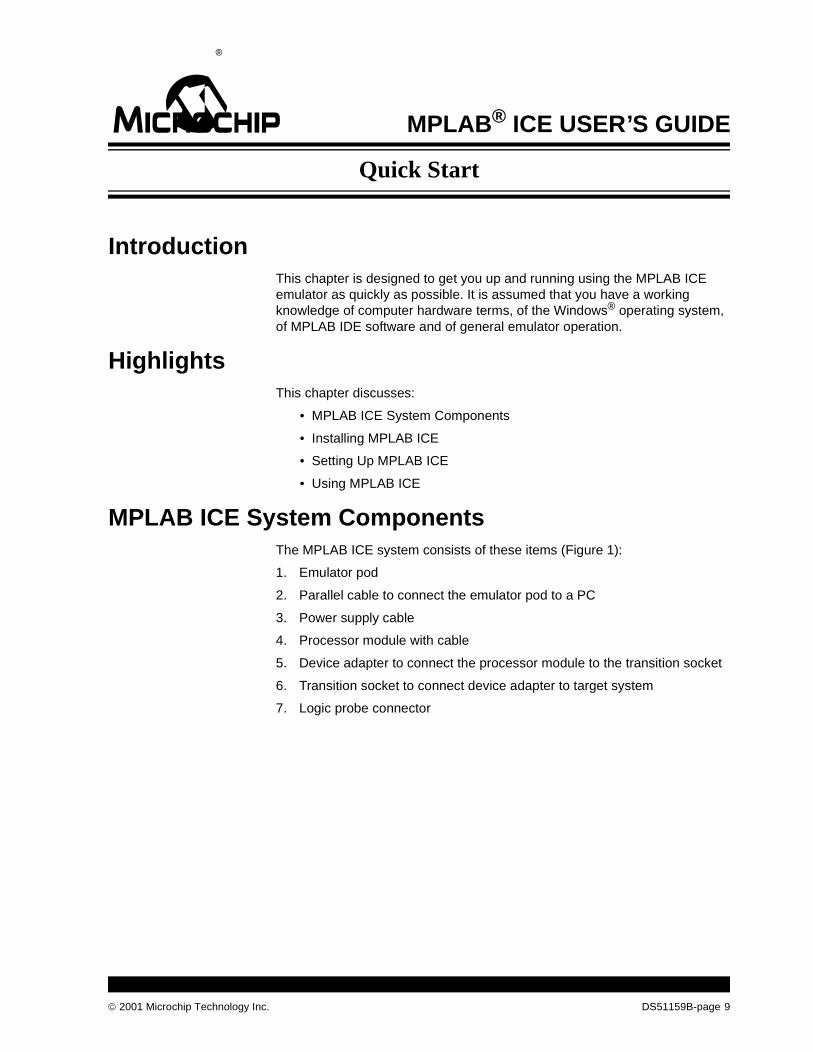
MPLAB ICE USER’S GUIDE12Quick StartIntroductionThis chapter is designed to get you up and running using the MPLAB ICE emulator as quickly as possible. It is assumed that you have a working knowledge of computer hardware terms, of the Windows® operating system, of MPLAB IDE software and of general emulator operation.
HighlightsThis chapter discusses:
• MPLAB ICE System Components
• Installing MPLAB ICE
• Setting Up MPLAB ICE
• Using MPLAB ICE
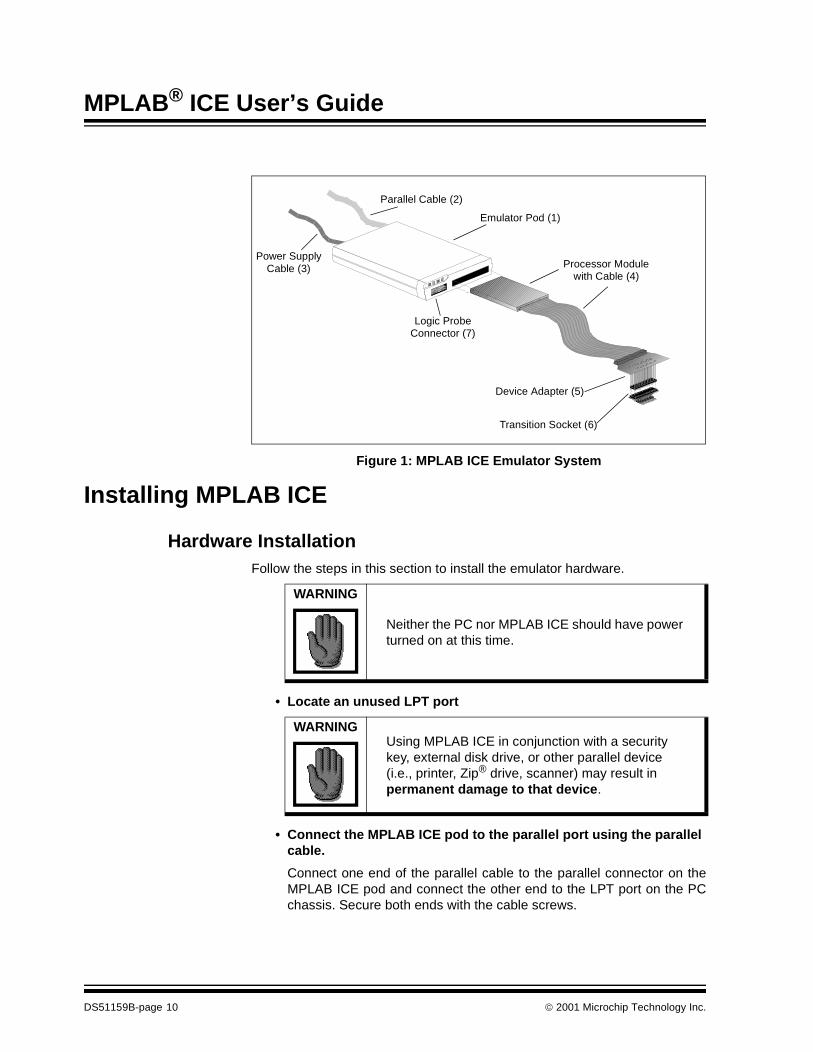
MPLAB ICE System ComponentsThe MPLAB ICE system consists of these items (Figure 1):
1. Emulator pod
2. Parallel cable to connect the emulator pod to a PC
3. Power supply cable
4. Processor module with cable
5. Device adapter to connect the processor module to the transition socket
6. Transition socket to connect device adapter to target system
7. Logic probe connector
2001 Microchip Technology Inc. DS51159B-page 9
MPLAB® ICE User’s Guide
Figure 1: MPLAB ICE Emulator System
Installing MPLAB ICE
Hardware InstallationFollow the steps in this section to install the emulator hardware.
• Locate an unused LPT port
• Connect the MPLAB ICE pod to the parallel port using the parallel cable.
Connect one end of the parallel cable to the parallel connector on theMPLAB ICE pod and connect the other end to the LPT port on the PCchassis. Secure both ends with the cable screws.
Parallel Cable (2)
Power SupplyCable (3)
Emulator Pod (1)
Processor Modulewith Cable (4)
Logic ProbeConnector (7)
Device Adapter (5)
Transition Socket (6)
WARNING
Neither the PC nor MPLAB ICE should have power turned on at this time.
WARNINGUsing MPLAB ICE in conjunction with a security key, external disk drive, or other parallel device (i.e., printer, Zip® drive, scanner) may result in permanent damage to that device.
DS51159B-page 10 2001 Microchip Technology Inc.
Quick Start
• Connect the logic probes.
Plug the logic probes into the logic probe connector found on the front ofthe emulator pod.
• Install the processor module.
Insert the processor module firmly into the front of the MPLAB ICE pod.To remove the processor module, place one finger behind each tab onthe front of the processor module and pull firmly. DO NOT pull on thecable.
• Attach the power supply.
Make certain that the MPLAB ICE pod on/off switch is in the “O” or “off”position before completing this step. Plug the appropriate ends of thepower supply into a power outlet and into the back of the MPLAB ICEpod.
• If using a target board with the MPLAB ICE system, install the device adapter.
Attach the device adapter to the end of the cable on the processormodule. Then, plug the device adapter into a transition socket on the tar-get board.
• Turn on the system components.
To prevent damage to any of the subsystem or target application parts,power up the system components in the following sequence:
1. Turn on the PC.2. Turn on the emulator assembly by pushing the emulator pod switch
to ‘I’.3. Apply power to the target application circuit.
Turn the system components off in reverse order.
2001 Microchip Technology Inc. DS51159B-page 11
MPLAB® ICE User’s Guide
Software InstallationTo install the MPLAB IDE software, refer to the installation instructions found in the MPLAB User’s Guide (DS51025).
Installation ProblemsIf you have difficulty installing the hardware, please refer to the more detailed chapter on installation (Chapter 1) or consult the troubleshooting chapter (Chapter 8). If you have difficulty installing the software, please refer to the MPLAB User’s Guide (DS51025).
Setting Up MPLAB ICE
Starting MPLABAfter installing MPLAB IDE software, invoke it by executing the file MPLAB.EXE. For more information on using MPLAB, refer to the MPLAB User’s Guide (DS51025) and the included file README.LAB.
Setting Up the Development ModeOpen the Development Mode dialog to set up the MPLAB ICE emulator for use with MPLAB IDE software. Select Options>Development Mode. Set up the development mode by clicking on each tab of the dialog and setting options as specified below. Click Apply to accept the setting of each tab. Click OK to accept the setting and close the Development Mode dialog.
• Ports tab: Displays information about the available LPT ports on the host PC. Select an available LPT port from the dropdown list. To deter-mine how this LPT port is configured on your system, click Query Port Info. The preferred mode of operation for MPLAB ICE is bi-directional mode (PS/2, EPP, and ECP types).
• Tools tab: Displays development mode and device information. Select the MPLAB ICE emulator for the development mode and choose a pro-cessor to emulate from the dropdown list.
Below the Processor is a brief description of any limitations that exist foremulating this processor on the MPLAB ICE emulator. A more detaileddescription of limitations may be viewed by clicking on Details.
WARNINGDo not select the MPLAB ICE Emulator mode if any other device (i.e., printer, Zip drive, scanner) is installed on the parallel port or permanent damage to that device may result.
DS51159B-page 12 2001 Microchip Technology Inc.
Quick Start
• Power tab: Displays system power information. Select from where you want the emulator system to get its power; from its own power source (From Emulator) or from the target system (From Target Board). Low Voltage emulation is available when choosing Processor Power From Target Board.
• Clock tab: Displays oscillator type and frequency information. To use the on-board clock, select an oscillator type and enter a frequency between 32 kHz and 40 MHz. To use the target board clock, you must first set Processor Power to From Target Board on the Power tab. Then select Use Target Board Clock and the actual frequency will be calcu-lated and displayed as Actual Frequency.
In addition to the above setting, you may wish to make additional changes based on your application or device.
• Memory tab: Use this tab to set the memory configuration being used. This tab is not available for all processors. In order for Off-Chip Memory to be used, the Processor Mode (Options> Development Mode, Con-figuration tab) must be set to Microprocessor or Extended Microcon-troller.
• Configuration tab: Use this tab to set up the Watchdog Timer and/or Processor Mode, i.e., internal and external memory. Processor mode is not available for all processors.
• Pins tab: Use this tab to set up pins, such as enable/disable master clear (MCLR).
• Break Options tab: Use this tab to change the global break and trace point environment options.
Setting Up a ProjectCreate a new project by selecting Project > New Project. Find or create a directory for the new project and then name the project (e.g., newprog.pjt). For more information on creating and using projects, refer to the MPLAB User’s Guide (DS51025).
Set Up ProblemsIf you have difficulty starting MPLAB or setting up a new project, please refer to the MPLAB User’s Guide (DS51025). If you have difficulty setting up the development mode, please refer to the more detailed chapter on set up (Chapter 4) or consult the troubleshooting chapter (Chapter 8).
2001 Microchip Technology Inc. DS51159B-page 13
MPLAB® ICE User’s Guide
Using MPLAB ICEMPLAB ICE provides a wide variety of tools to emulate and debug an application. MPLAB ICE offers a basic set of in-circuit debugging tools, including the ability to run, halt, reset and single step the processor, plus additional tools for advanced debugging techniques.
MPLAB ICE Basic FeaturesMPLAB ICE basic features include the following:
• Downloadable• Processor Memory• Status Bar and Tool Bars• Start and Stop Emulation• Software Break Points• Named Software Break Points• Trigger In/Out
The basic MPLAB ICE emulator features are built in to the MPLAB IDE software. For more detailed information on each of these features, consult the MPLAB User’s Guide (DS51025).
MPLAB ICE Advanced FeaturesMPLAB ICE advanced features include the following:
• Complex Triggering• Code Coverage• Trace Window
These features will each be discussed in the following sections. For more detailed information on each of these features, please refer to Chapter 6.
Using Complex TriggeringMPLAB ICE has a highly flexible and powerful triggering mechanism. A trigger is a combination of events that can cause:
• a hardware break point, and/or
• a trace memory capture.
An event is a description of the state of the system captured during one cycle.
In addition, an external signal can be generated when the trigger occurs. This is useful for synchronizing other analyzers or equipment to MPLAB ICE.
DS51159B-page 14 2001 Microchip Technology Inc.
Quick Start
Complex triggers can be specified by selecting Debug>Complex Trigger Settings. The Complex Trigger Settings dialog will look different depending on your selection of:
1. Memory Access
• Program Memory - If a Program Memory access is specified, the trig-ger can be generated on an instruction fetch or a table read / table write operation (on PICmicros that have table read / write capability).
• Data Memory - If a Data Memory access is specified, the trigger can be generated on a read or a write operation.
2. Events
• Sequential - Select Sequential if each event must occur in sequence to generate the trigger. Keep in mind that for sequential triggers, the emulator will wait until Event 1 is satisfied before proceeding to Event 2, and on down to the final Trigger event.
• All Events - Select All Events if each event much occur, in any order, to generate the trigger. The trigger will be generated when the final event occurs.
• Any Event - Select Any Event if any single event will generate the trig-ger.
• Time Between Events - Select Time Between Events to specify a starting and terminating event. This event selection is used in conjuc-tion with the trace memory window. Up to two events and the start event can be specified to occur sequentially before the time stamp generator starts incrementing.
• Filter Trace - Select Filter Trace to specify the events that will be cap-tured by the trace memory window. Up to three qualifying events can be specified to occur sequentially before starting to collect the specified events.To perform a continuous filter trace, check the Infinite Events checkbox.
Ignore FNOP Cycles should not be specified when performing a FilterTrace; otherwise, the trace buffer will capture the cycle that executesafter the cycle that caused the trigger.
Note: Processor modules that do not support data monitoring (12-bitcore processor modules) also do not support triggering on datamemory.
Note: Since Ignore FNOP Cycles should not be specified with a FilterTrace, prefetches will cause the trigger to fire.
2001 Microchip Technology Inc. DS51159B-page 15
MPLAB® ICE User’s Guide
Also, performing a Filter Trace on Data Memory access is not recom-mended, since the traced data will be one cycle after the trigger specifi-cation.
Click on the Help button to bring up the on-line help file to walk you through setting up a complex trigger.
In addition, a simple complex trigger break point can be set by using the right mouse button. In a source window, a listing window, or the program memory window, select the desired lines by clicking and dragging. Then select Complex Trigger Break Point on the right mouse button menu. This will set up and apply a single event sequential trigger with Ignore FNOP Cycles and Halt on Trigger set. The Complex Trigger dialog does not have to be open.
Using Code CoverageThe code coverage feature provides visibility as to what portions of the code are being accessed (fetched, written or read). This code is highlighted in the Program Memory window.
• To enable code coverage, select Debug > Code Coverage and choose either Enabled/Reset on Run or Enabled/Manual Reset. If Enabled/Reset on Run is selected, code coverage is reset every time emulation is started.
• If Enabled/Manual Reset is selected, code coverage is reset only when a reset (Chapter 6.4) is performed.
• Select Options>Environment Settings>Color and chose a color for Trace Point Text. This will be the code coverage highlighted text color.
• To disable code coverage, select Debug>Code Coverage and click on Disabled.
Using the Trace Memory WindowThe trace memory window in MPLAB ICE contains information that is uploaded from MPLAB ICE’s trace buffer. By default, all instruction cycles are captured by the trace buffer. The Complex Trigger dialog can be used to control which instruction cycles are captured (see Using Complex Triggering).
Note: When triggering on multiple events, keep in mind that triggerson data memory accesses are skewed two cycles from theinstructions that caused them.
Note: Code coverage and complex triggering are mutually exclusive.
DS51159B-page 16 2001 Microchip Technology Inc.
Quick Start
• This trace buffer can be viewed by selecting Window>Trace Memory.
Up to 32767 instruction cycles can be displayed. The trace memory win-dow contains the following information for each execution cycle:
- Cycle Number – Cycle’s position relative to the trigger or halting point. The approximate trigger cycle will be highlighted in blue, and will be numbered as cycle 0.
- Address (Addr) – Address of the instruction being fetched from program memory.
- Opcode (Op) – Instruction being fetched.- Label (Label) – Label (if any) associated with the program mem-
ory address.- Instruction (Instruction) – Disassembled instruction.- Source Data Address (SA) – Address or symbol of the source
data, if applicable.- Source Data Value (SD) – Value of the source data, if applicable.- Destination Data Address (DA) – Address or symbol of the desti-
nation data, if applicable.- Destination Data Value (DD) – Value of the destination data, if
applicable.- External Inputs (Ex) – Value of the external inputs.- Time Stamp (Cycles or Seconds) – Time stamp value.
• Select Data>Reload to force an upload of whatever data has currently been collected by the trace buffer. This allows you to see where your program is executing. This is often useful if your trigger is never reached.
• The column widths can be adjusted manually by dragging the right col-umn header border with the mouse. Select Options>Configure to further customize the trace display.
Usage ProblemsIf you have difficulty using any of the features of MPLAB ICE, please refer to the more detailed chapters on features (Chapter 5 or Chapter 6) or consult the troubleshooting chapter (Chapter 8).
Note: Due to the timing of processor signals, the data information will beskewed by one cycle. Destination data values are actually skewedby two cycles, but for display purposes, the trace buffer displaycompensates for one of the delayed cycles.
Note: Source and destination data addresses and values are notavailable when using processor modules based on the 12-bitPICmicro® core (PIC16C5X and related parts).
2001 Microchip Technology Inc. DS51159B-page 17

MPLAB® ICE User’s Guide
NOTES:
DS51159B-page 18 2001 Microchip Technology Inc.
®
MPLAB ICE USER’S GUIDE12General InformationIntroductionThis first chapter contains general information that will be useful to know before using the MPLAB ICE emulator.
HighlightsThe information you will garner from this chapter:
• About this Guide
• Warranty Registration
• Recommended Reading
• Troubleshooting
• The Microchip Internet Web Site
• Development Systems Customer Notification Service
• Customer Support
About This Guide
Document LayoutThis document describes how to use MPLAB ICE as a development tool to emulate and debug firmware on a target board. The manual layout is as follows:
• Quick Start – How to get up and running quickly using MPLAB ICE.
• Chapter 1: Overview and Installation – What MPLAB ICE is and how it can help you. Also, how to install MPLAB ICE hardware and MPLAB IDE software.
• Chapter 2: Tutorial - PIC16CXXX – A tutorial on using MPLAB ICE to emulate PIC16CXXX devices.
• Chapter 3: Tutorial - PIC18CXXX – A tutorial on using MPLAB ICE to emulate PIC18CXXX devices.
• Chapter 4: General Set Up – Setting up MPLAB ICE for use with MPLAB IDE.
• Chapter 5: Basic Features – A description of the basic features of MPLAB ICE, (i.e., run, halt, reset, single step, etc).
• Chapter 6: Advanced Features – A description of the advanced fea-tures of MPLAB ICE, (i.e., complex trigger, code coverage, trace).
2001 Microchip Technology Inc. DS51159B-page 19
MPLAB® ICE User’s Guide
• Chapter 7: Verification – How to verify MPLAB ICE’s correct opera-tion.
• Chapter 8: Troubleshooting – How to solve common problems with MPLAB ICE operation.
• Appendix A: Debugging Techniques – How to debug common prob-lems in your code by using MPLAB ICE.
• Appendix B: Pod Electrical Specification – The electrical specifications and description of the emulator pod.
• Appendix C: Migrating from PICMASTER® – How MPLAB ICE differs from PICMASTER.
• Glossary – A glossary of terms used in this guide.
• Index – Cross-reference listing of terms, features and sections of this document.
• Worldwide Sales and Service – A listing of Microchip sales and service locations and telephone numbers worldwide.
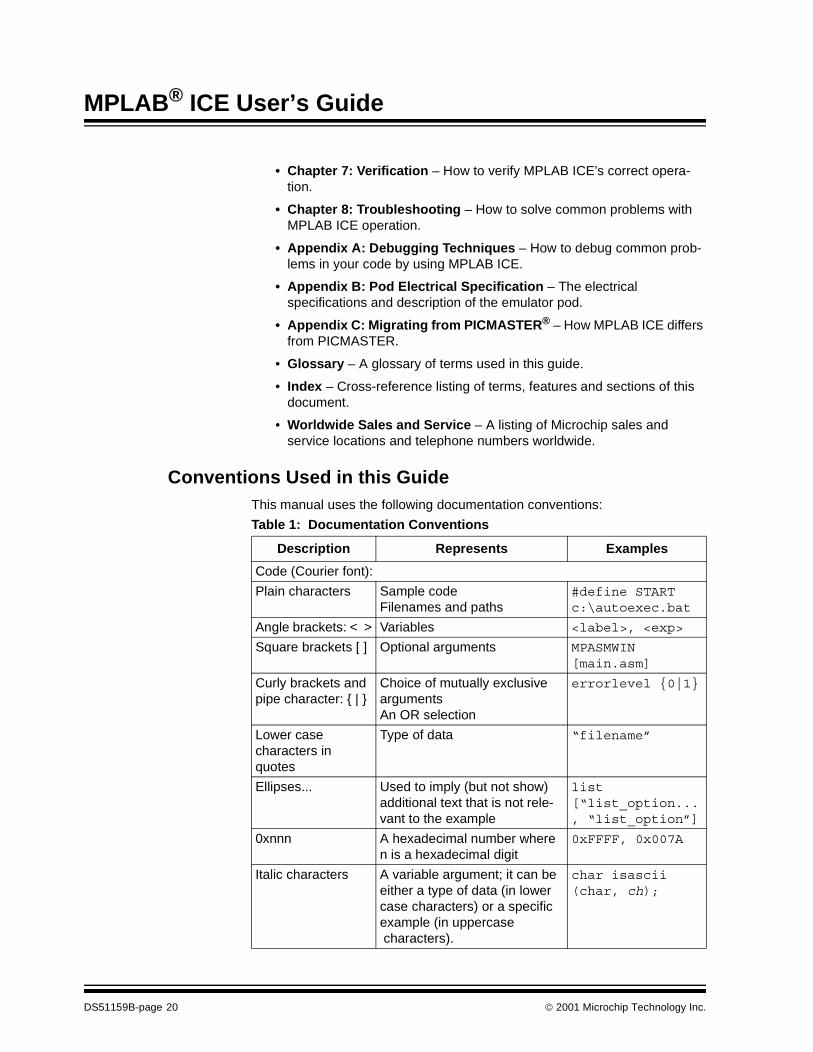
Conventions Used in this GuideThis manual uses the following documentation conventions:
Table 1: Documentation Conventions
Description Represents Examples
Code (Courier font):
Plain characters Sample codeFilenames and paths
#define STARTc:\autoexec.bat
Angle brackets: < > Variables <label>, <exp>
Square brackets [ ] Optional arguments MPASMWIN [main.asm]
Curly brackets and pipe character: { | }
Choice of mutually exclusive argumentsAn OR selection
errorlevel {0|1}
Lower case characters in quotes
Type of data “filename”
Ellipses... Used to imply (but not show) additional text that is not rele-vant to the example
list [“list_option..., “list_option”]
0xnnn A hexadecimal number where n is a hexadecimal digit
0xFFFF, 0x007A
Italic characters A variable argument; it can be either a type of data (in lower case characters) or a specific example (in uppercase characters).
char isascii (char, ch);
DS51159B-page 20 2001 Microchip Technology Inc.
General Information
Documentation UpdatesAll documentation becomes dated and this user’s guide is no exception. Since MPLAB IDE and other Microchip tools are constantly evolving to meet customer needs, some MPLAB IDE dialogs and/or tool descriptions may differ from those in this document. Please refer to our web site at www.microchip.com to obtain the latest documentation available.
Documentation Numbering ConventionsDocuments are numbered with a “DS” number. The number is located on the bottom of each page, in front of the page number. The numbering convention for the DS Number is: DSXXXXXA,
where:
Warranty RegistrationPlease complete the enclosed Warranty Registration Card and mail it promptly. Sending in your Warranty Registration Card entitles you to receive new product updates. Interim software releases are available at the Microchip web site.
Interface (Arial font):
Underlined, italic text with right arrow
A menu selection from the menu bar
File > Save
Bold characters A window or dialog button to click
OK, Cancel
Characters in angle brackets < >
A key on the keyboard <Tab>, <Ctrl-C>
Documents (Arial font):
Italic characters Referenced books MPLAB IDE User’s Guide
Table 1: Documentation Conventions (Continued)
Description Represents Examples
XXXXX = The document number.
A = The revision level of the document.
2001 Microchip Technology Inc. DS51159B-page 21
MPLAB® ICE User’s Guide
Recommended ReadingThis user’s guide describes how to use MPLAB ICE. Other useful documents are listed below.
README.ICEFor the latest information on using MPLAB ICE, read the README.ICE file (an ASCII text file) on the MPLAB IDE CD-ROM. README.ICE contains update information that may not be included in the MPLAB ICE User’s Guide.
README.XXXFor the latest information on using other tools, refer to an information file about the product that is more current than the printed manual. Check the MPLAB IDE directory for other README files. (In the case of MPASM™, for instance, the file is called README.ASM.)
MPLAB ICE Processor Module and Device Adapter Specification (DS51140)Consult this document for information on the different processor modules and device adaptors available for use with the MPLAB ICE pod.
MPLAB ICE Transition Socket Specification (DS51194)Consult this document for information on transition sockets available for use with MPLAB ICE device adaptors.
Microchip Technical Library CD-ROM (DS00161)This CD-ROM contains comprehensive application notes, data sheets, and technical briefs for all of Microchip products. To obtain this CD-ROM, contact the nearest Microchip Sales and Service location (see back page).
Embedded Control Handbook Vol.1 & 2 and the Embedded Control Handbook Update 2000 (DS00092, DS00167, and DS00711)These handbooks contain a wealth of information about microcontroller applications. To obtain these documents, contact the nearest Microchip sales and service location (see back page).
The application notes described in these manuals are also obtainable from Microchip sales and service locations or from the Microchip website (http://www.microchip.com).
Microsoft® Windows® ManualsThis manual assumes that users are familiar with the Microsoft Windows operating system. Many excellent references exist for this software program, and should be consulted for general operation of Windows.
TroubleshootingSee Chapter 8 for information on common problems.
DS51159B-page 22 2001 Microchip Technology Inc.
General Information
The Microchip Internet Web SiteMicrochip provides on-line support on the Microchip World Wide Web (WWW) site.
The web site is used by Microchip as a means to make files and information easily available to customers. To view the site, the user must have access to the Internet and a web browser, such as Netscape® Communicator or Microsoft® Internet Explorer®. Files are also available for FTP download from our FTP site.
Connecting to the Microchip Internet WebsiteThe Microchip website is available by using your favorite Internet browser to attach to:
http://www.microchip.com
The file transfer site is available by using an FTP service to connect to:
ftp://ftp.microchip.com
The web site and file transfer site provide a variety of services. Users may download files for the latest Development Tools, Data Sheets, Application Notes, User’s Guides, Articles, and Sample Programs. A variety of Microchip specific business information is also available, including listings of Microchip sales offices, distributors and factory representatives. Other data available for consideration is:
• Latest Microchip Press Releases
• Technical Support Section with Frequently Asked Questions
• Design Tips
• Device Errata
• Job Postings
• Microchip Consultant Program Member Listing
• Links to other useful web sites related to Microchip Products
• Conferences for products, development systems, technical information
• Listing of seminars and events
2001 Microchip Technology Inc. DS51159B-page 23
MPLAB® ICE User’s Guide
Development Systems Customer Notification ServiceMicrochip provides a customer notification service to help our customers keep current on Microchip products with the least amount of effort. Once you subscribe to one of our list servers, you will receive e-mail notification whenever we change, update, revise or have errata related to that product family or development tool. See the Microchip web site at www.microchip.com.
The Development Systems list names are:
• Compilers
• Emulators
• Programmers
• MPLAB
• Otools (Other Tools)
Once you have determined the names of the lists that you are interested in, you can subscribe by sending a message to:
with the following as the body:
subscribe <listname> yourname
Here is an example:
subscribe mplab John Doe
To UNSUBSCRIBE from these lists, send a message to:
with the following as the body:
unsubscribe <listname> yourname
Here is an example:
unsubscribe mplab John Doe
The following sections provide descriptions of the available Development Systems lists.
CompilersThe latest information on Microchip C compilers, Linkers and Assemblers. These include MPLAB C17, MPLAB C18, MPLINK™ and MPASM™, as well as the Librarian, MPLIB™ for MPLINK.
To SUBSCRIBE to this list, send a message to:
with the following as the body:
subscribe compilers yourname
DS51159B-page 24 2001 Microchip Technology Inc.
General Information
EmulatorsThe latest information on Microchip In-Circuit Emulators. These include MPLAB ICE and PICMASTER® emulator.
To SUBSCRIBE to this list, send a message to:
with the following as the body:
subscribe emulators yourname
ProgrammersThe latest information on Microchip PICmicro microcontroller (MCU) device programmers. These include PRO MATE® II and PICSTART® Plus.
To SUBSCRIBE to this list, send a message to:
with the following as the body:
subscribe programmers yourname
MPLABThe latest information on Microchip MPLAB IDE, the Windows Integrated Development Environment for development systems tools. This list is focused on MPLAB IDE, MPLAB SIM, MPLAB IDE Project Manager and general editing and debugging features. For specific information on MPLAB IDE compilers, linkers and assemblers, subscribe to the COMPILERS list. For specific information on MPLAB IDE emulators, subscribe to the EMULATORS list. For specific information on MPLAB IDE device programmers, please subscribe to the PROGRAMMERS list.
To SUBSCRIBE to this list, send a message to:
with the following as the body:
subscribe mplab yourname
Otools (Other Tools)The latest information on other development system tools provided by Microchip. For specific information on MPLAB IDE and its integrated tools refer to the other mail lists.
To SUBSCRIBE to this list, send a message to:
with the following as the body:
subscribe otools yourname
2001 Microchip Technology Inc. DS51159B-page 25

MPLAB® ICE User’s Guide
Customer SupportUsers of Microchip products can receive assistance through several channels:
• Distributor or Representative
• Local Sales Office
• Field Application Engineer (FAE)
• Corporate Applications Engineer (CAE)
• Hotline
Customers should call their distributor, representative or field application engineer (FAE) for support. Local sales offices are also available to help customers. See the back cover for a listing of sales offices and locations.
Corporate Applications Engineers (CAEs) may be contacted at (480) 792-7627.
In addition, there is a Systems Information and Upgrade Line. This line provides system users a listing of the latest versions of all of Microchip's development systems software products. Plus, this line provides information on how customers can receive any currently available upgrade kits.
The Hotline Numbers are:
1-800-755-2345 for U.S. and most of Canada.
1-480-792-7302 for the rest of the world.
DS51159B-page 26 2001 Microchip Technology Inc.
2001 Microchip Technology Inc. DS51159B-page 27
MPLAB® ICE USER’S GUIDE12Chapter 1. Overview and Installation
1.1 IntroductionThis chapter gives you an overview of the MPLAB ICE system and then explains how to install the system hardware and software.
1.2 HighlightsThis chapter discusses:
• What MPLAB ICE Is
• MPLAB ICE System Components
• How MPLAB ICE Helps You
• MPLAB ICE Kit Components
• Installing MPLAB ICE Hardware
• Applying Power to the System Components
• Installing MPLAB IDE Software
1.3 What MPLAB ICE IsMPLAB ICE is an In-Circuit Emulator (ICE) designed to emulate all PICmicro® microcontroller (MCU) devices. It uses the latest emulation processors to provide full speed emulation and visibility into both the instruction and the data paths during execution.
MPLAB ICE 2000 performs basic functions such as run, halt, single step, software break points and instruction address trace, plus features such as data monitoring, complex triggering, expanded trace and code coverage.
MPLAB ICE support is integrated into MPLAB, Microchip’s Integrated Development Environment (IDE). The MPLAB desktop provides an environment for developing and debugging your application.
This document covers the basic setup and operation of the MPLAB ICE emulator, but it does not cover all functions of the MPLAB IDE. Read the MPLAB User’s Guide (DS51025) to get a full understanding of the features and debug capabilities of the MPLAB IDE.
MPLAB® ICE User’s Guide
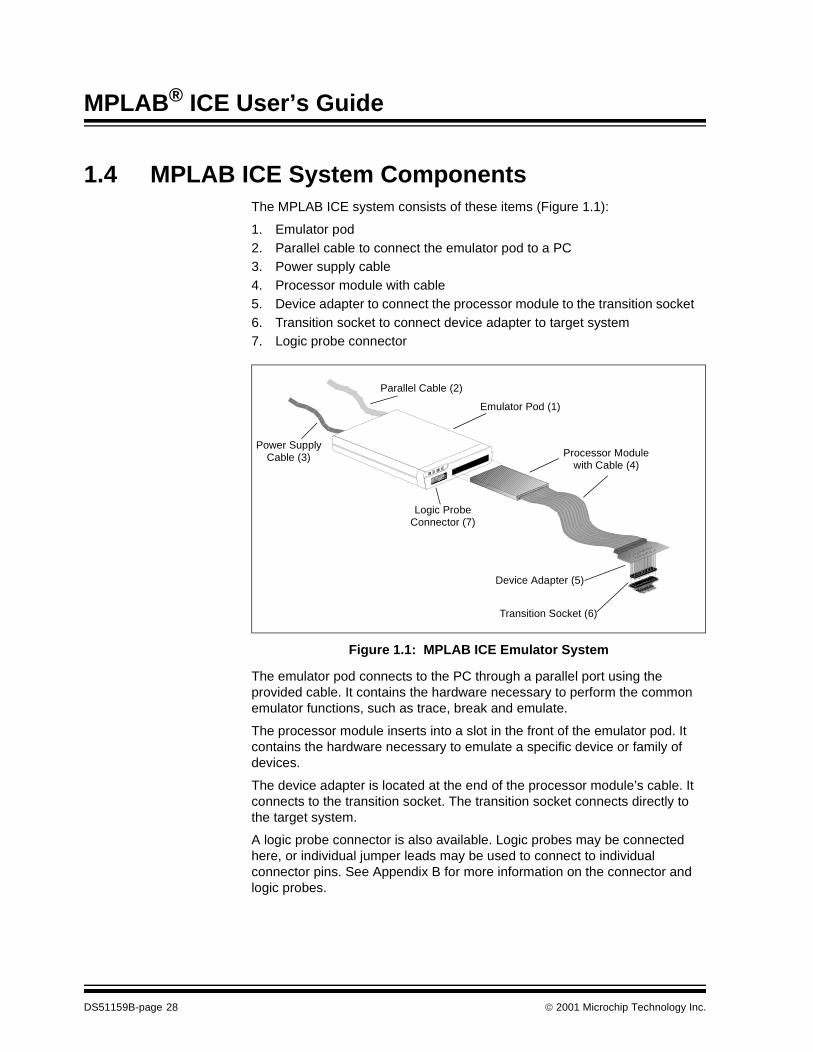
1.4 MPLAB ICE System ComponentsThe MPLAB ICE system consists of these items (Figure 1.1):
1. Emulator pod2. Parallel cable to connect the emulator pod to a PC3. Power supply cable4. Processor module with cable5. Device adapter to connect the processor module to the transition socket6. Transition socket to connect device adapter to target system7. Logic probe connector
Figure 1.1: MPLAB ICE Emulator System
The emulator pod connects to the PC through a parallel port using the provided cable. It contains the hardware necessary to perform the common emulator functions, such as trace, break and emulate.
The processor module inserts into a slot in the front of the emulator pod. It contains the hardware necessary to emulate a specific device or family of devices.
The device adapter is located at the end of the processor module’s cable. It connects to the transition socket. The transition socket connects directly to the target system.
A logic probe connector is also available. Logic probes may be connected here, or individual jumper leads may be used to connect to individual connector pins. See Appendix B for more information on the connector and logic probes.
Parallel Cable (2)
Power SupplyCable (3)
Emulator Pod (1)
Processor Modulewith Cable (4)
Logic ProbeConnector (7)
Device Adapter (5)
Transition Socket (6)
DS51159B-page 28 2001 Microchip Technology Inc.
Overview and Installation
1.5 How MPLAB ICE Helps YouMPLAB ICE allows you to:
• Debug your application on your own hardware in real time.
• Debug with both hardware and software break points.
• Measure timing between events.
• Set break points based on internal and/or external signals.
• Monitor internal file registers.
• Emulate full speed up to 40 MHz (depending on the device).
• Select the oscillator source in software.
• Program the application clock speed.
• Trace data bus activity and time stamp events.
• Set complex triggers based on program and data bus events, and external inputs.
Note: Certain processor modules do not support data bus event monitor-ing.
2001 Microchip Technology Inc. DS51159B-page 29
MPLAB® ICE User’s Guide
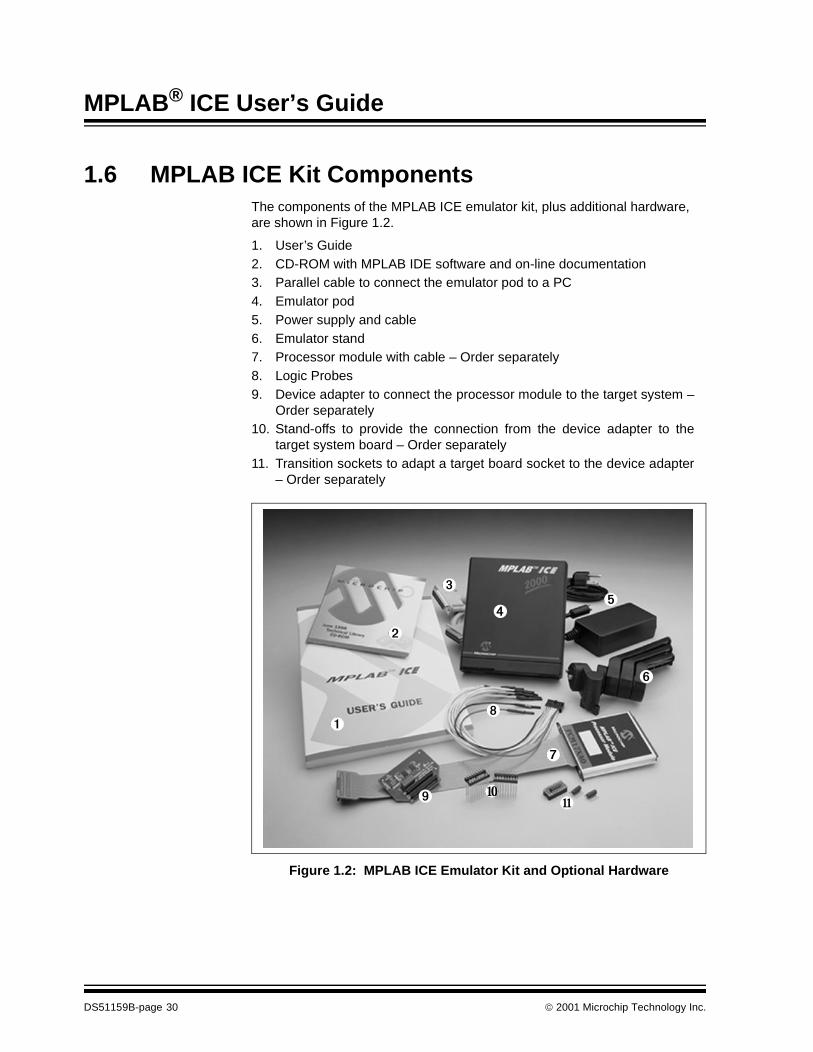
1.6 MPLAB ICE Kit ComponentsThe components of the MPLAB ICE emulator kit, plus additional hardware, are shown in Figure 1.2.
1. User’s Guide2. CD-ROM with MPLAB IDE software and on-line documentation3. Parallel cable to connect the emulator pod to a PC4. Emulator pod5. Power supply and cable6. Emulator stand7. Processor module with cable – Order separately8. Logic Probes9. Device adapter to connect the processor module to the target system –
Order separately10. Stand-offs to provide the connection from the device adapter to the
target system board – Order separately11. Transition sockets to adapt a target board socket to the device adapter
– Order separately
Figure 1.2: MPLAB ICE Emulator Kit and Optional Hardware
�
�
�
�
��
�
�
❿11
DS51159B-page 30 2001 Microchip Technology Inc.
Overview and Installation
1.7 Installing MPLAB ICE HardwareFollow the steps in this section to install the emulator hardware.
• Locate an unused LPT port
It is recommended that MPLAB ICE be run directly off a parallel port,without the use of a switchbox or a pass-through, since MPLAB ICE usesits own communications protocol.
If the parallel port is already in use, install an additional parallel port foruse with MPLAB ICE only.
• Connect the MPLAB ICE pod to the parallel port using the parallel cable.
Connect one end of the parallel cable to the parallel connector on theMPLAB ICE pod and connect the other end to the LPT port on the PCchassis. Secure both ends with the cable screws.
• Install the processor module.
Insert the processor module firmly into the front of the MPLAB ICE pod.To remove the processor module, place one finger behind each tab onthe front of the processor module and pull firmly. DO NOT pull on thecable.
• Connect the logic probes.
Plug the logic probes into the logic probe connector found on the front ofthe emulator pod.
• Attach the power supply.
Make certain that the MPLAB ICE pod on/off switch is in the “O” or “off”position before completing this step. Plug the appropriate ends of thepower supply into a power outlet and into the back of the MPLAB ICEpod.
WARNING
Neither the PC nor MPLAB ICE should have power turned on at this time.
WARNINGUsing MPLAB ICE in conjunction with a security key, external disk drive, or other parallel device (i.e., printer, Zip® drive, scanner) may result in permanent damage to that device.
2001 Microchip Technology Inc. DS51159B-page 31
MPLAB® ICE User’s Guide
If using a target board with the MPLAB ICE system:
• Install the device adapter and transition socket.
Attach the device adapter to the end of the cable on the processormodule. Then, plug the device adapter into the transition socket on thetarget board.
1.8 Applying Power to the System ComponentsMPLAB ICE must be run with an external power supply.
To prevent damage to any of the subsystem or target application parts, power up (and power down) the system components as specified below.
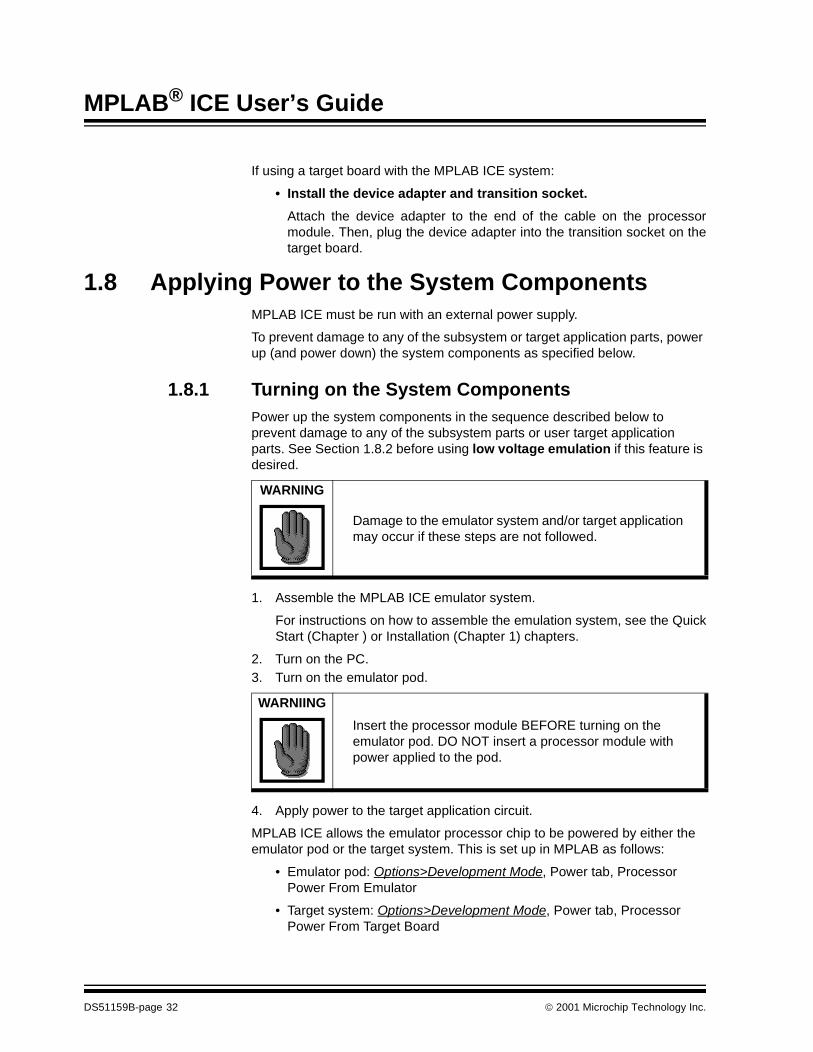
1.8.1 Turning on the System ComponentsPower up the system components in the sequence described below to prevent damage to any of the subsystem parts or user target application parts. See Section 1.8.2 before using low voltage emulation if this feature is desired.
1. Assemble the MPLAB ICE emulator system.
For instructions on how to assemble the emulation system, see the QuickStart (Chapter ) or Installation (Chapter 1) chapters.
2. Turn on the PC.3. Turn on the emulator pod.
4. Apply power to the target application circuit.
MPLAB ICE allows the emulator processor chip to be powered by either the emulator pod or the target system. This is set up in MPLAB as follows:
• Emulator pod: Options>Development Mode, Power tab, Processor Power From Emulator
• Target system: Options>Development Mode, Power tab, Processor Power From Target Board
WARNING
Damage to the emulator system and/or target application may occur if these steps are not followed.
WARNIING
Insert the processor module BEFORE turning on the emulator pod. DO NOT insert a processor module with power applied to the pod.
DS51159B-page 32 2001 Microchip Technology Inc.
Overview and Installation
Refer to the MPLAB ICE Processor Module and Device Adapter Specification (DS51140) for processor module power requirements before configuring the system for target system power.
When connecting to a target application system, you may notice a voltage level on the target application, even though you have not yet applied power to the target application circuit. This is normal and is due to current leakage of protection diodes through VCC of the Device Adapter. The current leakage will typically be less than 20 mA. However, if the target application is using a voltage regulator, it should be noted that some regulators require the use of an external shunt diode between VIN and VOUT for reverse-bias protection. Refer to the manufacture’s data sheets for additional information.
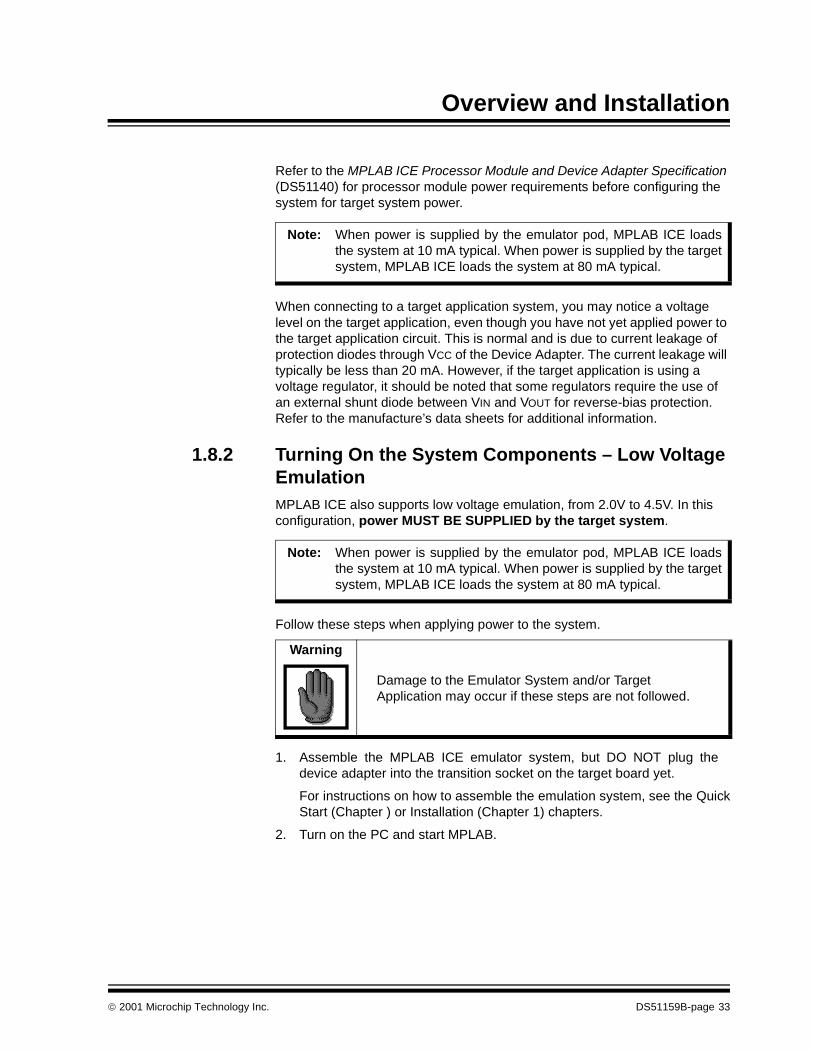
1.8.2 Turning On the System Components – Low Voltage EmulationMPLAB ICE also supports low voltage emulation, from 2.0V to 4.5V. In this configuration, power MUST BE SUPPLIED by the target system.
Follow these steps when applying power to the system.
1. Assemble the MPLAB ICE emulator system, but DO NOT plug thedevice adapter into the transition socket on the target board yet.
For instructions on how to assemble the emulation system, see the QuickStart (Chapter ) or Installation (Chapter 1) chapters.
2. Turn on the PC and start MPLAB.
Note: When power is supplied by the emulator pod, MPLAB ICE loadsthe system at 10 mA typical. When power is supplied by the targetsystem, MPLAB ICE loads the system at 80 mA typical.
Note: When power is supplied by the emulator pod, MPLAB ICE loadsthe system at 10 mA typical. When power is supplied by the targetsystem, MPLAB ICE loads the system at 80 mA typical.
Warning
Damage to the Emulator System and/or Target Application may occur if these steps are not followed.
2001 Microchip Technology Inc. DS51159B-page 33
MPLAB® ICE User’s Guide
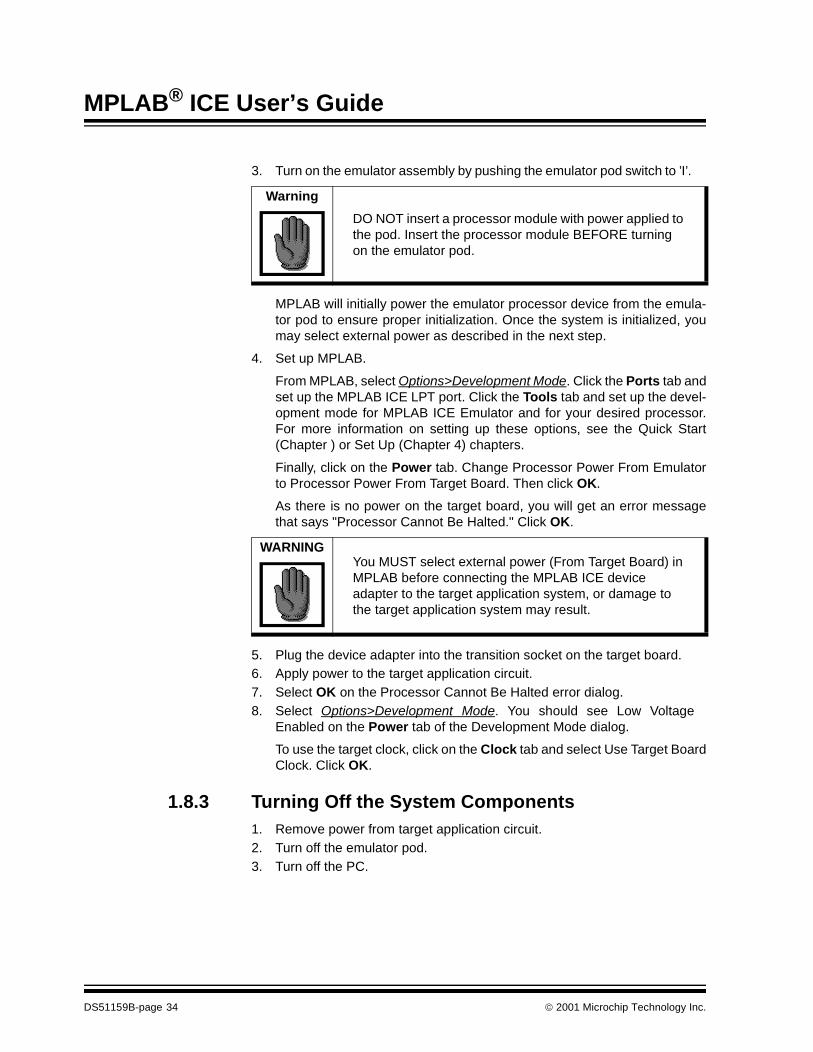
3. Turn on the emulator assembly by pushing the emulator pod switch to ’I’.
MPLAB will initially power the emulator processor device from the emula-tor pod to ensure proper initialization. Once the system is initialized, youmay select external power as described in the next step.
4. Set up MPLAB.
From MPLAB, select Options>Development Mode. Click the Ports tab andset up the MPLAB ICE LPT port. Click the Tools tab and set up the devel-opment mode for MPLAB ICE Emulator and for your desired processor.For more information on setting up these options, see the Quick Start(Chapter ) or Set Up (Chapter 4) chapters.
Finally, click on the Power tab. Change Processor Power From Emulatorto Processor Power From Target Board. Then click OK.
As there is no power on the target board, you will get an error messagethat says "Processor Cannot Be Halted." Click OK.
5. Plug the device adapter into the transition socket on the target board.6. Apply power to the target application circuit.7. Select OK on the Processor Cannot Be Halted error dialog.8. Select Options>Development Mode. You should see Low Voltage
Enabled on the Power tab of the Development Mode dialog.
To use the target clock, click on the Clock tab and select Use Target BoardClock. Click OK.
1.8.3 Turning Off the System Components1. Remove power from target application circuit.2. Turn off the emulator pod.3. Turn off the PC.
Warning
DO NOT insert a processor module with power applied to the pod. Insert the processor module BEFORE turning on the emulator pod.
WARNINGYou MUST select external power (From Target Board) in MPLAB before connecting the MPLAB ICE device adapter to the target application system, or damage to the target application system may result.
DS51159B-page 34 2001 Microchip Technology Inc.
2001 Microchip Technology Inc. DS51159B-page 35
Overview and Installation
1.9 Installing MPLAB IDE SoftwareTo install the MPLAB IDE software, refer to the installation instructions found in the MPLAB User’s Guide (DS51025).
The MPLAB ICE emulator functions with MPLAB IDE software under the following operating systems:
• Microsoft Windows 3.1x
• Windows 95/98
• Windows NT® 3.51 or greater
• Windows 2000

MPLAB® ICE User’s Guide
NOTES:
DS51159B-page 36 2001 Microchip Technology Inc.
2001 Microchip Technology Inc. DS51159B-page 37
MPLAB® ICE USER’S GUIDE12Chapter 2. Tutorial - PIC16CXXX
2.1 IntroductionAfter installing the MPLAB ICE hardware and MPLAB software, you may wish to try this tutorial to get you started.
2.2 HighlightsThis tutorial covers:
• Reviewing the Hardware
• Running MPLAB
• Setting Up the Development Mode
• Creating a Project
• Building a Project
• Using Software Break Points
• Using Named Software Break Points
• Using Hardware Break Points
• Using the Complex Trigger
• Using Code Coverage
• Going Forward
2.3 Reviewing the HardwareThe hardware setup used for this tutorial is listed below:
• PC LPT Port: LPT1, Bidirectional mode
• MPLAB ICE pod: MPLAB ICE 2000
• MPLAB ICE processor module: PCM16XE1
Although you may use an LPT port other than LPT1, it is preferable to use this port if possible. Also, bi-directional mode is the preferred mode of operation, although compatibility mode will work but will be slower.
The processor module for many mid-range PICmicro MCU’s is used in this tutorial. The PIC16C74B is used as the example processor. However, other PIC16CXXX processors could be used with minor modifications.

MPLAB® ICE User’s Guide
2.4 Running MPLABAfter installing MPLAB IDE software, invoke it by executing the file MPLAB.EXE.
For more information on using MPLAB, refer to the MPLAB User’s Guide (DS51025) and the included file README.LAB.
Figure 2.1: MPLAB IDE
DS51159B-page 38 2001 Microchip Technology Inc.

Tutorial - PIC16CXXX
2.5 Setting Up the Development ModeOpen the Development Mode dialog (Options>Development Mode) to set up the MPLAB ICE emulator for use with MPLAB IDE software. Set up the development mode by clicking on each tab of the dialog and setting options as specified below.
2.5.1 Ports TabThe Ports tab displays information about the available LPT ports on the host PC.
Figure 2.2: Development Mode Dialog – Ports Tab
Select an available LPT port from the dropdown list. To determine how this LPT port is configured on your system, click Query Port Info. The preferred mode of operation for MPLAB ICE is bi-directional mode (PS/2, EPP and ECP types).
Click Apply to accept the setting of this tab.
If you have any problems configuring the LPT port, please refer to the detailed Set Up (Chapter 4) or Troubleshooting (Chapter 8) chapter.
2001 Microchip Technology Inc. DS51159B-page 39

MPLAB® ICE User’s Guide
2.5.2 Tools TabThe Tools tab displays development mode and device information.
Figure 2.3: Development Mode Dialog – Tools Tab
Select the MPLAB ICE emulator for the development mode.
Choose the PIC16C74B processor to emulate from the dropdown list. Below the processor is a brief description of any limitations that exist for emulating this processor on the MPLAB ICE emulator. A more detailed description of limitations may be viewed by clicking on Details.
Click Apply to accept the setting of this tab.
WARNINGDo not select the MPLAB ICE Emulator mode if any other device (i.e., printer, Zip drive, scanner) is installed on the parallel port or permanent damage to that device may result.
DS51159B-page 40 2001 Microchip Technology Inc.
Tutorial - PIC16CXXX
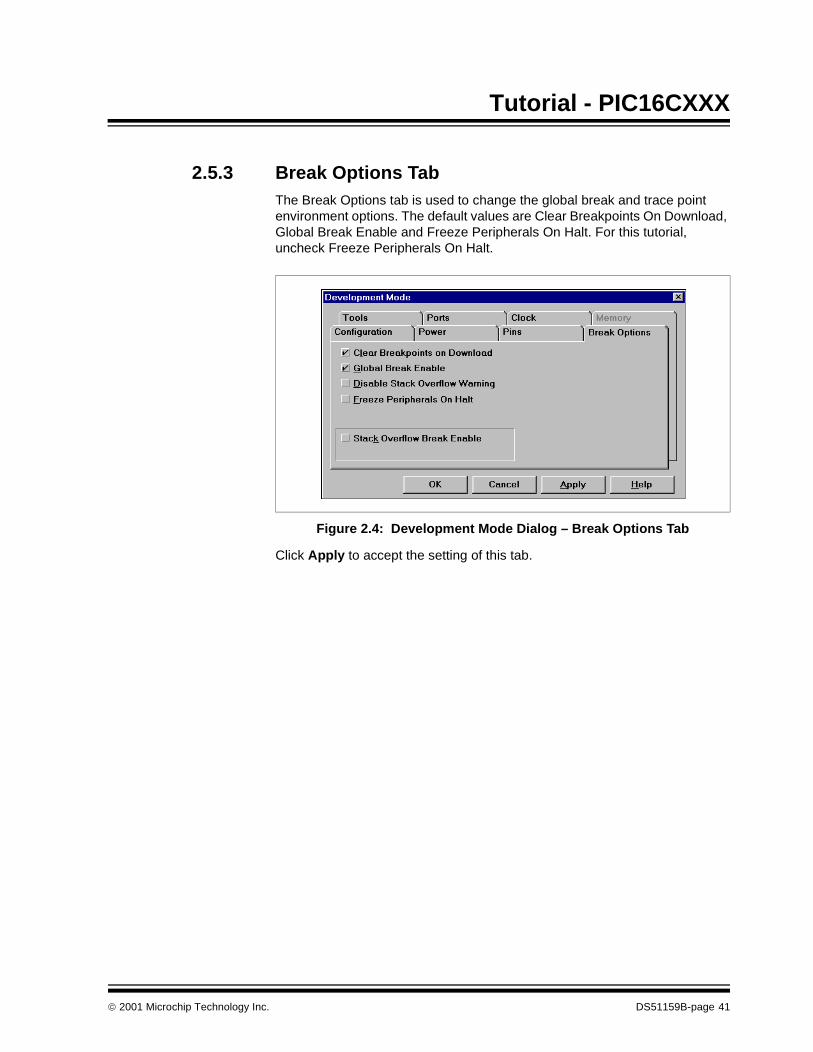
2.5.3 Break Options TabThe Break Options tab is used to change the global break and trace point environment options. The default values are Clear Breakpoints On Download, Global Break Enable and Freeze Peripherals On Halt. For this tutorial, uncheck Freeze Peripherals On Halt.
Figure 2.4: Development Mode Dialog – Break Options Tab
Click Apply to accept the setting of this tab.
2001 Microchip Technology Inc. DS51159B-page 41
MPLAB® ICE User’s Guide
2.5.4 Other TabsNo other tabs need to be edited. However, you may wish to view them to familiarize yourself with the options available on them.
• Power tab: Displays system power information. The default is Proces-sor Power From Emulator.
• Clock tab: Displays oscillator type and frequency information. The default is the on-board clock with Oscillator Type as LP and Desired Frequency as 4.0 MHz.
• Memory tab: Use this tab to set the memory configuration being used. This tab is not available for the selected processor.
• Configuration tab: Use this tab to set up the Watchdog Timer and/or Processor Mode, (i.e., internal and external memory). The default is Watch Dog Timer disabled (None). Processor mode is not available for the selected processor.
• Pins tab: Use this tab to set up pins, such as enable/disable master clear (MCLR). This option is not available for the selected processor.
When you are through, click OK to accept the setting and close the Development Mode dialog.
2.6 Creating a ProjectThe best way to develop an application using MPLAB IDE software is to create a project. In this tutorial, you are going to create a project named icetut16.pjt. Before doing this however, you should create a folder called icetut16 in which to place the new project. Also, you should copy the file icetut16.asm from the MPLAB install directory to this project directory to keep all project files in one place.
DS51159B-page 42 2001 Microchip Technology Inc.

Tutorial - PIC16CXXX
Create a new project by selecting Project > New Project. The New Project dialog will appear.
Figure 2.5: New Project Dialog
Find the directory you created for the project and then name the project icetut16.pjt. Click OK to close this dialog and open the Edit Project dialog.
Figure 2.6: Edit Project Dialog – Hex File Only
2001 Microchip Technology Inc. DS51159B-page 43

MPLAB® ICE User’s Guide
The only file listed in the Project Files section of this dialog is icetut16 [.hex], which will become the output file.
Next to the Project Files section are a group of buttons, one of which, the Add Node Button, is active. Click on it now to open the Add Node dialog.
Figure 2.7: Add Node Dialog
Find the ASM file you copied into the project directory and click on its name to select it. If you could not file this file, or if it was missing, type icetut16.asm in the File name box of the dialog.
Click OK to close this dialog and return to the Edit Project dialog.
Note: If you are using a version of MPLAB IDE that has not been recentlyinstalled, (i.e., the default configurations may have been changed),you will need to:
• click on the Hex file to activate the Node Properties button
• click on this button to open the Node Properties dialog
• select MPASM as the Language Tool in this dialog
• click OK to close this dialog and return to the Edit Project dialog
DS51159B-page 44 2001 Microchip Technology Inc.
Tutorial - PIC16CXXX
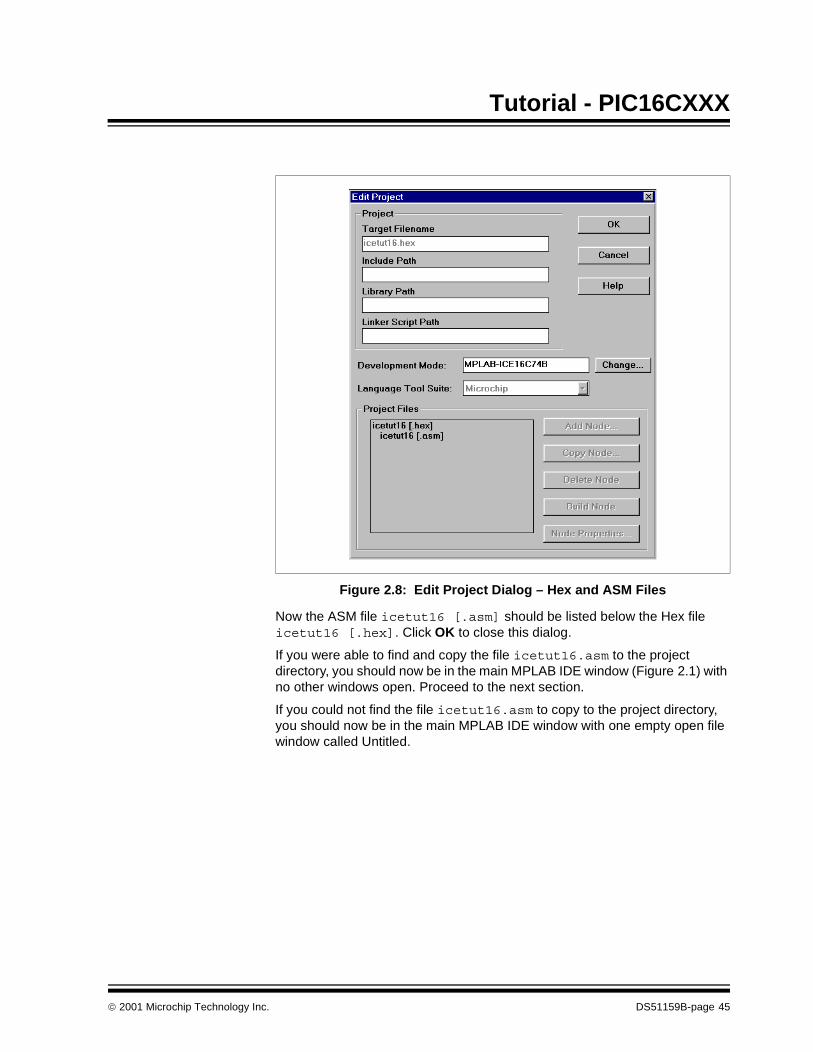
Figure 2.8: Edit Project Dialog – Hex and ASM Files
Now the ASM file icetut16 [.asm] should be listed below the Hex file icetut16 [.hex]. Click OK to close this dialog.
If you were able to find and copy the file icetut16.asm to the project directory, you should now be in the main MPLAB IDE window (Figure 2.1) with no other windows open. Proceed to the next section.
If you could not find the file icetut16.asm to copy to the project directory, you should now be in the main MPLAB IDE window with one empty open file window called Untitled.
2001 Microchip Technology Inc. DS51159B-page 45
MPLAB® ICE User’s Guide
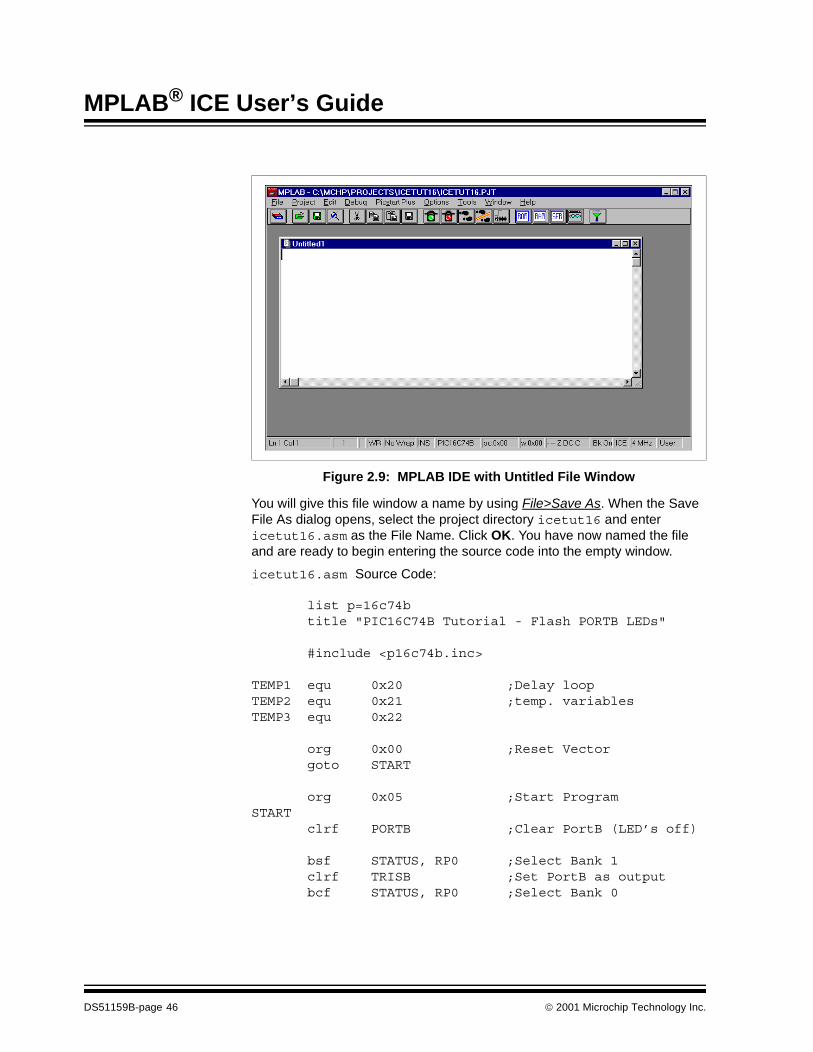
Figure 2.9: MPLAB IDE with Untitled File Window
You will give this file window a name by using File>Save As. When the Save File As dialog opens, select the project directory icetut16 and enter icetut16.asm as the File Name. Click OK. You have now named the file and are ready to begin entering the source code into the empty window.
icetut16.asm Source Code:
list p=16c74b title "PIC16C74B Tutorial - Flash PORTB LEDs"
#include <p16c74b.inc>
TEMP1 equ 0x20 ;Delay loopTEMP2 equ 0x21 ;temp. variablesTEMP3 equ 0x22
org 0x00 ;Reset Vector goto START
org 0x05 ;Start ProgramSTART clrf PORTB ;Clear PortB (LED’s off)
bsf STATUS, RP0 ;Select Bank 1 clrf TRISB ;Set PortB as output bcf STATUS, RP0 ;Select Bank 0
DS51159B-page 46 2001 Microchip Technology Inc.
Tutorial - PIC16CXXX
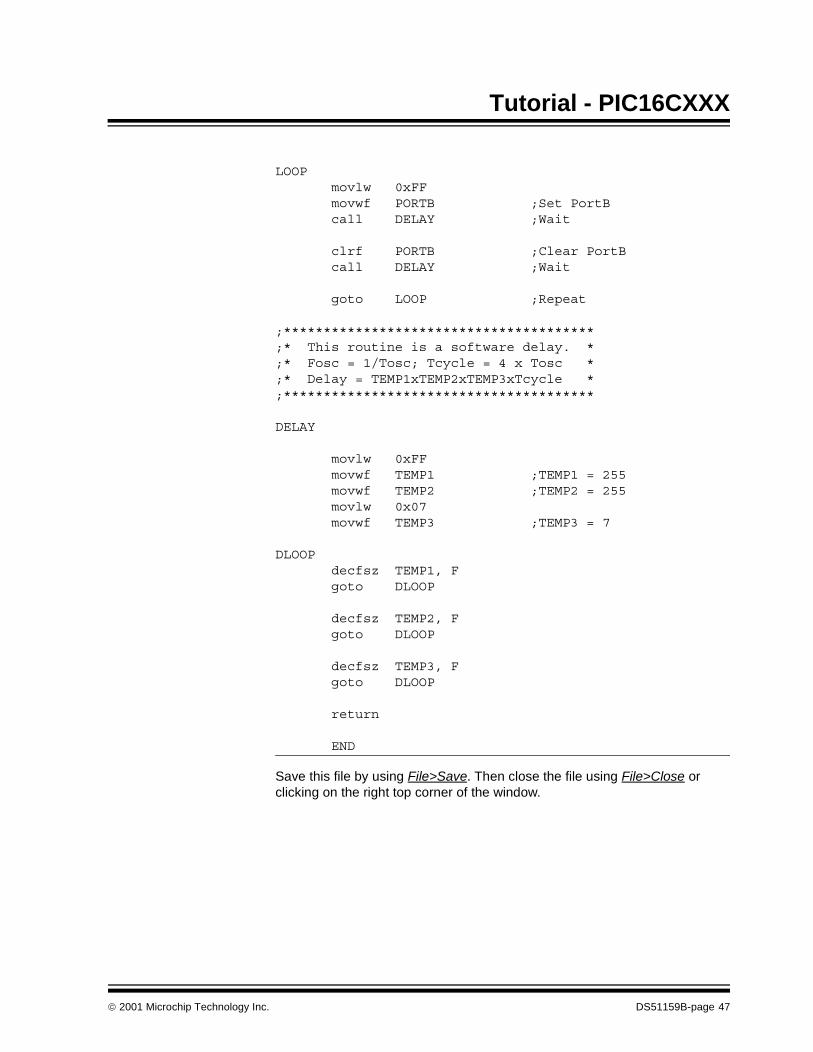
LOOP movlw 0xFF movwf PORTB ;Set PortB call DELAY ;Wait
clrf PORTB ;Clear PortB call DELAY ;Wait
goto LOOP ;Repeat
;***************************************;* This routine is a software delay. *;* Fosc = 1/Tosc; Tcycle = 4 x Tosc *;* Delay = TEMP1xTEMP2xTEMP3xTcycle *;***************************************
DELAY
movlw 0xFF movwf TEMP1 ;TEMP1 = 255 movwf TEMP2 ;TEMP2 = 255 movlw 0x07 movwf TEMP3 ;TEMP3 = 7
DLOOP decfsz TEMP1, F goto DLOOP
decfsz TEMP2, F goto DLOOP
decfsz TEMP3, F goto DLOOP
return
END
Save this file by using File>Save. Then close the file using File>Close or clicking on the right top corner of the window.
2001 Microchip Technology Inc. DS51159B-page 47
MPLAB® ICE User’s Guide
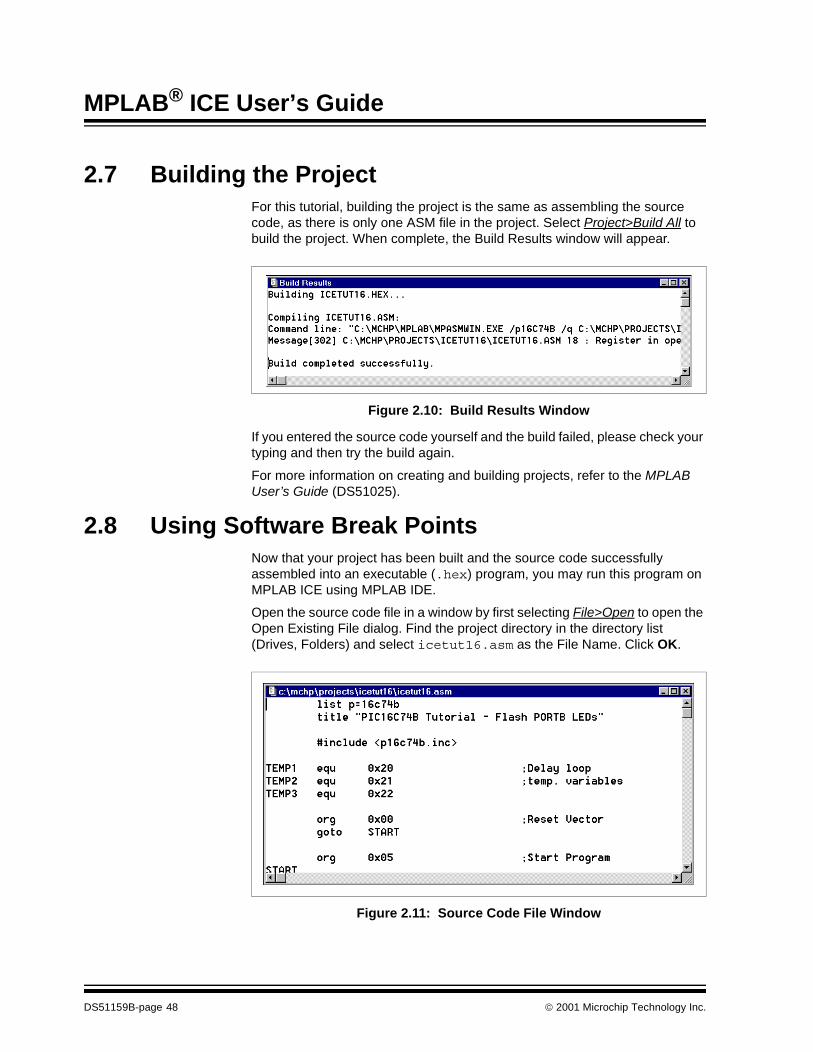
2.7 Building the ProjectFor this tutorial, building the project is the same as assembling the source code, as there is only one ASM file in the project. Select Project>Build All to build the project. When complete, the Build Results window will appear.
Figure 2.10: Build Results Window
If you entered the source code yourself and the build failed, please check your typing and then try the build again.
For more information on creating and building projects, refer to the MPLAB User’s Guide (DS51025).
2.8 Using Software Break PointsNow that your project has been built and the source code successfully assembled into an executable (.hex) program, you may run this program on MPLAB ICE using MPLAB IDE.
Open the source code file in a window by first selecting File>Open to open the Open Existing File dialog. Find the project directory in the directory list (Drives, Folders) and select icetut16.asm as the File Name. Click OK.
Figure 2.11: Source Code File Window
DS51159B-page 48 2001 Microchip Technology Inc.

Tutorial - PIC16CXXX
Next, open a new watch window by selecting Window>Watch Windows>New Watch Window. Scroll down in the scroll list of the Add Watch Window dialog until you find PORTB. Click on it to select the PORTB Symbol. Click Add. The PORTB symbol should now appear in the watch window Watch_1 (Figure 2.12). Click Close to close the Add Watch Window dialog.
Figure 2.12: Watch Window
Now you will set a software break point in the source code file window. Go to the main loop of the program and click the right mouse button on the line movwf PORTB. A menu will appear. Select Software Break Point(s). The line of code will change color. If you don’t like this color, you may change it by selecting Options>Environment Setup, clicking the Color tab, and selecting a different Color for Break Point Text.
Figure 2.13: Set Software Break Point
Run the program by selecting Debug>Run>Run or by clicking the toolbar green stoplight icon. The status bar on the bottom of the MPLAB IDE window will change color, indicating that the program is running. The program will halt when it reaches the break point.
2001 Microchip Technology Inc. DS51159B-page 49

MPLAB® ICE User’s Guide
Single step by selecting Debug>Run>Step, by pressing <F7> or by clicking the toolbar single step icon. You should now see that the value of PORTB in the Watch_1 watch window has changed from H’00’ to H’FF’ and should be a different color.
This demonstrates how software break points work with MPLAB ICE. The break point halts an emulation run before the line of code it is associated with is executed. By single stepping once, the code is executed and displayed in the watch window.
You may also set a temporary break point by selecting Run to Here instead of Software Break Point(s) from the right mouse button menu.
2.9 Using Named Software Break PointsMPLAB allows up to 16 named software break points. These break points can be selectively enabled and disabled. Break points set in this manner are retained with the project. Right mouse button menu break points are not.
Reset the program by selecting Debug>System Reset or by clicking on the toolbar reset processor icon. This will clear all break points.
Open the Break Point Settings dialog by selecting Debug>Break Settings. Enter 0x000A into the Start box of the dialog to place the break1 break point at the instruction movwf PORTB. Click Add.
Figure 2.14: Break Point Settings Dialog
Note: To determine the address of an instruction, use the Program Mem-ory Window (Window>Program Memory).
DS51159B-page 50 2001 Microchip Technology Inc.
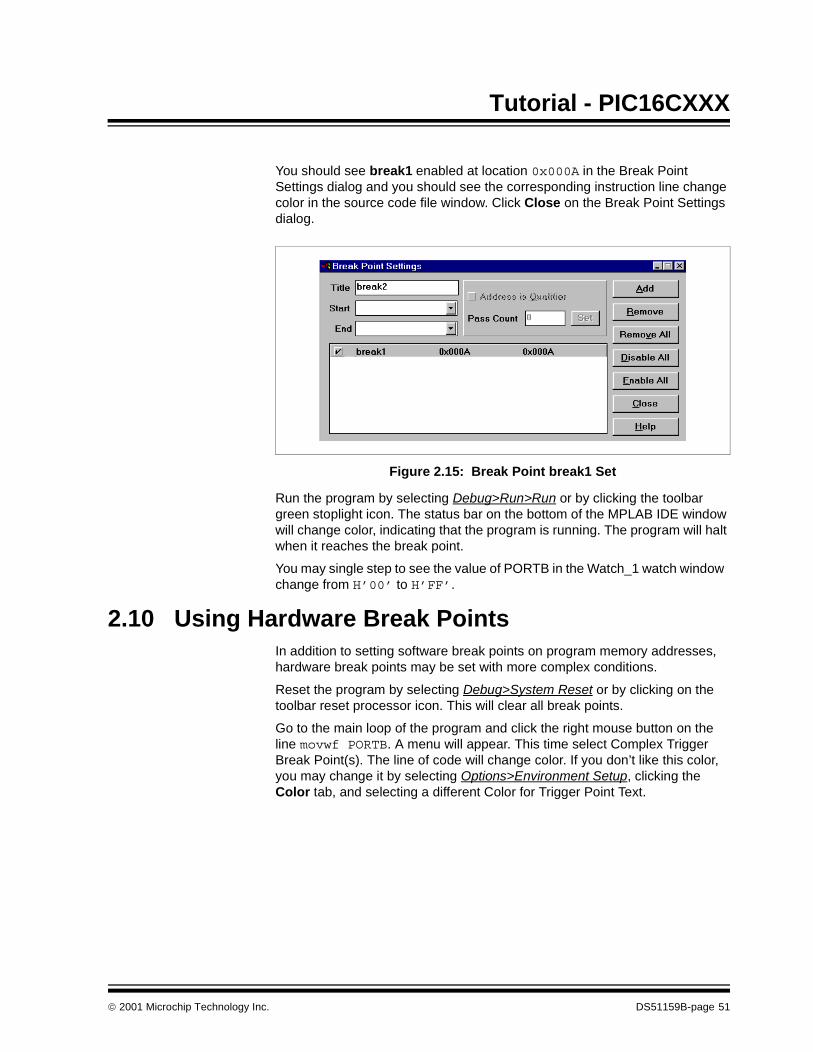
Tutorial - PIC16CXXX
You should see break1 enabled at location 0x000A in the Break Point Settings dialog and you should see the corresponding instruction line change color in the source code file window. Click Close on the Break Point Settings dialog.
Figure 2.15: Break Point break1 Set
Run the program by selecting Debug>Run>Run or by clicking the toolbar green stoplight icon. The status bar on the bottom of the MPLAB IDE window will change color, indicating that the program is running. The program will halt when it reaches the break point.
You may single step to see the value of PORTB in the Watch_1 watch window change from H’00’ to H’FF’.
2.10 Using Hardware Break PointsIn addition to setting software break points on program memory addresses, hardware break points may be set with more complex conditions.
Reset the program by selecting Debug>System Reset or by clicking on the toolbar reset processor icon. This will clear all break points.
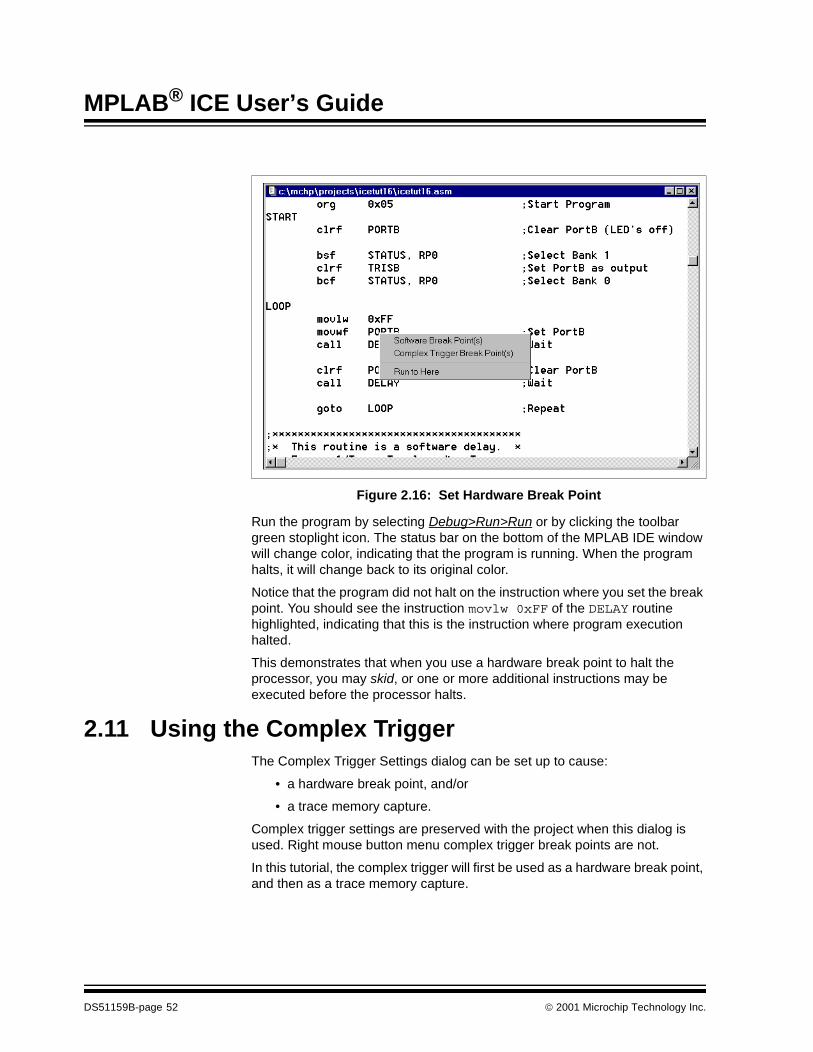
Go to the main loop of the program and click the right mouse button on the line movwf PORTB. A menu will appear. This time select Complex Trigger Break Point(s). The line of code will change color. If you don’t like this color, you may change it by selecting Options>Environment Setup, clicking the Color tab, and selecting a different Color for Trigger Point Text.
2001 Microchip Technology Inc. DS51159B-page 51
MPLAB® ICE User’s Guide
Figure 2.16: Set Hardware Break Point
Run the program by selecting Debug>Run>Run or by clicking the toolbar green stoplight icon. The status bar on the bottom of the MPLAB IDE window will change color, indicating that the program is running. When the program halts, it will change back to its original color.
Notice that the program did not halt on the instruction where you set the break point. You should see the instruction movlw 0xFF of the DELAY routine highlighted, indicating that this is the instruction where program execution halted.
This demonstrates that when you use a hardware break point to halt the processor, you may skid, or one or more additional instructions may be executed before the processor halts.
2.11 Using the Complex TriggerThe Complex Trigger Settings dialog can be set up to cause:
• a hardware break point, and/or
• a trace memory capture.
Complex trigger settings are preserved with the project when this dialog is used. Right mouse button menu complex trigger break points are not.
In this tutorial, the complex trigger will first be used as a hardware break point, and then as a trace memory capture.
DS51159B-page 52 2001 Microchip Technology Inc.
Tutorial - PIC16CXXX
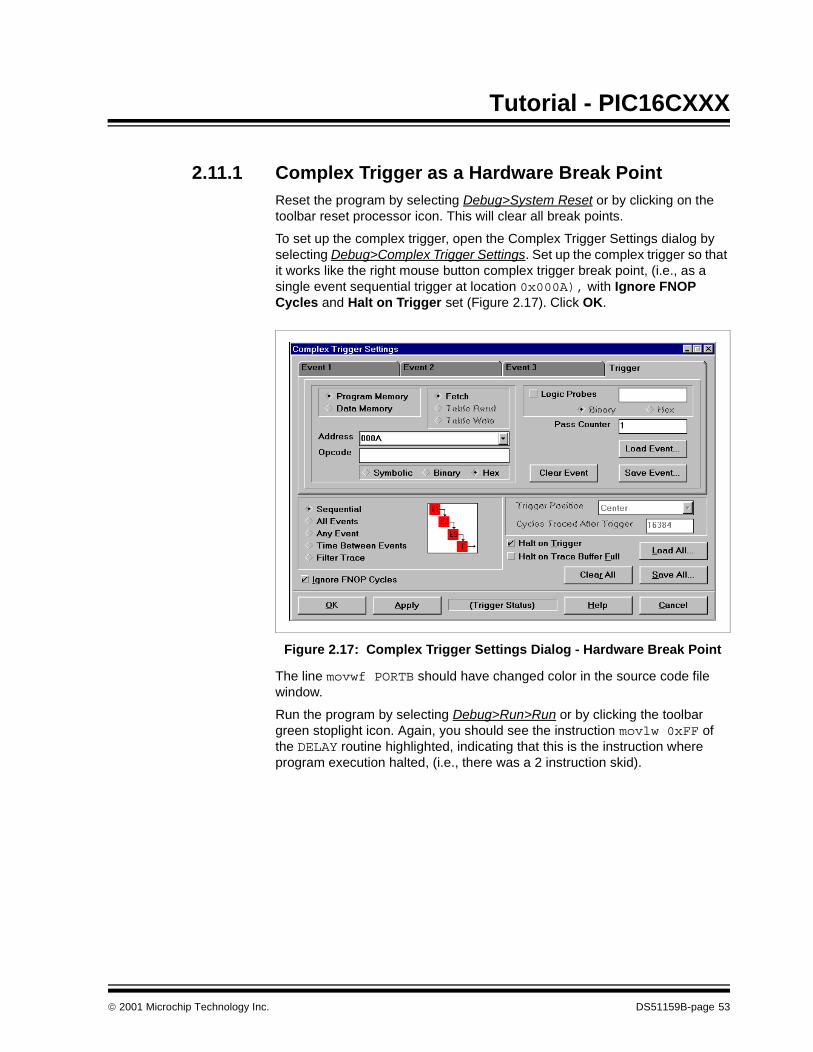
2.11.1 Complex Trigger as a Hardware Break PointReset the program by selecting Debug>System Reset or by clicking on the toolbar reset processor icon. This will clear all break points.
To set up the complex trigger, open the Complex Trigger Settings dialog by selecting Debug>Complex Trigger Settings. Set up the complex trigger so that it works like the right mouse button complex trigger break point, (i.e., as a single event sequential trigger at location 0x000A), with Ignore FNOP Cycles and Halt on Trigger set (Figure 2.17). Click OK.
Figure 2.17: Complex Trigger Settings Dialog - Hardware Break Point
The line movwf PORTB should have changed color in the source code file window.
Run the program by selecting Debug>Run>Run or by clicking the toolbar green stoplight icon. Again, you should see the instruction movlw 0xFF of the DELAY routine highlighted, indicating that this is the instruction where program execution halted, (i.e., there was a 2 instruction skid).
2001 Microchip Technology Inc. DS51159B-page 53
MPLAB® ICE User’s Guide
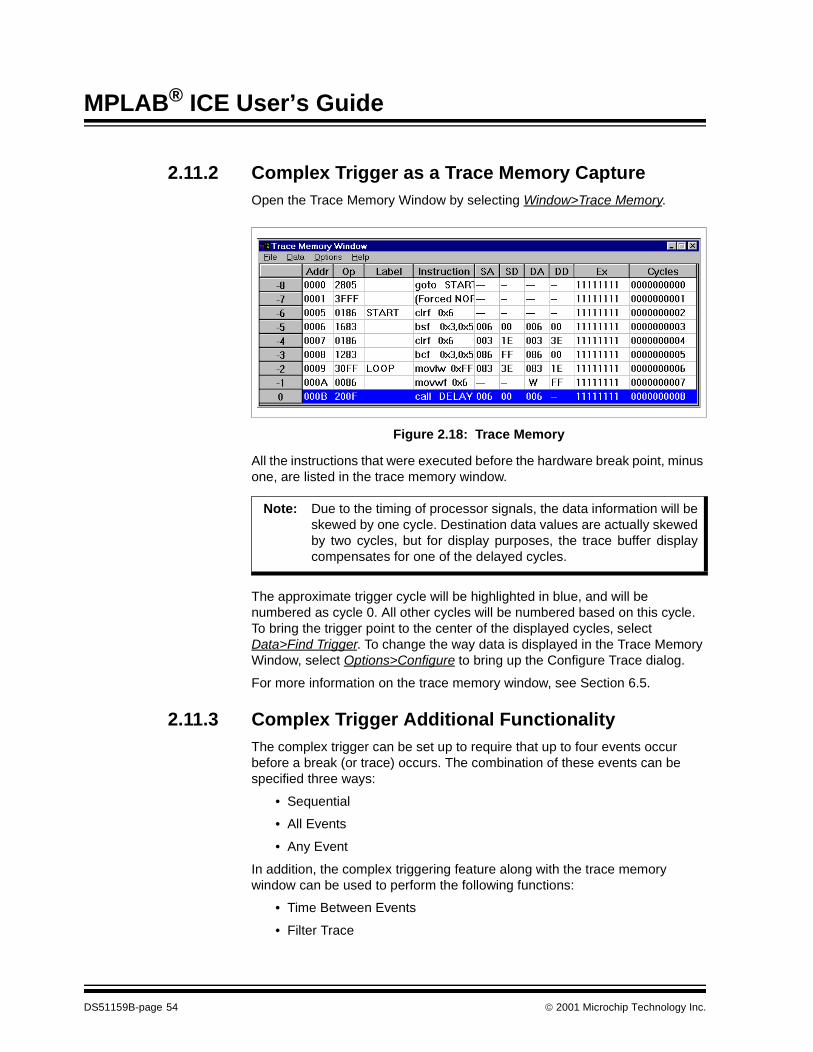
2.11.2 Complex Trigger as a Trace Memory CaptureOpen the Trace Memory Window by selecting Window>Trace Memory.
Figure 2.18: Trace Memory
All the instructions that were executed before the hardware break point, minus one, are listed in the trace memory window.
The approximate trigger cycle will be highlighted in blue, and will be numbered as cycle 0. All other cycles will be numbered based on this cycle. To bring the trigger point to the center of the displayed cycles, select Data>Find Trigger. To change the way data is displayed in the Trace Memory Window, select Options>Configure to bring up the Configure Trace dialog.
For more information on the trace memory window, see Section 6.5.
2.11.3 Complex Trigger Additional FunctionalityThe complex trigger can be set up to require that up to four events occur before a break (or trace) occurs. The combination of these events can be specified three ways:
• Sequential
• All Events
• Any Event
In addition, the complex triggering feature along with the trace memory window can be used to perform the following functions:
• Time Between Events
• Filter Trace
Note: Due to the timing of processor signals, the data information will beskewed by one cycle. Destination data values are actually skewedby two cycles, but for display purposes, the trace buffer displaycompensates for one of the delayed cycles.
DS51159B-page 54 2001 Microchip Technology Inc.
Tutorial - PIC16CXXX
For more information on complex triggering, as well as complex triggering examples, see Section 6.3.
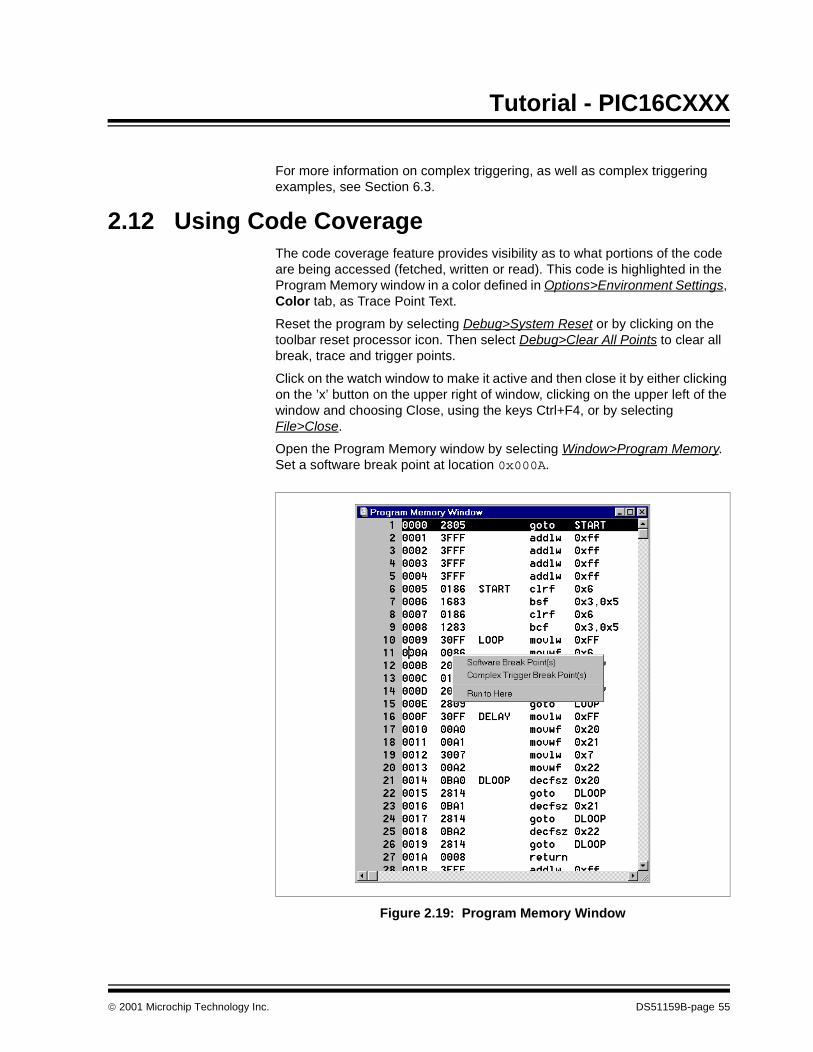
2.12 Using Code CoverageThe code coverage feature provides visibility as to what portions of the code are being accessed (fetched, written or read). This code is highlighted in the Program Memory window in a color defined in Options>Environment Settings, Color tab, as Trace Point Text.
Reset the program by selecting Debug>System Reset or by clicking on the toolbar reset processor icon. Then select Debug>Clear All Points to clear all break, trace and trigger points.
Click on the watch window to make it active and then close it by either clicking on the ’x’ button on the upper right of window, clicking on the upper left of the window and choosing Close, using the keys Ctrl+F4, or by selecting File>Close.
Open the Program Memory window by selecting Window>Program Memory. Set a software break point at location 0x000A.
Figure 2.19: Program Memory Window
2001 Microchip Technology Inc. DS51159B-page 55
MPLAB® ICE User’s Guide
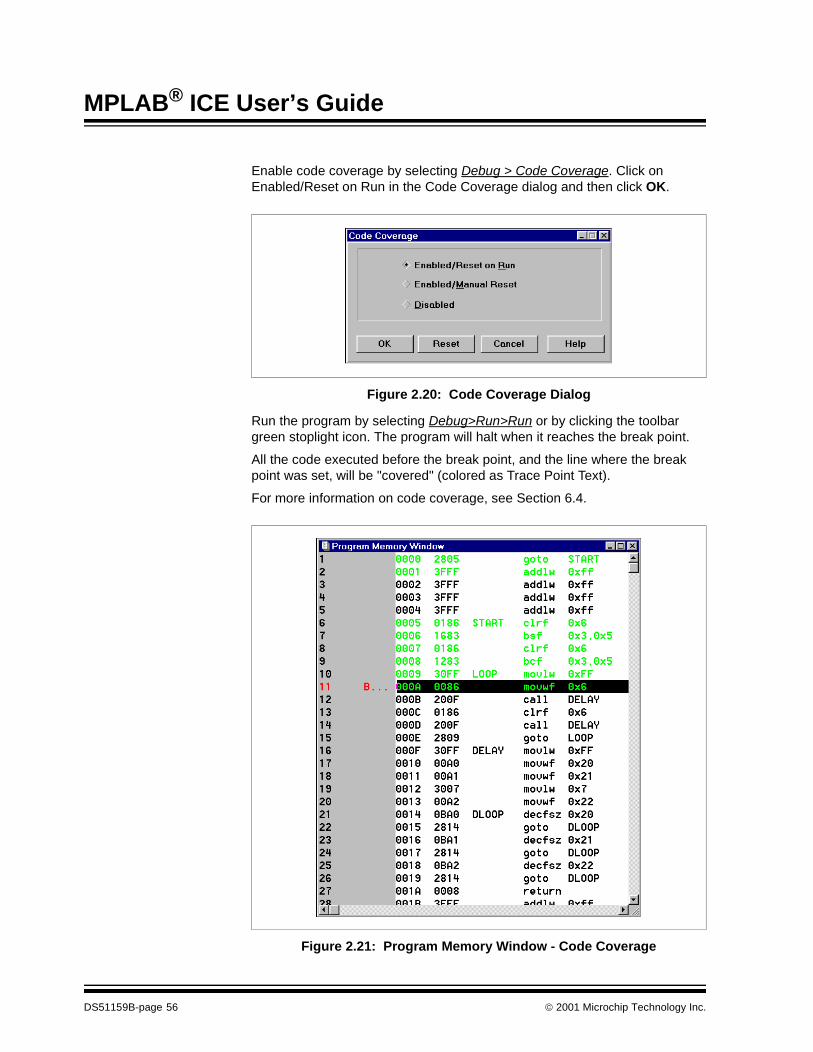
Enable code coverage by selecting Debug > Code Coverage. Click on Enabled/Reset on Run in the Code Coverage dialog and then click OK.
Figure 2.20: Code Coverage Dialog
Run the program by selecting Debug>Run>Run or by clicking the toolbar green stoplight icon. The program will halt when it reaches the break point.
All the code executed before the break point, and the line where the break point was set, will be "covered" (colored as Trace Point Text).
For more information on code coverage, see Section 6.4.
Figure 2.21: Program Memory Window - Code Coverage
DS51159B-page 56 2001 Microchip Technology Inc.
Tutorial - PIC16CXXX
2.13 Going ForwardYou have now completed the PIC16CXXX tutorial on MPLAB ICE and MPLAB IDE functionality. The simple examples shown here should give you a beginner’s knowledge of working with the emulator and software. For more detailed information on usage for your individual applications, please refer to the Basic (Chapter 5) and Advanced (Chapter 6) Features chapters.
2001 Microchip Technology Inc. DS51159B-page 57

MPLAB® ICE User’s Guide
NOTES:
DS51159B-page 58 2001 Microchip Technology Inc.

2001 Microchip Technology Inc. DS51159B-page 59
MPLAB® ICE USER’S GUIDE12Chapter 3. Tutorial - PIC18CXXX
3.1 IntroductionAfter installing the MPLAB ICE hardware and MPLAB software, you may wish to try this tutorial to get you started.
3.2 HighlightsThis tutorial covers:
• Reviewing the Hardware
• Running MPLAB
• Setting Up the Development Mode
• Creating a Project
• Building a Project
• Using Software Break Points
• Using Named Software Break Points
• Using Hardware Break Points
• Using the Complex Trigger
• Using Code Coverage
• Going Forward
3.3 Reviewing the HardwareThe hardware setup used for this tutorial is listed below:
• PC LPT Port: LPT1, Bidirectional mode
• MPLAB ICE pod: MPLAB ICE 2000
• MPLAB ICE processor module: PCM18XA0
Although you may use an LPT port other than LPT1, it is preferable to use this port if possible. Also, bi-directional mode is the preferred mode of operation, although compatibility mode will work but will be slower.
The processor module for PIC18CXX2 PICmicro MCU’s is used in this tutorial. The PIC18C252 is used as the example processor. However, other PIC18CXX2 processors could be used.
MPLAB® ICE User’s Guide
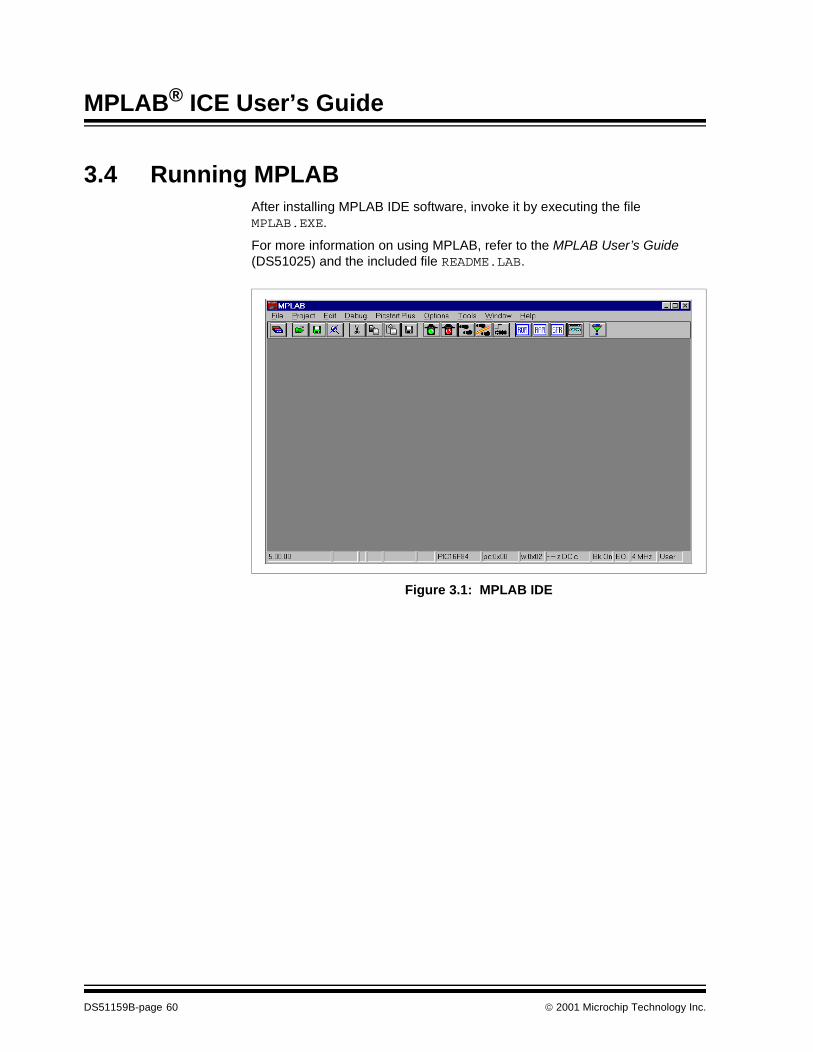
3.4 Running MPLABAfter installing MPLAB IDE software, invoke it by executing the file MPLAB.EXE.
For more information on using MPLAB, refer to the MPLAB User’s Guide (DS51025) and the included file README.LAB.
Figure 3.1: MPLAB IDE
DS51159B-page 60 2001 Microchip Technology Inc.
Tutorial - PIC18CXXX
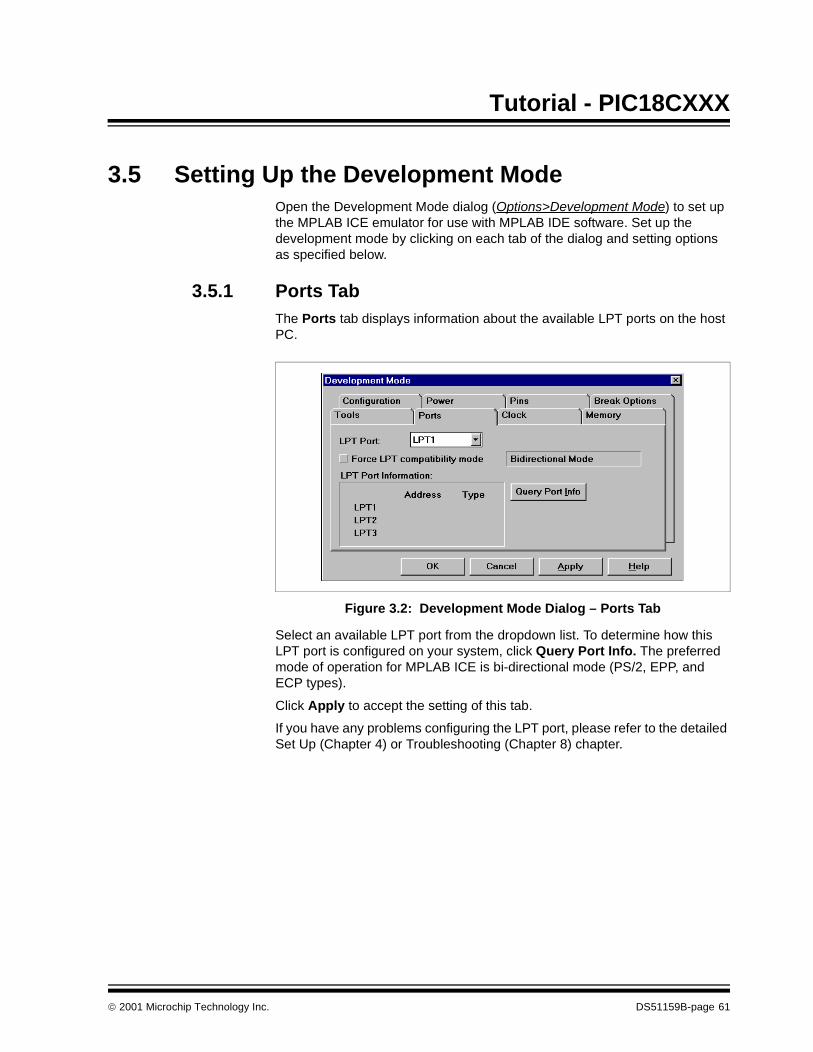
3.5 Setting Up the Development ModeOpen the Development Mode dialog (Options>Development Mode) to set up the MPLAB ICE emulator for use with MPLAB IDE software. Set up the development mode by clicking on each tab of the dialog and setting options as specified below.
3.5.1 Ports TabThe Ports tab displays information about the available LPT ports on the host PC.
Figure 3.2: Development Mode Dialog – Ports Tab
Select an available LPT port from the dropdown list. To determine how this LPT port is configured on your system, click Query Port Info. The preferred mode of operation for MPLAB ICE is bi-directional mode (PS/2, EPP, and ECP types).
Click Apply to accept the setting of this tab.
If you have any problems configuring the LPT port, please refer to the detailed Set Up (Chapter 4) or Troubleshooting (Chapter 8) chapter.
2001 Microchip Technology Inc. DS51159B-page 61
MPLAB® ICE User’s Guide
3.5.2 Tools TabThe Tools tab displays development mode and device information.
Figure 3.3: Development Mode Dialog – Tools Tab
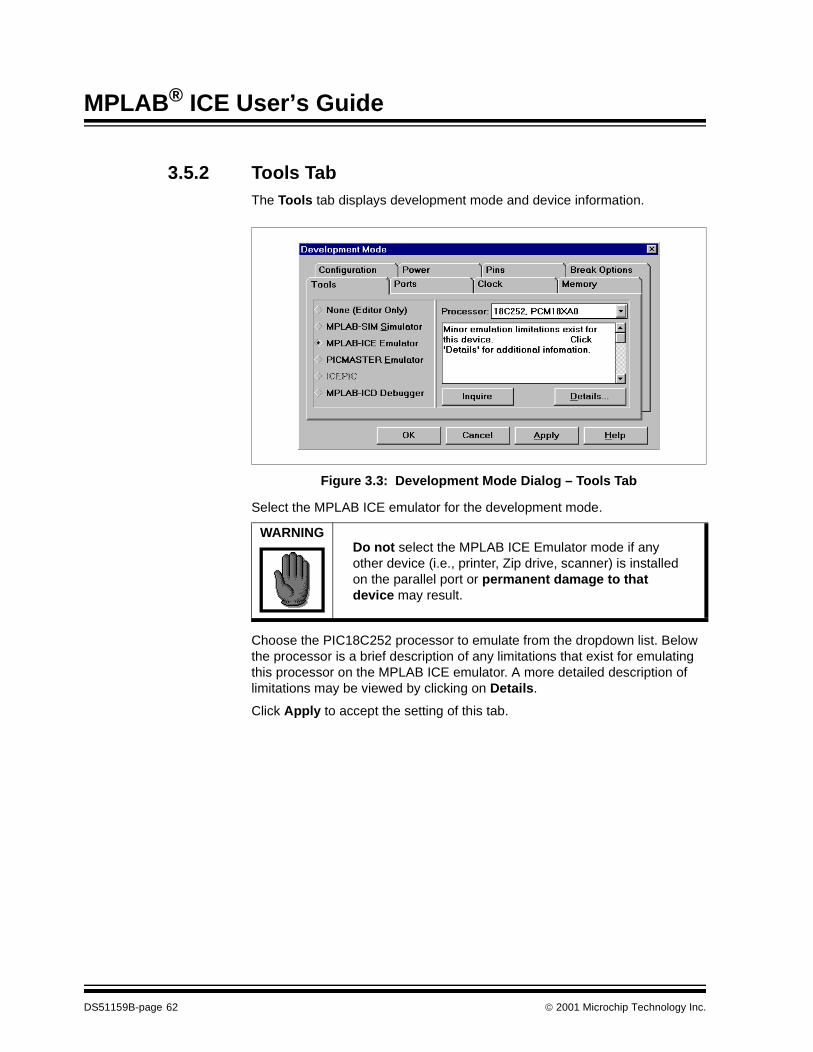
Select the MPLAB ICE emulator for the development mode.
Choose the PIC18C252 processor to emulate from the dropdown list. Below the processor is a brief description of any limitations that exist for emulating this processor on the MPLAB ICE emulator. A more detailed description of limitations may be viewed by clicking on Details.
Click Apply to accept the setting of this tab.
WARNINGDo not select the MPLAB ICE Emulator mode if any other device (i.e., printer, Zip drive, scanner) is installed on the parallel port or permanent damage to that device may result.
DS51159B-page 62 2001 Microchip Technology Inc.
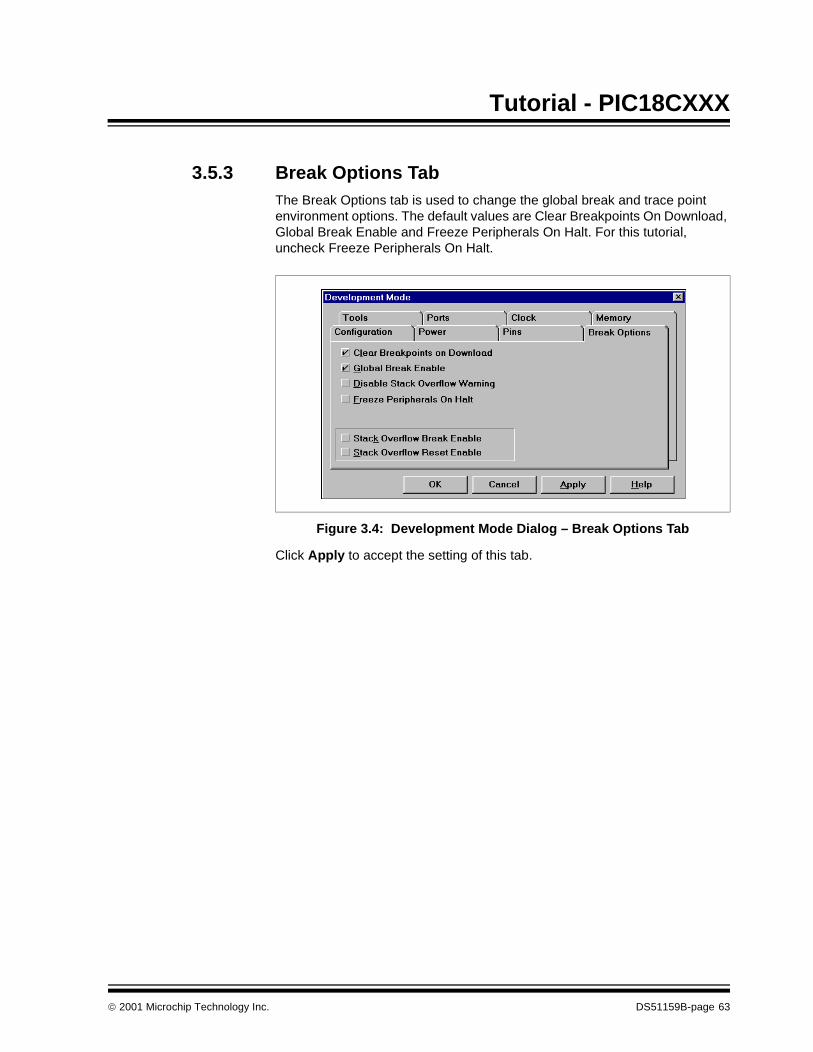
Tutorial - PIC18CXXX
3.5.3 Break Options TabThe Break Options tab is used to change the global break and trace point environment options. The default values are Clear Breakpoints On Download, Global Break Enable and Freeze Peripherals On Halt. For this tutorial, uncheck Freeze Peripherals On Halt.
Figure 3.4: Development Mode Dialog – Break Options Tab
Click Apply to accept the setting of this tab.
2001 Microchip Technology Inc. DS51159B-page 63
MPLAB® ICE User’s Guide
3.5.4 Other TabsNo other tabs need to be edited. However, you may wish to view them to familiarize yourself with the options available on them.
• Power tab: Displays system power information. The default is Proces-sor Power From Emulator.
• Clock tab: Displays oscillator type and frequency information. The default is the on-board clock with Oscillator Type as LP and Desired Frequency as 4.0 MHz.
• Memory tab: Use this tab to set the memory configuration being used and to enable/disable long writes. The default is all memory from the emulator and long writes enabled. Memory configuration is not avail-able for the selected processor.
• Configuration tab: Use this tab to set up the Watchdog Timer and/or Processor Mode, (i.e., internal and external memory). The defaults are Watch Dog Timer disabled (None) and Microcontroller Processor Mode (internal memory). Processor Mode selection is not available for the selected processor.
• Pins tab: Use this tab to set up pins. You may enable/disable master clear (MCLR), MUX CCP2 with RB3 and/or enable/disable the OSC switch. MCLR enable/disable is not available for the selected proces-sor.
When you are through, click OK to accept the setting and close the Development Mode dialog.
3.6 Creating a ProjectThe best way to develop an application using MPLAB IDE software is to create a project. In this tutorial, you are going to create a project named icetut18.pjt. Before doing this, however, you should create a folder called icetut18 in which to place the new project. Also, you should copy the file icetut18.asm from the MPLAB install directory to this project directory to keep all project files in one place.
DS51159B-page 64 2001 Microchip Technology Inc.
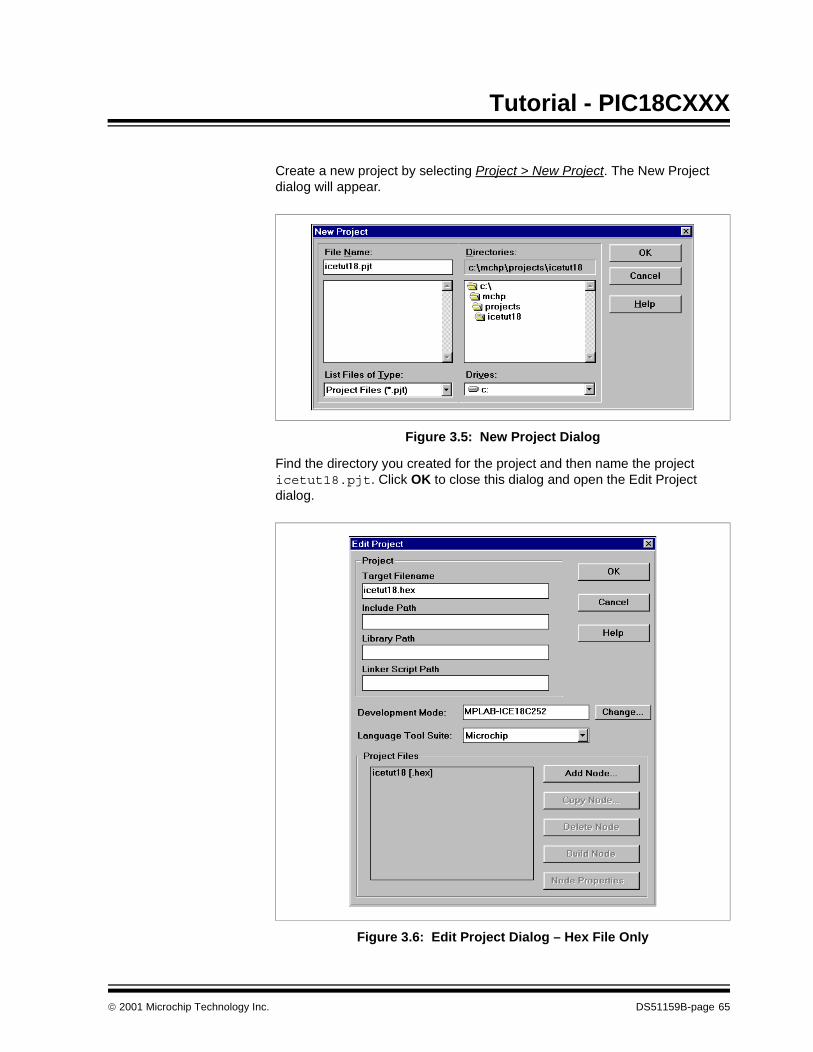
Tutorial - PIC18CXXX
Create a new project by selecting Project > New Project. The New Project dialog will appear.
Figure 3.5: New Project Dialog
Find the directory you created for the project and then name the project icetut18.pjt. Click OK to close this dialog and open the Edit Project dialog.
Figure 3.6: Edit Project Dialog – Hex File Only
2001 Microchip Technology Inc. DS51159B-page 65
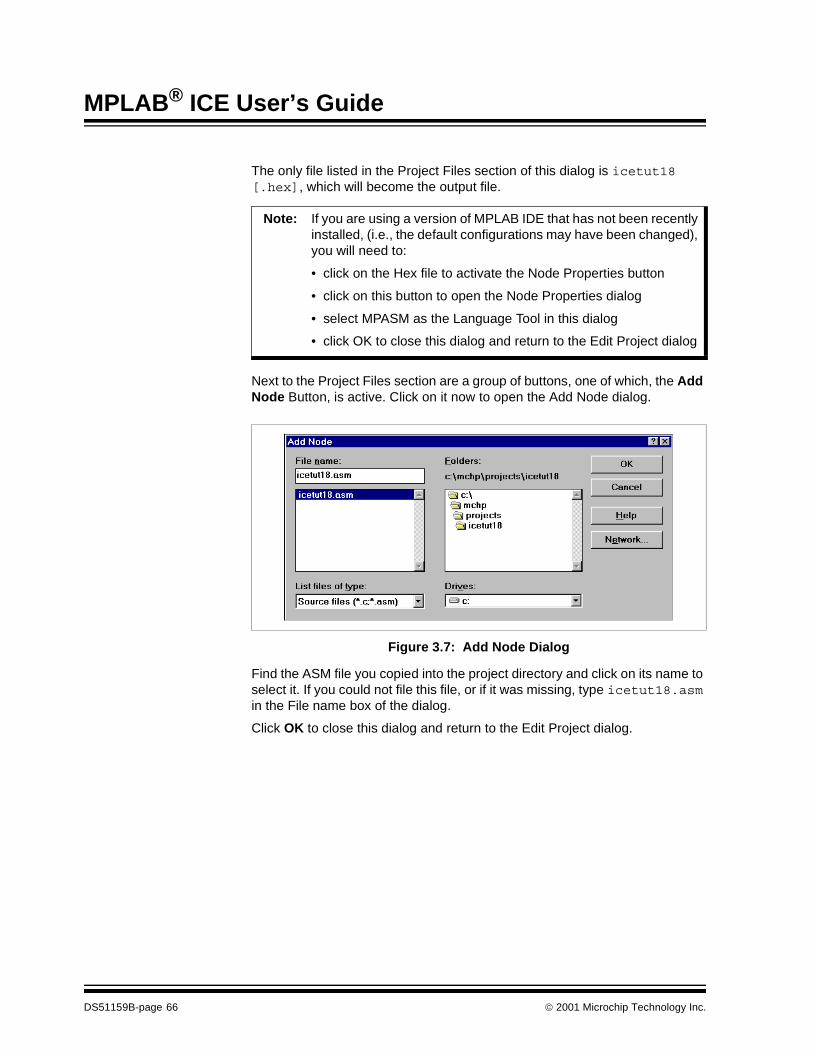
MPLAB® ICE User’s Guide
The only file listed in the Project Files section of this dialog is icetut18 [.hex], which will become the output file.
Next to the Project Files section are a group of buttons, one of which, the Add Node Button, is active. Click on it now to open the Add Node dialog.
Figure 3.7: Add Node Dialog
Find the ASM file you copied into the project directory and click on its name to select it. If you could not file this file, or if it was missing, type icetut18.asm in the File name box of the dialog.
Click OK to close this dialog and return to the Edit Project dialog.
Note: If you are using a version of MPLAB IDE that has not been recentlyinstalled, (i.e., the default configurations may have been changed),you will need to:
• click on the Hex file to activate the Node Properties button
• click on this button to open the Node Properties dialog
• select MPASM as the Language Tool in this dialog
• click OK to close this dialog and return to the Edit Project dialog
DS51159B-page 66 2001 Microchip Technology Inc.

Tutorial - PIC18CXXX
Figure 3.8: Edit Project Dialog – Hex and ASM Files
Now the ASM file icetut18 [.asm] should be listed below the Hex file icetut18 [.hex]. Click OK to close this dialog.
If you were able to find and copy the file icetut18.asm to the project directory, you should now be in the main MPLAB IDE window (Figure 3.1) with no other windows open. Proceed to the next section.
If you could not find the file icetut18.asm to copy to the project directory, you should now be in the main MPLAB IDE window with one empty open file window called Untitled.
2001 Microchip Technology Inc. DS51159B-page 67
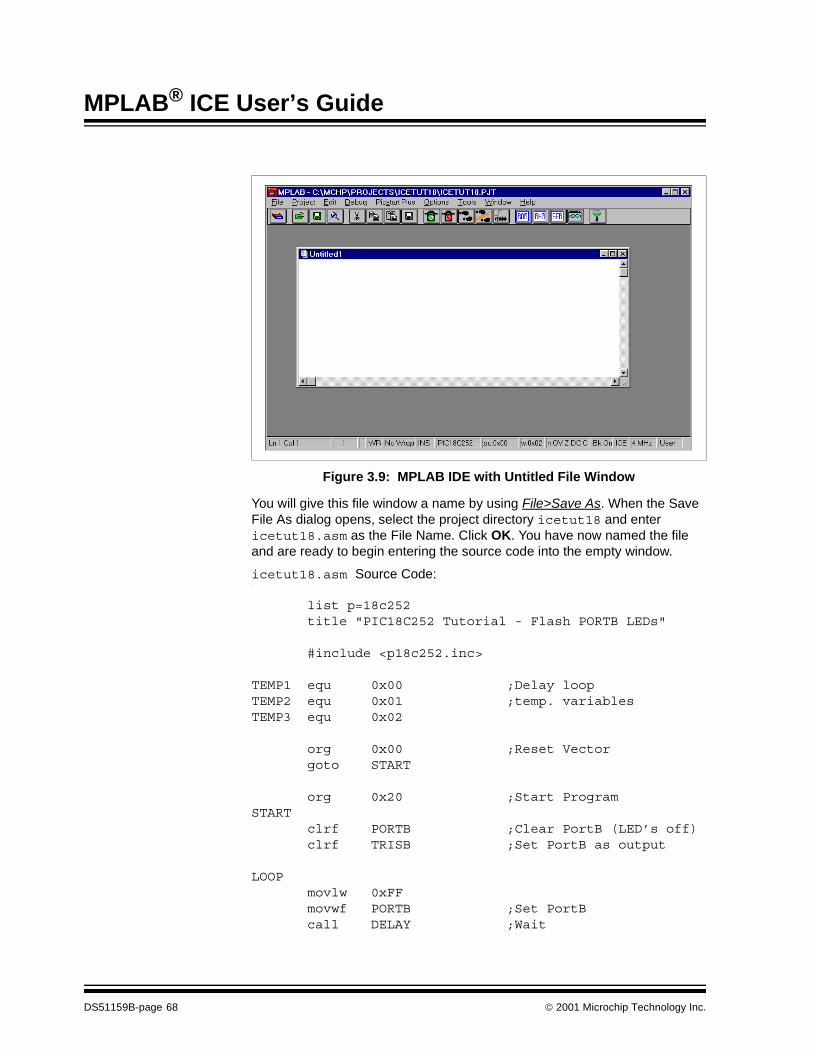
MPLAB® ICE User’s Guide
Figure 3.9: MPLAB IDE with Untitled File Window
You will give this file window a name by using File>Save As. When the Save File As dialog opens, select the project directory icetut18 and enter icetut18.asm as the File Name. Click OK. You have now named the file and are ready to begin entering the source code into the empty window.
icetut18.asm Source Code:
list p=18c252 title "PIC18C252 Tutorial - Flash PORTB LEDs"
#include <p18c252.inc>
TEMP1 equ 0x00 ;Delay loopTEMP2 equ 0x01 ;temp. variablesTEMP3 equ 0x02
org 0x00 ;Reset Vector goto START
org 0x20 ;Start ProgramSTART clrf PORTB ;Clear PortB (LED’s off) clrf TRISB ;Set PortB as output
LOOP movlw 0xFF movwf PORTB ;Set PortB call DELAY ;Wait
DS51159B-page 68 2001 Microchip Technology Inc.
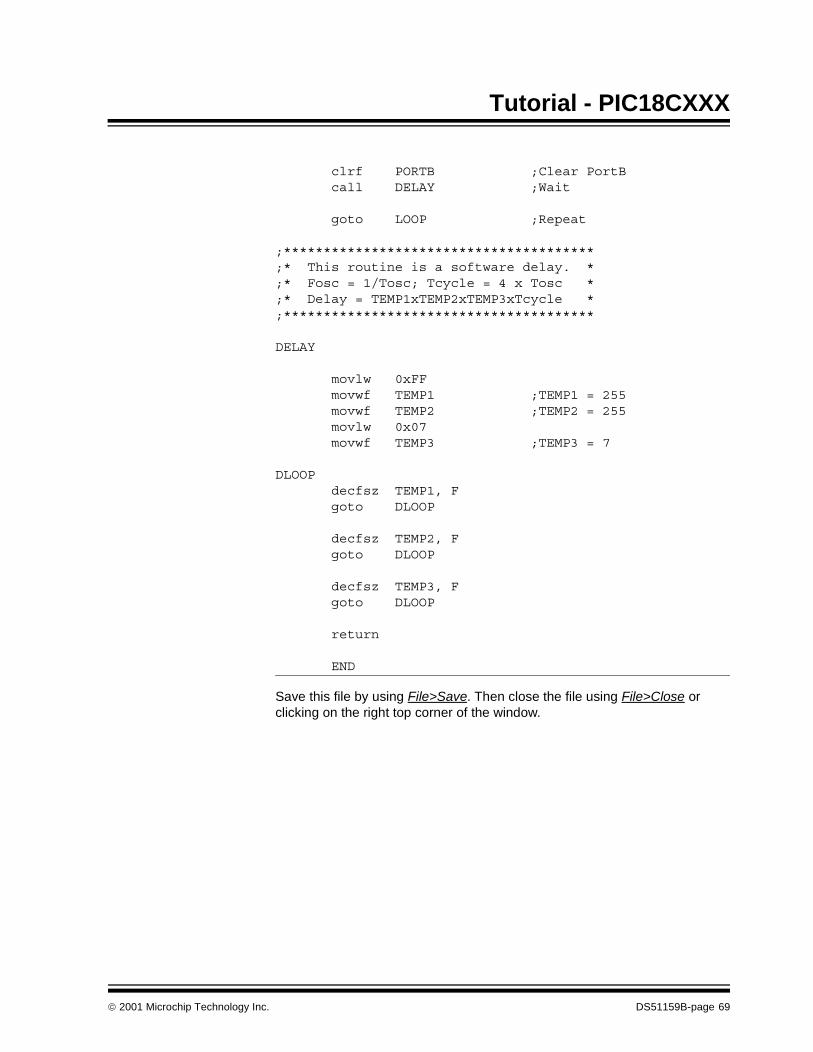
Tutorial - PIC18CXXX
clrf PORTB ;Clear PortB call DELAY ;Wait
goto LOOP ;Repeat
;***************************************;* This routine is a software delay. *;* Fosc = 1/Tosc; Tcycle = 4 x Tosc *;* Delay = TEMP1xTEMP2xTEMP3xTcycle *;***************************************
DELAY
movlw 0xFF movwf TEMP1 ;TEMP1 = 255 movwf TEMP2 ;TEMP2 = 255 movlw 0x07 movwf TEMP3 ;TEMP3 = 7
DLOOP decfsz TEMP1, F goto DLOOP
decfsz TEMP2, F goto DLOOP
decfsz TEMP3, F goto DLOOP
return
END
Save this file by using File>Save. Then close the file using File>Close or clicking on the right top corner of the window.
2001 Microchip Technology Inc. DS51159B-page 69
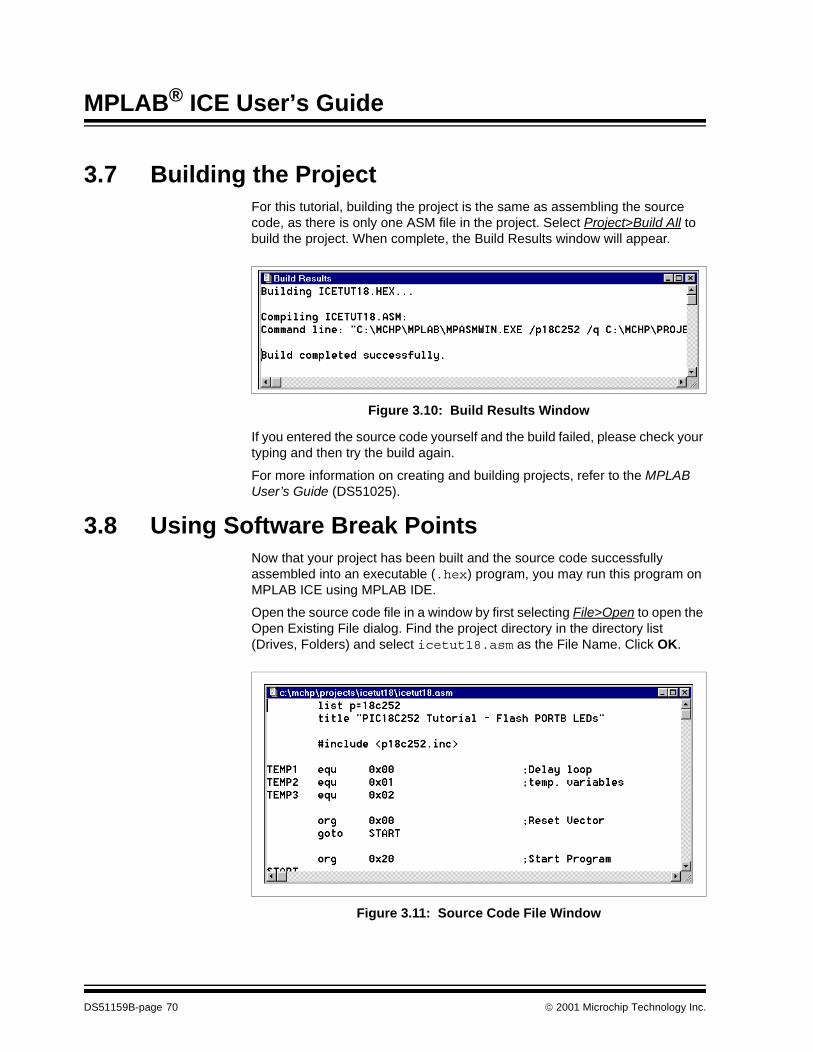
MPLAB® ICE User’s Guide
3.7 Building the ProjectFor this tutorial, building the project is the same as assembling the source code, as there is only one ASM file in the project. Select Project>Build All to build the project. When complete, the Build Results window will appear.
Figure 3.10: Build Results Window
If you entered the source code yourself and the build failed, please check your typing and then try the build again.
For more information on creating and building projects, refer to the MPLAB User’s Guide (DS51025).
3.8 Using Software Break PointsNow that your project has been built and the source code successfully assembled into an executable (.hex) program, you may run this program on MPLAB ICE using MPLAB IDE.
Open the source code file in a window by first selecting File>Open to open the Open Existing File dialog. Find the project directory in the directory list (Drives, Folders) and select icetut18.asm as the File Name. Click OK.
Figure 3.11: Source Code File Window
DS51159B-page 70 2001 Microchip Technology Inc.
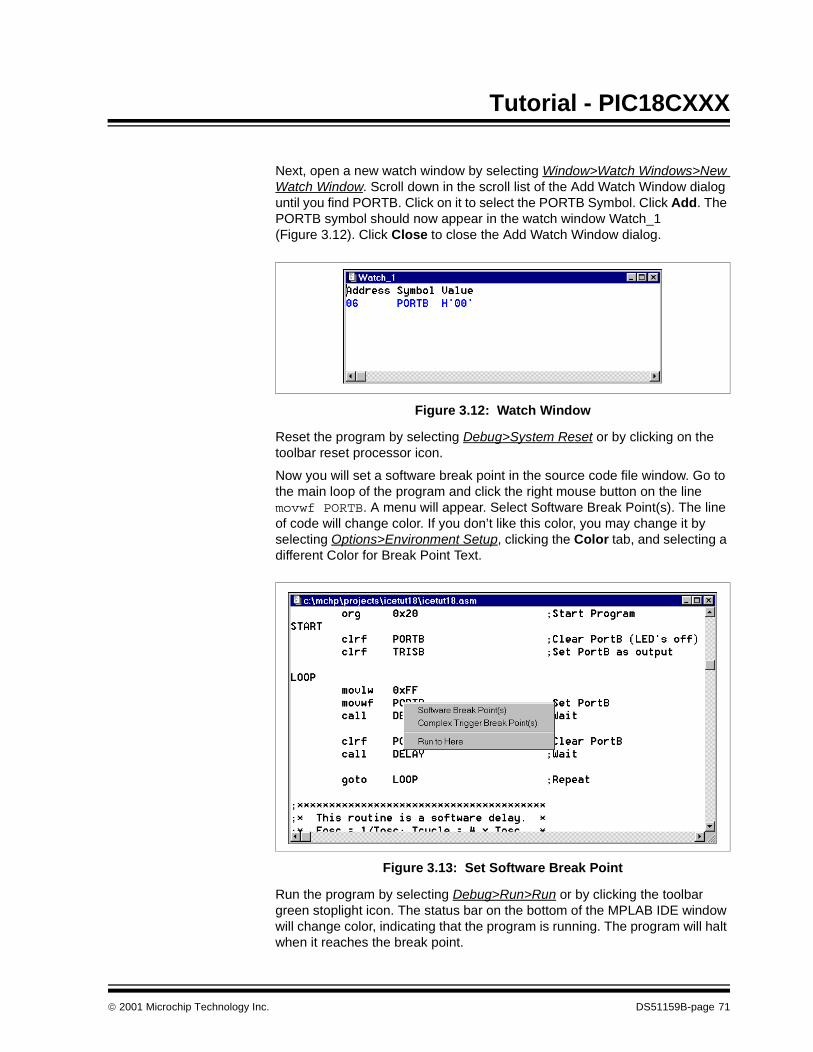
Tutorial - PIC18CXXX
Next, open a new watch window by selecting Window>Watch Windows>New Watch Window. Scroll down in the scroll list of the Add Watch Window dialog until you find PORTB. Click on it to select the PORTB Symbol. Click Add. The PORTB symbol should now appear in the watch window Watch_1 (Figure 3.12). Click Close to close the Add Watch Window dialog.
Figure 3.12: Watch Window
Reset the program by selecting Debug>System Reset or by clicking on the toolbar reset processor icon.
Now you will set a software break point in the source code file window. Go to the main loop of the program and click the right mouse button on the line movwf PORTB. A menu will appear. Select Software Break Point(s). The line of code will change color. If you don’t like this color, you may change it by selecting Options>Environment Setup, clicking the Color tab, and selecting a different Color for Break Point Text.
Figure 3.13: Set Software Break Point
Run the program by selecting Debug>Run>Run or by clicking the toolbar green stoplight icon. The status bar on the bottom of the MPLAB IDE window will change color, indicating that the program is running. The program will halt when it reaches the break point.
2001 Microchip Technology Inc. DS51159B-page 71
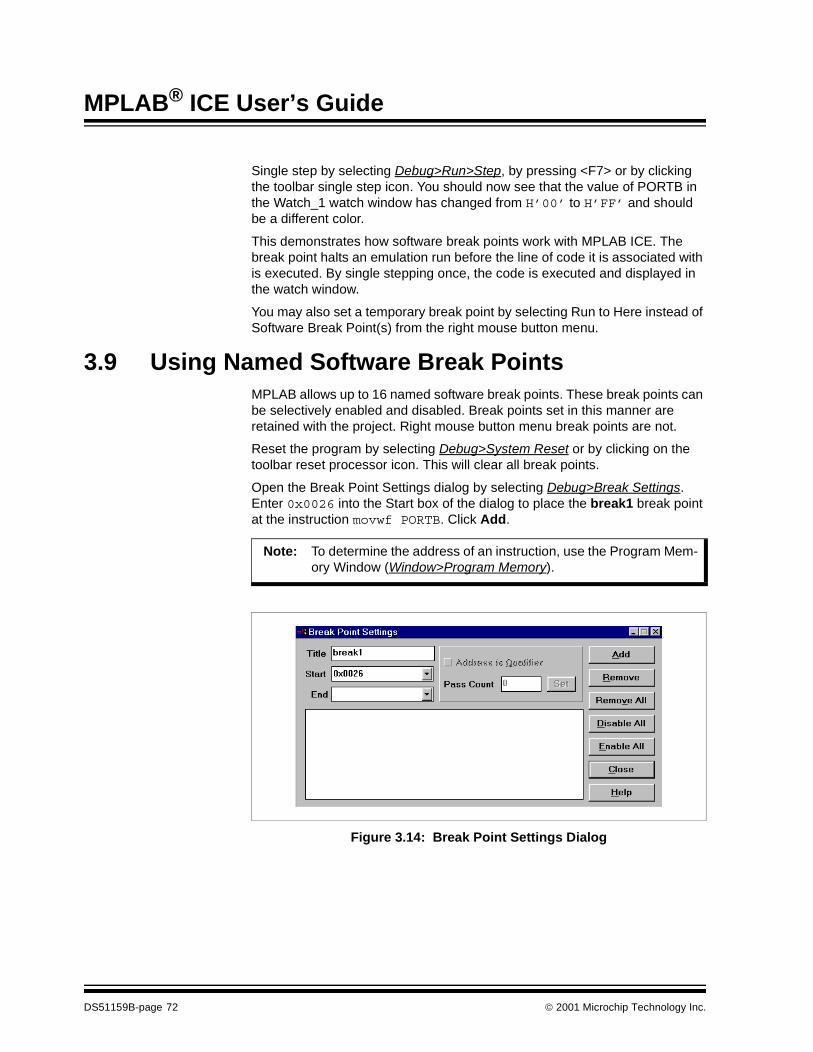
MPLAB® ICE User’s Guide
Single step by selecting Debug>Run>Step, by pressing <F7> or by clicking the toolbar single step icon. You should now see that the value of PORTB in the Watch_1 watch window has changed from H’00’ to H’FF’ and should be a different color.
This demonstrates how software break points work with MPLAB ICE. The break point halts an emulation run before the line of code it is associated with is executed. By single stepping once, the code is executed and displayed in the watch window.
You may also set a temporary break point by selecting Run to Here instead of Software Break Point(s) from the right mouse button menu.
3.9 Using Named Software Break PointsMPLAB allows up to 16 named software break points. These break points can be selectively enabled and disabled. Break points set in this manner are retained with the project. Right mouse button menu break points are not.
Reset the program by selecting Debug>System Reset or by clicking on the toolbar reset processor icon. This will clear all break points.
Open the Break Point Settings dialog by selecting Debug>Break Settings. Enter 0x0026 into the Start box of the dialog to place the break1 break point at the instruction movwf PORTB. Click Add.
Figure 3.14: Break Point Settings Dialog
Note: To determine the address of an instruction, use the Program Mem-ory Window (Window>Program Memory).
DS51159B-page 72 2001 Microchip Technology Inc.

Tutorial - PIC18CXXX
You should see break1 enabled at location 0x0026 in the Break Point Settings dialog and you should see the corresponding instruction line change color in the source code file window. Click Close on the Break Point Settings dialog.
Figure 3.15: Break Point break1 Set
Run the program by selecting Debug>Run>Run or by clicking the toolbar green stoplight icon. The status bar on the bottom of the MPLAB IDE window will change color, indicating that the program is running. The program will halt when it reaches the break point.
You may single step to see the value of PORTB in the Watch_1 watch window change from H’00’ to H’FF’.
3.10 Using Hardware Break PointsIn addition to setting software break points on program memory addresses, hardware break points may be set with more complex conditions.
Reset the program by selecting Debug>System Reset or by clicking on the toolbar reset processor icon. This will clear all break points.
Go to the main loop of the program and click the right mouse button on the line movwf PORTB. A menu will appear. This time select Complex Trigger Break Point(s). The line of code will change color. If you don’t like this color, you may change it by selecting Options>Environment Setup, clicking the Color tab, and selecting a different Color for Trigger Point Text.
2001 Microchip Technology Inc. DS51159B-page 73
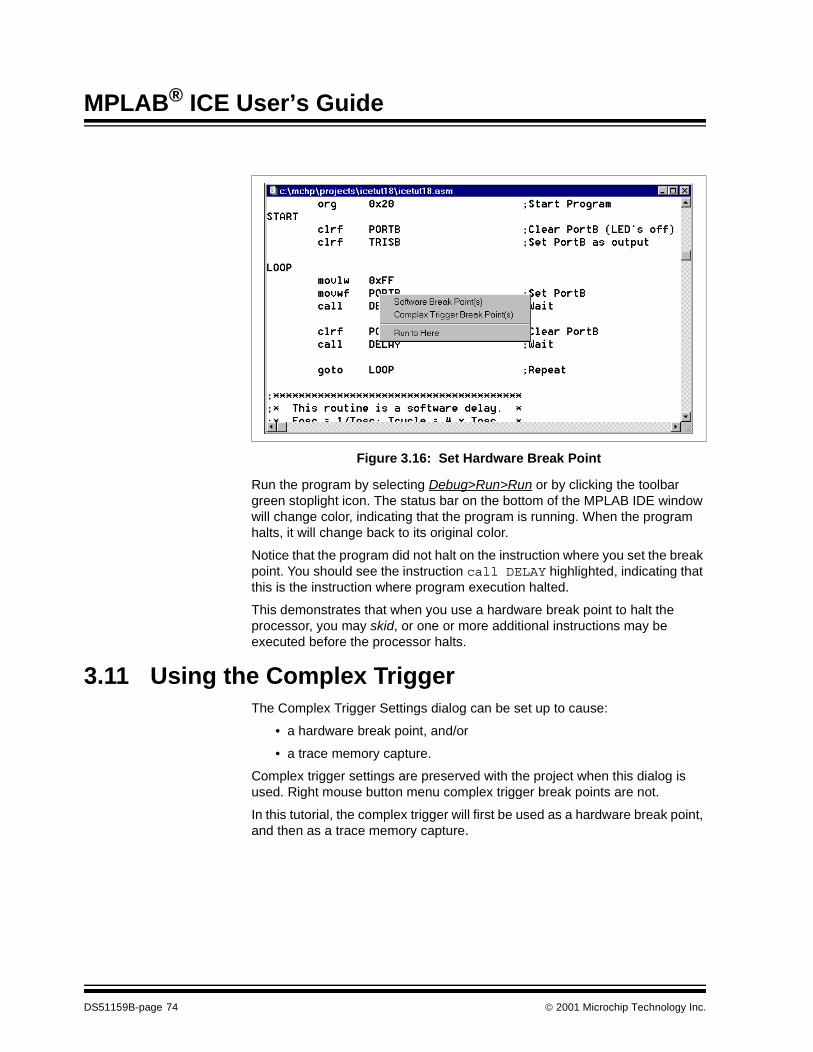
MPLAB® ICE User’s Guide
Figure 3.16: Set Hardware Break Point
Run the program by selecting Debug>Run>Run or by clicking the toolbar green stoplight icon. The status bar on the bottom of the MPLAB IDE window will change color, indicating that the program is running. When the program halts, it will change back to its original color.
Notice that the program did not halt on the instruction where you set the break point. You should see the instruction call DELAY highlighted, indicating that this is the instruction where program execution halted.
This demonstrates that when you use a hardware break point to halt the processor, you may skid, or one or more additional instructions may be executed before the processor halts.
3.11 Using the Complex TriggerThe Complex Trigger Settings dialog can be set up to cause:
• a hardware break point, and/or
• a trace memory capture.
Complex trigger settings are preserved with the project when this dialog is used. Right mouse button menu complex trigger break points are not.
In this tutorial, the complex trigger will first be used as a hardware break point, and then as a trace memory capture.
DS51159B-page 74 2001 Microchip Technology Inc.
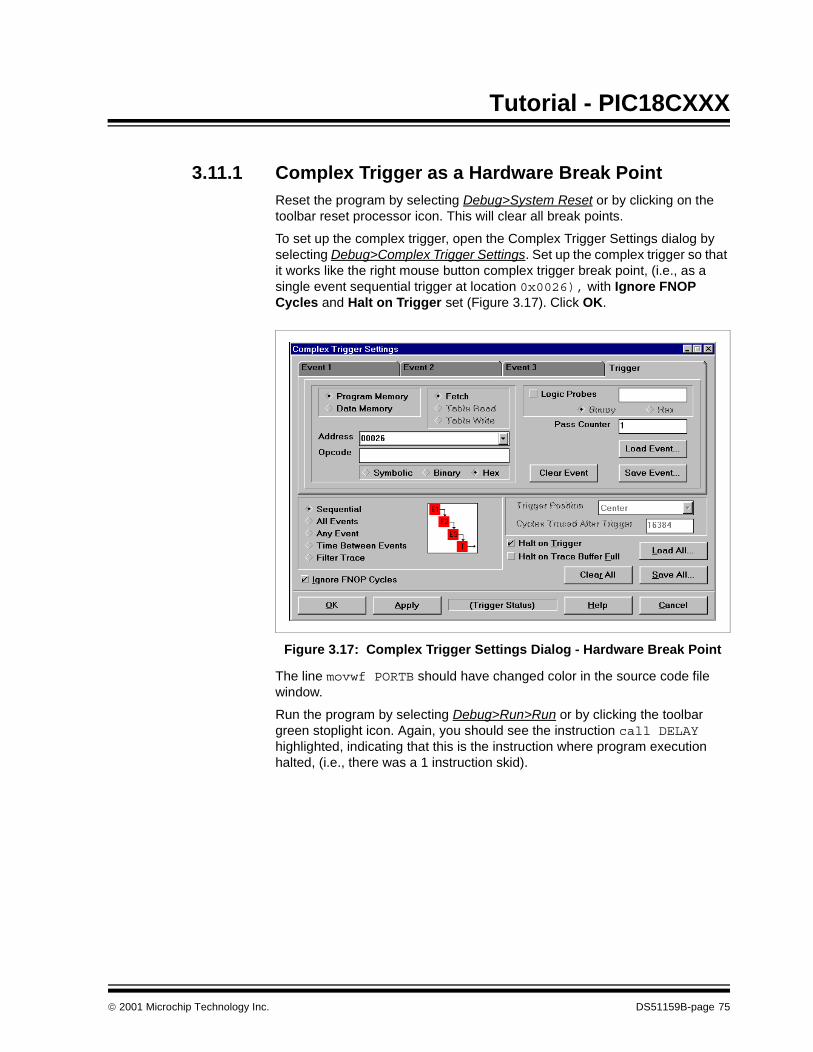
Tutorial - PIC18CXXX
3.11.1 Complex Trigger as a Hardware Break PointReset the program by selecting Debug>System Reset or by clicking on the toolbar reset processor icon. This will clear all break points.
To set up the complex trigger, open the Complex Trigger Settings dialog by selecting Debug>Complex Trigger Settings. Set up the complex trigger so that it works like the right mouse button complex trigger break point, (i.e., as a single event sequential trigger at location 0x0026), with Ignore FNOP Cycles and Halt on Trigger set (Figure 3.17). Click OK.
Figure 3.17: Complex Trigger Settings Dialog - Hardware Break Point
The line movwf PORTB should have changed color in the source code file window.
Run the program by selecting Debug>Run>Run or by clicking the toolbar green stoplight icon. Again, you should see the instruction call DELAY highlighted, indicating that this is the instruction where program execution halted, (i.e., there was a 1 instruction skid).
2001 Microchip Technology Inc. DS51159B-page 75
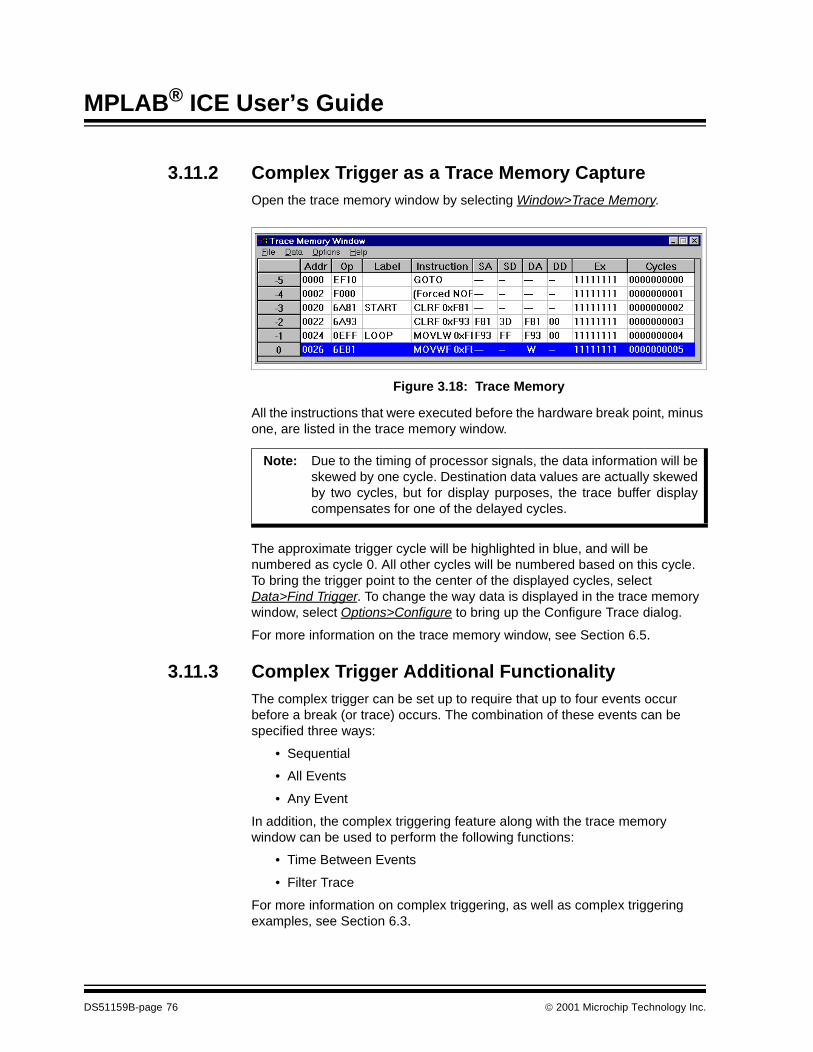
MPLAB® ICE User’s Guide
3.11.2 Complex Trigger as a Trace Memory CaptureOpen the trace memory window by selecting Window>Trace Memory.
Figure 3.18: Trace Memory
All the instructions that were executed before the hardware break point, minus one, are listed in the trace memory window.
The approximate trigger cycle will be highlighted in blue, and will be numbered as cycle 0. All other cycles will be numbered based on this cycle. To bring the trigger point to the center of the displayed cycles, select Data>Find Trigger. To change the way data is displayed in the trace memory window, select Options>Configure to bring up the Configure Trace dialog.
For more information on the trace memory window, see Section 6.5.
3.11.3 Complex Trigger Additional FunctionalityThe complex trigger can be set up to require that up to four events occur before a break (or trace) occurs. The combination of these events can be specified three ways:
• Sequential
• All Events
• Any Event
In addition, the complex triggering feature along with the trace memory window can be used to perform the following functions:
• Time Between Events
• Filter Trace
For more information on complex triggering, as well as complex triggering examples, see Section 6.3.
Note: Due to the timing of processor signals, the data information will beskewed by one cycle. Destination data values are actually skewedby two cycles, but for display purposes, the trace buffer displaycompensates for one of the delayed cycles.
DS51159B-page 76 2001 Microchip Technology Inc.
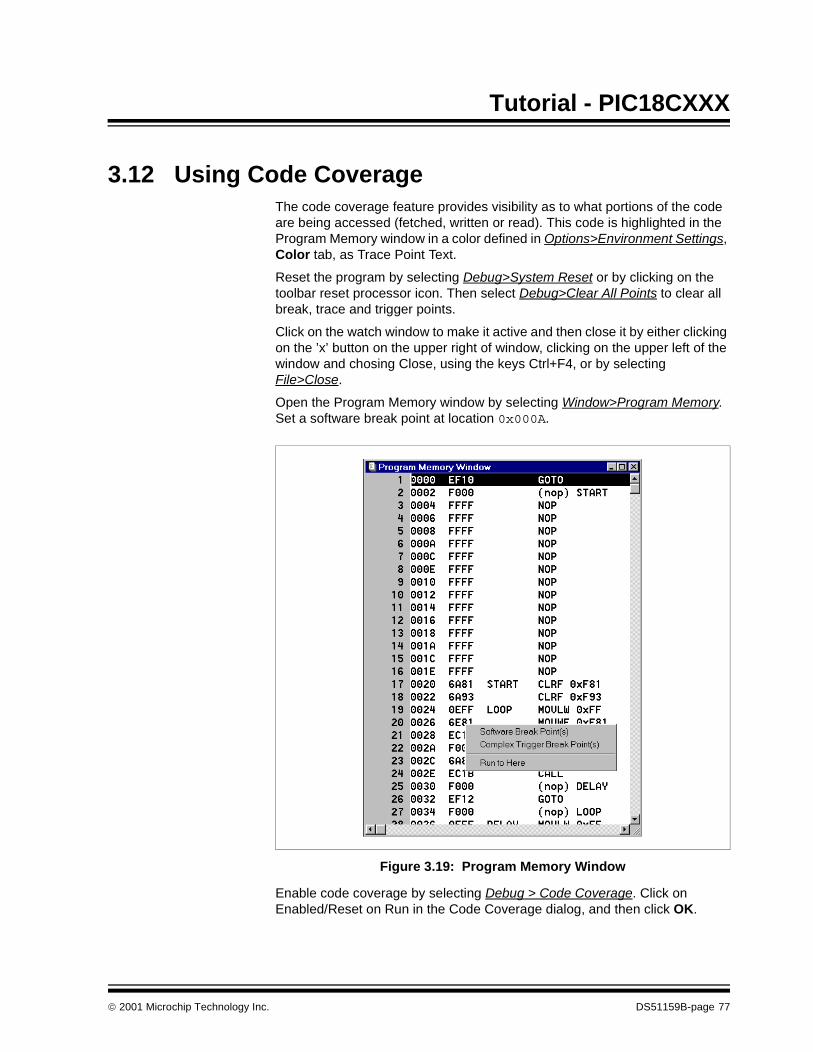
Tutorial - PIC18CXXX
3.12 Using Code CoverageThe code coverage feature provides visibility as to what portions of the code are being accessed (fetched, written or read). This code is highlighted in the Program Memory window in a color defined in Options>Environment Settings, Color tab, as Trace Point Text.
Reset the program by selecting Debug>System Reset or by clicking on the toolbar reset processor icon. Then select Debug>Clear All Points to clear all break, trace and trigger points.
Click on the watch window to make it active and then close it by either clicking on the ’x’ button on the upper right of window, clicking on the upper left of the window and chosing Close, using the keys Ctrl+F4, or by selecting File>Close.
Open the Program Memory window by selecting Window>Program Memory. Set a software break point at location 0x000A.
Figure 3.19: Program Memory Window
Enable code coverage by selecting Debug > Code Coverage. Click on Enabled/Reset on Run in the Code Coverage dialog, and then click OK.
2001 Microchip Technology Inc. DS51159B-page 77
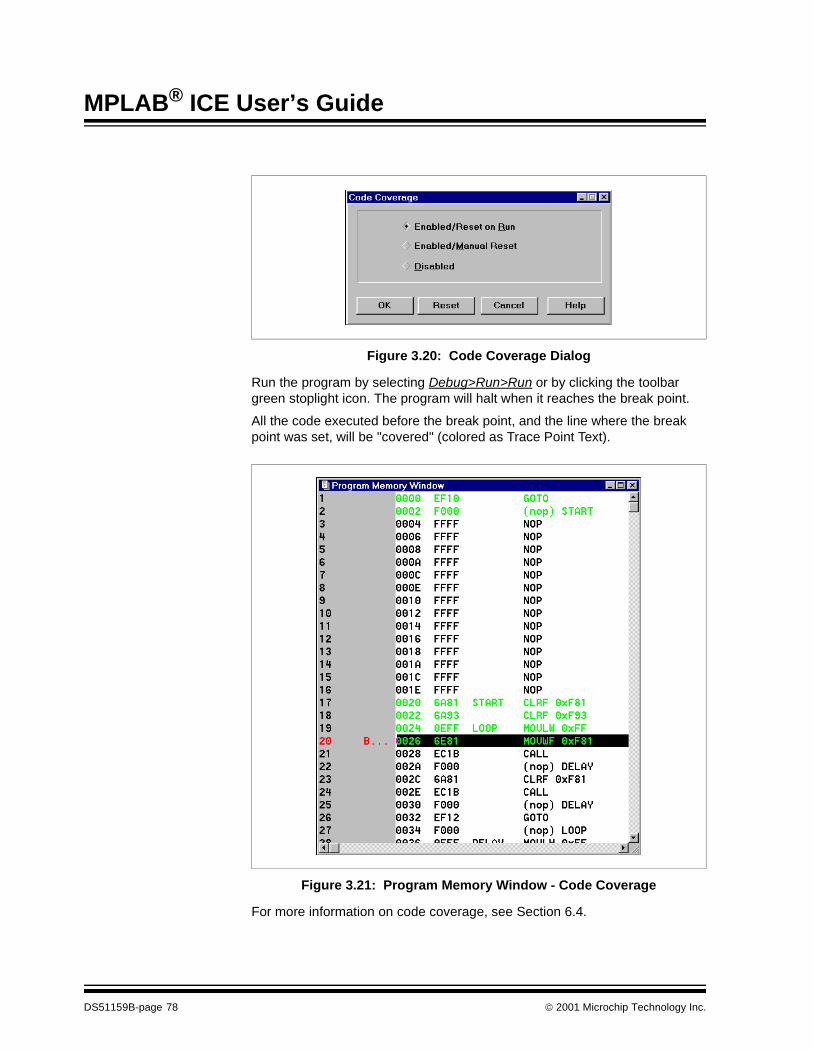
MPLAB® ICE User’s Guide
Figure 3.20: Code Coverage Dialog
Run the program by selecting Debug>Run>Run or by clicking the toolbar green stoplight icon. The program will halt when it reaches the break point.
All the code executed before the break point, and the line where the break point was set, will be "covered" (colored as Trace Point Text).
Figure 3.21: Program Memory Window - Code Coverage
For more information on code coverage, see Section 6.4.
DS51159B-page 78 2001 Microchip Technology Inc.

Tutorial - PIC18CXXX
3.13 Going ForwardYou have now completed the PIC18CXXX tutorial on MPLAB ICE and MPLAB IDE functionality. The simple examples shown here should give you a beginner’s knowledge of working with the emulator and software. For more detailed information on usage for your individual applications, please refer to the Basic (Chapter 5) and Advanced (Chapter 6) Features chapters.
2001 Microchip Technology Inc. DS51159B-page 79

MPLAB® ICE User’s Guide
NOTES:
DS51159B-page 80 2001 Microchip Technology Inc.
2001 Microchip Technology Inc. DS51159B-page 81
MPLAB® ICE USER’S GUIDE12Chapter 4. General Set Up
4.1 IntroductionAfter installing and starting up the MPLAB software, MPLAB ICE must be enabled and set up to correctly emulate the selected processor.
4.2 HighlightsThe steps needed to get started with MPLAB ICE are:
• Running MPLAB
• Configuring the LPT Port
• Selecting the Development Mode and Processor
• Selecting Processor Power
• Setting up the Processor Clock
• Setting up Miscellaneous Hardware
• Using MPLAB Projects
4.3 Running MPLABAfter installing MPLAB, invoke it by executing the file MPLAB.EXE.
For more information on installing and using MPLAB, refer to the MPLAB User’s Guide (DS51025) and the included file README.LAB.
Figure 4.1: MPLAB IDE
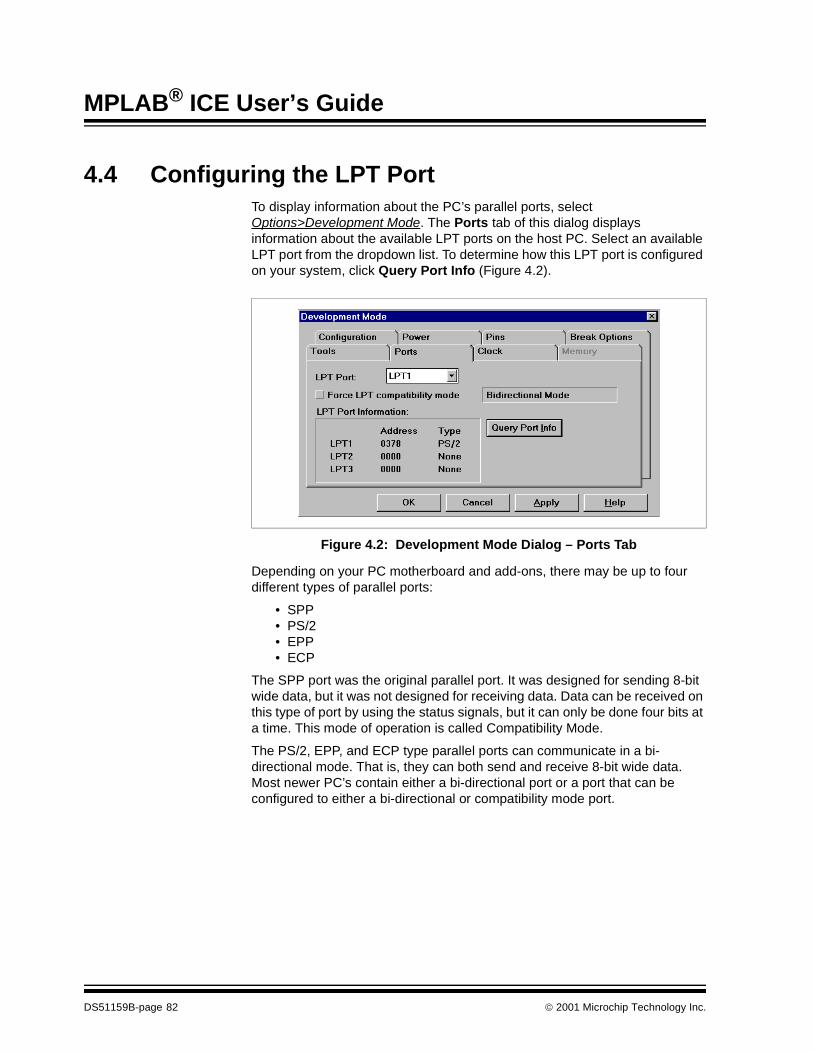
MPLAB® ICE User’s Guide
4.4 Configuring the LPT PortTo display information about the PC’s parallel ports, select Options>Development Mode. The Ports tab of this dialog displays information about the available LPT ports on the host PC. Select an available LPT port from the dropdown list. To determine how this LPT port is configured on your system, click Query Port Info (Figure 4.2).
Figure 4.2: Development Mode Dialog – Ports Tab
Depending on your PC motherboard and add-ons, there may be up to four different types of parallel ports:
• SPP• PS/2• EPP• ECP
The SPP port was the original parallel port. It was designed for sending 8-bit wide data, but it was not designed for receiving data. Data can be received on this type of port by using the status signals, but it can only be done four bits at a time. This mode of operation is called Compatibility Mode.
The PS/2, EPP, and ECP type parallel ports can communicate in a bi-directional mode. That is, they can both send and receive 8-bit wide data. Most newer PC’s contain either a bi-directional port or a port that can be configured to either a bi-directional or compatibility mode port.
DS51159B-page 82 2001 Microchip Technology Inc.
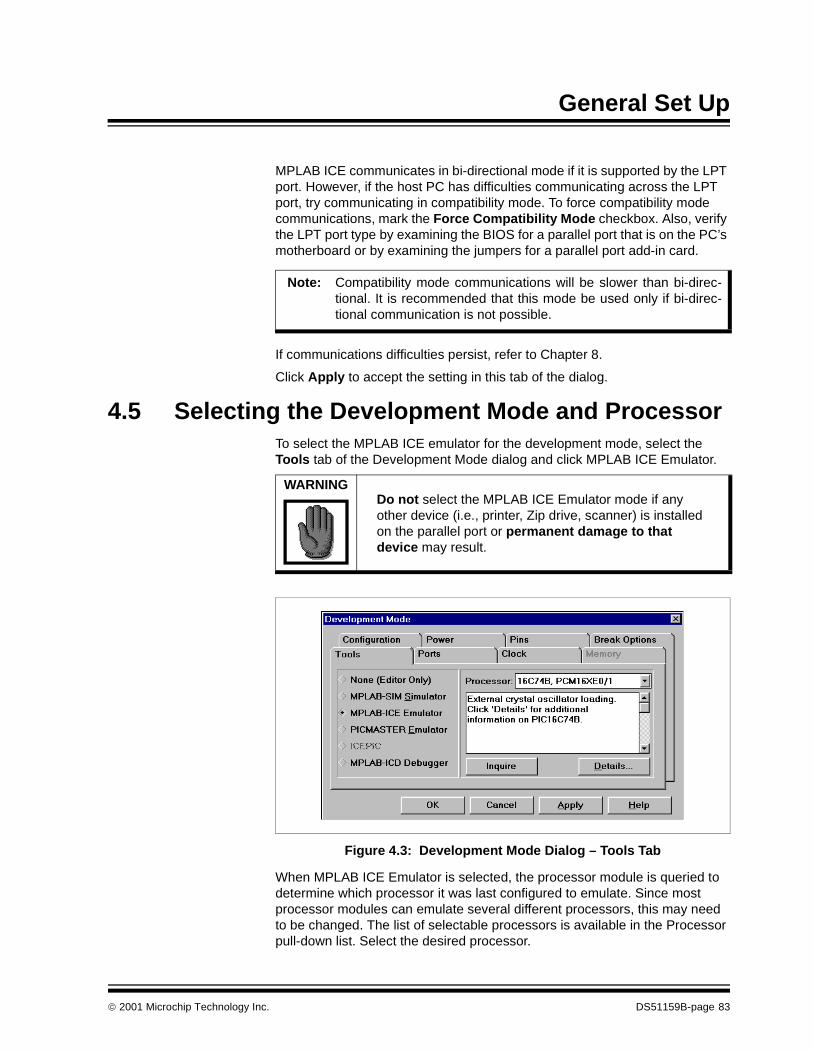
General Set Up
MPLAB ICE communicates in bi-directional mode if it is supported by the LPT port. However, if the host PC has difficulties communicating across the LPT port, try communicating in compatibility mode. To force compatibility mode communications, mark the Force Compatibility Mode checkbox. Also, verify the LPT port type by examining the BIOS for a parallel port that is on the PC’s motherboard or by examining the jumpers for a parallel port add-in card.
If communications difficulties persist, refer to Chapter 8.
Click Apply to accept the setting in this tab of the dialog.
4.5 Selecting the Development Mode and ProcessorTo select the MPLAB ICE emulator for the development mode, select the Tools tab of the Development Mode dialog and click MPLAB ICE Emulator.
Figure 4.3: Development Mode Dialog – Tools Tab
When MPLAB ICE Emulator is selected, the processor module is queried to determine which processor it was last configured to emulate. Since most processor modules can emulate several different processors, this may need to be changed. The list of selectable processors is available in the Processor pull-down list. Select the desired processor.
Note: Compatibility mode communications will be slower than bi-direc-tional. It is recommended that this mode be used only if bi-direc-tional communication is not possible.
WARNINGDo not select the MPLAB ICE Emulator mode if any other device (i.e., printer, Zip drive, scanner) is installed on the parallel port or permanent damage to that device may result.
2001 Microchip Technology Inc. DS51159B-page 83
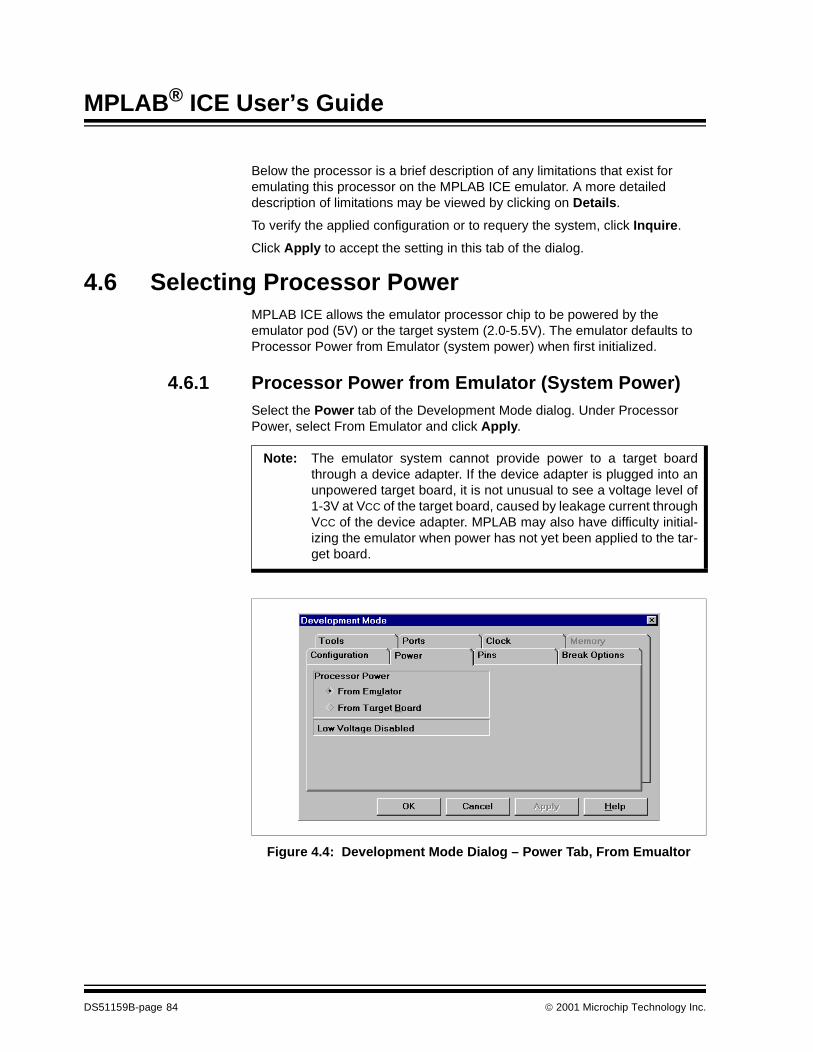
MPLAB® ICE User’s Guide
Below the processor is a brief description of any limitations that exist for emulating this processor on the MPLAB ICE emulator. A more detailed description of limitations may be viewed by clicking on Details.
To verify the applied configuration or to requery the system, click Inquire.
Click Apply to accept the setting in this tab of the dialog.
4.6 Selecting Processor PowerMPLAB ICE allows the emulator processor chip to be powered by the emulator pod (5V) or the target system (2.0-5.5V). The emulator defaults to Processor Power from Emulator (system power) when first initialized.
4.6.1 Processor Power from Emulator (System Power)Select the Power tab of the Development Mode dialog. Under Processor Power, select From Emulator and click Apply.
Figure 4.4: Development Mode Dialog – Power Tab, From Emualtor
Note: The emulator system cannot provide power to a target boardthrough a device adapter. If the device adapter is plugged into anunpowered target board, it is not unusual to see a voltage level of1-3V at VCC of the target board, caused by leakage current throughVCC of the device adapter. MPLAB may also have difficulty initial-izing the emulator when power has not yet been applied to the tar-get board.
DS51159B-page 84 2001 Microchip Technology Inc.
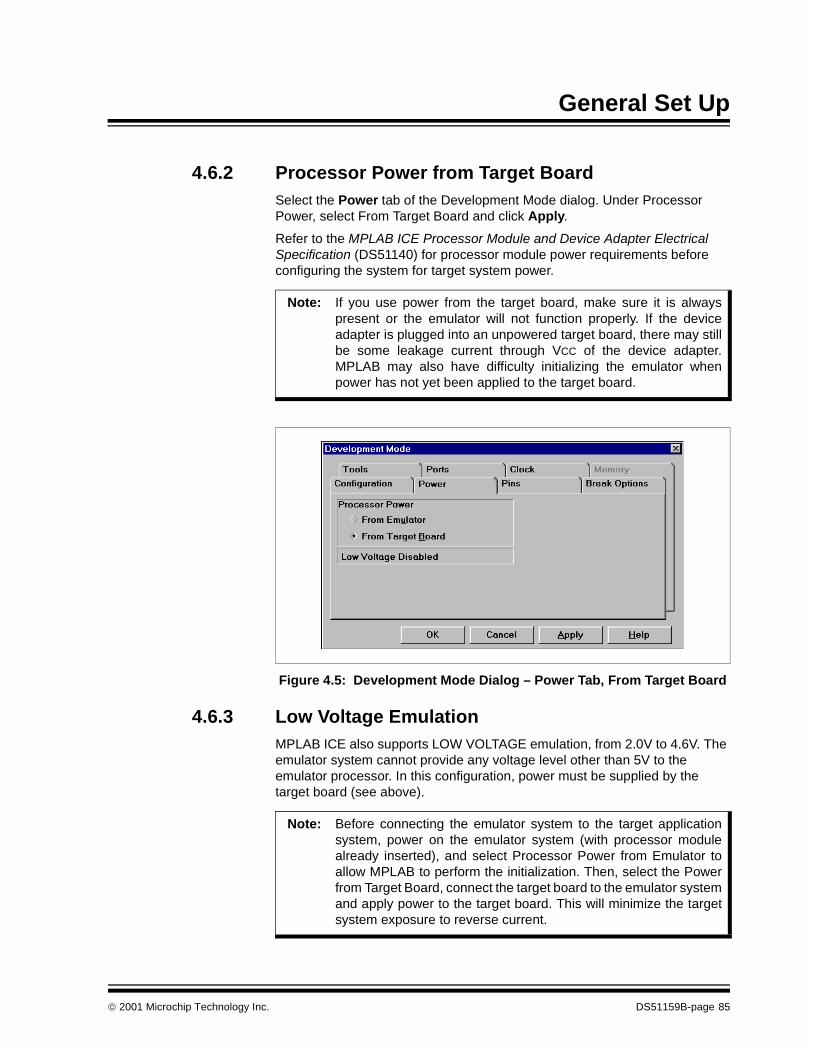
General Set Up
4.6.2 Processor Power from Target BoardSelect the Power tab of the Development Mode dialog. Under Processor Power, select From Target Board and click Apply.
Refer to the MPLAB ICE Processor Module and Device Adapter Electrical Specification (DS51140) for processor module power requirements before configuring the system for target system power.
Figure 4.5: Development Mode Dialog – Power Tab, From Target Board
4.6.3 Low Voltage EmulationMPLAB ICE also supports LOW VOLTAGE emulation, from 2.0V to 4.6V. The emulator system cannot provide any voltage level other than 5V to the emulator processor. In this configuration, power must be supplied by the target board (see above).
Note: If you use power from the target board, make sure it is alwayspresent or the emulator will not function properly. If the deviceadapter is plugged into an unpowered target board, there may stillbe some leakage current through VCC of the device adapter.MPLAB may also have difficulty initializing the emulator whenpower has not yet been applied to the target board.
Note: Before connecting the emulator system to the target applicationsystem, power on the emulator system (with processor modulealready inserted), and select Processor Power from Emulator toallow MPLAB to perform the initialization. Then, select the Powerfrom Target Board, connect the target board to the emulator systemand apply power to the target board. This will minimize the targetsystem exposure to reverse current.
2001 Microchip Technology Inc. DS51159B-page 85
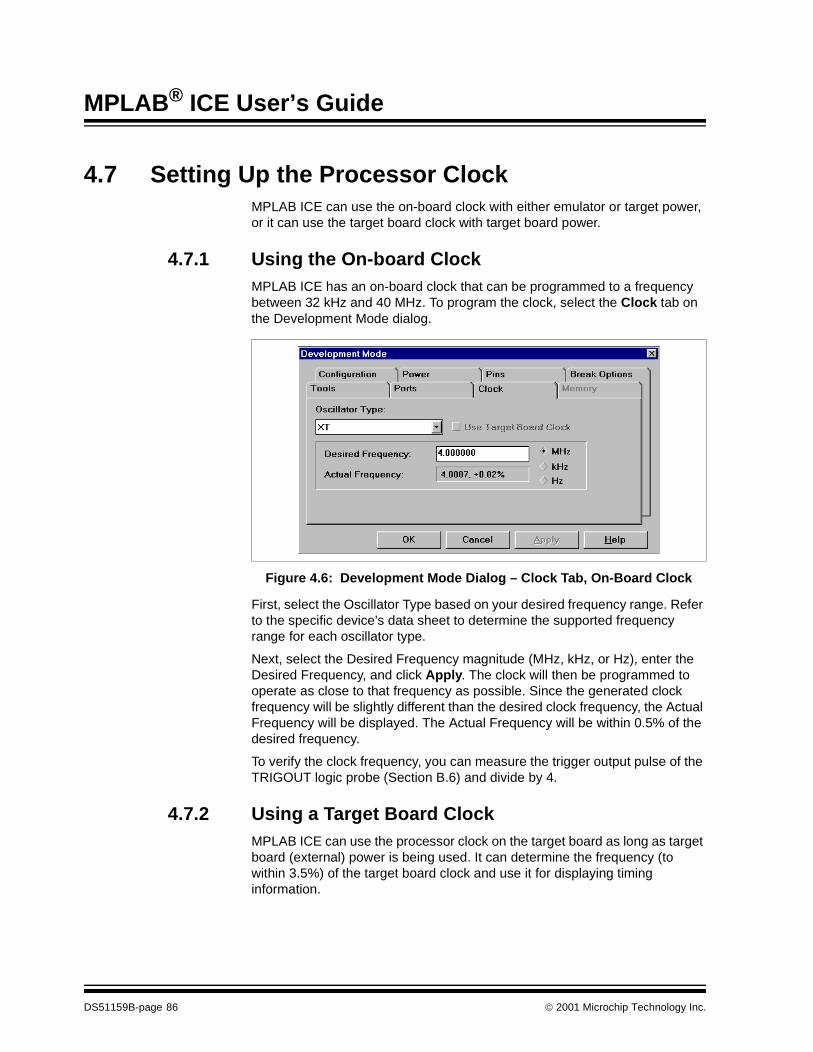
MPLAB® ICE User’s Guide
4.7 Setting Up the Processor ClockMPLAB ICE can use the on-board clock with either emulator or target power, or it can use the target board clock with target board power.
4.7.1 Using the On-board ClockMPLAB ICE has an on-board clock that can be programmed to a frequency between 32 kHz and 40 MHz. To program the clock, select the Clock tab on the Development Mode dialog.
Figure 4.6: Development Mode Dialog – Clock Tab, On-Board Clock
First, select the Oscillator Type based on your desired frequency range. Refer to the specific device’s data sheet to determine the supported frequency range for each oscillator type.
Next, select the Desired Frequency magnitude (MHz, kHz, or Hz), enter the Desired Frequency, and click Apply. The clock will then be programmed to operate as close to that frequency as possible. Since the generated clock frequency will be slightly different than the desired clock frequency, the Actual Frequency will be displayed. The Actual Frequency will be within 0.5% of the desired frequency.
To verify the clock frequency, you can measure the trigger output pulse of the TRIGOUT logic probe (Section B.6) and divide by 4.
4.7.2 Using a Target Board ClockMPLAB ICE can use the processor clock on the target board as long as target board (external) power is being used. It can determine the frequency (to within 3.5%) of the target board clock and use it for displaying timing information.
DS51159B-page 86 2001 Microchip Technology Inc.
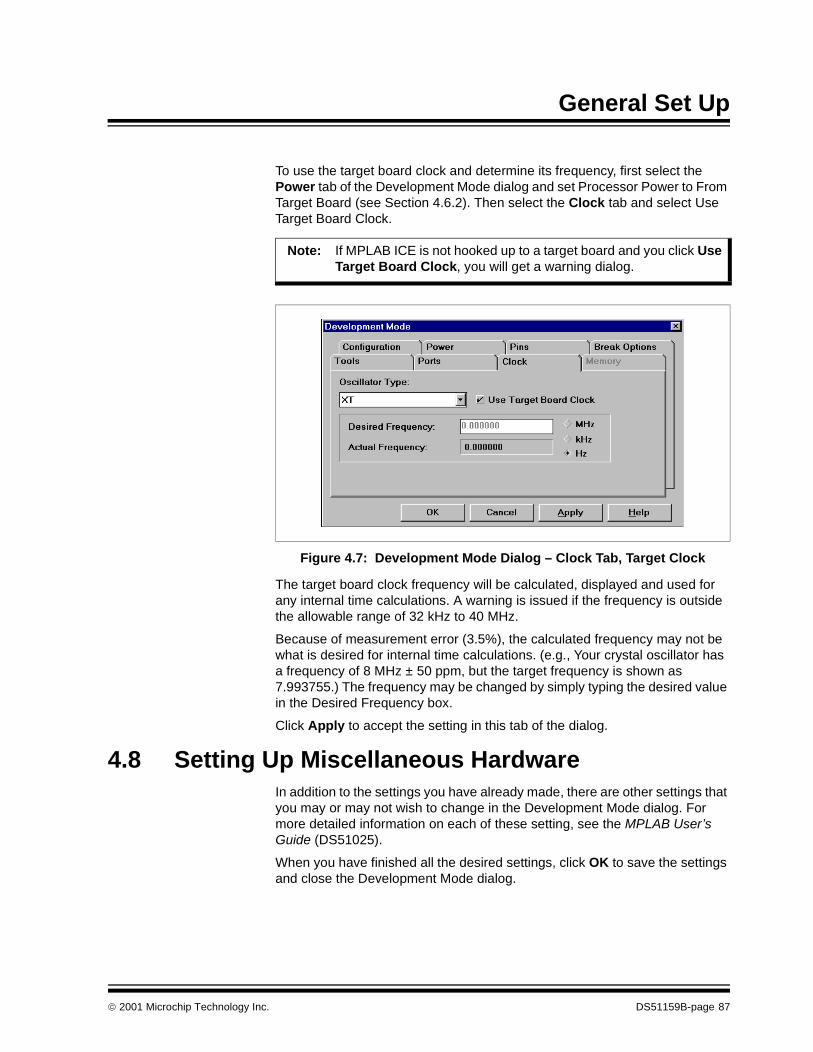
General Set Up
To use the target board clock and determine its frequency, first select the Power tab of the Development Mode dialog and set Processor Power to From Target Board (see Section 4.6.2). Then select the Clock tab and select Use Target Board Clock.
Figure 4.7: Development Mode Dialog – Clock Tab, Target Clock
The target board clock frequency will be calculated, displayed and used for any internal time calculations. A warning is issued if the frequency is outside the allowable range of 32 kHz to 40 MHz.
Because of measurement error (3.5%), the calculated frequency may not be what is desired for internal time calculations. (e.g., Your crystal oscillator has a frequency of 8 MHz ± 50 ppm, but the target frequency is shown as 7.993755.) The frequency may be changed by simply typing the desired value in the Desired Frequency box.
Click Apply to accept the setting in this tab of the dialog.
4.8 Setting Up Miscellaneous HardwareIn addition to the settings you have already made, there are other settings that you may or may not wish to change in the Development Mode dialog. For more detailed information on each of these setting, see the MPLAB User’s Guide (DS51025).
When you have finished all the desired settings, click OK to save the settings and close the Development Mode dialog.
Note: If MPLAB ICE is not hooked up to a target board and you click UseTarget Board Clock, you will get a warning dialog.
2001 Microchip Technology Inc. DS51159B-page 87
MPLAB® ICE User’s Guide
4.8.1 Memory TabUse the Memory tab to set the memory configuration being used. This option is not available for all processors.
For the Memory Mapped Peripheral Range, specify the starting and ending high byte address. The highest value that can be entered for the high byte is 0xFE.
In order for Off-Chip Memory to be used, the Processor Mode (Options> Development Mode, Configuration tab) must be set to Microprocessor or Extended Microcontroller.
Disable Long Writes disables/enables long writes. If a table write is to internal memory, you should select Disable Long Writes. These table write instructions should be removed before a device is programmed.
4.8.2 Configuration TabWatchdog Timer Set Up
Determine whether or not the Watchdog Timer (WDT) will be needed. During development, WDT is usually disabled. However, if a specific development requires the WDT to be enabled, remember to set its prescaler.
Processor Mode Set Up
If a processor has a mode that supports external memory (Microprocessor or Extended Microcontroller), select whether the external memory is located on the target board or is to be emulated by the emulator’s memory. Also, state the starting and ending address of any memory mapped peripherals.
4.8.3 Pins TabSet up processor pins, such as MCLR, CCP2 MUX’d with RB3 and OSC switch.
4.8.4 Break Options TabUse the Break Options tab to change the global break and trace point environment options. These include Clear Break Points on Download, Global Break Enable, Disable Stack Overflow Warning and Freeze Peripherals on Halt. Additional options are Stack Overflow Break Enable and Stack Overflow Reset Enable.
DS51159B-page 88 2001 Microchip Technology Inc.
General Set Up
4.9 Using MPLAB Projects
4.9.1 Creating a ProjectDeveloping and debugging code in the MPLAB environment is based on projects. Although emulation can be performed without having a project open, projects have the following advantages:
• Single or multiple source files can be easily built and maintained• Symbolic debugging is available• The debugging environment can be saved for later use
For more information on creating and using projects, refer to the MPLAB User’s Guide (DS51025).
4.9.2 Saving the ProjectOnce you have the MPLAB ICE system and software configured, it is advisable to save your current project to retain the values for later use, or use as a backup or default as you continue with your debugging.
Development Mode
The selected development mode is retained with the project information. To change the development mode for a project, follow these steps:
• Open the project. The previously used development mode will be selected.
• Change the development mode by selecting Options>Development Mode to access the Development Mode dialog.
• Save the project.
Processor Clock
The clock source and frequency will be saved with the project information. If the emulator’s programmable clock was being used, it will be set to the same frequency when the project is reopened. However, if the target board clock was being used, there is a chance that the clock may not be functioning the next time the project is opened. When the project is reopened, the system will attempt to use the target board clock and determine its frequency. If it appears that the target board clock is not functioning, a warning will be issued and a 4 MHz system clock will be used. This is necessary to ensure that the emulator and processor module are initialized correctly.
2001 Microchip Technology Inc. DS51159B-page 89
MPLAB® ICE User’s Guide
4.9.3 Opening/Closing a ProjectTo open a previously created project, select Project>Open Project. Then select the project file (*.PJT).
Opening a project will perform the following:
• Close the currently open project, if any• Set the development mode• Set the processor status• Open and restore all windows to their saved states• Download the contents of the hex file to emulation memory• Reset the processor
To close a project, select Project>Close Project. You will be asked if you want to save the project before it closes.
Some of the information that is retained with a project is:
• Development mode and processor• Clock source and frequency• Source files associated with the project• Name of the final PICmicro executable file• Open windows and their sizes and positions• Named break settings• Configuration bit settings
DS51159B-page 90 2001 Microchip Technology Inc.
2001 Microchip Technology Inc. DS51159B-page 91
MPLAB® ICE USER’S GUIDE12Chapter 5. Basic Features
5.1 IntroductionMPLAB ICE provides a wide variety of tools to emulate and debug an application. MPLAB ICE offers a basic set of in-circuit debugging tools, including the ability to run, halt, reset and single step the processor, plus additional tools for advanced debugging techniques.
The basic MPLAB ICE emulator features are built-in to the MPLAB IDE software. A general description of these features is provided here, but for more detailed information, consult the MPLAB User’s Guide (DS51025).
5.2 HighlightsMPLAB ICE basic features include the following:
• Resetting the Processor• Viewing Processor Memory• Viewing Files• Using the Status Bar and Tool Bars• Starting and Stopping Emulation• Using Software Break Points• Using Hardware Break Points• Using Trigger In/Out Settings
5.3 Resetting the ProcessorThere are three ways to reset the processor:
Reset
Debug > Run > Reset or F9
Performs MCLR, which sets the program counter to the reset vector.
System Reset
Debug > System Reset or Ctrl-Shift-F3
Resets the entire emulator system, including hardware, software and target processor.
MPLAB® ICE User’s Guide
Power-On Reset
Debug > Power-On Reset or Ctrl-Shift-F5
Performs a power-on reset, which randomizes RAM similar to powering up a device.
5.4 Viewing Processor MemoryMPLAB provides windows for viewing various memory information.
Program Memory
Program memory can be viewed by selecting Window>Program Memory.
EEPROM Memory
If the emulated device contains EEPROM, the EEPROM contents can be viewed by selecting Window>EEPROM Memory.
Calibration Memory
If the emulated device contains calibration memory, the calibration memory can be viewed by selecting Window>Calibration Memory. The appearance of this window will be different, depending on the emulated device.
File Registers
File registers can be viewed by selecting Window>File Registers. This window displays all of the file registers of the emulated device.
Special Function Registers (SFRs)
The special function registers can be displayed by selecting Window>Special Function Registers. The format provided by this window can be more useful for viewing the SFRs than the normal file register window, since each SFR name is included and several number formats are presented.
Stack
The contents of the stack can be viewed by selecting Window>Stack.
Watch Windows
MPLAB allows the contents of file registers to be monitored through a watch window. To open a watch window, select Window>New Watch Window.
Modify
To modify memory contents, use the Modify dialog accessed by selecting Window>Modify.
Note: If Stack Break Enable is set, MPLAB will display stack overflow andunderflow warnings when they occur. This is not supported on allprocessor modules.
DS51159B-page 92 2001 Microchip Technology Inc.
Basic Features
5.5 Viewing FilesWhen debugging code using a project, the current execution point will be tracked in both the source file and the absolute listing file. To open the source file, select File>Open and choose the appropriate file. After the project is built, the absolute listing file can be opened by selecting Window>Absolute Listing. The line representing the current execution point will be highlighted in each file window.
5.6 Using the Status Bar and Tool BarsMPLAB status information is consolidated on the status bar, located on the bottom of the MPLAB IDE window.
For your convenience, MPLAB IDE contains four toolbars to provide you with shortcuts for performing routine tasks. The four toolbars are:
• Edit Toolbar
• Debug Toolbar
• Project Toolbar
• User Defined Toolbar
Click the button at the far left of the toolbar to display the desired toolbar. The buttons on each toolbar can be reconfigured for your specific needs.
5.7 Starting and Stopping Emulation
Run (green light)
Debug>Run>Run
Begin emulation from the current program counter location.
Halt (red light)
Debug>Run>Halt
Halt program execution and update all displayed emulation information.
Step
Debug>Run>Step
Execute the instruction at the current program counter location and update all displayed emulation information.
Note: Do not step into a SLEEP instruction. If you do, you will need toselect Debug>System Reset in order to wake up the processormodule.
2001 Microchip Technology Inc. DS51159B-page 93
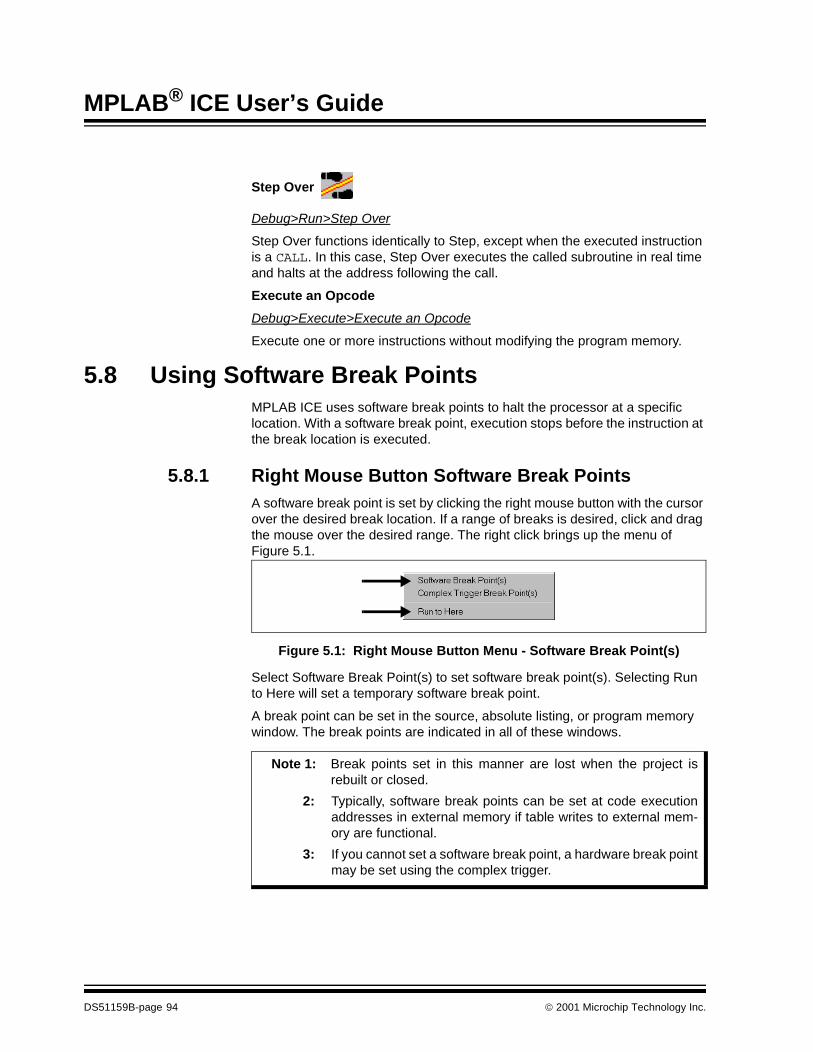
MPLAB® ICE User’s Guide
Step Over
Debug>Run>Step Over
Step Over functions identically to Step, except when the executed instruction is a CALL. In this case, Step Over executes the called subroutine in real time and halts at the address following the call.
Execute an Opcode
Debug>Execute>Execute an Opcode
Execute one or more instructions without modifying the program memory.
5.8 Using Software Break PointsMPLAB ICE uses software break points to halt the processor at a specific location. With a software break point, execution stops before the instruction at the break location is executed.
5.8.1 Right Mouse Button Software Break PointsA software break point is set by clicking the right mouse button with the cursor over the desired break location. If a range of breaks is desired, click and drag the mouse over the desired range. The right click brings up the menu of Figure 5.1.
Figure 5.1: Right Mouse Button Menu - Software Break Point(s)
Select Software Break Point(s) to set software break point(s). Selecting Run to Here will set a temporary software break point.
A break point can be set in the source, absolute listing, or program memory window. The break points are indicated in all of these windows.
Note 1: Break points set in this manner are lost when the project isrebuilt or closed.
2: Typically, software break points can be set at code executionaddresses in external memory if table writes to external mem-ory are functional.
3: If you cannot set a software break point, a hardware break pointmay be set using the complex trigger.
DS51159B-page 94 2001 Microchip Technology Inc.
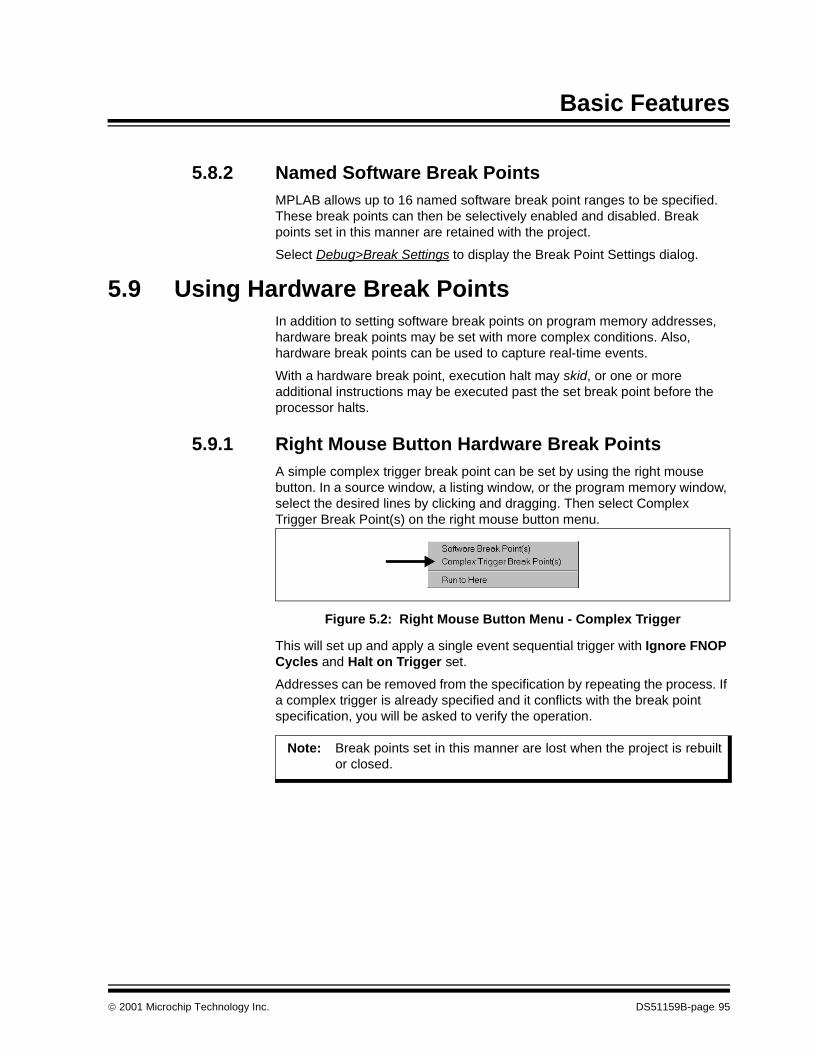
Basic Features
5.8.2 Named Software Break PointsMPLAB allows up to 16 named software break point ranges to be specified. These break points can then be selectively enabled and disabled. Break points set in this manner are retained with the project.
Select Debug>Break Settings to display the Break Point Settings dialog.
5.9 Using Hardware Break PointsIn addition to setting software break points on program memory addresses, hardware break points may be set with more complex conditions. Also, hardware break points can be used to capture real-time events.
With a hardware break point, execution halt may skid, or one or more additional instructions may be executed past the set break point before the processor halts.
5.9.1 Right Mouse Button Hardware Break PointsA simple complex trigger break point can be set by using the right mouse button. In a source window, a listing window, or the program memory window, select the desired lines by clicking and dragging. Then select Complex Trigger Break Point(s) on the right mouse button menu.
Figure 5.2: Right Mouse Button Menu - Complex Trigger
This will set up and apply a single event sequential trigger with Ignore FNOP Cycles and Halt on Trigger set.
Addresses can be removed from the specification by repeating the process. If a complex trigger is already specified and it conflicts with the break point specification, you will be asked to verify the operation.
Note: Break points set in this manner are lost when the project is rebuiltor closed.
2001 Microchip Technology Inc. DS51159B-page 95
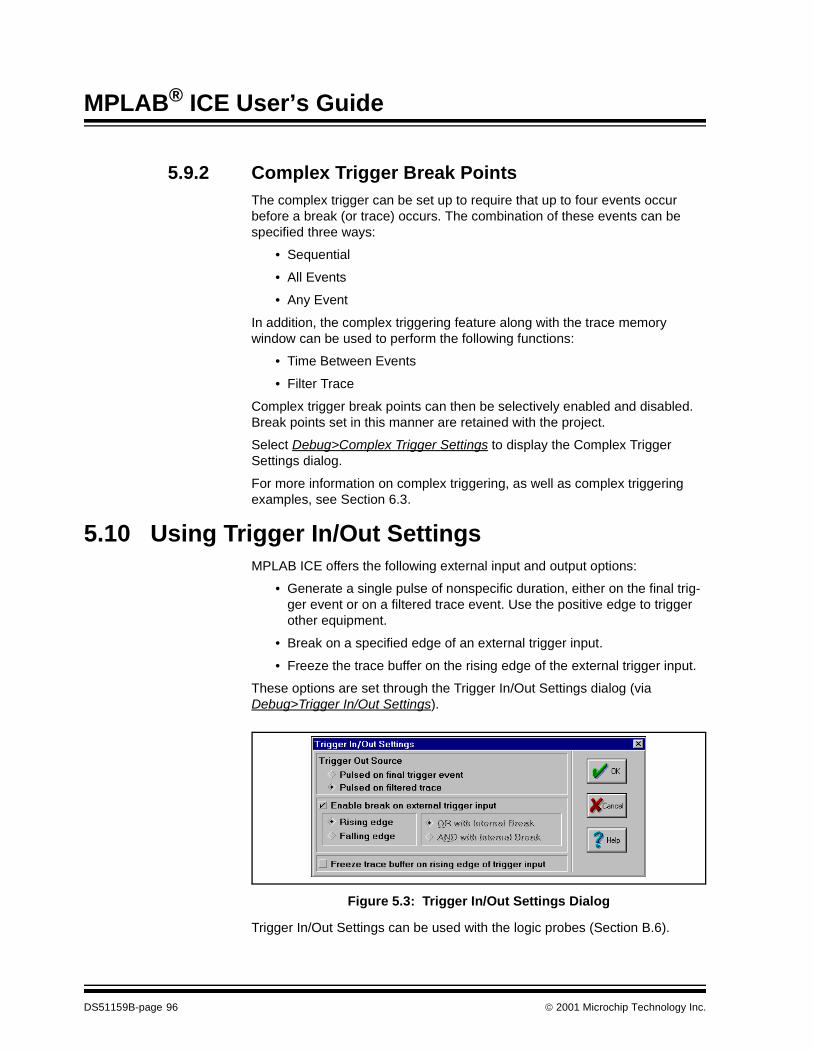
MPLAB® ICE User’s Guide
5.9.2 Complex Trigger Break PointsThe complex trigger can be set up to require that up to four events occur before a break (or trace) occurs. The combination of these events can be specified three ways:
• Sequential
• All Events
• Any Event
In addition, the complex triggering feature along with the trace memory window can be used to perform the following functions:
• Time Between Events
• Filter Trace
Complex trigger break points can then be selectively enabled and disabled. Break points set in this manner are retained with the project.
Select Debug>Complex Trigger Settings to display the Complex Trigger Settings dialog.
For more information on complex triggering, as well as complex triggering examples, see Section 6.3.
5.10 Using Trigger In/Out SettingsMPLAB ICE offers the following external input and output options:
• Generate a single pulse of nonspecific duration, either on the final trig-ger event or on a filtered trace event. Use the positive edge to trigger other equipment.
• Break on a specified edge of an external trigger input.
• Freeze the trace buffer on the rising edge of the external trigger input.
These options are set through the Trigger In/Out Settings dialog (via Debug>Trigger In/Out Settings).
Figure 5.3: Trigger In/Out Settings Dialog
Trigger In/Out Settings can be used with the logic probes (Section B.6).
DS51159B-page 96 2001 Microchip Technology Inc.
2001 Microchip Technology Inc. DS51159B-page 97
MPLAB® ICE USER’S GUIDE12Chapter 6. Advanced Features
6.1 IntroductionMPLAB ICE provides a wide variety of tools to emulate and debug an application. MPLAB ICE offers a basic set of in-circuit debugging tools, including the ability to run, halt, reset and single step the processor, plus additional tools for advanced debugging techniques.
Specialized features are available in the MPLAB IDE when using the MPLAB ICE emulator. A general description of these features is provided in the MPLAB User’s Guide (DS51025), but a more detailed discussion is provided here.
6.2 HighlightsMPLAB ICE advanced features include the following:
• Using Complex Triggering
- Complex Trigger Settings Dialog- Dialog Syntax- Memory Access Selection- Event Selection- Complex Triggering Examples- Complex Trigger Break Points with the Right Mouse Button
• Using Code Coverage
• Using the Trace Memory Window
- Viewing the Trace Memory Window- Customizing the Trace Memory Window
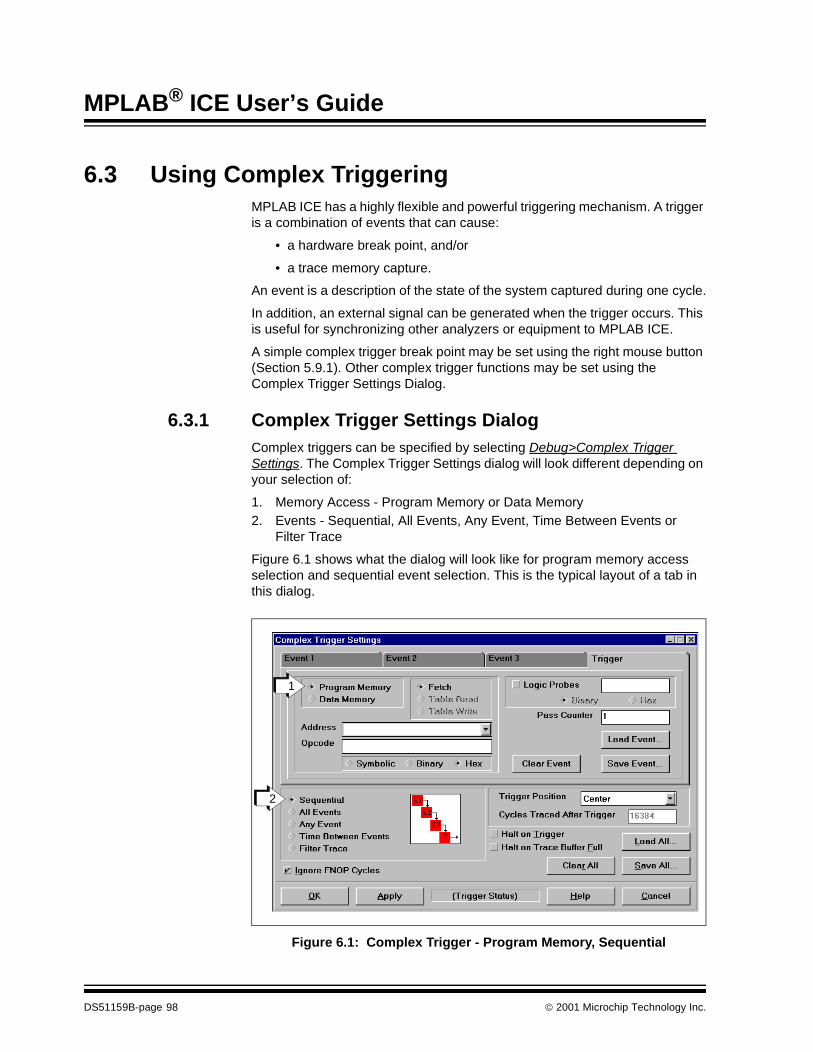
MPLAB® ICE User’s Guide
6.3 Using Complex TriggeringMPLAB ICE has a highly flexible and powerful triggering mechanism. A trigger is a combination of events that can cause:
• a hardware break point, and/or
• a trace memory capture.
An event is a description of the state of the system captured during one cycle.
In addition, an external signal can be generated when the trigger occurs. This is useful for synchronizing other analyzers or equipment to MPLAB ICE.
A simple complex trigger break point may be set using the right mouse button (Section 5.9.1). Other complex trigger functions may be set using the Complex Trigger Settings Dialog.
6.3.1 Complex Trigger Settings DialogComplex triggers can be specified by selecting Debug>Complex Trigger Settings. The Complex Trigger Settings dialog will look different depending on your selection of:
1. Memory Access - Program Memory or Data Memory2. Events - Sequential, All Events, Any Event, Time Between Events or
Filter Trace
Figure 6.1 shows what the dialog will look like for program memory access selection and sequential event selection. This is the typical layout of a tab in this dialog.
Figure 6.1: Complex Trigger - Program Memory, Sequential
1
2
DS51159B-page 98 2001 Microchip Technology Inc.
Advanced Features
For information on memory access selection, see Section 6.3.3. Additional memory information that you may enter is:
• Address (Optional) – A single Event may specify one or more addresses. This can be either a Program Memory or Data Memory address.
• Opcode or Value (Optional) – The actual value of an opcode, the data for a table read/write operation, or the value of a file register. Also select whether the opcode/value is expressed as Symbolic, Binary or Hex(adecimal).
Other triggering information that you may enter is:
• Logic Probes (Optional) – A value on the external logic probe inputs. Also select whether the value is expressed as Binary or Hex(adecimal).
• Pass Counter – A Pass Counter counts the number of times the event must occur before proceeding to the next event. Pass Counters are available only with sequential trigger types (Sequential, Time Between Events and Filter Trace).
For information on event selection, see Section 6.3.4.
Trace-related trigger information may be entered in the following dialog items:
• Trigger Position – Used to position the trigger location in the trace memory window, indicating the number of cycles captured by the trace memory window after the trigger occurs (Cycles Traced After Trigger). The approximate cycle that generated the trigger will be highlighted.
• Halt On Trigger – The trigger point will generate a hardware break point, halting the processor and will be the last entry in the trace mem-ory window. To capture traces without halting the target, un-select this option.
• Halt On Trace Buffer Full – A trigger will cause the trace buffer to stop before overwriting old data. When the trace buffer is full (32767 entries), a hardware break point will halt the processor.
Additional items on the dialog are:
• Ignore FNOP Cycles – Specifies whether or not forced NOP cycles are to be considered in the event processing. A forced NOP cycle is the second cycle of a two-cycle instruction. Since the PICmicro MCU archi-tecture is pipelined, it prefetches the next instruction in the physical address space while it is executing the current instruction. However, if the current instruction changes the program counter, this prefetched instruction is explicitly ignored, causing a forced NOP cycle.
Note: The number of downloaded lines specified in the ConfigureTrace dialog does not affect the number of cycles collected,and Trigger Position still applies.
2001 Microchip Technology Inc. DS51159B-page 99
MPLAB® ICE User’s Guide
Suppose a project has the following source code:
When the RETLW statement of RoutineA is executed, a prefetch of thenext instruction in the address space (the first instruction in RoutineB) isperformed.
This prefetched instruction will not be executed, but the program memoryaddress does appear on the bus. If a trigger is set at program memoryaddress RoutineB, the prefetch done during the execution of the RETLWin RoutineA will cause the trigger to fire. To prevent this, check the IgnoreFNOP Cycles checkbox. Two points to consider when using this checkboxare:
- Depending on the processor module, the trigger may skid one additional cycle.
- Ignore FNOP Cycles cannot be specified when doing a Filter Trace with a 12-bit or 16-bit core processor module.
• Trigger Status – This field indicates the status of the currently defined trigger as the emulator is running. Example messages are:
- No trigger in use – No trigger has been applied.- Event 3:7 – A sequential type trigger is currently processing
Event 3, which must occur seven more times before the event is satisfied.
- In progress – A nonsequential type trigger is currently in progress.
- Complete – The trigger has fired.
There are several buttons on the Complex Trigger Settings dialog with the following functions.
• Load Event – Opens the Load Current Trigger Level dialog, allowing you to load a *.trl file with trigger information for the active tab of the dialog.
• Save Event – Opens the Save Current Trigger Level dialog, allowing you to save as a *.trl file trigger information for the active tab of the dialog.
• Clear Event – Clears the current trigger information in the active tab of the dialog.
RoutineA<code for RoutineA>RETLW 0
RoutineB<code for RoutineB>RETLW 0
DS51159B-page 100 2001 Microchip Technology Inc.
Advanced Features
• Load All – Opens the Load All Trigger Definitions dialog, allowing you to load a *.trf file with trigger information for all tabs of the dialog.
• Save All – Opens the Save All Trigger Definitions dialog, allowing you to save as a *.trf file trigger information for all tabs of the dialog.
• Clear All – Clears the current trigger information in all tabs of the dia-log.
• OK – Accepts the current setting in the dialog and closes the dialog.
• Apply – Accepts the current setting in the dialog without closing the dia-log.
• Cancel – Closes the dialog without accepting the current settings.
• Help – Brings up the on-line help file to walk you through setting up a complex trigger.
2001 Microchip Technology Inc. DS51159B-page 101
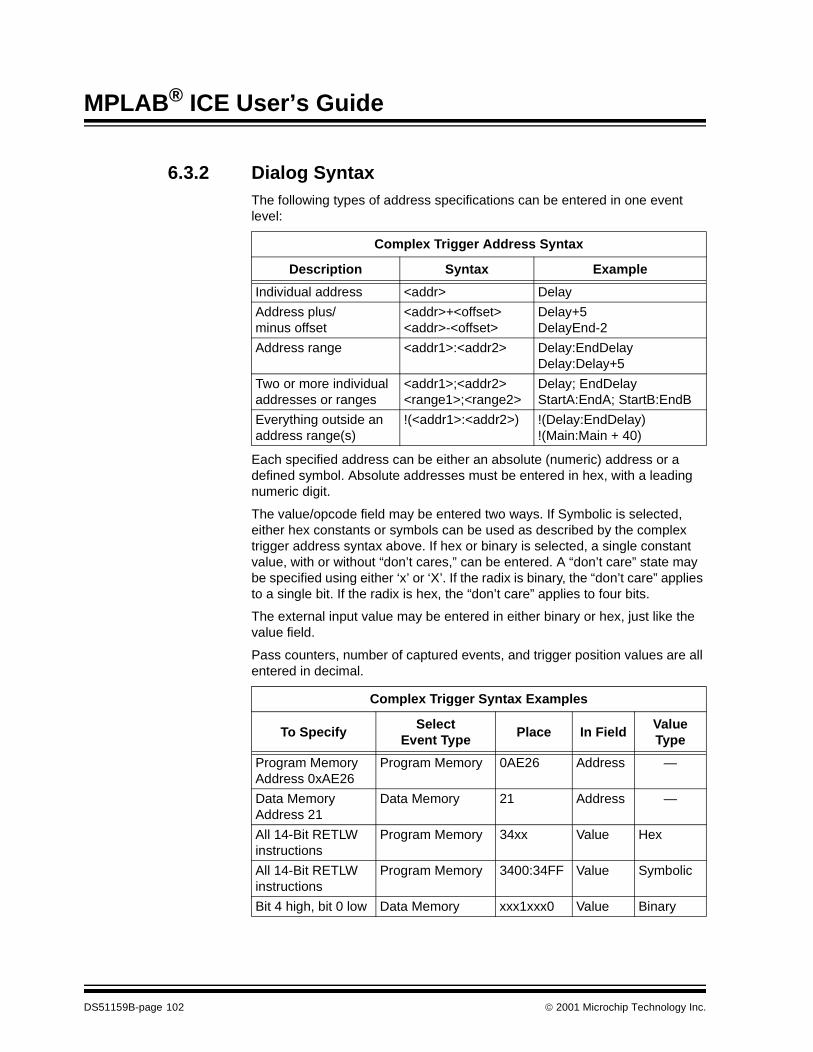
MPLAB® ICE User’s Guide
6.3.2 Dialog SyntaxThe following types of address specifications can be entered in one event level:
Each specified address can be either an absolute (numeric) address or a defined symbol. Absolute addresses must be entered in hex, with a leading numeric digit.
The value/opcode field may be entered two ways. If Symbolic is selected, either hex constants or symbols can be used as described by the complex trigger address syntax above. If hex or binary is selected, a single constant value, with or without “don’t cares,” can be entered. A “don’t care” state may be specified using either ‘x’ or ‘X’. If the radix is binary, the “don’t care” applies to a single bit. If the radix is hex, the “don’t care” applies to four bits.
The external input value may be entered in either binary or hex, just like the value field.
Pass counters, number of captured events, and trigger position values are all entered in decimal.
Complex Trigger Address Syntax
Description Syntax Example
Individual address <addr> Delay
Address plus/minus offset
<addr>+<offset> <addr>-<offset>
Delay+5DelayEnd-2
Address range <addr1>:<addr2> Delay:EndDelayDelay:Delay+5
Two or more individual addresses or ranges
<addr1>;<addr2> <range1>;<range2>
Delay; EndDelayStartA:EndA; StartB:EndB
Everything outside an address range(s)
!(<addr1>:<addr2>) !(Delay:EndDelay)!(Main:Main + 40)
Complex Trigger Syntax Examples
To SpecifySelect
Event TypePlace In Field
Value Type
Program Memory Address 0xAE26
Program Memory 0AE26 Address —
Data Memory Address 21
Data Memory 21 Address —
All 14-Bit RETLW instructions
Program Memory 34xx Value Hex
All 14-Bit RETLW instructions
Program Memory 3400:34FF Value Symbolic
Bit 4 high, bit 0 low Data Memory xxx1xxx0 Value Binary
DS51159B-page 102 2001 Microchip Technology Inc.
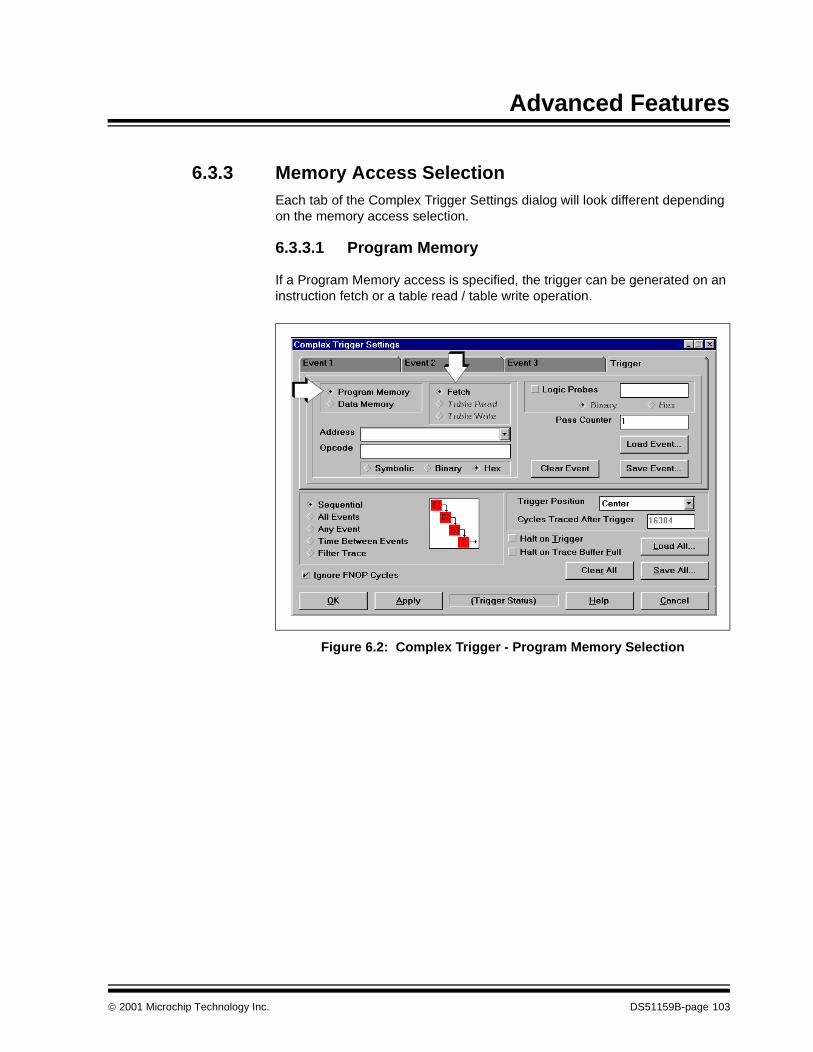
Advanced Features
6.3.3 Memory Access SelectionEach tab of the Complex Trigger Settings dialog will look different depending on the memory access selection.
6.3.3.1 Program Memory
If a Program Memory access is specified, the trigger can be generated on an instruction fetch or a table read / table write operation.
Figure 6.2: Complex Trigger - Program Memory Selection
2001 Microchip Technology Inc. DS51159B-page 103
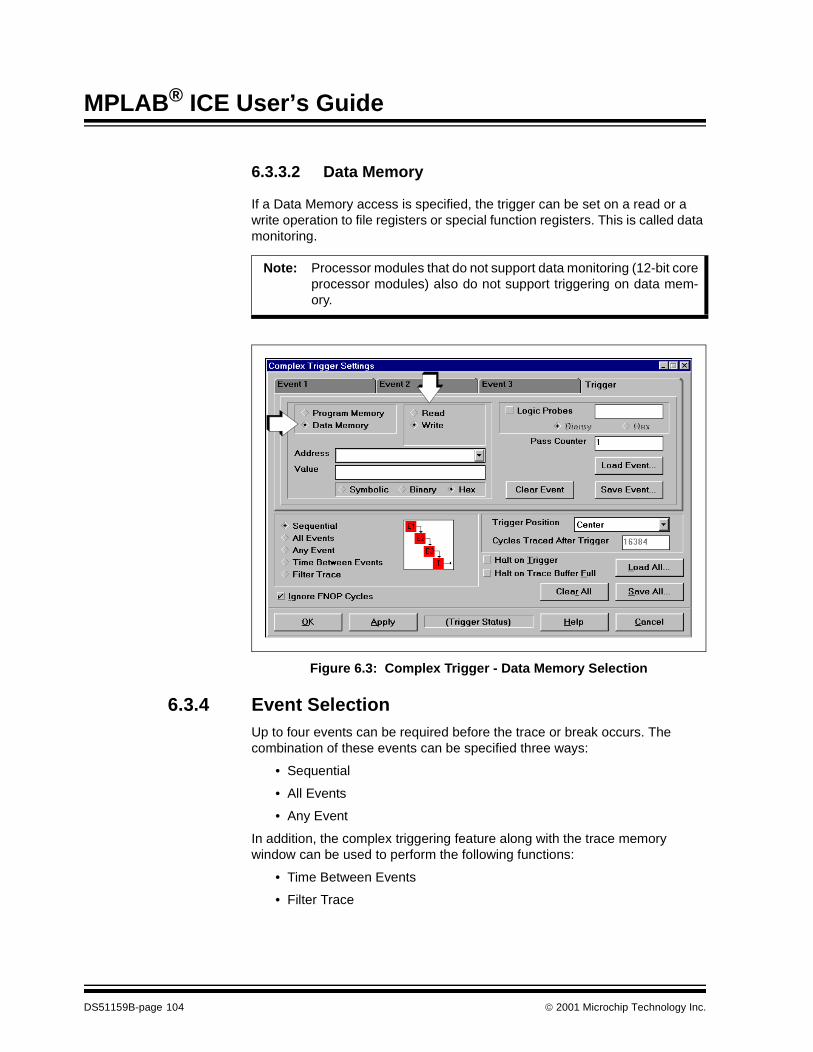
MPLAB® ICE User’s Guide
6.3.3.2 Data Memory
If a Data Memory access is specified, the trigger can be set on a read or a write operation to file registers or special function registers. This is called data monitoring.
Figure 6.3: Complex Trigger - Data Memory Selection
6.3.4 Event SelectionUp to four events can be required before the trace or break occurs. The combination of these events can be specified three ways:
• Sequential
• All Events
• Any Event
In addition, the complex triggering feature along with the trace memory window can be used to perform the following functions:
• Time Between Events
• Filter Trace
Note: Processor modules that do not support data monitoring (12-bit coreprocessor modules) also do not support triggering on data mem-ory.
DS51159B-page 104 2001 Microchip Technology Inc.
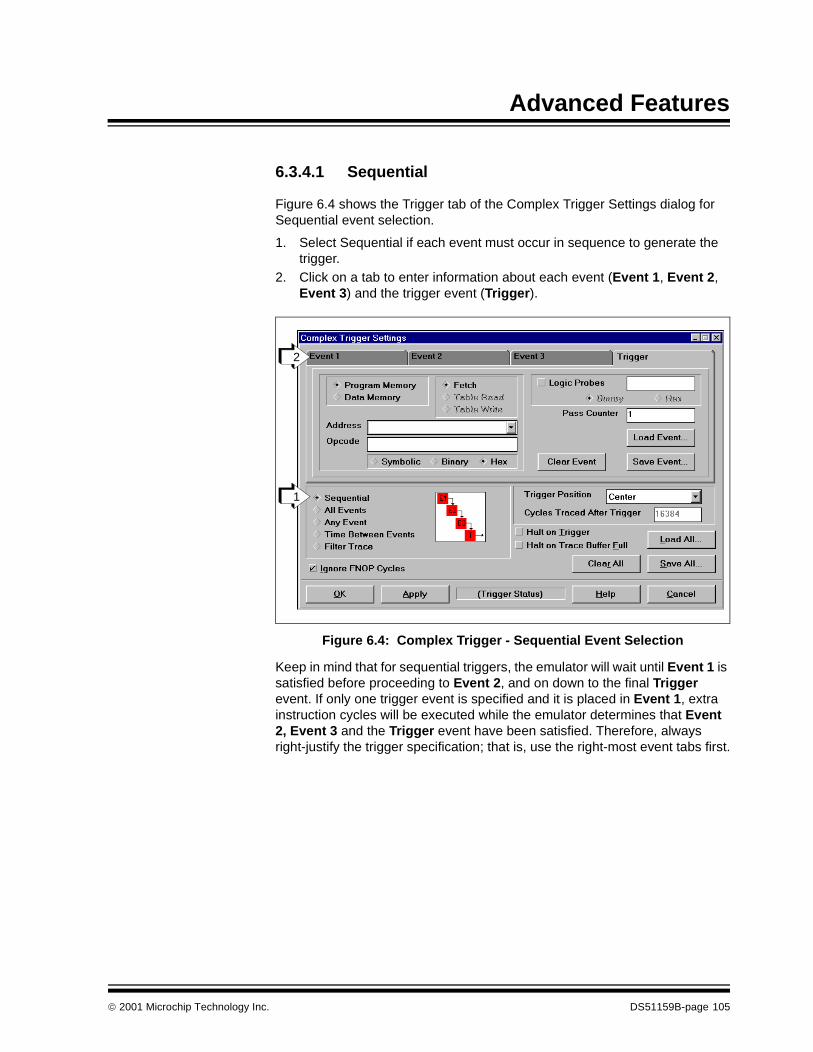
Advanced Features
6.3.4.1 Sequential
Figure 6.4 shows the Trigger tab of the Complex Trigger Settings dialog for Sequential event selection.
1. Select Sequential if each event must occur in sequence to generate thetrigger.
2. Click on a tab to enter information about each event (Event 1, Event 2,Event 3) and the trigger event (Trigger).
Figure 6.4: Complex Trigger - Sequential Event Selection
Keep in mind that for sequential triggers, the emulator will wait until Event 1 is satisfied before proceeding to Event 2, and on down to the final Trigger event. If only one trigger event is specified and it is placed in Event 1, extra instruction cycles will be executed while the emulator determines that Event 2, Event 3 and the Trigger event have been satisfied. Therefore, always right-justify the trigger specification; that is, use the right-most event tabs first.
1
2
2001 Microchip Technology Inc. DS51159B-page 105
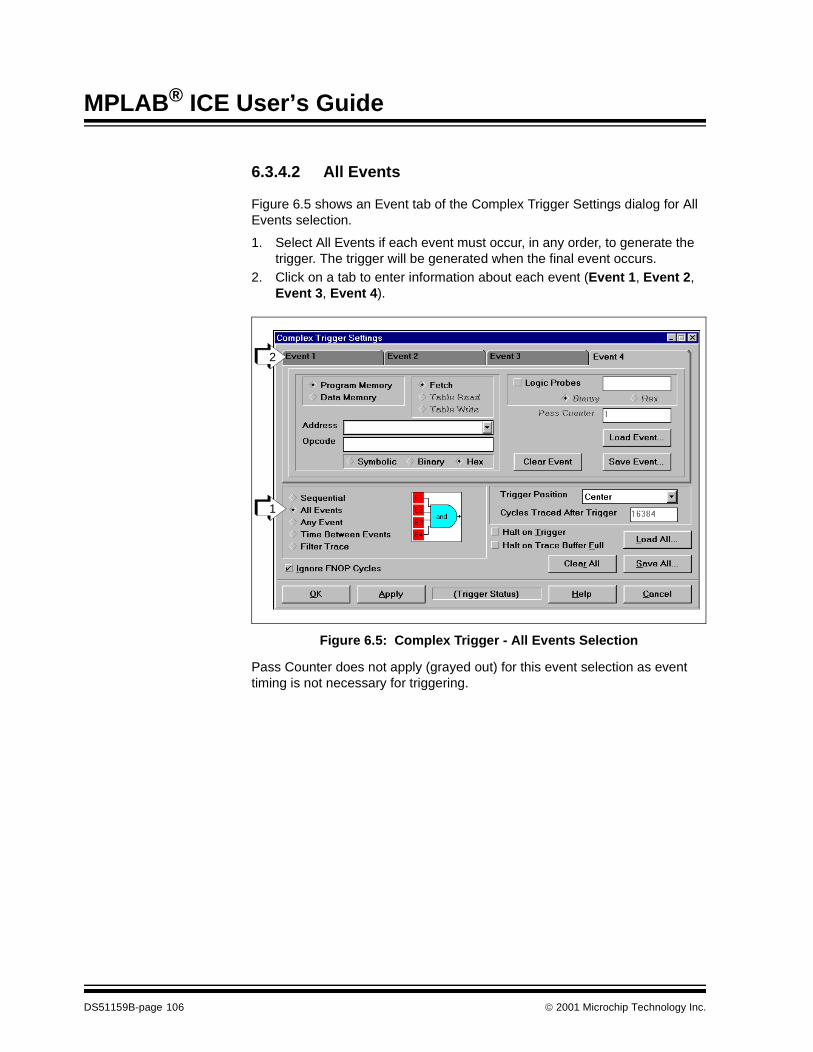
MPLAB® ICE User’s Guide
6.3.4.2 All Events
Figure 6.5 shows an Event tab of the Complex Trigger Settings dialog for All Events selection.
1. Select All Events if each event must occur, in any order, to generate thetrigger. The trigger will be generated when the final event occurs.
2. Click on a tab to enter information about each event (Event 1, Event 2,Event 3, Event 4).
Figure 6.5: Complex Trigger - All Events Selection
Pass Counter does not apply (grayed out) for this event selection as event timing is not necessary for triggering.
1
2
DS51159B-page 106 2001 Microchip Technology Inc.
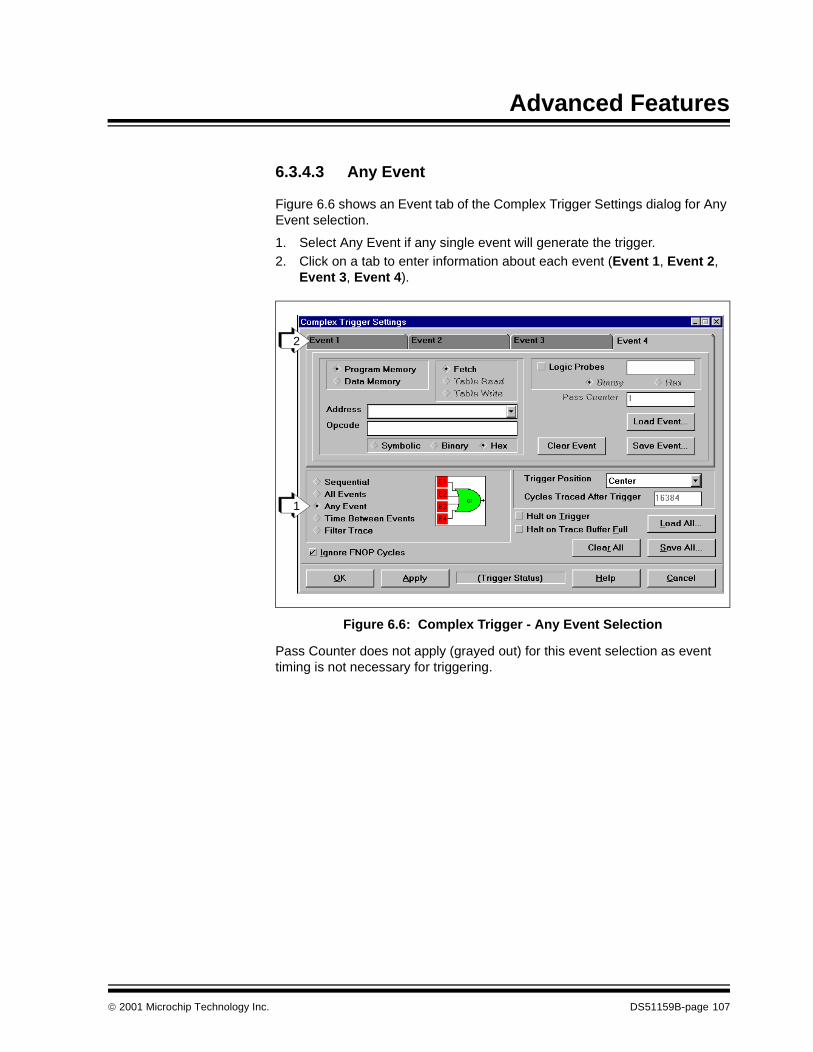
Advanced Features
6.3.4.3 Any Event
Figure 6.6 shows an Event tab of the Complex Trigger Settings dialog for Any Event selection.
1. Select Any Event if any single event will generate the trigger.2. Click on a tab to enter information about each event (Event 1, Event 2,
Event 3, Event 4).
Figure 6.6: Complex Trigger - Any Event Selection
Pass Counter does not apply (grayed out) for this event selection as event timing is not necessary for triggering.
1
2
2001 Microchip Technology Inc. DS51159B-page 107
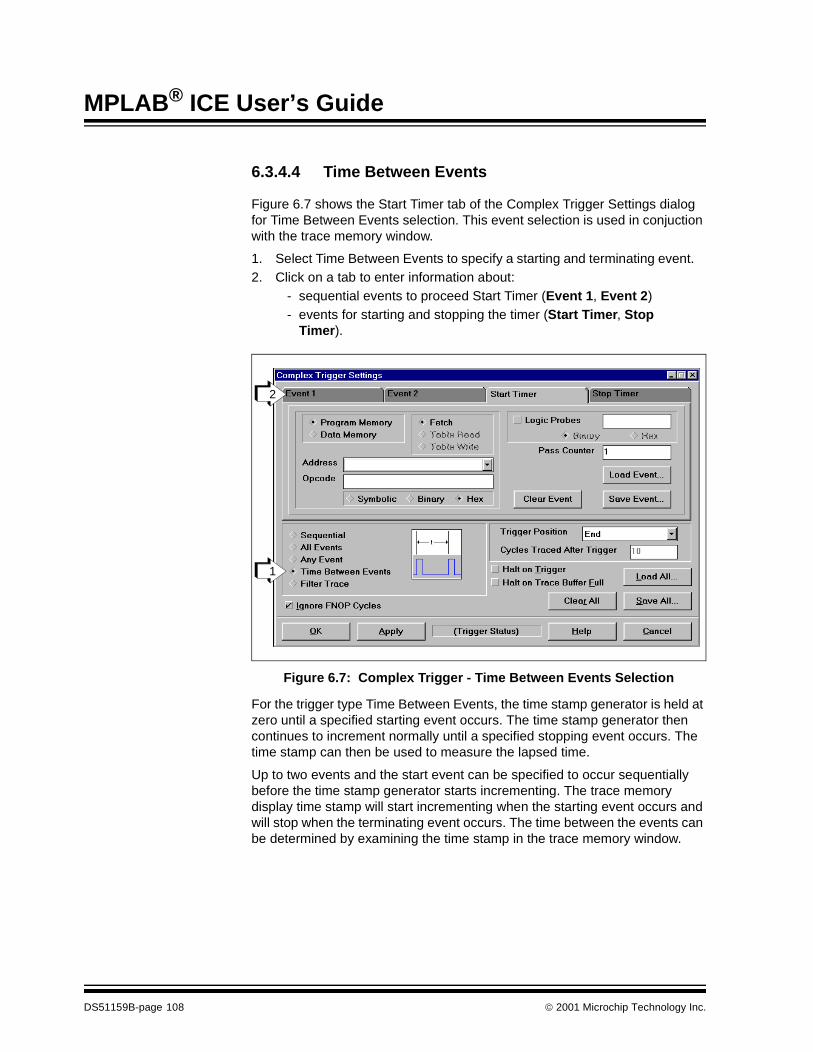
MPLAB® ICE User’s Guide
6.3.4.4 Time Between Events
Figure 6.7 shows the Start Timer tab of the Complex Trigger Settings dialog for Time Between Events selection. This event selection is used in conjuction with the trace memory window.
1. Select Time Between Events to specify a starting and terminating event.2. Click on a tab to enter information about:
- sequential events to proceed Start Timer (Event 1, Event 2)- events for starting and stopping the timer (Start Timer, Stop
Timer).
Figure 6.7: Complex Trigger - Time Between Events Selection
For the trigger type Time Between Events, the time stamp generator is held at zero until a specified starting event occurs. The time stamp generator then continues to increment normally until a specified stopping event occurs. The time stamp can then be used to measure the lapsed time.
Up to two events and the start event can be specified to occur sequentially before the time stamp generator starts incrementing. The trace memory display time stamp will start incrementing when the starting event occurs and will stop when the terminating event occurs. The time between the events can be determined by examining the time stamp in the trace memory window.
1
2
DS51159B-page 108 2001 Microchip Technology Inc.
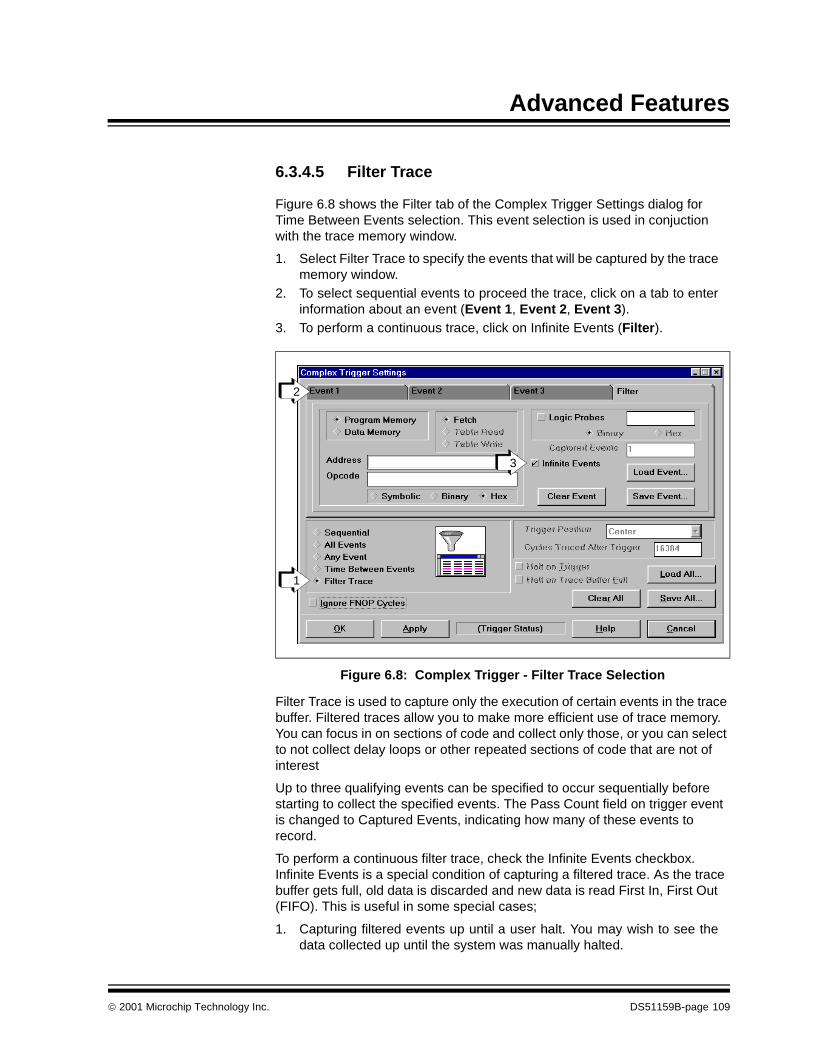
Advanced Features
6.3.4.5 Filter Trace
Figure 6.8 shows the Filter tab of the Complex Trigger Settings dialog for Time Between Events selection. This event selection is used in conjuction with the trace memory window.
1. Select Filter Trace to specify the events that will be captured by the tracememory window.
2. To select sequential events to proceed the trace, click on a tab to enterinformation about an event (Event 1, Event 2, Event 3).
3. To perform a continuous trace, click on Infinite Events (Filter).
Figure 6.8: Complex Trigger - Filter Trace Selection
Filter Trace is used to capture only the execution of certain events in the trace buffer. Filtered traces allow you to make more efficient use of trace memory. You can focus in on sections of code and collect only those, or you can select to not collect delay loops or other repeated sections of code that are not of interest
Up to three qualifying events can be specified to occur sequentially before starting to collect the specified events. The Pass Count field on trigger event is changed to Captured Events, indicating how many of these events to record.
To perform a continuous filter trace, check the Infinite Events checkbox. Infinite Events is a special condition of capturing a filtered trace. As the trace buffer gets full, old data is discarded and new data is read First In, First Out (FIFO). This is useful in some special cases;
1. Capturing filtered events up until a user halt. You may wish to see thedata collected up until the system was manually halted.
1
2
3
2001 Microchip Technology Inc. DS51159B-page 109
MPLAB® ICE User’s Guide
2. Use “Reload Data” as you are filtering events to get a trace display of thecurrent trace buffer. Continue to select “Reload Data” to upload anothercapture of the current data being filtered. This is useful if you are moni-toring a system in real time and just want to see what’s going on withouthalting the system.
3. Sometimes a system misbehaves after a long period of time. Infiniteevents will continue collecting the data in your critical routine until theapplication is halted. Often the misbehaving state will get into a place inthe program where no events will be collected. The trace buffer will thenbe a record of the data of interest before the “glitch.”
4. Filtered traces can output a series of triggers on the TRGOUT connector.If you wanted to trigger an external logic analyzer every time a particularroutine is executed, this can be achieved by filtering on that address andsetting the appropriate triggering in the Trigger In/Out Dialog. InfiniteEvents, in this case, will allow continuous triggers to be generated on theTRGOUT connector.
Trigger Position is inapplicable when filtering, as is Halt on Trigger and Halt on Trace Buffer Full.
Ignore FNOP Cycles should not be specified when performing a Filter Trace; otherwise, the trace buffer will capture the cycle that executes after the cycle that caused the trigger.
Also, performing a Filter Trace on Data Memory access is not recommended, since the traced data will be one cycle after the trigger specification.
Note: Since Ignore FNOP Cycles should not be specified with a FilterTrace, prefetches will cause the trigger to fire.
Note: When triggering on multiple events, keep in mind that triggers ondata memory accesses are skewed two cycles from the instruc-tions that caused them.
DS51159B-page 110 2001 Microchip Technology Inc.

Advanced Features
6.3.5 Complex Triggering ExamplesThe following examples show some of the ways that complex triggers can be used to help debug or characterize a problem.
6.3.5.1 Sequential Example - Program Memory
An application has several subroutines. A particular subroutine (RoutineA) functions correctly to begin with, but after a time, it begins to function incorrectly. This subroutine is called many times, so it would be nice to skip the executions where the subroutine functions properly and breaks just before the subroutine starts to fail. It is observed that the routine functions correctly until another after subroutine (RoutineB) is called.
This problem can be solved by a Sequential trigger with two events. The first event that must occur is the execution of RoutineB, so the Event 3 tab is specified with the fetch of program memory address RoutineB. The trigger should fire when RoutineA is called, so the Trigger tab is specified with the fetch of program memory address RoutineA. The Ignore FNOP Cycles is left checked so prefetches are ignored, and Halt On Trigger is checked so the improperly executing subroutine can be stepped.
Figure 6.9: Setting the First of Two Sequential Events
2001 Microchip Technology Inc. DS51159B-page 111
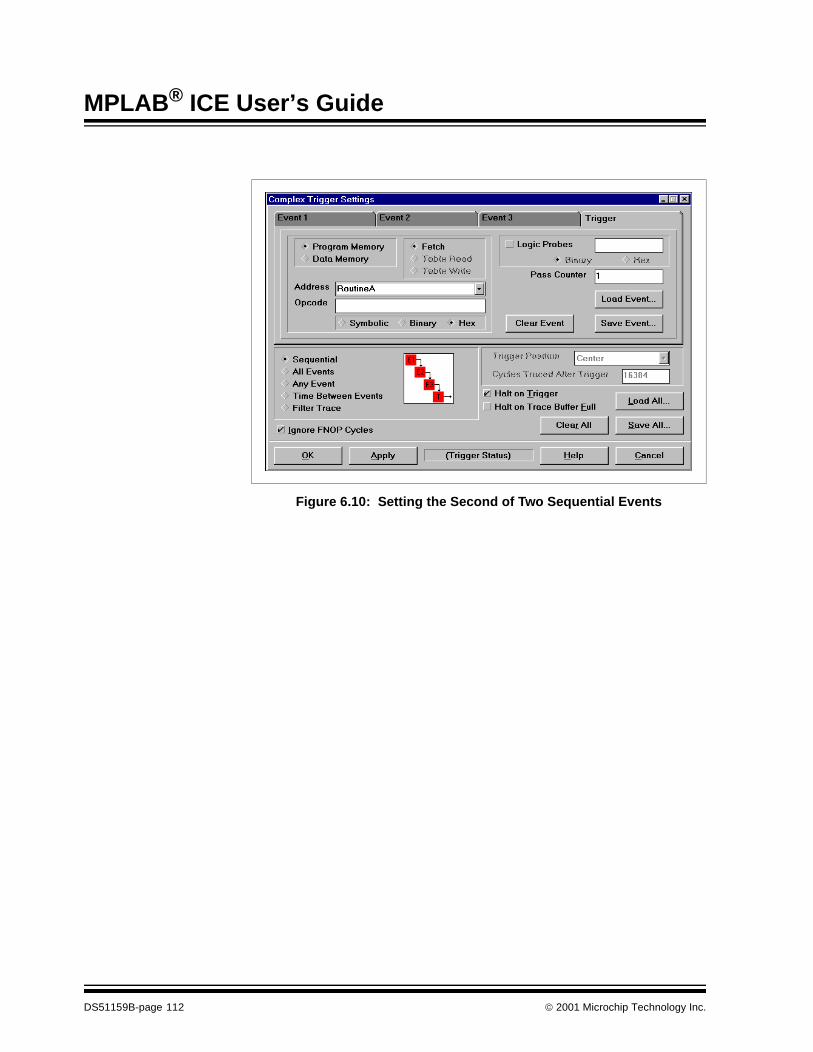
MPLAB® ICE User’s Guide
Figure 6.10: Setting the Second of Two Sequential Events
DS51159B-page 112 2001 Microchip Technology Inc.
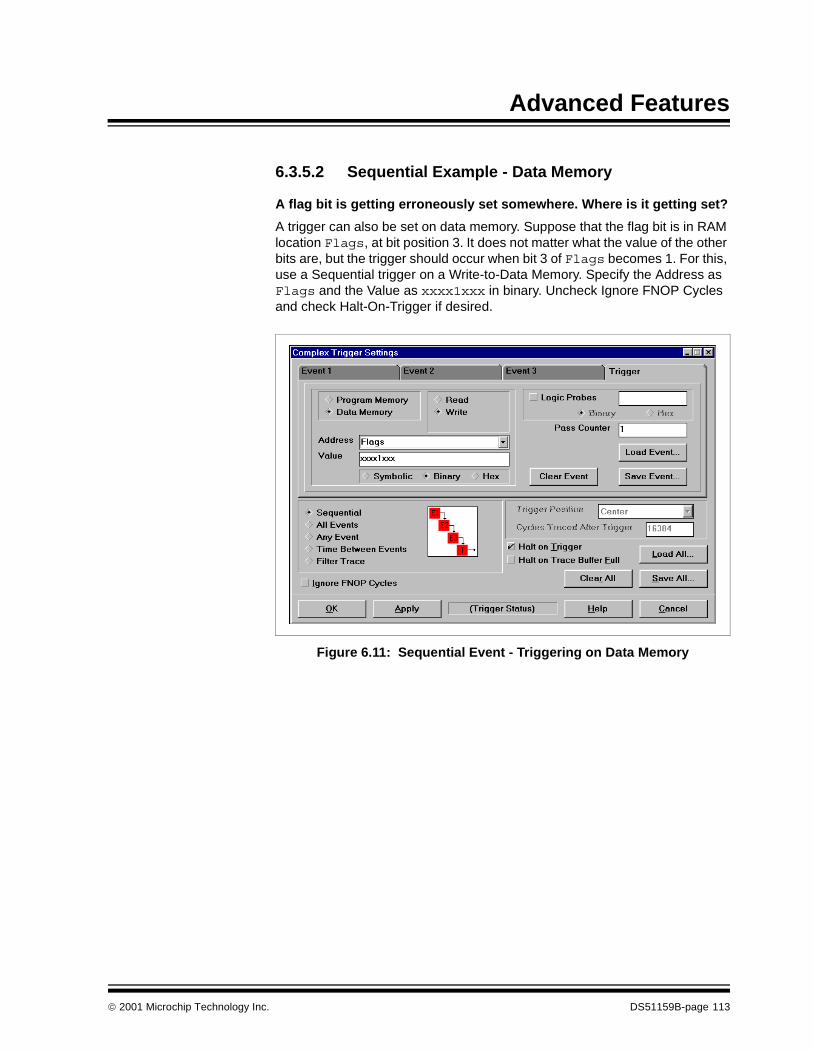
Advanced Features
6.3.5.2 Sequential Example - Data Memory
A flag bit is getting erroneously set somewhere. Where is it getting set?
A trigger can also be set on data memory. Suppose that the flag bit is in RAM location Flags, at bit position 3. It does not matter what the value of the other bits are, but the trigger should occur when bit 3 of Flags becomes 1. For this, use a Sequential trigger on a Write-to-Data Memory. Specify the Address as Flags and the Value as xxxx1xxx in binary. Uncheck Ignore FNOP Cycles and check Halt-On-Trigger if desired.
Figure 6.11: Sequential Event - Triggering on Data Memory
2001 Microchip Technology Inc. DS51159B-page 113
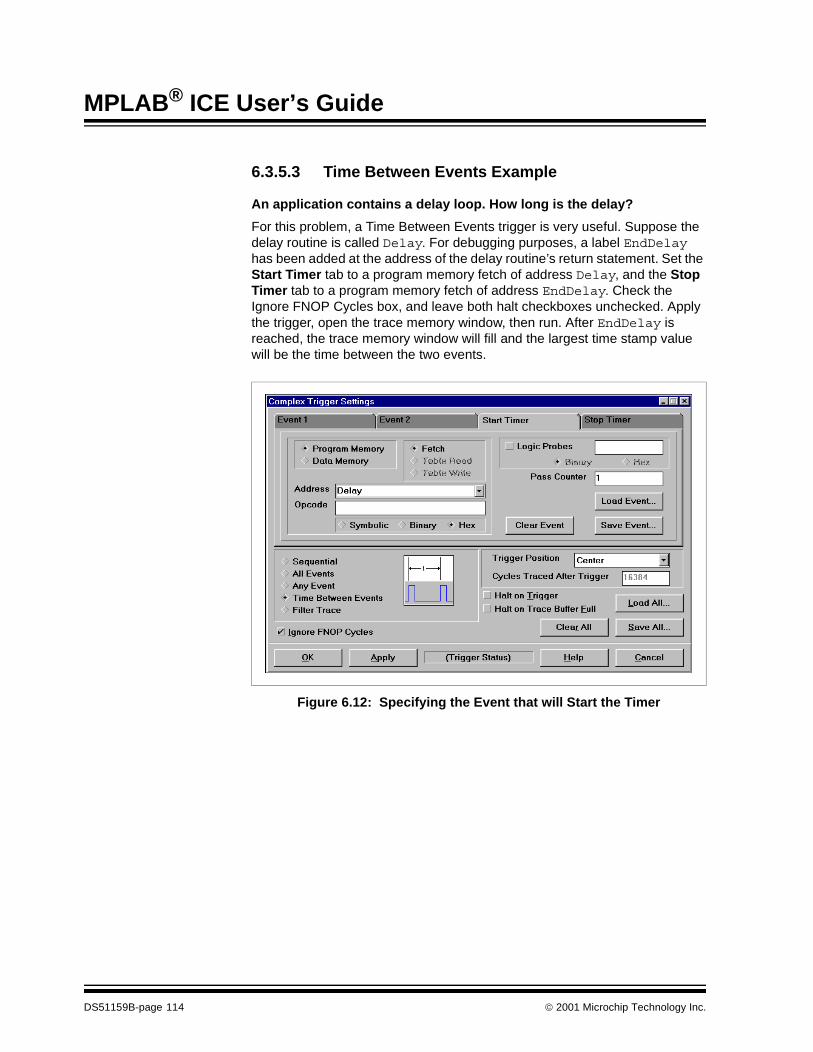
MPLAB® ICE User’s Guide
6.3.5.3 Time Between Events Example
An application contains a delay loop. How long is the delay?
For this problem, a Time Between Events trigger is very useful. Suppose the delay routine is called Delay. For debugging purposes, a label EndDelay has been added at the address of the delay routine’s return statement. Set the Start Timer tab to a program memory fetch of address Delay, and the Stop Timer tab to a program memory fetch of address EndDelay. Check the Ignore FNOP Cycles box, and leave both halt checkboxes unchecked. Apply the trigger, open the trace memory window, then run. After EndDelay is reached, the trace memory window will fill and the largest time stamp value will be the time between the two events.
Figure 6.12: Specifying the Event that will Start the Timer
DS51159B-page 114 2001 Microchip Technology Inc.
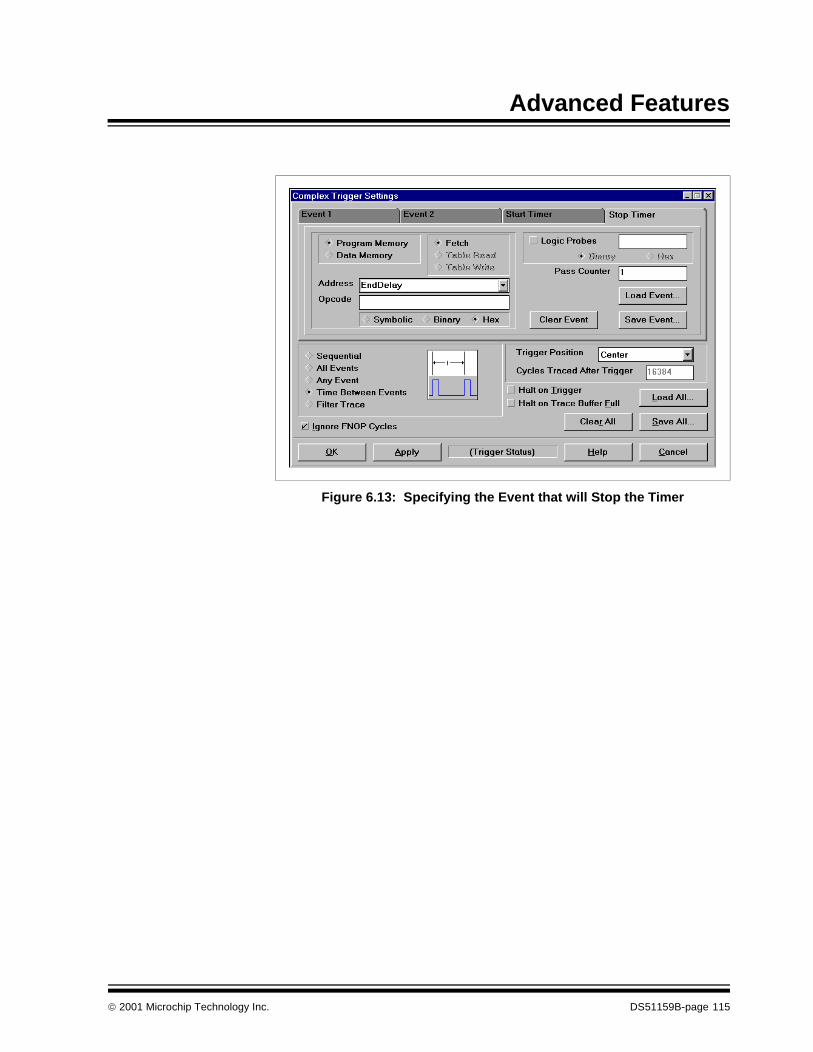
Advanced Features
Figure 6.13: Specifying the Event that will Stop the Timer
2001 Microchip Technology Inc. DS51159B-page 115
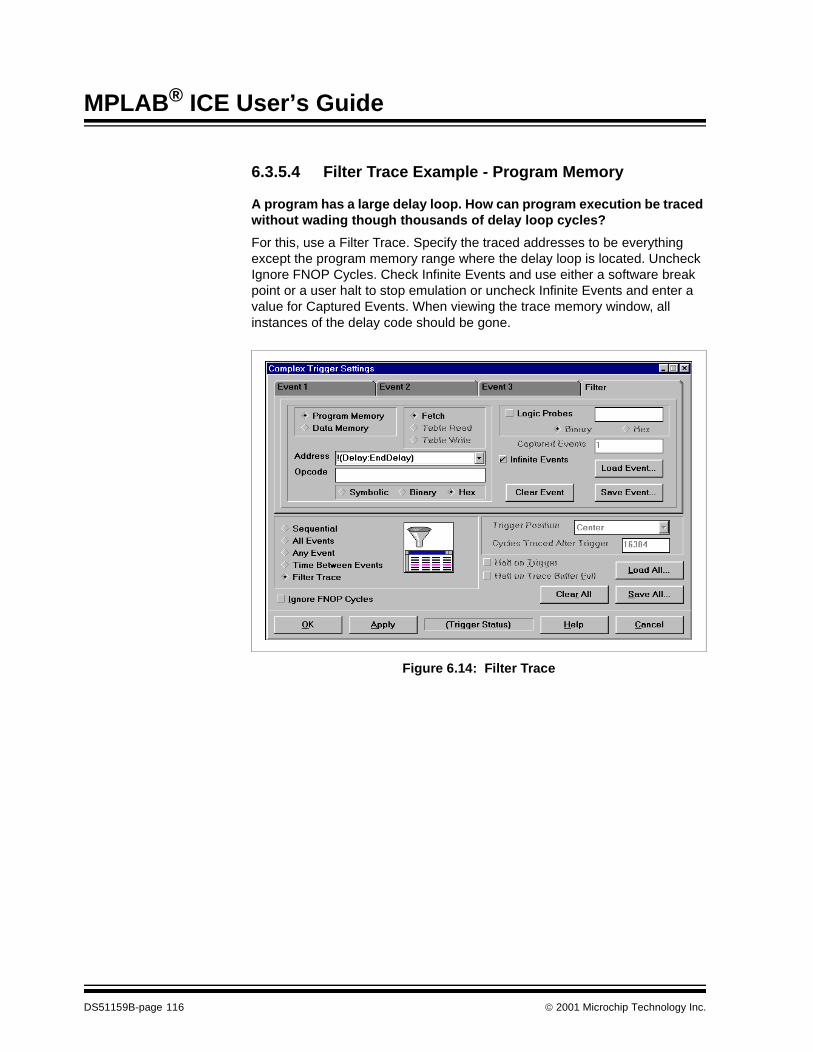
MPLAB® ICE User’s Guide
6.3.5.4 Filter Trace Example - Program Memory
A program has a large delay loop. How can program execution be traced without wading though thousands of delay loop cycles?
For this, use a Filter Trace. Specify the traced addresses to be everything except the program memory range where the delay loop is located. Uncheck Ignore FNOP Cycles. Check Infinite Events and use either a software break point or a user halt to stop emulation or uncheck Infinite Events and enter a value for Captured Events. When viewing the trace memory window, all instances of the delay code should be gone.
Figure 6.14: Filter Trace
DS51159B-page 116 2001 Microchip Technology Inc.
Advanced Features
6.3.5.5 Filter Trace Example - Data Memory
How do I filter on data memory?
Filtering on PICmicro file register reads and writes will result in the collection of the cycles immediately following the R/W. While this is not exactly the information you are looking for, it does provide two data points:
1. The program memory after the R/W occurred, so you can track downplaces in your code that affect a particular variable or SFR.
2. The number of times the R/W occurred, providing you with a count of thecollected cycles.
There are two ways to capture the actual data values with a filter. The first is to filter on the routine that does the R/W. This will generate some extra cycles, but will collect the proper information. The second is to make code that will generate two R/W cycles to the same location, one of which does not affect the actual data. For instance, the register can be ANDed with a value of 0xFF to generate the extra cycle like this:
test
movlw 0xFF
movwf LSDigit
test1
decfsz LSDigit
andwf LSDigit ; generate extra read/w to LSDigit
goto test1
2001 Microchip Technology Inc. DS51159B-page 117
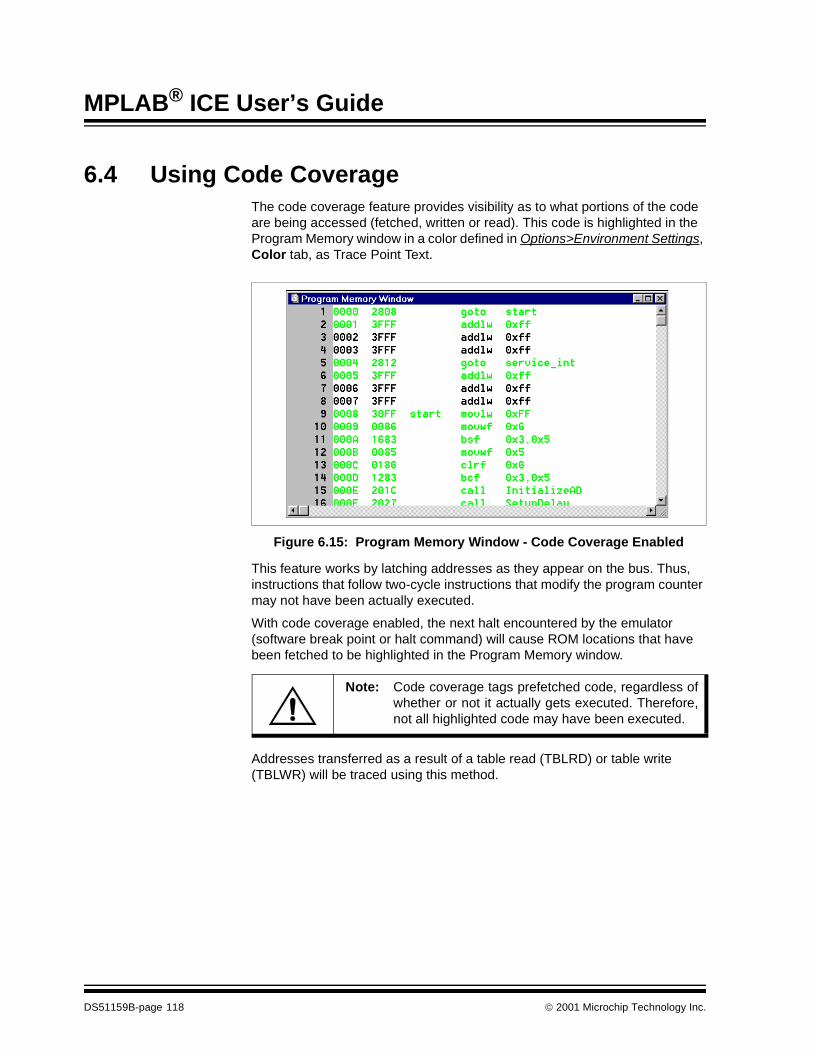
MPLAB® ICE User’s Guide
6.4 Using Code CoverageThe code coverage feature provides visibility as to what portions of the code are being accessed (fetched, written or read). This code is highlighted in the Program Memory window in a color defined in Options>Environment Settings, Color tab, as Trace Point Text.
Figure 6.15: Program Memory Window - Code Coverage Enabled
This feature works by latching addresses as they appear on the bus. Thus, instructions that follow two-cycle instructions that modify the program counter may not have been actually executed.
With code coverage enabled, the next halt encountered by the emulator (software break point or halt command) will cause ROM locations that have been fetched to be highlighted in the Program Memory window.
Addresses transferred as a result of a table read (TBLRD) or table write (TBLWR) will be traced using this method.
Note: Code coverage tags prefetched code, regardless ofwhether or not it actually gets executed. Therefore,not all highlighted code may have been executed.
DS51159B-page 118 2001 Microchip Technology Inc.
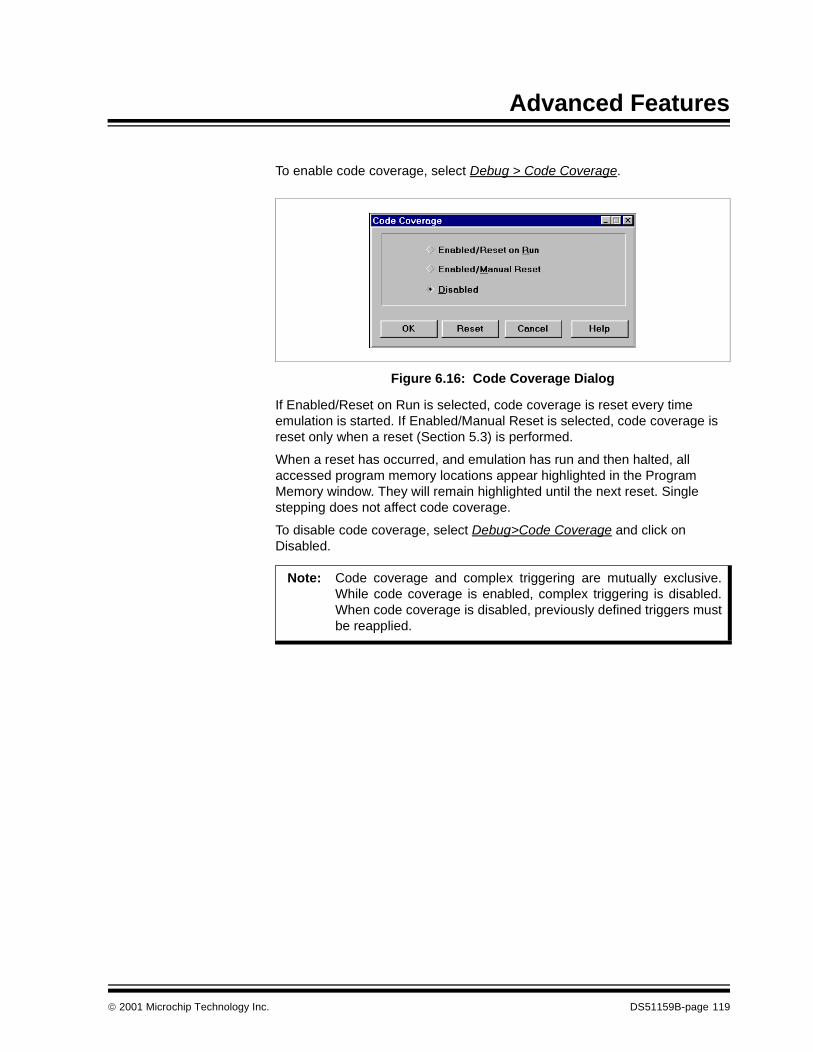
Advanced Features
To enable code coverage, select Debug > Code Coverage.
Figure 6.16: Code Coverage Dialog
If Enabled/Reset on Run is selected, code coverage is reset every time emulation is started. If Enabled/Manual Reset is selected, code coverage is reset only when a reset (Section 5.3) is performed.
When a reset has occurred, and emulation has run and then halted, all accessed program memory locations appear highlighted in the Program Memory window. They will remain highlighted until the next reset. Single stepping does not affect code coverage.
To disable code coverage, select Debug>Code Coverage and click on Disabled.
Note: Code coverage and complex triggering are mutually exclusive.While code coverage is enabled, complex triggering is disabled.When code coverage is disabled, previously defined triggers mustbe reapplied.
2001 Microchip Technology Inc. DS51159B-page 119
MPLAB® ICE User’s Guide
6.5 Using the Trace Memory WindowThe trace memory window in MPLAB ICE contains information that is uploaded from MPLAB ICE’s trace buffer. The trace buffer consists of memory hardware that can log the electrical state of the various PICmicro MCU data, address and control signals at an instruction cycle in real time as the PICmicro MCU executes instructions. By default, all instruction cycles are captured by the trace buffer. The Complex Trigger dialog can be used to control which instruction cycles are captured (Section 6.3).
In MPLAB ICE, the trace buffer captures data on a 128-bit wide analyzer that is connected to the emulator chip and other devices in the emulator (Figure 6.17). The signals that the MPLAB ICE analyzer captures are:
• Program Memory Address• Program Memory Opcode/Data• File Register Source Address• File Register Source Data• File Register Destination Address • File Register Destination Data • External Logic Probe• Time Stamp• Additional Internal Emulator Signals
DS51159B-page 120 2001 Microchip Technology Inc.
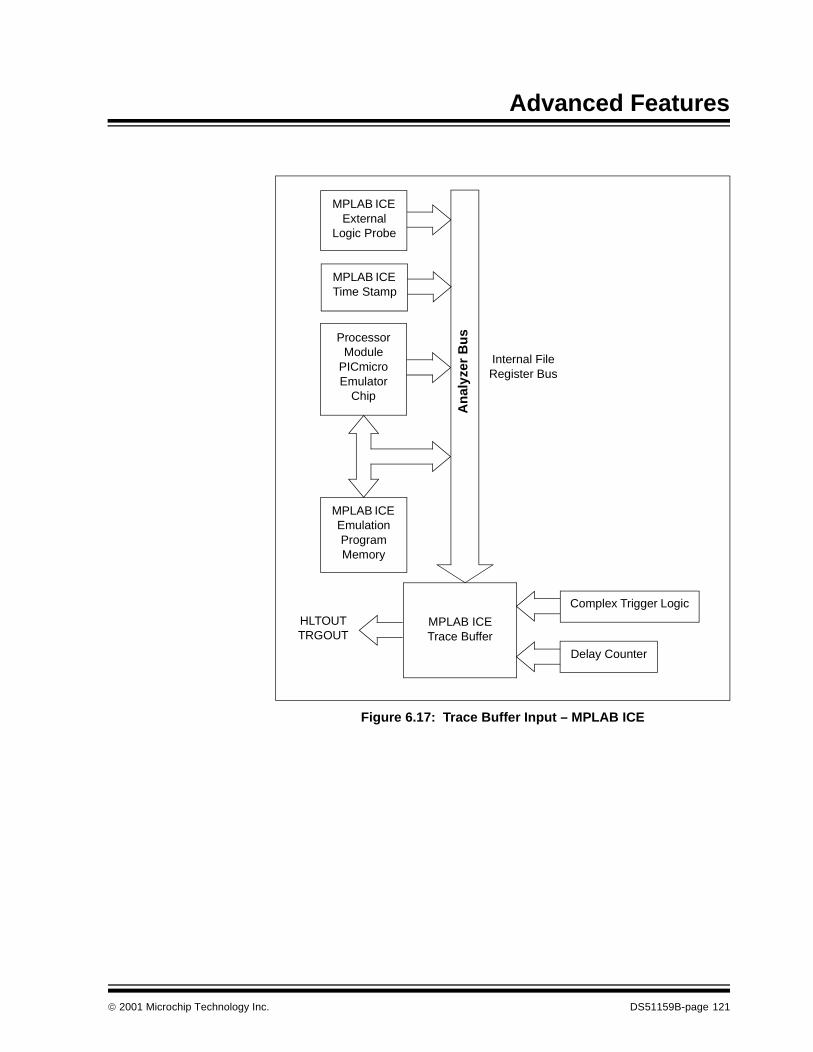
Advanced Features
Figure 6.17: Trace Buffer Input – MPLAB ICE
MPLAB ICE Trace Buffer
Complex Trigger Logic
Delay Counter
MPLAB ICE Emulation Program Memory
Processor Module
PICmicro Emulator
Chip
An
alyz
er B
us
Internal File Register Bus
MPLAB ICE Time Stamp
MPLAB ICE External
Logic Probe
HLTOUT TRGOUT
2001 Microchip Technology Inc. DS51159B-page 121
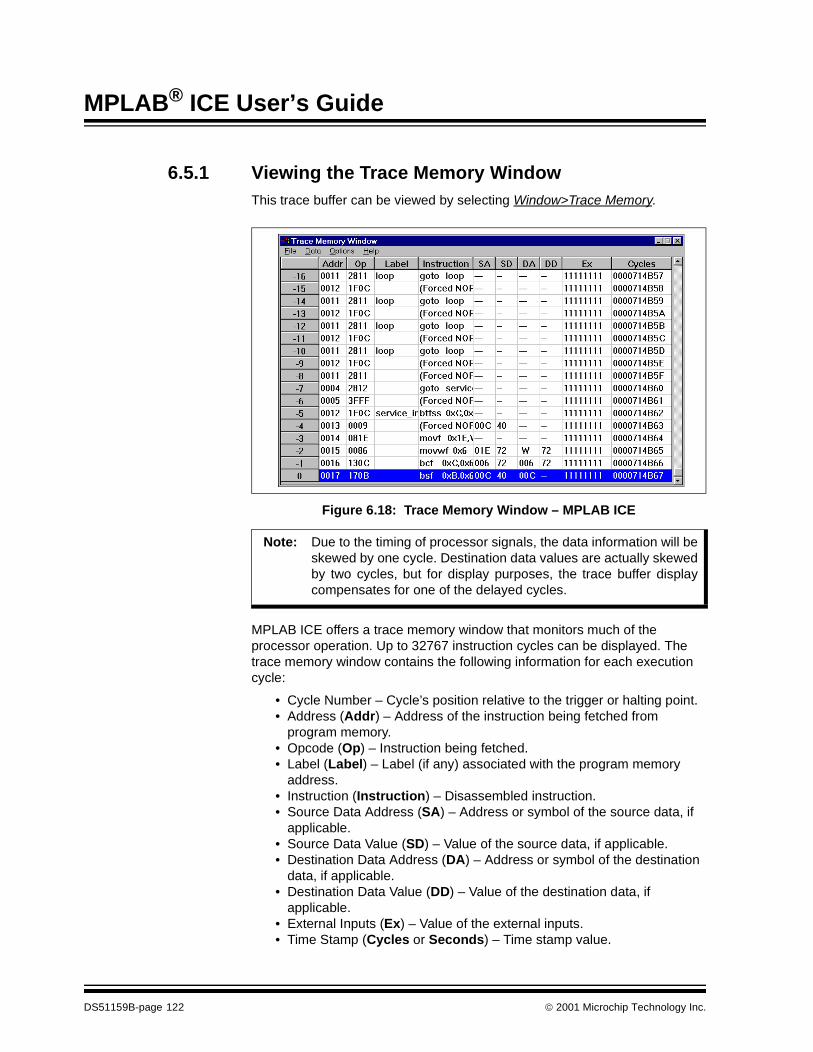
MPLAB® ICE User’s Guide
6.5.1 Viewing the Trace Memory WindowThis trace buffer can be viewed by selecting Window>Trace Memory.
Figure 6.18: Trace Memory Window – MPLAB ICE
MPLAB ICE offers a trace memory window that monitors much of the processor operation. Up to 32767 instruction cycles can be displayed. The trace memory window contains the following information for each execution cycle:
• Cycle Number – Cycle’s position relative to the trigger or halting point. • Address (Addr) – Address of the instruction being fetched from
program memory.• Opcode (Op) – Instruction being fetched.• Label (Label) – Label (if any) associated with the program memory
address.• Instruction (Instruction) – Disassembled instruction.• Source Data Address (SA) – Address or symbol of the source data, if
applicable.• Source Data Value (SD) – Value of the source data, if applicable.• Destination Data Address (DA) – Address or symbol of the destination
data, if applicable.• Destination Data Value (DD) – Value of the destination data, if
applicable.• External Inputs (Ex) – Value of the external inputs.• Time Stamp (Cycles or Seconds) – Time stamp value.
Note: Due to the timing of processor signals, the data information will beskewed by one cycle. Destination data values are actually skewedby two cycles, but for display purposes, the trace buffer displaycompensates for one of the delayed cycles.
DS51159B-page 122 2001 Microchip Technology Inc.
Advanced Features
The approximate trigger cycle will be highlighted in blue and will be numbered as cycle 0. All other cycles will be numbered based on this cycle. Cycles that occurred before the trigger point will have a negative cycle number and cycles that occurred after the trigger point will have a positive number. If the trace buffer was displayed after a user halt, a software break point, or a complex trigger that halted the processor, the trigger point will be the last traced cycle. If a complex trigger filled the trace buffer without halting the processor, the trigger point will show the approximate cycle when the complex trigger fired.
The menu items in the window perform the following functions:
• File>Save – Saves the displayed trace buffer information to a tab delimited file.
• Data>Find Trigger – Brings the trigger point to the center of the displayed cycles.
• Data>Reload – Reloads the trace information from the emulator.• Options>Configure – Brings up the Configure Trace dialog, described in
Section 6.5.2. • Options>Reset Time Stamp – Resets the value of the time stamp.• Help – Brings up the on-line help for Trace Memory.
Select Data>Reload to force an upload of what ever data has currently been collected by the trace buffer. This allows you to see where your program is executing. This is often useful if your trigger is never reached.
Note: Source and destination data addresses and values are notavailable when using processor modules based on the 12-bitPICmicro core (PIC16C5X and related parts).
2001 Microchip Technology Inc. DS51159B-page 123
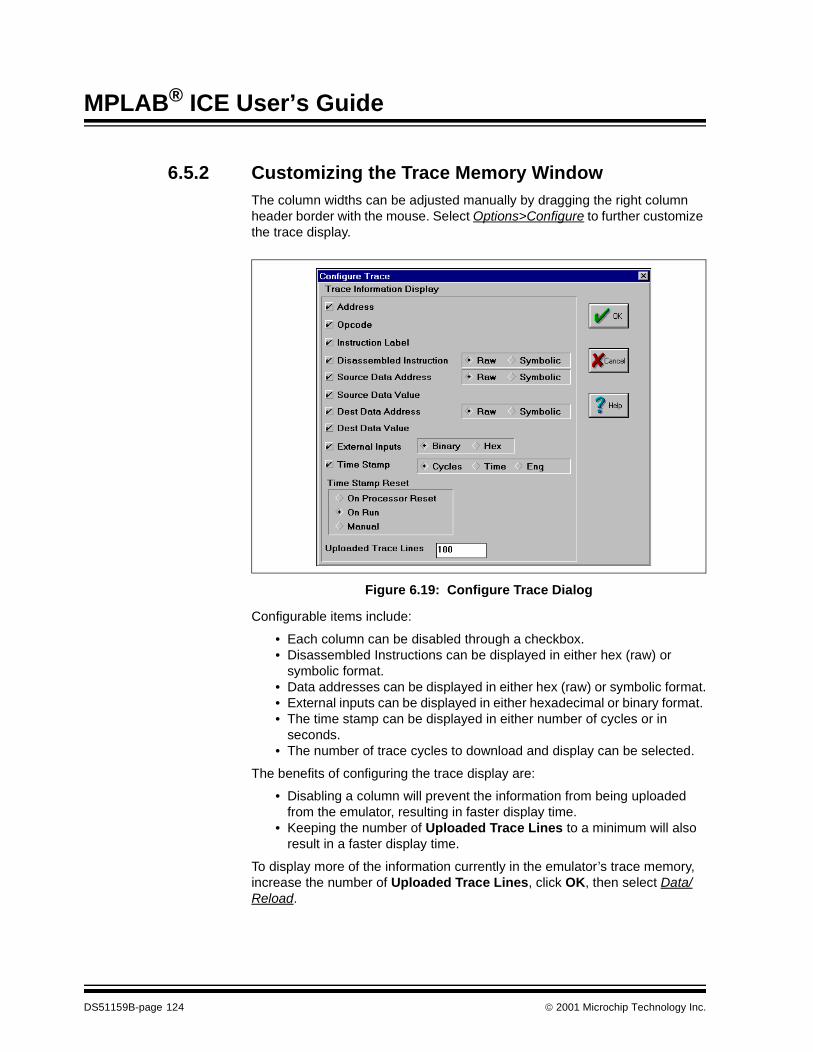
MPLAB® ICE User’s Guide
6.5.2 Customizing the Trace Memory WindowThe column widths can be adjusted manually by dragging the right column header border with the mouse. Select Options>Configure to further customize the trace display.
Figure 6.19: Configure Trace Dialog
Configurable items include:
• Each column can be disabled through a checkbox. • Disassembled Instructions can be displayed in either hex (raw) or
symbolic format.• Data addresses can be displayed in either hex (raw) or symbolic format.• External inputs can be displayed in either hexadecimal or binary format. • The time stamp can be displayed in either number of cycles or in
seconds.• The number of trace cycles to download and display can be selected.
The benefits of configuring the trace display are:
• Disabling a column will prevent the information from being uploaded from the emulator, resulting in faster display time.
• Keeping the number of Uploaded Trace Lines to a minimum will also result in a faster display time.
To display more of the information currently in the emulator’s trace memory, increase the number of Uploaded Trace Lines, click OK, then select Data/Reload.
DS51159B-page 124 2001 Microchip Technology Inc.
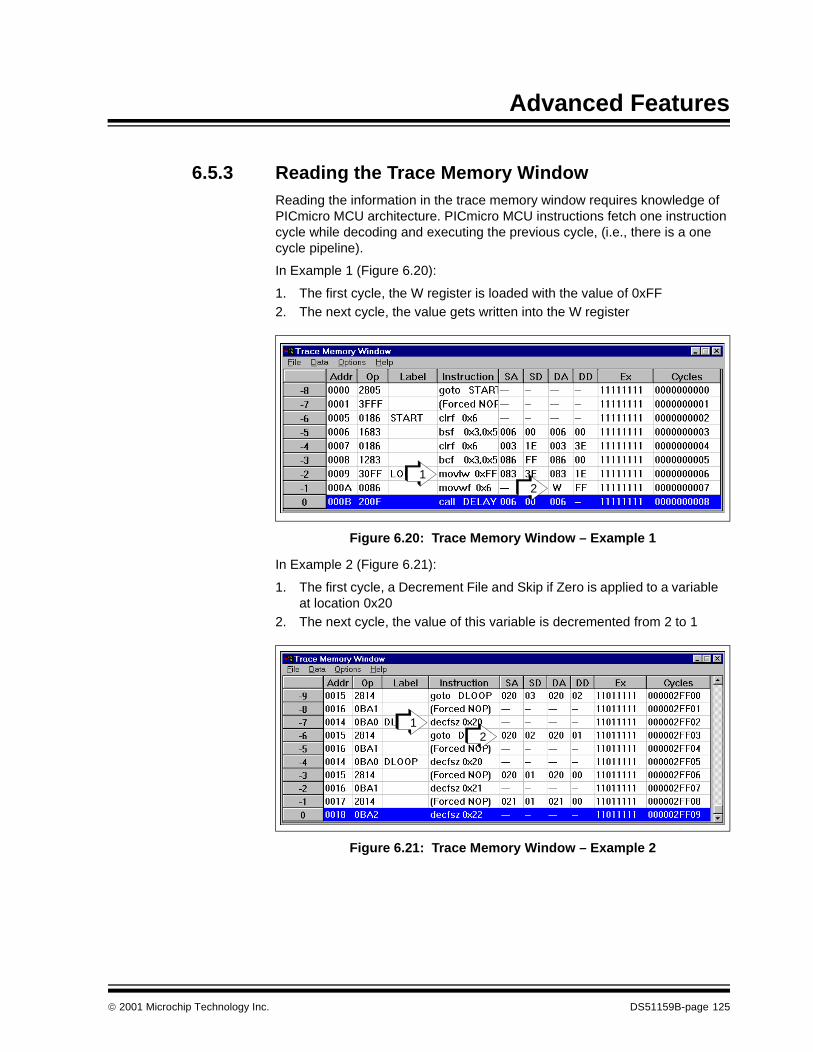
Advanced Features
6.5.3 Reading the Trace Memory WindowReading the information in the trace memory window requires knowledge of PICmicro MCU architecture. PICmicro MCU instructions fetch one instruction cycle while decoding and executing the previous cycle, (i.e., there is a one cycle pipeline).
In Example 1 (Figure 6.20):
1. The first cycle, the W register is loaded with the value of 0xFF2. The next cycle, the value gets written into the W register
Figure 6.20: Trace Memory Window – Example 1
In Example 2 (Figure 6.21):
1. The first cycle, a Decrement File and Skip if Zero is applied to a variableat location 0x20
2. The next cycle, the value of this variable is decremented from 2 to 1
Figure 6.21: Trace Memory Window – Example 2
12
12
12
2001 Microchip Technology Inc. DS51159B-page 125

MPLAB® ICE User’s Guide
NOTES:
DS51159B-page 126 2001 Microchip Technology Inc.
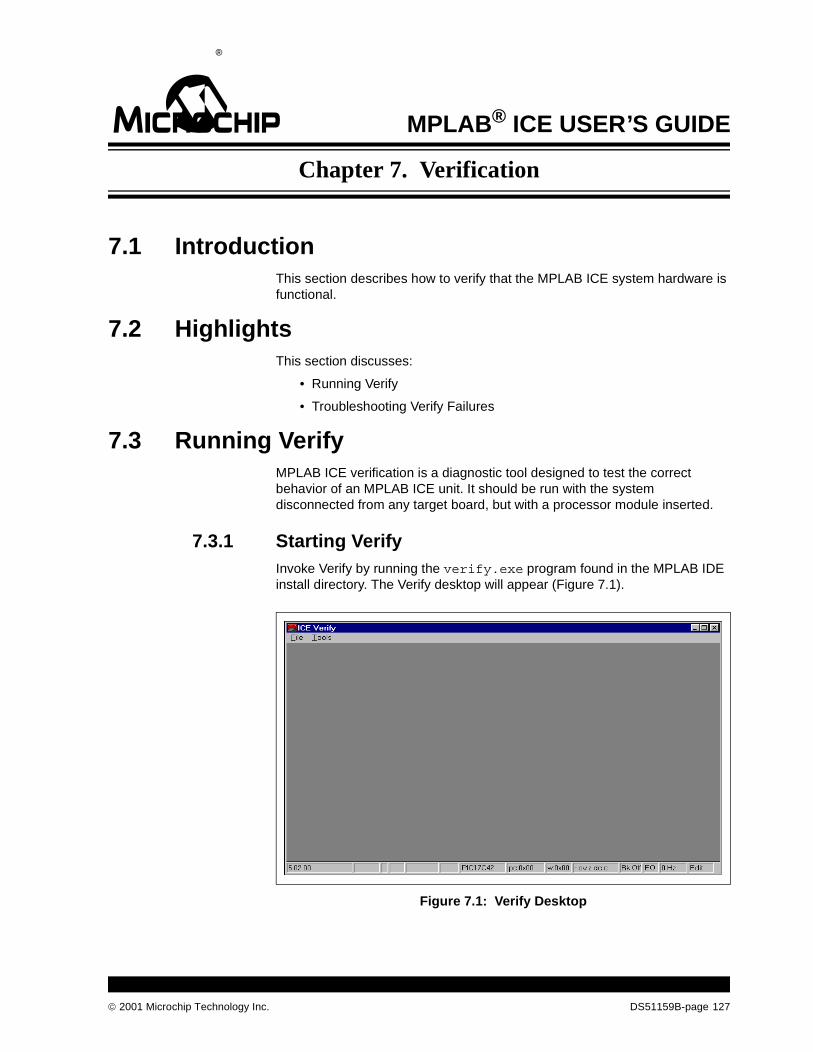
2001 Microchip Technology Inc. DS51159B-page 127
MPLAB® ICE USER’S GUIDE12Chapter 7. Verification
7.1 IntroductionThis section describes how to verify that the MPLAB ICE system hardware is functional.
7.2 HighlightsThis section discusses:
• Running Verify
• Troubleshooting Verify Failures
7.3 Running VerifyMPLAB ICE verification is a diagnostic tool designed to test the correct behavior of an MPLAB ICE unit. It should be run with the system disconnected from any target board, but with a processor module inserted.
7.3.1 Starting VerifyInvoke Verify by running the verify.exe program found in the MPLAB IDE install directory. The Verify desktop will appear (Figure 7.1).
Figure 7.1: Verify Desktop
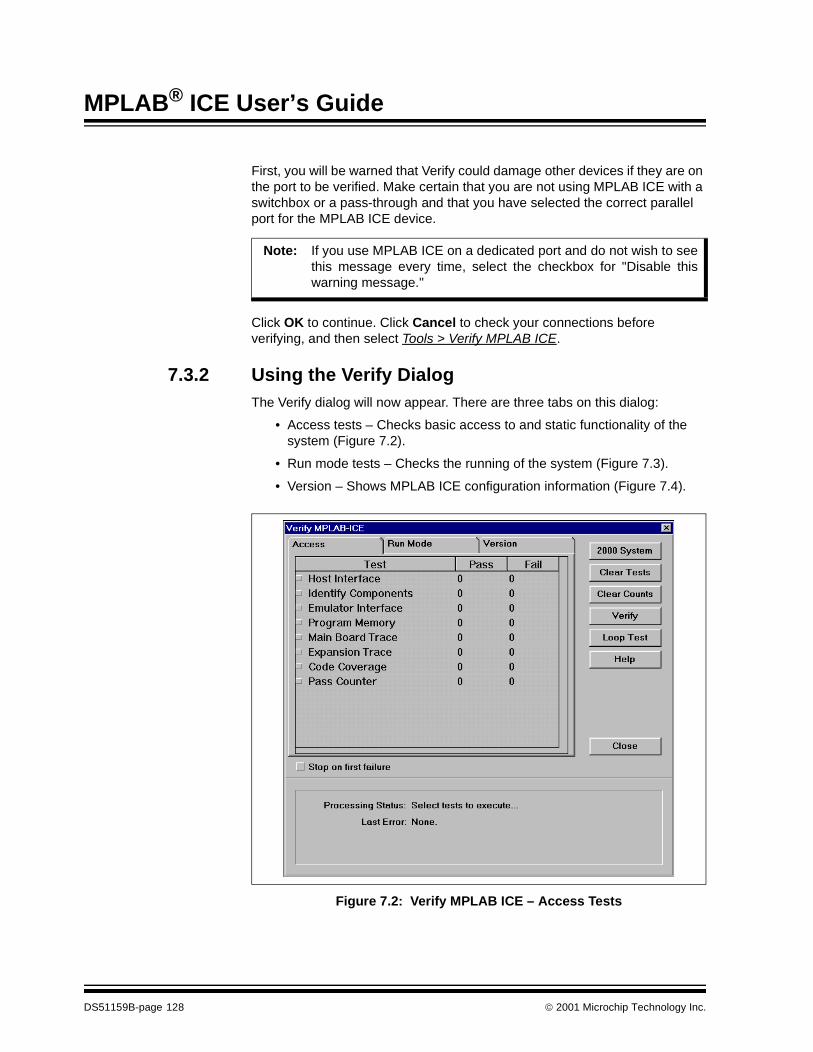
MPLAB® ICE User’s Guide
First, you will be warned that Verify could damage other devices if they are on the port to be verified. Make certain that you are not using MPLAB ICE with a switchbox or a pass-through and that you have selected the correct parallel port for the MPLAB ICE device.
Click OK to continue. Click Cancel to check your connections before verifying, and then select Tools > Verify MPLAB ICE.
7.3.2 Using the Verify DialogThe Verify dialog will now appear. There are three tabs on this dialog:
• Access tests – Checks basic access to and static functionality of the system (Figure 7.2).
• Run mode tests – Checks the running of the system (Figure 7.3).
• Version – Shows MPLAB ICE configuration information (Figure 7.4).
Figure 7.2: Verify MPLAB ICE – Access Tests
Note: If you use MPLAB ICE on a dedicated port and do not wish to seethis message every time, select the checkbox for "Disable thiswarning message."
DS51159B-page 128 2001 Microchip Technology Inc.
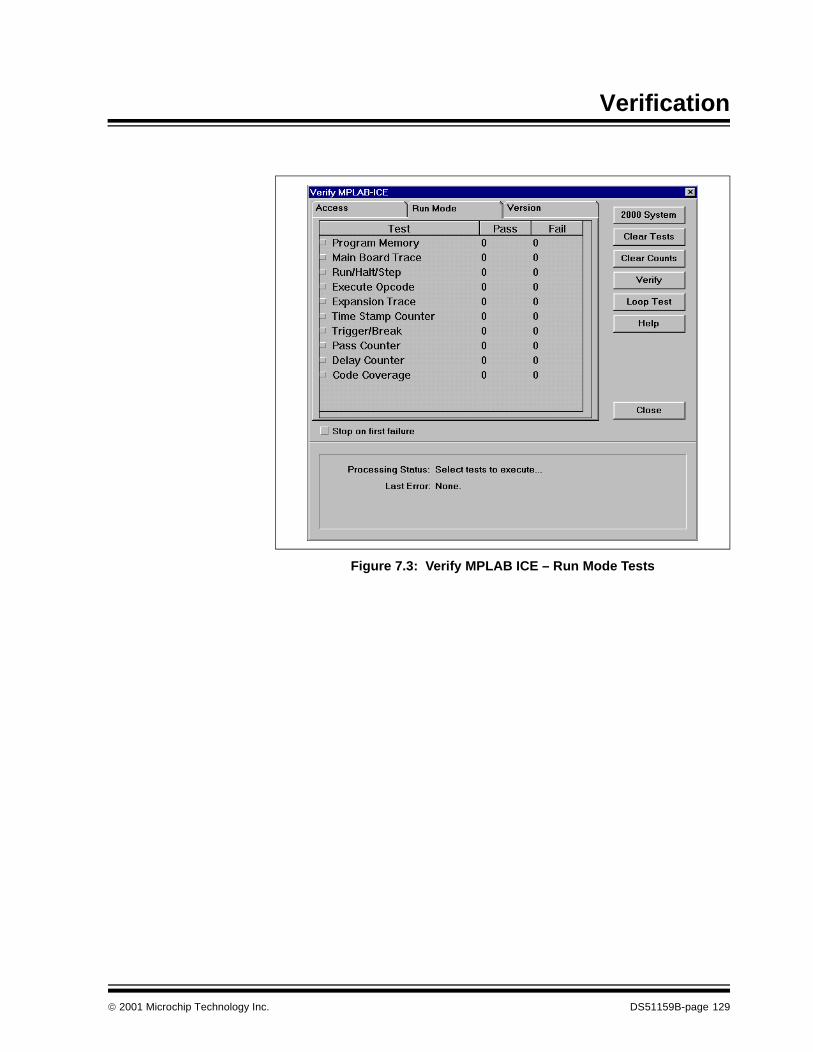
Verification
Figure 7.3: Verify MPLAB ICE – Run Mode Tests
2001 Microchip Technology Inc. DS51159B-page 129
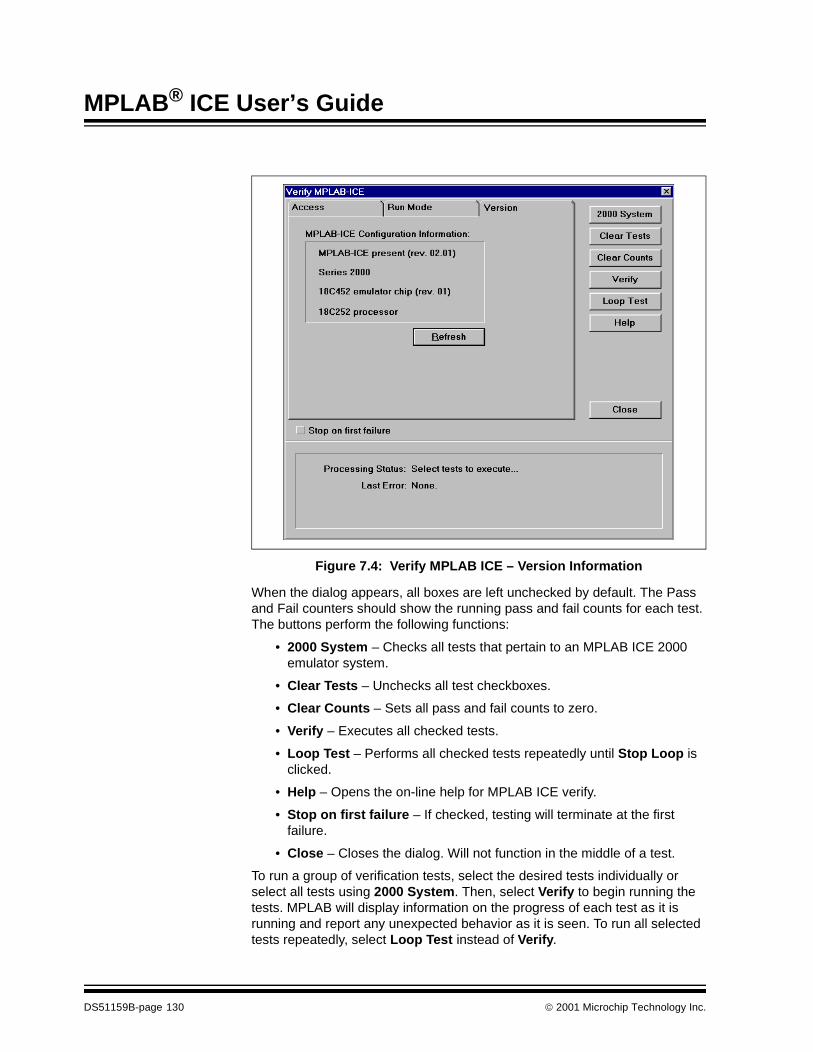
MPLAB® ICE User’s Guide
Figure 7.4: Verify MPLAB ICE – Version Information
When the dialog appears, all boxes are left unchecked by default. The Pass and Fail counters should show the running pass and fail counts for each test. The buttons perform the following functions:
• 2000 System – Checks all tests that pertain to an MPLAB ICE 2000 emulator system.
• Clear Tests – Unchecks all test checkboxes.
• Clear Counts – Sets all pass and fail counts to zero.
• Verify – Executes all checked tests.
• Loop Test – Performs all checked tests repeatedly until Stop Loop is clicked.
• Help – Opens the on-line help for MPLAB ICE verify.
• Stop on first failure – If checked, testing will terminate at the first failure.
• Close – Closes the dialog. Will not function in the middle of a test.
To run a group of verification tests, select the desired tests individually or select all tests using 2000 System. Then, select Verify to begin running the tests. MPLAB will display information on the progress of each test as it is running and report any unexpected behavior as it is seen. To run all selected tests repeatedly, select Loop Test instead of Verify.
DS51159B-page 130 2001 Microchip Technology Inc.
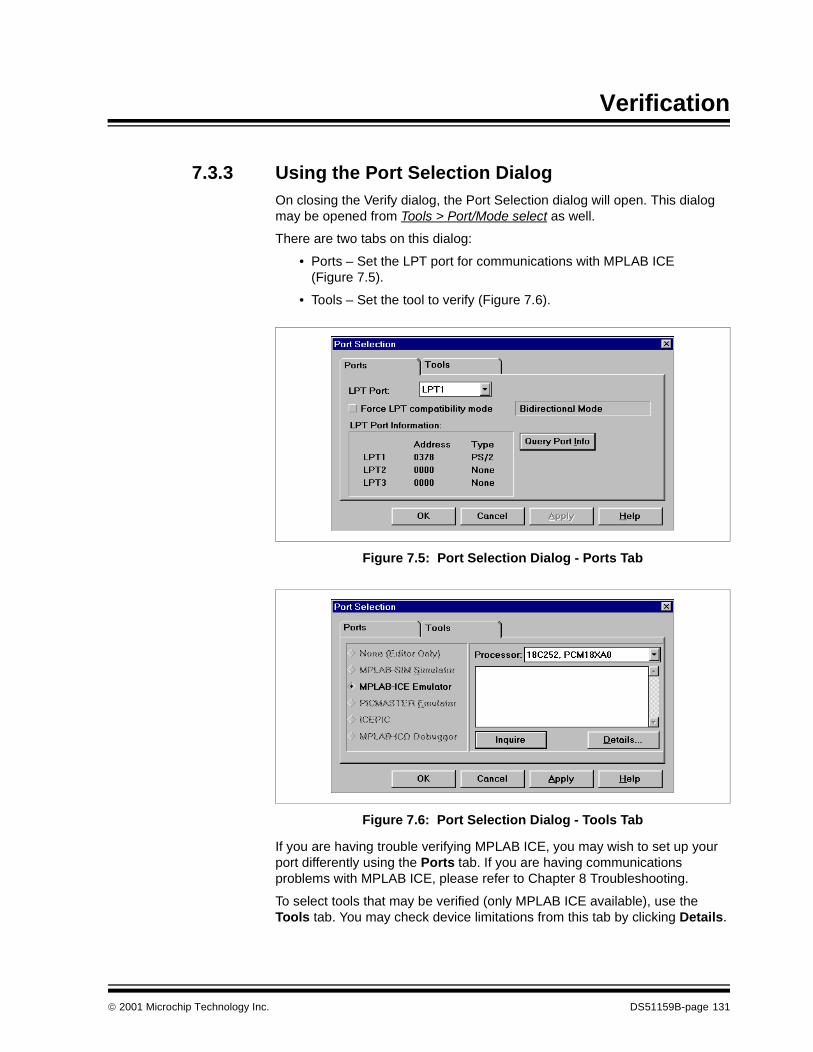
Verification
7.3.3 Using the Port Selection DialogOn closing the Verify dialog, the Port Selection dialog will open. This dialog may be opened from Tools > Port/Mode select as well.
There are two tabs on this dialog:
• Ports – Set the LPT port for communications with MPLAB ICE (Figure 7.5).
• Tools – Set the tool to verify (Figure 7.6).
Figure 7.5: Port Selection Dialog - Ports Tab
Figure 7.6: Port Selection Dialog - Tools Tab
If you are having trouble verifying MPLAB ICE, you may wish to set up your port differently using the Ports tab. If you are having communications problems with MPLAB ICE, please refer to Chapter 8 Troubleshooting.
To select tools that may be verified (only MPLAB ICE available), use the Tools tab. You may check device limitations from this tab by clicking Details.
2001 Microchip Technology Inc. DS51159B-page 131
MPLAB® ICE User’s Guide
Click OK to close and save your changes. Click Cancel to close without making changes. Click Help for on-line help information.
7.3.4 Working with and Exiting VerifyOnce you have closed either Verify dialog, you may re-open them using options on the Tool menu:
• Verify MPLAB ICE – Opens the Verify MPLAB ICE dialog
• Port/Mode select – Opens the Port Selection dialog
When you have finished verifying, exit the program by one of the following methods:
• Select File > Exit
• Use keystrokes Alt-F-X or Alt-F4
• Select Close from the system menu button (top left corner of the win-dow)
• Click on the "X" in the top right corner of the window
7.4 Troubleshooting Verify FailuresIf your MPLAB ICE unit reports failures when running Verify, please check the following items:
• Confirm that the MPLAB ICE unit is powered up and properly communicating with your PC. To determine this, select Tools > MPLAB ICE Configuration..., then choose Inquire from the MPLAB ICE System tab in this dialog. To resolve communication problems, please see Chapter 8 Troubleshooting.
• Confirm that a processor module is properly inserted into the MPLAB ICE unit. (The Error light should not be lit). Also, make sure that the pro-cessor module isn't connected to a target board.
• Confirm that the processor module is correctly configured for a valid processor. See Chapter 4 for information on how to configure your processor module.
If you have checked all of the above items and still believe that your MPLAB ICE system may not be operating correctly, please follow the guidelines in General Information for obtaining customer support to get your unit repaired or replaced.
DS51159B-page 132 2001 Microchip Technology Inc.
2001 Microchip Technology Inc. DS51159B-page 133
MPLAB® ICE USER’S GUIDE12Chapter 8. Troubleshooting
8.1 IntroductionThis section describes some common problems associated with running MPLAB ICE and steps to follow to resolve those problems.
8.2 HighlightsThis section discusses the following:
• Common Problems
- Communications cannot be established with MPLAB ICE- Illegal parallel port selected (Windows NT 4.0)- MPLAB ICE driver not loaded (Windows NT 4.0/Windows 2000)- Program Memory appears correct, but the file registers and pro-
gram execution do not appear to work correctly- On reset, an error message appears saying that there was an
error resetting the processor and to check power- Power light is blinking
• Configuring a PC's Parallel Interface for MPLAB ICE
8.3 Common ProblemsCommunications cannot be established with MPLAB ICE
Check the LPT Port
• Verify that MPLAB ICE is connected to the selected LPT port.
• Select Options > Development Mode and select the Ports tab. Click Query Port Info to see what LPT (parallel) ports are available.
• Verify that the LPT port and MPLAB software are using the same communication protocol. Check the LPT port setting through the PC’s BIOS. If using an add-in card, verify the card’s jumpers. For optimum performance, set your LPT port to a bi-directional mode (e.g., PS/2, EPP, or ECP). MPLAB will use bi-directional communications if it thinks the port can support it.
• If your parallel port does not support a bi-directional mode, try forcing MPLAB to use compatibility mode by selecting and checking the Force Compatibility Mode checkbox.
• In Windows 2000, the operating system might report a different address for the LPT port for MPLAB ICE than MPLAB does. If this occurs, you must change this setting in the operating system under Control Panel > System > Device Manager. Click the + to see the port, and double-click on it or select it and click Properties to set the address in NT.
MPLAB® ICE User’s Guide
DS51159B-page 134 2001 Microchip Technology Inc.
• If none of this works, proceed to Section 8.4 Configuring a PC's Parallel Interface for MPLAB ICE.
Check target clock/power
• If you are using target clock, select emulator clock (Options > Develop-ment Mode > Clock, uncheck Use Target Board Clock) and see if you can establish communications. If so, there may be a problem with the target clock.
• If you are using target power, select emulator power (Options > Devel-opment Mode > Power, select Processor Power From Emulator) and see if you can establish communications. If so, there may be a problem with the target power.
Illegal parallel port selected (Windows NT 4.0)
In Windows NT 4.0, check that the parallel port is set to ECP mode in thePC's BIOS and that compatibility mode is not selected. In some PC BIOS,the ECP mode is labeled PS2 or Normal mode. The port should not be setto SPP or EPP mode. Check your PC's BIOS by powering on the PC,pressing the key that the display indicates for running setup, and followingthe on-screen instructions. Also check that the mplabice driver is runningby looking in Control Panel>Devices and scrolling down to find mplabice.
MPLAB ICE driver not loaded (Windows NT 4.0/Windows 2000)
If you suspect that the MPLAB ICE driver is not being loaded correctly,check the Event Viewer. In Windows NT 4.0, the Event Viewer is underStart>Programs>Administrative Tools. In Windows 2000, the Event Vieweris in the Control Panel. "mplabice" should appear in the Source column inthe Event Viewer's System Log. Double-click on the mplabice line to viewthe event properties. It should indicate that the MPLAB ICE driver wasloaded successfully. If there is no "mplabice" entry in the Event Viewer'sSystem Log, the driver is not being loaded.
Program Memory appears correct, but the file registers and program execution do not appear to work correctly.
• Make sure that the processor clock is set to a valid speed. Select Options>Processor Setup>Clock Frequency to bring up the Processor Clock dialog. Verify that the frequency is within the correct range for the emulated device at the current operating voltage.
• Verify that the correct power source is selected by selecting Options>Processor Setup>Hardware and verifying the Processor Power option. If using a target board for a power source, verify that the target board power has been applied.
On reset, an error message appears saying that there was an error resetting the processor and to check power.
If you are doing low voltage emulation, this message is the point afterdoing a System Reset where the target board should be connected andvoltage applied. However, MPLAB and MPLAB ICE do not always syn-
2001 Microchip Technology Inc. DS51159B-page 135
Troubleshooting
chronize on the first try. In most cases, clicking Yes to retry will work andinitialization will continue. If it doesn’t work after two or three times, clickNo and MPLAB will try to continue, reporting any other errors it encounters.
Power light is blinking
On some pods, the power light will blink when there is a system fault (Section B.5.1). Turn the pod off and then back on to clear the fault. If this does not clear the fault, contact Microchip support.
8.4 Configuring a PC’s Parallel Interface for MPLAB ICE
The MPLAB ICE emulator uses an industry standard, bi-directional parallel peripheral interface, commonly referred to as the printer port. Most PCs are configured with one parallel interface port, but can be configured with three, depending on available PC slots.
MPLAB ICE communicates in both compatible (nibble) mode and bi-directional mode. Either or both may work depending on the PC or parallel port manufacturer's implementation.
Most of the time, MPLAB ICE will be able to identify and communicate with the installed parallel interface with no user intervention. Occasionally, you may encounter unique PCs that require you to configure the parallel interface so that it will correctly communicate with MPLAB ICE.
8.4.1 Checking PC BIOS SettingsWhen configuring a PC to run MPLAB ICE, check and record the parallel port characteristics as known to your PC's BIOS.
Typically, you access the BIOS configuration settings by pressing a key or key sequence while the PC boots from a hard reset or power on reset. While the PC is booting, the PC's monitor indicates what key sequence to use to access the BIOS configuration settings. For example, the Hewlett Packard monitor displays "<F2> Setup" when you first power the PC on. Normally <F1>, <F2>, <F10>, or <DEL>. Watch the monitor when you start the PC or refer to your PC manufacturer's documentation to find out how to access the BIOS configuration settings.
Although the parallel interface is an industry standard, the protocol is still implementation dependent. The BIOS screen should contain information about the parallel port (LPT) settings. Write down the default (startup) setting as reported by the BIOS.
Most BIOS settings screens have instructions on their use. Since the operating system is not yet loaded, you will have to use the keyboard keys to navigate through the settings menus, make selections and save your changes.
Generally, look at the main settings and note whether your PC is allowing a plug-and-play operating system to configure devices.
MPLAB® ICE User’s Guide
DS51159B-page 136 2001 Microchip Technology Inc.
Then, navigate to the "Advanced" (Hewlett Packard) or communications menu until you find the port configuration settings. One setting should indicate Auto, Yes, or No to indicate whether the LPT port is being automatically configured by the plug-and-play operating system, through the BIOS, or is disabled. If you feel that something is overriding your existing setup, you may want to select Yes (Enabled) to make sure that the setting you make in the BIOS settings screen will have effect.
The mode selection is usually near the above configuration setting. Usually, phrases such as "compatible mode", "bi-directional mode," "EPP mode," or "ECP modes" are available. Depending on the manufacturer, any or all of these settings may work with MPLAB ICE. Certain implementations of specific settings may not work, so it may be necessary to return to these settings later.
Look for instructions on how to change the settings. Usually you press a function key repeatedly to scroll through the possible values, then exit the menu. Be sure to note which function key to use to save your choices, and avoid pressing any function keys that restore all settings to their defaults. When you exit the BIOS setup, your PC will continue booting.
Refer to your PC’s operating guide or your local system administrator for help if you are uncomfortable retrieving your PC’s BIOS settings or are unable to retrieve them.
8.4.2 Checking Operating System SettingsAfter checking your PC’s BIOS settings, check the operating system’s knowledge of the parallel ports attached to your PC. In Windows 95, select Settings, Control Panel from the Start menu. Double-click the System icon. Click the Device Manager tab, and expand the port settings by clicking the plus sign next to the ports, if necessary. You should find that the number of ports listed here are the same as is known to the BIOS. If there aren’t as many ports here as are listed under the BIOS, you may need to add ports to the system. Double-click the Add New Hardware icon of the Control Panel (refer to your operating system’s documentation).
Refer to your PC’s operating system documentation or your local system administrator for help if you are unable or uncomfortable retrieving your PC’s system settings.
8.4.3 Configuring MPLAB ICEIn order to identify whether a parallel port is configured appropriately for MPLAB ICE, you will want to use the MPLAB ICE Verify routines (Tools>Verify MPLAB ICE). Errors reported using this technique may indicate a failed component, but certain interpretations can be drawn that may indicate the need to reconfigure the parallel port.
After noting the characteristics of the parallel port, you will want to make sure that MPLAB ICE is connected and communicating with the PC. After following the procedures for installing MPLAB, select Options>Development Mode and configure the MPLAB ICE.
2001 Microchip Technology Inc. DS51159B-page 137
Troubleshooting
Click the Ports tab of the Development Mode dialog. The various parallel port characteristics that MPLAB understands are listed in the dialog and, in the start-up state, the LPT settings will be blank. Click Query Port Info.
You will see a dialog that instructs you to disconnect any security dongles or other shared parallel port devices from the system before continuing the test. Take whatever appropriate precautions are necessary and click OK.
Any parallel ports known to the operating system will appear along with their base address and type, as identified by MPLAB. There should be a correlation between what MPLAB understands the port to be and what the system BIOS understands the port to be, although the exact terminology may be slightly different. For example, the BIOS may report that a port is bi-directional, while MPLAB may further refine this to describe the port as PS/2.
If you believe that there are not enough ports reported by MPLAB ICE (this might happen after you add a parallel interface card), it may be necessary to add the hardware device to the system configuration. In Windows 95, this is done from the system dialog. Select Settings, Control Panel from the Start menu. Double-click the System icon. Click the Device Manager tab and expand the port settings by clicking the plus sign next to the ports, if necessary. If there aren’t as many ports here as are listed under the BIOS, you may need to add ports to the system. Double-click the Add New Hardware icon of the Control Panel (refer to your operating system’s documentation).
In MPLAB, select Options>Development Mode. On the Tools tab, make sure the MPLAB ICE is selected as the tool, along with a valid processor module. Click the Ports tab. Click Query Port Info to cause the software to look through the known parallel ports for an MPLAB ICE system. If it finds one and can communicate adequately, the MPLAB Status bar will be updated to indicate the tool (MPLAB ICE) and the installed processor module.
8.4.4 No MPLAB ICE FoundIf the software reports that there is no MPLAB ICE present after you have attempted to configure the MPLAB ICE and clicked Query Port Info on the Ports tab of the Development Mode dialog, you should do the following.
1. Select Options>Development Mode and click the Ports tab. Select theForce Compatibility Mode check-box. Click Query Port Info.
2. If MPLAB ICE is now identified, then you are now in compatible, or nib-ble, mode. The MPLAB ICE should function adequately in this mode, butsystem response to PC inquiries will be slowed by the communicationinterface.
3. If the MPLAB ICE is still not found, there may be a discrepancy between
Note: We recommend that you use LPT1 as your parallel port for MPLABICE. Under certain conditions (especially Windows NT and Win-dows 2000) MPLAB might not recognize additional LPT ports suchas LPT2.
MPLAB® ICE User’s Guide
DS51159B-page 138 2001 Microchip Technology Inc.
how the parallel port is configured, how it is implemented and howMPLAB ICE understands the parallel port.
8.4.5 Correcting DiscrepanciesReturn to the BIOS setup screen. Locate the parallel ports on the setup screen, specifically the one to which you believe MPLAB ICE is attached.
Write down the original setting. Following the PC manufacturer’s instructions, change the characteristics of the port by scrolling through the available options. There is no guaranteed right answer, but it is recommended that you begin by selecting what appears to be an output only, SPP, or compatible mode. Following the manufacturer’s instructions, save the new settings.
Verify MPLAB ICE again.
If after selecting all possible settings from the vendor, you are still unable to get MPLAB ICE to communicate to the PC, it is likely that the parallel port implementation is non-standard. This can be true particularly of consumer grade PCs that have integrated port implementations on the motherboard. It may be necessary to install a separate parallel interface card that can be dedicated to MPLAB ICE.
If you are unable to change the port settings through the BIOS, they may be controlled on a separate port card or with jumper settings on a separate port card. Cards should be configured according to the manufacturer’s instructions.
After you have changed the characteristics of the parallel port, MPLAB ICE may report a different value when verifying the parallel port.
8.4.6 Verifying MPLAB ICEYou may discover more than one parallel port setting that will allow you to configure and query port information on MPLAB ICE.
Depending on the parallel port’s implementation, one or another may actually function better with the emulator system. To determine whether the best setting is chosen, it may be useful to run Tools > Verify MPLAB ICE. If errors are reported, follow the procedures for forcing compatibility mode, or changing the port settings in the system BIOS.
8.4.7 Sharing the Parallel Interface with Other ProductsMPLAB ICE should not share a parallel port with other devices. Using MPLAB ICE with a security dongle, for example, may result in damage to the security device. Sharing the parallel port with other devices that require drivers to be loaded may also cause unexpected results.
2001 Microchip Technology Inc. DS51159B-page 139
Troubleshooting
If you must change the characteristics of the parallel port and other devices have previously been defined on that port, you should follow the instructions for that device first, deleting that device and associated drivers from the system. Then reconfigure the port and reinstall the device. This will ensure that the alternate device will pick up the new port characteristics.
8.4.8 Speed IssuesUsing MPLAB ICE in compatible (nibble) mode will result in decreased performance when communicating with the emulator. This is most noticeable during upload and download of large amounts of data, but does not affect the real time performance of the system.
Once determining that a compatible mode works, it may be worth trying other parallel port modes (i.e., bi-directional) to improve performance.
8.4.9 Nothing I Do WorksIt is possible that none of the settings of the parallel port will work properly with MPLAB ICE. This is true even though other parallel port devices (e.g., printers) may function properly on the port. This is not a malfunction of MPLAB ICE. MPLAB ICE depends on a standard IEEE implementation, while printers may depend on the operating system to interface with the parallel port.
In this case, a separate, dedicated parallel interface card is the recommended solution. Follow the manufacturer’s instructions for inserting the card into the PC and making it available to the operating system. Most such devices will use a standard implementation and are very likely to be compatible with MPLAB ICE.

MPLAB® ICE User’s Guide
DS51159B-page 140 2001 Microchip Technology Inc.
NOTES:
2001 Microchip Technology Inc. DS51159B-page 141
MPLAB® ICE USER’S GUIDE12Appendix A. Debugging Techniques
A.1 IntroductionThis appendix describes various debugging techniques that you may find useful when emulating with MPLAB ICE.
A.2 HighlightsThis appendix contains the following information:
• Complex Triggering Examples
• Additional Debugging Techniques
A.3 Complex Triggering ExamplesThe debugging techniques listed below have been previously covered in Complex Triggering Examples, Section 6.3.5.
A.3.1 Subroutine starts to fail
An application has several subroutines. A particular subroutine (RoutineA) functions correctly to begin with, but after a time, it begins to function incorrectly. This subroutine is called many times, so it would be nice to skip the executions where the subroutine functions properly and break just before the subroutine starts to fail. It is observed that the routine functions correctly until another after subroutine (RoutineB) is called.
See Sequential Example - Program Memory.
A.3.2 Flag bit erroneously set
A flag bit is getting erroneously set somewhere. Where is it getting set?
See Sequential Example - Data Memory.
A.3.3 Length of delay loop
An application contains a delay loop. How long is the delay?
See Time Between Events Example.
A.3.4 Trace without long delay loop
A program has a large delay loop. How can program execution be traced without wading though thousands of delay loop cycles?
See Filter Trace Example - Program Memory.
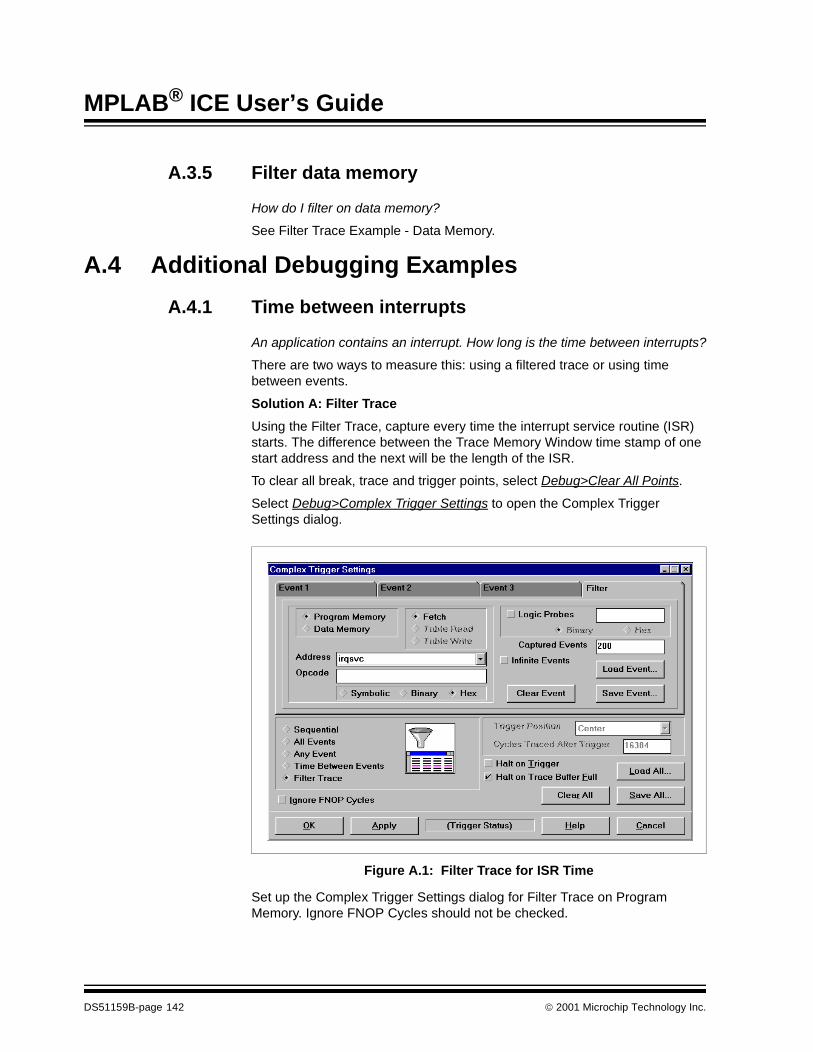
MPLAB® ICE User’s Guide
DS51159B-page 142 2001 Microchip Technology Inc.
A.3.5 Filter data memory
How do I filter on data memory?
See Filter Trace Example - Data Memory.
A.4 Additional Debugging Examples
A.4.1 Time between interrupts
An application contains an interrupt. How long is the time between interrupts?
There are two ways to measure this: using a filtered trace or using time between events.
Solution A: Filter Trace
Using the Filter Trace, capture every time the interrupt service routine (ISR) starts. The difference between the Trace Memory Window time stamp of one start address and the next will be the length of the ISR.
To clear all break, trace and trigger points, select Debug>Clear All Points.
Select Debug>Complex Trigger Settings to open the Complex Trigger Settings dialog.
Figure A.1: Filter Trace for ISR Time
Set up the Complex Trigger Settings dialog for Filter Trace on Program Memory. Ignore FNOP Cycles should not be checked.
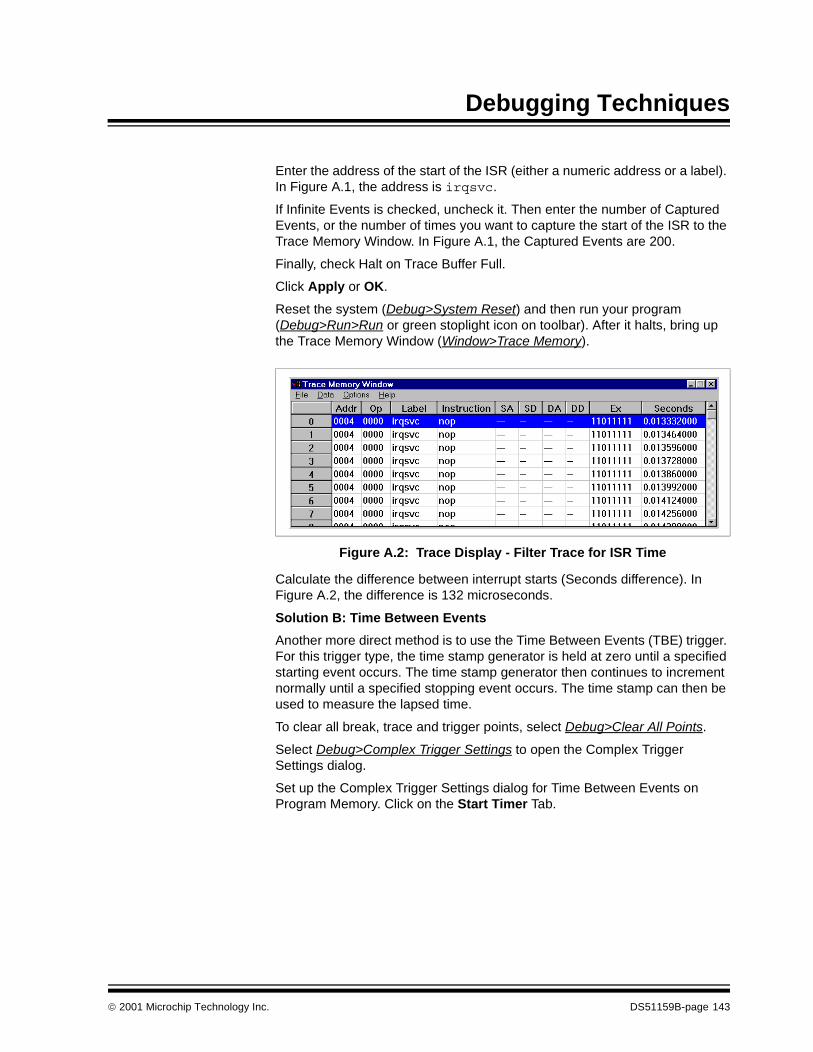
Debugging Techniques
Enter the address of the start of the ISR (either a numeric address or a label). In Figure A.1, the address is irqsvc.
If Infinite Events is checked, uncheck it. Then enter the number of Captured Events, or the number of times you want to capture the start of the ISR to the Trace Memory Window. In Figure A.1, the Captured Events are 200.
Finally, check Halt on Trace Buffer Full.
Click Apply or OK.
Reset the system (Debug>System Reset) and then run your program (Debug>Run>Run or green stoplight icon on toolbar). After it halts, bring up the Trace Memory Window (Window>Trace Memory).
Figure A.2: Trace Display - Filter Trace for ISR Time
Calculate the difference between interrupt starts (Seconds difference). In Figure A.2, the difference is 132 microseconds.
Solution B: Time Between Events
Another more direct method is to use the Time Between Events (TBE) trigger. For this trigger type, the time stamp generator is held at zero until a specified starting event occurs. The time stamp generator then continues to increment normally until a specified stopping event occurs. The time stamp can then be used to measure the lapsed time.
To clear all break, trace and trigger points, select Debug>Clear All Points.
Select Debug>Complex Trigger Settings to open the Complex Trigger Settings dialog.
Set up the Complex Trigger Settings dialog for Time Between Events on Program Memory. Click on the Start Timer Tab.
2001 Microchip Technology Inc. DS51159B-page 143
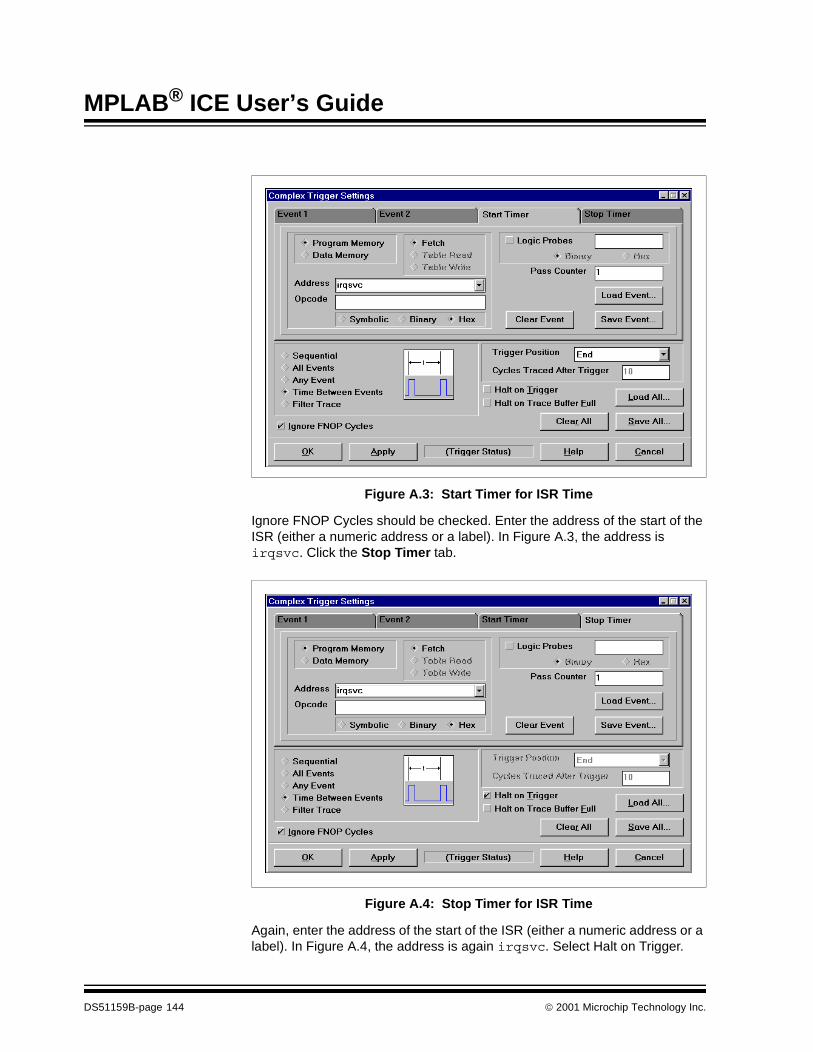
MPLAB® ICE User’s Guide
Figure A.3: Start Timer for ISR Time
Ignore FNOP Cycles should be checked. Enter the address of the start of the ISR (either a numeric address or a label). In Figure A.3, the address is irqsvc. Click the Stop Timer tab.
Figure A.4: Stop Timer for ISR Time
Again, enter the address of the start of the ISR (either a numeric address or a label). In Figure A.4, the address is again irqsvc. Select Halt on Trigger.
DS51159B-page 144 2001 Microchip Technology Inc.
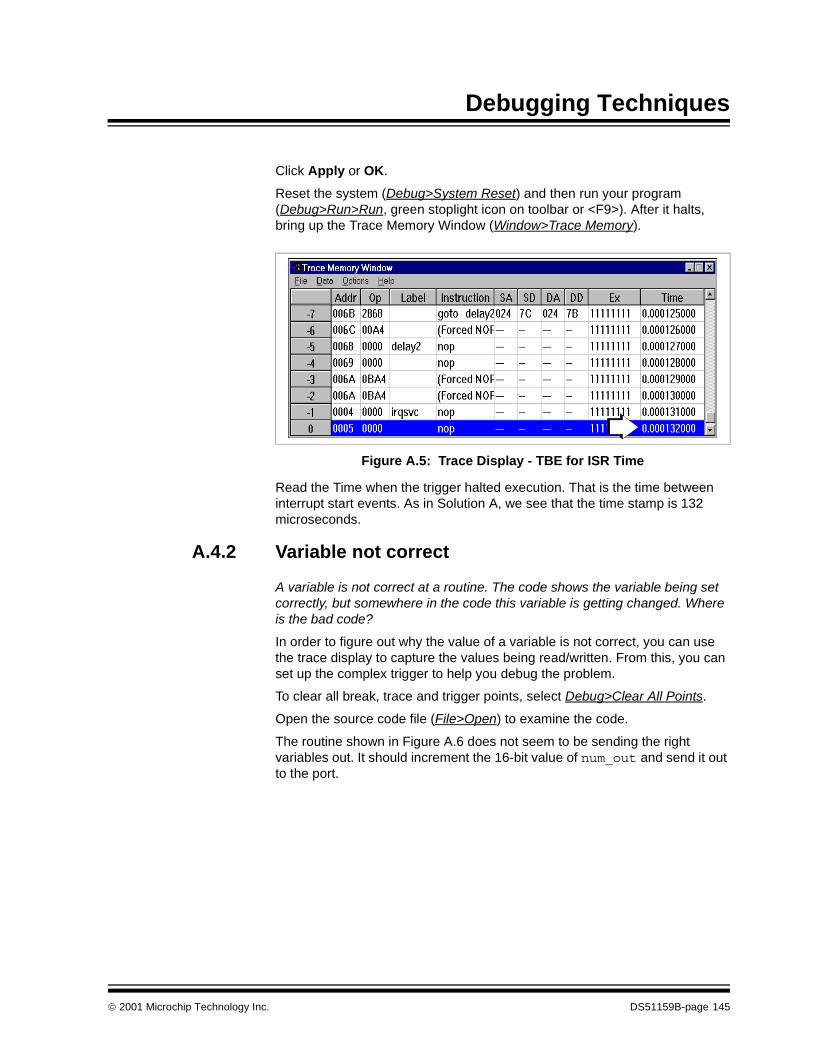
Debugging Techniques
Click Apply or OK.
Reset the system (Debug>System Reset) and then run your program (Debug>Run>Run, green stoplight icon on toolbar or <F9>). After it halts, bring up the Trace Memory Window (Window>Trace Memory).
Figure A.5: Trace Display - TBE for ISR Time
Read the Time when the trigger halted execution. That is the time between interrupt start events. As in Solution A, we see that the time stamp is 132 microseconds.
A.4.2 Variable not correct
A variable is not correct at a routine. The code shows the variable being set correctly, but somewhere in the code this variable is getting changed. Where is the bad code?
In order to figure out why the value of a variable is not correct, you can use the trace display to capture the values being read/written. From this, you can set up the complex trigger to help you debug the problem.
To clear all break, trace and trigger points, select Debug>Clear All Points.
Open the source code file (File>Open) to examine the code.
The routine shown in Figure A.6 does not seem to be sending the right variables out. It should increment the 16-bit value of num_out and send it out to the port.
2001 Microchip Technology Inc. DS51159B-page 145
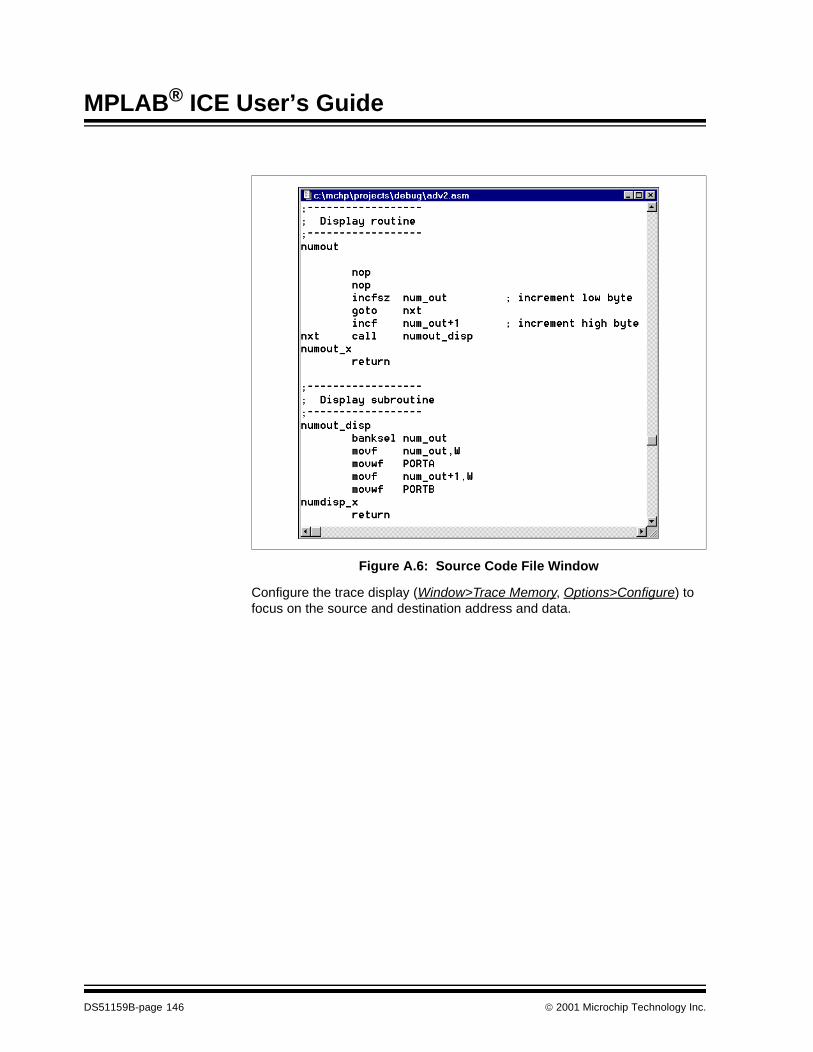
MPLAB® ICE User’s Guide
Figure A.6: Source Code File Window
Configure the trace display (Window>Trace Memory, Options>Configure) to focus on the source and destination address and data.
DS51159B-page 146 2001 Microchip Technology Inc.
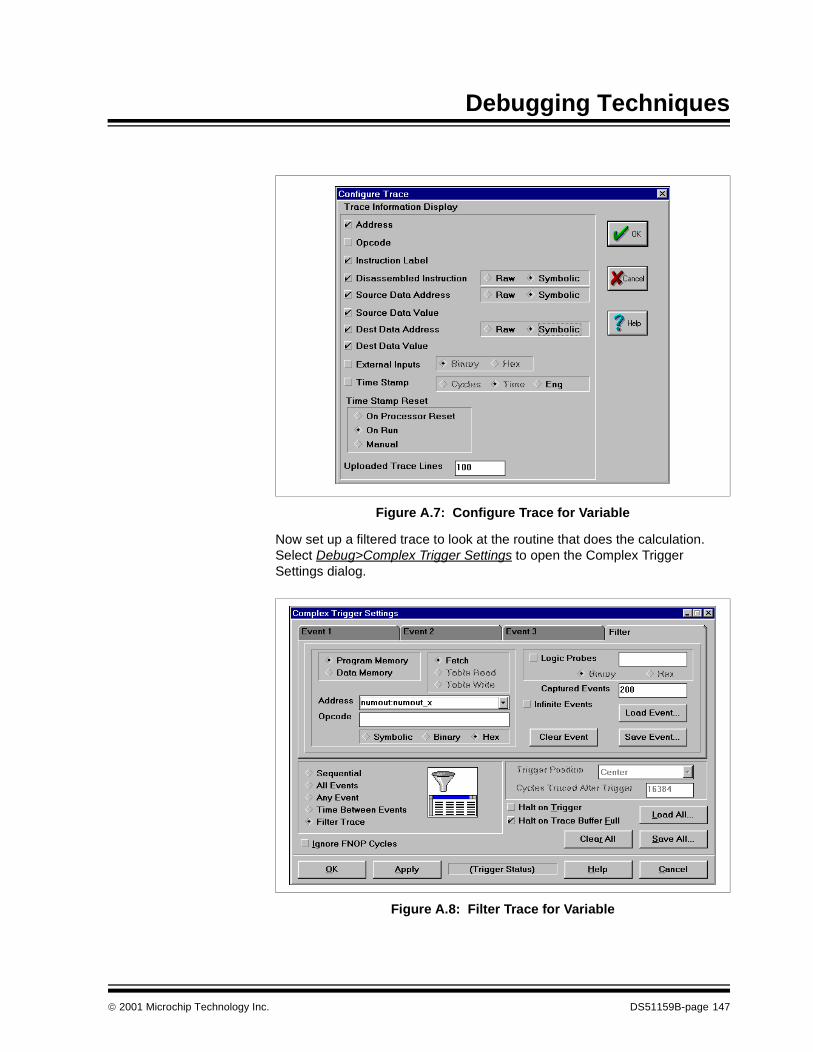
Debugging Techniques
Figure A.7: Configure Trace for Variable
Now set up a filtered trace to look at the routine that does the calculation. Select Debug>Complex Trigger Settings to open the Complex Trigger Settings dialog.
Figure A.8: Filter Trace for Variable
2001 Microchip Technology Inc. DS51159B-page 147
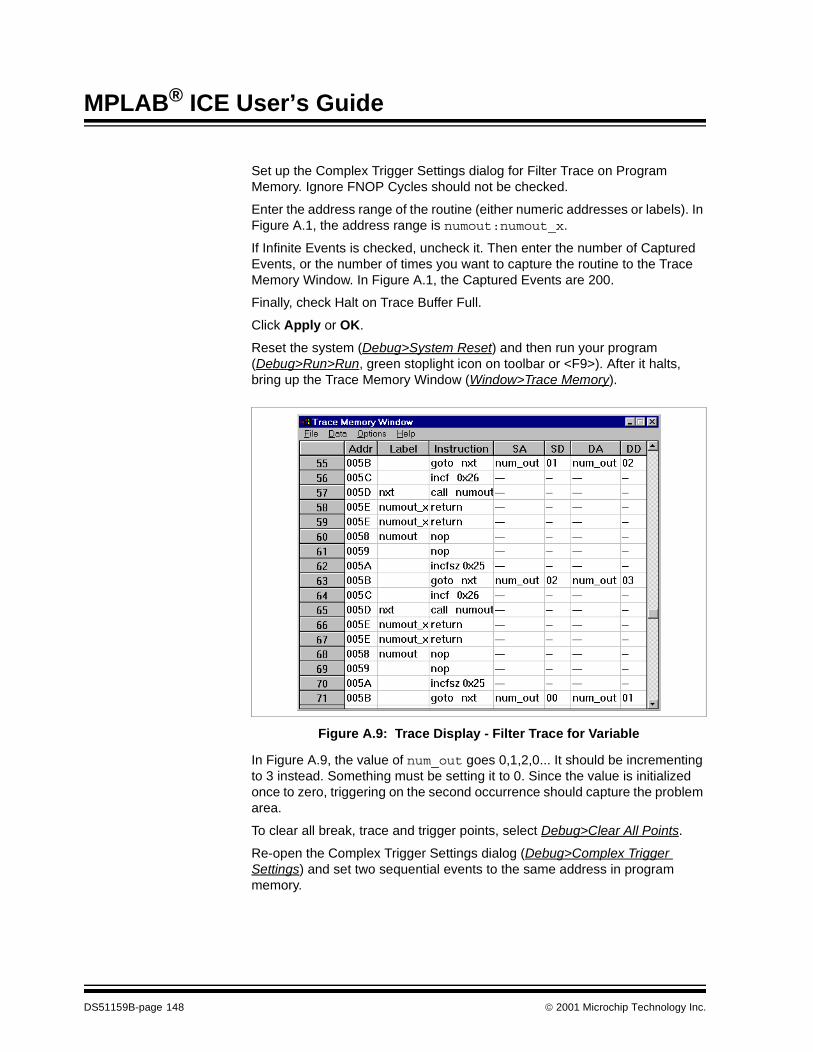
MPLAB® ICE User’s Guide
Set up the Complex Trigger Settings dialog for Filter Trace on Program Memory. Ignore FNOP Cycles should not be checked.
Enter the address range of the routine (either numeric addresses or labels). In Figure A.1, the address range is numout:numout_x.
If Infinite Events is checked, uncheck it. Then enter the number of Captured Events, or the number of times you want to capture the routine to the Trace Memory Window. In Figure A.1, the Captured Events are 200.
Finally, check Halt on Trace Buffer Full.
Click Apply or OK.
Reset the system (Debug>System Reset) and then run your program (Debug>Run>Run, green stoplight icon on toolbar or <F9>). After it halts, bring up the Trace Memory Window (Window>Trace Memory).
Figure A.9: Trace Display - Filter Trace for Variable
In Figure A.9, the value of num_out goes 0,1,2,0... It should be incrementing to 3 instead. Something must be setting it to 0. Since the value is initialized once to zero, triggering on the second occurrence should capture the problem area.
To clear all break, trace and trigger points, select Debug>Clear All Points.
Re-open the Complex Trigger Settings dialog (Debug>Complex Trigger Settings) and set two sequential events to the same address in program memory.
DS51159B-page 148 2001 Microchip Technology Inc.
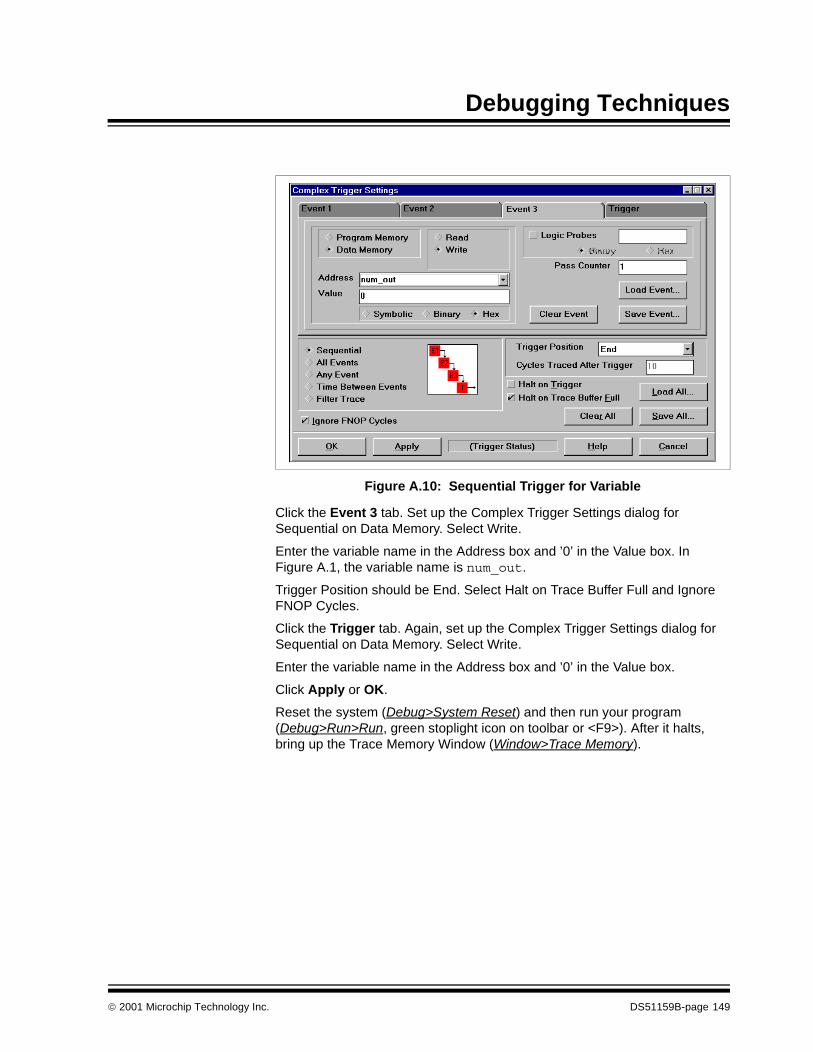
Debugging Techniques
Figure A.10: Sequential Trigger for Variable
Click the Event 3 tab. Set up the Complex Trigger Settings dialog for Sequential on Data Memory. Select Write.
Enter the variable name in the Address box and ’0’ in the Value box. In Figure A.1, the variable name is num_out.
Trigger Position should be End. Select Halt on Trace Buffer Full and Ignore FNOP Cycles.
Click the Trigger tab. Again, set up the Complex Trigger Settings dialog for Sequential on Data Memory. Select Write.
Enter the variable name in the Address box and ’0’ in the Value box.
Click Apply or OK.
Reset the system (Debug>System Reset) and then run your program (Debug>Run>Run, green stoplight icon on toolbar or <F9>). After it halts, bring up the Trace Memory Window (Window>Trace Memory).
2001 Microchip Technology Inc. DS51159B-page 149
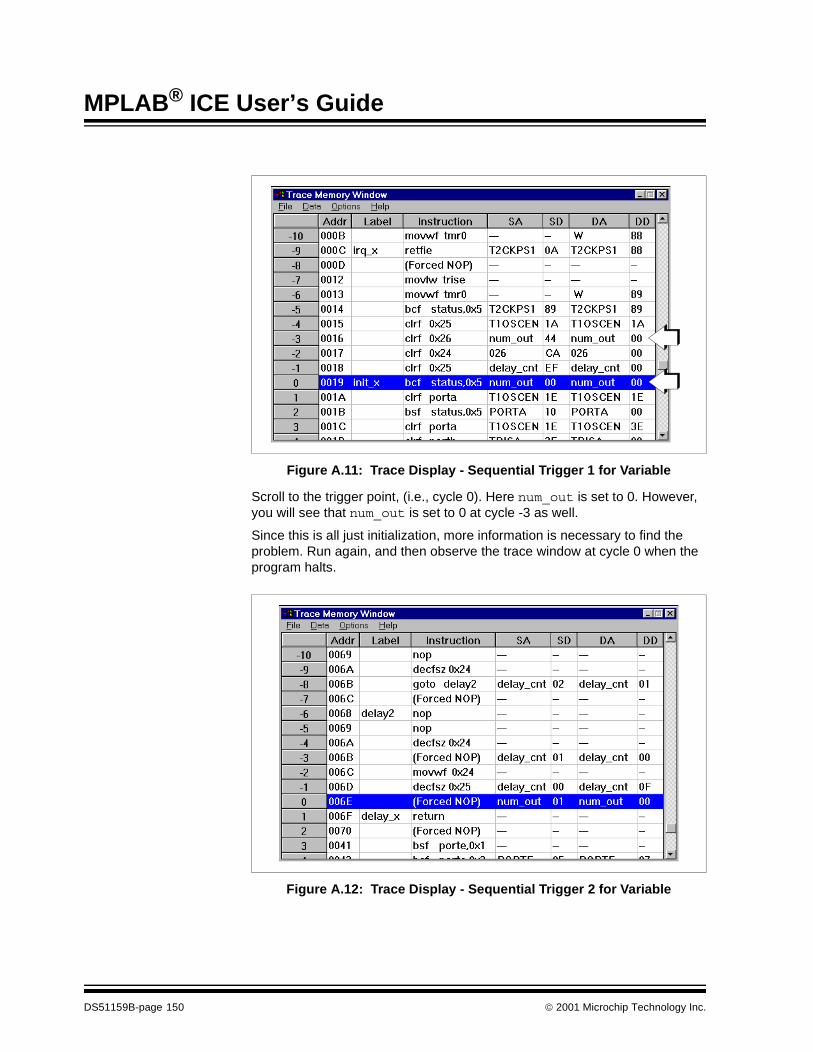
MPLAB® ICE User’s Guide
Figure A.11: Trace Display - Sequential Trigger 1 for Variable
Scroll to the trigger point, (i.e., cycle 0). Here num_out is set to 0. However, you will see that num_out is set to 0 at cycle -3 as well.
Since this is all just initialization, more information is necessary to find the problem. Run again, and then observe the trace window at cycle 0 when the program halts.
Figure A.12: Trace Display - Sequential Trigger 2 for Variable
DS51159B-page 150 2001 Microchip Technology Inc.
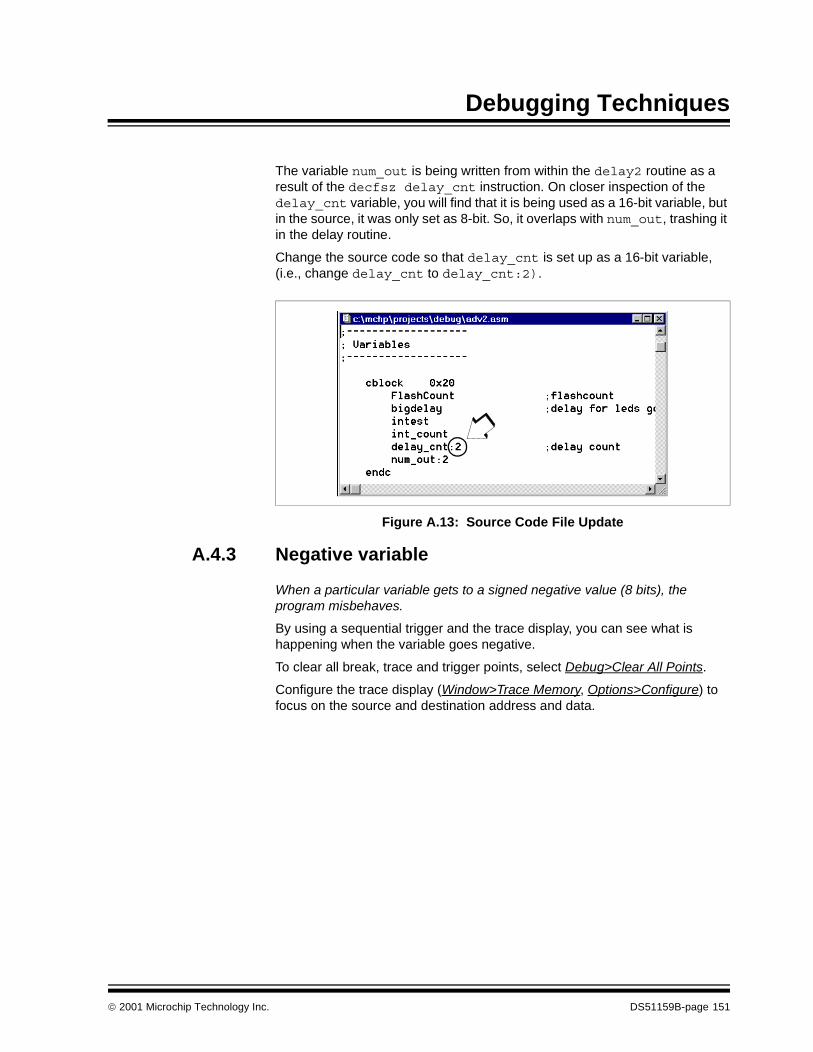
Debugging Techniques
The variable num_out is being written from within the delay2 routine as a result of the decfsz delay_cnt instruction. On closer inspection of the delay_cnt variable, you will find that it is being used as a 16-bit variable, but in the source, it was only set as 8-bit. So, it overlaps with num_out, trashing it in the delay routine.
Change the source code so that delay_cnt is set up as a 16-bit variable, (i.e., change delay_cnt to delay_cnt:2).
Figure A.13: Source Code File Update
A.4.3 Negative variable
When a particular variable gets to a signed negative value (8 bits), the program misbehaves.
By using a sequential trigger and the trace display, you can see what is happening when the variable goes negative.
To clear all break, trace and trigger points, select Debug>Clear All Points.
Configure the trace display (Window>Trace Memory, Options>Configure) to focus on the source and destination address and data.
2001 Microchip Technology Inc. DS51159B-page 151
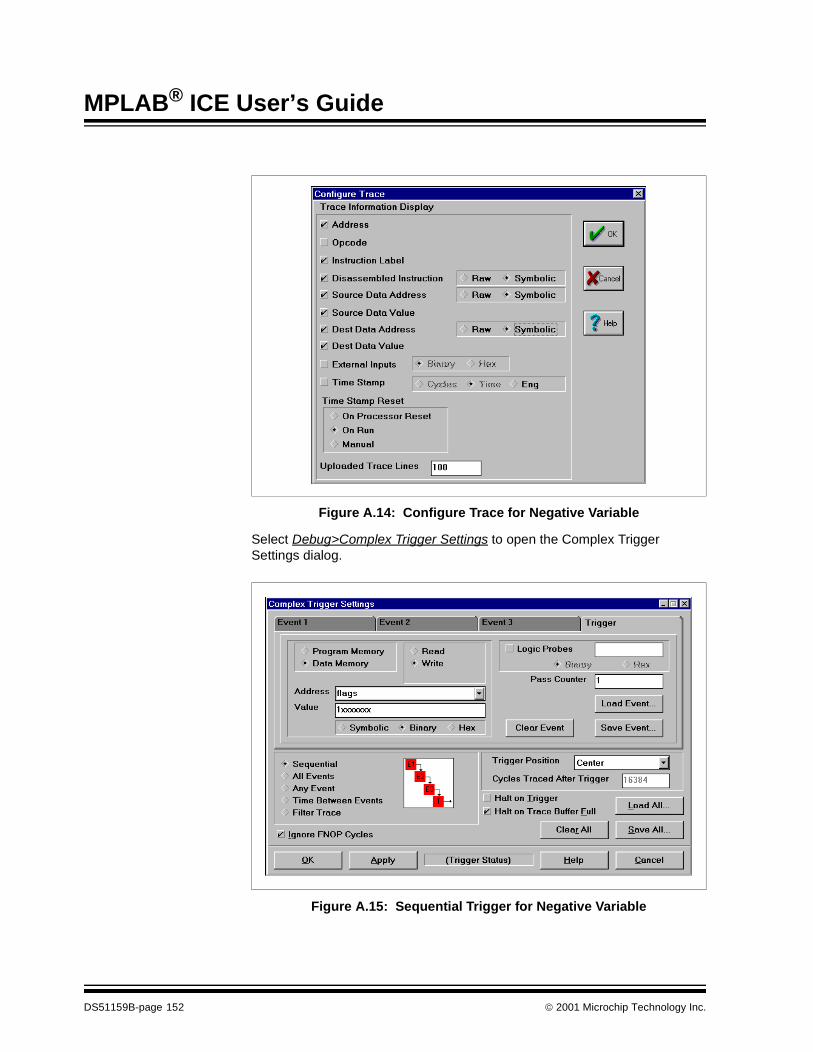
MPLAB® ICE User’s Guide
Figure A.14: Configure Trace for Negative Variable
Select Debug>Complex Trigger Settings to open the Complex Trigger Settings dialog.
Figure A.15: Sequential Trigger for Negative Variable
DS51159B-page 152 2001 Microchip Technology Inc.
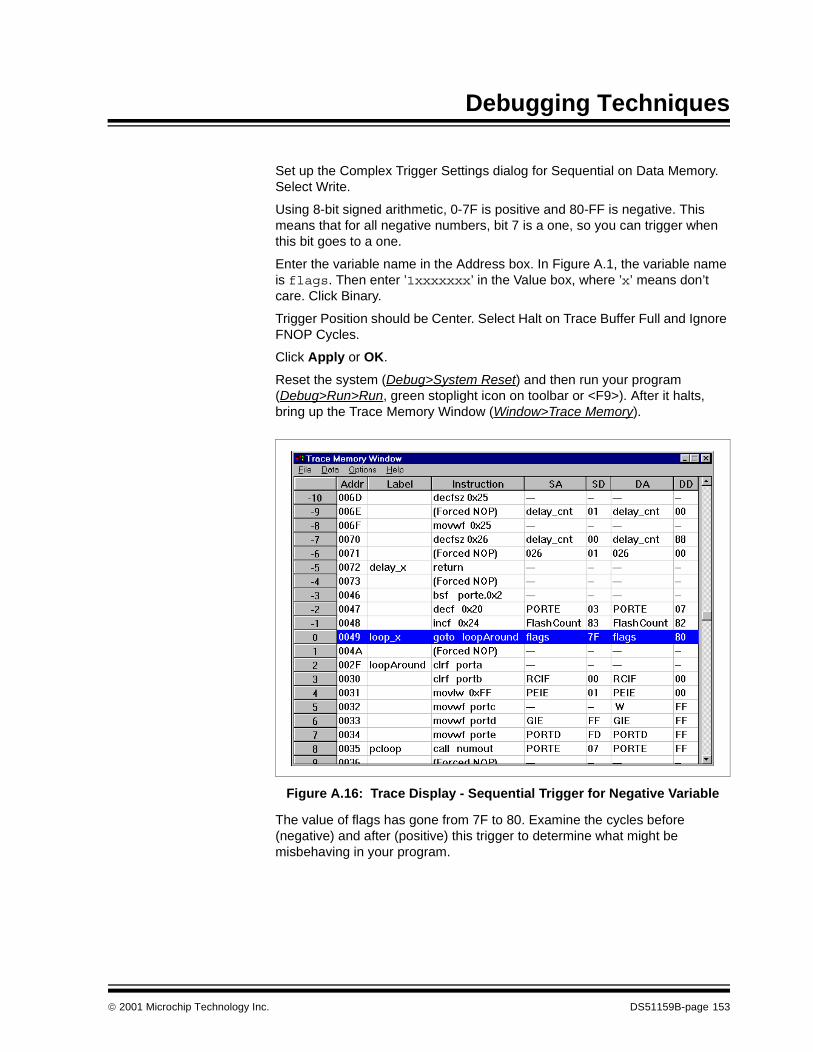
Debugging Techniques
Set up the Complex Trigger Settings dialog for Sequential on Data Memory. Select Write.
Using 8-bit signed arithmetic, 0-7F is positive and 80-FF is negative. This means that for all negative numbers, bit 7 is a one, so you can trigger when this bit goes to a one.
Enter the variable name in the Address box. In Figure A.1, the variable name is flags. Then enter ’1xxxxxxx’ in the Value box, where ’x’ means don’t care. Click Binary.
Trigger Position should be Center. Select Halt on Trace Buffer Full and Ignore FNOP Cycles.
Click Apply or OK.
Reset the system (Debug>System Reset) and then run your program (Debug>Run>Run, green stoplight icon on toolbar or <F9>). After it halts, bring up the Trace Memory Window (Window>Trace Memory).
Figure A.16: Trace Display - Sequential Trigger for Negative Variable
The value of flags has gone from 7F to 80. Examine the cycles before (negative) and after (positive) this trigger to determine what might be misbehaving in your program.
2001 Microchip Technology Inc. DS51159B-page 153
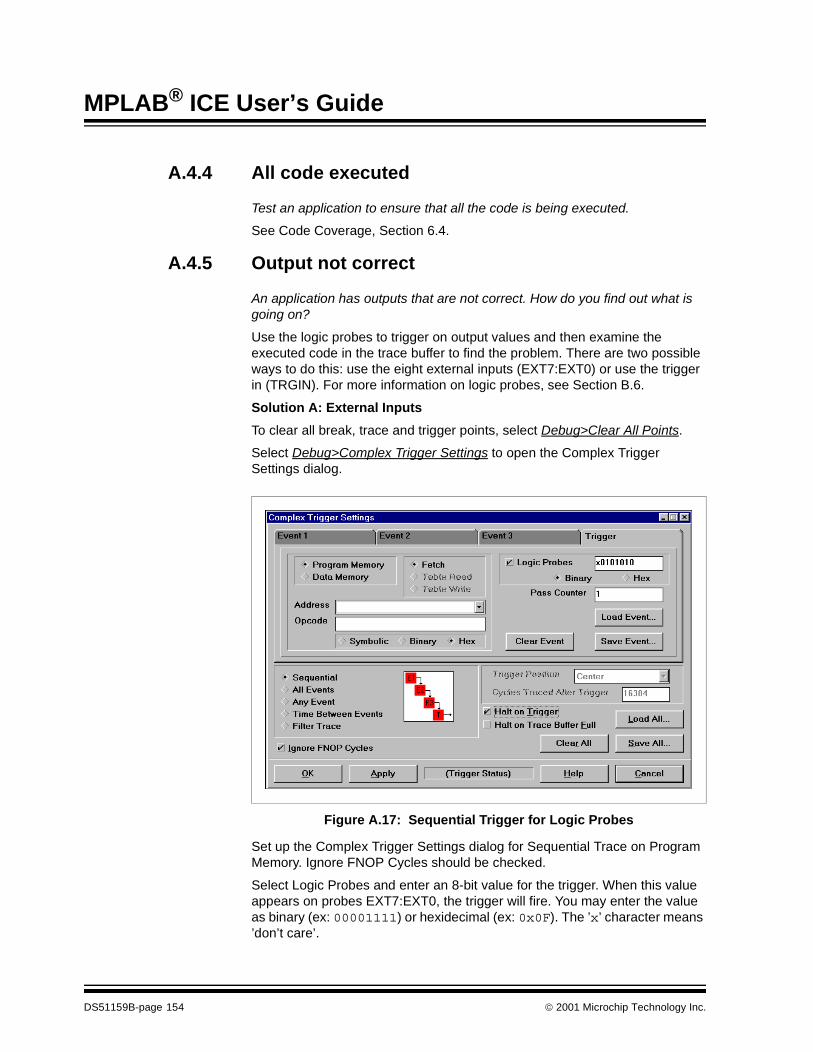
MPLAB® ICE User’s Guide
A.4.4 All code executed
Test an application to ensure that all the code is being executed.
See Code Coverage, Section 6.4.
A.4.5 Output not correct
An application has outputs that are not correct. How do you find out what is going on?
Use the logic probes to trigger on output values and then examine the executed code in the trace buffer to find the problem. There are two possible ways to do this: use the eight external inputs (EXT7:EXT0) or use the trigger in (TRGIN). For more information on logic probes, see Section B.6.
Solution A: External Inputs
To clear all break, trace and trigger points, select Debug>Clear All Points.
Select Debug>Complex Trigger Settings to open the Complex Trigger Settings dialog.
Figure A.17: Sequential Trigger for Logic Probes
Set up the Complex Trigger Settings dialog for Sequential Trace on Program Memory. Ignore FNOP Cycles should be checked.
Select Logic Probes and enter an 8-bit value for the trigger. When this value appears on probes EXT7:EXT0, the trigger will fire. You may enter the value as binary (ex: 00001111) or hexidecimal (ex: 0x0F). The ’x’ character means ’don’t care’.
DS51159B-page 154 2001 Microchip Technology Inc.
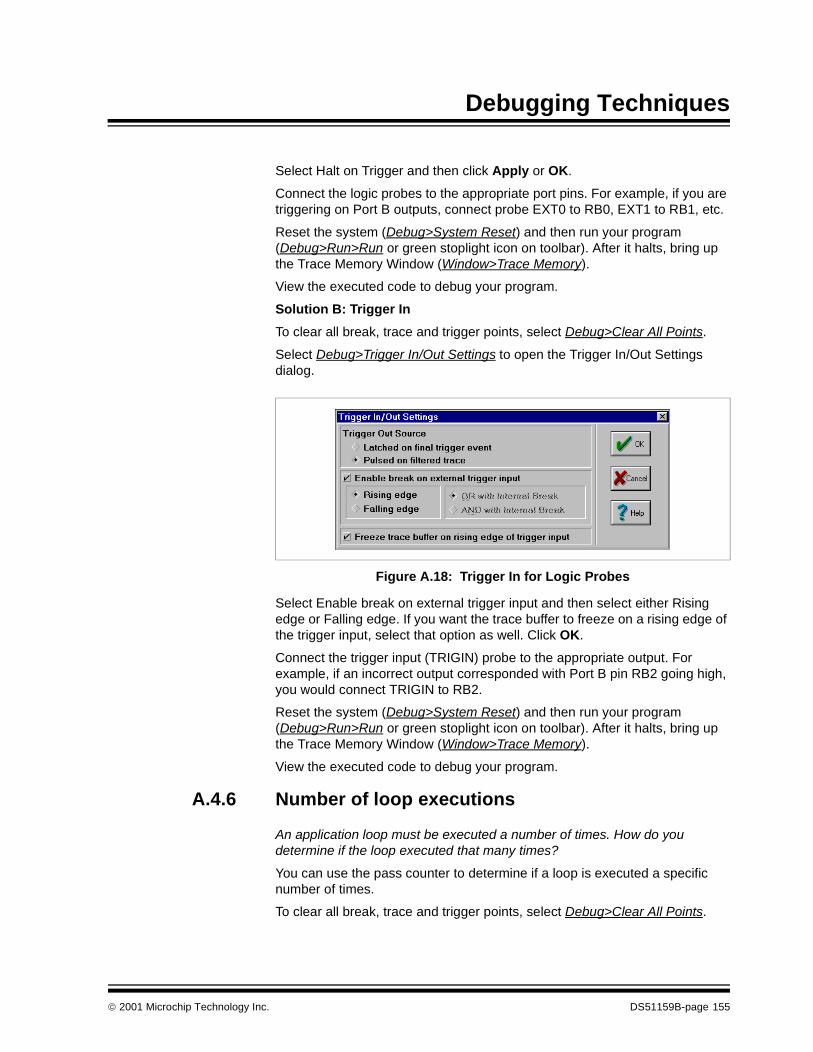
Debugging Techniques
Select Halt on Trigger and then click Apply or OK.
Connect the logic probes to the appropriate port pins. For example, if you are triggering on Port B outputs, connect probe EXT0 to RB0, EXT1 to RB1, etc.
Reset the system (Debug>System Reset) and then run your program (Debug>Run>Run or green stoplight icon on toolbar). After it halts, bring up the Trace Memory Window (Window>Trace Memory).
View the executed code to debug your program.
Solution B: Trigger In
To clear all break, trace and trigger points, select Debug>Clear All Points.
Select Debug>Trigger In/Out Settings to open the Trigger In/Out Settings dialog.
Figure A.18: Trigger In for Logic Probes
Select Enable break on external trigger input and then select either Rising edge or Falling edge. If you want the trace buffer to freeze on a rising edge of the trigger input, select that option as well. Click OK.
Connect the trigger input (TRIGIN) probe to the appropriate output. For example, if an incorrect output corresponded with Port B pin RB2 going high, you would connect TRIGIN to RB2.
Reset the system (Debug>System Reset) and then run your program (Debug>Run>Run or green stoplight icon on toolbar). After it halts, bring up the Trace Memory Window (Window>Trace Memory).
View the executed code to debug your program.
A.4.6 Number of loop executions
An application loop must be executed a number of times. How do you determine if the loop executed that many times?
You can use the pass counter to determine if a loop is executed a specific number of times.
To clear all break, trace and trigger points, select Debug>Clear All Points.
2001 Microchip Technology Inc. DS51159B-page 155
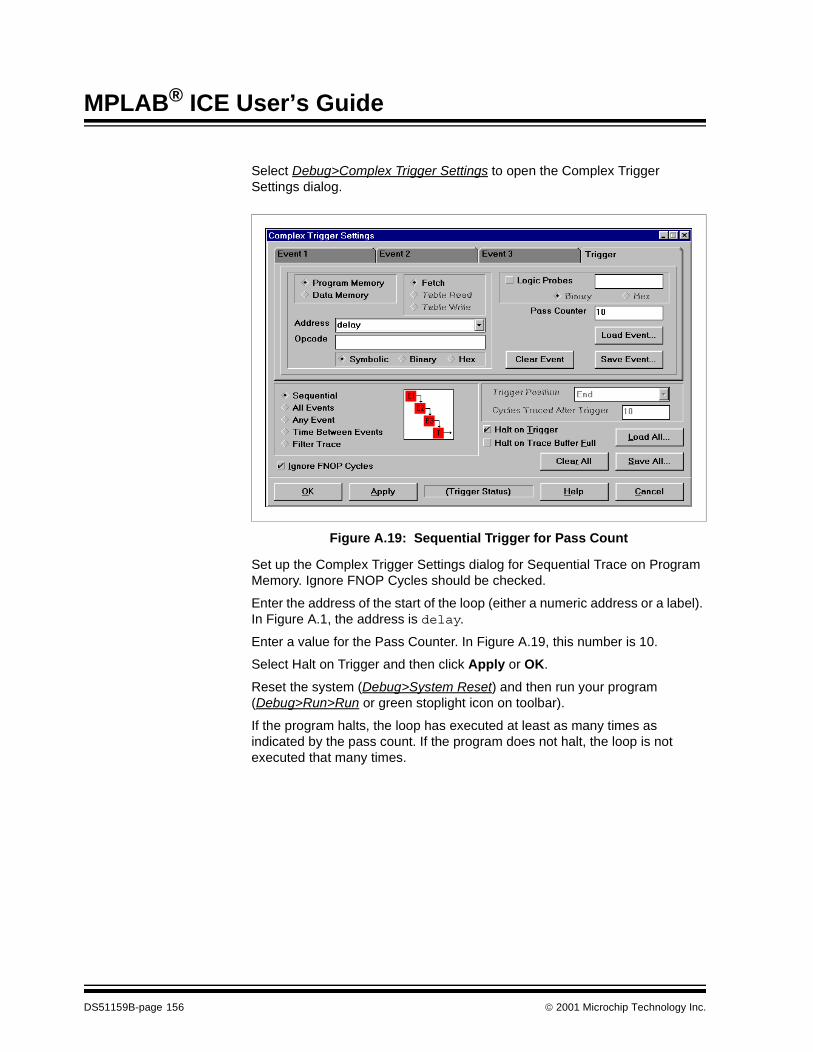
MPLAB® ICE User’s Guide
Select Debug>Complex Trigger Settings to open the Complex Trigger Settings dialog.
Figure A.19: Sequential Trigger for Pass Count
Set up the Complex Trigger Settings dialog for Sequential Trace on Program Memory. Ignore FNOP Cycles should be checked.
Enter the address of the start of the loop (either a numeric address or a label). In Figure A.1, the address is delay.
Enter a value for the Pass Counter. In Figure A.19, this number is 10.
Select Halt on Trigger and then click Apply or OK.
Reset the system (Debug>System Reset) and then run your program (Debug>Run>Run or green stoplight icon on toolbar).
If the program halts, the loop has executed at least as many times as indicated by the pass count. If the program does not halt, the loop is not executed that many times.
DS51159B-page 156 2001 Microchip Technology Inc.
Debugging Techniques
A.4.7 Phantom interrupt
An interrupt has occurred, but there is no interrupt flag set.
If you halt program execution when an interrupt service routine is entered, but then notice that no flags have been set, you have a phantom interrupt.
Phantom interrupts can occur when your program is in the process of clearing interrupt flags when an interrupt comes in. Due to the pipelined architecture of the PICmicro MCU, an interrupt can occur when an instruction to clear interrupt flags is being fetched. The next fetch will be to branch to the ISR, but the instruction executed then will be a clear of the interrupt flags.
2001 Microchip Technology Inc. DS51159B-page 157
MPLAB® ICE User’s Guide
NOTES:
DS51159B-page 158 2001 Microchip Technology Inc.
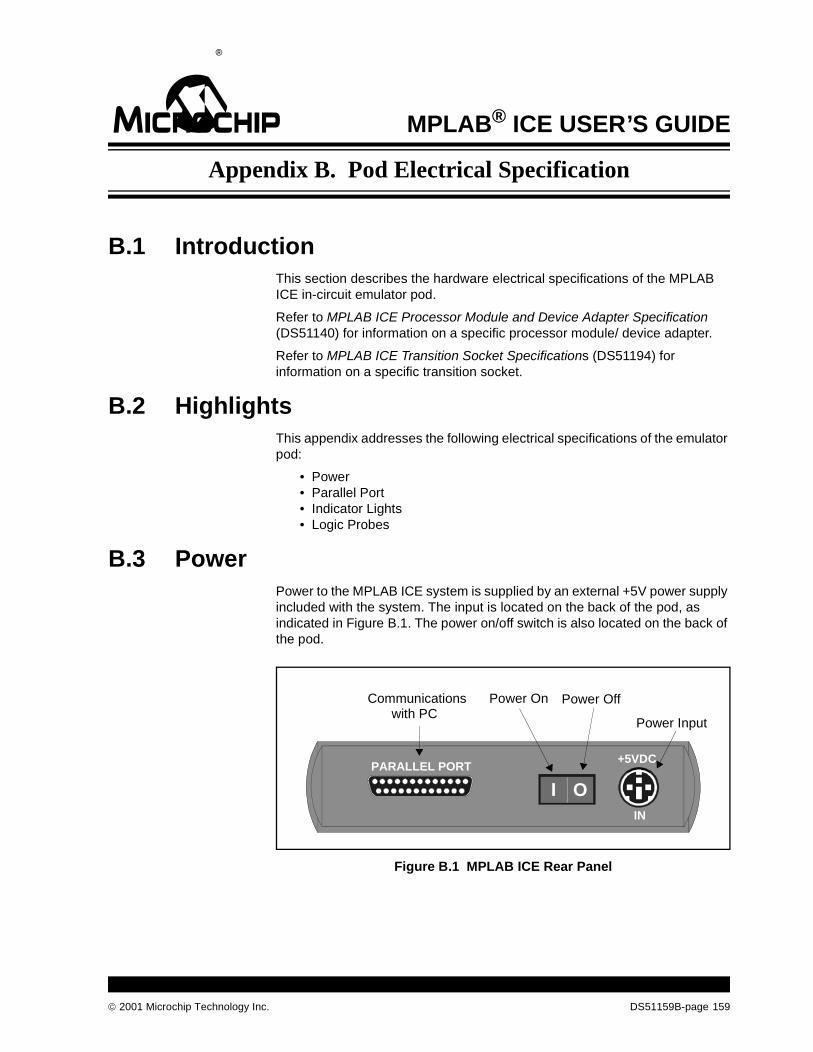
2001 Microchip Technology Inc. DS51159B-page 159
MPLAB® ICE USER’S GUIDE12Appendix B. Pod Electrical Specification
B.1 IntroductionThis section describes the hardware electrical specifications of the MPLAB ICE in-circuit emulator pod.
Refer to MPLAB ICE Processor Module and Device Adapter Specification (DS51140) for information on a specific processor module/ device adapter.
Refer to MPLAB ICE Transition Socket Specifications (DS51194) for information on a specific transition socket.
B.2 HighlightsThis appendix addresses the following electrical specifications of the emulator pod:
• Power• Parallel Port• Indicator Lights• Logic Probes
B.3 PowerPower to the MPLAB ICE system is supplied by an external +5V power supply included with the system. The input is located on the back of the pod, as indicated in Figure B.1. The power on/off switch is also located on the back of the pod.
Figure B.1 MPLAB ICE Rear Panel
PARALLEL PORT
IN
+5VDC
I O
Power On Power Off
Power Input
Communicationswith PC
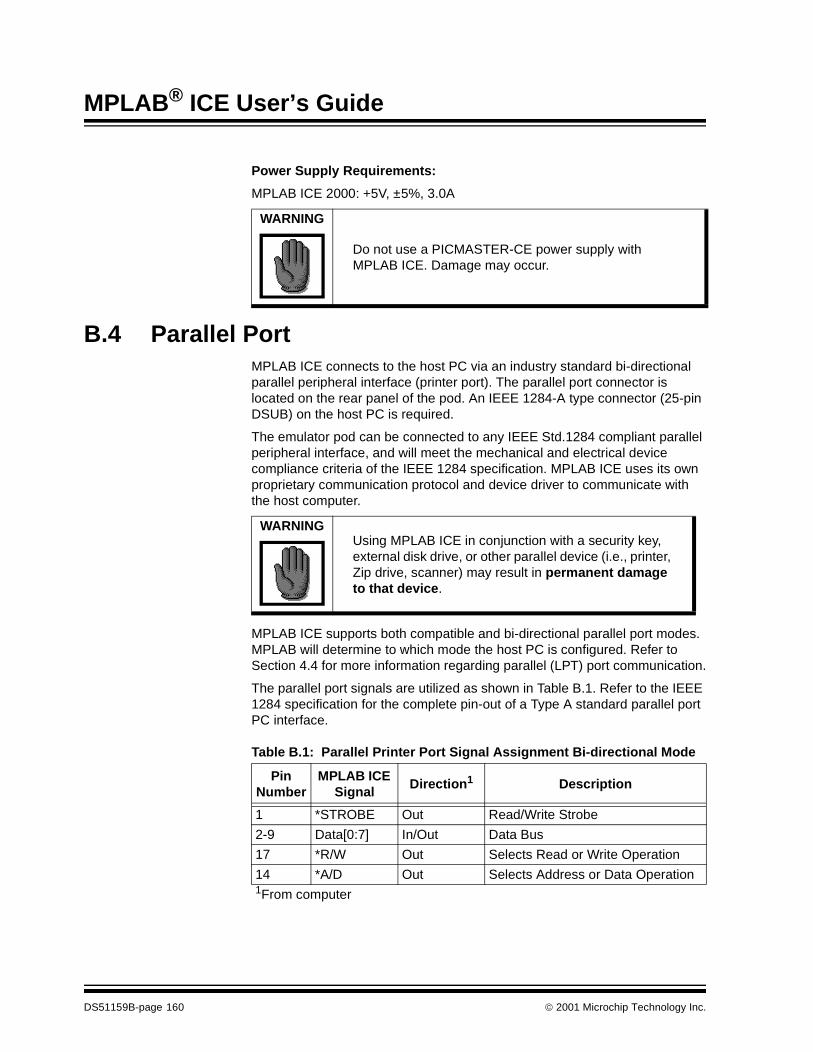
MPLAB® ICE User’s Guide
Power Supply Requirements:
MPLAB ICE 2000: +5V, ±5%, 3.0A
B.4 Parallel PortMPLAB ICE connects to the host PC via an industry standard bi-directional parallel peripheral interface (printer port). The parallel port connector is located on the rear panel of the pod. An IEEE 1284-A type connector (25-pin DSUB) on the host PC is required.
The emulator pod can be connected to any IEEE Std.1284 compliant parallel peripheral interface, and will meet the mechanical and electrical device compliance criteria of the IEEE 1284 specification. MPLAB ICE uses its own proprietary communication protocol and device driver to communicate with the host computer.
MPLAB ICE supports both compatible and bi-directional parallel port modes. MPLAB will determine to which mode the host PC is configured. Refer to Section 4.4 for more information regarding parallel (LPT) port communication.
The parallel port signals are utilized as shown in Table B.1. Refer to the IEEE 1284 specification for the complete pin-out of a Type A standard parallel port PC interface.
WARNING
Do not use a PICMASTER-CE power supply with MPLAB ICE. Damage may occur.
WARNINGUsing MPLAB ICE in conjunction with a security key, external disk drive, or other parallel device (i.e., printer, Zip drive, scanner) may result in permanent damage to that device.
Table B.1: Parallel Printer Port Signal Assignment Bi-directional Mode
Pin Number
MPLAB ICE Signal
Direction1 Description
1 *STROBE Out Read/Write Strobe
2-9 Data[0:7] In/Out Data Bus
17 *R/W Out Selects Read or Write Operation
14 *A/D Out Selects Address or Data Operation1From computer
DS51159B-page 160 2001 Microchip Technology Inc.
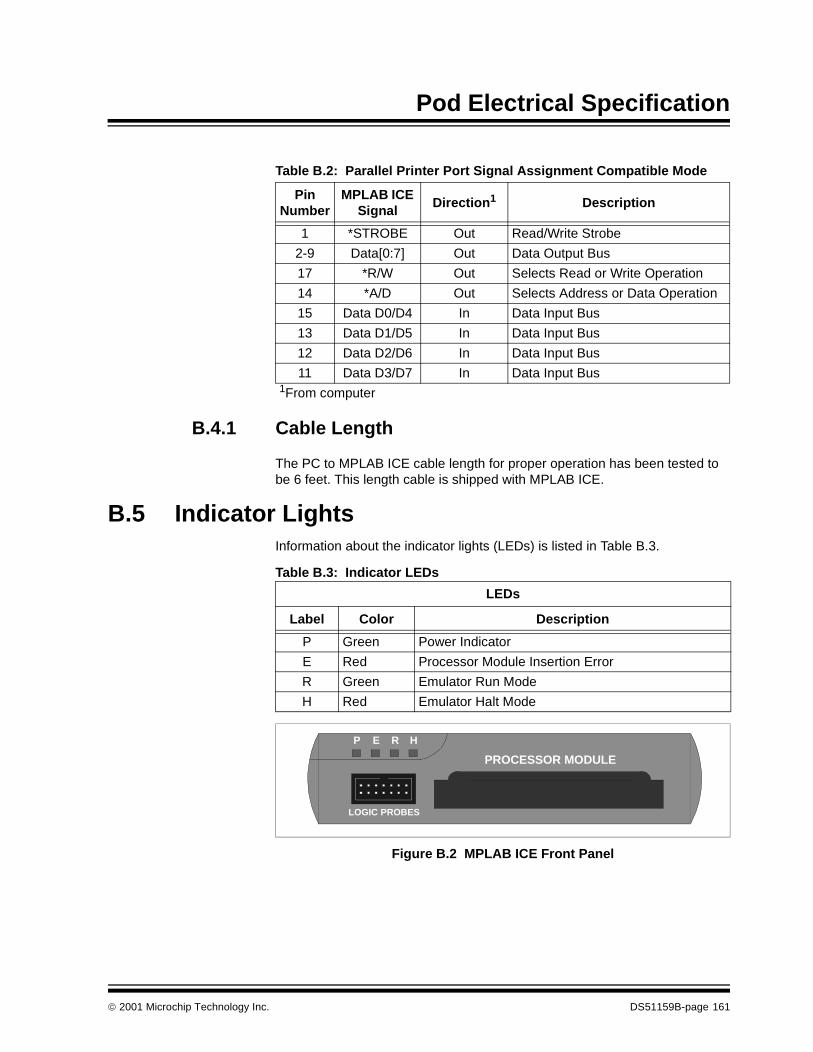
Pod Electrical Specification
B.4.1 Cable Length
The PC to MPLAB ICE cable length for proper operation has been tested to be 6 feet. This length cable is shipped with MPLAB ICE.
B.5 Indicator LightsInformation about the indicator lights (LEDs) is listed in Table B.3.
Table B.3: Indicator LEDs
Figure B.2 MPLAB ICE Front Panel
Table B.2: Parallel Printer Port Signal Assignment Compatible Mode
Pin Number
MPLAB ICE Signal
Direction1 Description
1 *STROBE Out Read/Write Strobe
2-9 Data[0:7] Out Data Output Bus
17 *R/W Out Selects Read or Write Operation
14 *A/D Out Selects Address or Data Operation
15 Data D0/D4 In Data Input Bus
13 Data D1/D5 In Data Input Bus
12 Data D2/D6 In Data Input Bus
11 Data D3/D7 In Data Input Bus1From computer
LEDs
Label Color Description
P Green Power Indicator
E Red Processor Module Insertion Error
R Green Emulator Run Mode
H Red Emulator Halt Mode
LOGIC PROBES
P E R H
PROCESSOR MODULE
2001 Microchip Technology Inc. DS51159B-page 161
MPLAB® ICE User’s Guide
B.5.1 Power LED (P)
This LED is located on the front panel of the pod and is lit when the system is sufficiently powered.
The LED will turn off if the internal system voltage falls below a 4.65 (±5%) volts, indicating a low power condition. If this occurs, power should be removed until the cause of the low voltage is determined.
On pods with an electronic circuit breaker, the LED will blink if there is a system fault. The rate of blinking determines the type of fault.
The system may be reset from a fault by turning off the pod and then turning it back on. If a condition persists, please contact Microchip support.
B.5.2 Processor Module Insertion Error LED (E)
This LED will turn on when the processor module is not inserted completely or correctly. If this LED is on, turn off the power, and remove and reinsert the processor module.
B.5.3 Emulator Run Mode LED (R)
This LED will be on when the processor is actually running and will blink momentarily when a single step is executed.
The function of this LED is the compliment of the Emulator Halt Mode LED (H).
LED Condition
On System is sufficiently powered.
Off No or low power condition.
Blinking Fault detected.
Blink Rate Meaning
2 per second Overcurrent condition (more than 3 A.)
8 per second Undervoltage condition (equal to or less than 4.65V.)
3 rapid, pause, 3 rapid Undervoltage condition on processor module.
LED Condition
On Processor module not inserted completely or correctly.
Off Processor module inserted correctly.
LED Condition
On Processor is running.
Off Processor is halted.
Blink Processor executes single step.
DS51159B-page 162 2001 Microchip Technology Inc.
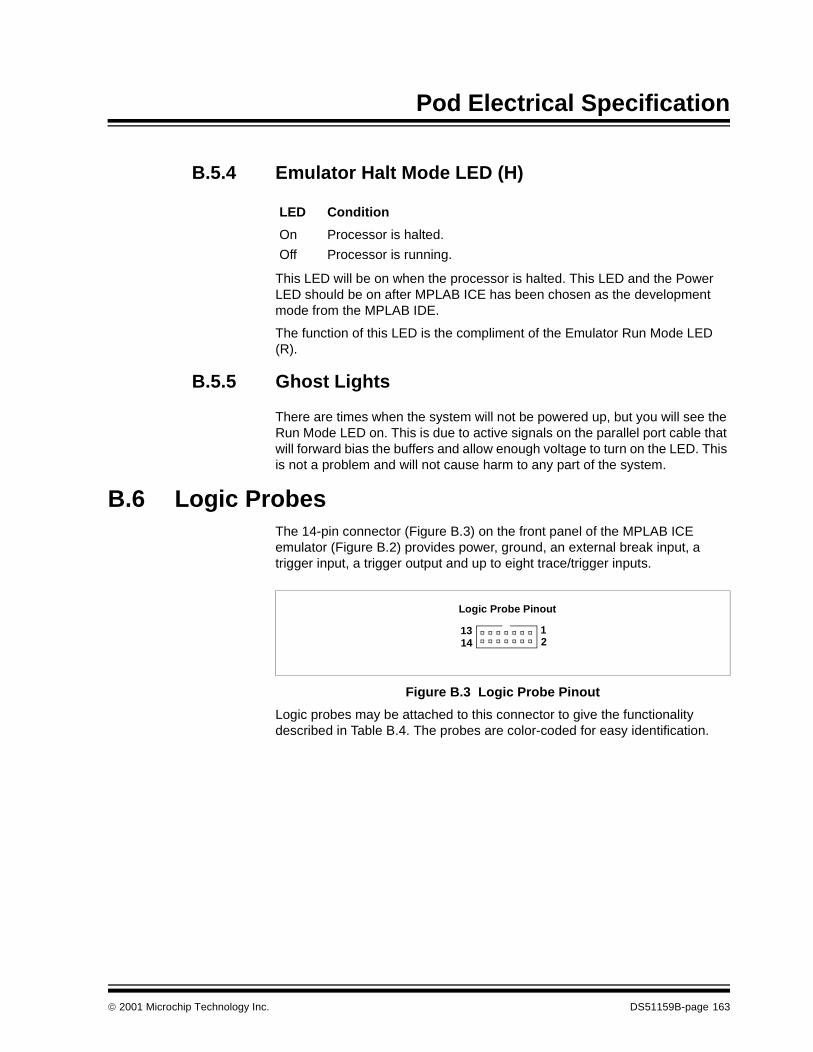
Pod Electrical Specification
B.5.4 Emulator Halt Mode LED (H)
This LED will be on when the processor is halted. This LED and the Power LED should be on after MPLAB ICE has been chosen as the development mode from the MPLAB IDE.
The function of this LED is the compliment of the Emulator Run Mode LED (R).
B.5.5 Ghost Lights
There are times when the system will not be powered up, but you will see the Run Mode LED on. This is due to active signals on the parallel port cable that will forward bias the buffers and allow enough voltage to turn on the LED. This is not a problem and will not cause harm to any part of the system.
B.6 Logic ProbesThe 14-pin connector (Figure B.3) on the front panel of the MPLAB ICE emulator (Figure B.2) provides power, ground, an external break input, a trigger input, a trigger output and up to eight trace/trigger inputs.
Figure B.3 Logic Probe Pinout
Logic probes may be attached to this connector to give the functionality described in Table B.4. The probes are color-coded for easy identification.
LED Condition
On Processor is halted.
Off Processor is running.
Logic Probe Pinout
12
1314
2001 Microchip Technology Inc. DS51159B-page 163
MPLAB® ICE User’s Guide
The electrical specifications for logic probes are listed in Table B.5.
Table B.4: Logic Probe Pinout Description
Pin I/O Name Function Color
1 O VDD System Power. Will supply +5V ±5%, up to 250 mA
Red
2 O HLTOUT Processor Halted Signal. Indicates whether the processor is halted (high) or running (low).
Gray
3 O TRGOUT Trigger/Break Out Gray
4 I TRGIN Trigger In. Active-high input will freeze the trace buffer without halting the processor or edge triggered input will halt the processor.
Gray
5 I EXT7 External input bit 7 of the trace/trigger inputs.
White
6 I EXT6 External input bit 6 of the trace/trigger inputs.
White
7 I EXT5 External input bit 5 of the trace/trigger inputs.
White
8 I EXT4 External input bit 4 of the trace/trigger inputs.
White
9 I EXT3 External input bit 3 of the trace/trigger inputs.
White
10 I EXT2 External input bit 2 of the trace/trigger inputs.
White
11 I EXT1 External input bit 1 of the trace/trigger inputs.
White
12 I EXT0 External input bit 0 of the trace/trigger inputs.
White
13 Gnd GND System Ground Black
14 Gnd GND System Ground Black
Table B.5: Logic Probe Electrical Specifications
Logic Inputs VIH = 3.2V min
VIL = 1.8V max
Logic Outputs VOH = 2.4V min
VOL = 0.4V max
TRGIN Minimum input pulse width = 15 nsec
TRGOUT The output pulse width of the filter trace is one bus cycle, which is ¼ the clock speed (PICmicro MCU devices use four clocks for each instruction).
DS51159B-page 164 2001 Microchip Technology Inc.
2001 Microchip Technology Inc. DS51159B-page 165
MPLAB® ICE USER’S GUIDE12Appendix C. Migrating from PICMASTER
C.1 IntroductionAlthough MPLAB ICE and PICMASTER have the same basic look and feel through the MPLAB IDE, there are some differences. This appendix details those differences, showing how familiar PICMASTER tasks can be performed using MPLAB ICE.
C.2 HighlightsThis appendix includes:
• Unchanged Items• Hardware Setup• How to Time Events• Setting Break Points• Complex Triggers vs. Break/Trace/Trigger Points• External Inputs and Outputs
C.3 Unchanged ItemsMany MPLAB ICE functions operate identically to PICMASTER. These functions include:
• Projects, including language tools and interfaces, and the MPLAB IDE Editor.
• Viewing program memory, calibration and data (EEPROM) memory (if applicable), file registers and SFR’s.
• Modifying program memory, calibration and data (EEPROM) memory (if applicable), file registers and SFR’s.
• Named break points.• Run, halt, step, step over, reset.
C.4 Hardware SetupPICMASTER probes contained various DIP switches and jumpers to configure the probe. These options are now software-selectable through the Power and Clock tabs accessed by Options>Development Mode.
MPLAB® ICE User’s Guide
The PICMASTER jumpers and switches are selected through the following options in the Development Mode dialog.
C.5 How to Time EventsWith PICMASTER, events could be timed through the Stopwatch dialog. With MPLAB ICE, events are timed using the time stamp in the trace memory window.
There are at least two ways to use the time stamp to time an event:
1. Set the program counter at the beginning of the event to time. Set asoftware break point at the end of the event. Then run and view the tracebuffer when execution halts. The last time stamp is the time between theevents.
2. Using a Time Between Events trigger, set the Start Timer and Stop Timerevents appropriately, then run. The last time stamp value in the tracebuffer is the time between the two events. Using this method, it is notnecessary to halt the processor.
Hardware Configuration Items
Description PICMASTER MPLAB ICE
Emulation Power Jumper (+5VSYS/+5VEXT) Options>Development Mode, Power tab
Clock Source Jumper (EXTCLK/INTCLK) Options>Development Mode, Clock tab
Clock Frequency Oscillator installed on probe
Options>Development Mode, Clock tab
Oscillator Type DIP switches Options>Development Mode, Clock tab
DS51159B-page 166 2001 Microchip Technology Inc.
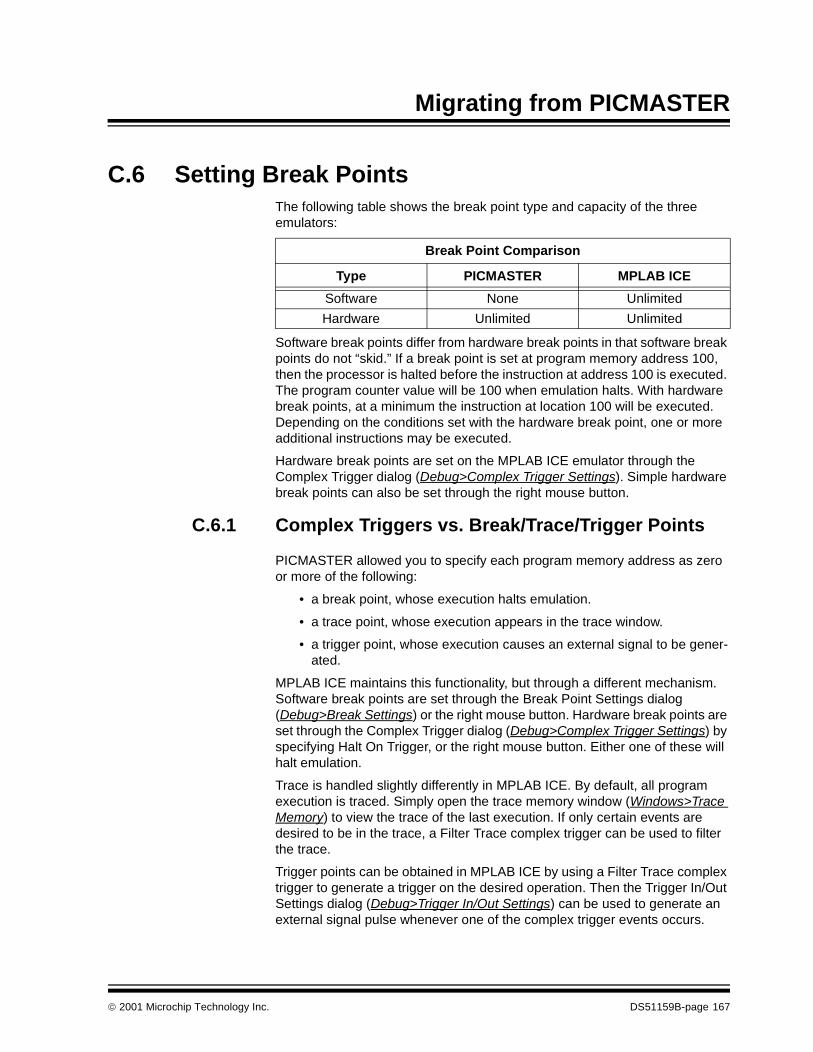
Migrating from PICMASTER
C.6 Setting Break PointsThe following table shows the break point type and capacity of the three emulators:
Software break points differ from hardware break points in that software break points do not “skid.” If a break point is set at program memory address 100, then the processor is halted before the instruction at address 100 is executed. The program counter value will be 100 when emulation halts. With hardware break points, at a minimum the instruction at location 100 will be executed. Depending on the conditions set with the hardware break point, one or more additional instructions may be executed.
Hardware break points are set on the MPLAB ICE emulator through the Complex Trigger dialog (Debug>Complex Trigger Settings). Simple hardware break points can also be set through the right mouse button.
C.6.1 Complex Triggers vs. Break/Trace/Trigger Points
PICMASTER allowed you to specify each program memory address as zero or more of the following:
• a break point, whose execution halts emulation.
• a trace point, whose execution appears in the trace window.
• a trigger point, whose execution causes an external signal to be gener-ated.
MPLAB ICE maintains this functionality, but through a different mechanism. Software break points are set through the Break Point Settings dialog (Debug>Break Settings) or the right mouse button. Hardware break points are set through the Complex Trigger dialog (Debug>Complex Trigger Settings) by specifying Halt On Trigger, or the right mouse button. Either one of these will halt emulation.
Trace is handled slightly differently in MPLAB ICE. By default, all program execution is traced. Simply open the trace memory window (Windows>Trace Memory) to view the trace of the last execution. If only certain events are desired to be in the trace, a Filter Trace complex trigger can be used to filter the trace.
Trigger points can be obtained in MPLAB ICE by using a Filter Trace complex trigger to generate a trigger on the desired operation. Then the Trigger In/Out Settings dialog (Debug>Trigger In/Out Settings) can be used to generate an external signal pulse whenever one of the complex trigger events occurs.
Break Point Comparison
Type PICMASTER MPLAB ICE
Software None Unlimited
Hardware Unlimited Unlimited
2001 Microchip Technology Inc. DS51159B-page 167
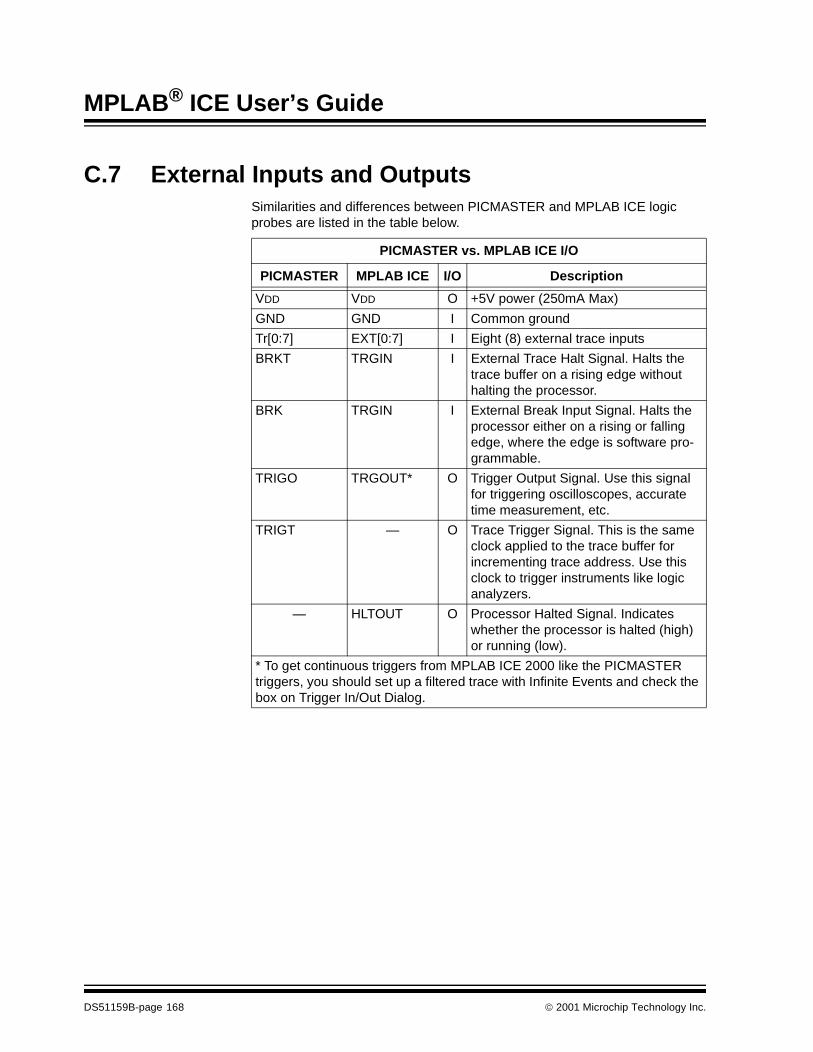
MPLAB® ICE User’s Guide
C.7 External Inputs and OutputsSimilarities and differences between PICMASTER and MPLAB ICE logic probes are listed in the table below.
PICMASTER vs. MPLAB ICE I/O
PICMASTER MPLAB ICE I/O Description
VDD VDD O +5V power (250mA Max)
GND GND I Common ground
Tr[0:7] EXT[0:7] I Eight (8) external trace inputs
BRKT TRGIN I External Trace Halt Signal. Halts the trace buffer on a rising edge without halting the processor.
BRK TRGIN I External Break Input Signal. Halts the processor either on a rising or falling edge, where the edge is software pro-grammable.
TRIGO TRGOUT* O Trigger Output Signal. Use this signal for triggering oscilloscopes, accurate time measurement, etc.
TRIGT — O Trace Trigger Signal. This is the same clock applied to the trace buffer for incrementing trace address. Use this clock to trigger instruments like logic analyzers.
— HLTOUT O Processor Halted Signal. Indicates whether the processor is halted (high) or running (low).
* To get continuous triggers from MPLAB ICE 2000 like the PICMASTER triggers, you should set up a filtered trace with Infinite Events and check the box on Trigger In/Out Dialog.
DS51159B-page 168 2001 Microchip Technology Inc.
2001 Microchip Technology Inc. DS51159B-page 169
MPLAB® IDE USER’S GUIDE12Glossary
IntroductionTo provide a common frame of reference, this glossary defines the terms for several Microchip tools.
HighlightsThis glossary contains terms and definitions for the following tools:
• MPLAB IDE, MPLAB SIM, MPLAB Editor
• MPASM Assembler, MPLINK Linker, MPLIB Librarian
• MPLAB CXX
• MPLAB ICE, PICMASTER Emulators
• MPLAB ICD
• PICSTART Plus, PRO MATE programmer
TermsAbsolute Section
A section with a fixed (absolute) address which can not be changed by the linker.
Access RAM (PIC18CXXX Devices Only)
Special general purpose registers on PIC18CXXX devices that allow access regardless of the setting of the bank select bit (BSR).
Alpha Character
Alpha characters are those characters, regardless of case, that are letters of the alphabet: (a, b, …, z, A, B, …, Z).
Alphanumeric
Alphanumeric characters include alpha characters and numbers: (0,1, …, 9).
Application
A set of software and hardware developed by the user, usually designed to be a product controlled by a PICmicro microcontroller.
Assemble
What an assembler does. See assembler.
Assembler
A language tool that translates a user’s assembly source code (.asm) into machine code. MPASM is Microchip’s assembler.
MPLAB® IDE User’s Guide
Assembly
A programming language that is once removed from machine language. Machine languages consist entirely of numbers and are almost impossible for humans to read and write. Assembly languages have the same structure and set of commands as machine languages, but they enable a programmer to use names (mnemonics) instead of numbers.
Assigned Section
A section which has been assigned to a target memory block in the linker command file. The linker allocates an assigned section into its specified target memory block.
Break Point – Hardware
An event whose execution will cause a halt. See event.
Break Point – Software
An address where execution of the firmware will halt.
Build
A function that recompiles all the source files for an application.
C
A high level programming language that may be used to generate code for PICmicro MCUs, especially high-end device families.
Calibration Memory
A special function register or registers used to hold values for calibration of a PICmicro microcontroller on-board RC oscillator.
COFF
Common Object File Format. An intermediate file format generated by MPLINK linker that contains machine code and debugging information.
Command Line Interface
Command line interface refers to executing a program on the DOS command line with options. Executing MPASM with any command line options or just the file name will invoke the assembler. In the absence of any command line options, a prompted input interface (shell) will be executed.
Compile
What a compiler does. See compiler.
Compiler
A language tool that translates a user’s C source code into machine code. MPLAB C17 and MPLAB C18 are Microchip’s C compilers for PIC17CXXX and PIC18CXXX devices, respectively.
DS51159B-page 170 2001 Microchip Technology Inc.
Glossary
Configuration Bits
Unique bits programmed to set PICmicro microcontroller modes of operation. A configuration bit may or may not be preprogrammed. These bits are set in the Options > Development Mode dialog for simulators or emulators and in the _ _ CONFIG MPASM directive for programmers.
Control Directives
Control directives in MPASM permit sections of conditionally assembled code.
Data Directives
Data directives are those that control MPASM’s allocation of memory and provide a way to refer to data items symbolically; that is, by meaningful names.
Data Memory
General purpose file registers (GPRs) from RAM on the PICmicro device being emulated. The File Register window displays data memory.
Directives
Directives provide control of the assembler’s operation by telling MPASM how to treat mnemonics, define data and format the listing file. Directives make coding easier and provide custom output according to specific needs.
Download
Download is the process of sending data from the PC host to another device, such as an emulator, programmer or target board.
EEPROM
Electrically Erasable Programmable Read Only Memory. A special type of PROM that can be erased electrically. Data is written or erased one byte at a time. EEPROM retains its contents even when power is turned off.
Emulation
The process of executing software loaded into emulation memory as if the firmware resided on the microcontroller device under development.
Emulation Memory
Program memory contained within the emulator.
Emulator
Hardware that performs emulation.
Emulator System
The MPLAB ICE emulator system includes the pod, processor module, device adapter, cables and MPLAB Software. The PICMASTER emulator system includes the pod, device-specific probe, cables and MPLAB Software.
Event
A description of a bus cycle which may include address, data, pass count, external input, cycle type (fetch, R/W) and time stamp. Events are used to describe triggers and break points.
2001 Microchip Technology Inc. DS51159B-page 171
MPLAB® IDE User’s Guide
Executable Code
See Hex Code.
Export
Send data out of the MPLAB IDE in a standardized format.
Expressions
Expressions are used in the operand field of MPASM’s source line and may contain constants, symbols, or any combination of constants and symbols separated by arithmetic operators. Each constant or symbol may be preceded by a plus or minus to indicate a positive or negative expression.
Extended Microcontroller Mode(PIC17CXXX and PIC18CXXX Devices Only)
In extended microcontroller mode, on-chip program memory as well as external memory is available. Execution automatically switches to external if the program memory address is greater than the internal memory space of the PIC17CXXX or PIC18CXXX device.
External Input Line (MPLAB ICE only)
An external input signal logic probe line (TRIGIN) for setting an event based upon external signals.
External Linkage
A function or variable has external linkage if it can be accessed from outside the module in which it is defined.
External RAM (PIC17CXXX and PIC18CXXX Devices Only)
Off-chip Read/Write memory.
External Symbol
A symbol for an identifier which has external linkage.
External Symbol Definition
A symbol for a function or variable defined in the current module.
External Symbol Reference
A symbol which references a function or variable defined outside the current module.
External Symbol Resolution
A process performed by the linker in which external symbol definitions from all input modules are collected in an attempt to update all external symbol references. Any external symbol references which do not have a corresponding definition cause a linker error to be reported.
Note: MPASM expressions are evaluated in 32-bit integer math. (Floating point is not currently supported.)
DS51159B-page 172 2001 Microchip Technology Inc.
Glossary
File Registers
On-chip general purpose and special function registers.
Flash
A type of EEPROM where data is written or erased in blocks instead of bytes.
FNOP
Forced No Operation. A forced NOP cycle is the second cycle of a two-cycle instruction. Since the PICmicro architecture is pipelined, it prefetches the next instruction in the physical address space while it is executing the current instruction. However, if the current instruction changes the program counter, this prefetched instruction is explicitly ignored, causing a forced NOP cycle.
GPR
See Data Memory.
Halt
A function that stops the emulator. Executing Halt is the same as stopping at a break point. The program counter stops and the user can inspect and change register values and single step through code.
Hex Code
Executable instructions assembled or compiled from source code into standard hexadecimal format code. Also called executable or machine code. Hex code is contained in a hex file.
Hex File
An ASCII file containing hexadecimal addresses and values (hex code) suitable for programming a device. This format is readable by a device programmer.
High Level Language
A language for writing programs that is of a higher level of abstraction from the processor than assembler code. High level languages (such as C) employ a compiler to translate statements into machine instructions that the target processor can execute.
ICD
In-Circuit Debugger. MPLAB ICD is Microchip’s in-circuit debugger for PIC16F87X devices. MPLAB ICD works with MPLAB IDE.
ICE
In-Circuit Emulator. MPLAB ICE is Microchip’s in-circuit emulator that works with MPLAB IDE.
IDE
Integrated Development Environment. An application that has multiple functions for firmware development. The MPLAB IDE integrates a compiler, an assembler, a project manager, an editor, a debugger, a simulator and an
2001 Microchip Technology Inc. DS51159B-page 173
MPLAB® IDE User’s Guide
assortment of other tools within one Windows application. A user developing an application can write code, compile, debug and test an application without leaving the MPLAB IDE desktop.
Identifier
A function or variable name.
Import
Bring data into the MPLAB Integrated Development Environment (IDE) from an outside source, such as from a hex file.
Initialized Data
Data which is defined with an initial value. In C, int myVar=5; defines a variable which will reside in an initialized data section.
Internal Linkage
A function or variable has internal linkage if it can not be accessed from outside the module in which it is defined.
Librarian
A language tool that creates and manipulates libraries. MPLIB is Microchip’s librarian.
Library
A library is a collection of relocatable object modules. It is created by assembling multiple source files to object files and then using the librarian to combine the object files into one library file. A library can be linked with object modules and other libraries to create executable code.
Link
What a linker does. See Linker.
Linker
A language tool that combines object files and libraries to create executable code. Linking is performed by Microchip’s linker, MPLINK.
Linker Script Files
Linker script files are the command files of MPLINK (.LKR). They define linker options and describe available memory on the target platform.
Listing Directives
Listing directives are those directives that control the MPASM listing file format. They allow the specification of titles, pagination and other listing control.
Listing File
A listing file is an ASCII text file that shows the machine code generated for each C source statement, assembly instruction, MPASM directive, or macro encountered in a source file.
DS51159B-page 174 2001 Microchip Technology Inc.
Glossary
Local Label
A local label is one that is defined inside a macro with the LOCAL directive. These labels are particular to a given instance of a macro’s instantiation. In other words, the symbols and labels that are declared as local are no longer accessible after the ENDM macro is encountered.
Logic Probes
Up to 14 logic probes connected to the emulator. The logic probes provide external trace inputs, trigger output signal, +5V and a common ground.
Machine Code
Either object or executable code.
Macro
A collection of assembler instructions that are included in the assembly code when the macro name is encountered in the source code. Macros must be defined before they are used; forward references to macros are not allowed.
All statements following a MACRO directive and prior to an ENDM directive are part of the macro definition. Labels used within the macro must be local to the macro so the macro can be called repetitively.
Macro Directives
Directives that control the execution and data allocation within macro body definitions.
Make Project
A command that rebuilds an application, re-compiling only those source files that have changed since the last complete compilation.
MCU
Microcontroller Unit. An abbreviation for microcontroller. Also µC.
Memory Models
Versions of libraries and/or precompiled object files based on a device’s memory (RAM/ROM) size and structure.
Microcontroller
A highly integrated chip that contains all the components comprising a controller. Typically this includes a CPU, RAM, some form of ROM, I/O ports and timers. Unlike a general-purpose computer, which also includes all of these components, a microcontroller is designed for a very specific task – to control a particular system. As a result, the parts can be simplified and reduced, which cuts down on production costs.
Microcontroller Mode (PIC17CXXX and PIC18CXXX Devices Only)
One of the possible program memory configurations of the PIC17CXXX and PIC18CXXX families of microcontrollers. In microcontroller mode, only internal execution is allowed. Thus, only the on-chip program memory is available in microcontroller mode.
2001 Microchip Technology Inc. DS51159B-page 175
MPLAB® IDE User’s Guide
Microprocessor Mode (PIC17CXXX and PIC18CXXX Devices Only)
One of the possible program memory configurations of the PIC17CXXX and PIC18CXXX families of microcontrollers. In microprocessor mode, the on-chip program memory is not used. The entire program memory is mapped externally.
Mnemonics
Instructions that are translated directly into machine code. Mnemonics are used to perform arithmetic and logical operations on data residing in program or data memory of a microcontroller. They can also move data in and out of registers and memory as well as change the flow of program execution. Also referred to as Opcodes.
MPASM
Microchip Technology’s relocatable macro assembler. MPASM is a DOS or Windows-based PC application that provides a platform for developing assembly language code for Microchip’s PICmicro microcontroller families. Generically, MPASM will refer to the entire development platform including the macro assembler and utility functions.
MPASM will translate source code into either object or executable code. The object code created by MPASM may be turned into executable code through the use of the MPLINK linker.
MPLAB CXX
Refers to MPLAB C17 and MPLAB C18 C compilers.
MPLAB ICD
Microchip’s in-circuit debugger for PIC16F87X devices. MPLAB ICD works with MPLAB IDE. The MPLAB ICD system consists of a module, header, demo board (optional), cables and MPLAB Software.
MPLAB ICE
Microchip’s in-circuit emulator that works with MPLAB IDE.
MPLAB IDE
The name of the main executable program that supports the IDE with an Editor, Project Manager and Emulator/Simulator Debugger. The MPLAB Software resides on the PC host. The executable file name is MPLAB.EXE. MPLAB.EXE calls many other files.
MPLAB SIM
Microchip’s simulator that works with MPLAB IDE.
MPLIB
MPLIB is a librarian for use with COFF object modules (filename.o) created using either MPASM v2.0, MPASMWIN v2.0, or MPLAB C v2.0 or later.
MPLIB librarian will combine multiple object files into one library file. Then MPLIB can be used to manipulate the object files within the created library.
DS51159B-page 176 2001 Microchip Technology Inc.
Glossary
MPLINK
MPLINK is a linker for the Microchip relocatable assembler, MPASM and the Microchip C compilers, MPLAB C17 or MPLAB C18. MPLINK also may be used with the Microchip librarian, MPLIB. MPLINK is designed to be used with MPLAB IDE, though it does not have to be.
MPLINK will combine object files and libraries to create a single executable file.
MPSIM
The DOS version of Microchip’s simulator. MPLAB SIM is the newest simulator from Microchip.
MRU
Most Recently Used. Refers to files and windows available to be selected from MPLAB IDE main pull down menus.
Nesting Depth
The maximum level to which macros can include other macros. Macros can be nested to 16 levels deep.
Non Real-Time
Refers to the processor at a break point or executing single step instructions or MPLAB IDE being run in simulator mode.
Node
MPLAB IDE project component.
NOP
No Operation. An instruction that has no effect when executed except to advance the program counter.
Object Code
The intermediate code that is produced from the source code after it is processed by an assembler or compiler. Relocatable code is code produced by MPASM assembler or MPLAB C17/C18 that can be run through MPLINK linker to create executable code. Object code is contained in an object file.
Object File
A module which may contain relocatable code or data and references to external code or data. Typically, multiple object modules are linked to form a single executable output. Special directives are required in the source code when generating an object file. The object file contains object code.
Object File Directives
Directives that are used only when creating an object file.
2001 Microchip Technology Inc. DS51159B-page 177
MPLAB® IDE User’s Guide
Off-Chip Memory (PIC17CXXX and PIC18CXXX Devices Only)
Off-chip memory refers to the memory selection option for the PIC17CXXX or PIC18CXXX device where memory may reside on the target board, or where all program memory may be supplied by the Emulator. The Memory tab accessed from Options > Development Mode provides the Off-Chip Memory selection dialog box.
Opcode
Operational Code. See Mnemonics.
Operators
Arithmetic symbols, like the plus sign ‘+’ and the minus sign ‘-’, that are used when forming well-defined expressions. Each operator has an assigned precedence.
Pass Counter
A counter that decrements each time an event (such as the execution of an instruction at a particular address) occurs. When the pass count value reaches zero, the event is satisfied. You can assign the Pass Counter to break and trace logic and to any sequential event in the complex trigger dialog.
PC
Personal Computer or Program Counter.
PC Host
Any IBM or compatible Personal Computer running Windows 3.1x or Windows 95/98, Windows NT, or Windows 2000. MPLAB IDE runs on 486 or higher machines.
PICmicro MCUs
PICmicro microcontrollers (MCUs) refers to all Microchip microcontroller families.
PICMASTER Emulator
The hardware unit that provides tools for emulating and debugging firmware applications. This unit contains emulation memory, break point logic, counters, timers and a trace analyzer among some of its tools. MPLAB ICE is the newest emulator from Microchip.
PICSTART Plus
A device programmer from Microchip. Programs 8-, 14-, 28- and 40-pin PICmicro microcontrollers. Must be used with MPLAB Software.
Pod
The external emulator box that contains emulation memory, trace memory, event and cycle timers and trace/break point logic. Occasionally used as an abbreviated name for the MPLAB ICE emulator.
DS51159B-page 178 2001 Microchip Technology Inc.
Glossary
Power-on-Reset Emulation
A software randomization process that writes random values in data RAM areas to simulate uninitialized values in RAM upon initial power application.
Precedence
The concept that some elements of an expression are evaluated before others; (i.e., * and / before + and -). In MPASM, operators of the same precedence are evaluated from left to right. Use parentheses to alter the order of evaluation.
Program Counter
A register that specifies the current execution address.
Program Memory
The memory area in a PICmicro microcontroller where instructions are stored. Memory in the emulator or simulator containing the downloaded target application firmware.
Programmer
A device used to program electrically programmable semiconductor devices such as microcontrollers.
Project
A set of source files and instructions to build the object and executable code for an application.
PRO MATE
A device programmer from Microchip. Programs all PICmicro microcontrollers and most memory and KEELOQ® devices. Can be used with MPLAB IDE or stand-alone.
Prototype System
A term referring to a user’s target application, or target board.
PWM Signals
Pulse Width Modulation Signals. Certain PICmicro devices have a PWM peripheral.
Qualifier
An address or an address range used by the Pass Counter or as an event before another operation in a complex trigger.
Radix
The number base, hex, or decimal, used in specifying an address and for entering data in the Window > Modify command.
RAM
Random Access Memory (Data Memory).
Raw Data
The binary representation of code or data associated with a section.
2001 Microchip Technology Inc. DS51159B-page 179
MPLAB® IDE User’s Guide
Real-Time
When released from the halt state in the emulator or MPLAB ICD mode, the processor runs in real-time mode and behaves exactly as the normal chip would behave. In real-time mode, the real-time trace buffer of MPLAB ICE is enabled and constantly captures all selected cycles and all break logic is enabled. In the emulator or MPLAB ICD, the processor executes in real-time until a valid break point causes a halt, or until the user halts the emulator.
In the simulator real-time simply means execution of the microcontroller instructions as fast as they can be simulated by the host CPU.
Recursion
The concept that a function or macro, having been defined, can call itself. Great care should be taken when writing recursive macros; it is easy to get caught in an infinite loop where there will be no exit from the recursion.
Relocatable Section
A section whose address is not fixed (absolute). The linker assigns addresses to relocatable sections through a process called relocation.
Relocation
A process performed by the linker in which absolute addresses are assigned to relocatable sections and all identifier symbol definitions within the relocatable sections are updated to their new addresses.
ROM
Read Only Memory (Program Memory).
Run
The command that releases the emulator from halt, allowing it to run the application code and change or respond to I/O in real time.
Section
An portion of code or data which has a name, size and address.
SFR
Special Function Registers of a PICmicro.
Shared Section
A section which resides in a shared (non-banked) region of data RAM.
Shell
The MPASM shell is a prompted input interface to the macro assembler. There are two MPASM shells: one for the DOS version and one for the Windows version.
Simulator
A software program that models the operation of the PICmicro microprocessor.
DS51159B-page 180 2001 Microchip Technology Inc.
Glossary
Single Step
This command steps though code, one instruction at a time. After each instruction, MPLAB IDE updates register windows, watch variables and status displays so you can analyze and debug instruction execution.
You can also single step C compiler source code, but instead of executing single instructions, MPLAB IDE will execute all assembly level instructions generated by the line of the high level C statement.
Skew
The information associated with the execution of an instruction appears on the processor bus at different times. For example, the executed opcode appears on the bus as a fetch during the execution of the previous instruction, the source data address and value and the destination data address appear when the opcode is actually executed, and the destination data value appears when the next instruction is executed. The trace buffer captures the information that is on the bus at one instance. Therefore, one trace buffer entry will contain execution information for three instructions. The number of captured cycles from one piece of information to another for a single instruction execution is referred to as the skew.
Skid
When a hardware break point is used to halt the processor, one or more additional instructions may be executed before the processor halts. The number of extra instructions executed after the intended break point is referred to as the skid.
Source Code - Assembly
Source code consists of PICmicro instructions and MPASM directives and macros that will be translated into machine code by an assembler.
Source Code - C
A program written in the high level language called “C” which will be converted into PICmicro machine code by a compiler. Machine code is suitable for use by a PICmicro MCU or Microchip development system product like MPLAB IDE.
Source File - Assembly
The ASCII text file of PICmicro instructions and MPASM directives and macros (source code) that will be translated into machine code by an assembler. It is an ASCII file that can be created using any ASCII text editor.
Source File - C
The ASCII text file containing C source code that will be translated into machine code by a compiler. It is an ASCII file that can be created using any ASCII text editor.
Special Function Registers
Registers that control I/O processor functions, I/O status, timers, or other modes or peripherals.
2001 Microchip Technology Inc. DS51159B-page 181
MPLAB® IDE User’s Guide
DS51159B-page 182 2001 Microchip Technology Inc.
Stack - Hardware
An area in PICmicro MCU memory where function arguments, return values, local variables and return addresses are stored; (i.e., a “Push-Down” list of calling routines). Each time a PICmicro MCU executes a CALL or responds to an interrupt, the software pushes the return address to the stack. A return command pops the address from the stack and puts it in the program counter.
The PIC18CXXX family also has a hardware stack to store register values for “fast” interrupts.
Stack - Software
The compiler uses a software stack for storing local variables and for passing arguments to and returning values from functions.
Static RAM or SRAM
Static Random Access Memory. Program memory you can Read/Write on the target board that does not need refreshing frequently.
Status Bar
The Status Bar is located on the bottom of the MPLAB IDE window and indicates such current information as cursor position, development mode and device, and active tool bar.
Step Into
This command is the same as Single Step. Step Into (as opposed to Step Over) follows a CALL instruction into a subroutine.
Step Over
Step Over allows you to debug code without stepping into subroutines. When stepping over a CALL instruction, the next break point will be set at the instruction after the CALL. If for some reason the subroutine gets into an endless loop or does not return properly, the next break point will never be reached.
The Step Over command is the same as Single Step except for its handling of CALL instructions.
Stimulus
Data generated to exercise the response of simulation to external signals. Often the data is put into the form of a list of actions in a text file. Stimulus may be asynchronous, synchronous (pin), clocked and register.
Stopwatch
A counter for measuring execution cycles.
Symbol
A symbol is a general purpose mechanism for describing the various pieces which comprise a program. These pieces include function names, variable names, section names, file names, struct/enum/union tag names, etc.
Symbols in MPLAB IDE refer mainly to variable names, function names and assembly labels.
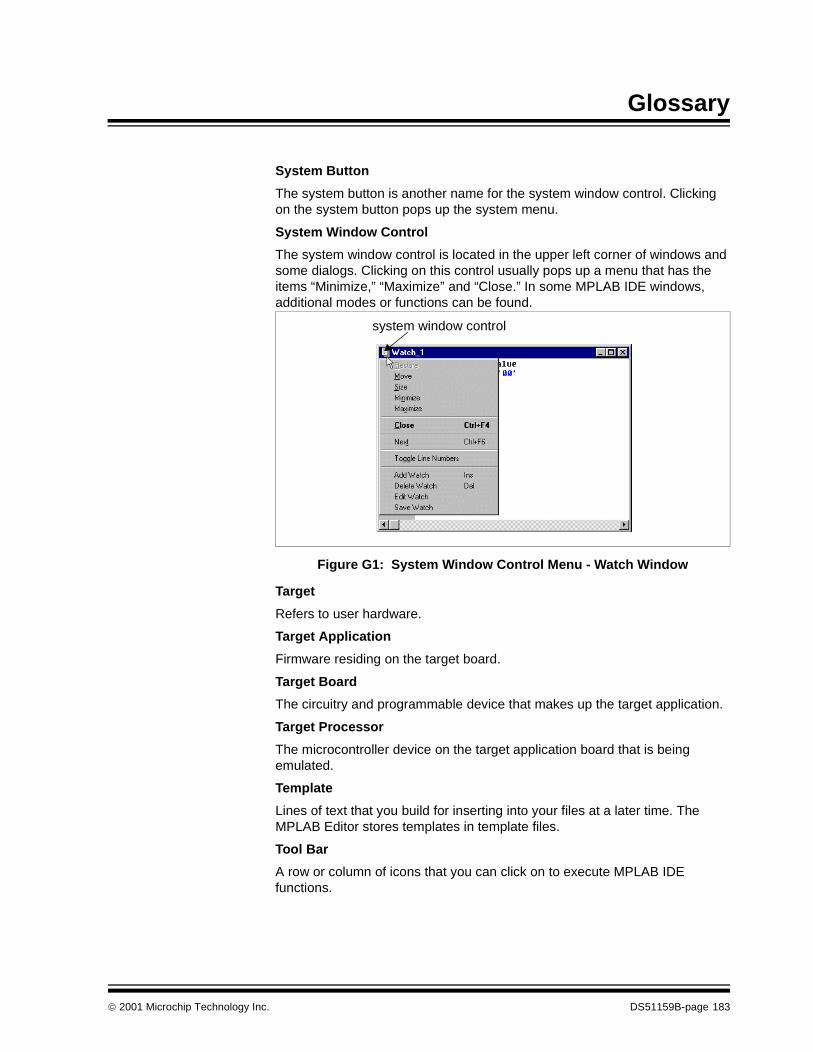
2001 Microchip Technology Inc. DS51159B-page 183
Glossary
System Button
The system button is another name for the system window control. Clicking on the system button pops up the system menu.
System Window Control
The system window control is located in the upper left corner of windows and some dialogs. Clicking on this control usually pops up a menu that has the items “Minimize,” “Maximize” and “Close.” In some MPLAB IDE windows, additional modes or functions can be found.
Figure G1: System Window Control Menu - Watch Window
Target
Refers to user hardware.
Target Application
Firmware residing on the target board.
Target Board
The circuitry and programmable device that makes up the target application.
Target Processor
The microcontroller device on the target application board that is being emulated.
Template
Lines of text that you build for inserting into your files at a later time. The MPLAB Editor stores templates in template files.
Tool Bar
A row or column of icons that you can click on to execute MPLAB IDE functions.
system window control
MPLAB® IDE User’s Guide
DS51159B-page 184 2001 Microchip Technology Inc.
Trace
An emulator or simulator function that logs program execution. The emulator logs program execution into its trace buffer which is uploaded to MPLAB IDE’s trace window.
Trace Memory
Trace memory contained within the emulator. Trace memory is sometimes called the trace buffer.
Trigger Output
Trigger output refers to an emulator output signal that can be generated at any address or address range and is independent of the trace and break point settings. Any number of trigger output points can be set.
Unassigned Section
A section which has not been assigned to a specific target memory block in the linker command file. The linker must find a target memory block in which to allocate an unassigned section.
Uninitialized Data
Data which is defined without an initial value. In C, int myVar; defines a variable which will reside in an uninitialized data section.
Upload
The Upload function transfers data from a tool, such as an emulator or programmer, to the host PC or from the target board to the emulator.
Warning
An alert that is provided to warn you of a situation that would cause physical damage to a device, software file, or equipment.
Watchdog Timer (WDT)
A timer on a PICmicro microcontroller that resets the processor after a selectable length of time. The WDT is enabled or disabled and set up using configuration bits.
Watch Variable
A variable that you may monitor during a debugging session in a watch window.
Watch Window
Watch windows contain a list of watch variables that are updated at each break point.
2001 Microchip Technology Inc. DS51159B-page 185
M
AAbsolute Section .......................................... 169Access RAM ................................................. 169AccessTests ................................................. 128Address .................................................. 17, 122Address Range ............................................. 102Address, Memory ........................................... 99All Events ............................................... 15, 106Any Event ............................................... 15, 107Assembler .................................................... 169Assigned Section .......................................... 170
BBidirectional Communication .................. 83, 160Break Options ............................... 13, 41, 63, 88Break Options Tab ................................... 13, 88Break Points
Hardware ........................ 14, 51, 52, 73, 74, .......................... 94, 95, 96, 98, 170
Named Software .......................... 50, 72, 95PICMASTER .......................................... 167Software ............................... 48, 70, 94, 170
CCables
Parallel Port ................................. 9, 28, 161Power Supply ................................. 9, 28, 30Processor Module .......................... 9, 28, 30
Calibration Memory ................................ 92, 170Captured Events ........................................... 109CD-ROM ................................................... 22, 30Clear Breakpoints On Download .............. 41, 63Clock .................................................. 42, 64, 89
Frequency ................................................ 89On-board ............................................ 13, 86Target Board ...................................... 13, 86
Clock Tab ........................................... 13, 86, 87Closing a Project ............................................ 90Code Coverage .................. 16, 55, 77, 118, 154Column ......................................................... 124Command Line Interface .............................. 170Compatible Mode ......................................... 161Compiler ....................................................... 170
Complex Trigger ..................................... 52, 167Break Points ............................................. 96Settings Dialog ......................................... 98
Complex Triggering .................................. 14, 98Examples ............................................... 111
Configuration Bits ......................................... 171Configuration Tab ..................................... 13, 88Customer Notification Service ........................ 24Customer Support ........................................... 26Cycle Number ......................................... 17, 122
DData Memory ........................... 15, 16, 104, 110,
......................................... 113, 117, 171Data/Reload .................................................. 124Debugging Techniques ................................. 141Destination Data Address ....................... 17, 122Destination Data Value ........................... 17, 122Development Mode ....................... 12, 40, 62, 89Device Adapter ......................... 9, 11, 28, 30, 32
Specification ............................................. 22Device Information .............................. 12, 40, 62Directives ...................................................... 171
Control .................................................... 171Data ........................................................ 171Listing ..................................................... 174Macro ..................................................... 175Object File .............................................. 177
DocumentationConventions ............................................. 20Layout ...................................................... 19Updates .................................................... 21
EECP ................................................................ 82EEPROM ................................................ 92, 171Emulation, Starting and Stopping ................... 93Emulator ....................................................... 171Emulator Pod see PodEmulator Stand ............................................... 30EPP ................................................................ 82Event .................................... 14, 15, 98, 99, 100Event Tabs .................................................... 105Examples, Complex Triggering ..................... 111Executable Code .......................................... 172
MPLAB® ICE USER’S GUIDE
Index
MPLAB® ICE User’s Guide
Execute an Opcode ........................................94Export ...........................................................172Expressions ..................................................172Extended Microcontroller Mode ........13, 88, 172External
Clock see Clock, Target BoardInputs ........................................17, 122, 172Linkage ...................................................172Memory ............................................88, 172Power see Power From Target BoardSignal .................................................14, 98Symbol ...................................................172Trigger ..............................................96, 164
FFetch .......................................................15, 103File Registers ..........................................92, 134File, Listing ....................................................174Filter Trace ......................................15, 109, 116Flag Bit ..........................................................113Force Compatibility Mode .......................83, 133Forced NOP (FNOP) ................................15, 99Freeze Peripherals On Halt ......................41, 63Freeze the Trace ............................................96
GGhost Lights ..................................................163Global Break Enable .................................41, 63Glossary ........................................................169
HHalt .................................................................93Halt On Trace Buffer Full ................................99Halt On Trigger .......................................99, 113Hardware
Break Points ..........................14, 51, 52, 73, ..................................74, 94, 95, 98
Installation ..........................................10, 31Powering Down ............................11, 32, 34Powering Up .......................................11, 32Set Up ....................................................165
Hex Code ......................................................173
IICD ................................................................173ICE ................................................................173IDE ................................................................173Ignore FNOP Cycles .........................15, 99, 110Import ............................................................174Indicator Lights .............................................161Infinite Events .................................15, 109, 116Initialized Data ..............................................174Inquire .............................................................84Installation
Hardware ............................................10, 31Software .............................................12, 35
Instruction ...............................................17, 122
InternalClock see Clock, On- BoardLinkage ...................................................174Power see Power From Emulator
Internet Address ..............................................23Interrupts ...............................................142, 157
KKit Components ...............................................30
LLabel .......................................................17, 122LEDs .............................................................161Librarian ........................................................174Library ...........................................................174Linker ............................................................174Linker Script Files ..........................................174Listing File .....................................................174Local Label ....................................................175Logic Probes ................................11, 30, 31, 99,
.........................................154, 163, 175Connector .............................................9, 28I/O Electrical Specifications ....................164PICMASTER ...........................................168Pinout .....................................................163
Loop Execution .....................................116, 155Low Voltage Emulation .............................33, 85LPT Port .................................10, 12, 31, 39, 61,
.........................................133, 159, 160
MMCLR ............................................13, 42, 64, 88MCU ..............................................................175Memory ...................................13, 42, 64, 88, 98
Calibration ..............................................170Data ...................................15, 16, 104, 110,
...........................................117, 171Program ....................................15, 103, 179Trace ................................................16, 184
Memory Models .............................................175Memory Tab ..............................................13, 88Menu, Right Mouse Button ........................94, 95Microchip Internet Web Site ............................23Microcontroller Mode .....................................175Microprocessor Mode ........................13, 88, 176Mnemonics ....................................................176Modify ..............................................................92Mouse, Right Button Menu ........................94, 95MPASM .................................................169, 176MPLAB IDE ...........................12, 27, 38, 60, 176MPLAB, Running ...........................12, 38, 60, 81MPLAB CXX ..................................................176MPLAB ICD ...................................................176MPLAB ICE .............................................27, 176MPLAB SIM ...................................................176MPLIB ...................................................174, 176
DS51159B-page 186 2001 Microchip Technology Inc.
Index
MPLINK ................................................ 174, 177Multiple Events ....................................... 16, 110
NNamed Software Break Points ........... 50, 72, 95NOP, Forced .................................................. 99
OObject Code ................................................. 177Off-Chip Memory .......................................... 178Opcode ..................................... 17, 99, 122, 178Opening a Project ........................................... 90Operators ..................................................... 178
PParallel Cable ........................... 9, 10, 28, 30, 31Parallel Port ........................... 10, 12, 31, 39, 61,
........................................ 133, 159, 160Pass Counter .................................. 99, 109, 178Phantom Interrupt ......................................... 157PICMASTER ........................................ 165, 178PICmicro ....................................................... 181PICSTART Plus ............................................ 178Pins Tab ................................................... 13, 88Pod ........................................... 9, 10, 28, 30, 31
Electrical Specification ........................... 159Port see LPT PortPorts Tab .................................................. 12, 82Power ............................................... 42, 64, 164
From Emulator ................................... 13, 84From Target Board ............................ 13, 85On/Off Switch ......................................... 159
Power Down Hardware ...................... 11, 32, 34Power Supply ..................................... 11, 30, 31
Cable ............................................. 9, 28, 30Input ....................................................... 159Requirements ........................................ 160
Power Tab .................................... 13, 84, 85, 87Power Up Hardware ................................. 11, 32Power-On Reset ............................................. 92Precedence .................................................. 179PRO MATE ................................................... 179Processor Clock ..................................... 89, 134Processor Mode ................................. 13, 42, 64Processor Module .................... 9, 11, 28, 30, 31
Specification ............................................ 22Processor, Resetting ...................................... 91Program Counter .......................................... 179Program Memory ...................... 15, 92, 103, 179Programmer ................................................. 179Project .......................................................... 179
Opening/Closing ...................................... 90Saving ...................................................... 89Set Up .......................................... 13, 42, 64
PS/2 ................................................................ 82
QQualifier ........................................................ 179Quick Start ........................................................ 9
RRadix ............................................................ 179RAM see Data MemoryReading, Recommended ................................ 22README ........................................................ 22Real-Time ..................................................... 180Reload Trace Data ................................. 17, 123Relocatable Section ...................................... 180Reset .............................................................. 91Resetting the Processor ................................. 91Right Mouse Button Menu ........................ 94, 95ROM see Program MemoryRun ................................................................. 93Run Mode Tests ........................................... 128
SSaving a Project ............................................. 89Section .......................................................... 180
Absolute ................................................. 169Assigned ................................................ 170Relocatable ............................................ 180Shared .................................................... 180Unassigned ............................................ 184
Sequential Event .................................... 15, 105Sequential Trigger ................................ 111, 113Shared Section ............................................. 180Simulator ...................................................... 180Single Step ................................................... 181Skew ................................... 17, 54, 76, 122, 181Skid ............................................................... 181Software
Break Points ................................. 48, 70, 94Installation .......................................... 12, 35Named Break Points .................... 50, 72, 95
Source Code, Assembly ............................... 181Source Code, C ............................................ 181Source Data Address ............................. 17, 122Source Data Value ................................. 17, 122Special Function Registers (SFRs) ................ 92SPP ................................................................ 82Stack Break Enable ........................................ 92Stack, Hardware ..................................... 92, 182
Overflow/Underflow ...................... 41, 63, 92Stack, Software ............................................ 182Stand-Offs, Gold ............................................. 30Starting and Stopping Emulation .................... 93Status Bar ....................................................... 93Step ................................................................ 93Step Over ....................................................... 94Stimulus ........................................................ 182Stopwatch ............................................. 166, 182Subroutines .................................................. 111
2001 Microchip Technology Inc. DS51159B-page 187
MPLAB® ICE User’s Guide
Symbol ..........................................................182Symbolic .......................................................102System Button, Windows ..............................183System Components, MPLAB ICE .............9, 28System Reset .................................................91System Verify, MPLAB ICE ..........................127System Window Control ...............................183
TTable Read/Write ....................................15, 103Target ...........................................................183Time Between Events .....................15, 108, 114Time Stamp ............................17, 120, 122, 124Tool Bar ..........................................................93Tools Tab ..................................................12, 83Trace Buffer see Trace MemoryTrace Display see Trace Memory WindowTrace Memory .......................................120, 184
Capture ...................................14, 52, 74, 98Freezing ...................................................96
Trace Memory Window ...........................16, 120Customization .........................................124Reading ..................................................125Viewing ...................................................122
Transition Socket ............................9, 28, 30, 32Specification .............................................22
TRGIN ...................................................164, 172TRGOUT .......................................................164Trigger
Cycle ....................................17, 54, 76, 123Event ................................................15, 105External ..................................................164In ....................................................164, 172In/Out Settings ..........................................96Out ..........................................................164Position .............................................99, 110Sequential ......................................111, 113Status .....................................................100Syntax ....................................................102
Tripod ..............................................................30Troubleshooting ............................................133
UUnassigned Section ......................................184Uninitialized Data ..........................................184Uploaded Trace Lines ...................................124
VVariables ...............................................145, 151Verify .............................................................127Verify Failures ...............................................132Viewing Files ...................................................93Viewing the Trace .........................................122
WWarranty Registration .....................................21Watch Window ........................................92, 184Watchdog Timer (WDT) ........13, 42, 64, 88, 184WWW Address ................................................23
DS51159B-page 188 2001 Microchip Technology Inc.

Index
NOTES:
2001 Microchip Technology Inc. DS51159B-page 189
MPLAB® ICE User’s Guide
NOTES:
DS51159B-page 190 2001 Microchip Technology Inc.

Index
NOTES:
2001 Microchip Technology Inc. DS51159B-page 191
DS51159C-page 192 2001 Microchip Technology Inc.
MAMERICASCorporate Office2355 West Chandler Blvd.Chandler, AZ 85224-6199Tel: 480-792-7200 Fax: 480-792-7277Technical Support: 480-792-7627Web Address: http://www.microchip.comRocky Mountain2355 West Chandler Blvd.Chandler, AZ 85224-6199Tel: 480-792-7966 Fax: 480-792-7456
Atlanta500 Sugar Mill Road, Suite 200BAtlanta, GA 30350Tel: 770-640-0034 Fax: 770-640-0307Austin - Analog8303 MoPac Expressway NorthSuite A-201Austin, TX 78759Tel: 512-345-2030 Fax: 512-345-6085Boston2 Lan Drive, Suite 120Westford, MA 01886Tel: 978-692-3848 Fax: 978-692-3821Boston - AnalogUnit A-8-1 Millbrook Tarry Condominium97 Lowell RoadConcord, MA 01742Tel: 978-371-6400 Fax: 978-371-0050Chicago333 Pierce Road, Suite 180Itasca, IL 60143Tel: 630-285-0071 Fax: 630-285-0075Dallas4570 Westgrove Drive, Suite 160Addison, TX 75001Tel: 972-818-7423 Fax: 972-818-2924DaytonTwo Prestige Place, Suite 130Miamisburg, OH 45342Tel: 937-291-1654 Fax: 937-291-9175DetroitTri-Atria Office Building 32255 Northwestern Highway, Suite 190Farmington Hills, MI 48334Tel: 248-538-2250 Fax: 248-538-2260Los Angeles18201 Von Karman, Suite 1090Irvine, CA 92612Tel: 949-263-1888 Fax: 949-263-1338New York150 Motor Parkway, Suite 202Hauppauge, NY 11788Tel: 631-273-5305 Fax: 631-273-5335San JoseMicrochip Technology Inc.2107 North First Street, Suite 590San Jose, CA 95131Tel: 408-436-7950 Fax: 408-436-7955Toronto6285 Northam Drive, Suite 108Mississauga, Ontario L4V 1X5, CanadaTel: 905-673-0699 Fax: 905-673-6509
ASIA/PACIFICAustraliaMicrochip Technology Australia Pty LtdSuite 22, 41 Rawson StreetEpping 2121, NSWAustraliaTel: 61-2-9868-6733 Fax: 61-2-9868-6755China - BeijingMicrochip Technology Consulting (Shanghai)Co., Ltd., Beijing Liaison OfficeUnit 915New China Hong Kong Manhattan Bldg.No. 6 Chaoyangmen Beidajie Beijing, 100027, No. ChinaTel: 86-10-85282100 Fax: 86-10-85282104China - ChengduMicrochip Technology Consulting (Shanghai)Co., Ltd., Chengdu Liaison OfficeRm. 2401, Ming Xing Financial TowerNo. 88 TIDU StreetChengdu 610016, ChinaTel: 86-28-6766200 Fax: 86-28-6766599China - FuzhouMicrochip Technology Consulting (Shanghai)Co., Ltd., Fuzhou Liaison OfficeRm. 531, North BuildingFujian Foreign Trade Center Hotel73 Wusi RoadFuzhou 350001, ChinaTel: 86-591-7557563 Fax: 86-591-7557572China - ShanghaiMicrochip Technology Consulting (Shanghai)Co., Ltd.Room 701, Bldg. BFar East International PlazaNo. 317 Xian Xia RoadShanghai, 200051Tel: 86-21-6275-5700 Fax: 86-21-6275-5060China - ShenzhenMicrochip Technology Consulting (Shanghai)Co., Ltd., Shenzhen Liaison OfficeRm. 1315, 13/F, Shenzhen Kerry Centre,Renminnan LuShenzhen 518001, ChinaTel: 86-755-2350361 Fax: 86-755-2366086Hong KongMicrochip Technology Hongkong Ltd.Unit 901, Tower 2, Metroplaza223 Hing Fong RoadKwai Fong, N.T., Hong KongTel: 852-2401-1200 Fax: 852-2401-3431IndiaMicrochip Technology Inc.India Liaison OfficeDivyasree Chambers1 Floor, Wing A (A3/A4)No. 11, O’Shaugnessey RoadBangalore, 560 025, IndiaTel: 91-80-2290061 Fax: 91-80-2290062
JapanMicrochip Technology Japan K.K.Benex S-1 6F3-18-20, ShinyokohamaKohoku-Ku, Yokohama-shiKanagawa, 222-0033, JapanTel: 81-45-471- 6166 Fax: 81-45-471-6122KoreaMicrochip Technology Korea168-1, Youngbo Bldg. 3 FloorSamsung-Dong, Kangnam-KuSeoul, Korea 135-882Tel: 82-2-554-7200 Fax: 82-2-558-5934SingaporeMicrochip Technology Singapore Pte Ltd.200 Middle Road#07-02 Prime CentreSingapore, 188980Tel: 65-334-8870 Fax: 65-334-8850TaiwanMicrochip Technology Taiwan11F-3, No. 207Tung Hua North RoadTaipei, 105, TaiwanTel: 886-2-2717-7175 Fax: 886-2-2545-0139
EUROPEDenmarkMicrochip Technology Denmark ApSRegus Business CentreLautrup hoj 1-3Ballerup DK-2750 DenmarkTel: 45 4420 9895 Fax: 45 4420 9910FranceArizona Microchip Technology SARLParc d’Activite du Moulin de Massy43 Rue du Saule TrapuBatiment A - ler Etage91300 Massy, FranceTel: 33-1-69-53-63-20 Fax: 33-1-69-30-90-79GermanyArizona Microchip Technology GmbHGustav-Heinemann Ring 125D-81739 Munich, GermanyTel: 49-89-627-144 0 Fax: 49-89-627-144-44Germany - AnalogLochhamer Strasse 13D-82152 Martinsried, GermanyTel: 49-89-895650-0 Fax: 49-89-895650-22ItalyArizona Microchip Technology SRLCentro Direzionale Colleoni Palazzo Taurus 1 V. Le Colleoni 120041 Agrate BrianzaMilan, Italy Tel: 39-039-65791-1 Fax: 39-039-6899883United KingdomArizona Microchip Technology Ltd.505 Eskdale RoadWinnersh TriangleWokingham Berkshire, England RG41 5TUTel: 44 118 921 5869 Fax: 44-118 921-5820
06/01/01
WORLDWIDE SALES AND SERVICE